Strategic Hotels and Resorts Inc
Strategic Hotels and Resorts — Investor Presentation (September 2011)
16 slides from Strategic Hotels and Resorts's investor presentation, Sep 7, 2011

Slide 1: Investor Presentation September 2011
Investor Presentation September 2011 Exhibit 99.1
Slide 2: Strategic Hotels Overview
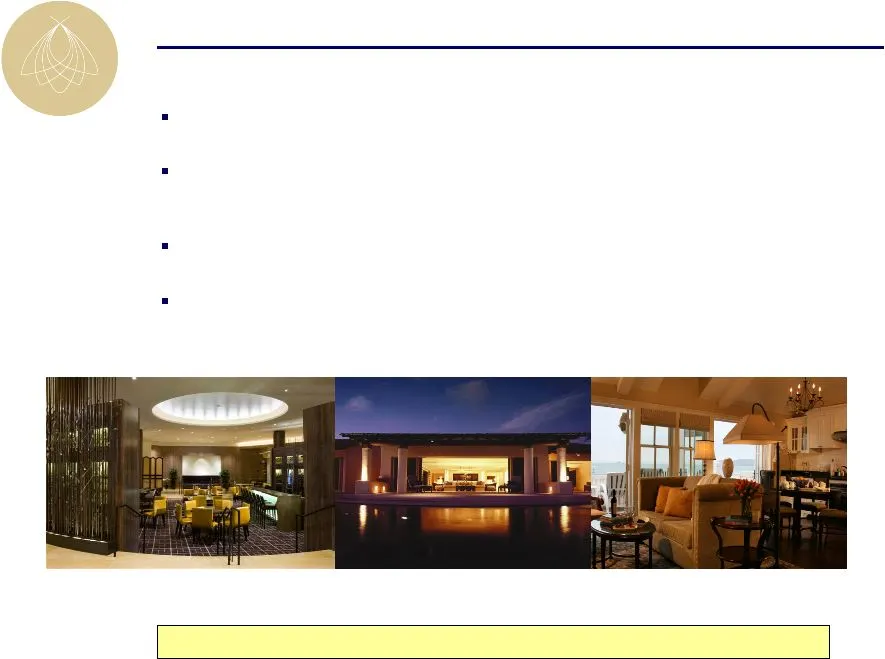
World-class luxury hotels supported by unique real-estate value Luxury segment has historically outperformed the overall industry in a recovery Industry leading asset management capabilities Management team and board members with significant hospitality industry experience Strategic Hotels Overview
Slide 3: World-Class Hotels in High Barrier to Entry Markets
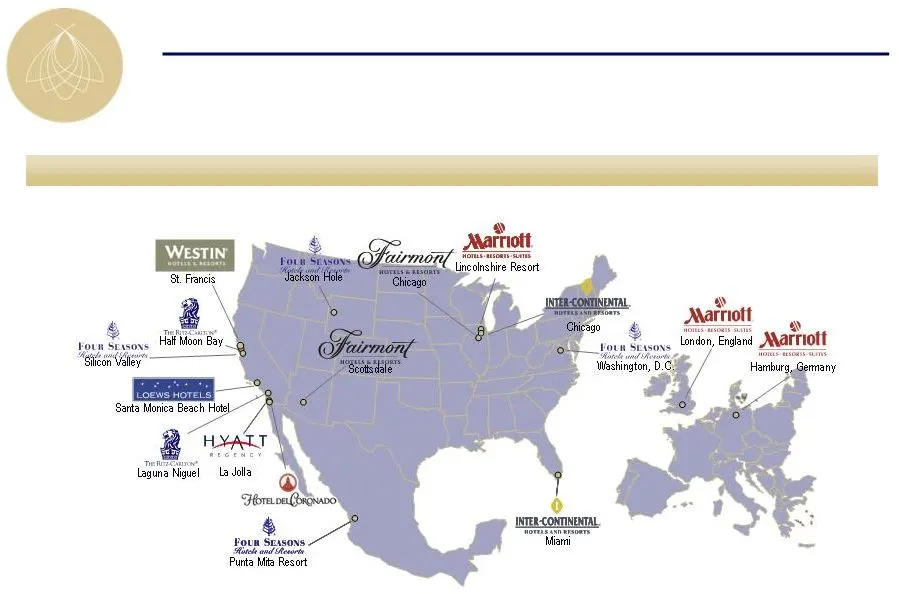
17 hotels and resorts with 7,762 rooms World-Class Hotels in High Barrier to Entry Markets
Slide 4: Unique and Irreplaceable Hotel Portfolio
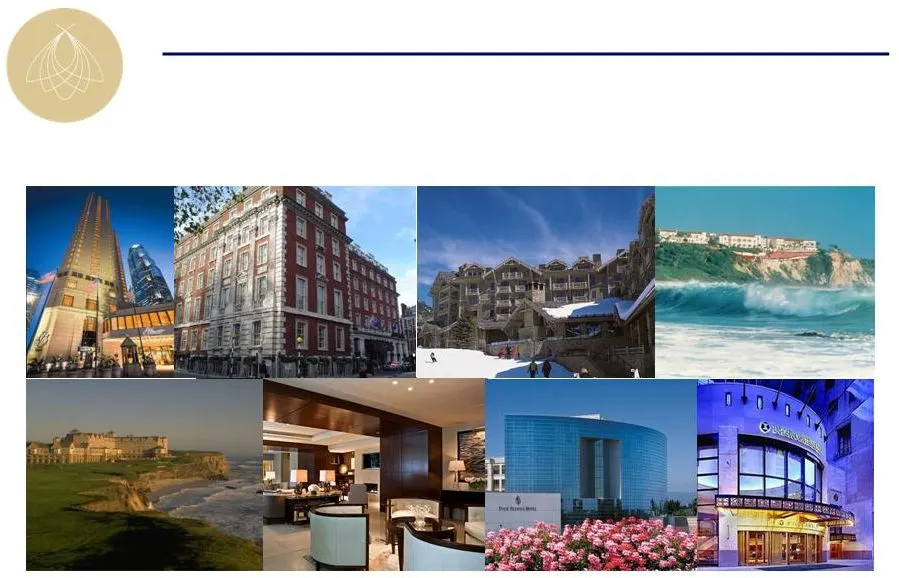
Unique and Irreplaceable Hotel Portfolio Fairmont Chicago Marriott Grosvenor Square Four Seasons Jackson Hole Ritz-Carlton Laguna Niguel Ritz-Carlton Half Moon Bay Four Seasons Washington, D.C. Four Seasons Silicon Valley InterContinental Chicago

Slide 5: Industry Leading Asset Management Capabilities
Revenue enhancement through market research based programs Exceptional asset management supported by internally developed operating systems Aggressive and early cost cutting initiatives implemented in advance of the downturn Proactively maintaining fixed cost reduction at hotels during recovery phas
Slide 6: Notable Capital Projects 2008-2011
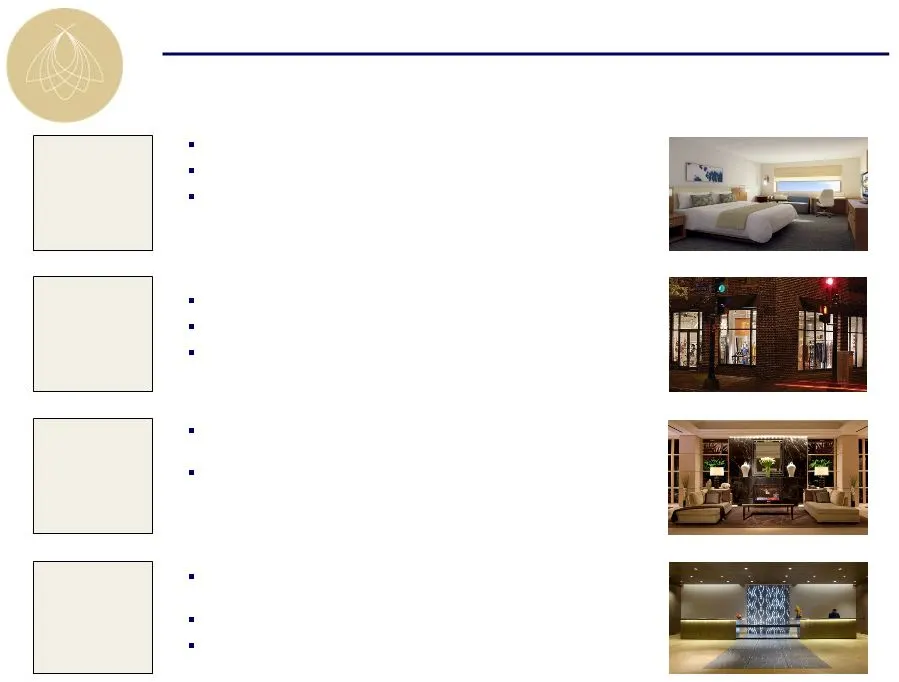
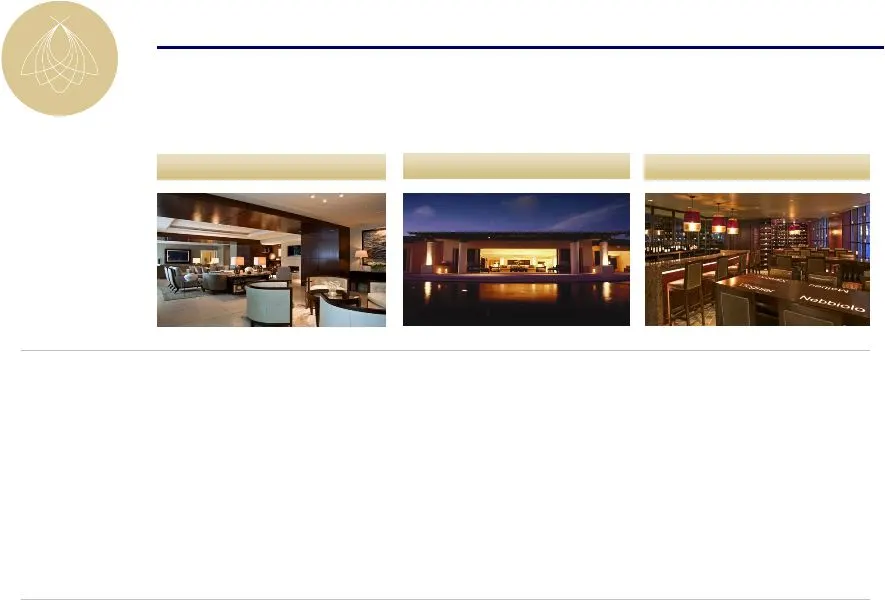
Notable 2008 capital projects Notable 2009 capital projects InterContinental Miami – Room and lobby renovation InterContinental Chicago – Michael Jordan Steak House addition Four Seasons Washington, D.C. – ENO wine tasting room Four Seasons Washington, D.C – Retail outlet renovation Marriott Lincoln
Slide 7: Value Enhancement Projects
Four Seasons Washington, D.C. Four Seasons Punta Mita InterContinental Chicago Value Enhancement Projects 11.5% 8.5% 15.0% 2010 EBITDA Description: Bourbon Steakhouse and 11- room expansion Two, 5-bedroom suite expansion, 23-room expansion with river pool ENO wine room Year of project: 2008-2009 200
Slide 8: U.S. Luxury Demand Correlated with GDP
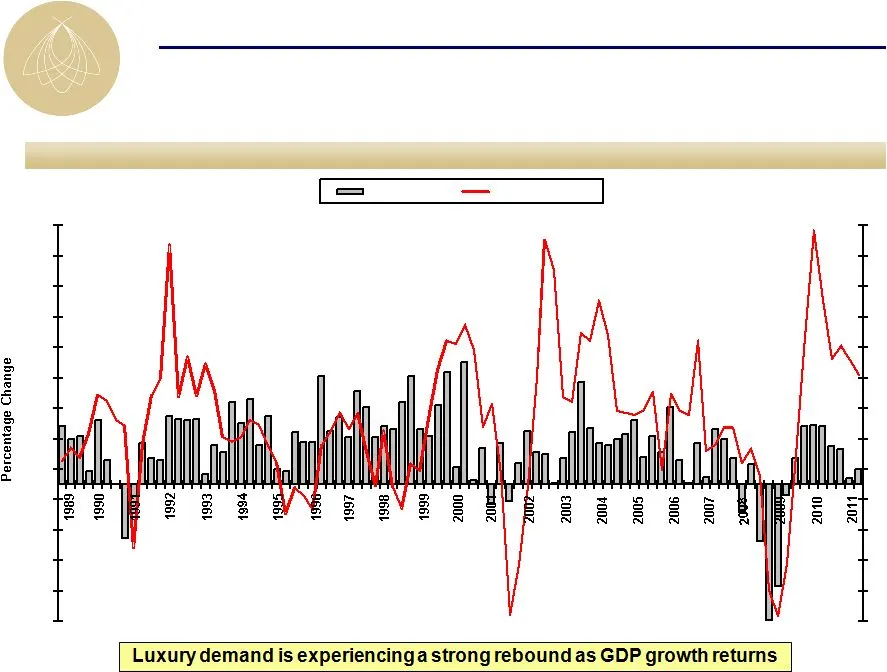
U.S. luxury demand vs. GDP growth U.S. Luxury Demand Correlated with GDP Quarterly percentage change to prior year -9.0 -7.0 -5.0 -3.0 -1.0 1.0 3.0 5.0 7.0 9.0 11.0 13.0 15.0 17.0 -9.0 -7.0 -5.0 -3.0 -1.0 1.0 3.0 5.0 7.0 9.0 11.0 13.0 15.0 17.0 GDP % Change Demand % Change
Slide 9: Favorable Supply Outlook
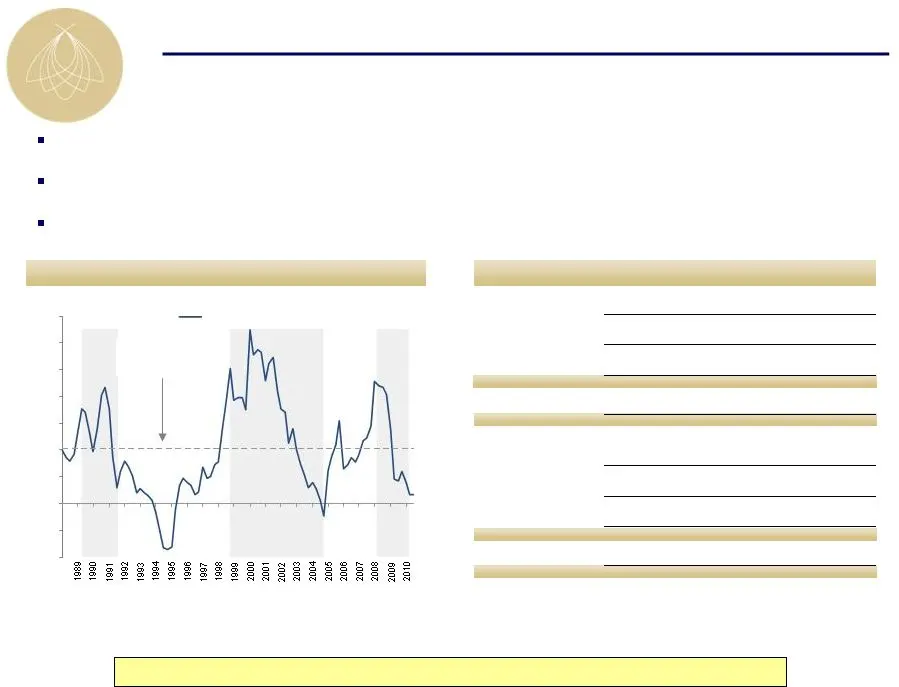
Source: Smith Travel Research Note: Data represents trends within the United States Project pipeline forecast as of 6/30/11 Supply growth was lower leading into this downturn than past downturns and remains minimal Projects in planning and under construction have decreased significantly Less than 1%
Slide 10: Luxury Hotels Outperform in a Recovery
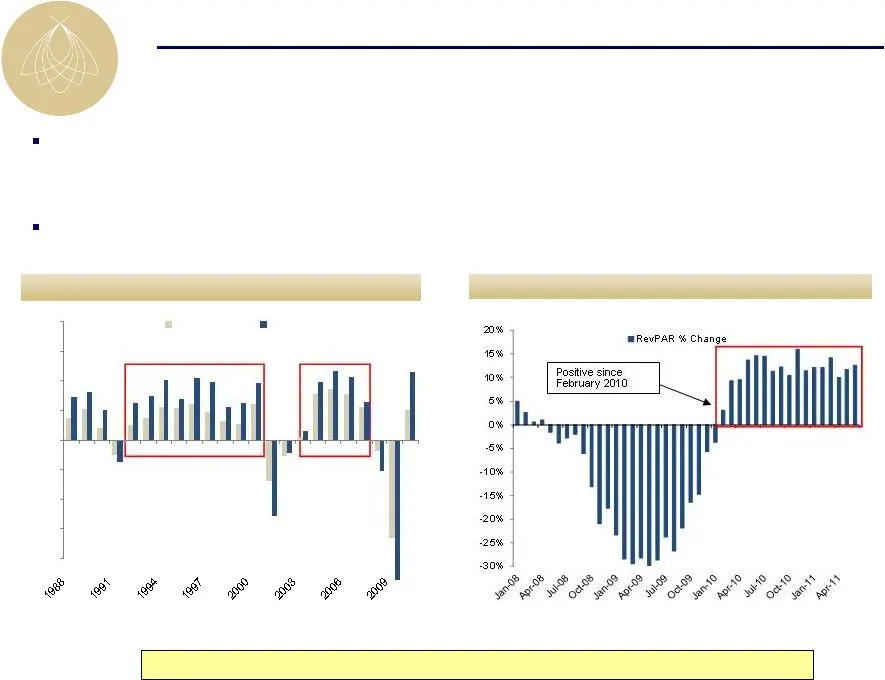
Source: Smith Travel Research Note: Data represents trends within the United States Annual % change in RevPAR Monthly YoY % change in luxury RevPAR Luxury hotels have experienced prolonged RevPAR growth following past industry downturns – 1991: 9 consecutive years of annual luxury RevPAR growth tota
Slide 11: Second Quarter 2011 RevPAR
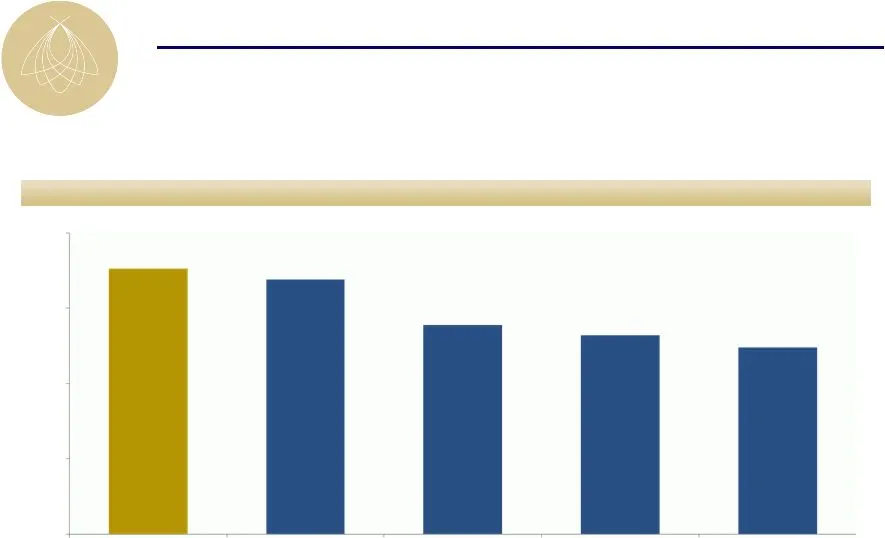
Second Quarter 2011 RevPAR Source: Company filings as of 6/30/11 North American Same Store portfolio #1 in RevPAR in the Public Lodging Sector $0 $50 $100 $150 $200 BEE¹ LHO HST SHO DRH
Slide 12: Historical Comparison
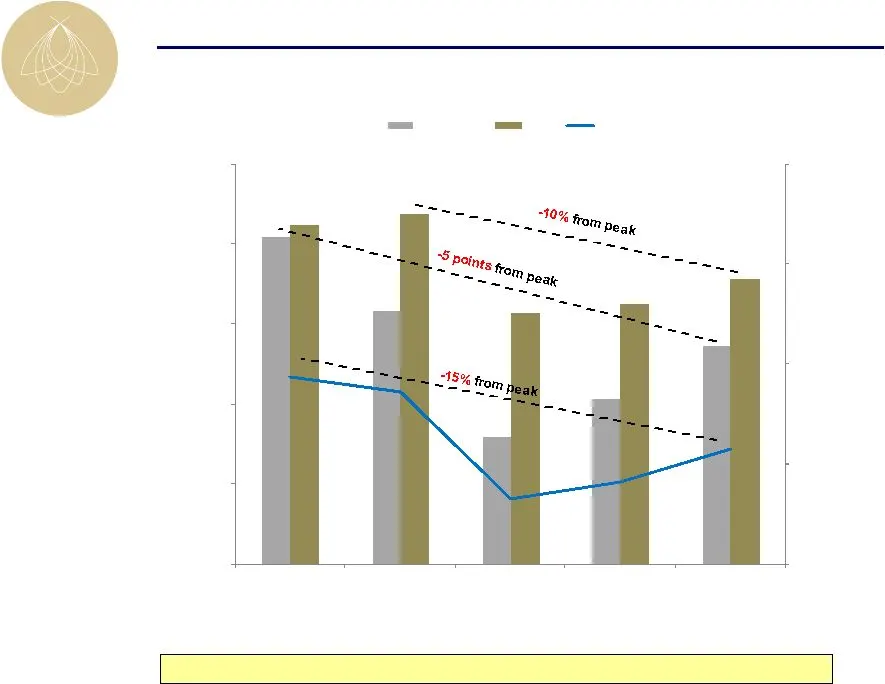
Historical Comparison Operating performance improving; still significantly below peak (Same Store North American Portfolio) Portfolio excludes: Hotel del Coronado, Fairmont Scottsdale Princess, Four Seasons Jackson Hole, Four Seasons Silicon Valley $120 $160 $200 $240 $280 60.0% 64.0% 68.0% 72.0% 76
Slide 13: Strong Second Quarter Results
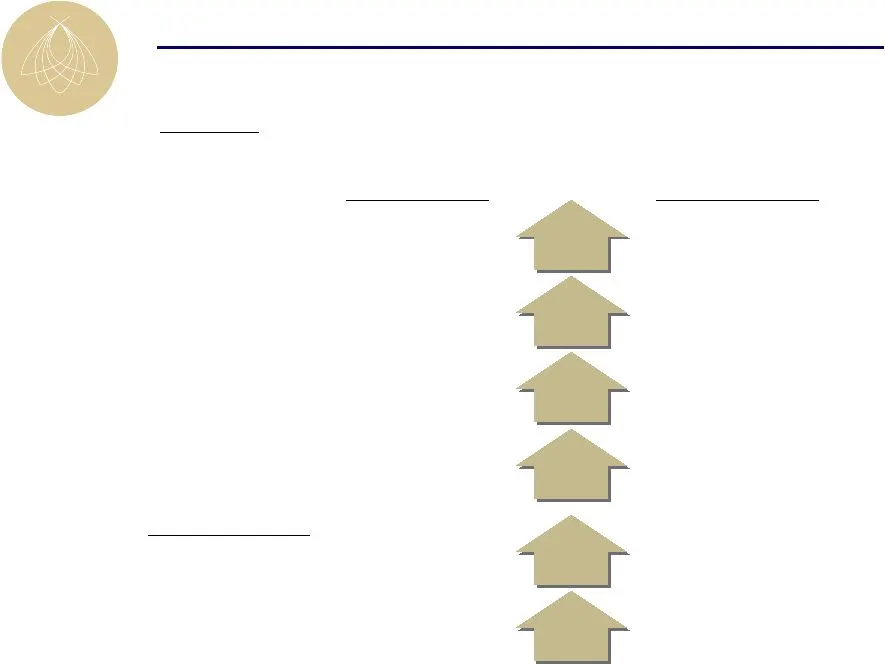
(EBITDA in millions) (a) Excludes Fairmont Scottsdale Princess, Four Seasons Jackson Hole, Four Seasons Silicon Valley, and Hotel del Coronado Operations Corporate Results Strong Second Quarter Results Comparable EBITDA $37.7 12.9% $42.5 Comparable FFO /share $0.04 25.0% $0.05 (Same Store U.S. Portf
Slide 14: 2011 Guidance
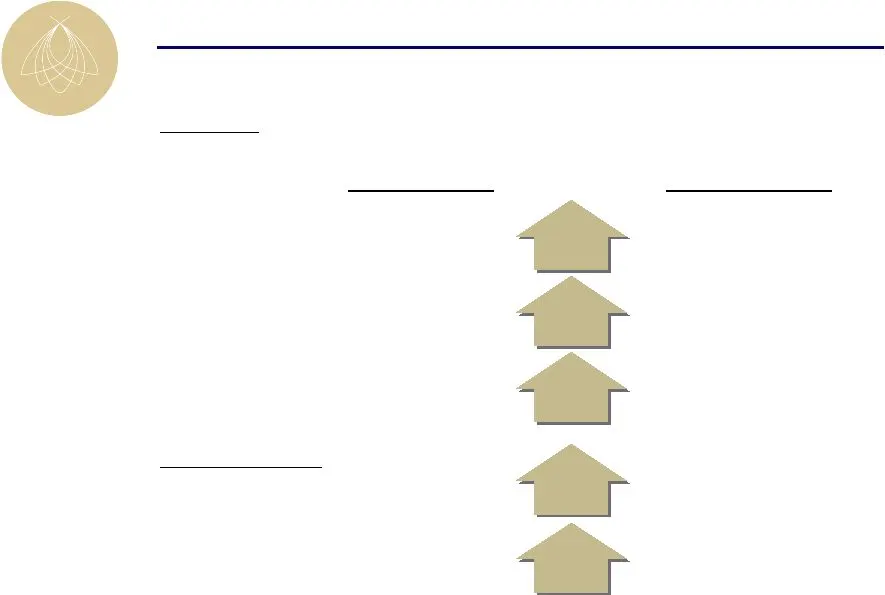
2011 Guidance (EBITDA in millions) (b) 2010 results exclude $4.9 mm of real estate tax refunds and no adjustments for cancellation fees (c) 2010 excludes $12.6 mm of VCP expense; 2011 VCP expense excluded Operations (a) Corporate Results (c) EBITDA $132.0 10%-17% $145.0-$155.0 FFO / share $0.05 60%-
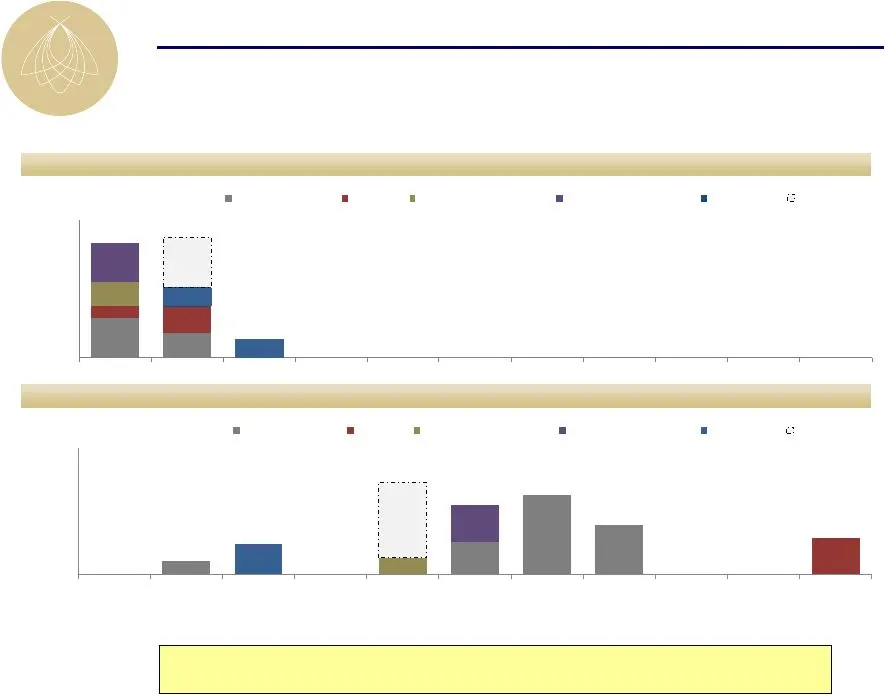
Slide 15: Debt Maturity Profile Update
$52.2 $130.0 $317.8 $195.0 $145.0 $66.5 $145.8 $119.0 $281.7 $173.5 $90.0 $194.8 $180.0 $282.8 $148.9 $124.9 12/31/09 Actual ($mm) Today ($mm) Debt Maturity Profile Update Significant accomplishments in debt maturity profile; final refinancing stage to be executed throughout 2011 Note: Debt shown at

Slide 16: Strategic Hotels & Resorts
STRATEGIC Hotels ky Resorts
Source: SEC EDGAR · 8-K filed Sep 7, 2011
More decks from Strategic Hotels and Resorts Inc
 Investor Presentation (June 2015)43 slides · Jun 1, 2015
 Investor Presentation (February 2015)43 slides · Feb 24, 2015
 Investor Presentation (January 2015)44 slides · Jan 26, 2015
 Investor Presentation (November 2014)50 slides · Nov 5, 2014
 Investor Presentation (October 2014)50 slides · Oct 3, 2014
 Investor Day (September 2014)67 slides · Sep 22, 2014