Sundance Energy — Sundance Energy Australia — Investor Presentation (September 2016)
23 slides from Sundance Energy's investor presentation, Sep 2, 2016

Slide 1: Disclaimers
Disclaimers This presentation has been prepared by Sundance Energy Australia Limited (ABN 76 112 202 883). Summary information This presentation contains summary information about Sundance and its activities current as at 8 August 2016 ("Information"). The Information in this presentation is subject
Slide 2: Executive summary, Asset overview, Financial overview, Appendix
1) Executive summary 2) Asset overview 3) Financial overview 4) Appendix 3
Slide 3: Executive summary: Company Overview
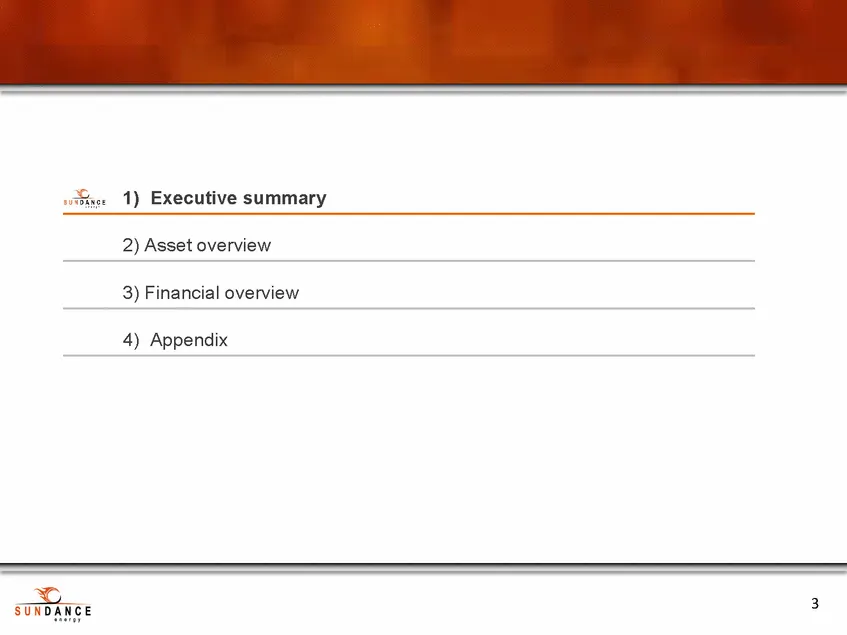
Executive summary Company Overview Greater Anadarko Mississippian / Woodford Net acres: ~18,500 1P reserves:1.8 mmboe(1) 2015 production: 1,100 boed 2016E production: 700 to 800 boed Locations: % operated: % WI: Counties: 360 gross & 126 net 68% 34.9% Logan, Noble and Garfield Ticker Share count Mar
Slide 4: Key investment highlights
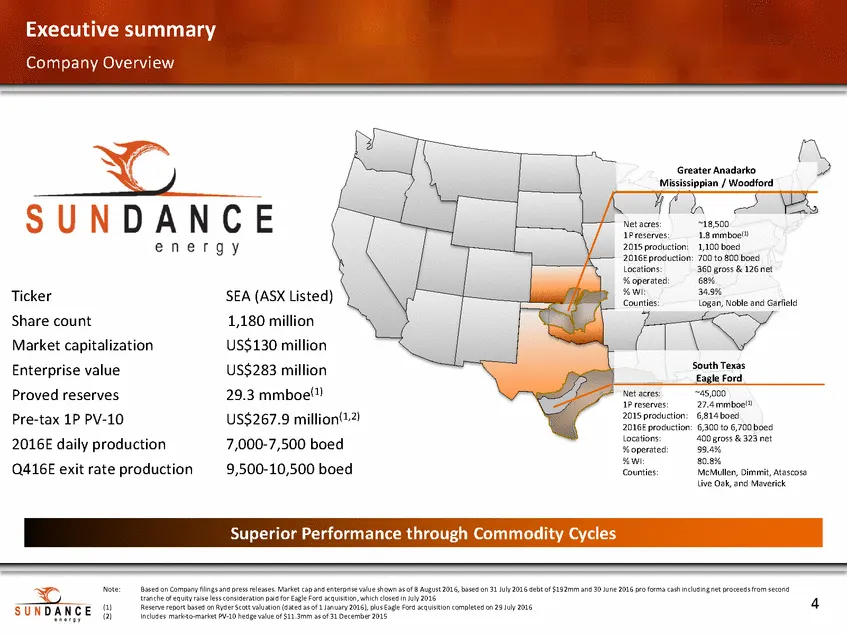
Executive summary Key investment highlights sheet (1) (2) (3) 5000’ type well in the Company’s McMullen County Eagle Ford project, excludes facilities Cash liquidity as of June 30, 2016 plus net proceeds from second tranche of equity raise, less consideration paid for Eagle Ford acquisition, which c
Slide 5: Asset overview
1) Executive summary 2) Asset overview 3) Financial overview 4) Appendix 6
Slide 6: Eagle Ford
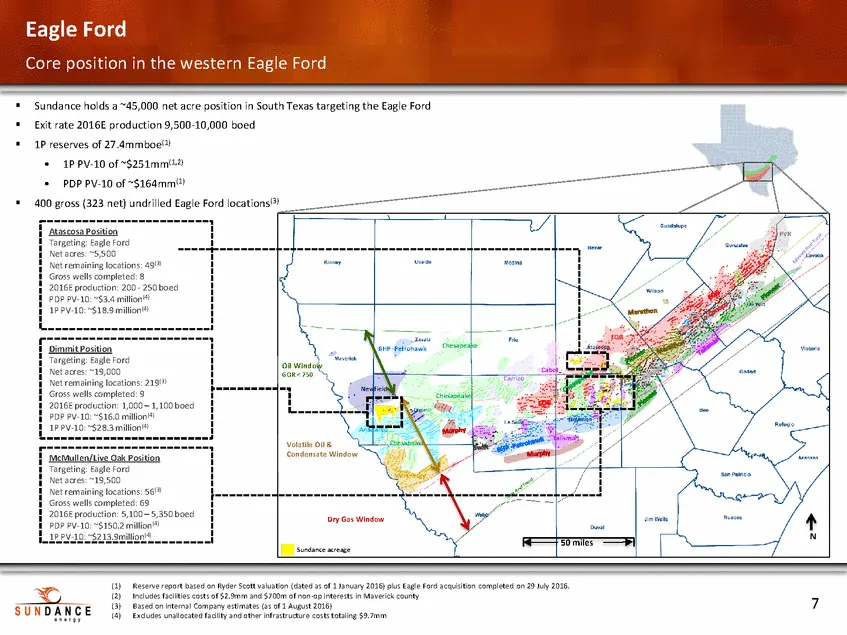
Eagle Ford Core position in the western Eagle Ford Sundance holds a ~45,000 net acre position in South Texas targeting the Eagle Ford Exit rate 2016E production 9,500-10,000 boed 1P reserves of 27.4mmboe(1) •1P PV-10 of ~$251mm(1,2) 400 gross (323 net) undrilled Eagle Ford locations(3) Oil Window Ca
Slide 7: Asset Overview: McMullen, Atascosa and Live Oak Counties
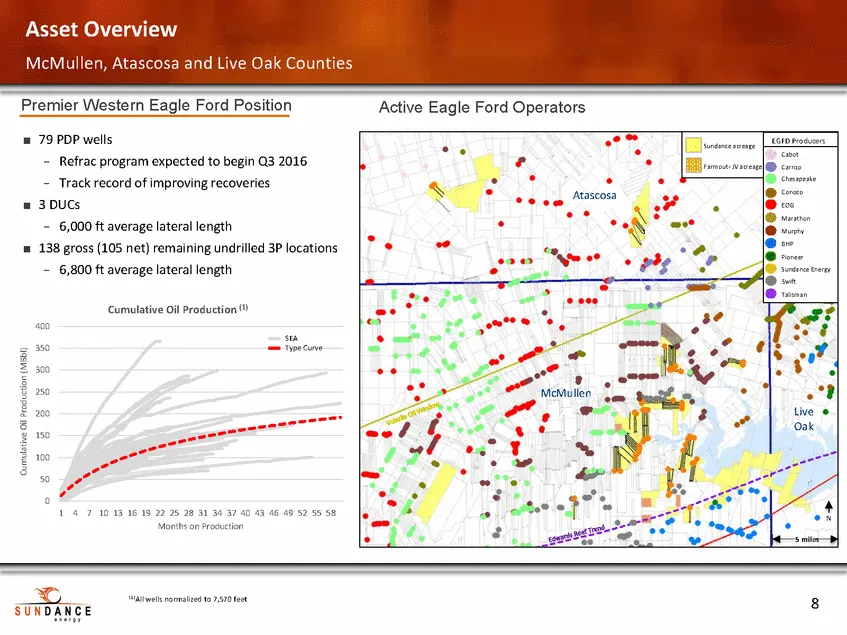
Asset Overview McMullen, Atascosa and Live Oak Counties Premier Western Eagle Ford Position Active Eagle Ford Operators 79 PDP wells Refrac program expected to begin Q3 2016 Track record of improving recoveries 3 DUCs 6,000 ft average lateral length 138 gross (105 net) remaining undrilled 3P locatio
Slide 8: McMullen County Operator Comparison
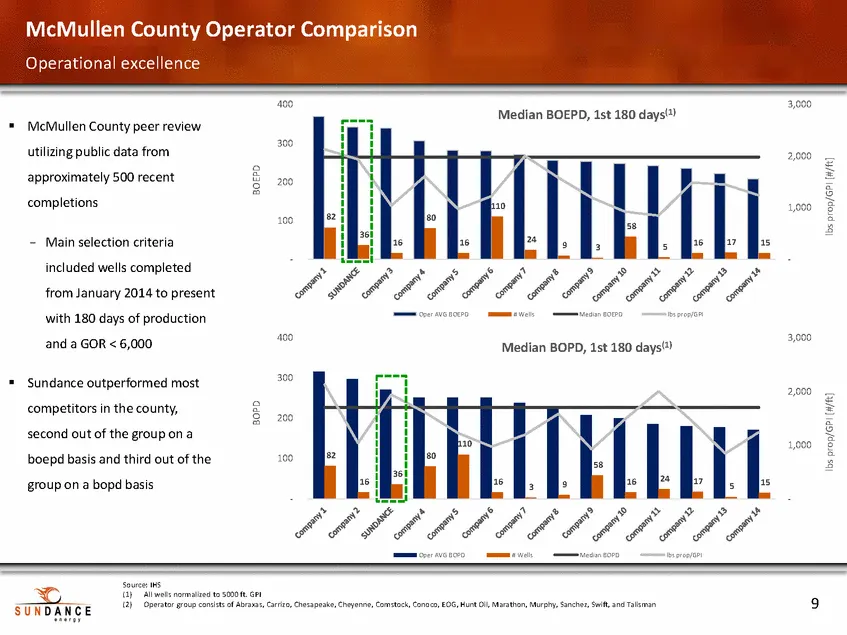
McMullen County Operator Comparison Operational excellence 400 3,000 Median BOEPD, 1st 180 days(1) McMullen County peer review utilizing public data from approximately 500 recent completions 300 2,000 200 1,000 100 Main selection criteria included wells completed from January 2014 to present with 18
Slide 9: Eagle Ford – Play Economics: McMullen County
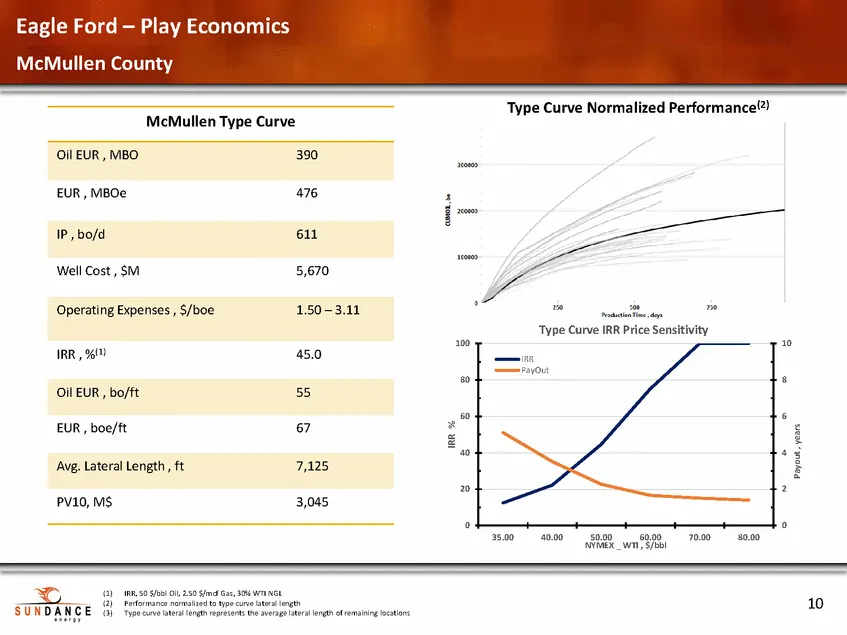
Eagle Ford – Play Economics McMullen County Type Curve Normalized Performance(2) McMullen Type Curve EUR , MBOe 476 Well Cost , $M 5,670 Type Curve IRR Price Sensitivity 100 10 IRR , %(1) 45.0 80 8 60 6 EUR , boe/ft 67 40 4 20 2 PV10, M$ 3,045 0 0 35.00 40.00 50.0060.00 NYMEX _ WTI , $/bbl 70.00 80.
Slide 10: Asset Overview: Dimmit County
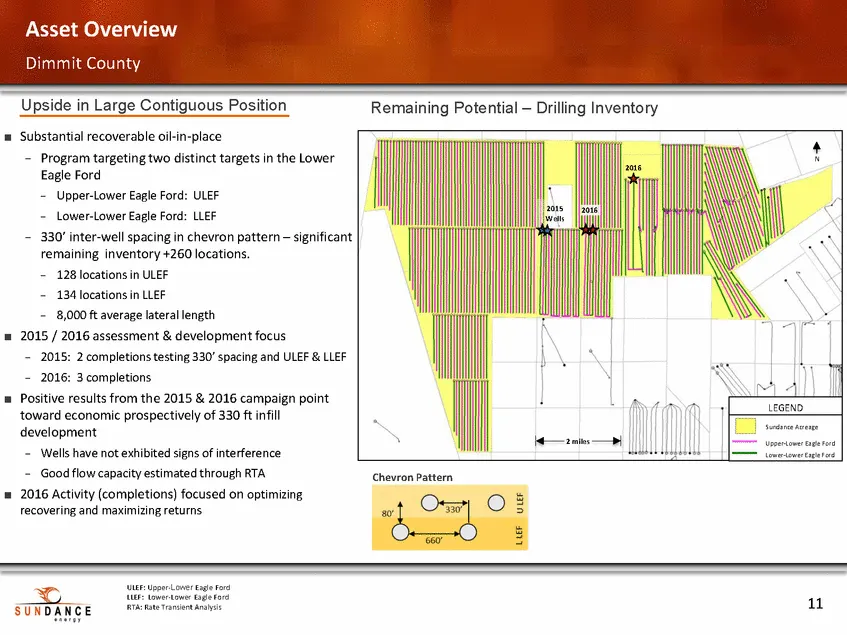
Asset Overview Dimmit County Upside in Large Contiguous Position Remaining Potential – Drilling Inventory Substantial recoverable oil-in-place Program targeting two distinct targets in the Lower Eagle Ford Upper-Lower Eagle Ford: ULEF Lower-Lower Eagle Ford: LLEF 330’ inter-well spacing in chevron p
Slide 11: Eagle Ford – Play Economics: Dimmit County
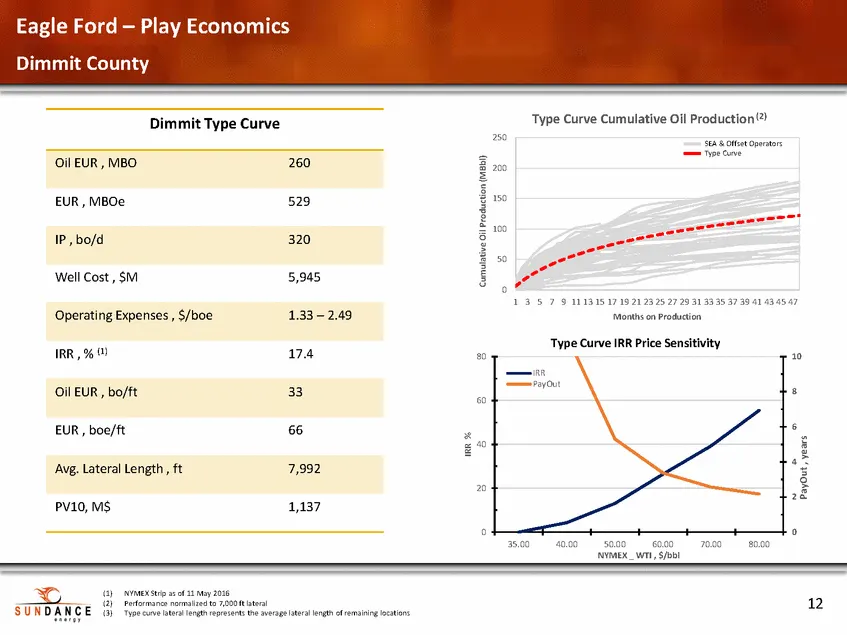
Eagle Ford – Play Economics Dimmit County Type Curve Cumulative Oil Production (2) Dimmit Type Curve 250 200 150 EUR , MBOe 529 100 50 Well Cost , $M 5,945 0 1 3 5 7 9 11 13 15 17 19 21 23 25 27 29 31 33 35 37 39 41 43 45 47 Months on Production Type Curve IRR Price Sensitivity IRR , % (1) 17.4 80 1
Slide 12: Financial overview
1) Executive summary 2) Asset overview 3) Financial overview 4) Appendix 13
Slide 13: Pro Forma Capitalization
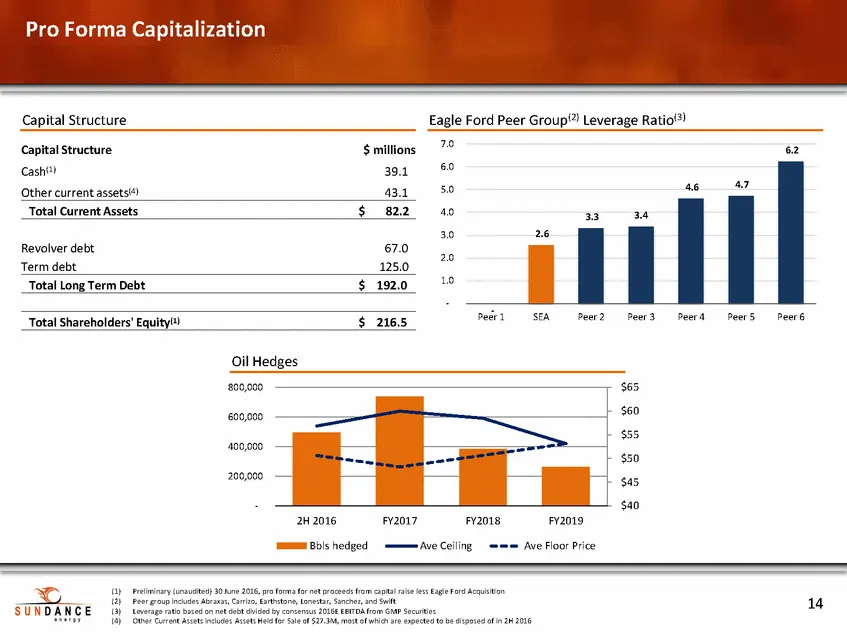
Pro Forma Capitalization Eagle Ford Peer Group(2) Leverage Ratio(3) Capital Structure 7.0 Capital Structure Cash(1) $ millions 39.1 6.2 6.0 5.0 Other current assets(4) 43.1 Total Current Assets $ 82.2 4.0 2.6 3.0 Revolver debt Term debt 67.0 125.0 2.0 1.0 Total Long Term Debt $192.0 - - Peer 1 SEA P
Slide 14: Pro Forma Guidance
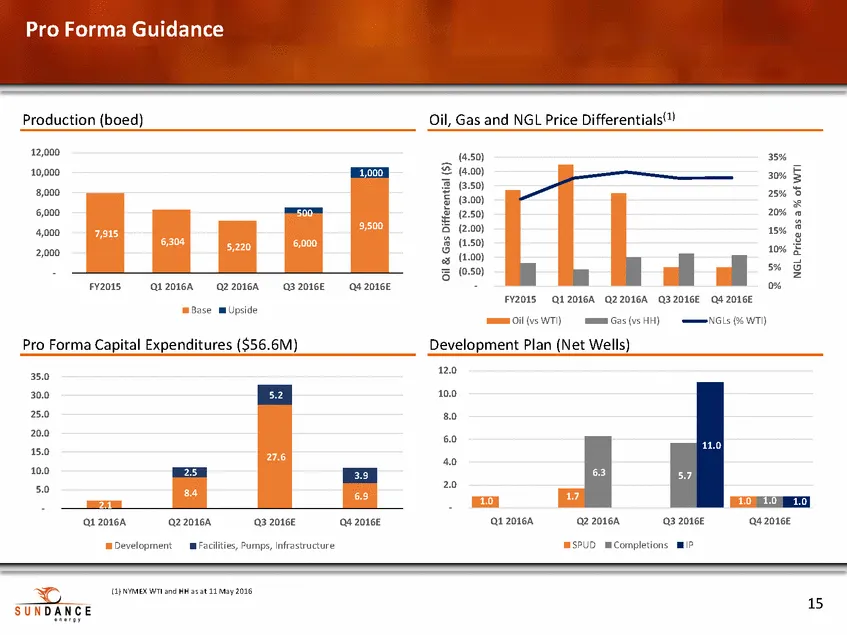
Pro Forma Guidance Production (boed) Oil, Gas and NGL Price Differentials(1) 12,000 10,000 8,000 6,000 4,000 2,000 - (4.50) (4.00) (3.50) (3.00) (2.50) (2.00) (1.50) (1.00) (0.50) - 35% 30% 25% 20% 15% 10% 5% 0% FY2015 Q1 2016A Q2 2016A Q3 2016E Q4 2016E FY2015 Q1 2016A Q2 2016A Q3 2016E Q4 2016E NG
Slide 15: Cost Benchmarking
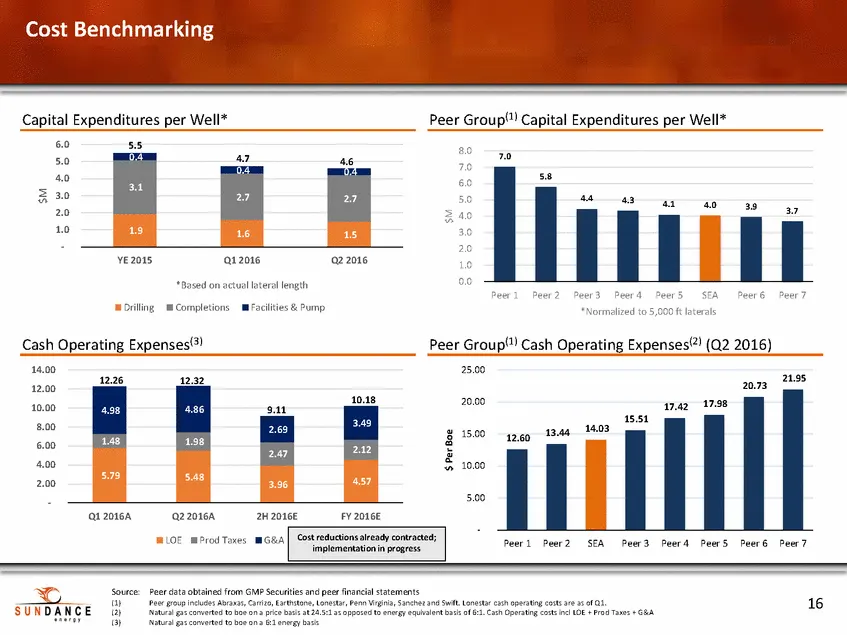
Cost Benchmarking Capital Expenditures per Well* Peer Group(1) Capital Expenditures per Well* 6.0 5.0 4.0 3.0 2.0 1.0 - 5.5 8.0 7.0 6.0 5.0 4.0 3.0 2.0 1.0 0.0 7.0 4.6 4.4 4.3 4.1 4.0 3.9 3.7 YE 2015 Q1 2016 Q2 2016 *Based on actual lateral length Peer 1 Peer 2Peer 3Peer 4Peer 5 SEA Peer 6 Peer 7 Dr
Slide 16: Summary
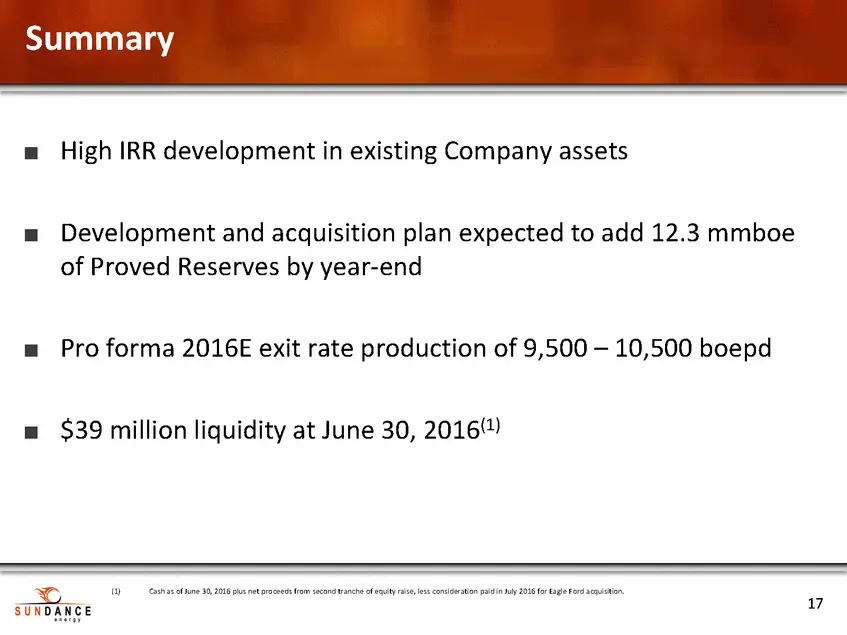
Summary High IRR development in existing Company assets Development and acquisition plan expected to add 12.3 mmboe of Proved Reserves by year-end Pro forma 2016E exit rate production of 9,500 – 10,500 boepd $39 million liquidity at June 30, 2016(1) (1) Cash as of June 30, 2016 plus net proceeds fro
Slide 17: Appendix
1) Executive summary 2) Asset overview 3) Financial overview 4) Appendix 18
Slide 18: Management team
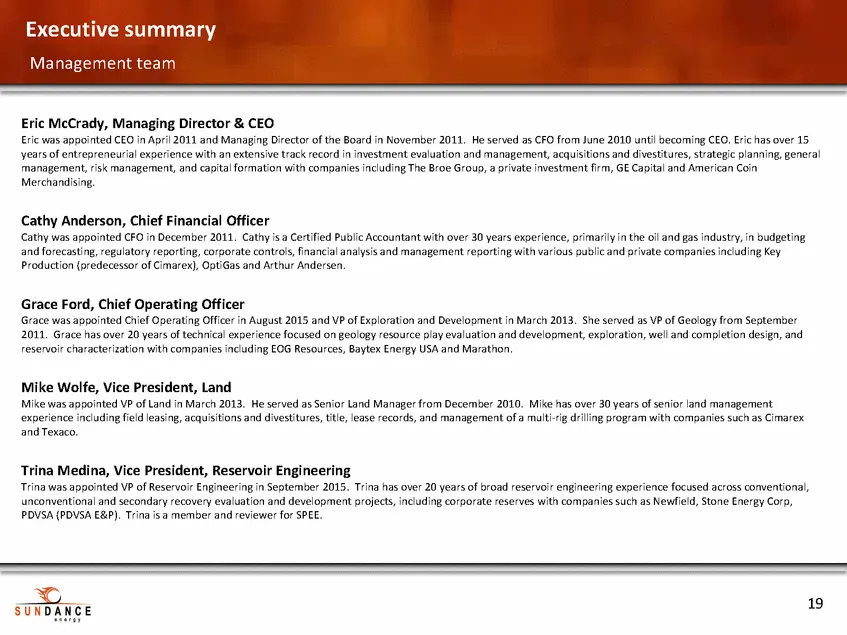
Executive summary Management team Eric McCrady, Managing Director & CEO Eric was appointed CEO in April 2011 and Managing Director of the Board in November 2011. He served as CFO from June 2010 until becoming CEO. Eric has over 15 years of entrepreneurial experience with an extensive track record in
Slide 19: Asset overview: Mississippian Lime - Woodford
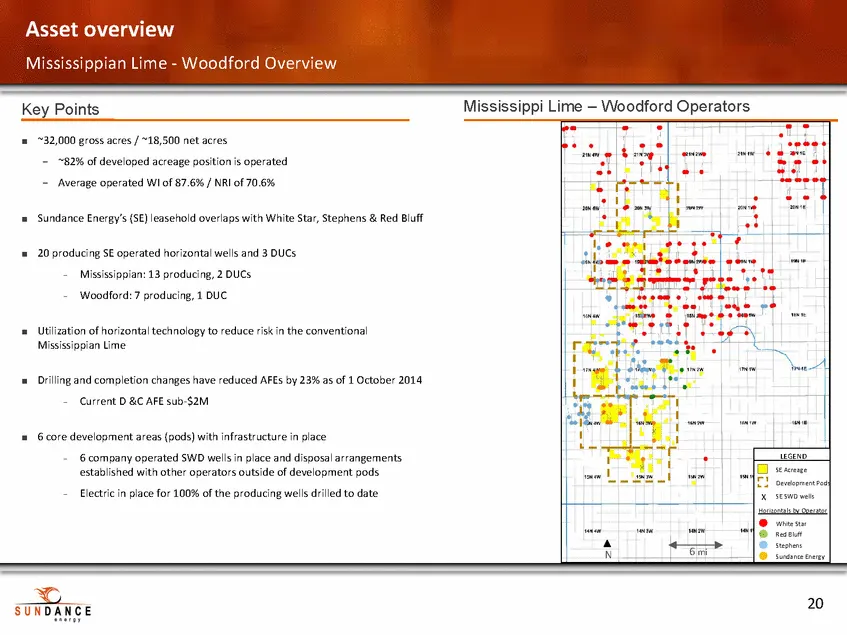
Asset overview Mississippian Lime - Woodford Overview Mississippi Lime – Woodford Operators Key Points ~32,000 gross acres / ~18,500 net acres ~82% of developed acreage position is operated Average operated WI of 87.6% / NRI of 70.6% Sundance Energy’s (SE) leasehold overlaps with White Star, Stephen
Slide 20: Hedge Summary
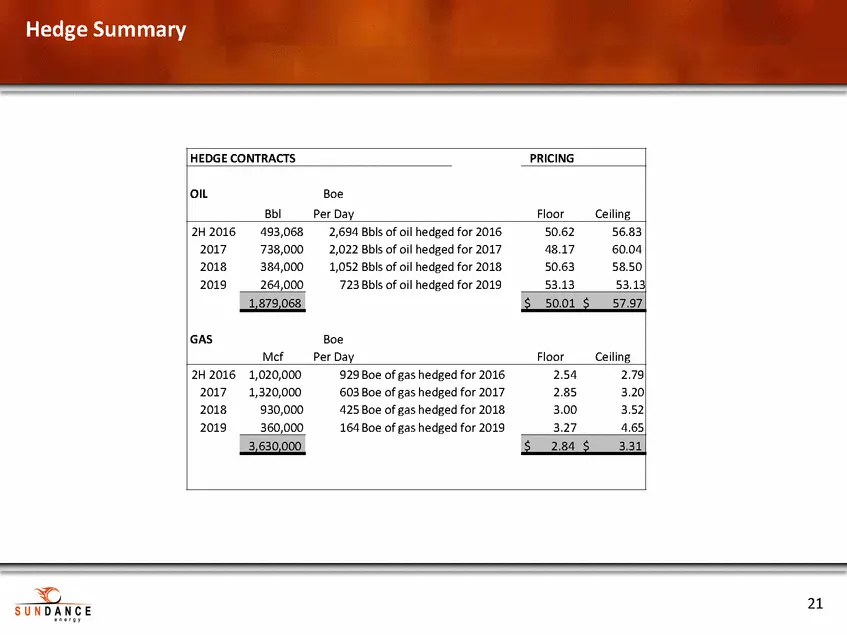
Hedge Summary 21 HEDGE CONTRACTS PRICING OILBoe BblPer Day FloorCeiling 2H 2016493,0682,694 Bbls of oil hedged for 201650.6256.83 2017738,0002,022 Bbls of oil hedged for 201748.1760.04 2018384,0001,052 Bbls of oil hedged for 201850.6358.50 2019264,000723 Bbls of oil hedged for 201953.1353.13 $50.01
Slide 21: Reserve summary
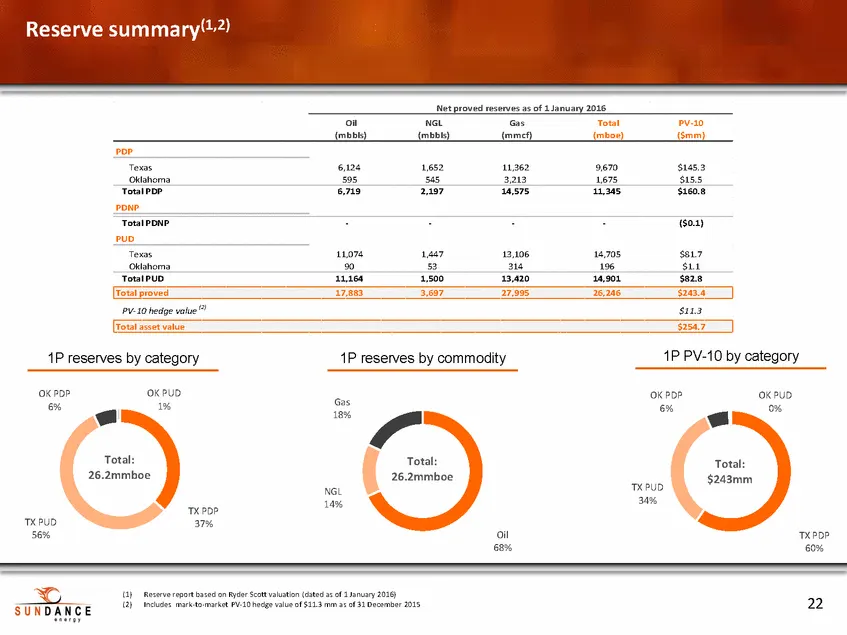
Reserve summary(1,2) Net proved reserves as of 1 January 2016 Oil (mbbls) NGL (mbbls) Gas (mmcf) Total (mboe) PV-10 ($mm) PDP Texas Oklahoma 6,124 595 1,652 545 11,362 3,213 9,670 1,675 $145.3 $15.5 Total PDP PDNP 6,719 2,197 14,575 11,345 $160.8 Total PDNP PUD - - - - ($0.1) Texas Oklahoma 11,074 9
Slide 22: Definitions
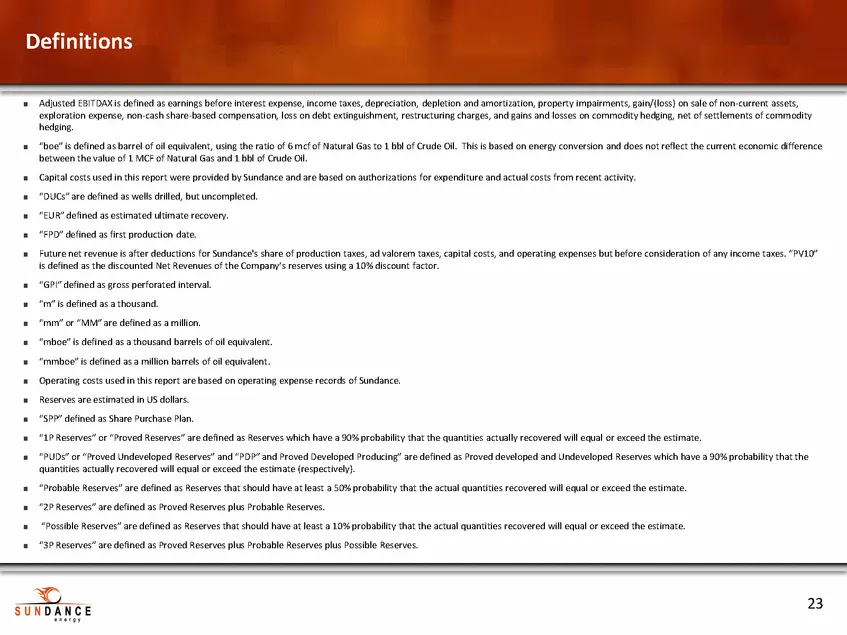
Definitions Adjusted EBITDAX is defined as earnings before interest expense, income taxes, depreciation, depletion and amortization, property impairments, gain/(loss) on sale of non-current assets, exploration expense, non-cash share-based compensation, loss on debt extinguishment, restructuring cha
Slide 23: Definitions
Definitions ‘Adjusted EB:TOAR!s defined as earnings befor incerest expense, income taxes, deprecation, depletion and amortization, property impairments, gain/oss on sale of non current asses, ‘exploration expense, non-cash share-based compensation, loss cn debt extinguishment, restructuring charges,
Source: SEC EDGAR · 6-K filed Sep 2, 2016
More decks from Sundance Energy Inc
 Investor Presentation (February 2020)25 slides · Feb 10, 2020
 Sundance Energy Australia — Q3 2019 Earnings Presentation24 slides · Nov 18, 2019
 Sundance Energy Australia — Q2 2019 Earnings Presentation25 slides · Aug 16, 2019
 Sundance Energy Australia — Investor Presentation (July 2019)19 slides · Jul 24, 2019
 Sundance Energy Australia — Investor Presentation (June 2019)16 slides · Jun 3, 2019
 Sundance Energy Australia — Q1 2019 Earnings Presentation17 slides · May 21, 2019