Aspen Insurance Holdings Ltd · NYSE:AHL/PE
Aspen Insurance — Investor Presentation (November 2010)
49 slides from Aspen Insurance's investor presentation, Nov 16, 2010
Slide 1: Aspen Insurance Holdings Limited Investor Presentation
Aspen Insurance Holdings Limited November/December 2010 Investor Presentation Chris O'Kane Chief Executive Officer Richard Houghton Chief Financial Officer Draft 10
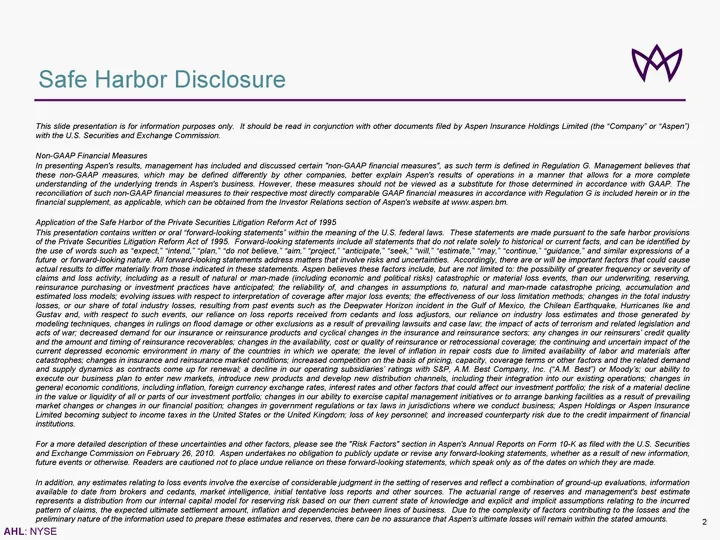
Slide 2: Safe Harbor Disclosure
Safe Harbor Disclosure This slide presentation is for information purposes only. It should be read in conjunction with other documents filed by Aspen Insurance Holdings Limited (the "Company" or "Aspen") with the U.S. Securities and Exchange Commission. Non-GAAP Financial Measures In presenting Aspe
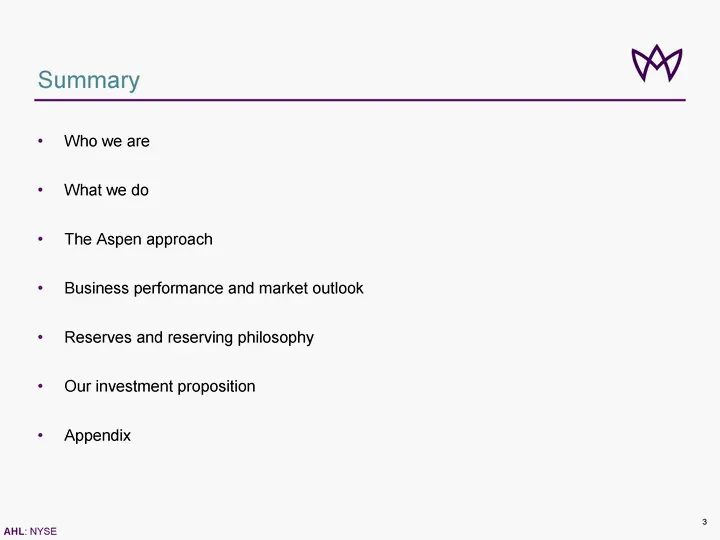
Slide 3: Summary
Summary Who we are What we do The Aspen approach Business performance and market outlook Reserves and reserving philosophy Our investment proposition Appendix
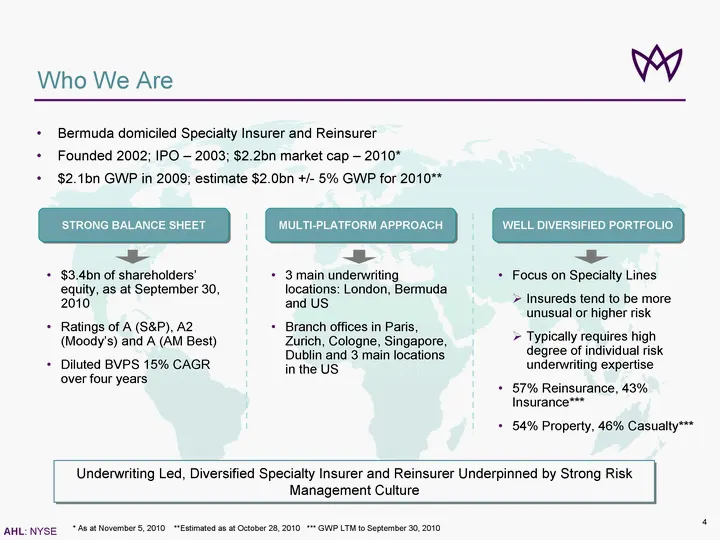
Slide 4: Who We Are
Who We Are STRONG BALANCE SHEET WELL DIVERSIFIED PORTF OLIO MULTI-PLATFORM APPROACH $3.4bn of shareholders' equity, as at September 30, 2010 Ratings of A (S&P), A2 (Moody's) and A (AM Best) Diluted BVPS 15% CAGR over four years Focus on Specialty Lines ? Insureds tend to be more unusual or higher ri
Slide 5: What We Do
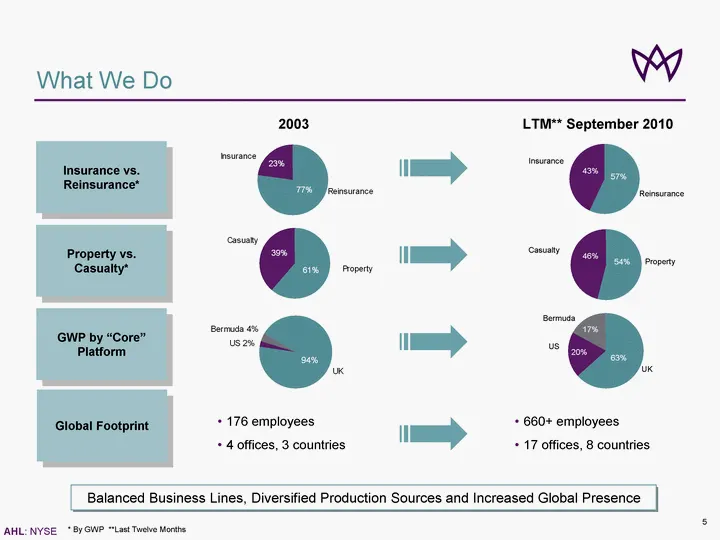
What We Do Insurance vs. Reinsurance* Property vs. Casualty* GWP by "Core" Platform Global Footprint 176 employees 4 offices, 3 countries 660+ employees 17 offices, 8 countries Balanced Business Lines, Diversified Production Sources and Increased Global Presence * By GWP **Last Twelve Months 42% 19%
Slide 6: What We Do: Strategy Elements
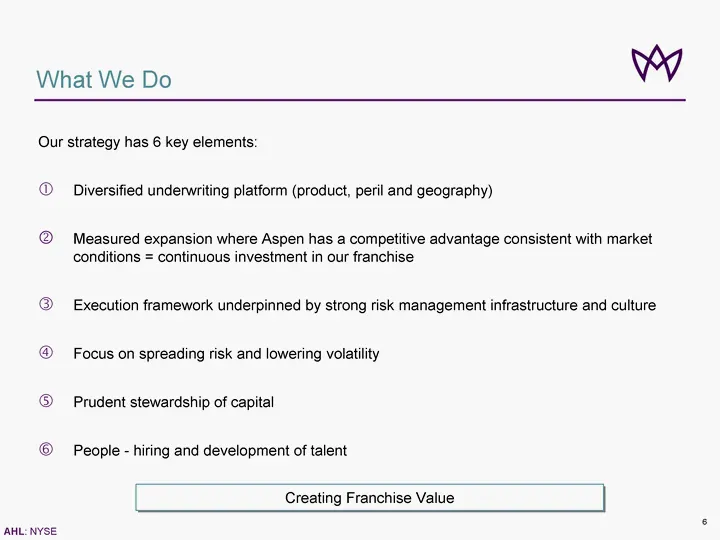
What We Do Our strategy has 6 key elements: Diversified underwriting platform (product, peril and geography) Measured expansion where Aspen has a competitive advantage consistent with market conditions = continuous investment in our franchise Execution framework underpinned by strong risk management
Slide 7: Setting our Risk Return Profile
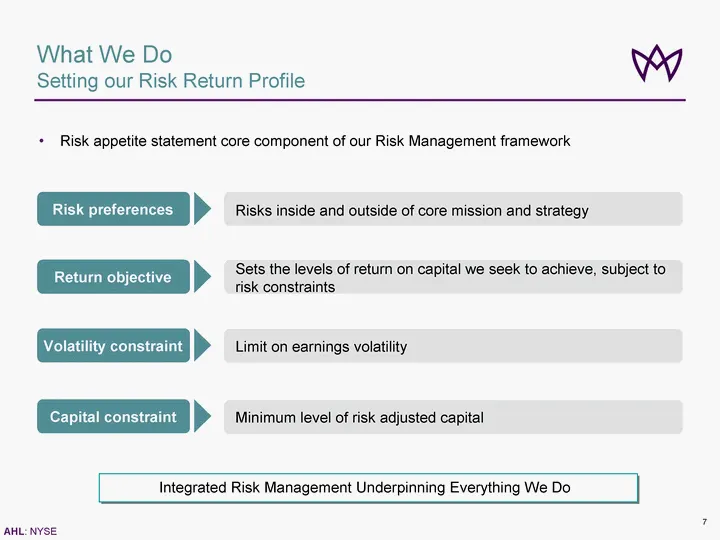
Risk appetite statement core component of our Risk Management framework What We Do Setting our Risk Return Profile Integrated Risk Management Underpinning Everything We Do Risk preferences Return objective Volatility constraint Capital constraint Risks inside and outside of core mission and strategy
Slide 8: Setting our Return Objective
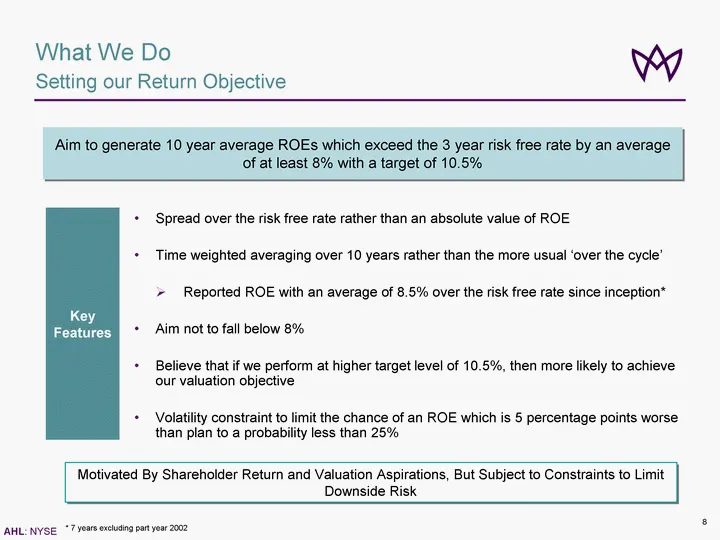
What We Do Setting our Return Objective Aim to generate 10 year average ROEs which exceed the 3 year risk free rate by an average of at least 8% with a target of 10.5% Motivated By Shareholder Return and Valuation Aspirations, But Subject to Constraints to Limit Downside Risk Key Features Spread ove
Slide 9: The Specialty Approach
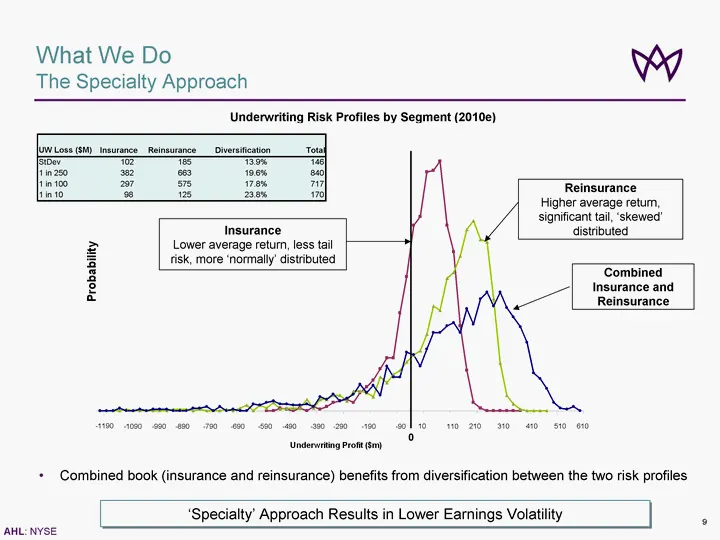
What We Do The Specialty Approach Underwriting Risk Profiles by Segment (2010e) 'Specialty' Approach Results in Lower Earnings Volatility Insurance Lower average return, less tail risk, more 'normally' distributed Reinsurance Higher average return, significant tail, 'skewed' distributed Combined Ins
Slide 10: Risk Profile - As At January 1, 2010
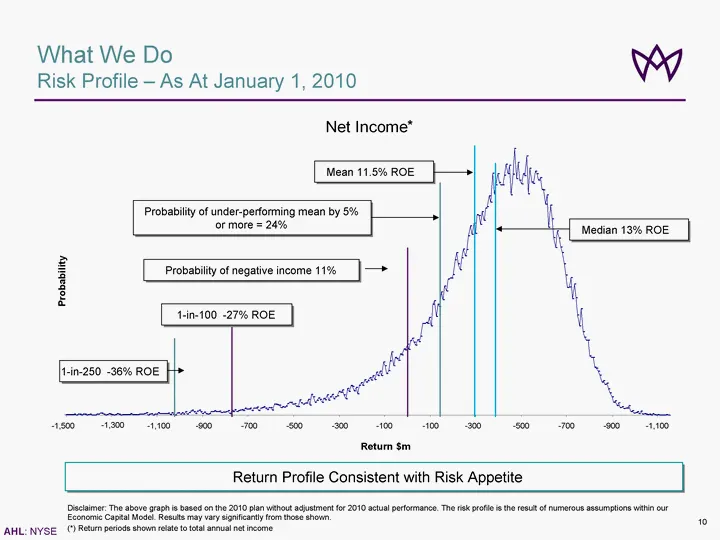
Median 13% ROE Mean 11.5% ROE Probability of under-performing mean by 5% or more = 24% 1-in-100 -27% ROE 1-in-250 -36% ROE Probability of negative income 11% Return Profile Consistent with Risk Appetite Disclaimer: The above graph is based on the 2010 plan without adjustment for 2010 actual performa
Slide 11: Reinsurance: Overview and Strategy
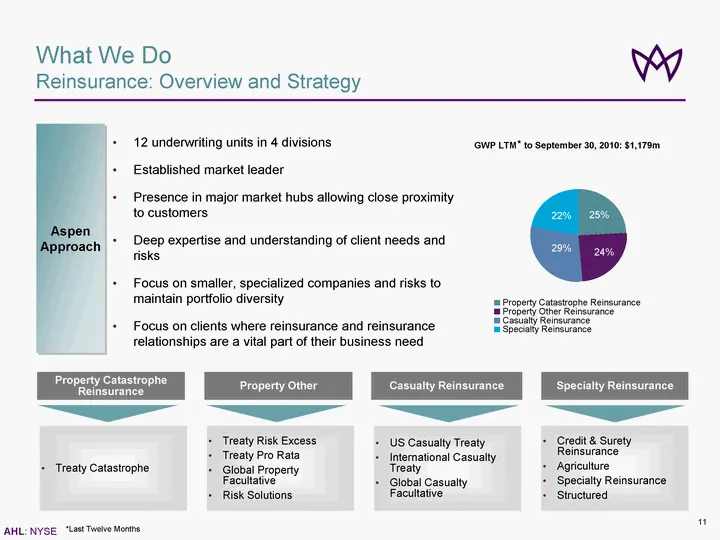
GWP LTM to September 30, 2010: $1,179m 25% 22% 29% 24% Property Catastrophe Reinsurance Property Other Reinsurance Casualty Reinsurance Specialty Reinsurance What We Do Reinsurance: Overview and Strategy Aspen Approach Property Catastrophe Reinsurance Property Other Casualty Reinsurance Specialty Re
Slide 12: Insurance: Overview and Strategy
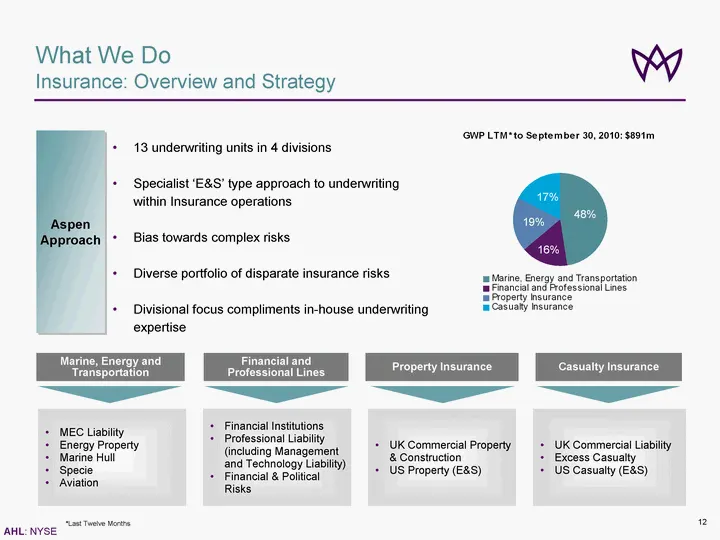
Marine, Energy and Transportation Financial and Professional Lines Property Insurance Casualty Insurance MEC Liability Energy Property Marine Hull Specie Aviation Financial Institutions Professional Liability (including Management and Technology Liability) Financial & Political Risks UK Commercial P
Slide 13: Managing Growth
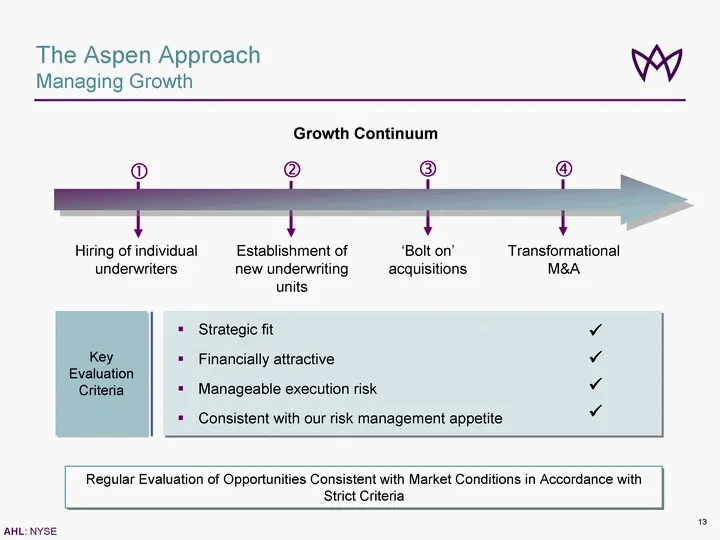
The Aspen Approach Managing Growth Regular Evaluation of Opportunities Consistent with Market Conditions in Accordance with Strict Criteria Hiring of individual underwriters Establishment of new underwriting units 'Bolt on' acquisitions Transformational M&A Growth Continuum ? ? ? ? Strategic fit Fin
Slide 14: Investing in our Franchise
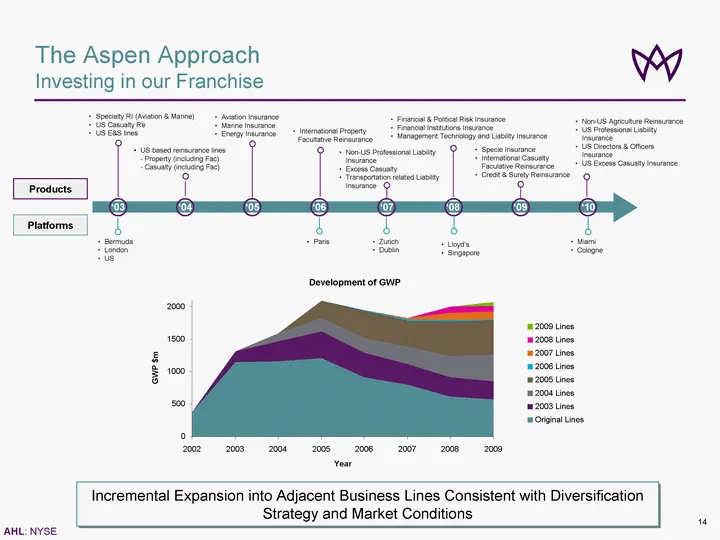
'06 '07 '08 '09 '10 The Aspen Approach Investing in our Franchise '03 '04 '05 Specialty RI (Aviation & Marine) US Casualty Re US E&S lines Aviation Insurance Marine Insurance Energy Insurance International Property Facultative Reinsurance Non-US Professional Liability Insurance Excess Casualty Trans
Slide 15: 2010 and Beyond
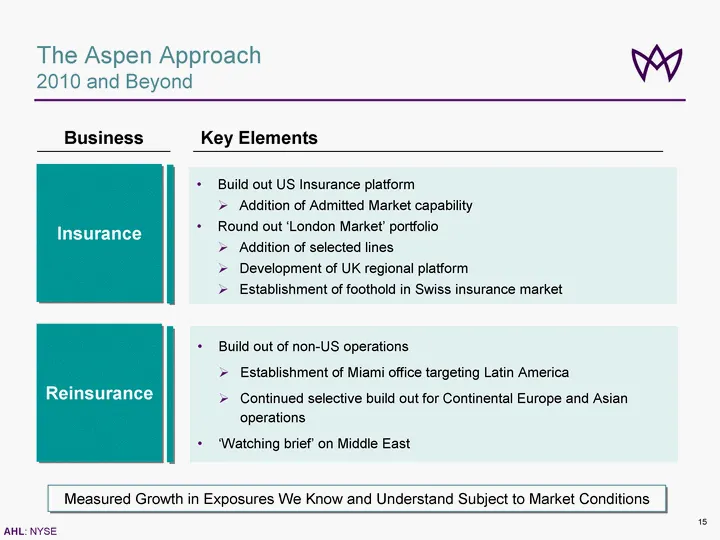
The Aspen Approach 2010 and Beyond Insurance Build out US Insurance platform ? Addition of Admitted Market capability Round out 'London Market' portfolio ? Addition of selected lines ? Development of UK regional platform ? Establishment of foothold in Swiss insurance market Build out of non-US opera
Slide 16: Shareholder Value Creation: Pulling the Financial Levers
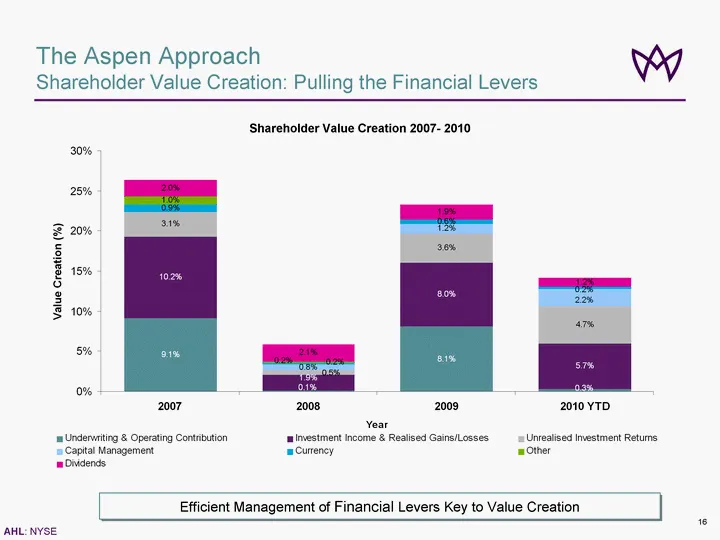
The Aspen Approach Shareholder Value Creation: Pulling the Financial Levers Efficient Management of Financial Levers Key to Value Creation Shareholder Value Creation 2007- 2010 0.5%
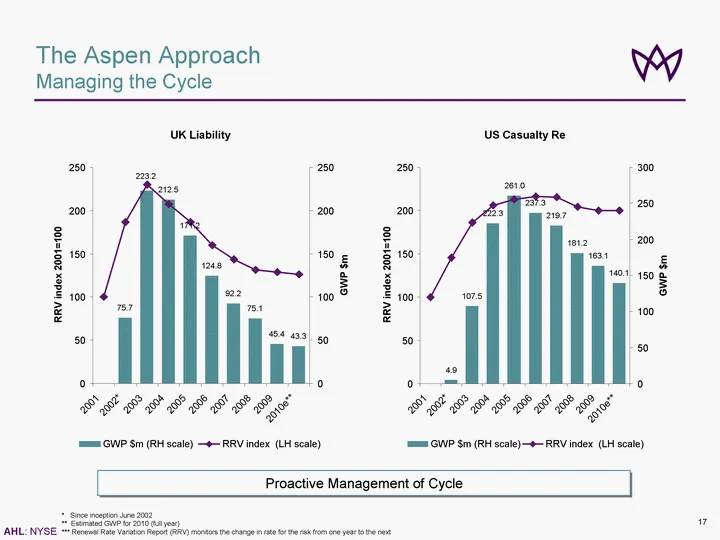
Slide 17: Managing the Cycle
The Aspen Approach Managing the Cycle * Since inception June 2002 ** Estimated GWP for 2010 (full year) *** Renewal Rate Variation Report (RRV) monitors the change in rate for the risk from one year to the next Proactive Management of Cycle US Casualty Re 4.9 107.5 222.3 261.0 237.3 219.7 181.2 163.
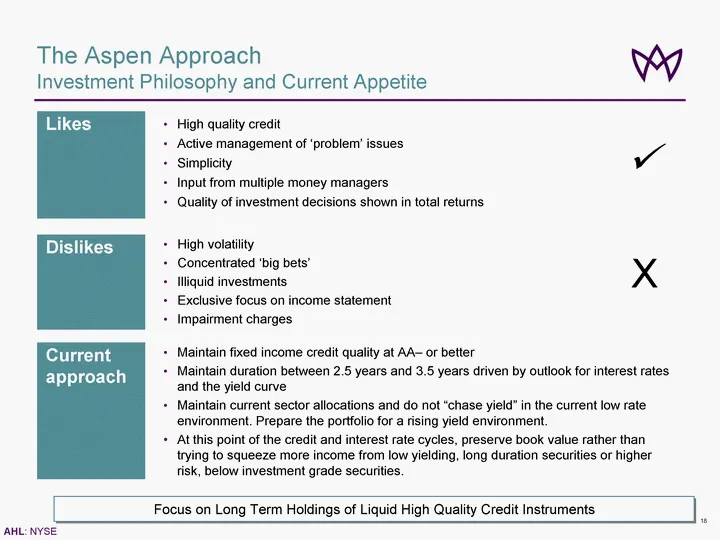
Slide 18: Investment Philosophy and Current Appetite
18 The Aspen Approach Investment Philosophy and Current Appetite Likes High quality credit Active management of 'problem' issues Simplicity Input from multiple money managers Quality of investment decisions shown in total returns Dislikes High volatility Concentrated 'big bets' Illiquid investments
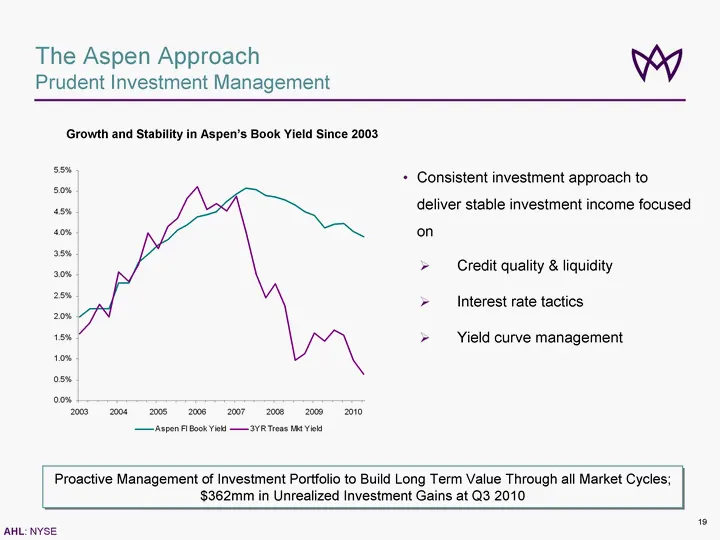
Slide 19: Prudent Investment Management
The Aspen Approach Prudent Investment Management Growth and Stability in Aspen's Book Yield Since 2003 Proactive Management of Investment Portfolio to Build Long Term Value Through all Market Cycles; $362mm in Unrealized Investment Gains at Q3 2010 Consistent investment approach to deliver stable in
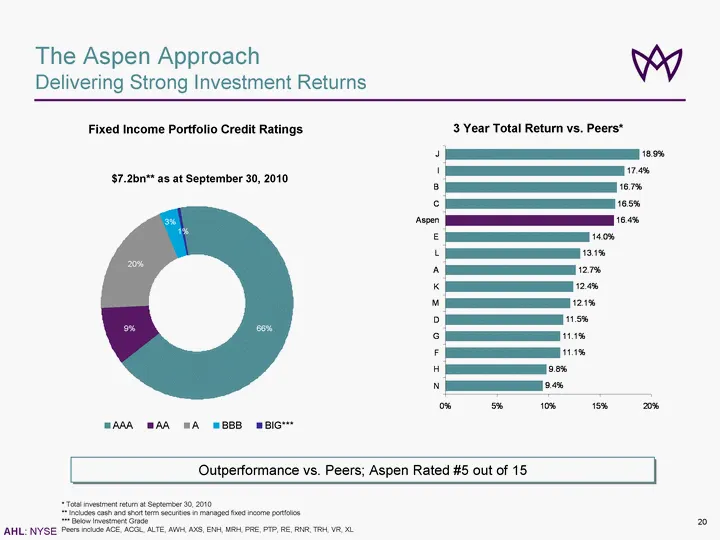
Slide 20: Delivering Strong Investment Returns
20 The Aspen Approach Delivering Strong Investment Returns 3 Year Total Return vs. Peers* Fixed Income Portfolio Credit Ratings Outperformance vs. Peers; Aspen Rated #5 out of 15 * Total investment return at September 30, 2010 ** Includes cash and short term securities in managed fixed income portfo
Slide 21: Pro-active Management of Capital
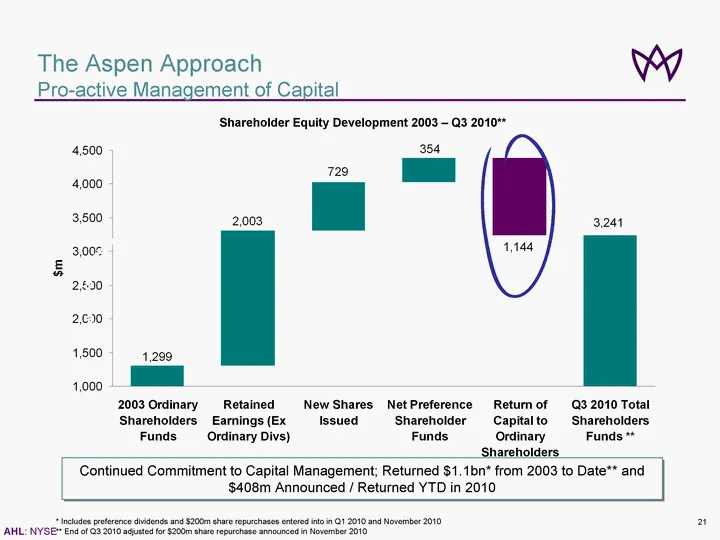
The Aspen Approach Pro-active Management of Capital Shareholder Equity Development 2003 - Q3 2010** Premium income Rises Continued Commitment to Capital Management; Returned $1.1bn* from 2003 to Date** and $408m Announced / Returned YTD in 2010 * Includes preference dividends and $200m share repurch
Slide 22: Business Performance and Market Outlook
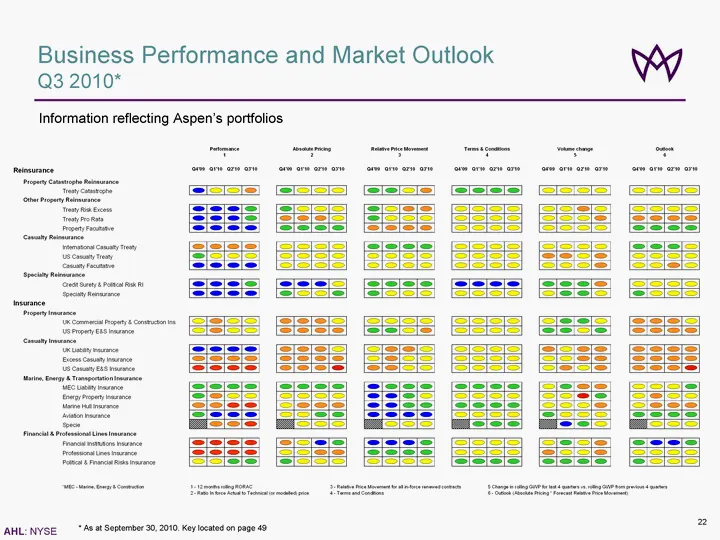
Business Performance and Market Outlook Q3 2010* Information reflecting Aspen's portfolios * As at September 30, 2010. Key located on page 49
Slide 23: Reserves and Reserving Philosophy Summary
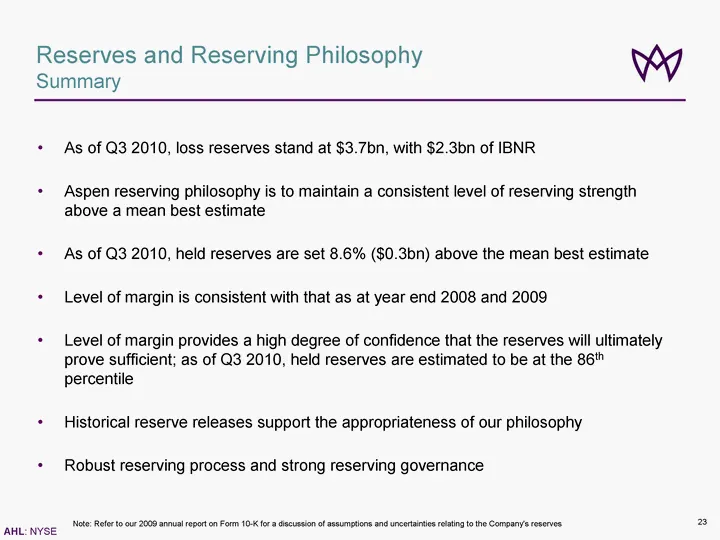
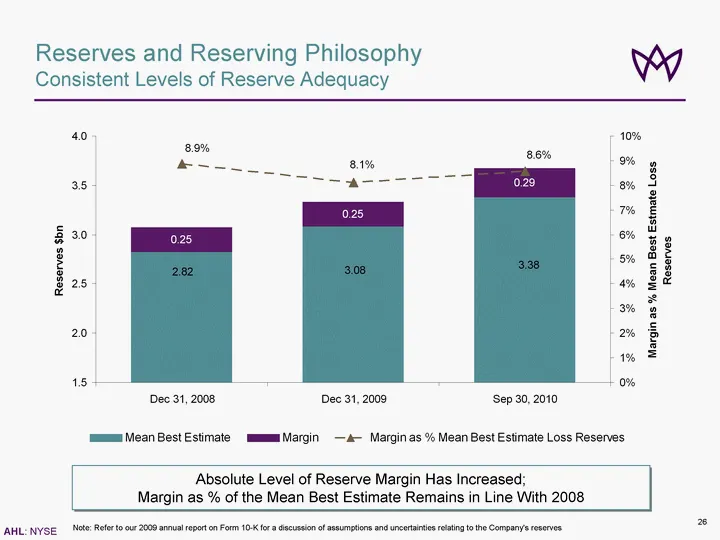
Reserves and Reserving Philosophy Summary As of Q3 2010, loss reserves stand at $3.7bn, with $2.3bn of IBNR Aspen reserving philosophy is to maintain a consistent level of reserving strength above a mean best estimate As of Q3 2010, held reserves are set 8.6% ($0.3bn) above the mean best estimate Le
Slide 24: Reinsurance Reserves Account for 63% of Total Reserves
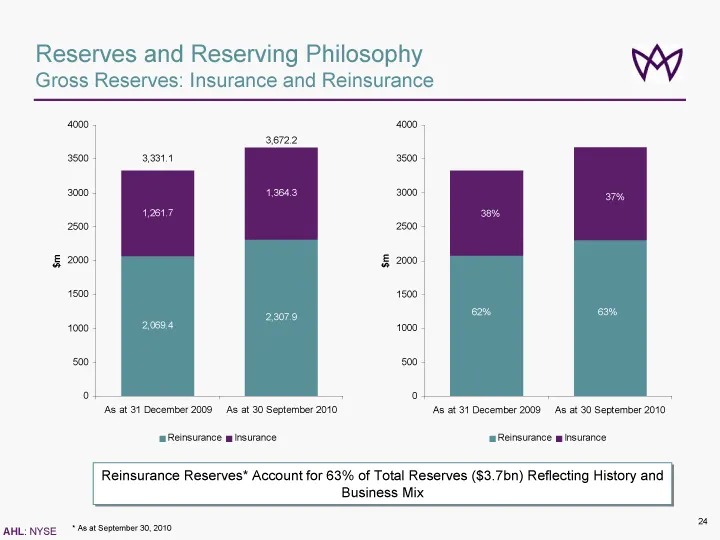
Reinsurance Reserves* Account for 63% of Total Reserves ($3.7bn) Reflecting History and Business Mix Reserves and Reserving Philosophy Gross Reserves: Insurance and Reinsurance * As at September 30, 2010
Slide 25: Loss Reserving Philosophy
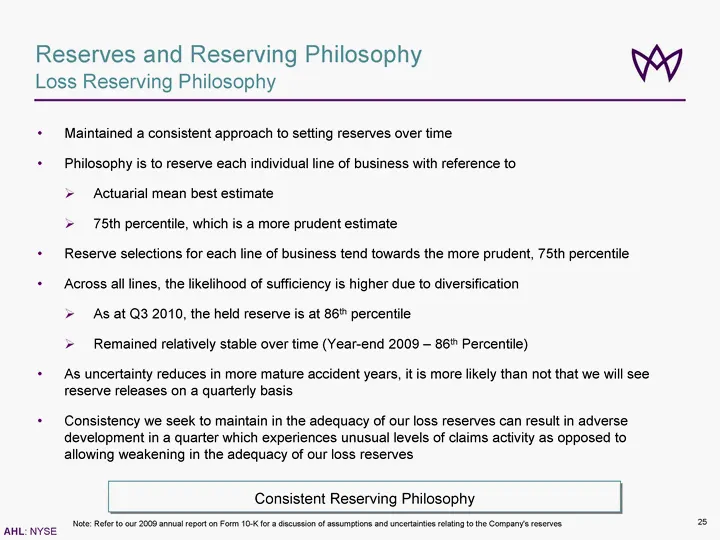
Reserves and Reserving Philosophy Loss Reserving Philosophy Maintained a consistent approach to setting reserves over time Philosophy is to reserve each individual line of business with reference to ? Actuarial mean best estimate ? 75th percentile, which is a more prudent estimate Reserve selections
Slide 26: Consistent Levels of Reserve Adequacy
Reserves and Reserving Philosophy Consistent Levels of Reserve Adequacy Absolute Level of Reserve Margin Has Increased; Margin as % of the Mean Best Estimate Remains in Line With 2008 Note: Refer to our 2009 annual report on Form 10-K for a discussion of assumptions and uncertainties relating to the
Slide 27: Confidence in Reserves Held
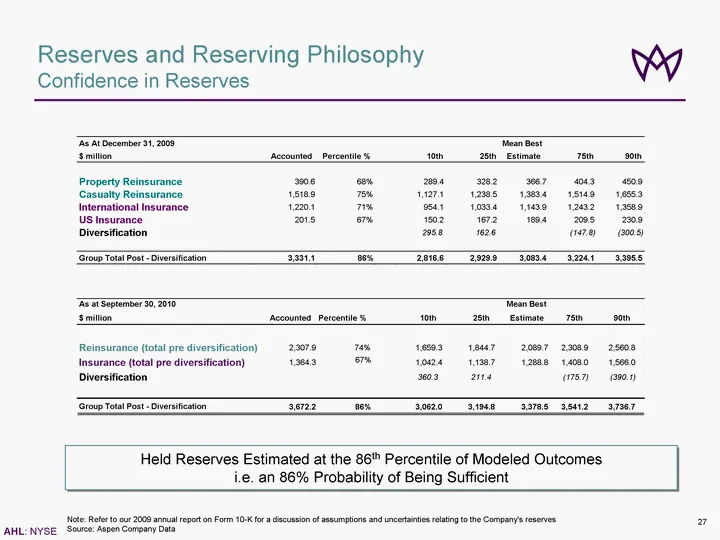
Reserves and Reserving Philosophy Confidence in Reserves Held Reserves Estimated at the 86th Percentile of Modeled Outcomes i.e. an 86% Probability of Being Sufficient Note: Refer to our 2009 annual report on Form 10-K for a discussion of assumptions and uncertainties relating to the Company's reser
Slide 28: Historical Reserve Releases
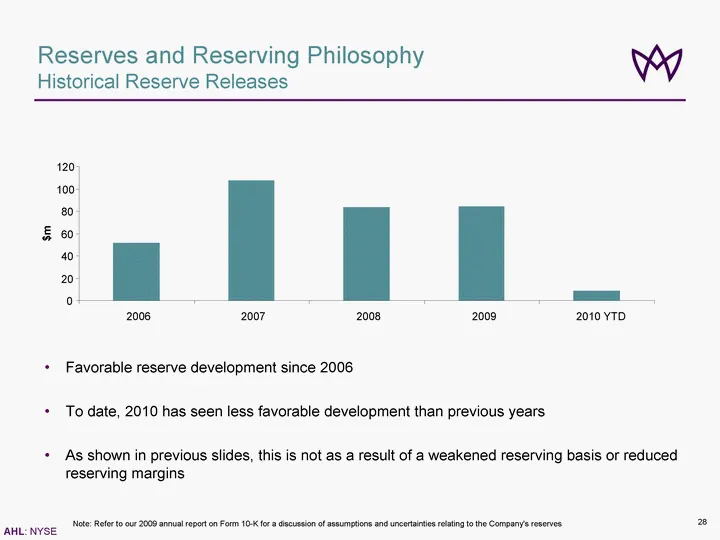
Reserves and Reserving Philosophy Historical Reserve Releases Favorable reserve development since 2006 To date, 2010 has seen less favorable development than previous years As shown in previous slides, this is not as a result of a weakened reserving basis or reduced reserving margins Note: Refer to
Slide 29: Loss Reserving Process
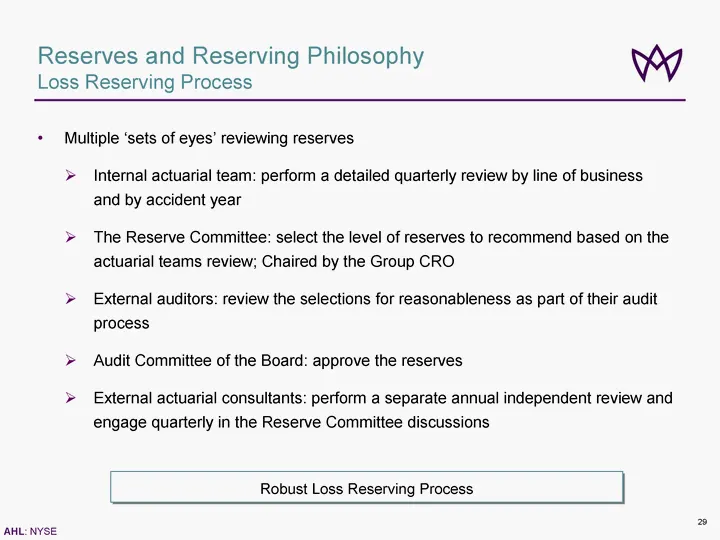
Reserves and Reserving Philosophy Loss Reserving Process Multiple 'sets of eyes' reviewing reserves ? Internal actuarial team: perform a detailed quarterly review by line of business and by accident year ? The Reserve Committee: select the level of reserves to recommend based on the actuarial teams
Slide 30: Growth in Book Value Per Share and ROE
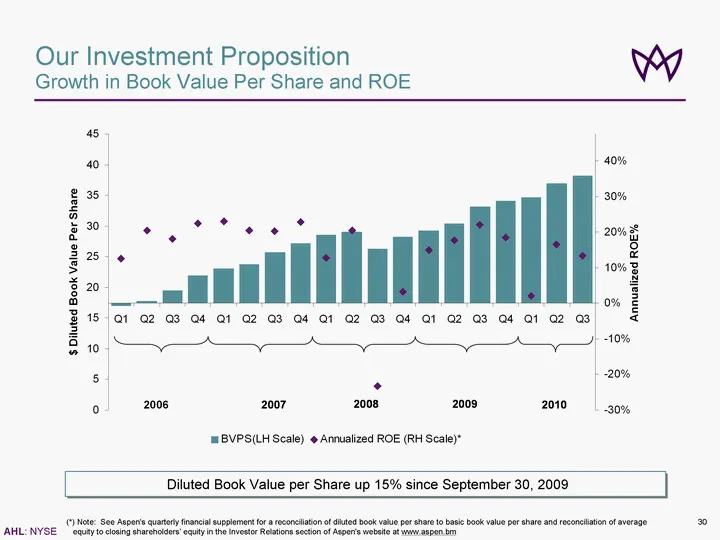
Our Investment Proposition Growth in Book Value Per Share and ROE (*) Note: See Aspen's quarterly financial supplement for a reconciliation of diluted book value per share to basic book value per share and reconciliation of average equity to closing shareholders' equity in the Investor Relations sec
Slide 31: The Embedded Value in Our Franchise
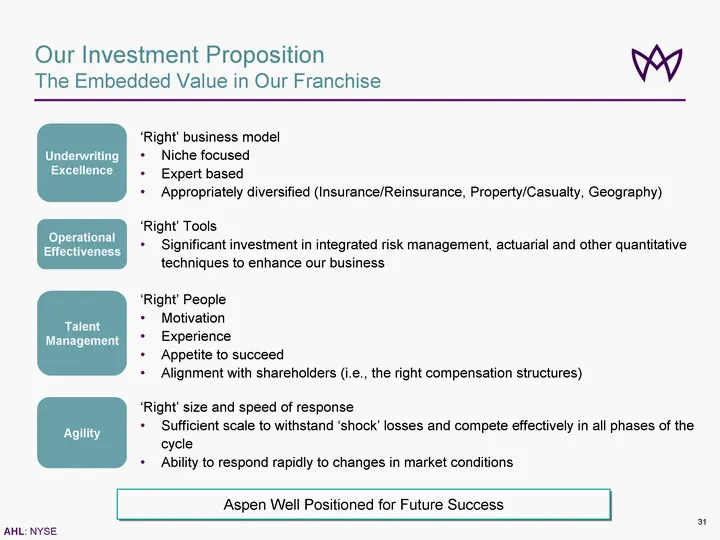
Our Investment Proposition The Embedded Value in Our Franchise 'Right' business model Niche focused Expert based Appropriately diversified (Insurance/Reinsurance, Property/Casualty, Geography) 'Right' Tools Significant investment in integrated risk management, actuarial and other quantitative techni

Slide 32: Appendix
Appendix AHL: NYSE
Slide 33: 2010 Guidance
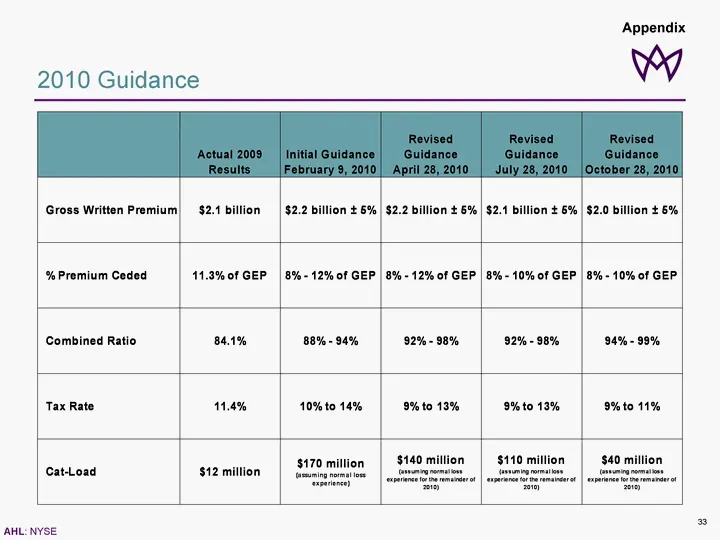
2010 Guidance 2010 Guidance Appendix
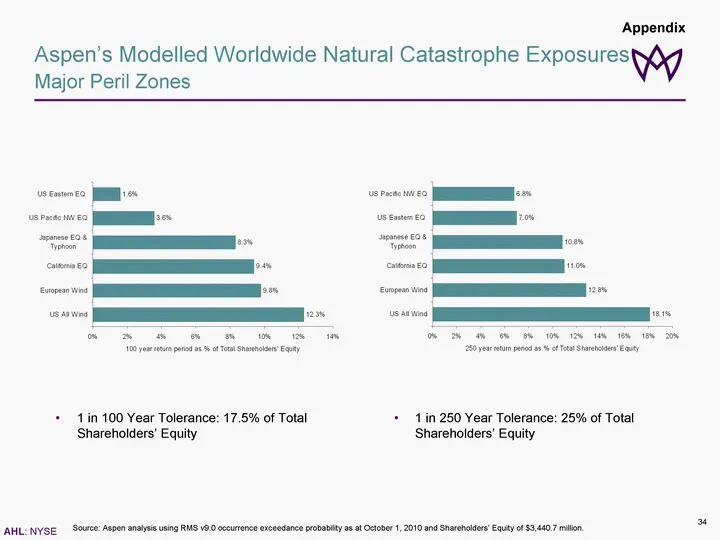
Slide 34: Modelled Worldwide Natural Catastrophe Exposures
Aspen's Modelled Worldwide Natural Catastrophe Exposures Major Peril Zones Source: Aspen analysis using RMS v9.0 occurrence exceedance probability as at October 1, 2010 and Shareholders' Equity of $3,440.7 million. 1 in 100 Year Tolerance: 17.5% of Total Shareholders' Equity 1 in 250 Year Tolerance:
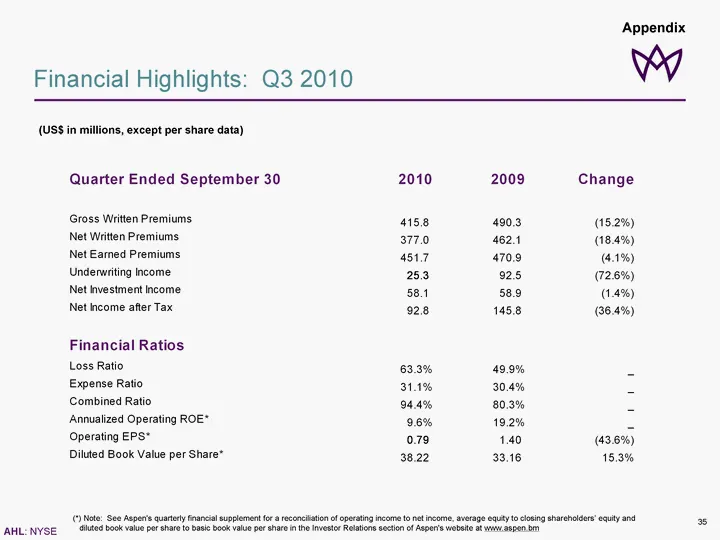
Slide 35: Financial Highlights: Q3 2010
Financial Highlights: Q3 2010 (US$ in millions, except per share data) (*) Note: See Aspen's quarterly financial supplement for a reconciliation of operating income to net income, average equity to closing shareholders' equity and diluted book value per share to basic book value per share in the Inv
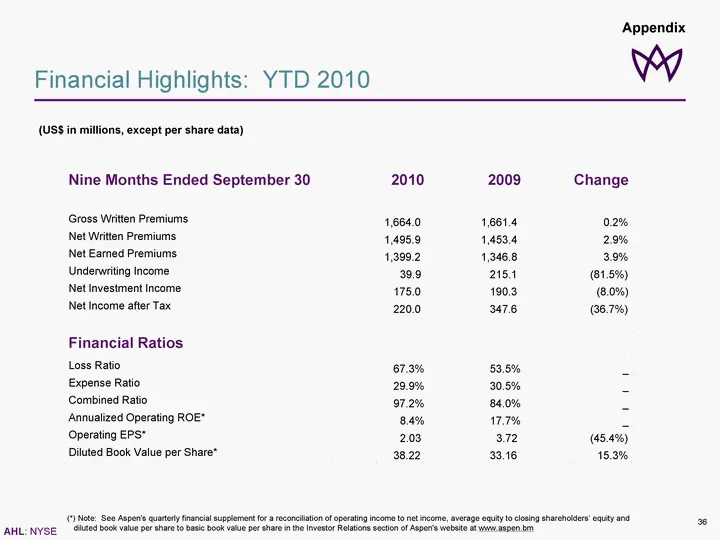
Slide 36: Financial Highlights: YTD 2010
Financial Highlights: YTD 2010 (US$ in millions, except per share data) (*) Note: See Aspen's quarterly financial supplement for a reconciliation of operating income to net income, average equity to closing shareholders' equity and diluted book value per share to basic book value per share in the In
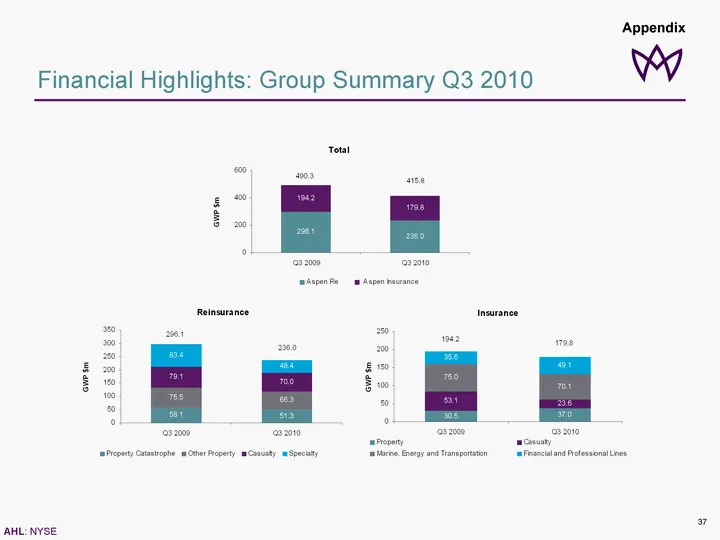
Slide 37: Financial Highlights: Group Summary Q3 2010
Financial Highlights: Group Summary Q3 2010 Appendix
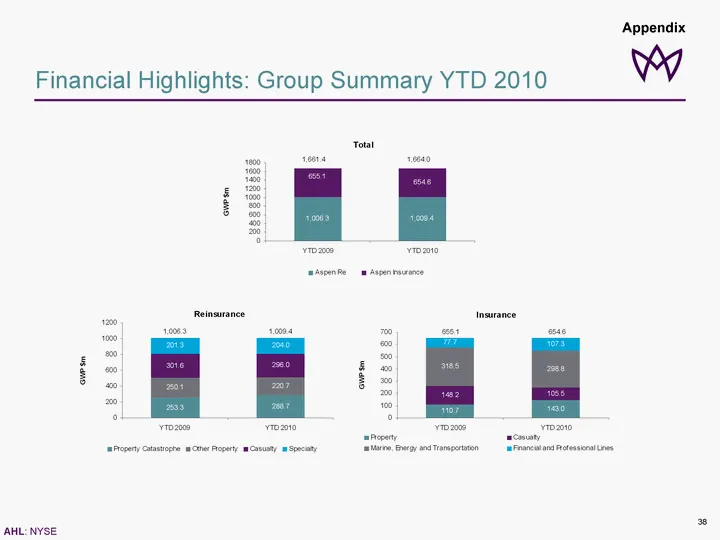
Slide 38: Financial Highlights: Group Summary YTD 2010
Financial Highlights: Group Summary YTD 2010 Financial Highlights: Group Summary YTD 2010 Appendix
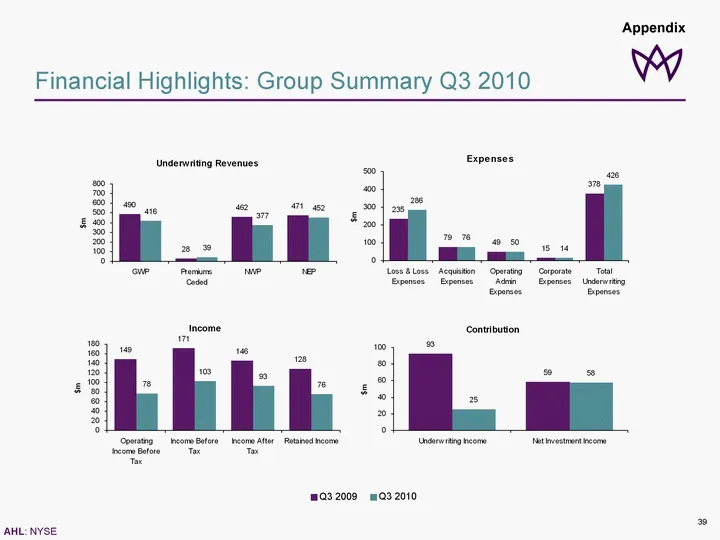
Slide 39: Financial Highlights: Group Summary Q3 2010
Financial Highlights: Group Summary Q3 2010 Q3 2009 Q3 2010 Appendix
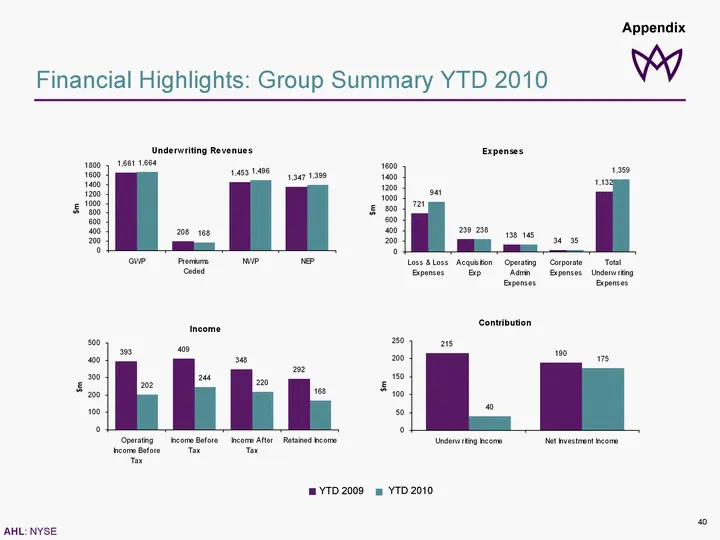
Slide 40: Financial Highlights: Group Summary YTD 2010
Financial Highlights: Group Summary YTD 2010 YTD 2009 YTD 2010 Appendix
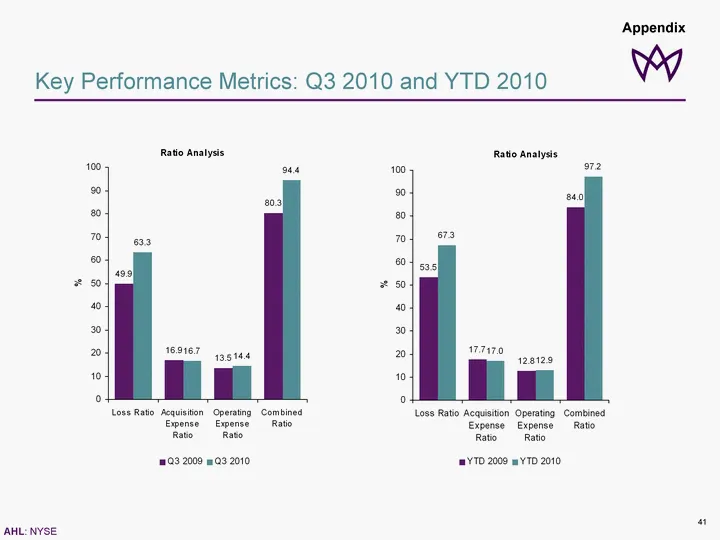
Slide 41: Key Performance Metrics: Q3 2010 and YTD 2010
Key Performance Metrics: Q3 2010 and YTD 2010 * * Appendix
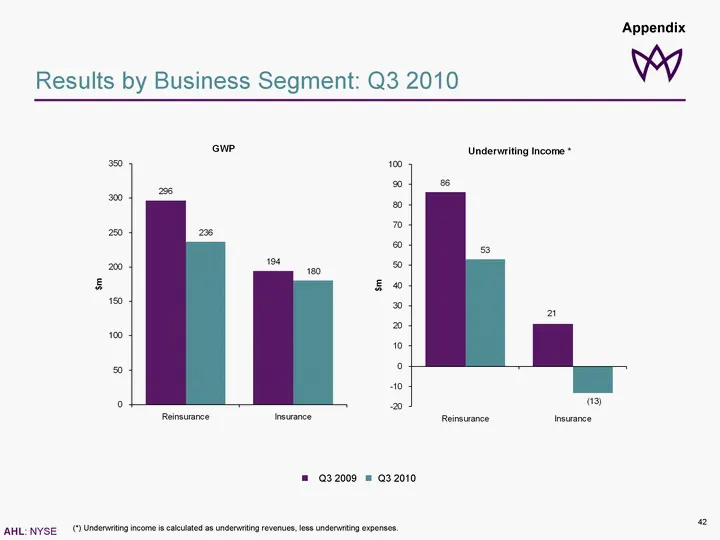
Slide 42: Results by Business Segment: Q3 2010
Results by Business Segment: Q3 2010 (*) Underwriting income is calculated as underwriting revenues, less underwriting expenses. n Q3 2009 n Q3 2010 n Q3 2009 n Q3 2010 Appendix
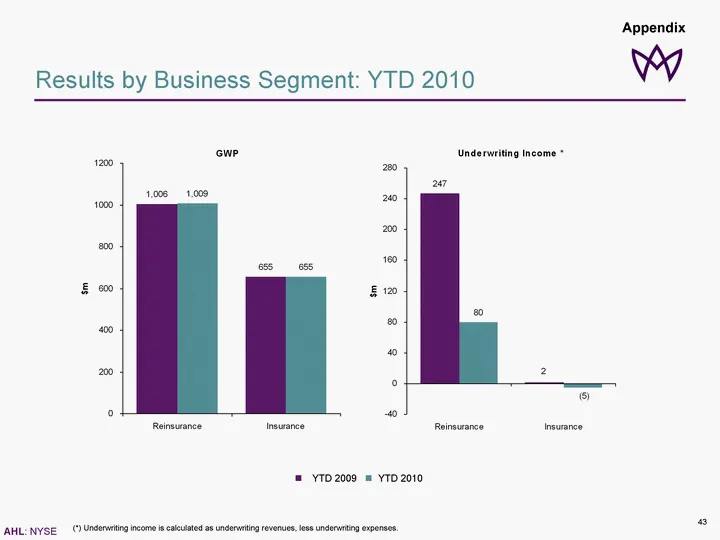
Slide 43: Results by Business Segment: YTD 2010
Results by Business Segment: YTD 2010 (*) Underwriting income is calculated as underwriting revenues, less underwriting expenses. n YTD 2009 n YTD 2010 n YTD 2009 n YTD 2010 Appendix
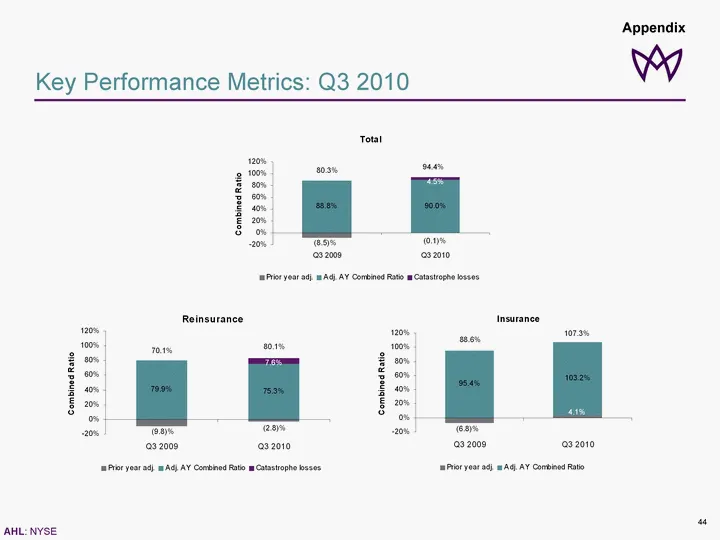
Slide 44: Key Performance Metrics: Q3 2010
Key Performance Metrics: Q3 2010 * * Appendix
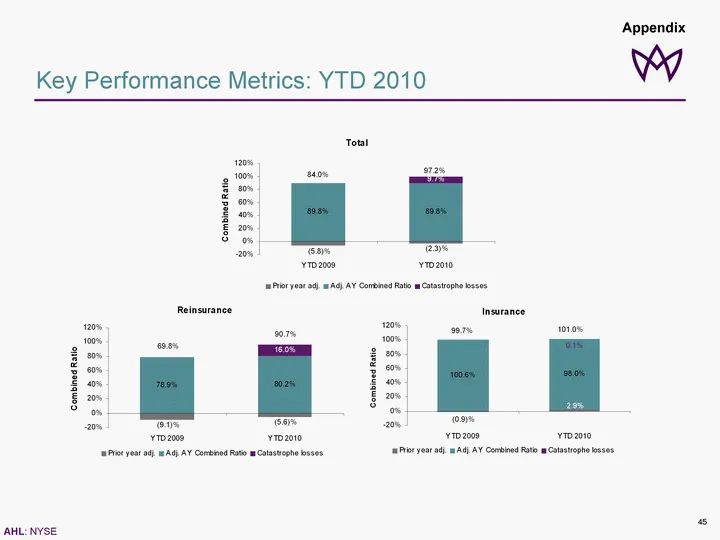
Slide 45: Key Performance Metrics: YTD 2010
Key Performance Metrics: YTD 2010 * * Appendix
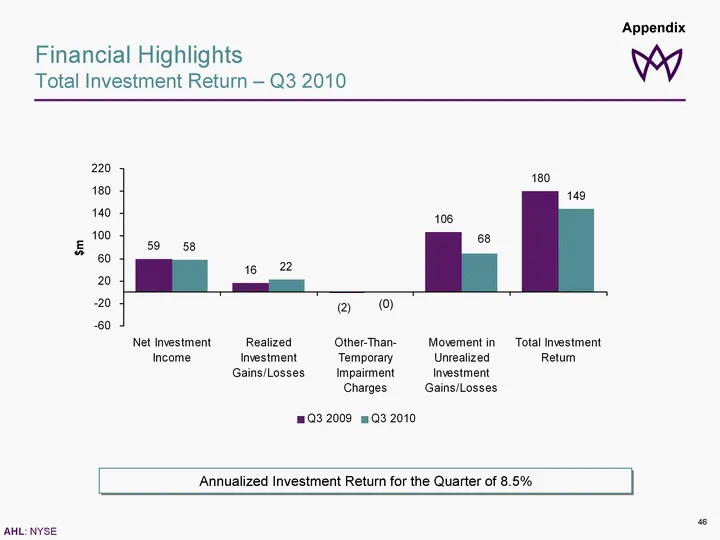
Slide 46: Total Investment Return - Q3 2010
Financial Highlights Total Investment Return - Q3 2010 Annualized Investment Return for the Quarter of 8.5% Annualized Investment Return for the Quarter of 8.5% (0) Appendix
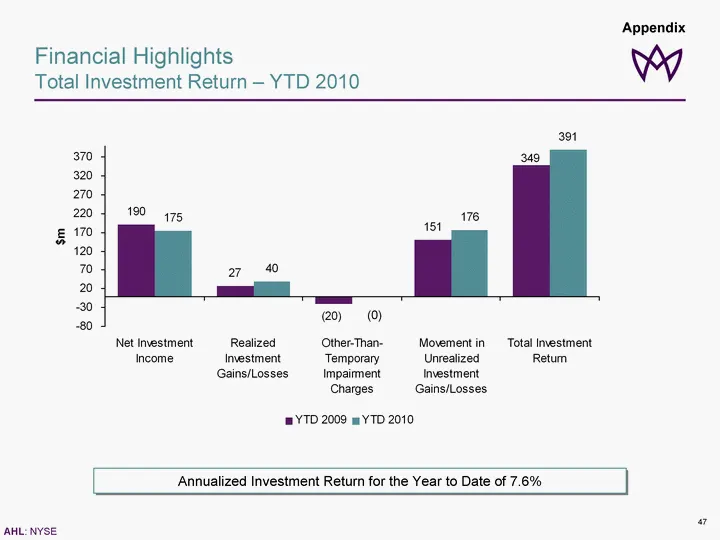
Slide 47: Total Investment Return - YTD 2010
Financial Highlights Total Investment Return - YTD 2010 Annualized Investment Return for the Year to Date of 7.6% Annualized Investment Return for the Year to Date of 7.6% (0) Appendix
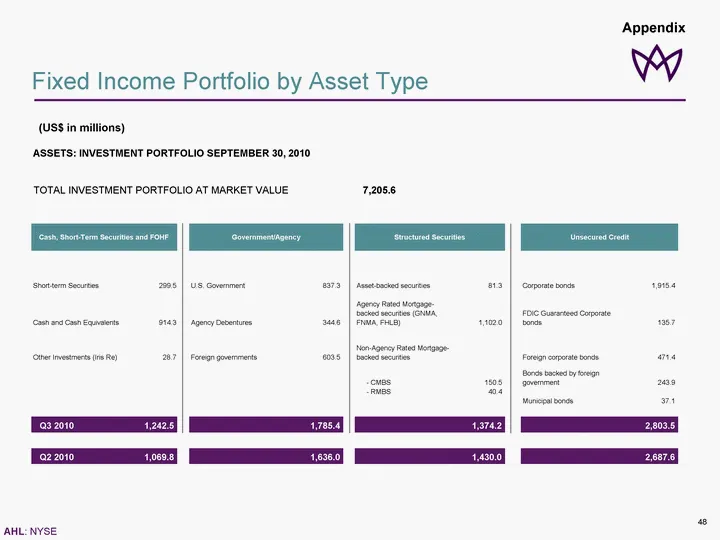
Slide 48: Fixed Income Portfolio by Asset Type
Fixed Income Portfolio by Asset Type (US$ in millions) ASSETS: INVESTMENT PORTFOLIO SEPTEMBER 30, 2010 TOTAL INVESTMENT PORTFOLIO AT MARKET VALUE 7,205.6 Short-term Securities 299.5 837.3 81.3 1,915.4 Cash and Cash Equivalents 914.3 344.6 1,102.0 135.7 Other Investments (Iris Re) 28.7 603.5 471.4 -
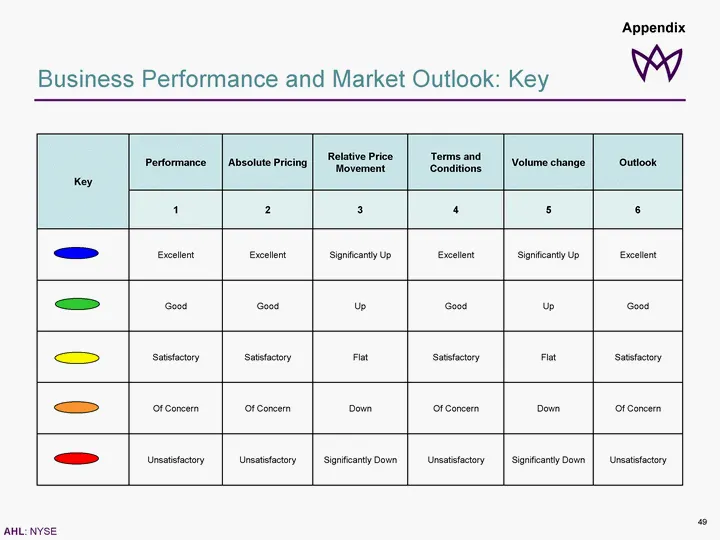
Slide 49: Business Performance and Market Outlook: Key
Business Performance and Market Outlook: Key Key Performance Absolute Pricing Relative Price Movement Terms and Conditions Volume change Outlook Key 1 2 3 4 5 6 Excellent Excellent Significantly Up Excellent Significantly Up Excellent Good Good Up Good Up Good Satisfactory Satisfactory Flat Satisfac
Source: SEC EDGAR · 8-K filed Nov 16, 2010
More decks from Aspen Insurance Holdings Ltd
 Q1 2018 Earnings Presentation13 slides · May 2, 2018
 Q3 2017 Earnings Presentation20 slides · Nov 15, 2017
 Q2 2017 Earnings Presentation20 slides · Jul 26, 2017
 Q1 2017 Earnings Presentation20 slides · Apr 26, 2017
 Q4 2016 Earnings Presentation16 slides · Feb 14, 2017
 Q3 2016 Earnings Presentation16 slides · Oct 26, 2016