Tabcorp Holdings Limited · ASX:TAH
Tabcorp — H1 2018 Earnings Presentation
40 slides from Tabcorp's earnings presentation, Feb 8, 2018
Slide 1: 2017/18 First Half Results Presentation
TABCORP HOLDINGS LIMITED 2017/18 FIRST HALF RESULTS PRESENTATION 8 FEBRUARY 2018 ABN 66 063 780 709
Slide 2: Table of Contents
TABLE OF CONTENTS Reshaping Tabcorp and 1H18 Overview 3-4 Tabcorp Results 6 - 12 Tatts Results 14 - 19 Pro-forma Combined Group Results 21 - 22 Capital Management 24 Regulatory Update 26 Integration Update 28 Conclusion 30 Appendices 32 - 38 2
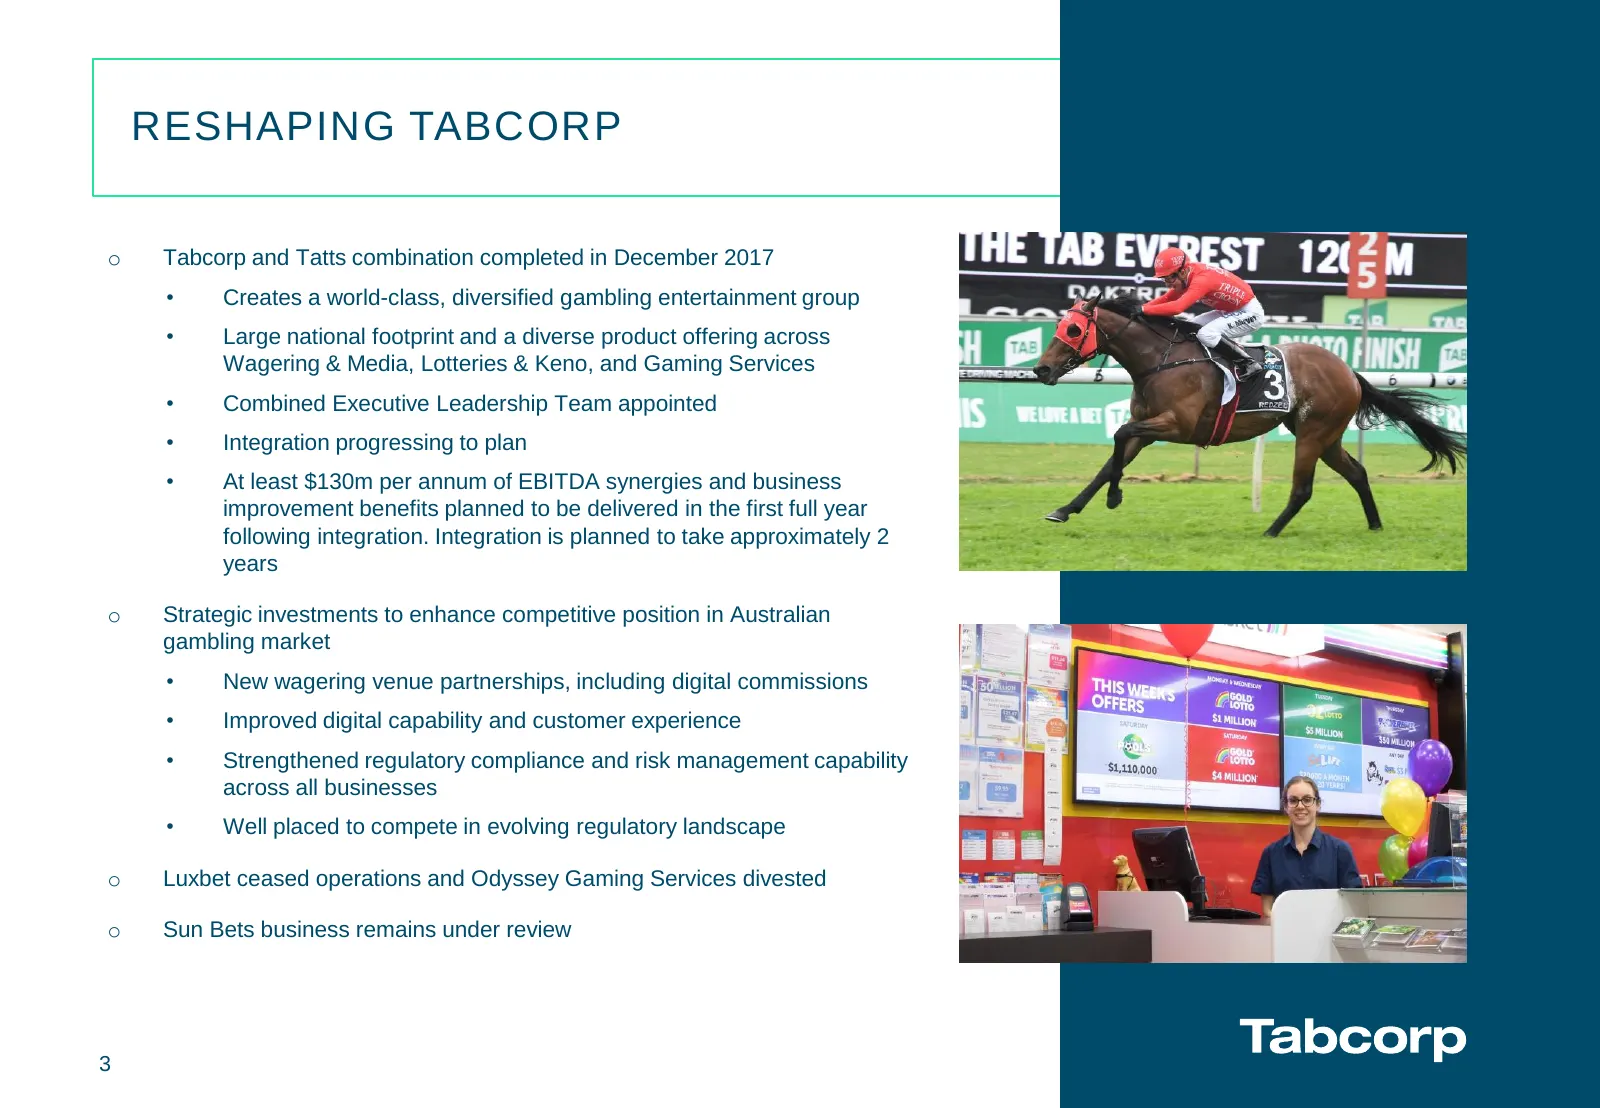
Slide 3: Reshaping Tabcorp
RESHAPING TABCORP o Tabcorp and Tatts combination completed in December 2017 • Creates a world-class, diversified gambling entertainment group • Large national footprint and a diverse product offering across Wagering & Media, Lotteries & Keno, and Gaming Services • Combined Executive Leadership Team
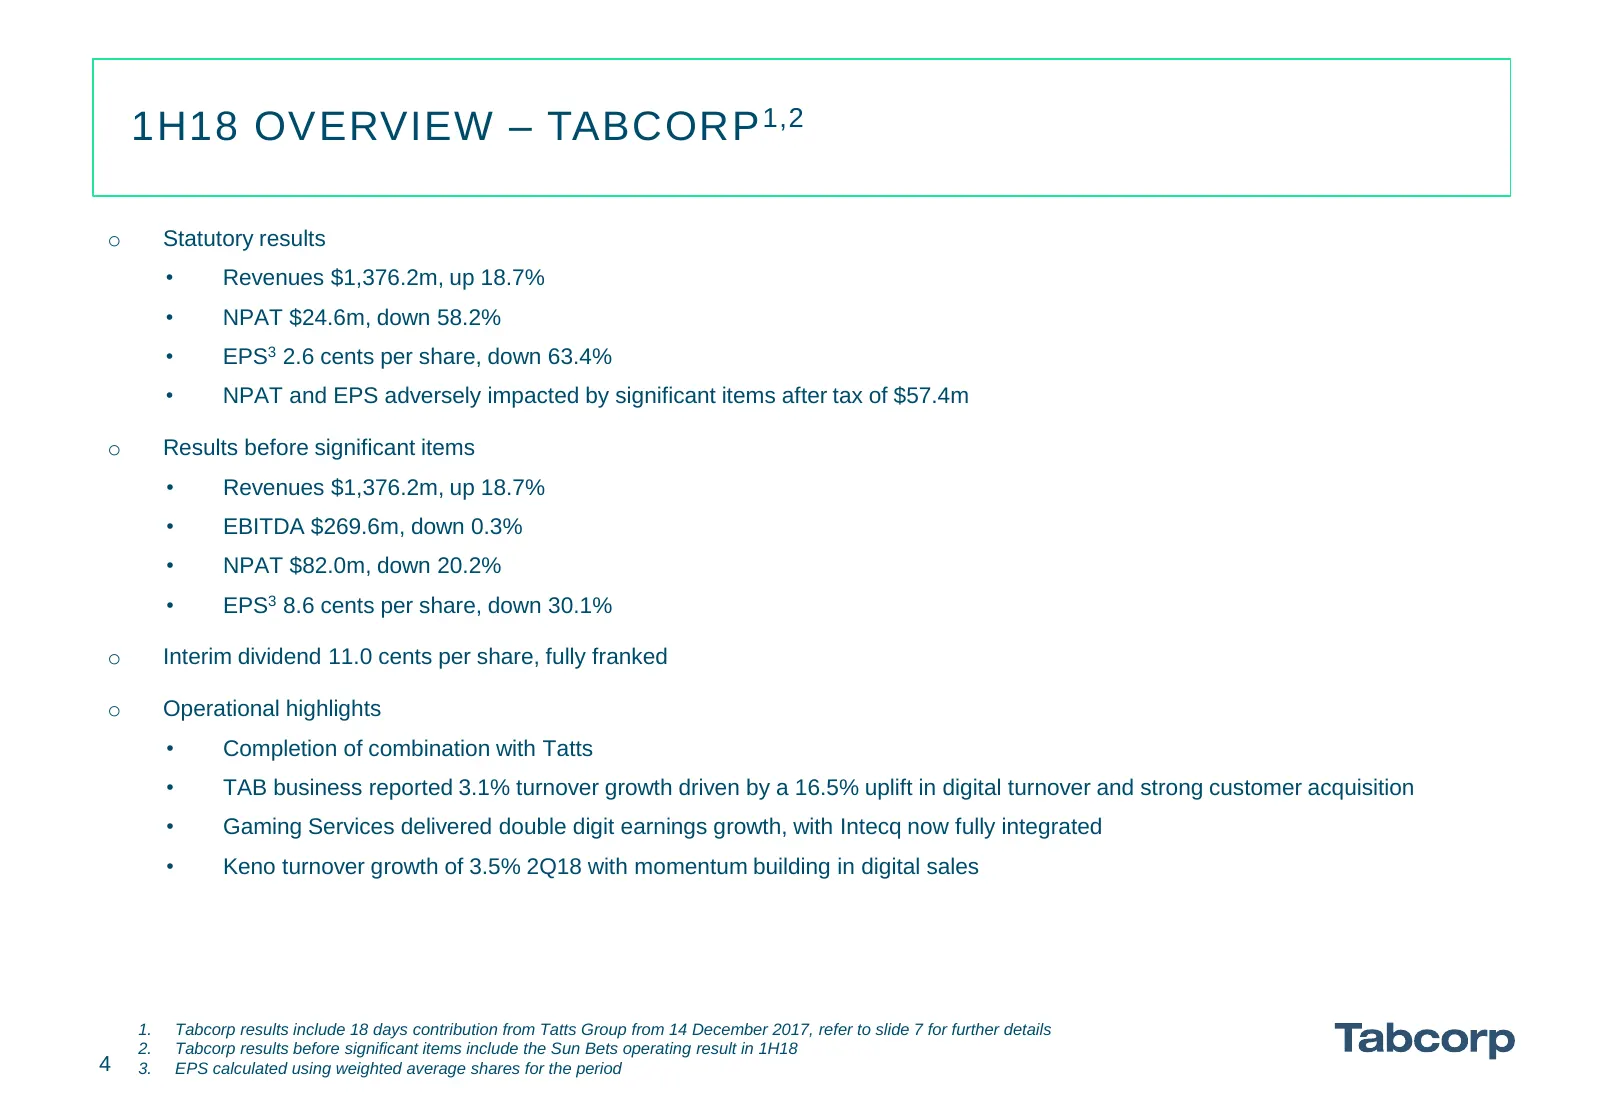
Slide 4: 1H18 Overview – Tabcorp
1H18 OVERVIEW – TABCORP 1,2 o Statutory results • Revenues $1,376.2m, up 18.7% • NPAT $24.6m, down 58.2% • EPS3 2.6 cents per share, down 63.4% • NPAT and EPS adversely impacted by significant items after tax of $57.4m o Results before significant items • Revenues $1,376.2m, up 18.7% • EBITDA $269.6
Slide 5: Table of Contents
TABLE OF CONTENTS Reshaping Tabcorp and 1H18 Overview 3-4 Tabcorp Results 6 - 12 Tatts Results 14 - 19 Pro-forma Combined Group Results 21 - 22 Capital Management 24 Regulatory Update 26 Integration Update 28 Conclusion 30 Appendices 32 - 38 5
Slide 6: Group Results
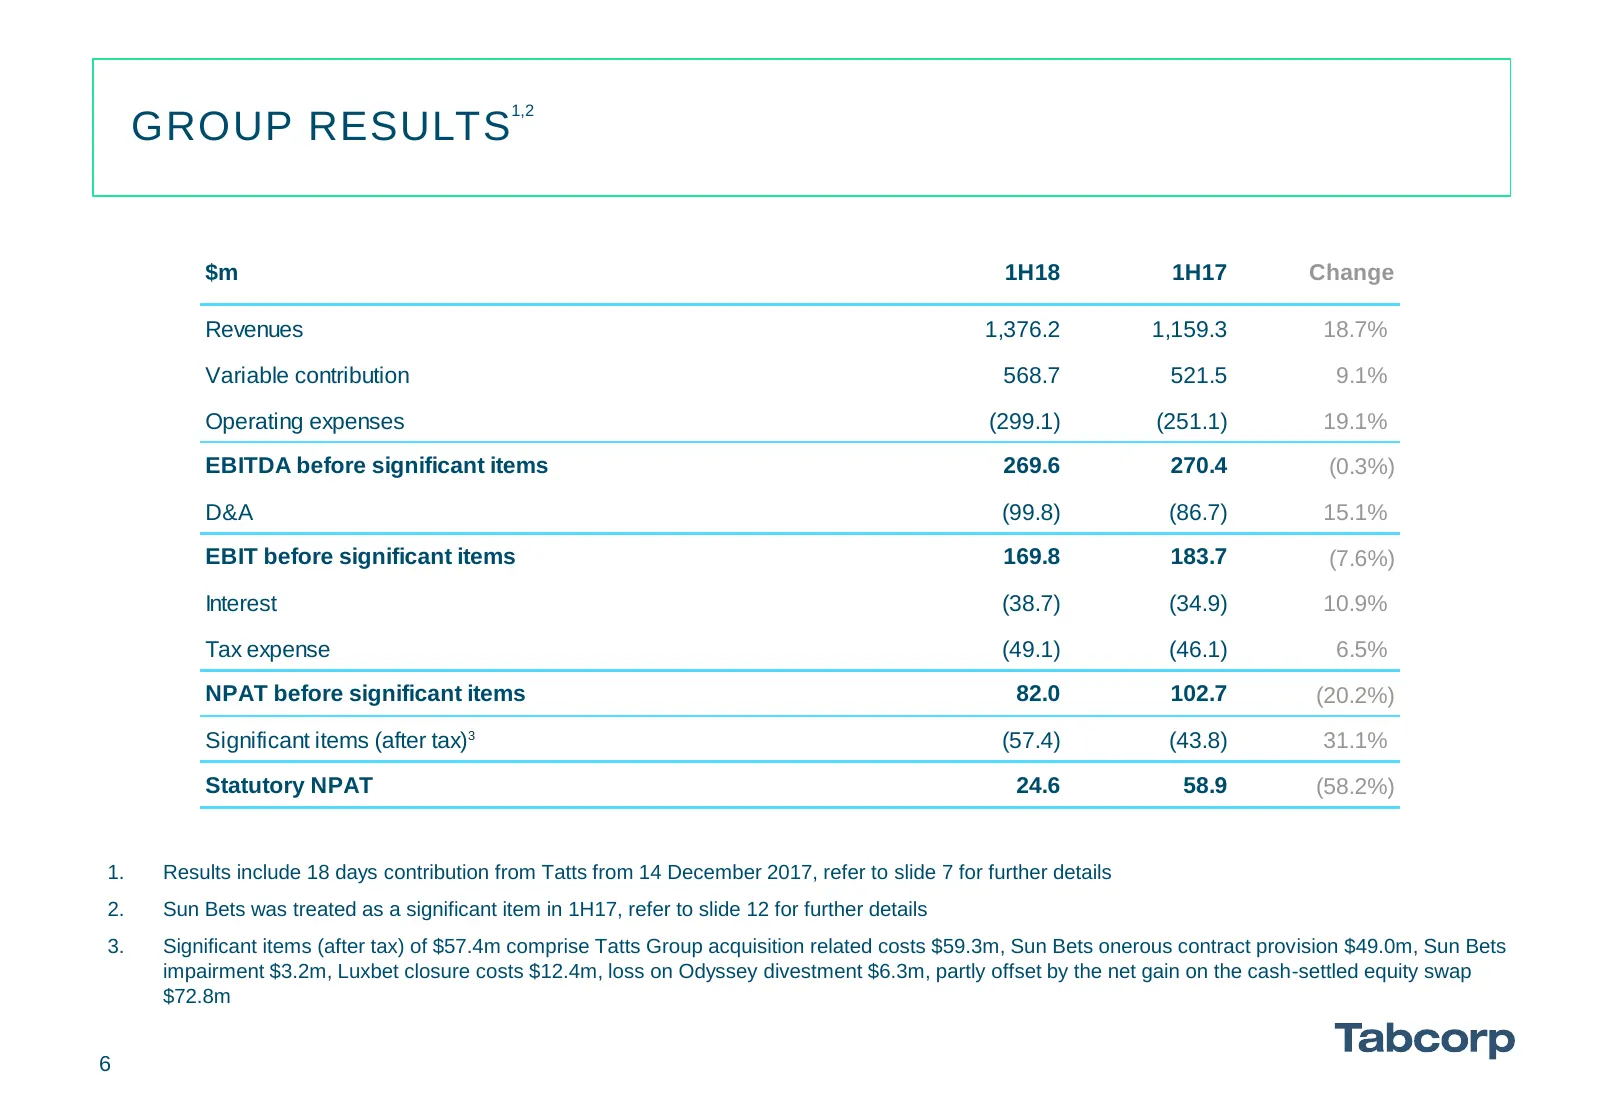
1,2 GROUP RESULTS $m 1H18 1H17 Change Revenues 1,376.2 1,159.3 18.7% Variable contribution 568.7 521.5 9.1% Operating expenses (299.1) (251.1) 19.1% EBITDA before significant items 269.6 270.4 (0.3%) D&A (99.8) (86.7) 15.1% EBIT before significant items 169.8 183.7 (7.6%) Interest (38.7) (34.9) 10.9
Slide 7: Business Results
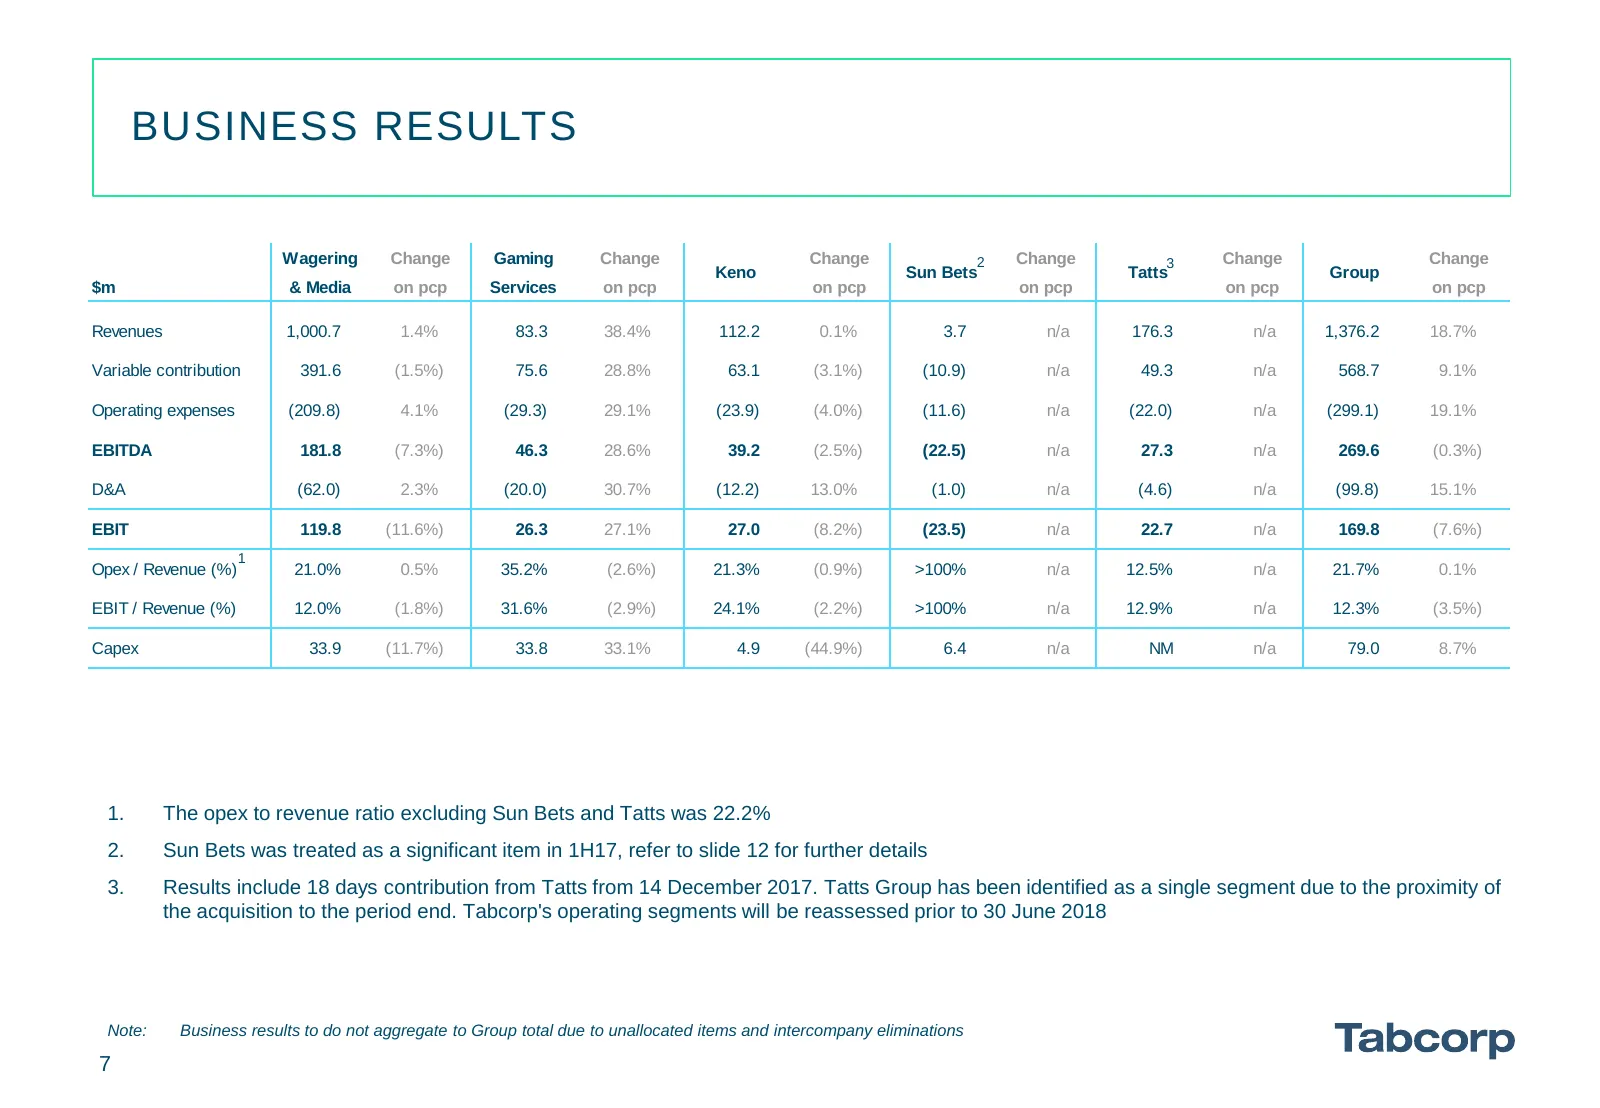
BUSINESS RESULTS Wagering Change Gaming Change Change 2 Change 3 Change Change Keno Sun Bets Tatts Group $m & Media on pcp Services on pcp on pcp on pcp on pcp on pcp Revenues 1,000.7 1.4% 83.3 38.4% 112.2 0.1% 3.7 n/a 176.3 n/a 1,376.2 18.7% Variable contribution 391.6 (1.5%) 75.6 28.8% 63.1 (3.1%)
Slide 8: Wagering & Media
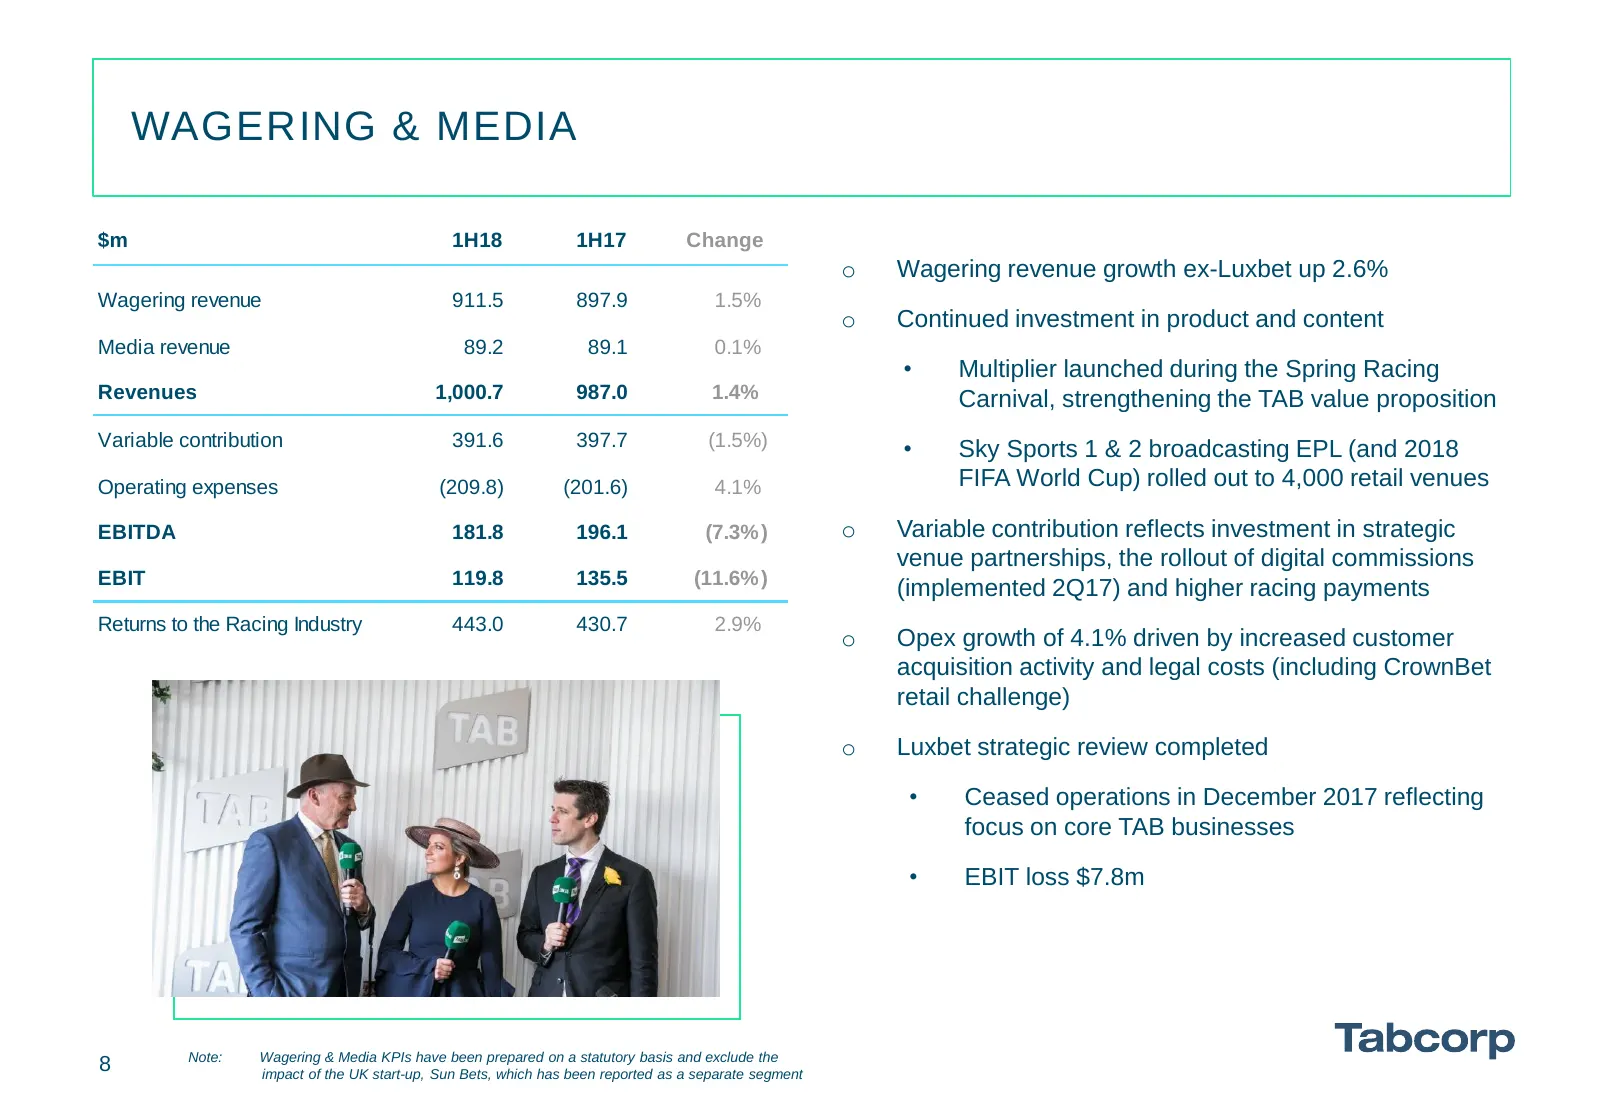
WAGERING & MEDIA $m 1H18 1H17 Change o Wagering revenue growth ex-Luxbet up 2.6% Wagering revenue 911.5 897.9 1.5% o Continued investment in product and content Media revenue 89.2 89.1 0.1% • Multiplier launched during the Spring Racing Revenues 1,000.7 987.0 1.4% Carnival, strengthening the TAB val
Slide 9: TAB: KPIs
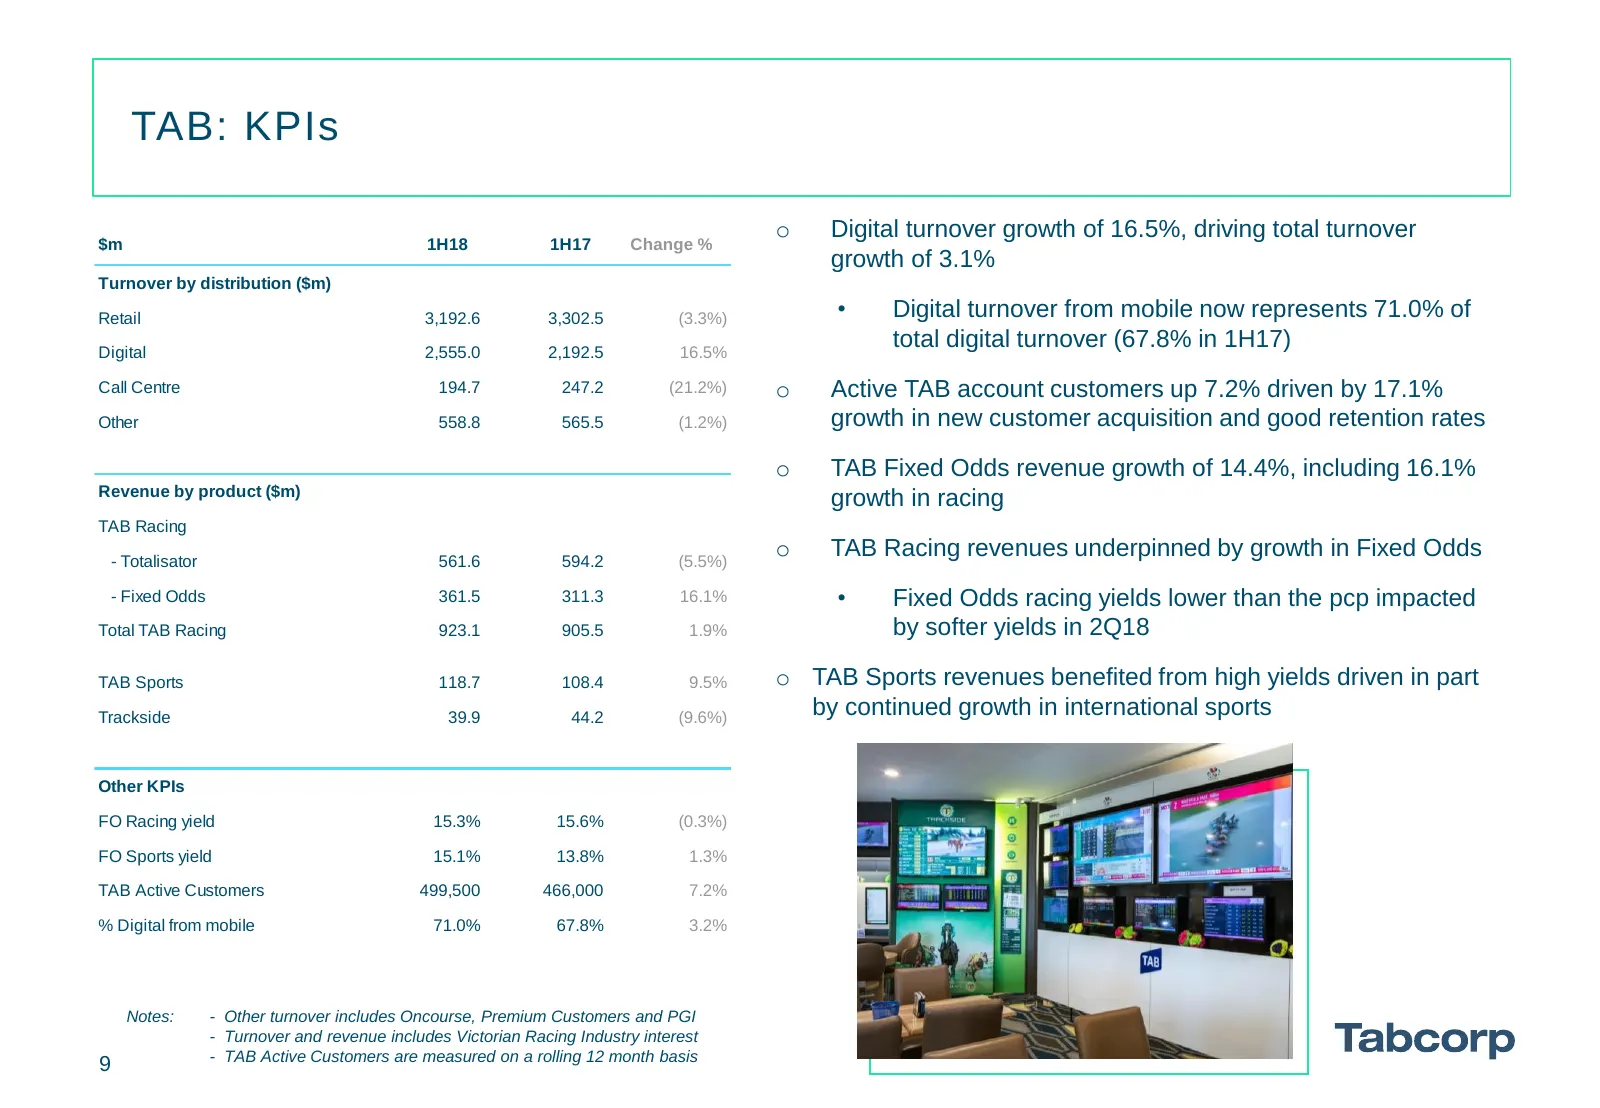
TAB: KPIs o Digital turnover growth of 16.5%, driving total turnover $m 1H18 1H17 Change % growth of 3.1% Turnover by distribution ($m) Retail 3,192.6 3,302.5 (3.3%) • Digital turnover from mobile now represents 71.0% of Digital 2,555.0 2,192.5 16.5% total digital turnover (67.8% in 1H17) Call Centr
Slide 10: Gaming Services
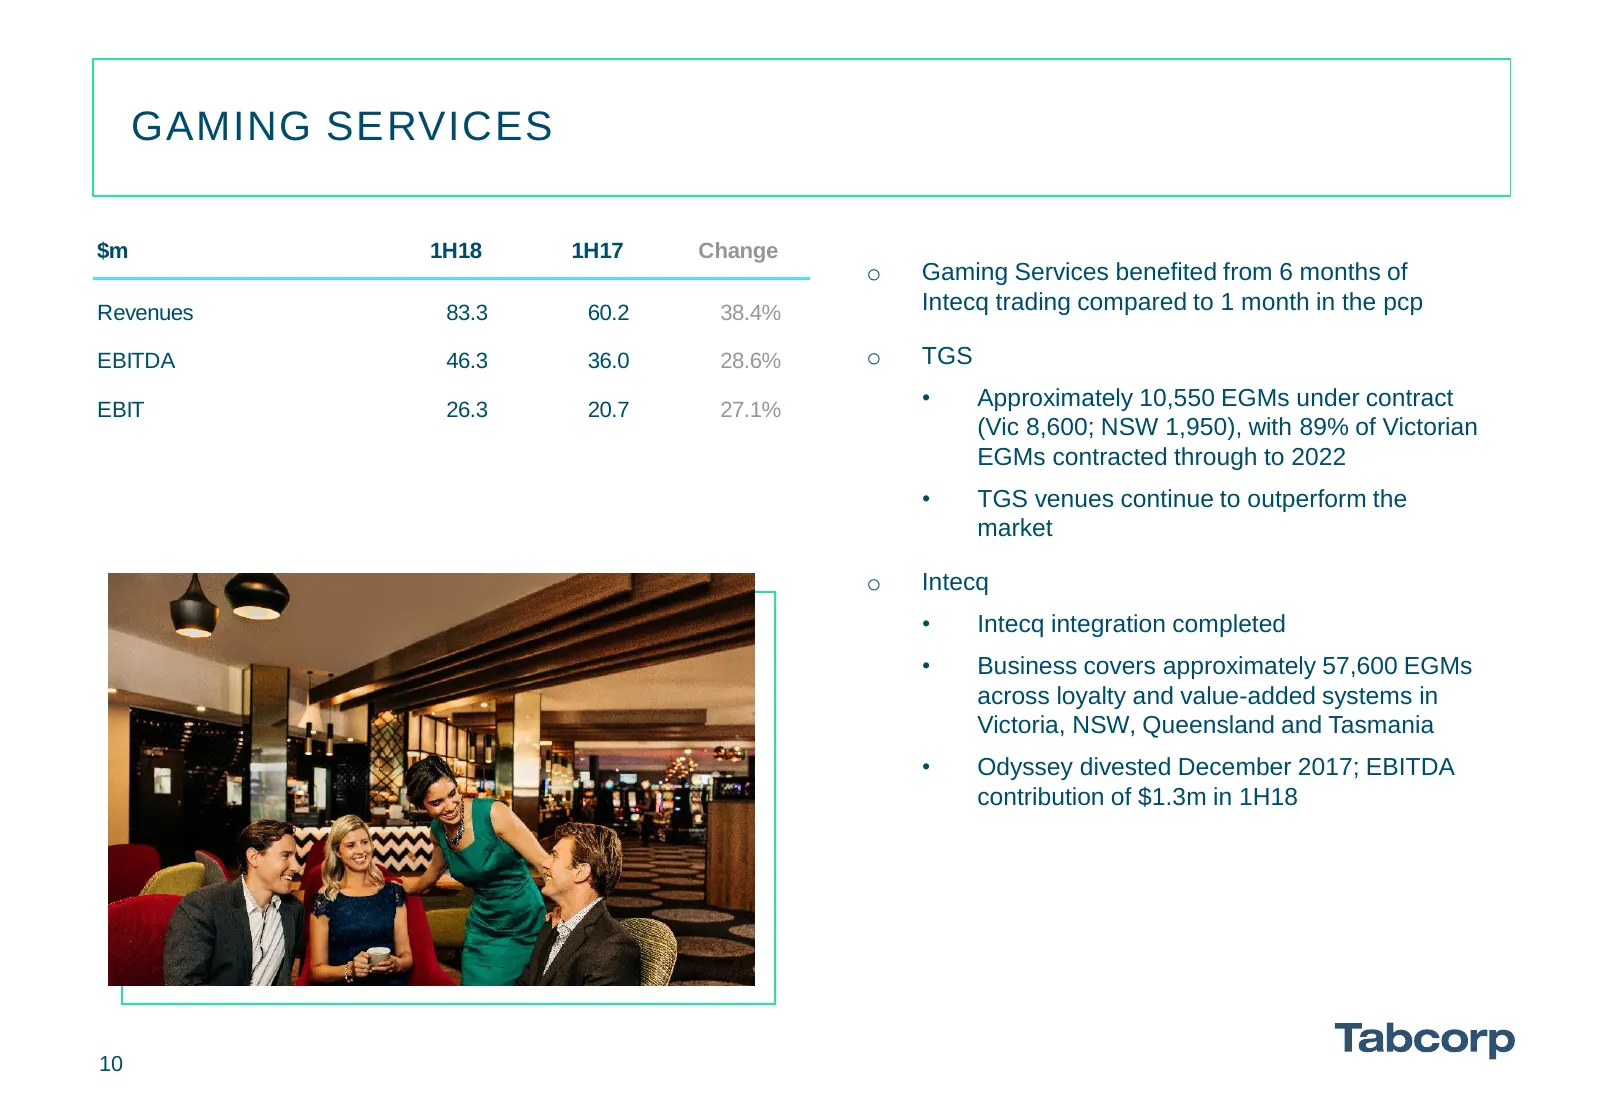
GAMING SERVICES $m 1H18 1H17 Change o Gaming Services benefited from 6 months of Revenues 83.3 60.2 38.4% Intecq trading compared to 1 month in the pcp EBITDA 46.3 36.0 28.6% o TGS EBIT 26.3 20.7 27.1% • Approximately 10,550 EGMs under contract (Vic 8,600; NSW 1,950), with 89% of Victorian EGMs cont
Slide 11: Keno
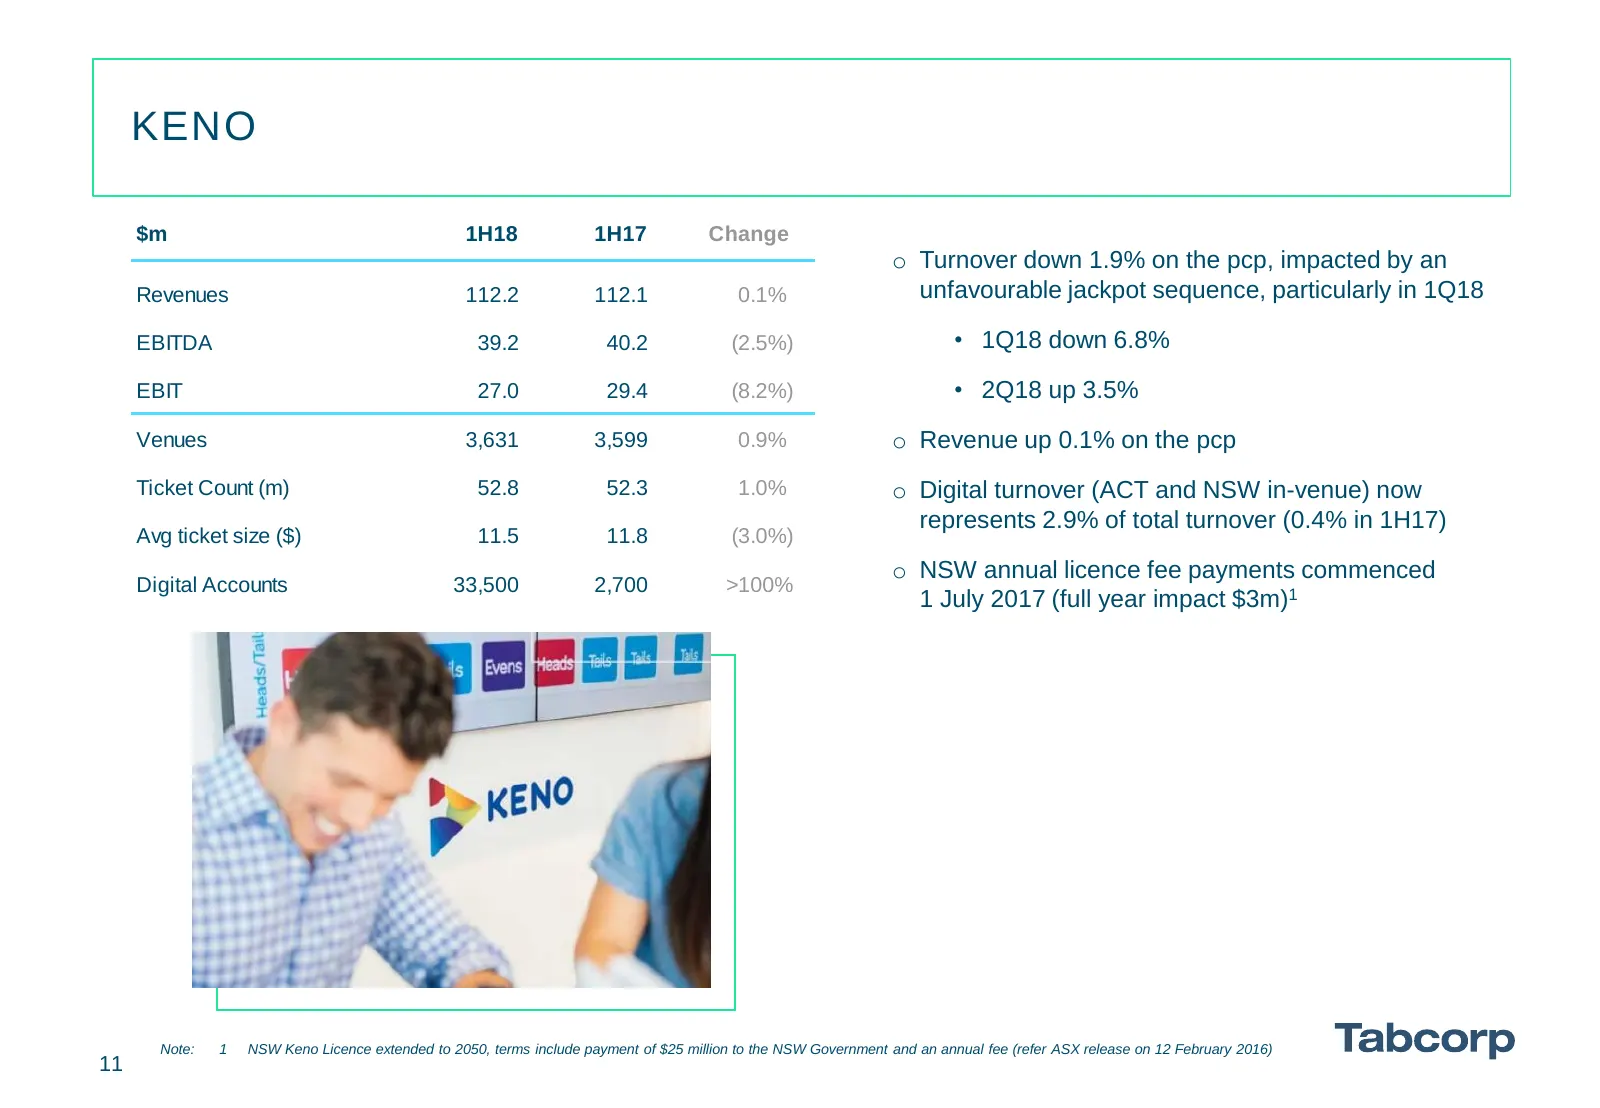
KENO $m 1H18 1H17 Change o Turnover down 1.9% on the pcp, impacted by an Revenues 112.2 112.1 0.1% unfavourable jackpot sequence, particularly in 1Q18 EBITDA 39.2 40.2 (2.5%) • 1Q18 down 6.8% EBIT 27.0 29.4 (8.2%) • 2Q18 up 3.5% Venues 3,631 3,599 0.9% o Revenue up 0.1% on the pcp Ticket Count (m) 5
Slide 12: Sun Bets
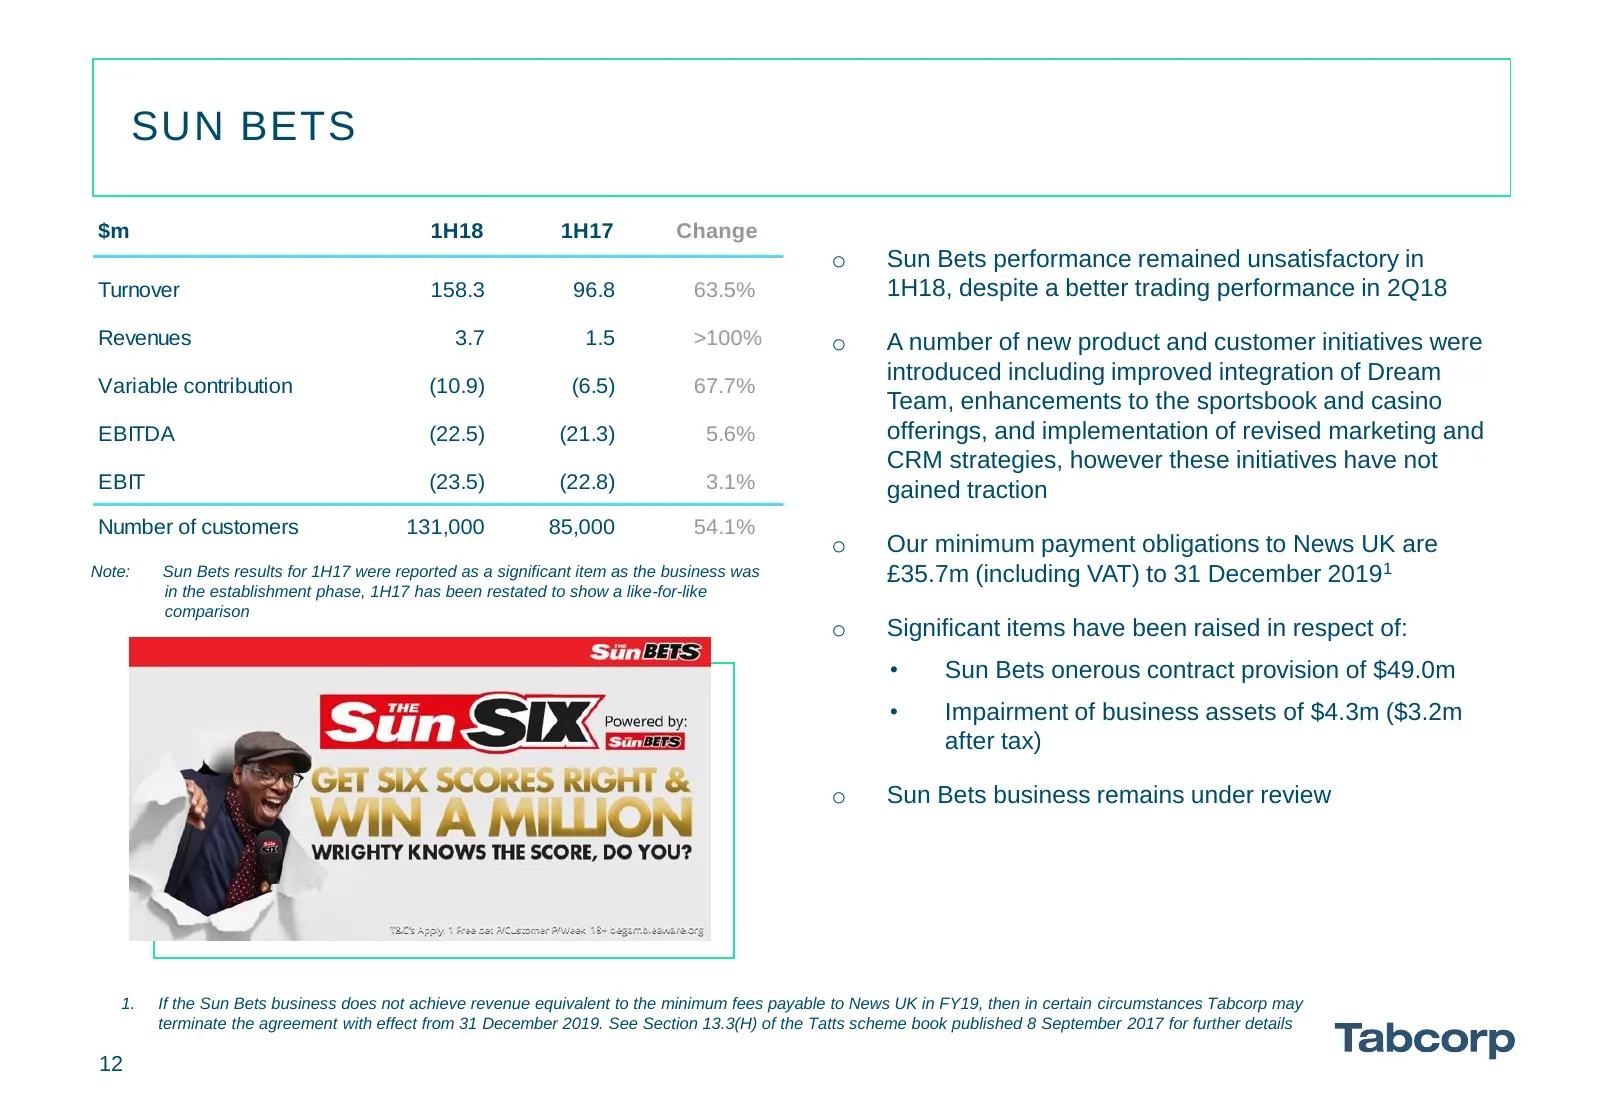
SUN BETS $m 1H18 1H17 Change o Sun Bets performance remained unsatisfactory in Turnover 158.3 96.8 63.5% 1H18, despite a better trading performance in 2Q18 Revenues 3.7 1.5 >100% o A number of new product and customer initiatives were introduced including improved integration of Dream Variable contr
Slide 13: Table of Contents
TABLE OF CONTENTS Reshaping Tabcorp and 1H18 Overview 3-4 Tabcorp Results 6 - 12 Tatts Results 14 - 19 Pro-forma Combined Group Results 21 - 22 Capital Management 24 Regulatory Update 26 Integration Update 28 Conclusion 30 Appendices 32 - 38 13
Slide 14: Tatts 1H18 Overview
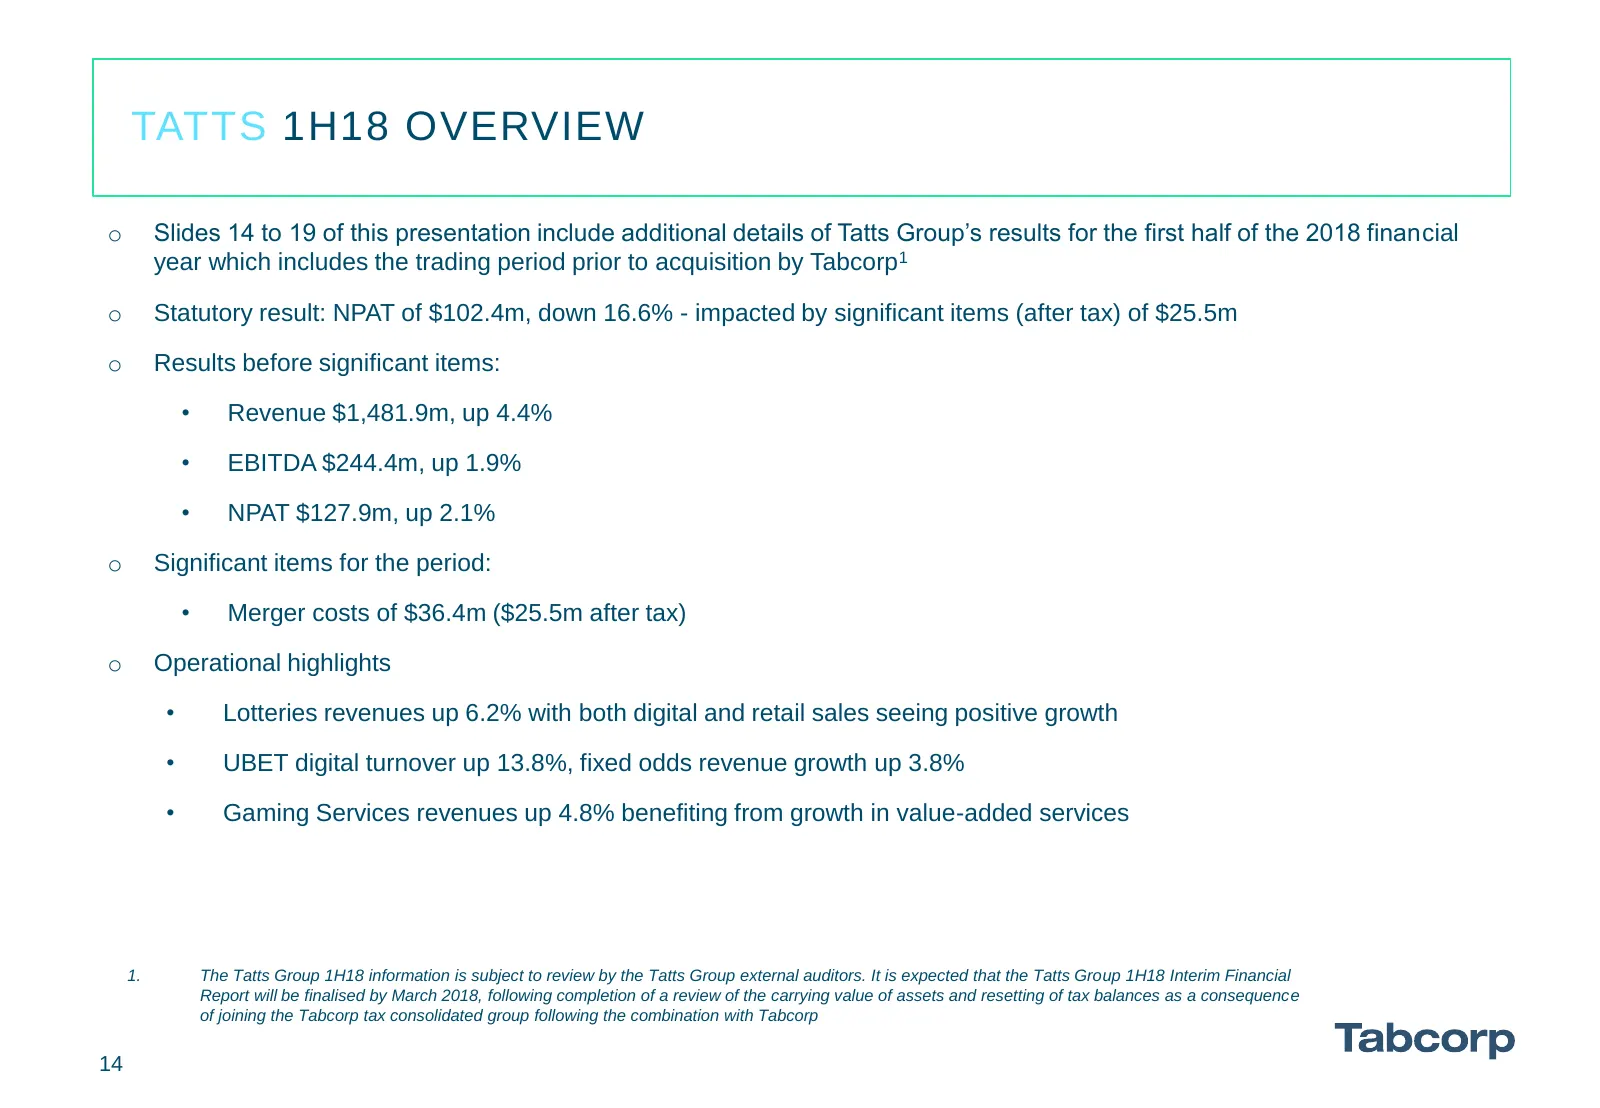
TATTS 1H18 OVERVIEW o Slides 14 to 19 of this presentation include additional details of Tatts Group’s results for the first half of the 2018 financial year which includes the trading period prior to acquisition by Tabcorp1 o Statutory result: NPAT of $102.4m, down 16.6% - impacted by significant it
Slide 15: Tatts Group Results
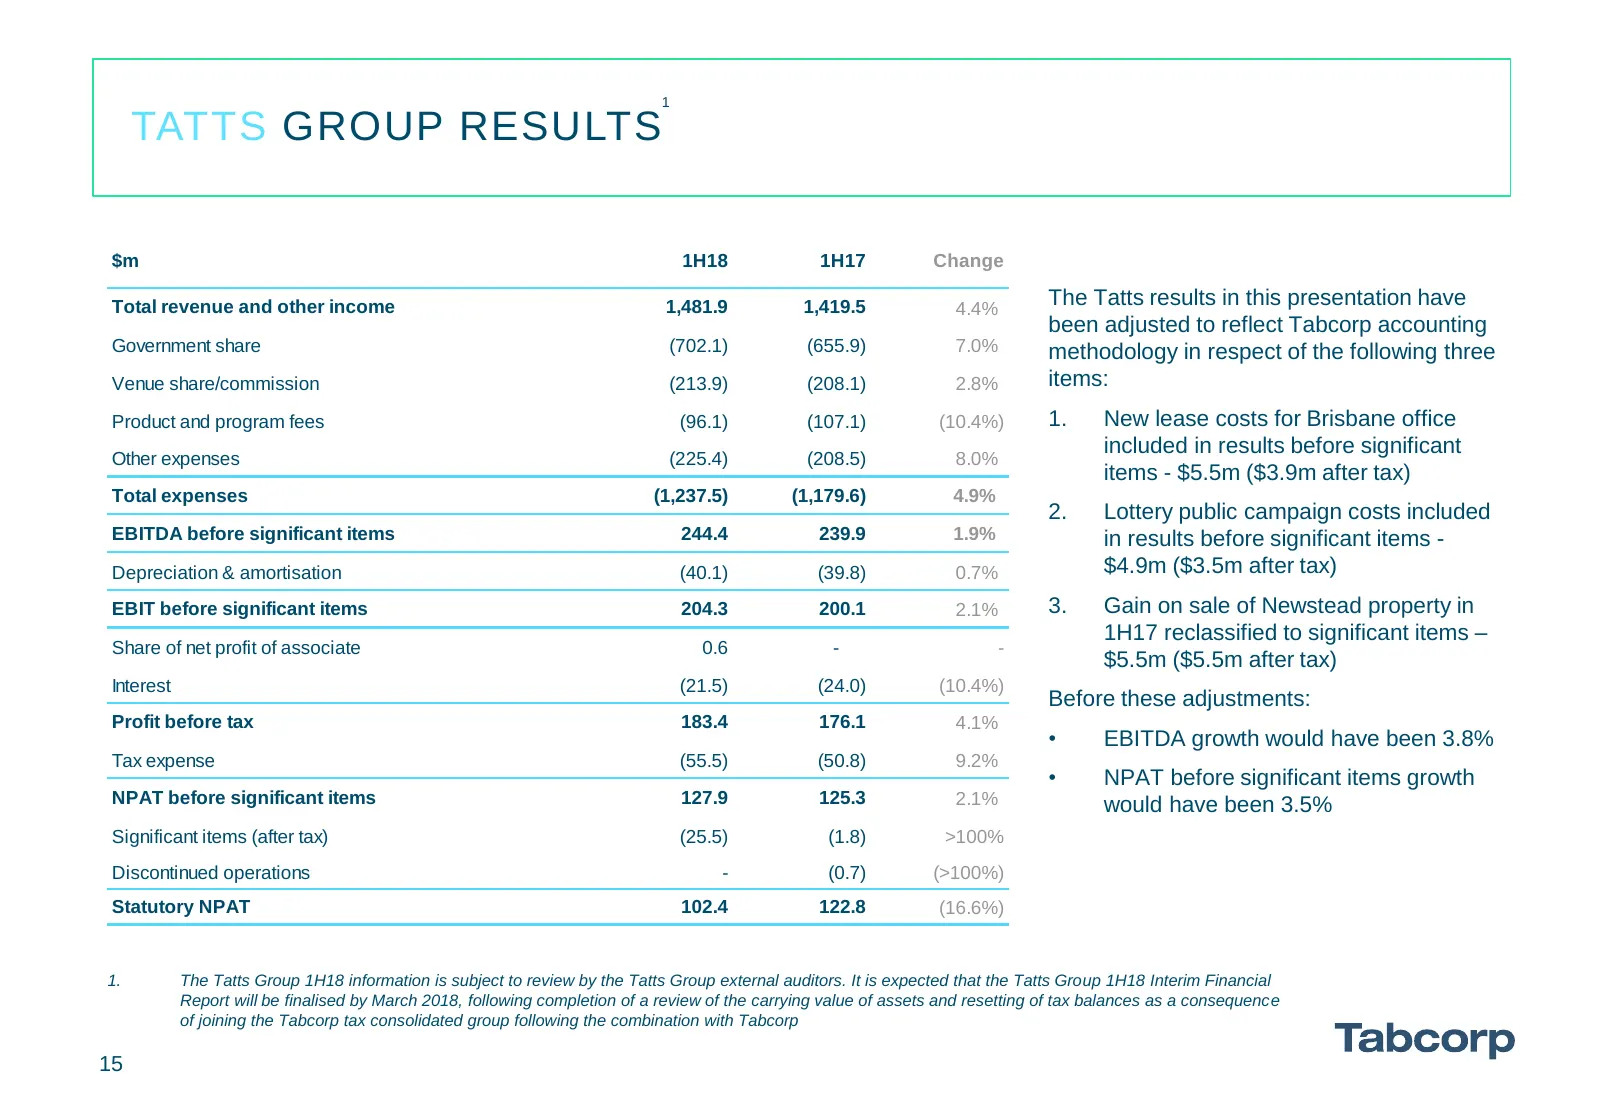
1 TATTS GROUP RESULTS $m 1H18 1H17 Change Total revenue and other income 1,481.9 1,419.5 4.4% The Tatts results in this presentation have been adjusted to reflect Tabcorp accounting Government share (702.1) (655.9) 7.0% methodology in respect of the following three Venue share/commission (213.9) (20
Slide 16: Tatts Business Results
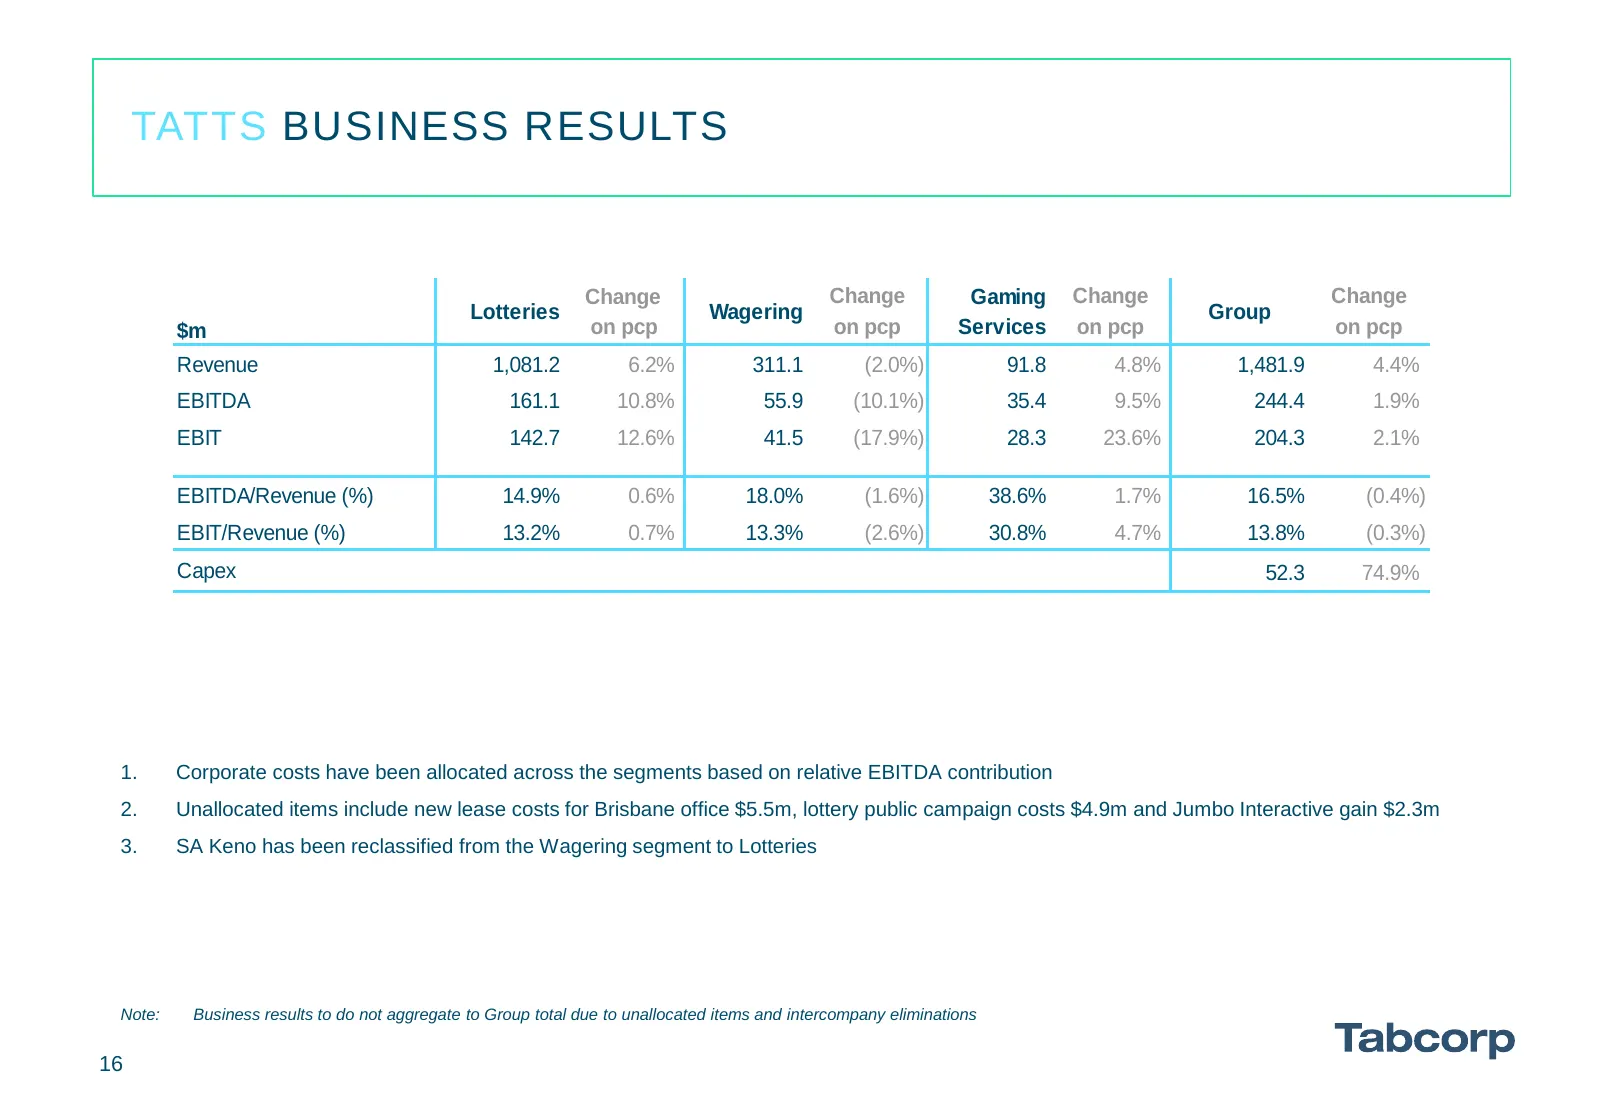
TATTS BUSINESS RESULTS Change Change Gaming Change Change Lotteries Wagering Group $m on pcp on pcp Services on pcp on pcp Revenue 1,081.2 6.2% 311.1 (2.0%) 91.8 4.8% 1,481.9 4.4% EBITDA 161.1 10.8% 55.9 (10.1%) 35.4 9.5% 244.4 1.9% EBIT 142.7 12.6% 41.5 (17.9%) 28.3 23.6% 204.3 2.1% EBITDA/Revenue
Slide 17: Tatts Lotteries
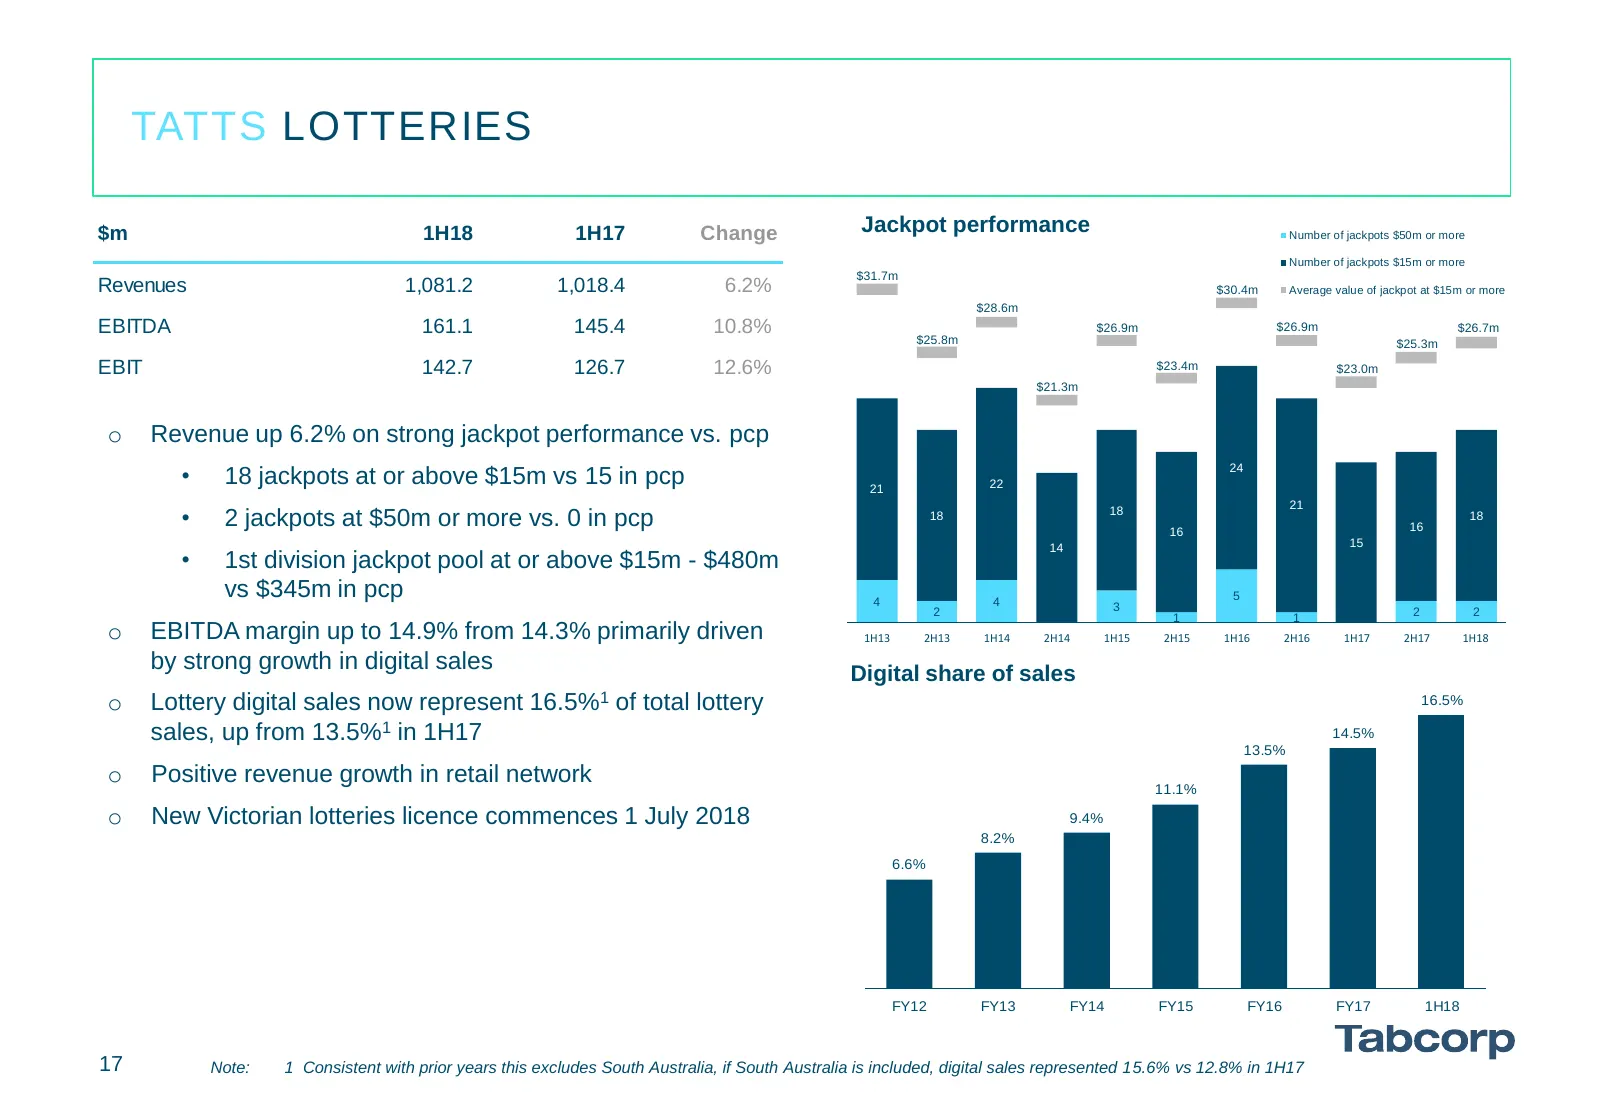
TATTS LOTTERIES $m 1H18 1H17 Change Jackpot performance Number of jackpots $50m or more Number of jackpots $15m or more $31.7m Revenues 1,081.2 1,018.4 6.2% $30.4m Average value of jackpot at $15m or more $28.6m EBITDA 161.1 145.4 10.8% $26.9m $26.9m $26.7m $25.8m $25.3m EBIT 142.7 126.7 12.6% $23.4
Slide 18: Tatts Wagering
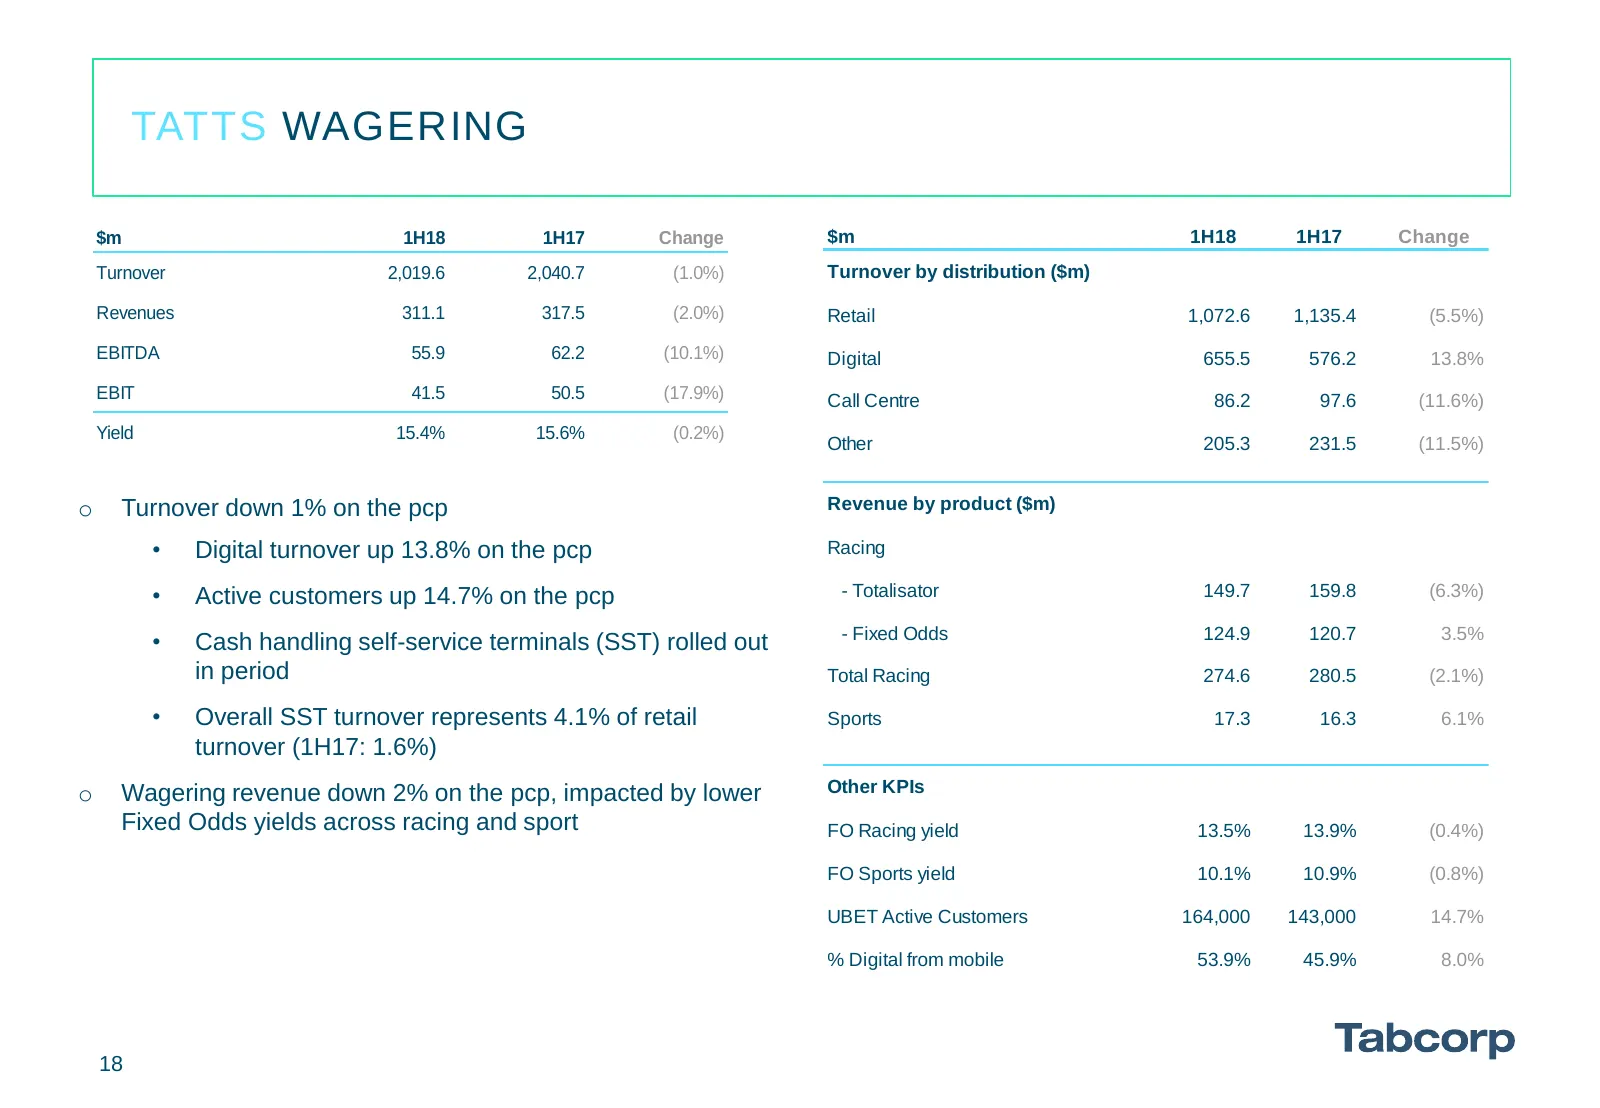
TATTS WAGERING $m 1H18 1H17 Change $m 1H18 1H17 Change Turnover 2,019.6 2,040.7 (1.0%) Turnover by distribution ($m) Revenues 311.1 317.5 (2.0%) Retail 1,072.6 1,135.4 (5.5%) EBITDA 55.9 62.2 (10.1%) Digital 655.5 576.2 13.8% EBIT 41.5 50.5 (17.9%) Call Centre 86.2 97.6 (11.6%) Yield 15.4% 15.6% (0.
Slide 19: Tatts Gaming Services
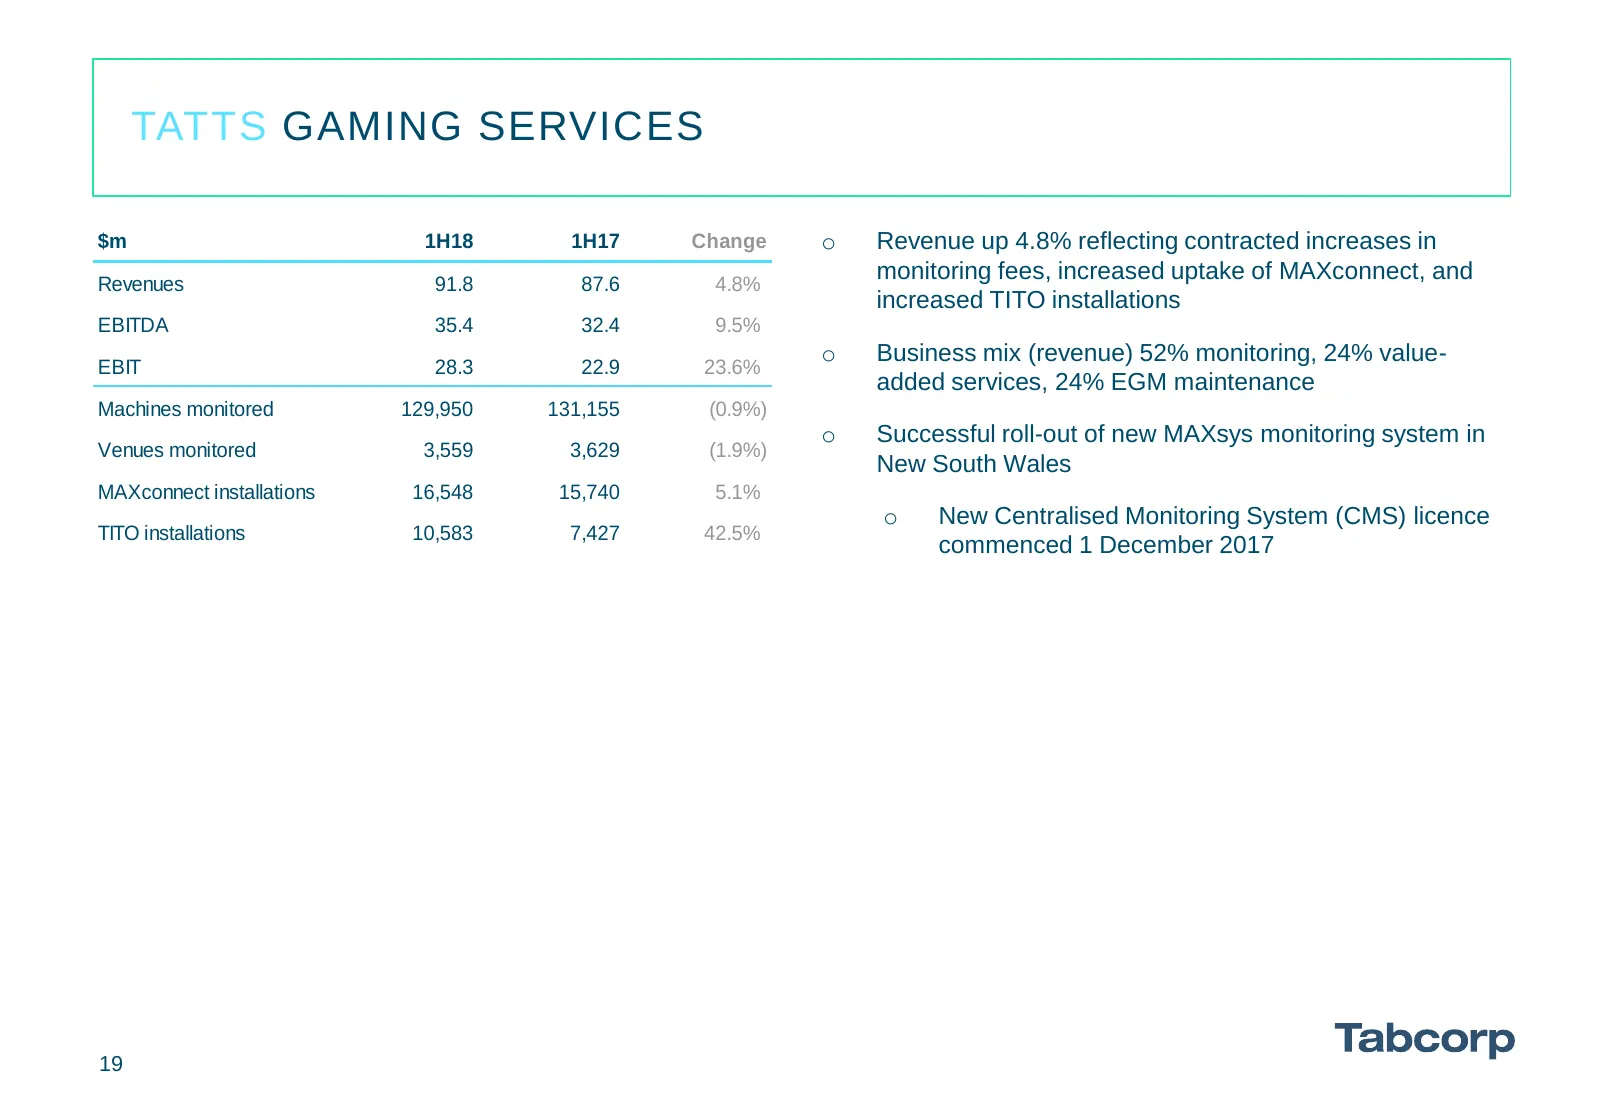
TATTS GAMING SERVICES $m 1H18 1H17 Change o Revenue up 4.8% reflecting contracted increases in Revenues 91.8 87.6 4.8% monitoring fees, increased uptake of MAXconnect, and increased TITO installations EBITDA 35.4 32.4 9.5% o Business mix (revenue) 52% monitoring, 24% value- EBIT 28.3 22.9 23.6% adde
Slide 20: Table of Contents
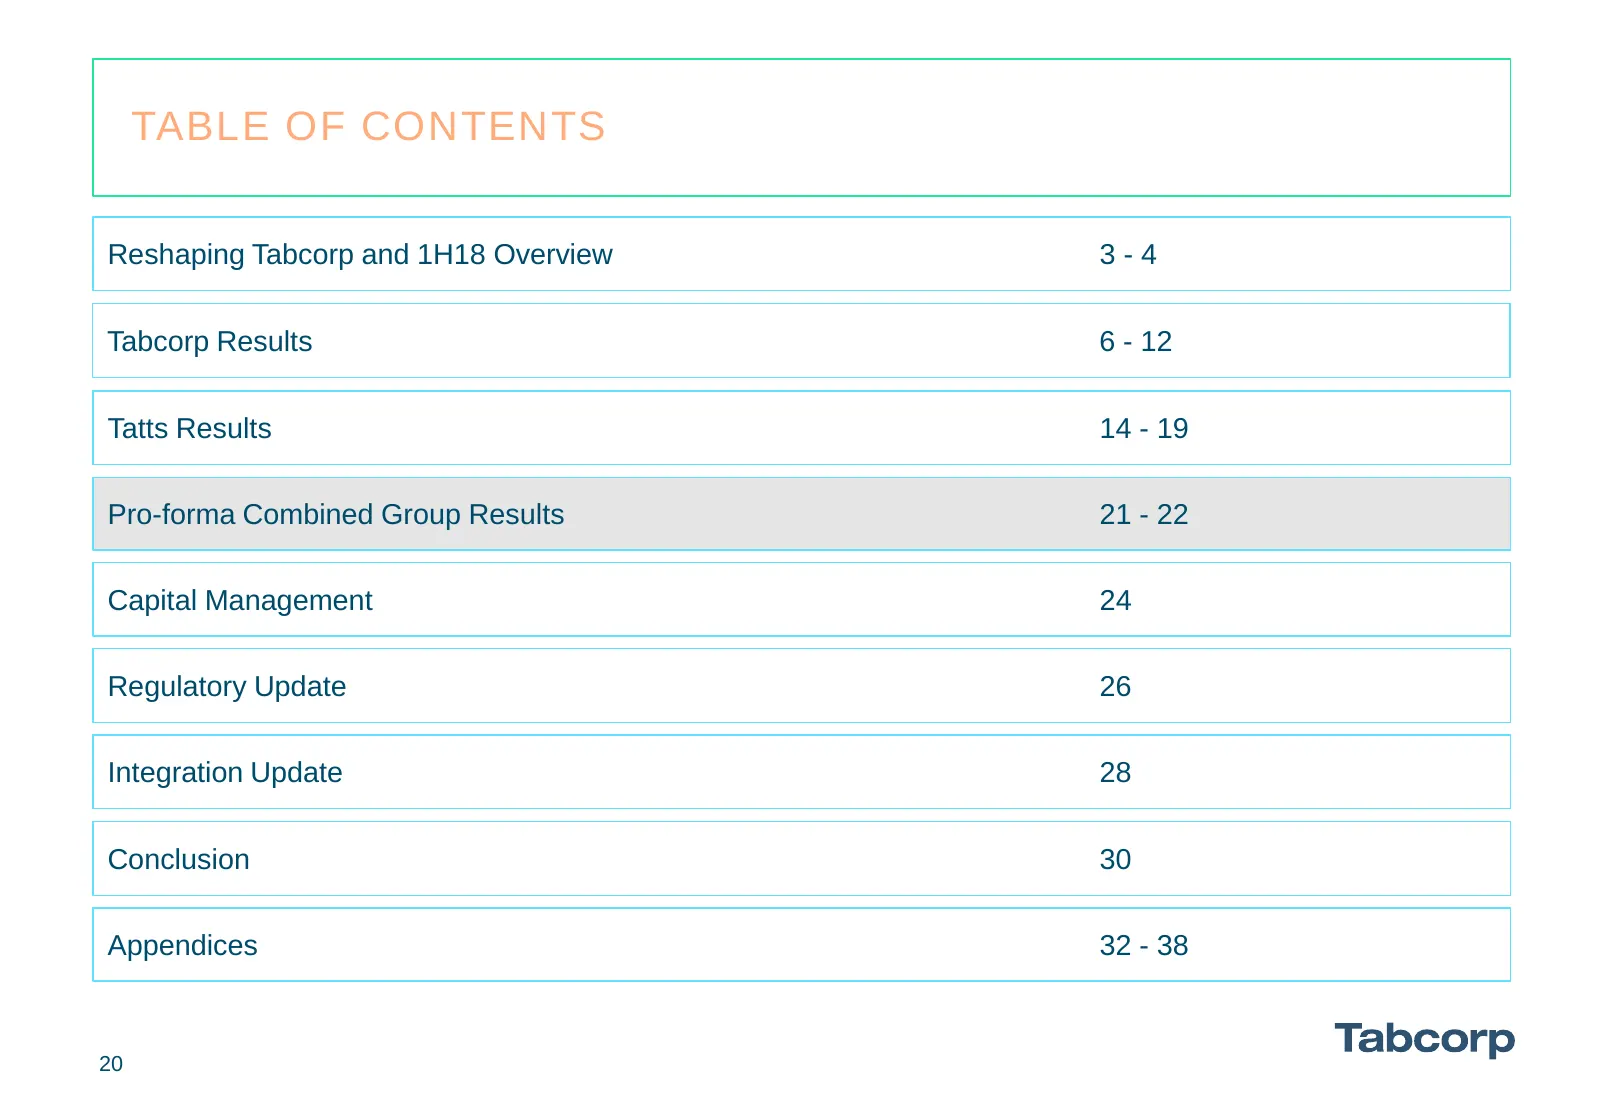
TABLE OF CONTENTS Reshaping Tabcorp and 1H18 Overview 3-4 Tabcorp Results 6 - 12 Tatts Results 14 - 19 Pro-forma Combined Group Results 21 - 22 Capital Management 24 Regulatory Update 26 Integration Update 28 Conclusion 30 Appendices 32 - 38 20
Slide 21: 1H18 Overview – Pro-forma Combined Group
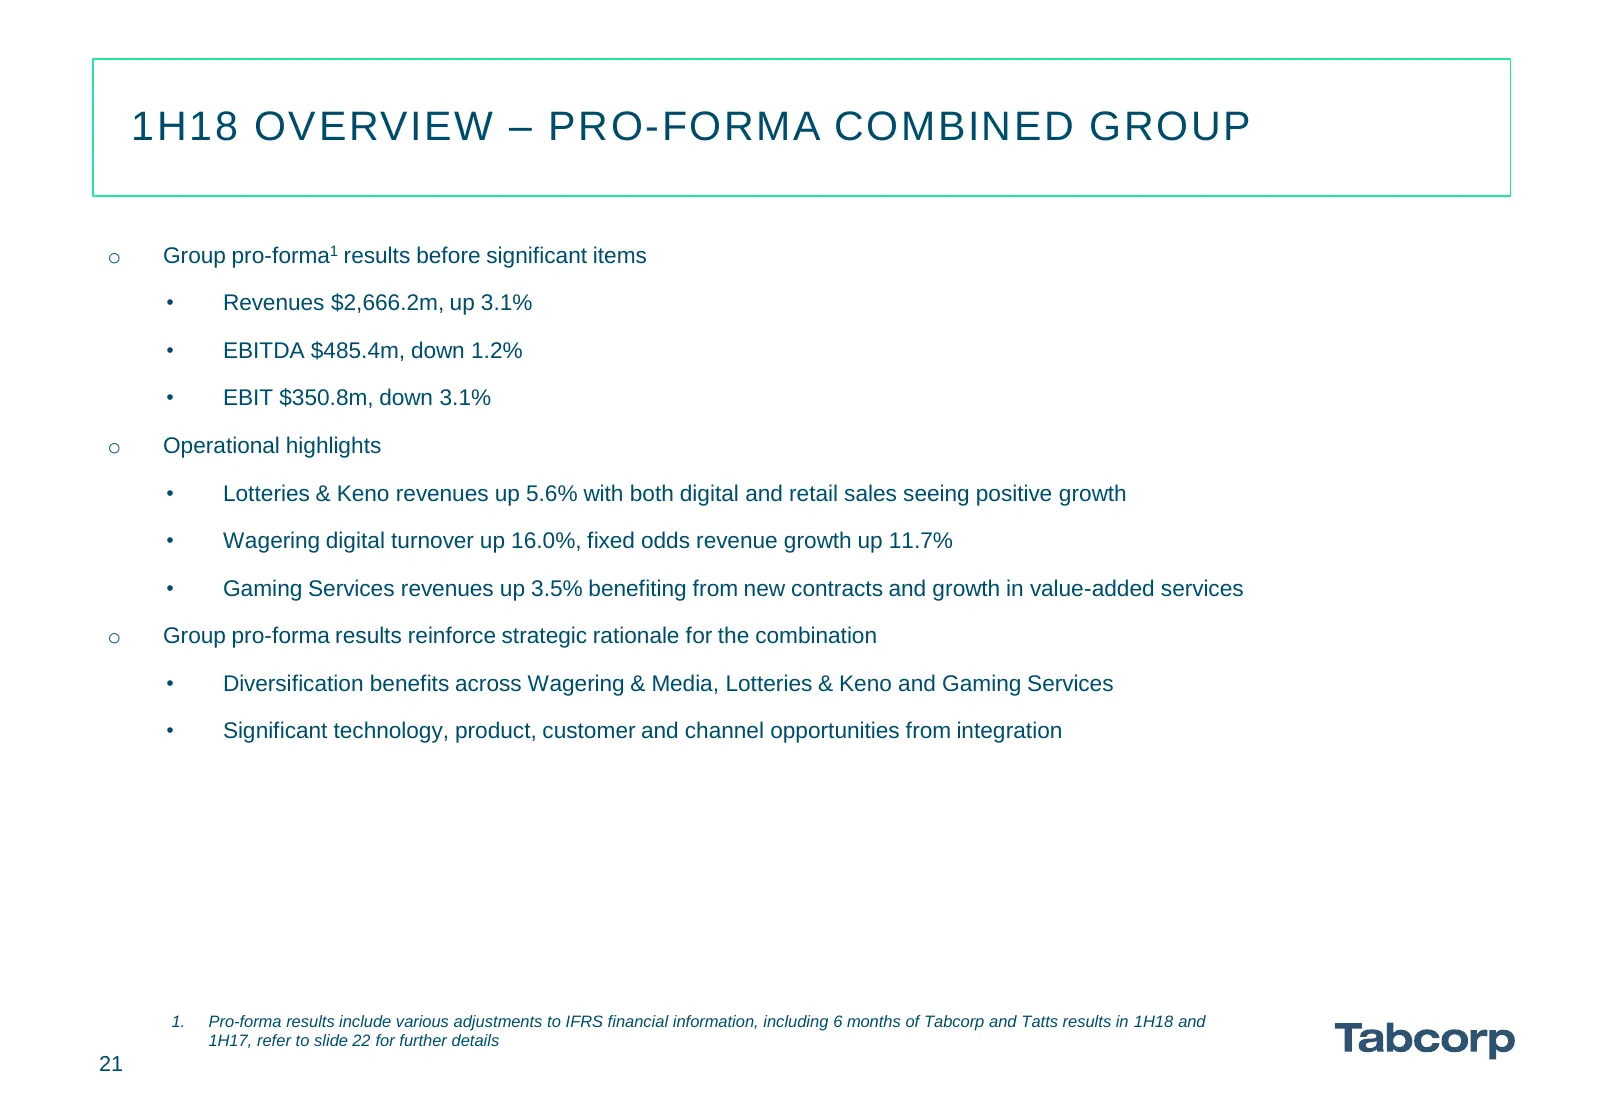
1H18 OVERVIEW – PRO-FORMA COMBINED GROUP o Group pro-forma1 results before significant items • Revenues $2,666.2m, up 3.1% • EBITDA $485.4m, down 1.2% • EBIT $350.8m, down 3.1% o Operational highlights • Lotteries & Keno revenues up 5.6% with both digital and retail sales seeing positive growth • Wa
Slide 22: Pro-forma Combined Group Business Results
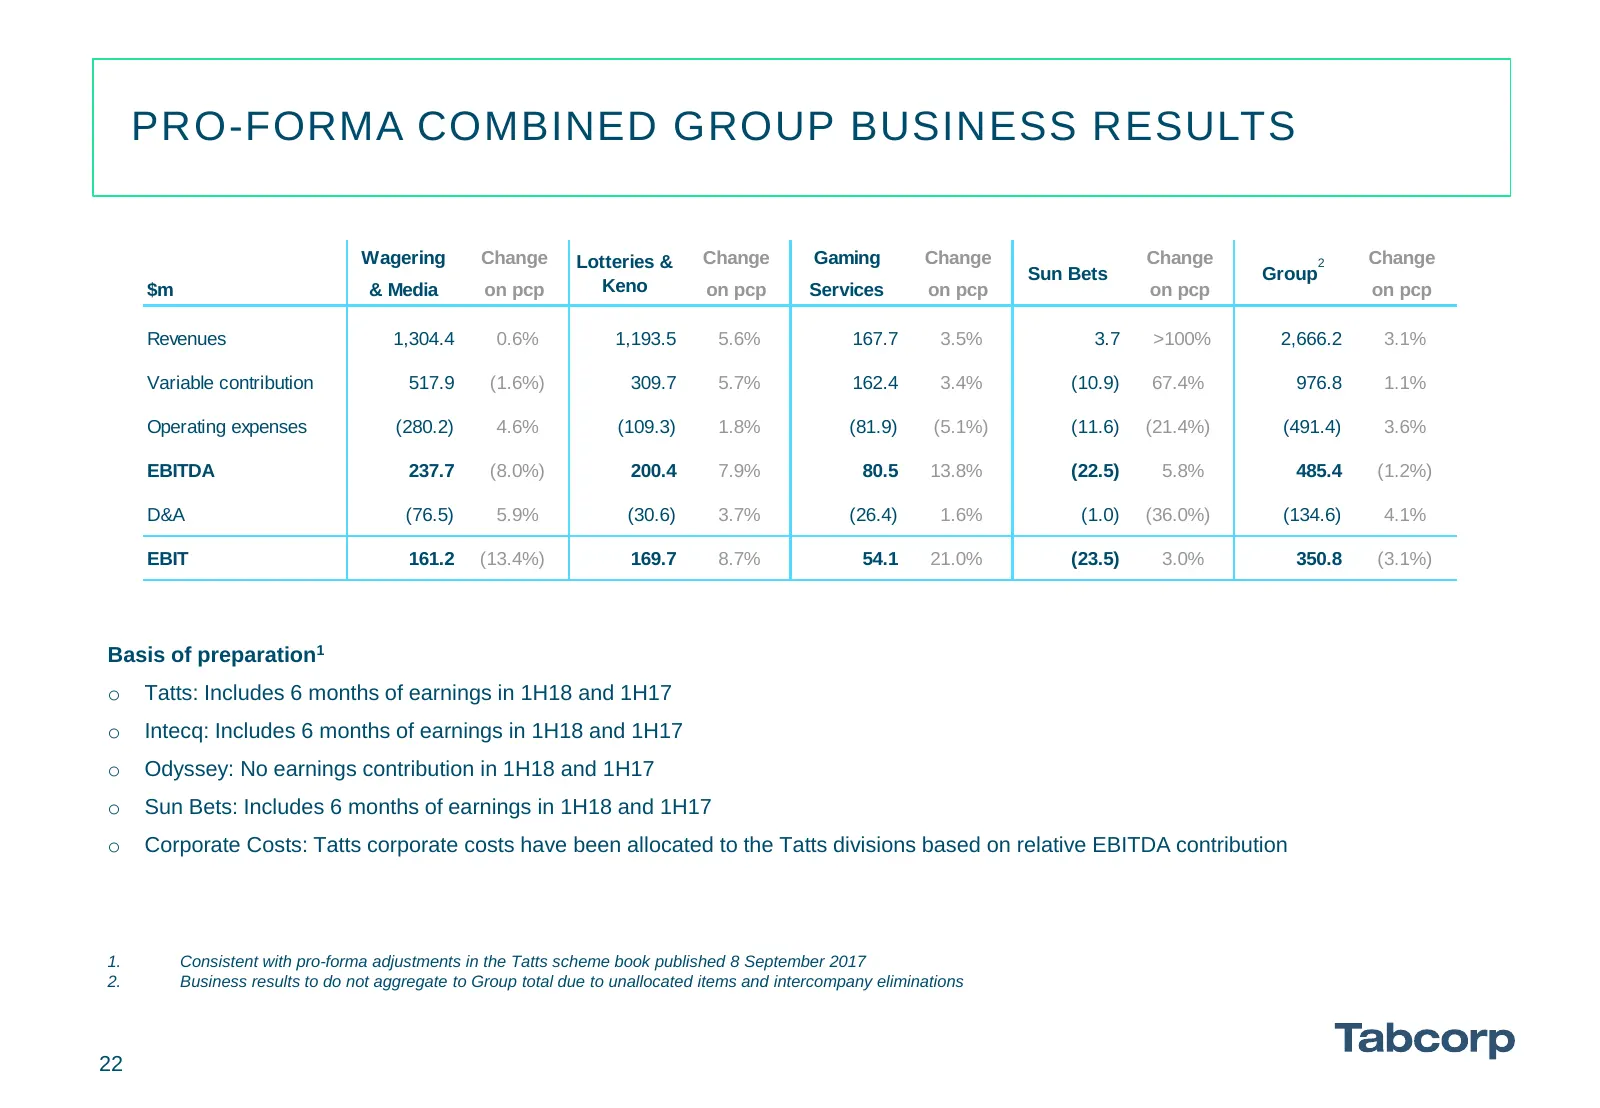
PRO-FORMA COMBINED GROUP BUSINESS RESULTS Wagering Change Lotteries & Change Gaming Change Change 2 Change Sun Bets Group $m & Media on pcp Keno on pcp Services on pcp on pcp on pcp Revenues 1,304.4 0.6% 1,193.5 5.6% 167.7 3.5% 3.7 >100% 2,666.2 3.1% Variable contribution 517.9 (1.6%) 309.7 5.7% 162
Slide 23: Table of Contents
TABLE OF CONTENTS Reshaping Tabcorp and 1H18 Overview 3-4 Tabcorp Results 6 - 12 Tatts Results 14 - 19 Pro-forma Combined Group Results 21 - 22 Capital Management 24 Regulatory Update 26 Integration Update 28 Conclusion 30 Appendices 32 - 38 23
Slide 24: Capital Management
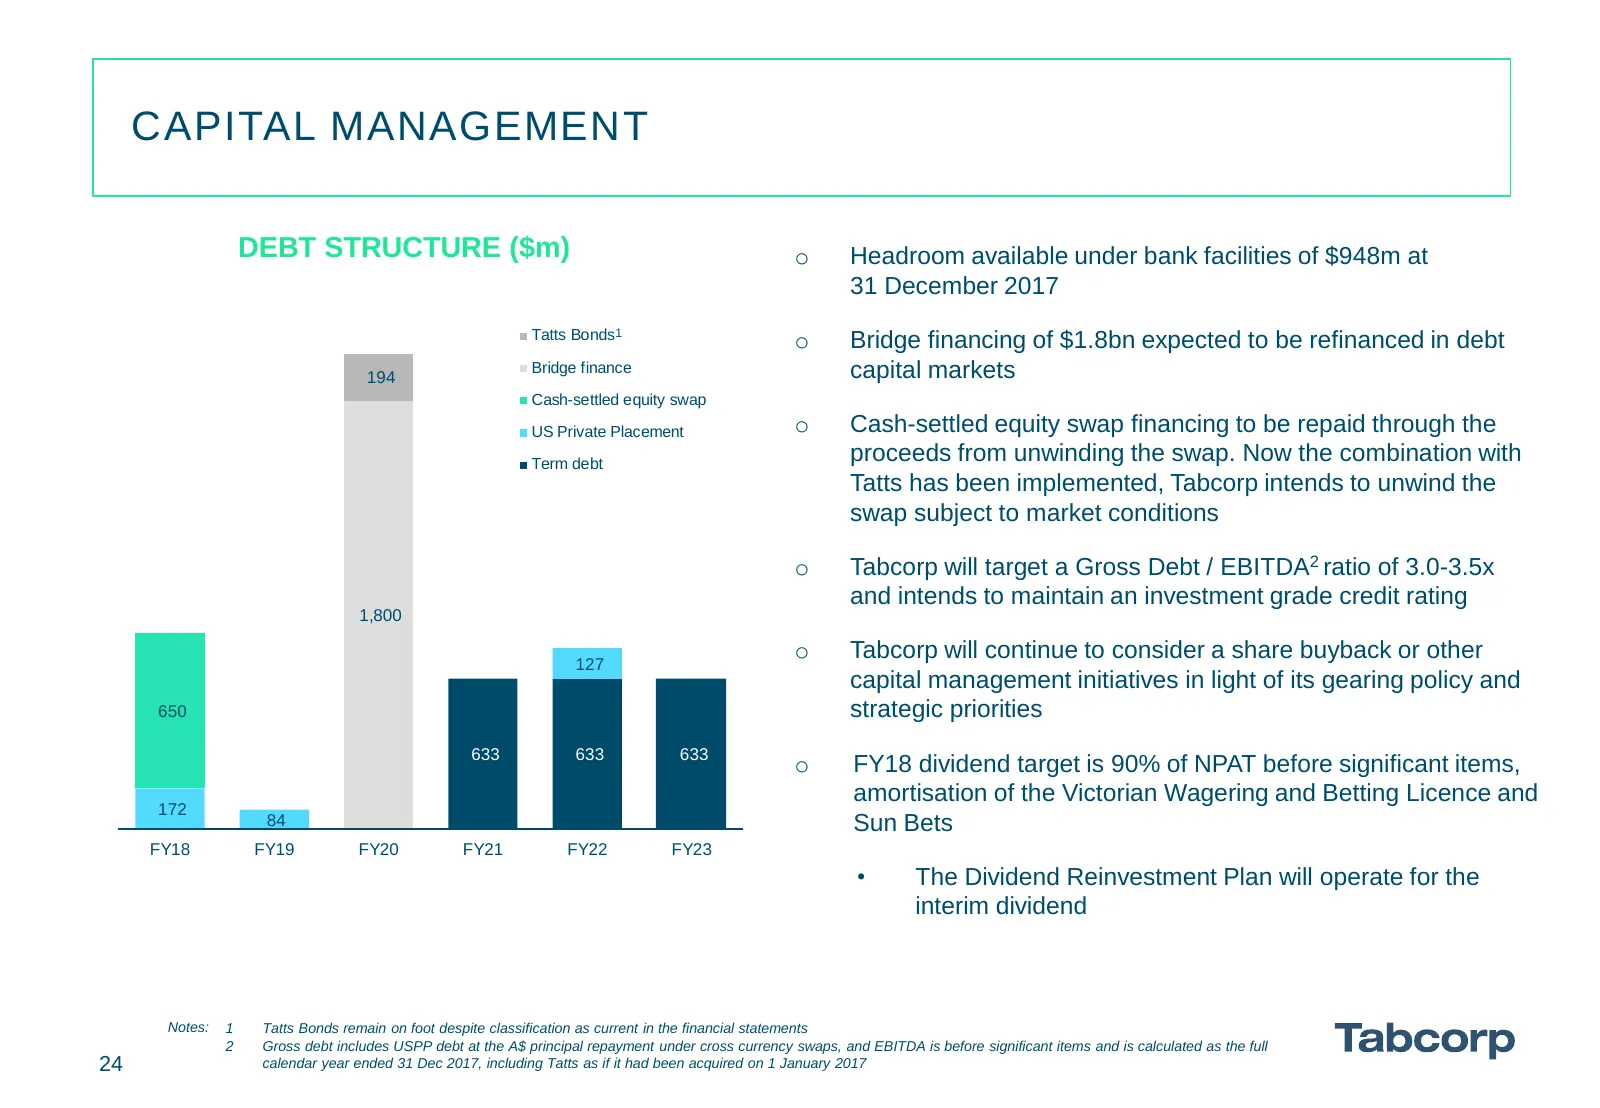
CAPITAL MANAGEMENT DEBT STRUCTURE ($m) o Headroom available under bank facilities of $948m at 31 December 2017 Tatts Bonds1 o Bridge financing of $1.8bn expected to be refinanced in debt 194 Bridge finance capital markets Cash-settled equity swap US Private Placement o Cash-settled equity swap finan
Slide 25: Table of Contents
TABLE OF CONTENTS Reshaping Tabcorp and 1H18 Overview 3-4 Tabcorp Results 6 - 12 Tatts Results 14 - 19 Pro-forma Combined Group Results 21 - 22 Capital Management 24 Regulatory Update 26 Integration Update 28 Conclusion 30 Appendices 32 - 38 25
Slide 26: Regulatory Update
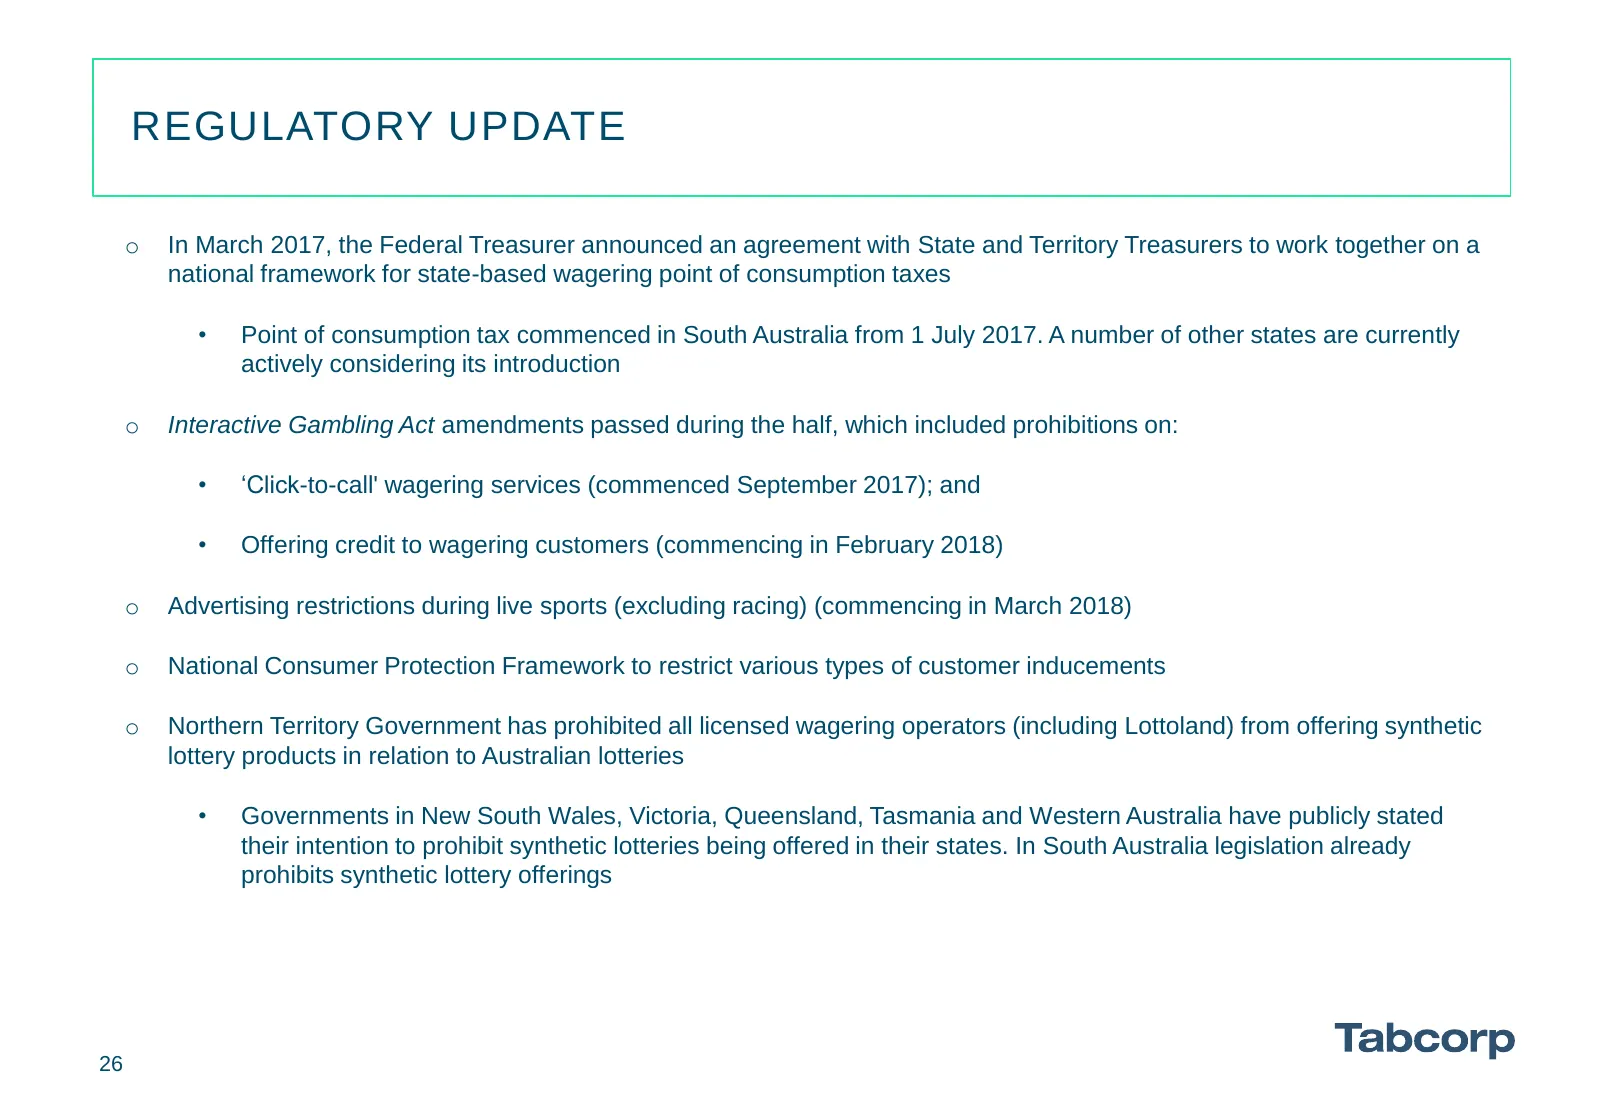
REGULATORY UPDATE o In March 2017, the Federal Treasurer announced an agreement with State and Territory Treasurers to work together on a national framework for state-based wagering point of consumption taxes • Point of consumption tax commenced in South Australia from 1 July 2017. A number of other
Slide 27: Table of Contents
TABLE OF CONTENTS Reshaping Tabcorp and 1H18 Overview 3-4 Tabcorp Results 6 - 12 Tatts Results 14 - 19 Pro-forma Combined Group Results 21 - 22 Capital Management 24 Regulatory Update 26 Integration Update 28 Conclusion 30 Appendices 32 - 38 27
Slide 28: Integration Update
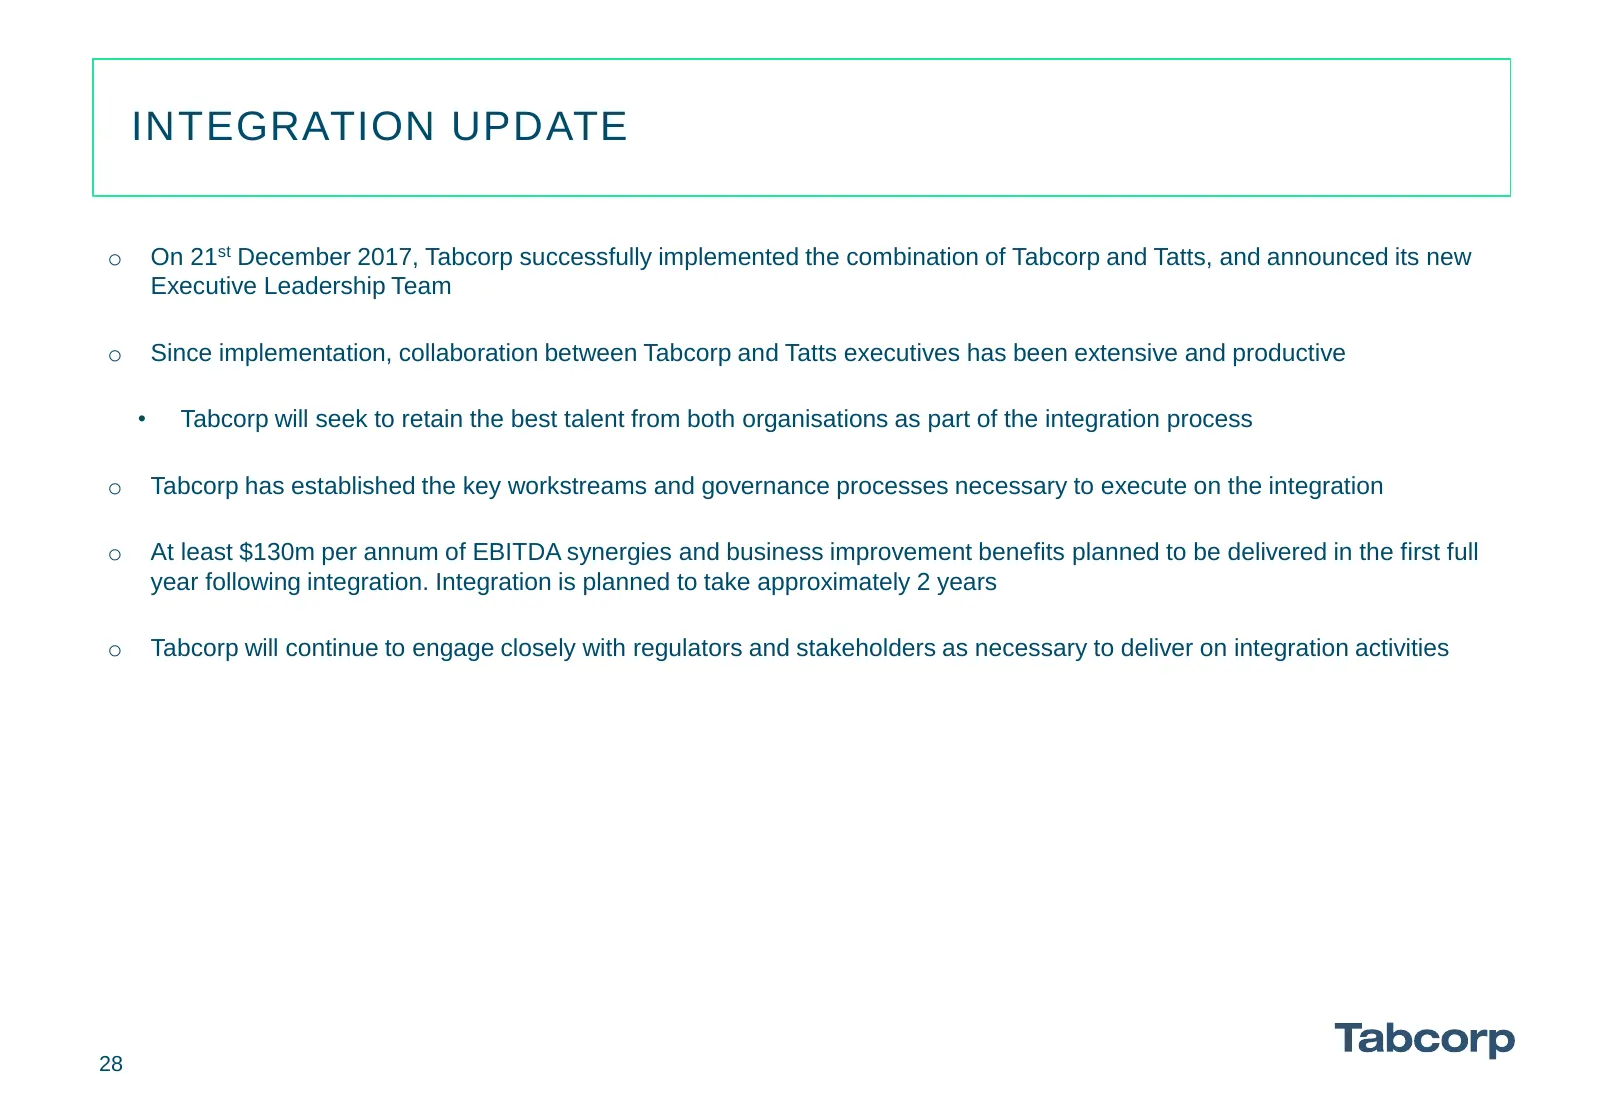
INTEGRATION UPDATE o On 21st December 2017, Tabcorp successfully implemented the combination of Tabcorp and Tatts, and announced its new Executive Leadership Team o Since implementation, collaboration between Tabcorp and Tatts executives has been extensive and productive • Tabcorp will seek to retai
Slide 29: Table of Contents
TABLE OF CONTENTS Reshaping Tabcorp and 1H18 Overview 3-4 Tabcorp Results 6 - 12 Tatts Results 14 - 19 Pro-forma Combined Group Results 21 - 22 Capital Management 24 Regulatory Update 26 Integration Update 28 Conclusion 30 Appendices 32 - 38 29
Slide 30: Conclusion
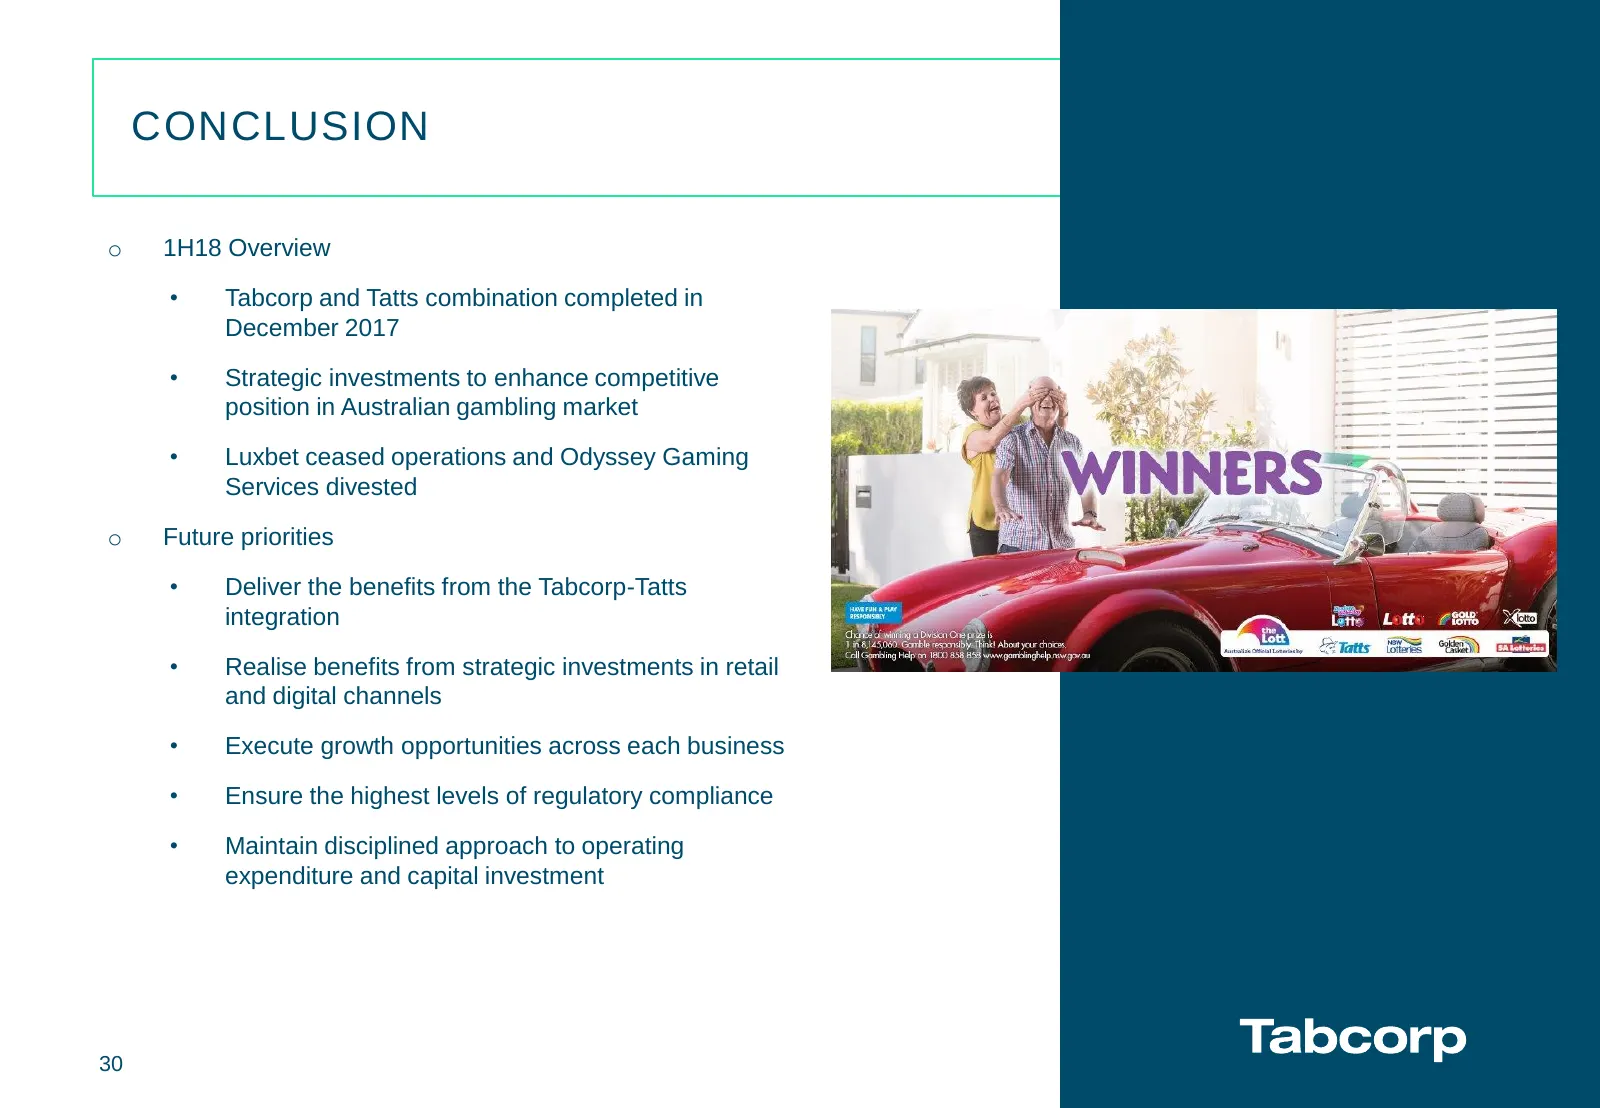
CONCLUSION o 1H18 Overview • Tabcorp and Tatts combination completed in December 2017 • Strategic investments to enhance competitive position in Australian gambling market • Luxbet ceased operations and Odyssey Gaming Services divested o Future priorities • Deliver the benefits from the Tabcorp-Tatt
Slide 31: Table of Contents
TABLE OF CONTENTS Reshaping Tabcorp and 1H18 Overview 3-4 Tabcorp Results 6 - 12 Tatts Results 14 - 19 Pro-forma Combined Group Results 21 - 22 Capital Management 24 Regulatory Update 26 Integration Update 28 Conclusion 30 Appendices 32 - 38 31
Slide 32: Appendices
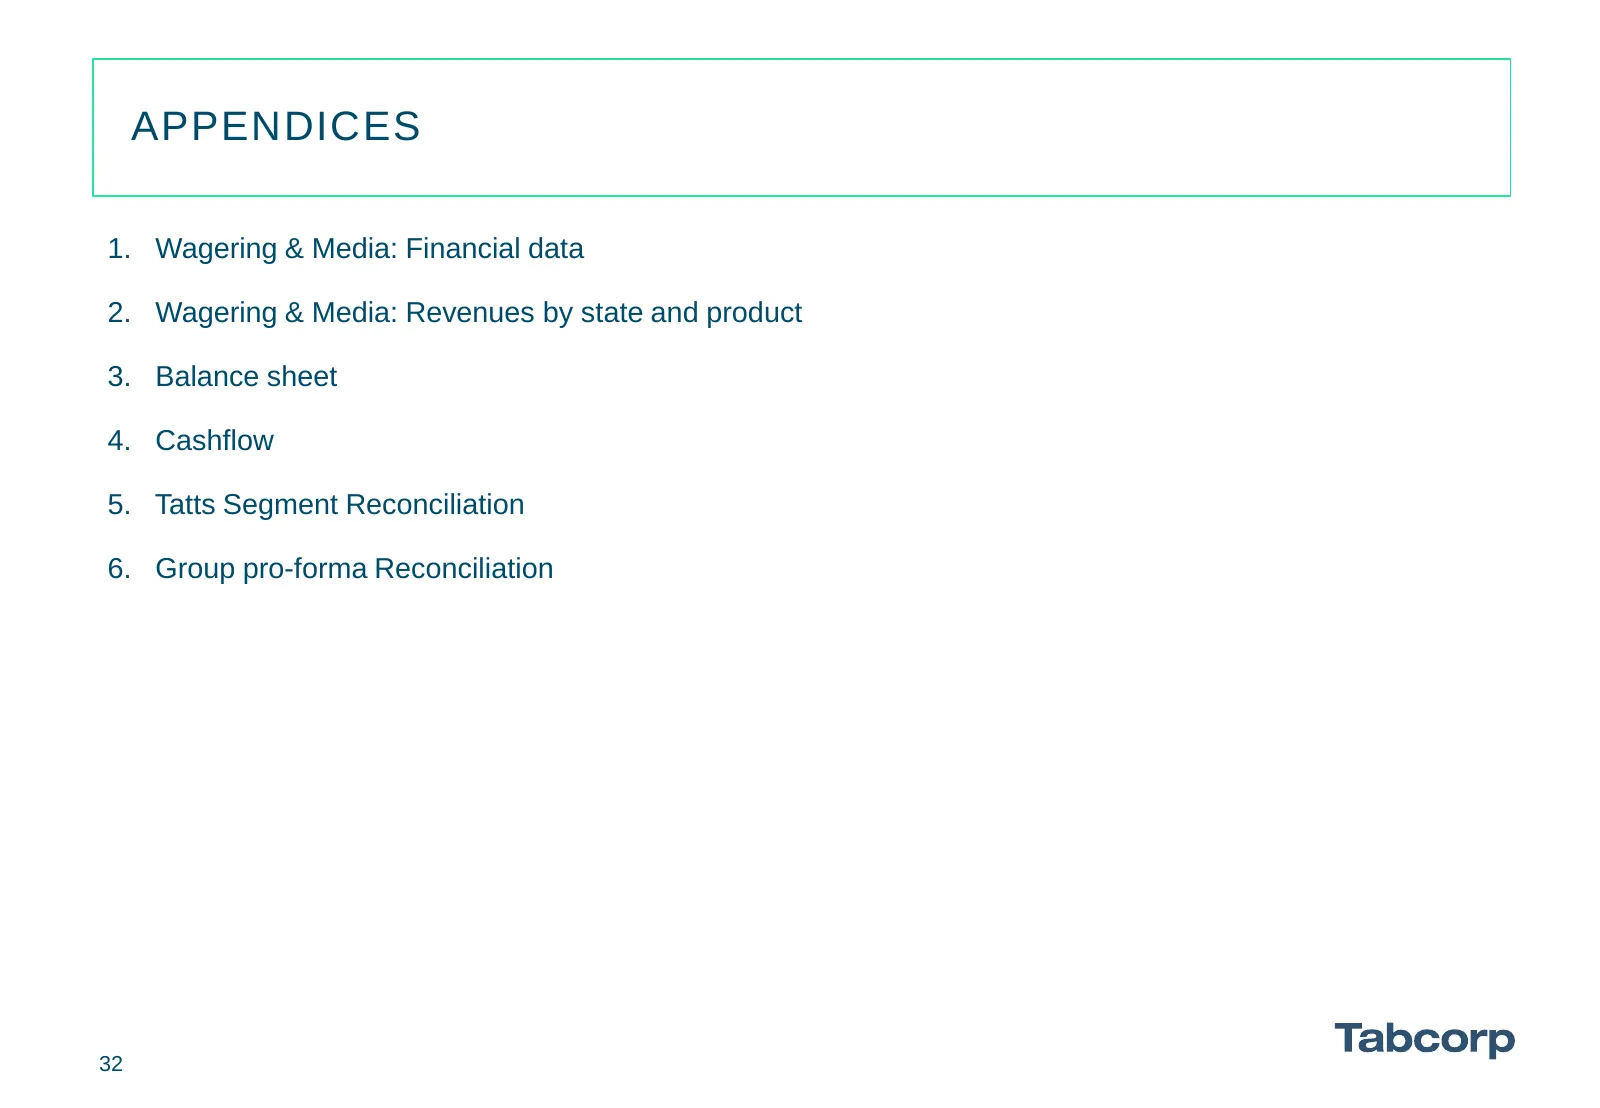
APPENDICES 1. Wagering & Media: Financial data 2. Wagering & Media: Revenues by state and product 3. Balance sheet 4. Cashflow 5. Tatts Segment Reconciliation 6. Group pro-forma Reconciliation 32
Slide 33: Wagering & Media: Financial Data
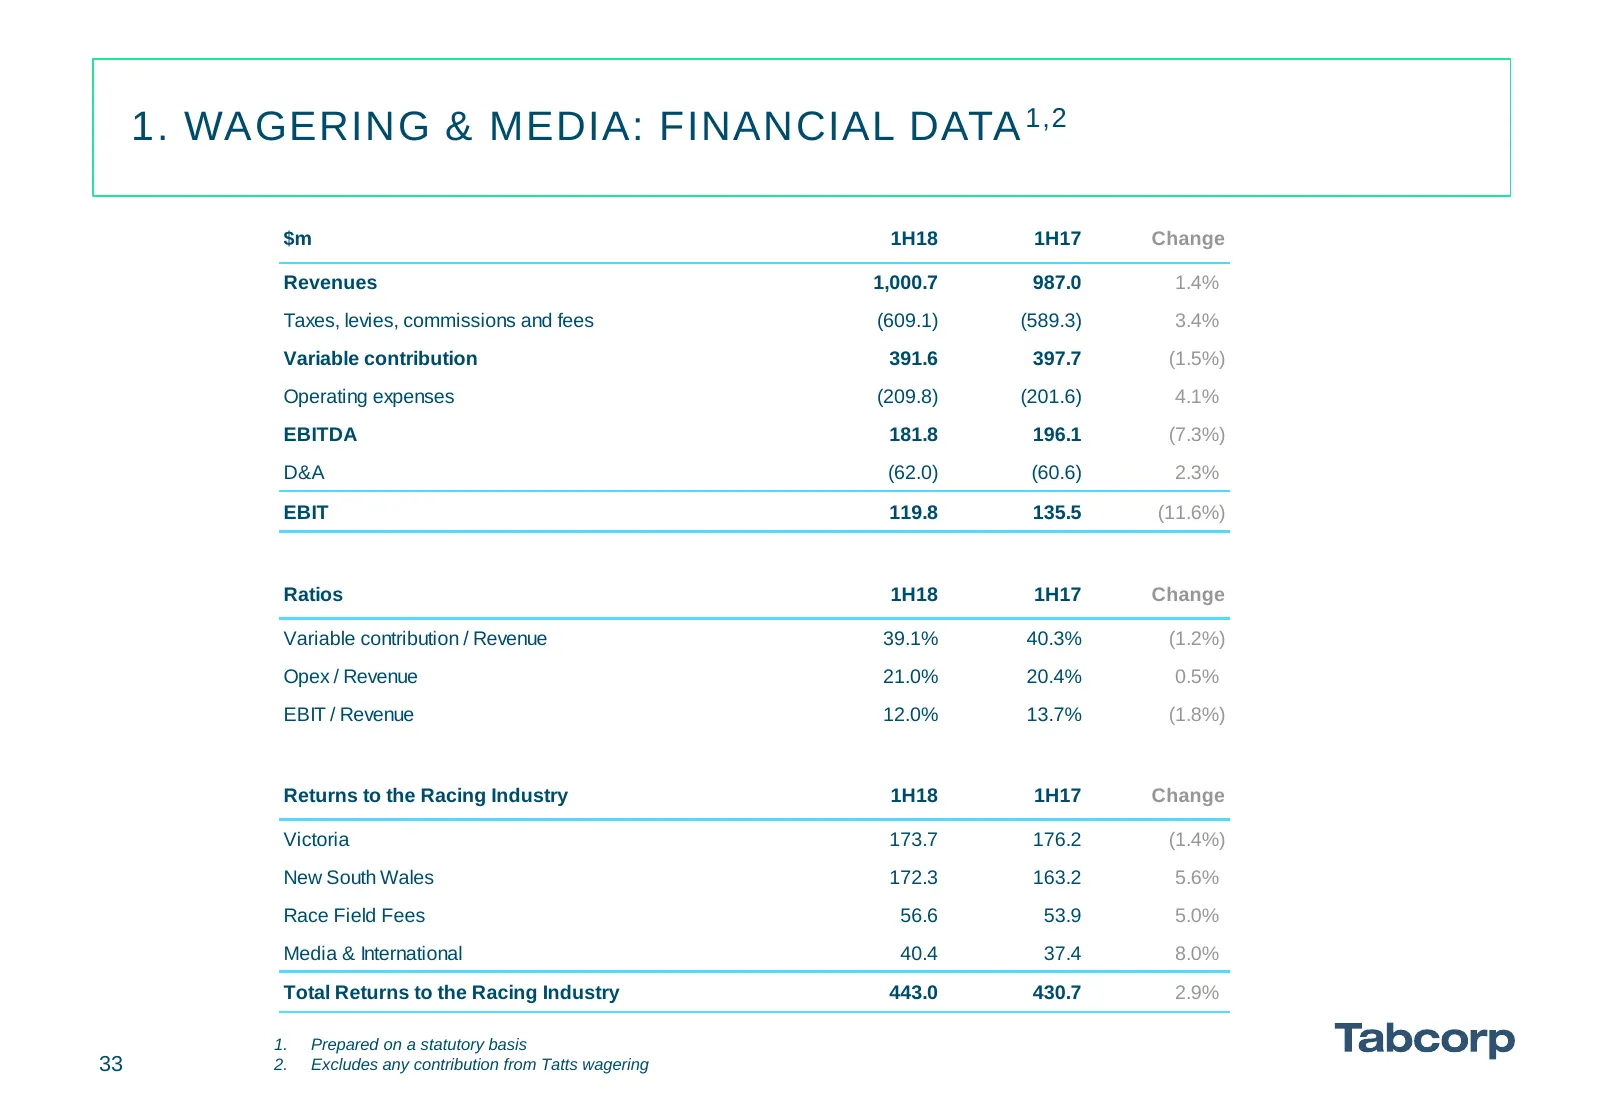
1. WAGERING & MEDIA: FINANCIAL DATA 1,2 $m 1H18 1H17 Change Revenues 1,000.7 987.0 1.4% Taxes, levies, commissions and fees (609.1) (589.3) 3.4% Variable contribution 391.6 397.7 (1.5%) Operating expenses (209.8) (201.6) 4.1% EBITDA 181.8 196.1 (7.3%) D&A (62.0) (60.6) 2.3% EBIT 119.8 135.5 (11.6%)
Slide 34: Wagering & Media: Revenues by State and Product
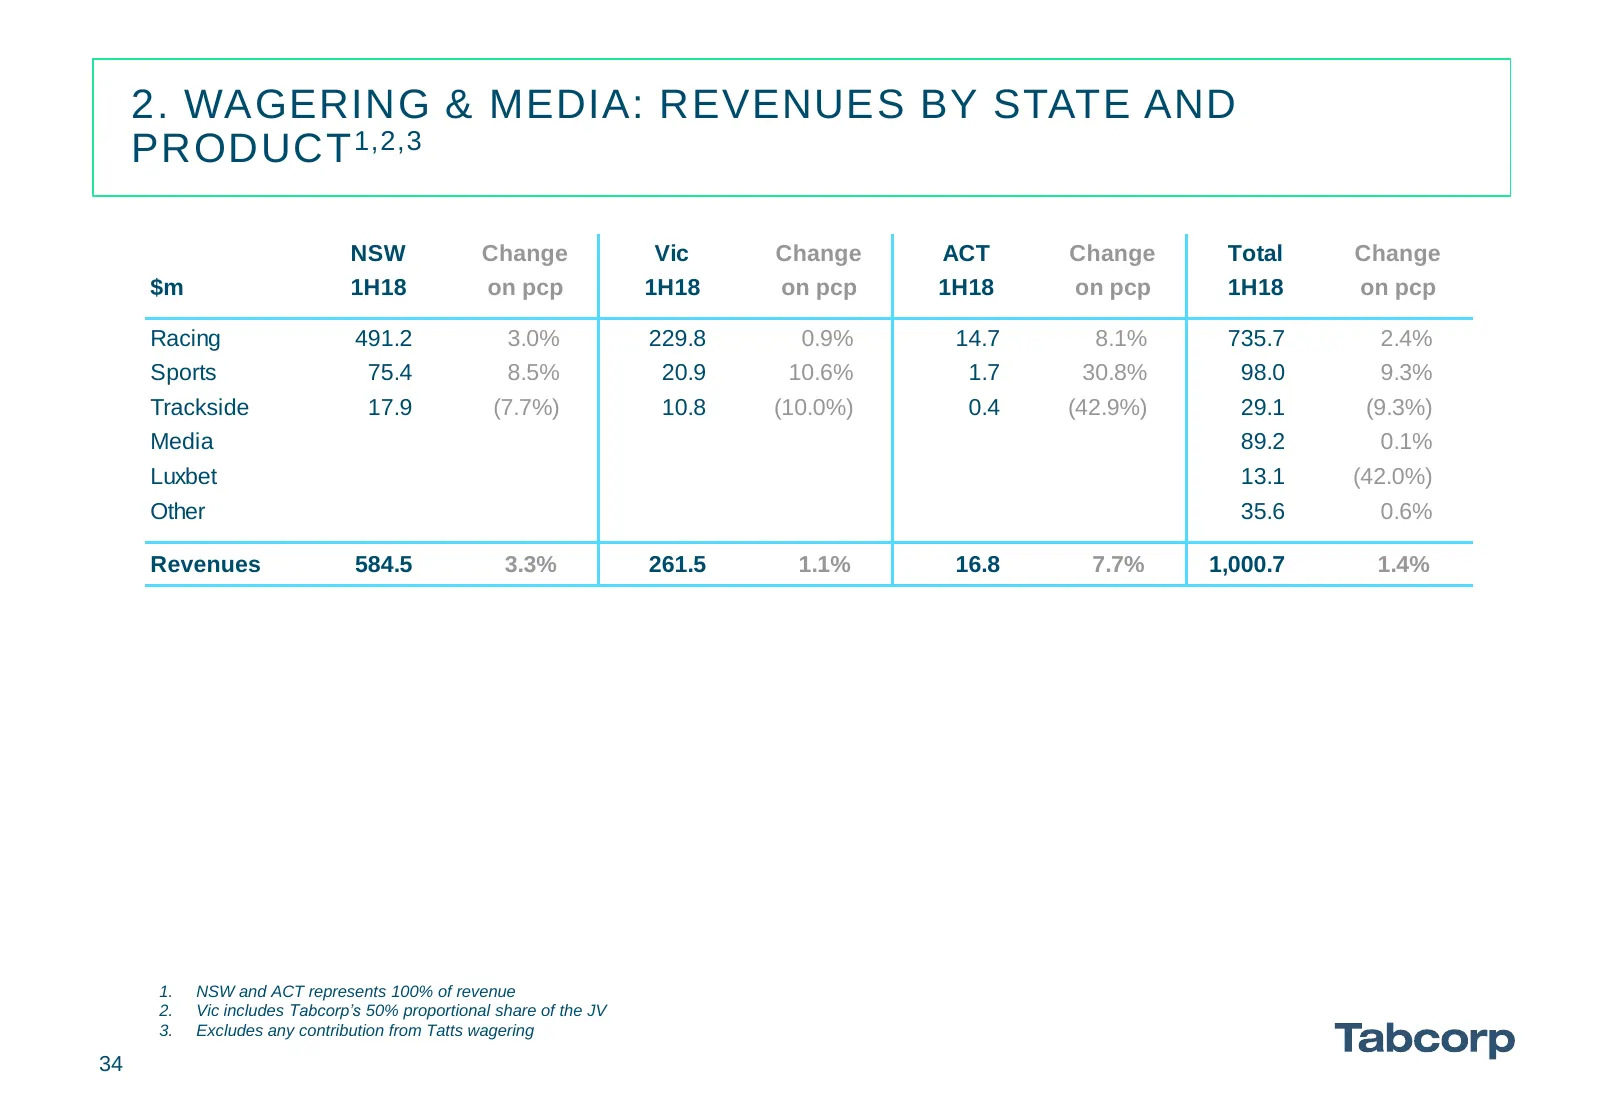
2. WAGERING & MEDIA: REVENUES BY STATE AND PRODUCT 1,2,3 NSW Change Vic Change ACT Change Total Change $m 1H18 on pcp 1H18 on pcp 1H18 on pcp 1H18 on pcp Racing 491.2 3.0% 229.8 0.9% 14.7 8.1% 735.7 2.4% Sports 75.4 8.5% 20.9 10.6% 1.7 30.8% 98.0 9.3% Trackside 17.9 (7.7%) 10.8 (10.0%) 0.4 (42.9%) 2
Slide 35: Balance Sheet
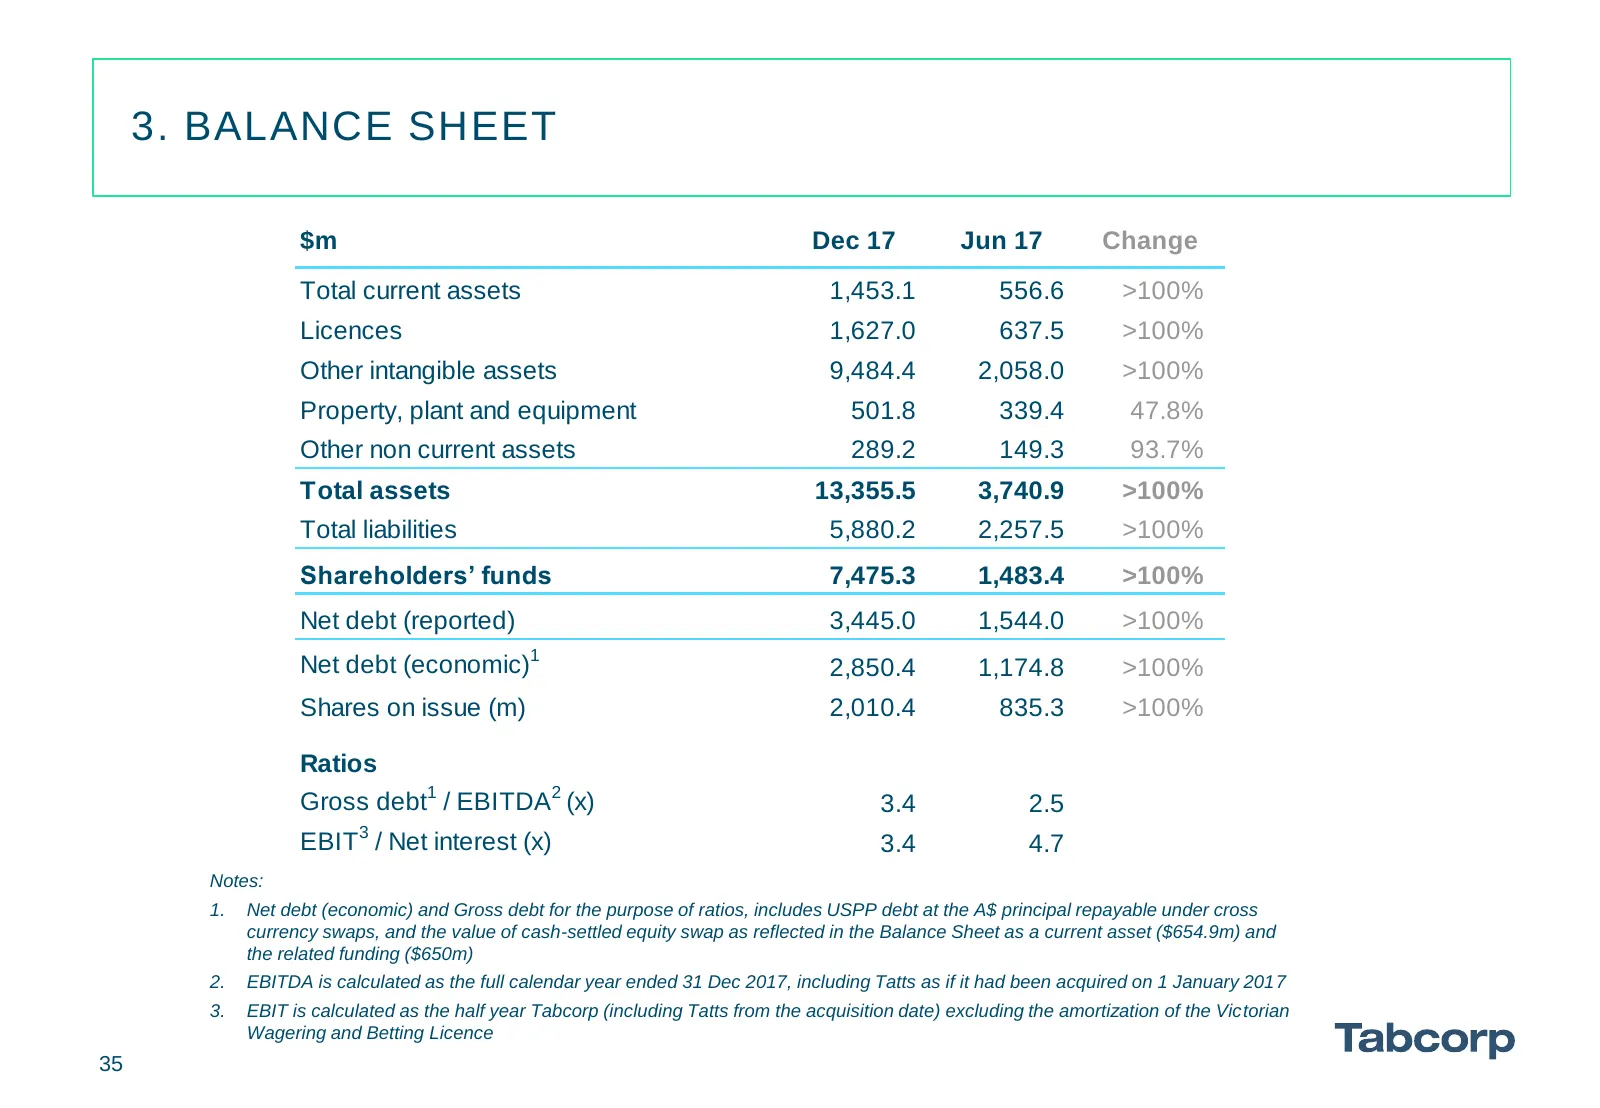
3. BALANCE SHEET $m Dec 17 Jun 17 Change Total current assets 1,453.1 556.6 >100% Licences 1,627.0 637.5 >100% Other intangible assets 9,484.4 2,058.0 >100% Property, plant and equipment 501.8 339.4 47.8% Other non current assets 289.2 149.3 93.7% Total assets 13,355.5 3,740.9 >100% Total liabilitie
Slide 36: Cashflow
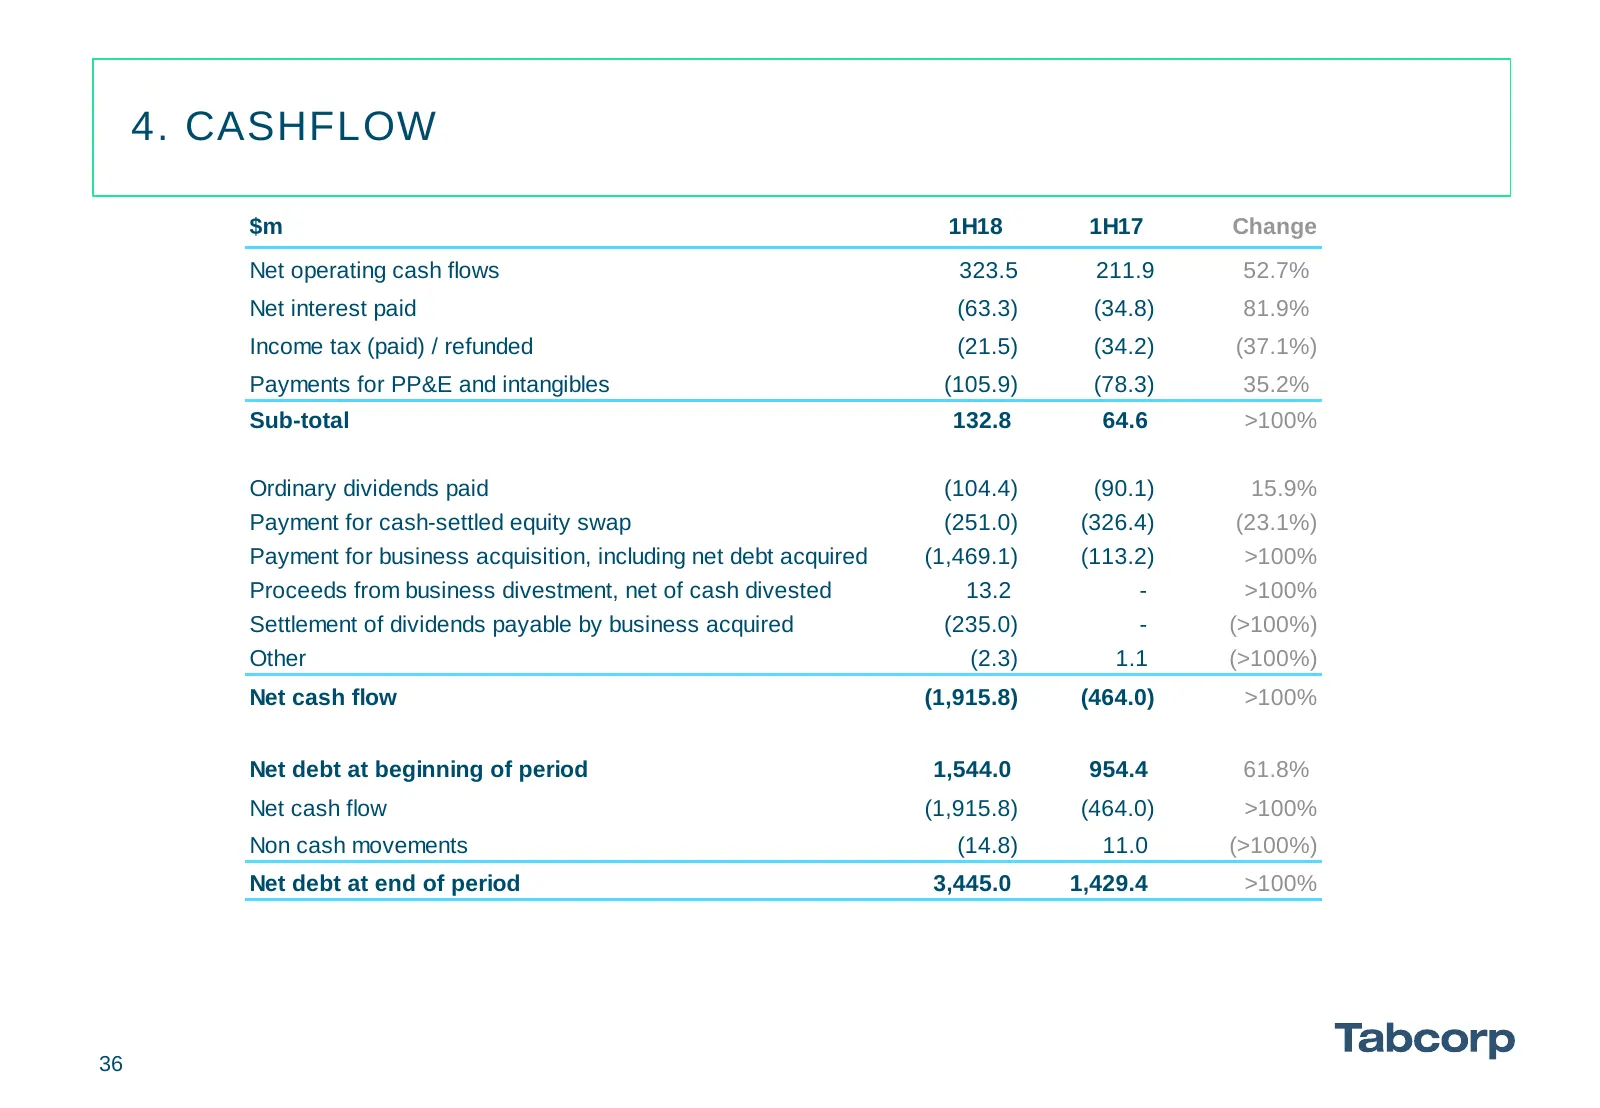
4. CASHFLOW $m 1H18 1H17 Change Net operating cash flows 323.5 211.9 52.7% Net interest paid (63.3) (34.8) 81.9% Income tax (paid) / refunded (21.5) (34.2) (37.1%) Payments for PP&E and intangibles (105.9) (78.3) 35.2% Sub-total 132.8 64.6 >100% Ordinary dividends paid (104.4) (90.1) 15.9% Payment f
Slide 37: Tatts Segment Reconciliation
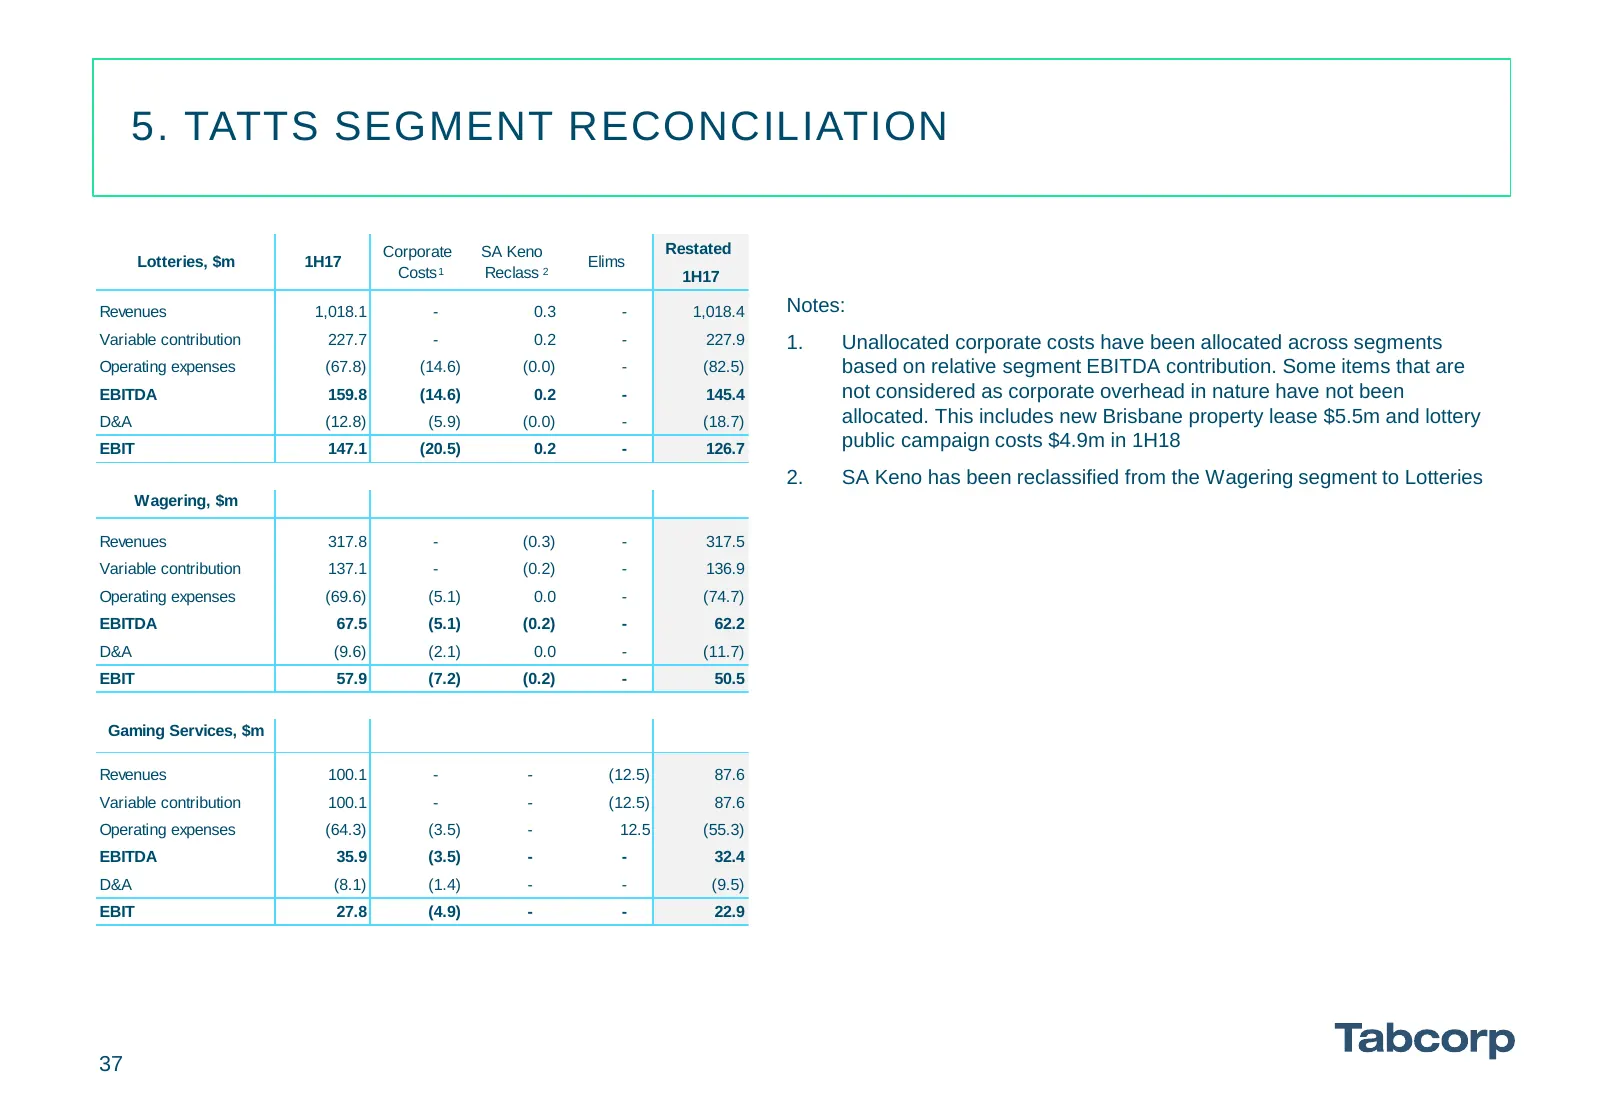
5. TATTS SEGMENT RECONCILIATION Corporate SA Keno Restated Lotteries, $m 1H17 Elims Costs 1 Reclass 2 1H17 Revenues 1,018.1 - 0.3 - 1,018.4 Notes: Variable contribution 227.7 - 0.2 - 227.9 1. Unallocated corporate costs have been allocated across segments Operating expenses (67.8) (14.6) (0.0) - (82
Slide 38: Group Pro-forma Reconciliation
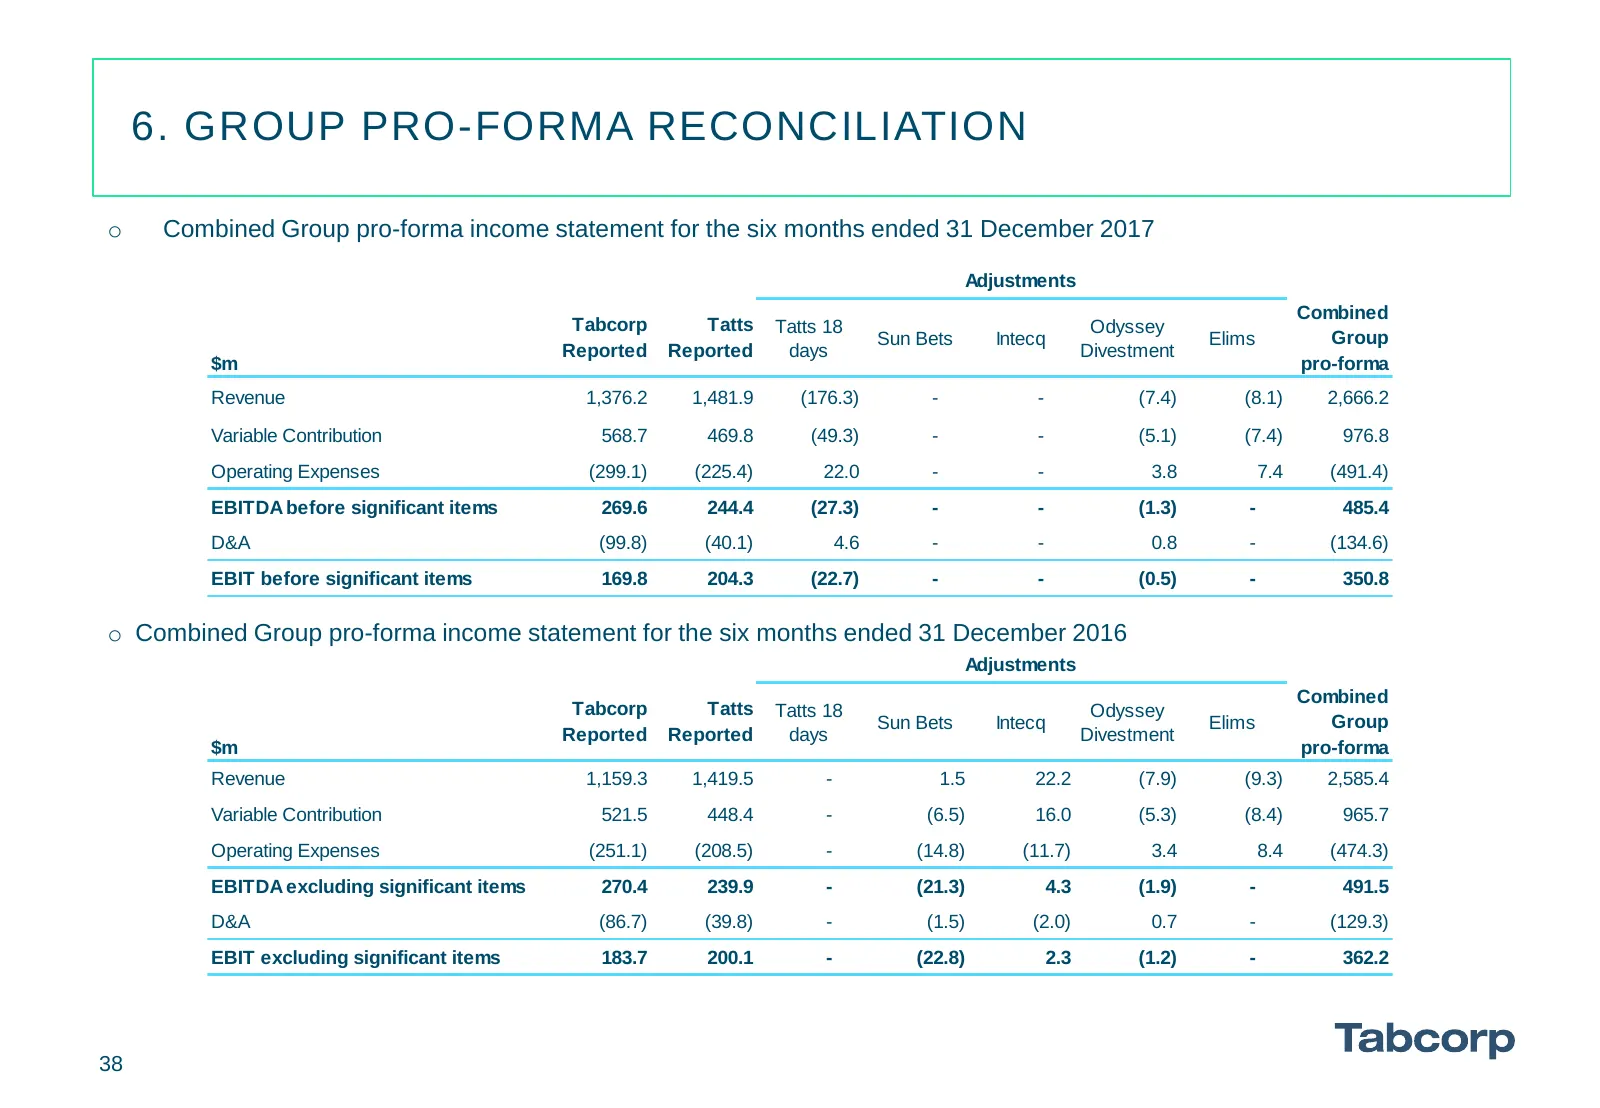
6. GROUP PRO-FORMA RECONCILIATION o Combined Group pro-forma income statement for the six months ended 31 December 2017 Adjustments Combined Tabcorp Tatts Tatts 18 Odyssey Sun Bets Intecq Elims Group Reported Reported days Divestment $m pro-forma Revenue 1,376.2 1,481.9 (176.3) - - (7.4) (8.1) 2,666
Slide 39: Disclaimer
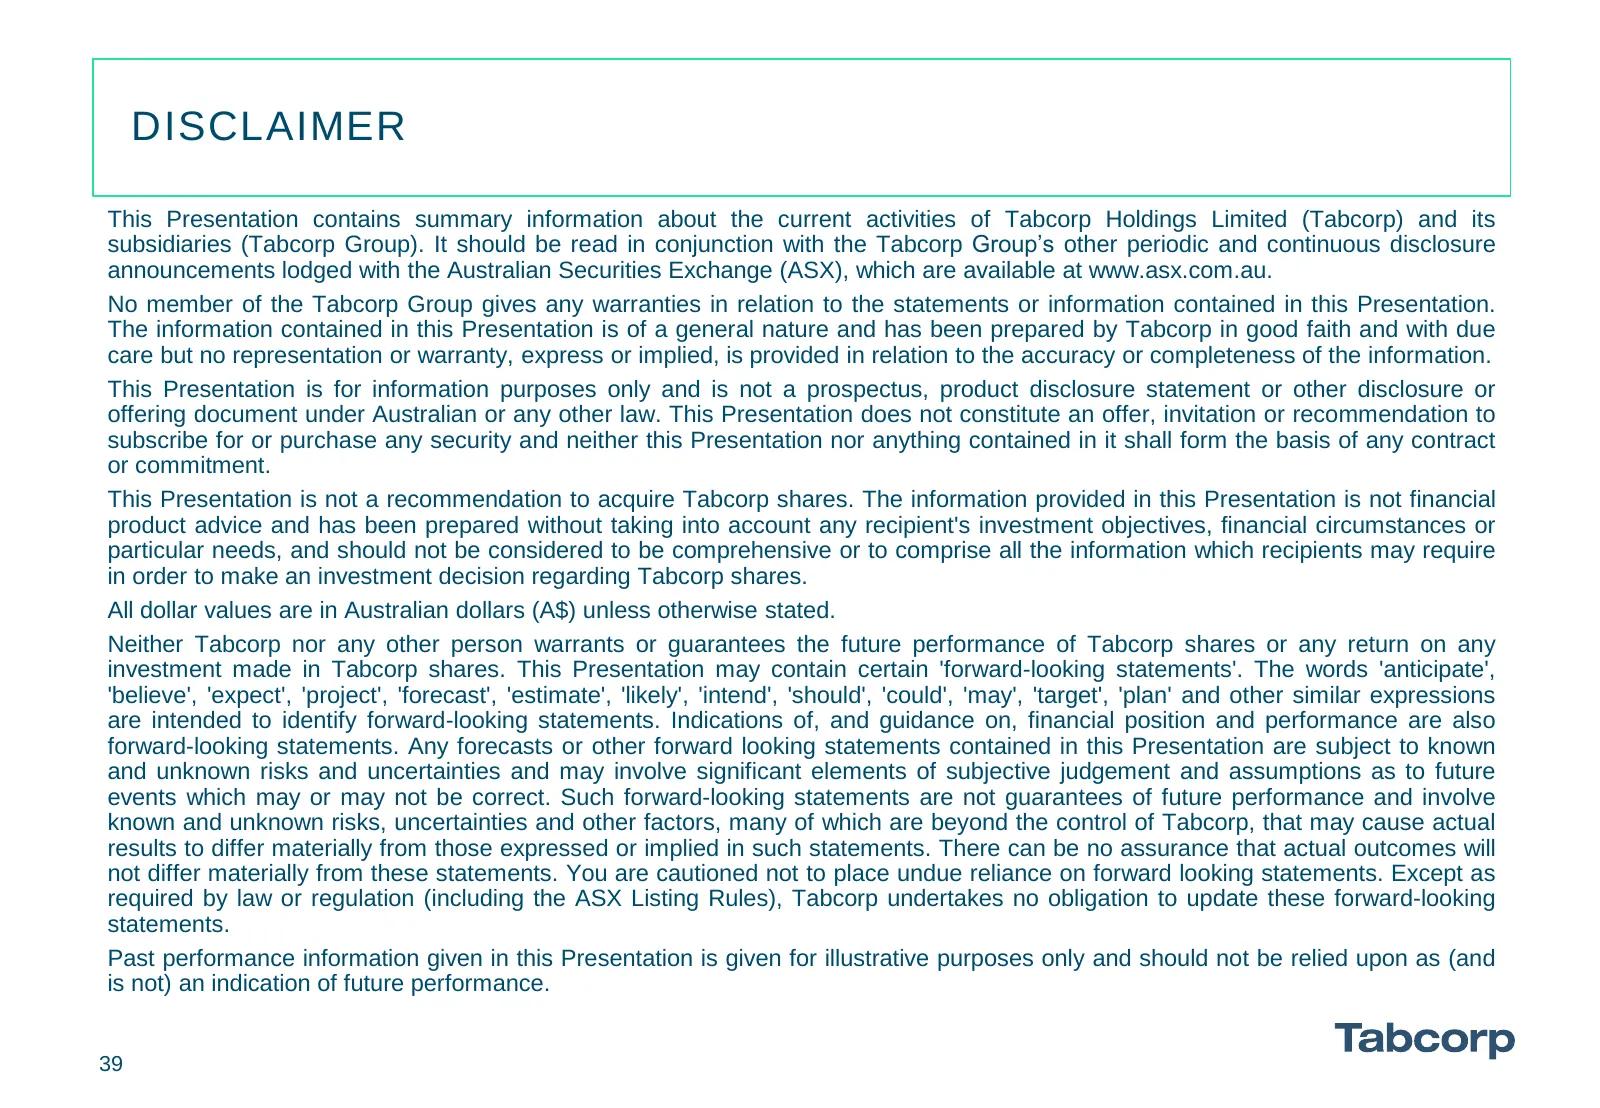
DISCLAIMER This Presentation contains summary information about the current activities of Tabcorp Holdings Limited (Tabcorp) and its subsidiaries (Tabcorp Group). It should be read in conjunction with the Tabcorp Group’s other periodic and continuous disclosure announcements lodged with the Australi
Slide 40: To Advance the Way We Play
TO ADVANCE THE WAY WE PLAY Tabcorp
Source: Internet Archive copy of tabcorp.com.au
More decks from Tabcorp Holdings Limited
 FY2026 Earnings Presentation40 slides · Aug 26, 2026
 FY2026 Earnings Presentation39 slides · Aug 25, 2026
 Investor Presentation (August 2026)16 slides · Aug 10, 2026
 Macquarie Australia Conference 202614 slides · May 5, 2026
 1H26 Earnings Presentation39 slides · Feb 25, 2026
 Shareholder Meeting (October 2025)17 slides · Oct 20, 2025