Componenta Oyj · OMXHEX:CTH1V
Componenta Oyj — FY2012 Earnings Presentation
46 slides from Componenta Oyj's earnings presentation, Feb 28, 2013

Slide 1: Casting Future Solutions
Casting Future SOLUTIONS COMPONENTA
Slide 2: Componenta Corporation Financial Statements 1 January - 31 December 2012
Componenta Corporation Financial Statements 1 January - 31 December 2012 Heikki Lehtonen President and CEO 28 February 2013 © Componenta 2
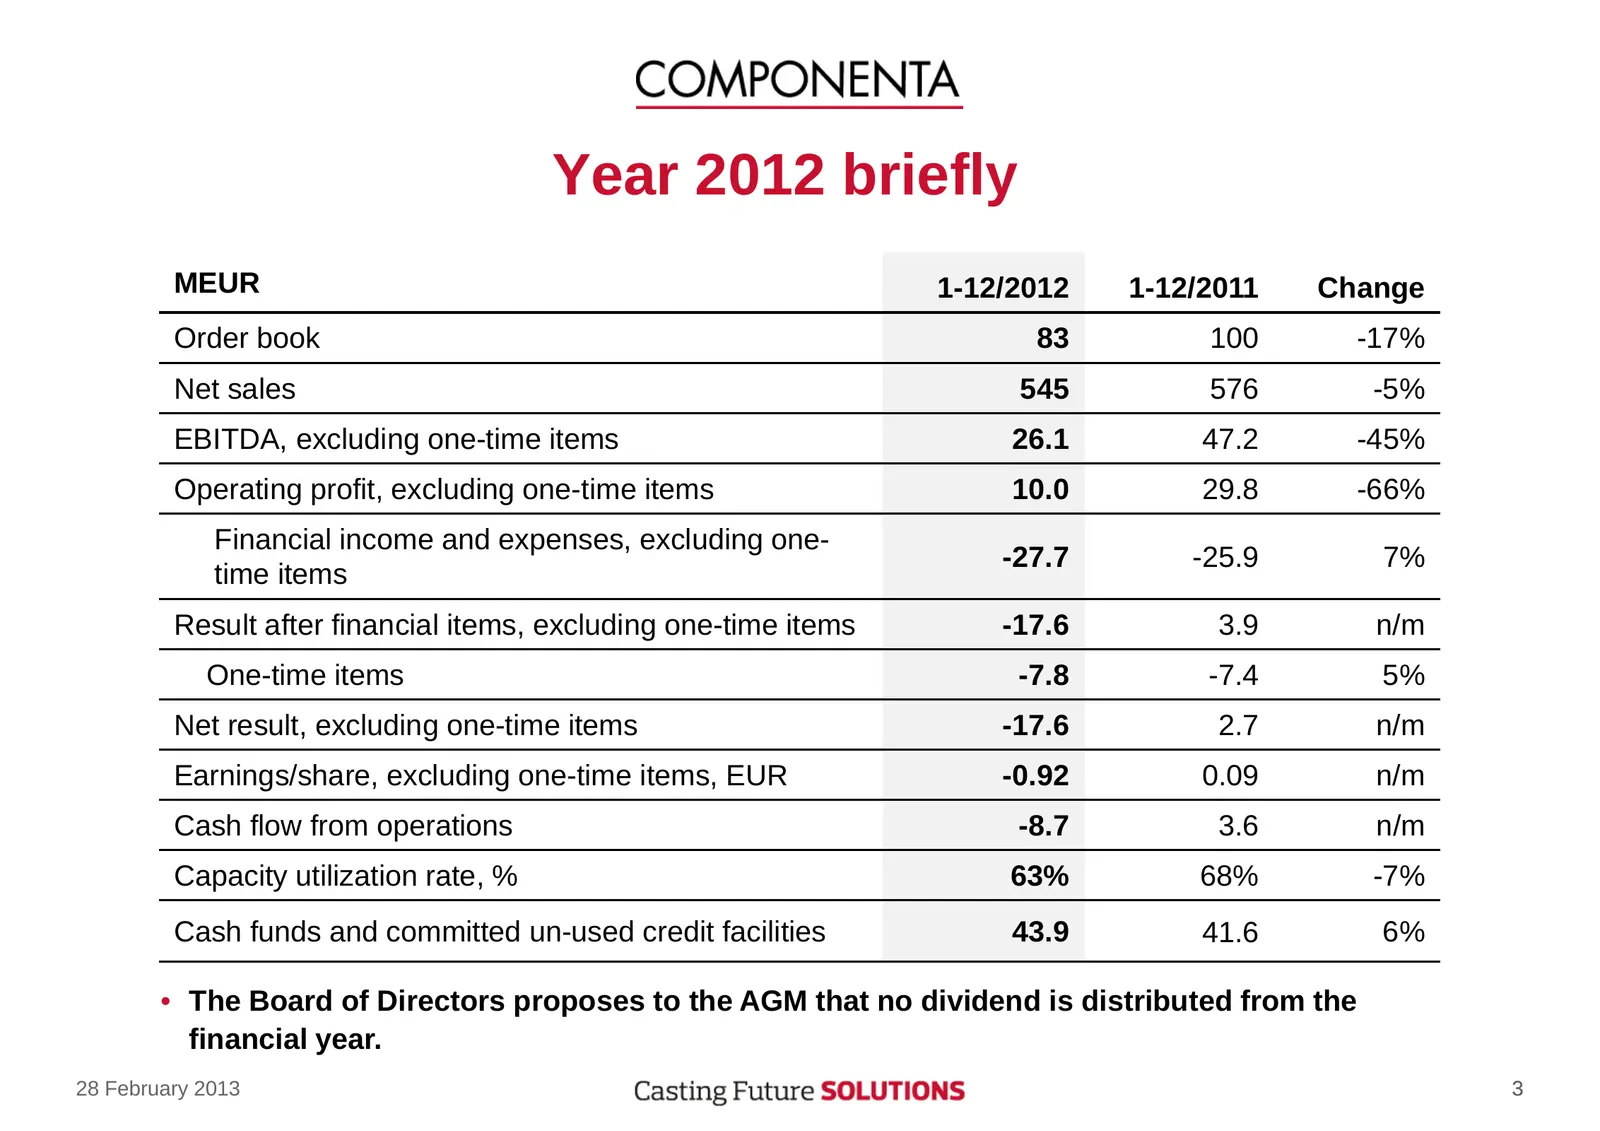
Slide 3: Year 2012 briefly
Year 2012 briefly MEUR 1-12/2012 1-12/2011 Change Order book 83 100 -17% Net sales 545 576 -5% EBITDA, excluding one-time items 26.1 47.2 -45% Operating profit, excluding one-time items 10.0 29.8 -66% Financial income and expenses, excluding one- -27.7 -25.9 7% time items Result after financial item
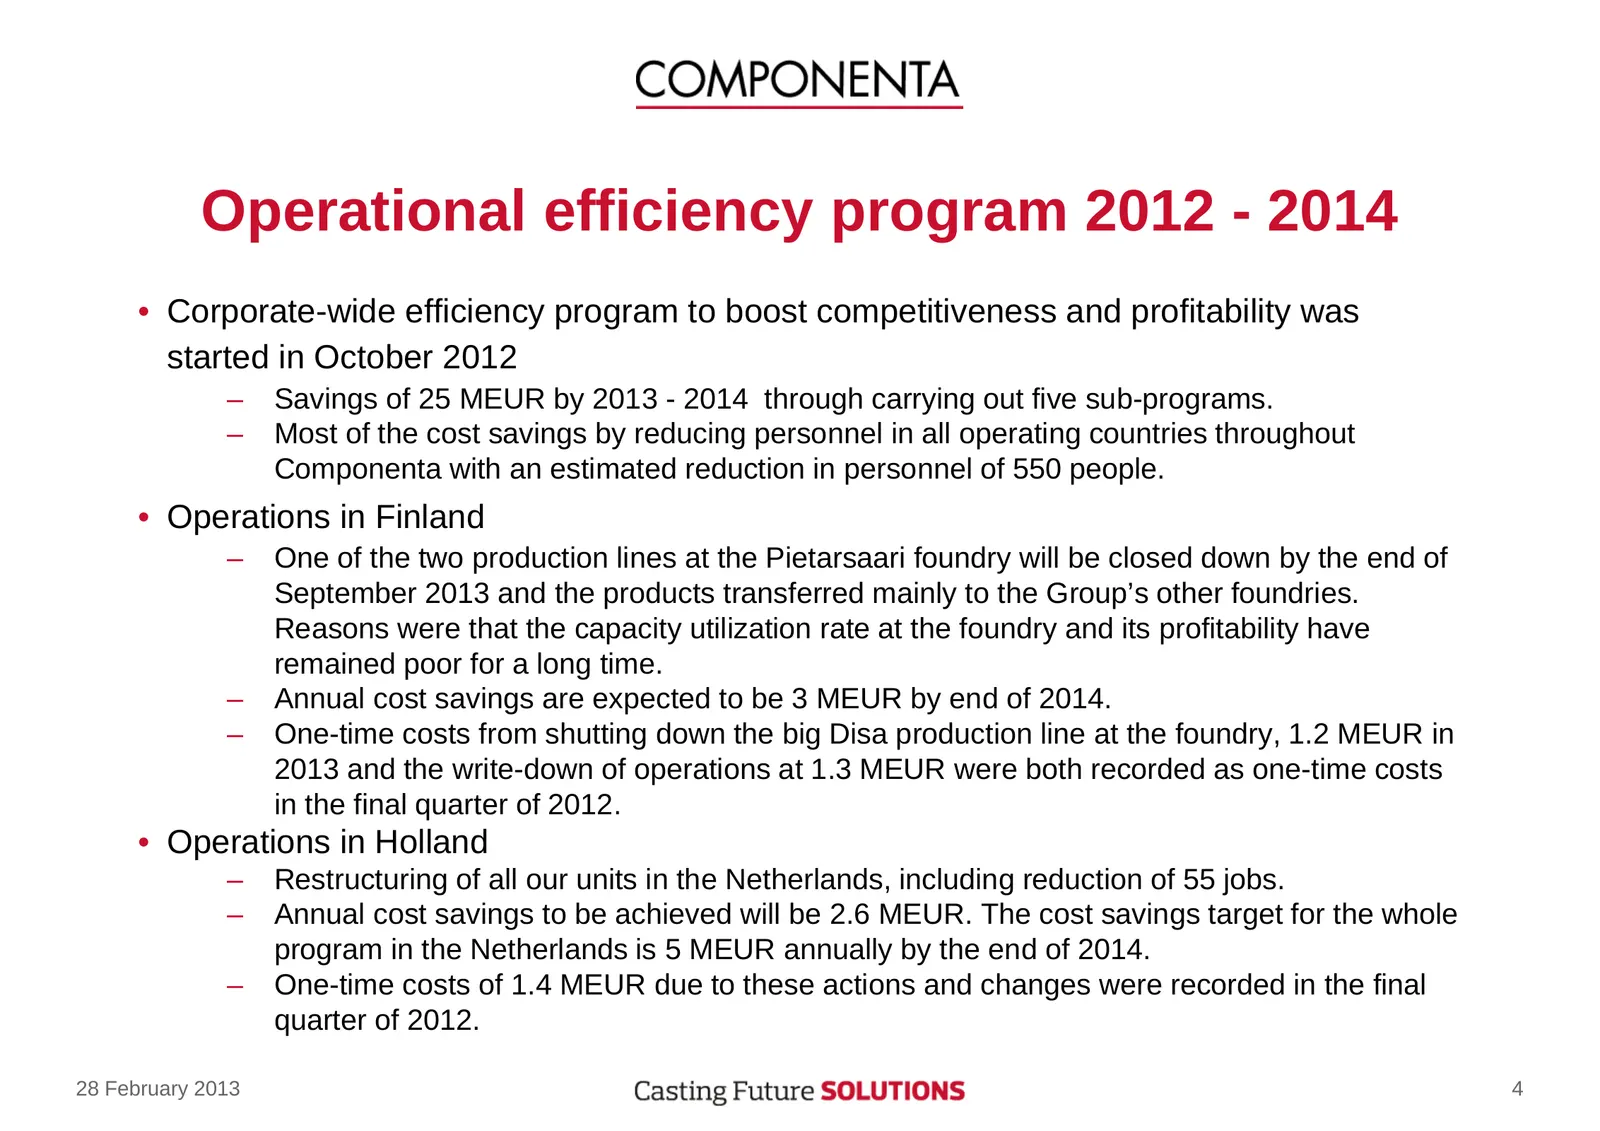
Slide 4: Operational efficiency program 2012 - 2014
Operational efficiency program 2012 - 2014 • Corporate-wide efficiency program to boost competitiveness and profitability was started in October 2012 – Savings of 25 MEUR by 2013 - 2014 through carrying out five sub-programs. – Most of the cost savings by reducing personnel in all operating countrie
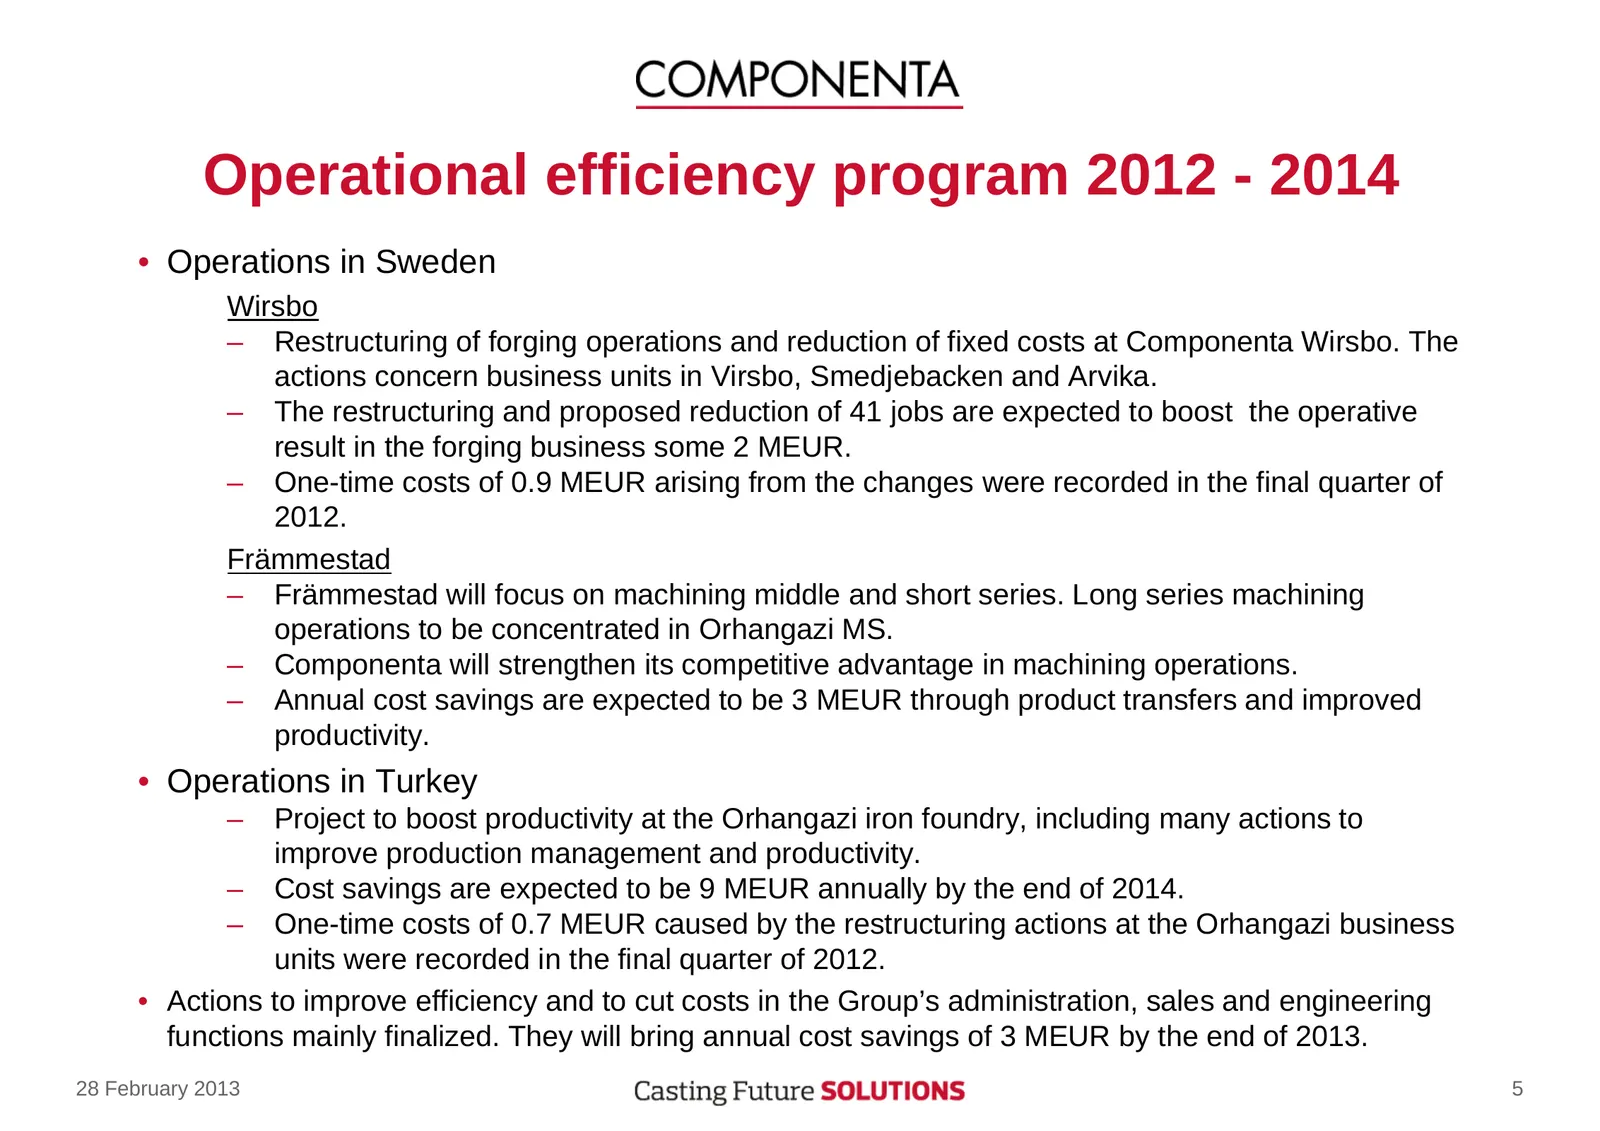
Slide 5: Operational efficiency program 2012 - 2014
Operational efficiency program 2012 - 2014 • Operations in Sweden Wirsbo – Restructuring of forging operations and reduction of fixed costs at Componenta Wirsbo. The actions concern business units in Virsbo, Smedjebacken and Arvika. – The restructuring and proposed reduction of 41 jobs are expected
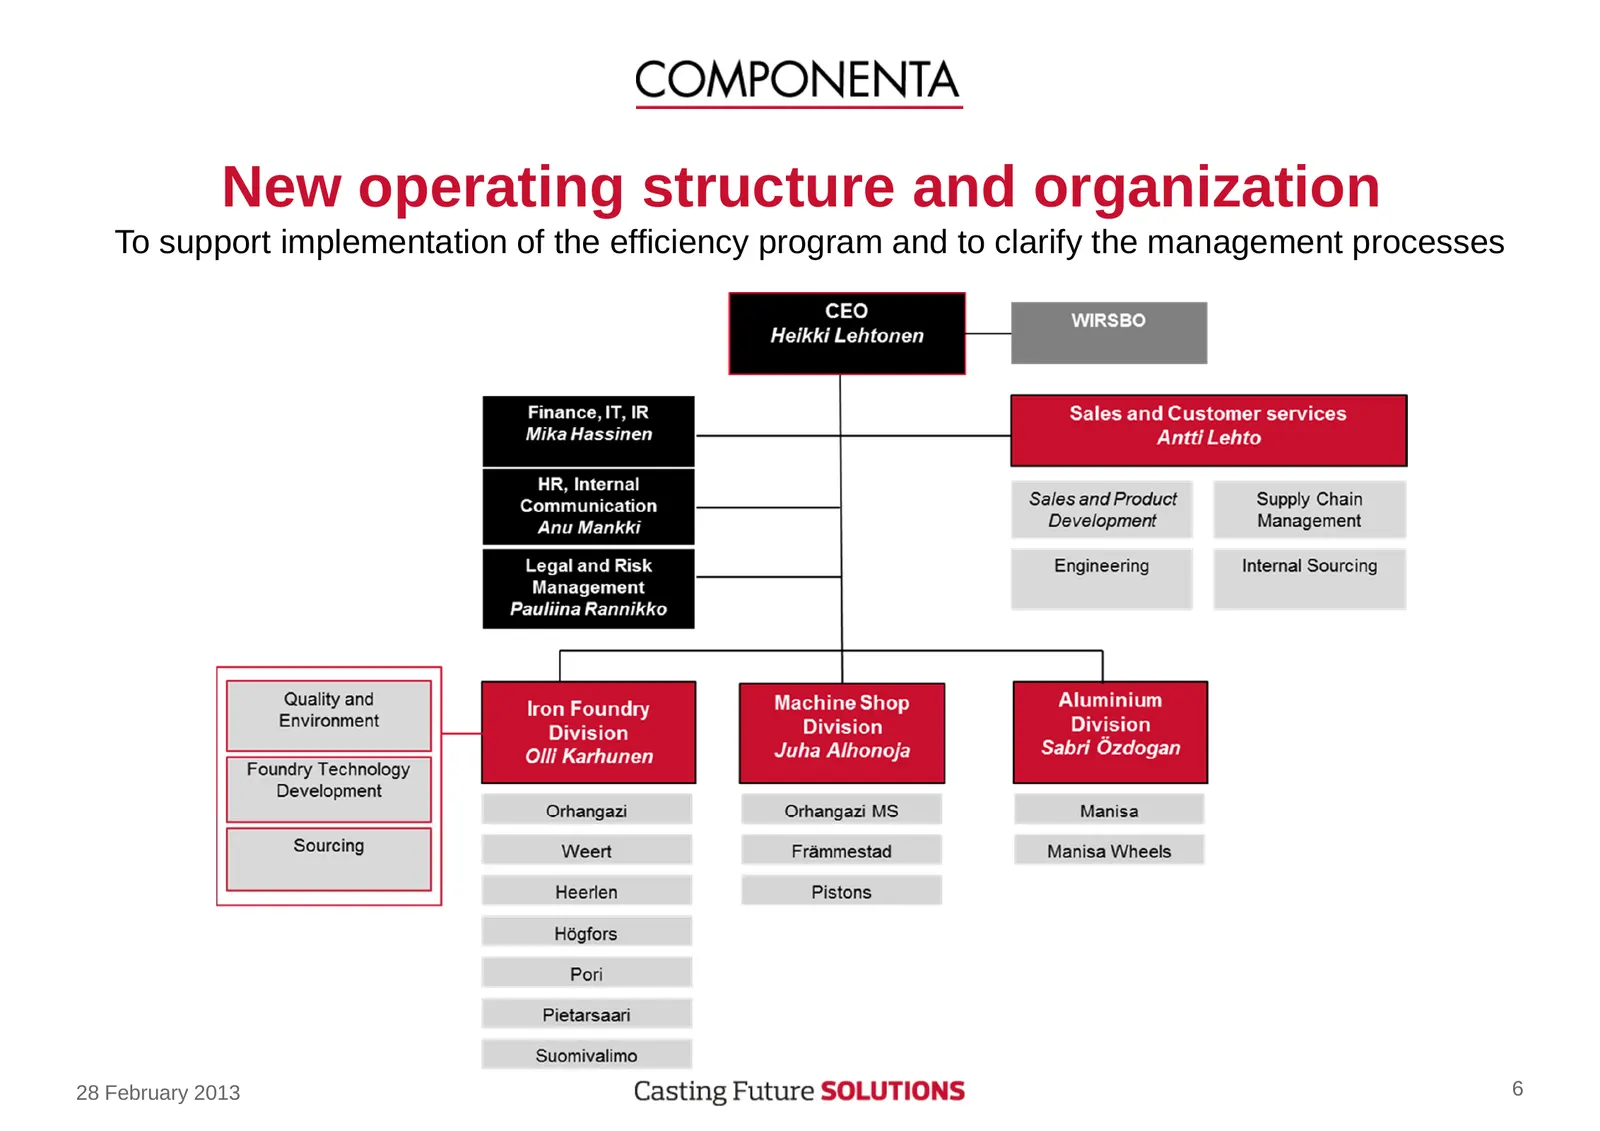
Slide 6: New operating structure and organization
New operating structure and organization To support implementation of the efficiency program and to clarify the management processes 28 February 2013 6
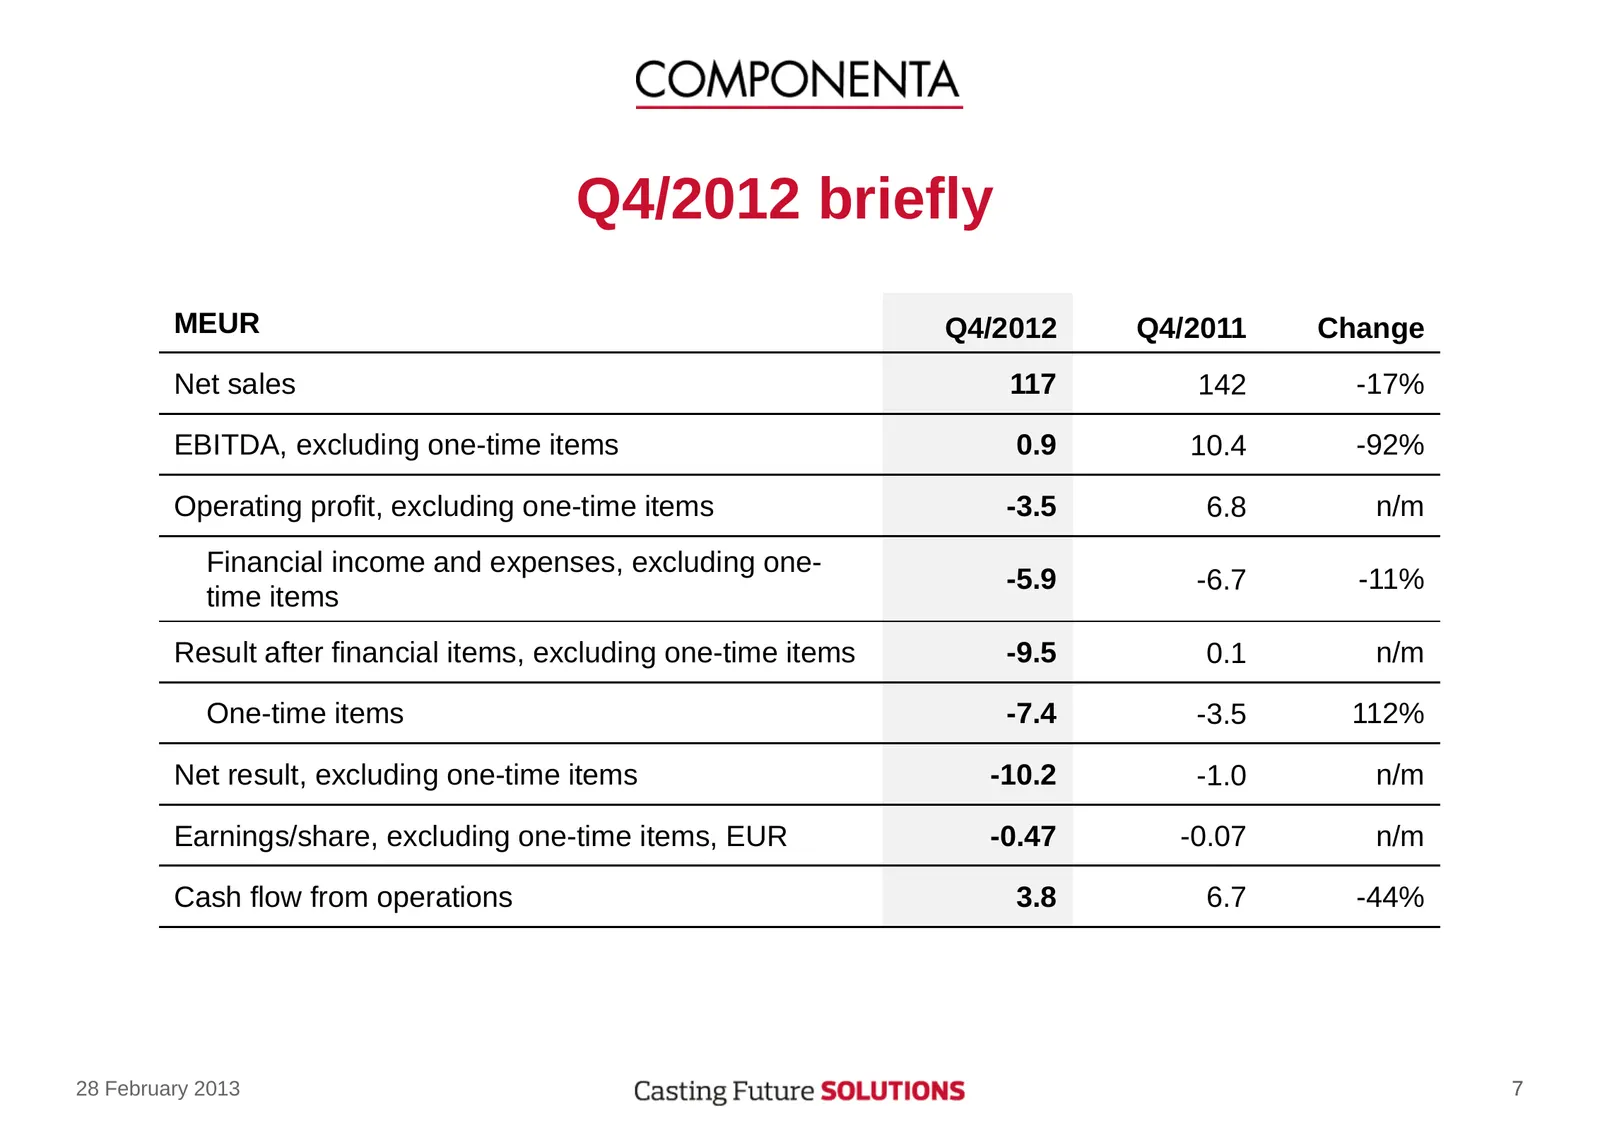
Slide 7: Q4/2012 briefly
Q4/2012 briefly MEUR Q4/2012 Q4/2011 Change Net sales 117 142 -17% EBITDA, excluding one-time items 0.9 10.4 -92% Operating profit, excluding one-time items -3.5 6.8 n/m Financial income and expenses, excluding one- -5.9 -6.7 -11% time items Result after financial items, excluding one-time items -9.
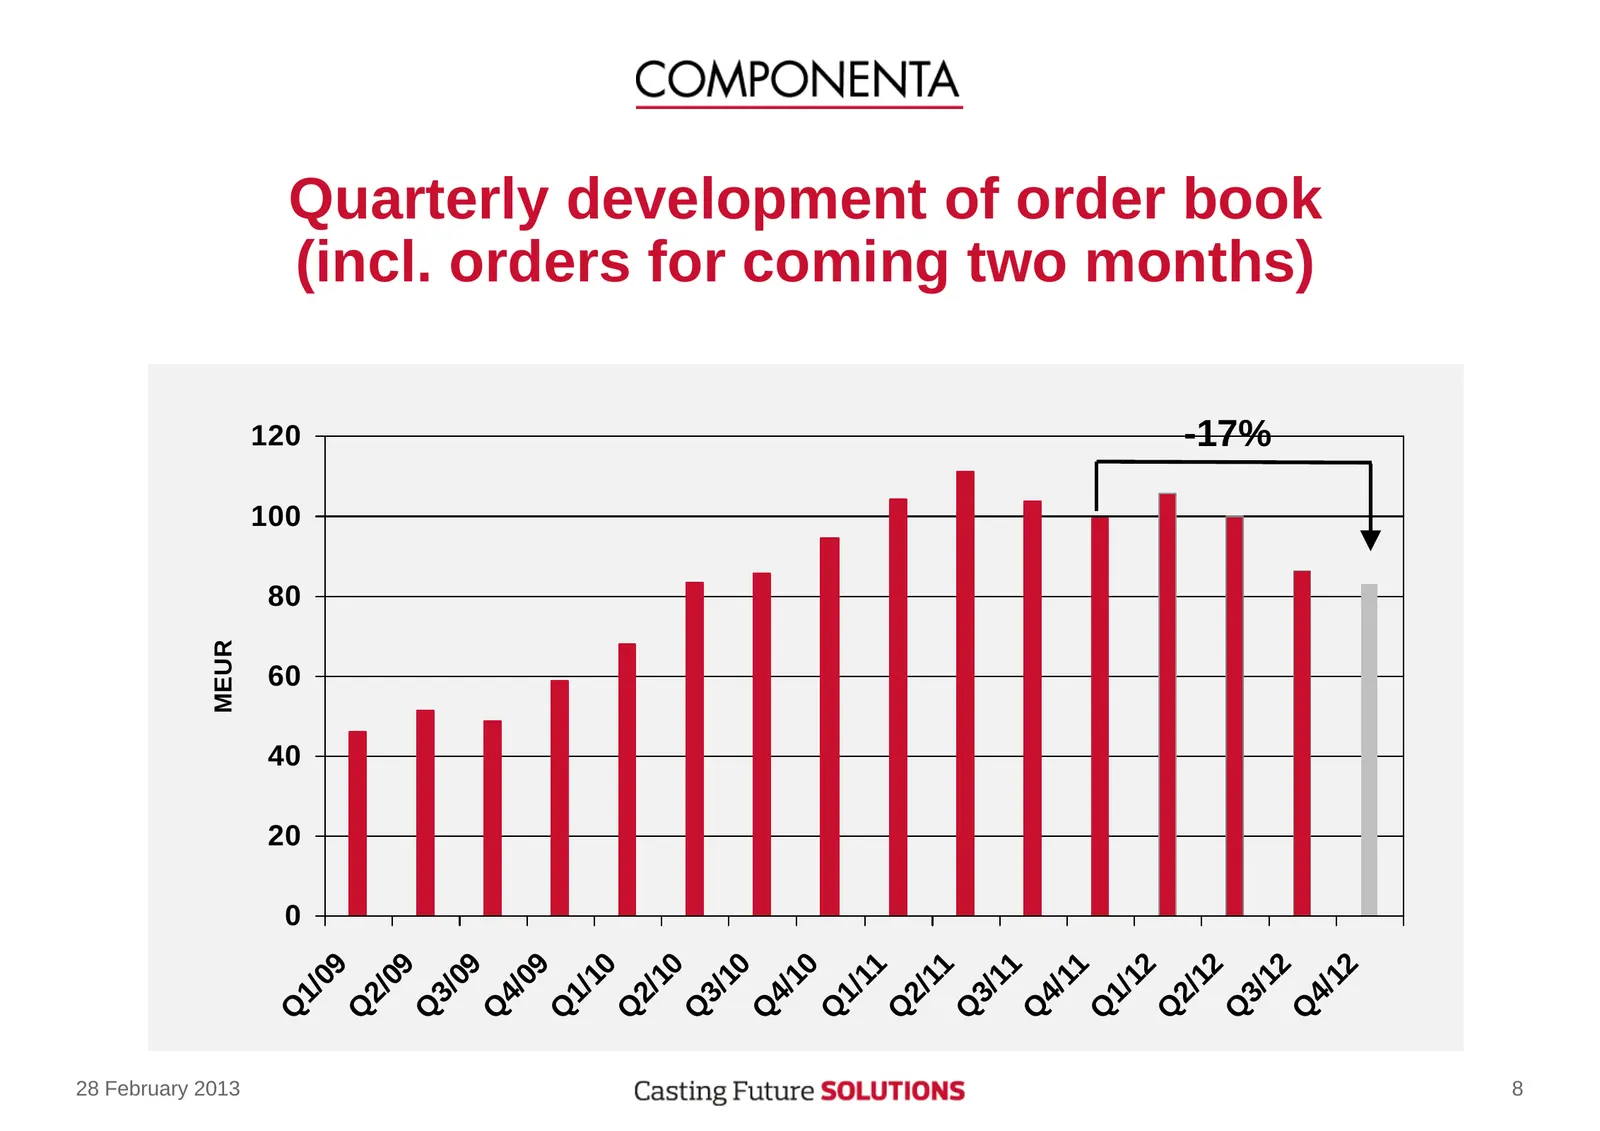
Slide 8: Quarterly development of order book
Quarterly development of order book (incl. orders for coming two months) 120 -17% 100 80 MEUR 60 40 20 0 09 09 09 09 10 10 10 10 11 11 11 11 12 12 12 12 1/ 2/ 3/ 4/ 1/ 2/ 3/ 4/ 1/ 2/ 3/ 4/ 1/ 2/ 3/ 4/ Q Q Q Q Q Q Q Q Q Q Q Q Q Q Q Q 28 February 2013 8
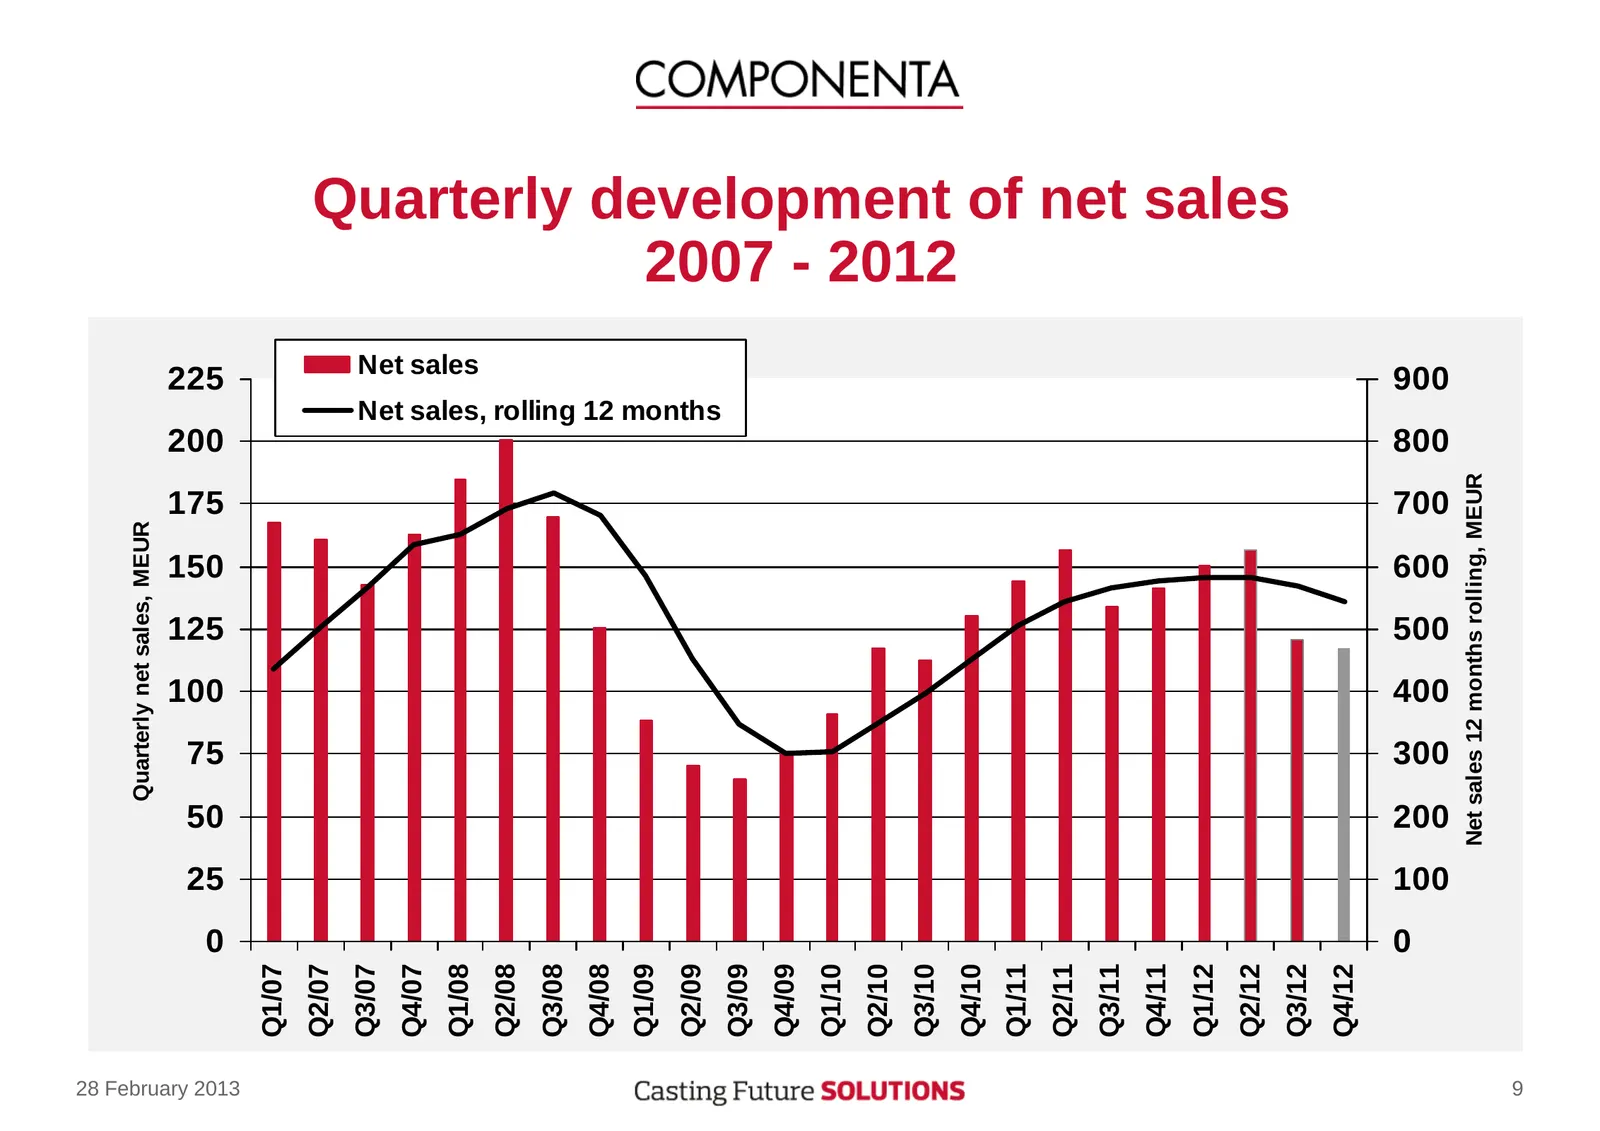
Slide 9: Quarterly net sales, MEUR
Quarterly net sales, MEUR 0 25 50 75 100 125 150 175 200 225 28 February 2013 Q1/07 Q2/07 Q3/07 Q4/07 Q1/08 Net sales Q2/08 Q3/08 Q4/08 Q1/09 Q2/09 Net sales, rolling 12 months Q3/09 Q4/09 Q1/10 Q2/10 Q3/10 2007 - 2012 Q4/10 Q1/11 Q2/11 Q3/11 Q4/11 Q1/12 Q2/12 Quarterly development of net sales Q3/1
Slide 10: Analysis of changes in income statements excluding one-time items
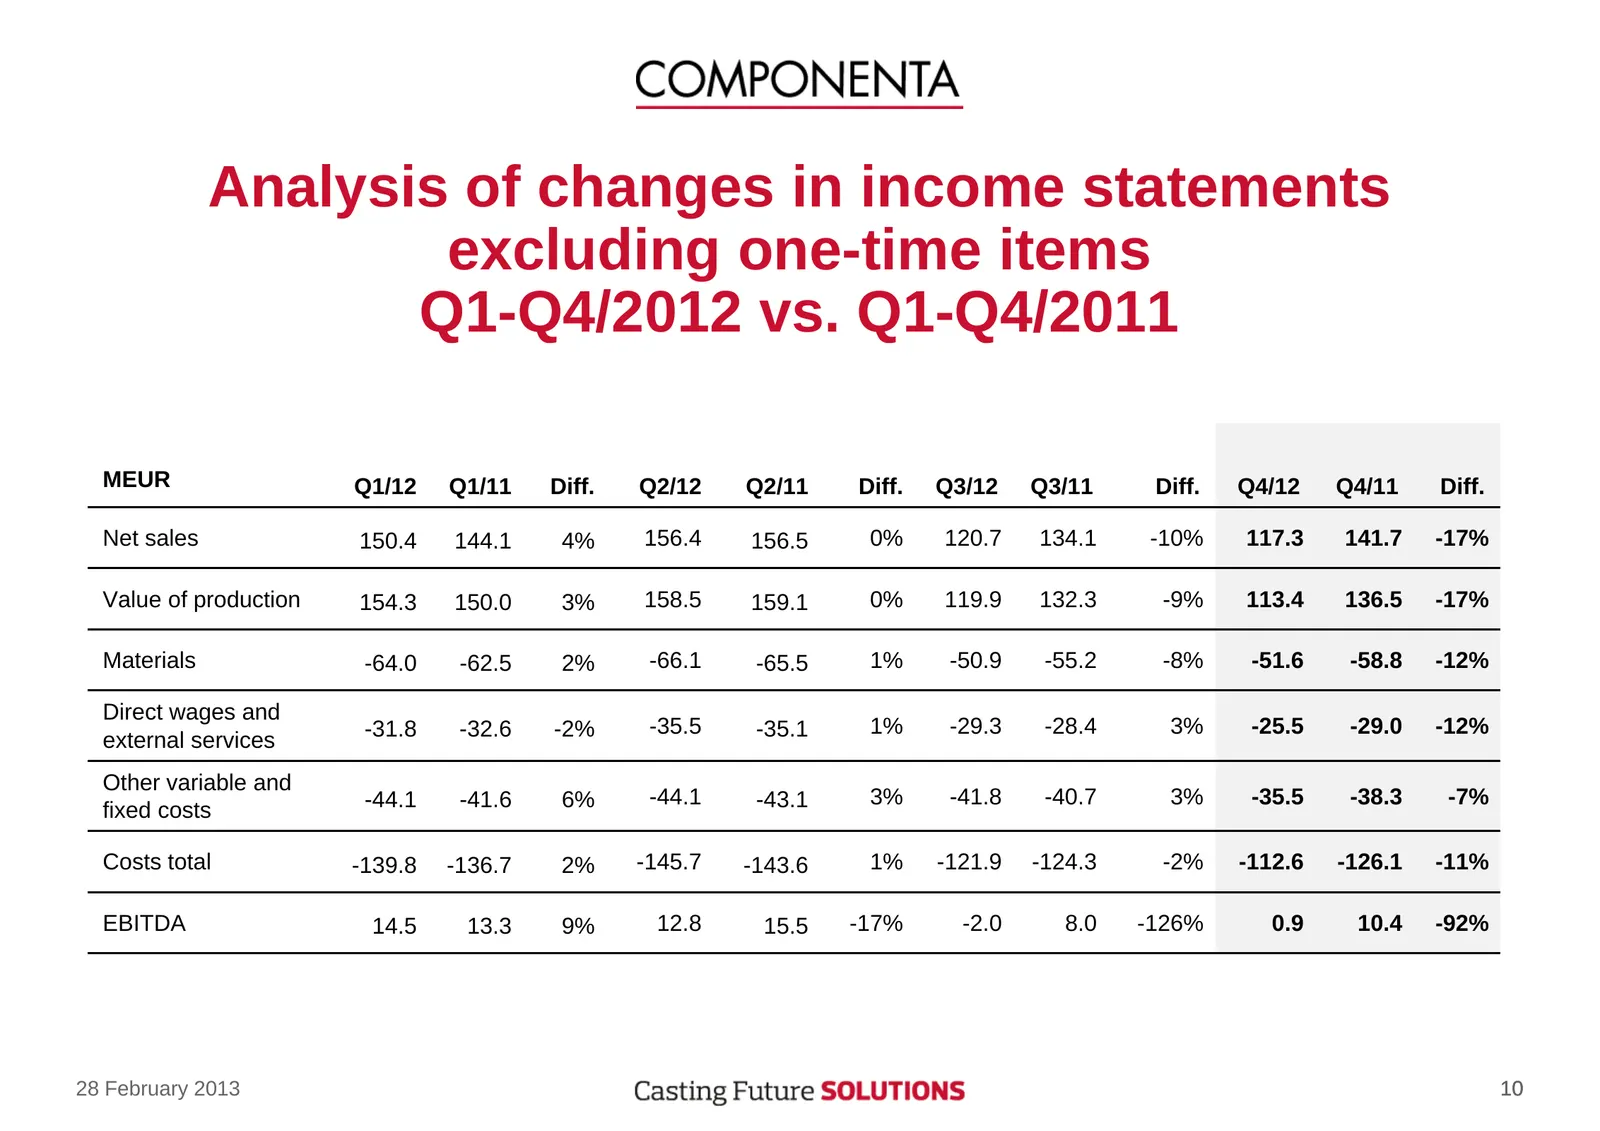
Analysis of changes in income statements excluding one-time items Q1-Q4/2012 vs. Q1-Q4/2011 MEUR Q1/12 Q1/11 Diff. Q2/12 Q2/11 Diff. Q3/12 Q3/11 Diff. Q4/12 Q4/11 Diff. Net sales 150.4 144.1 4% 156.4 156.5 0% 120.7 134.1 -10% 117.3 141.7 -17% Value of production 154.3 150.0 3% 158.5 159.1 0% 119.9 1
Slide 11: Quarterly operating profit and result after financial items
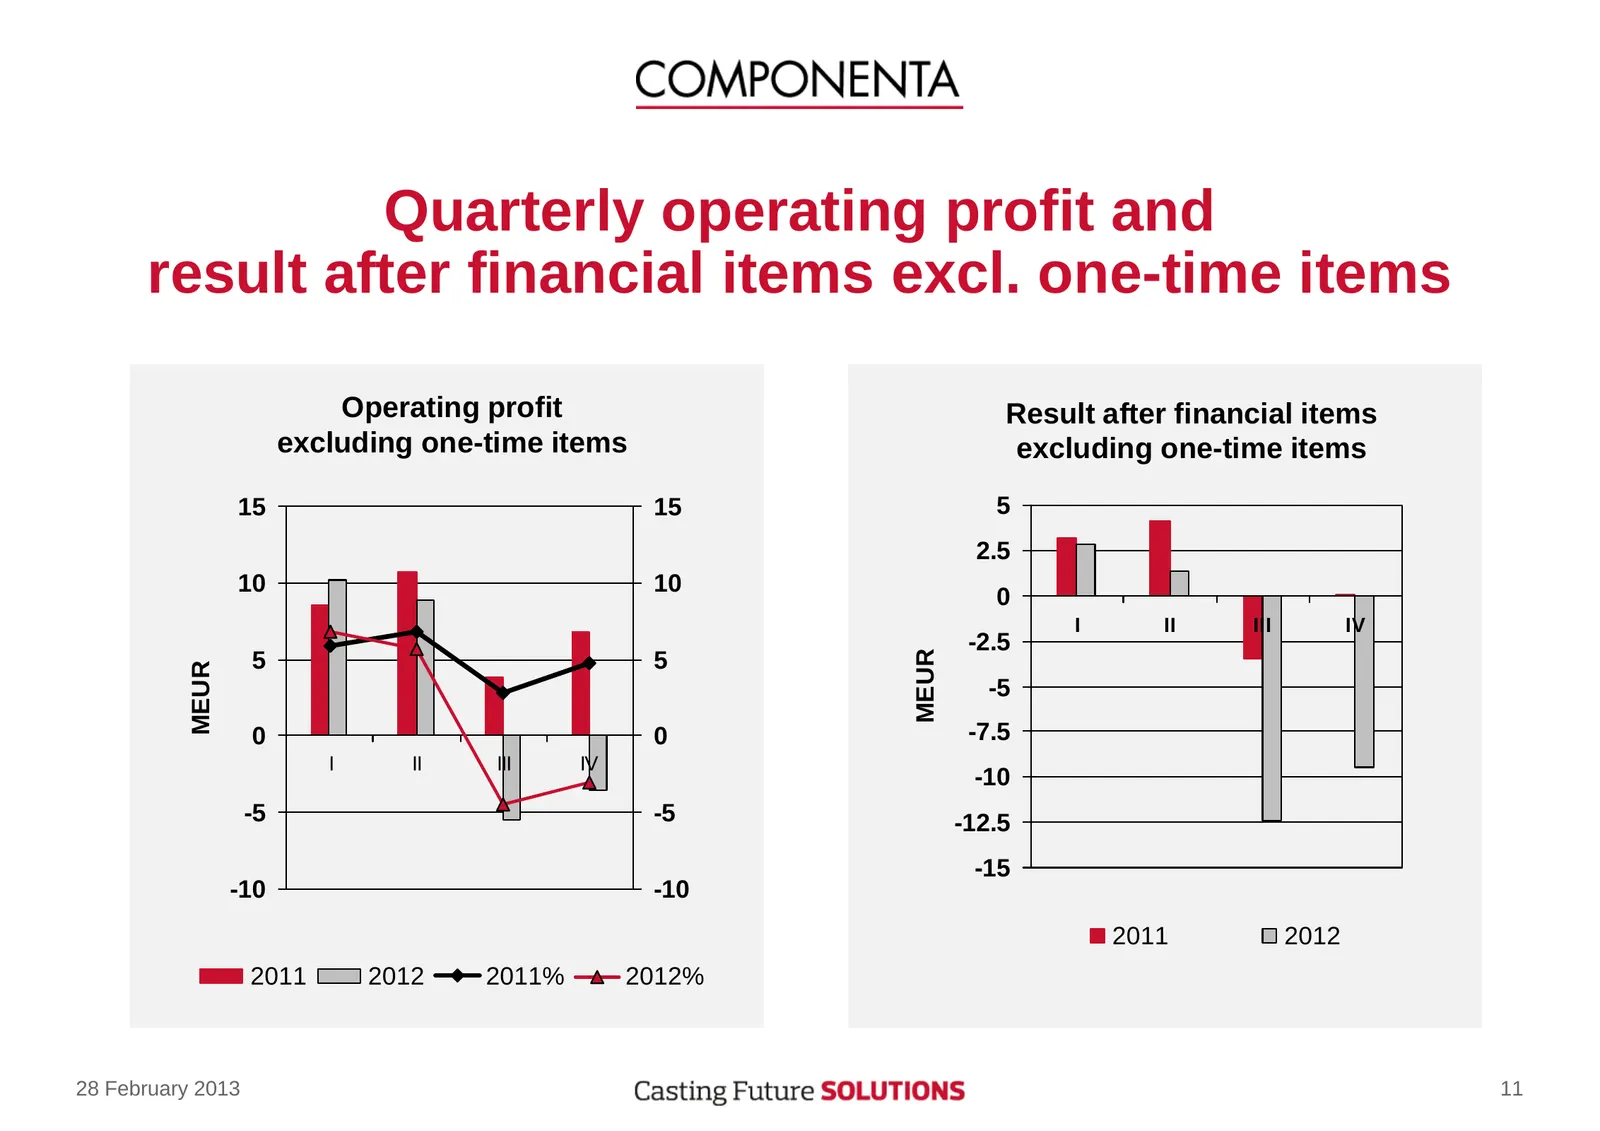
Quarterly operating profit and result after financial items excl. one-time items Operating profit Result after financial items excluding one-time items excluding one-time items 15 15 5 2.5 10 10 0 I II III IV -2.5 MEUR 5 5 MEUR -5 0 0 -7.5 I II III IV -10 -5 -5 -12.5 -15 -10 -10 2011 2012 2011 2012
Slide 12: Key ratios
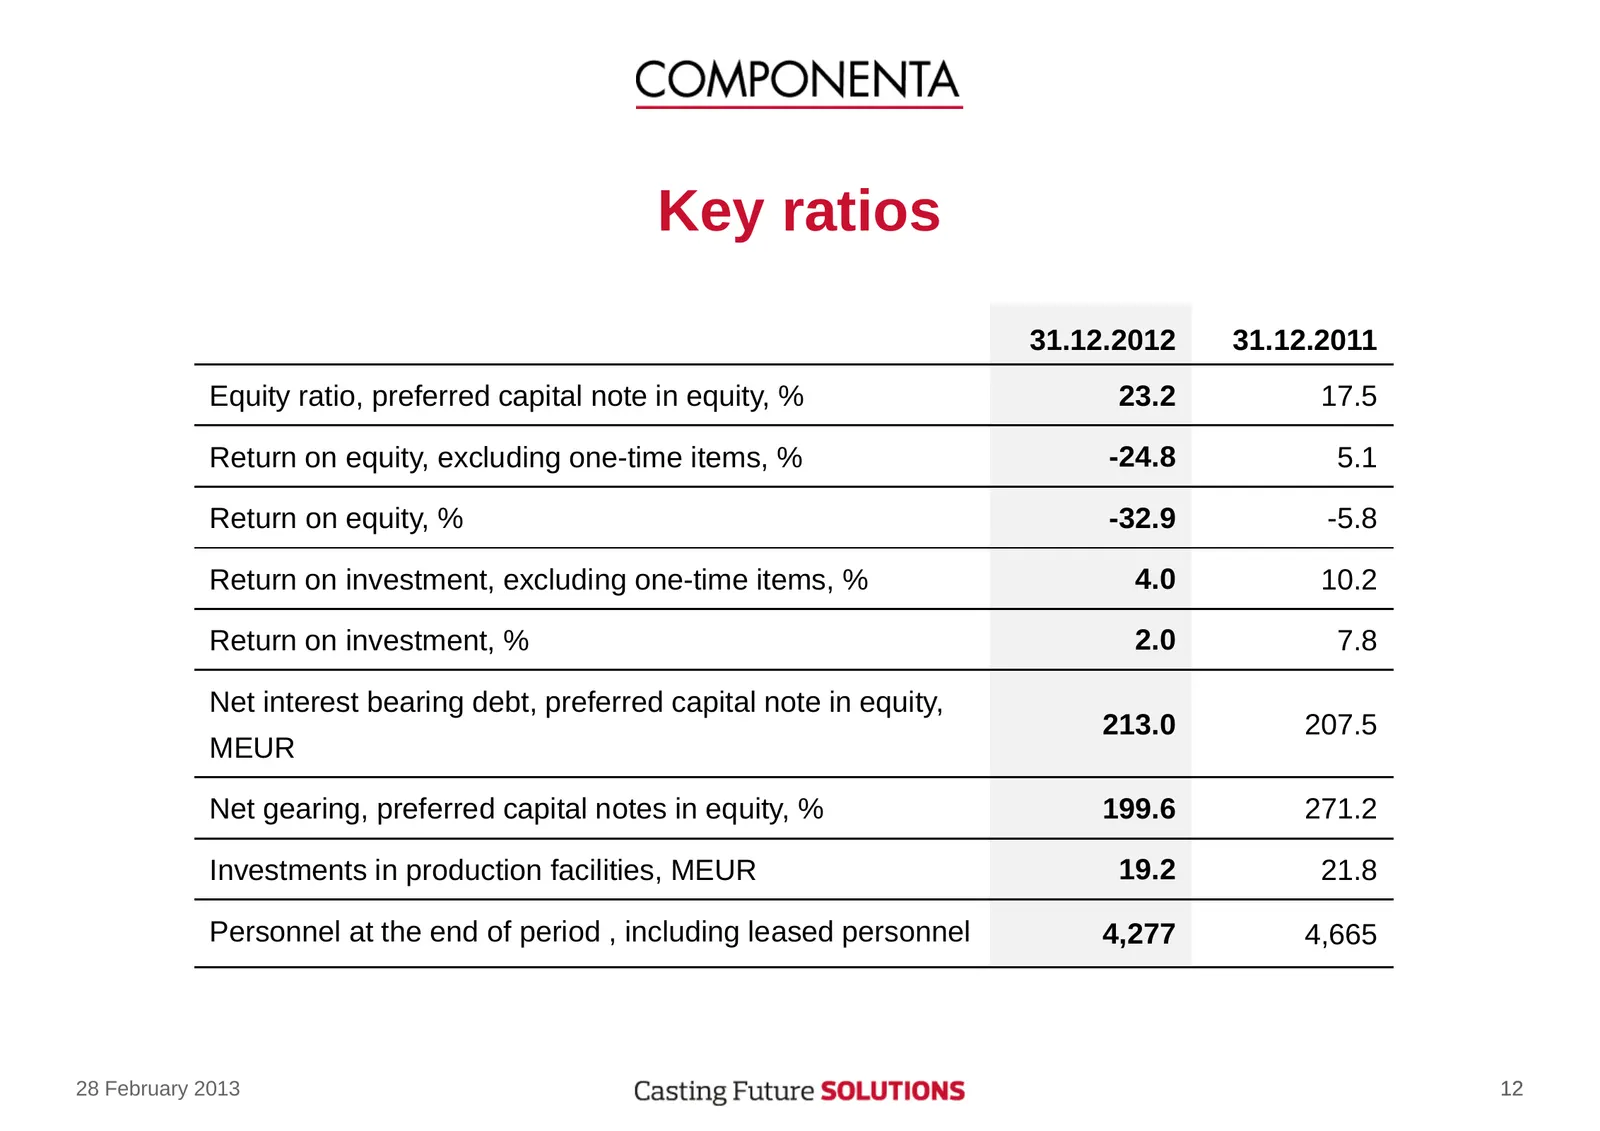
Key ratios 31.12.2012 31.12.2011 Equity ratio, preferred capital note in equity, % 23.2 17.5 Return on equity, excluding one-time items, % -24.8 5.1 Return on equity, % -32.9 -5.8 Return on investment, excluding one-time items, % 4.0 10.2 Return on investment, % 2.0 7.8 Net interest bearing debt, pr
Slide 13: Equity ratio, %
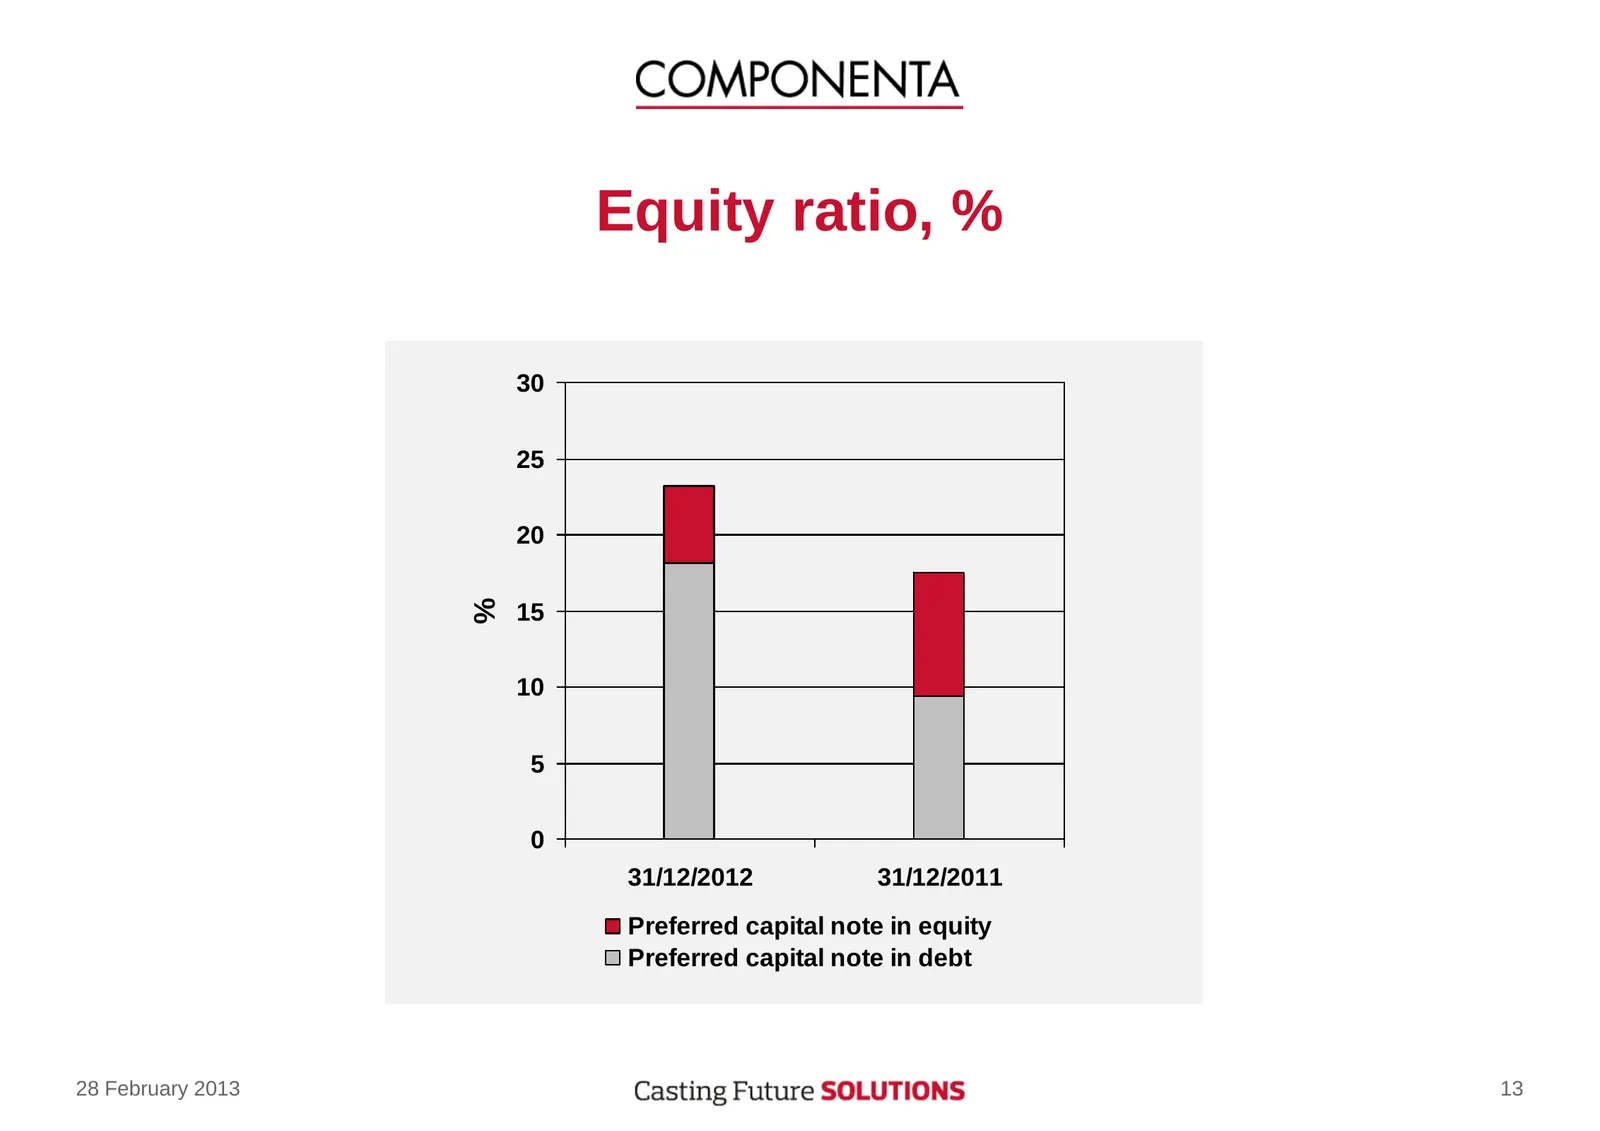
Equity ratio, % 30 25 20 % 15 10 5 0 31/12/2012 31/12/2011 Preferred capital note in equity Preferred capital note in debt 28 February 2013 13
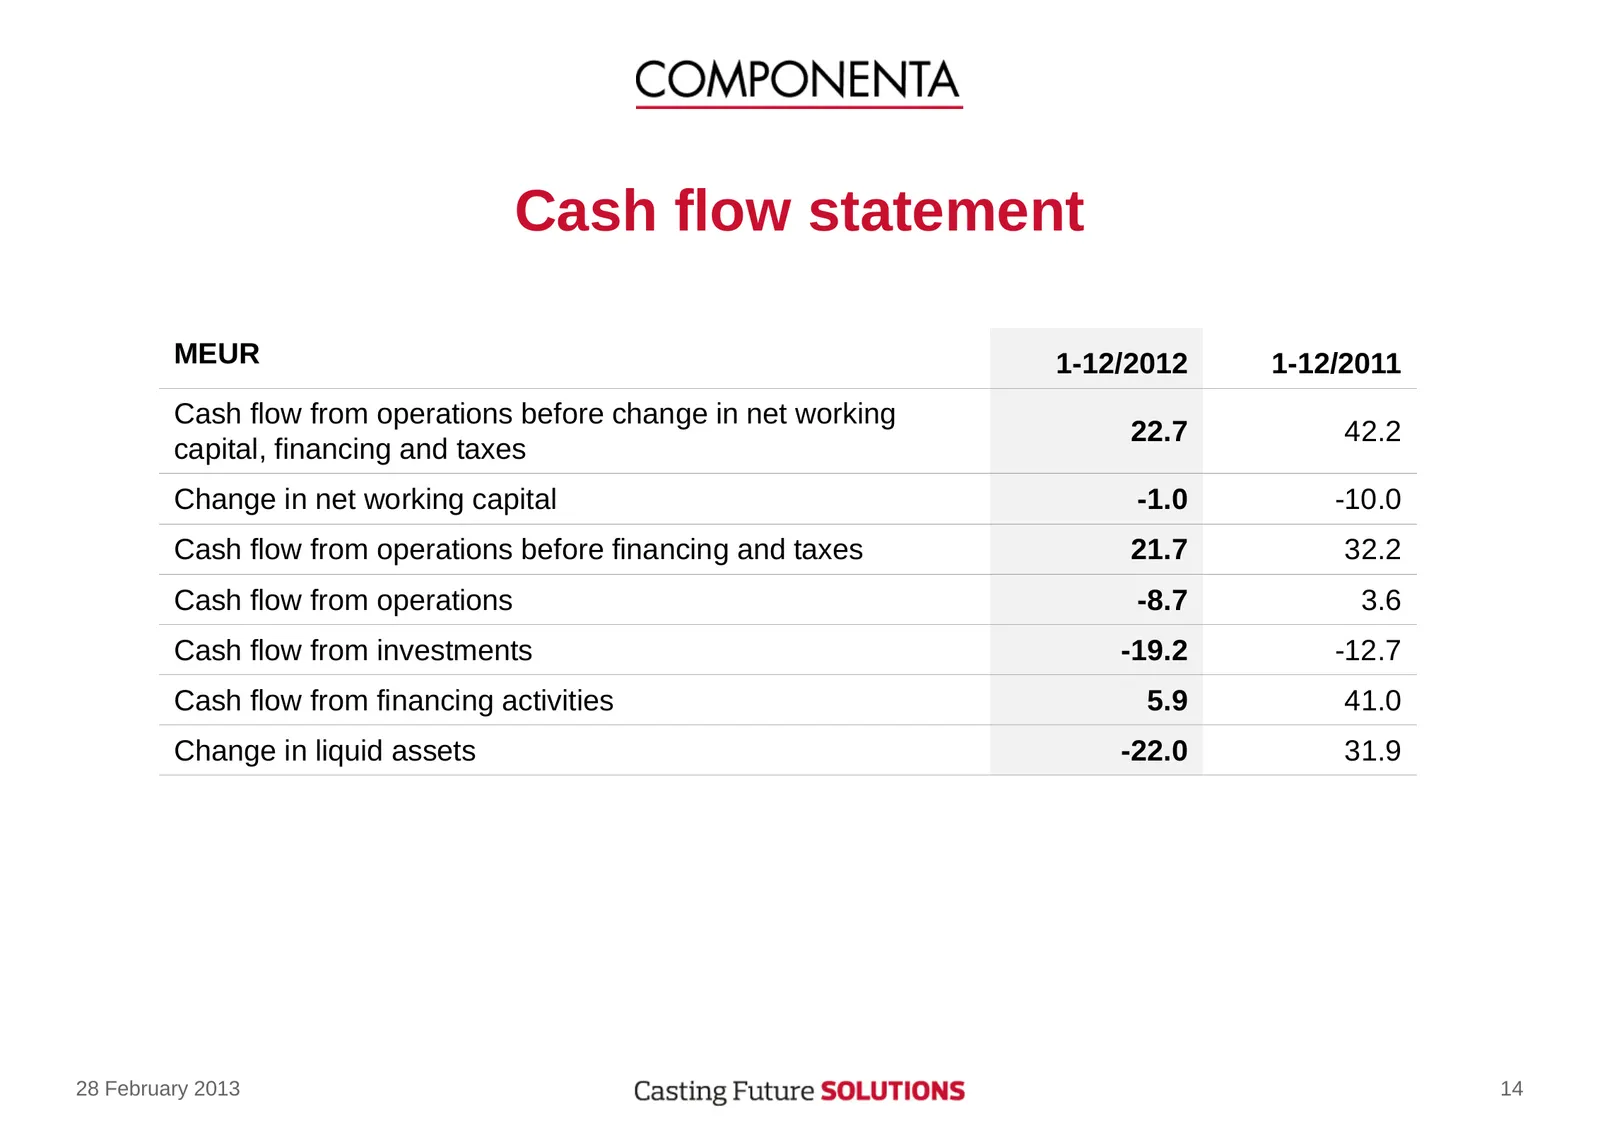
Slide 14: Cash flow statement
Cash flow statement MEUR 1-12/2012 1-12/2011 Cash flow from operations before change in net working 22.7 42.2 capital, financing and taxes Change in net working capital -1.0 -10.0 Cash flow from operations before financing and taxes 21.7 32.2 Cash flow from operations -8.7 3.6 Cash flow from investm
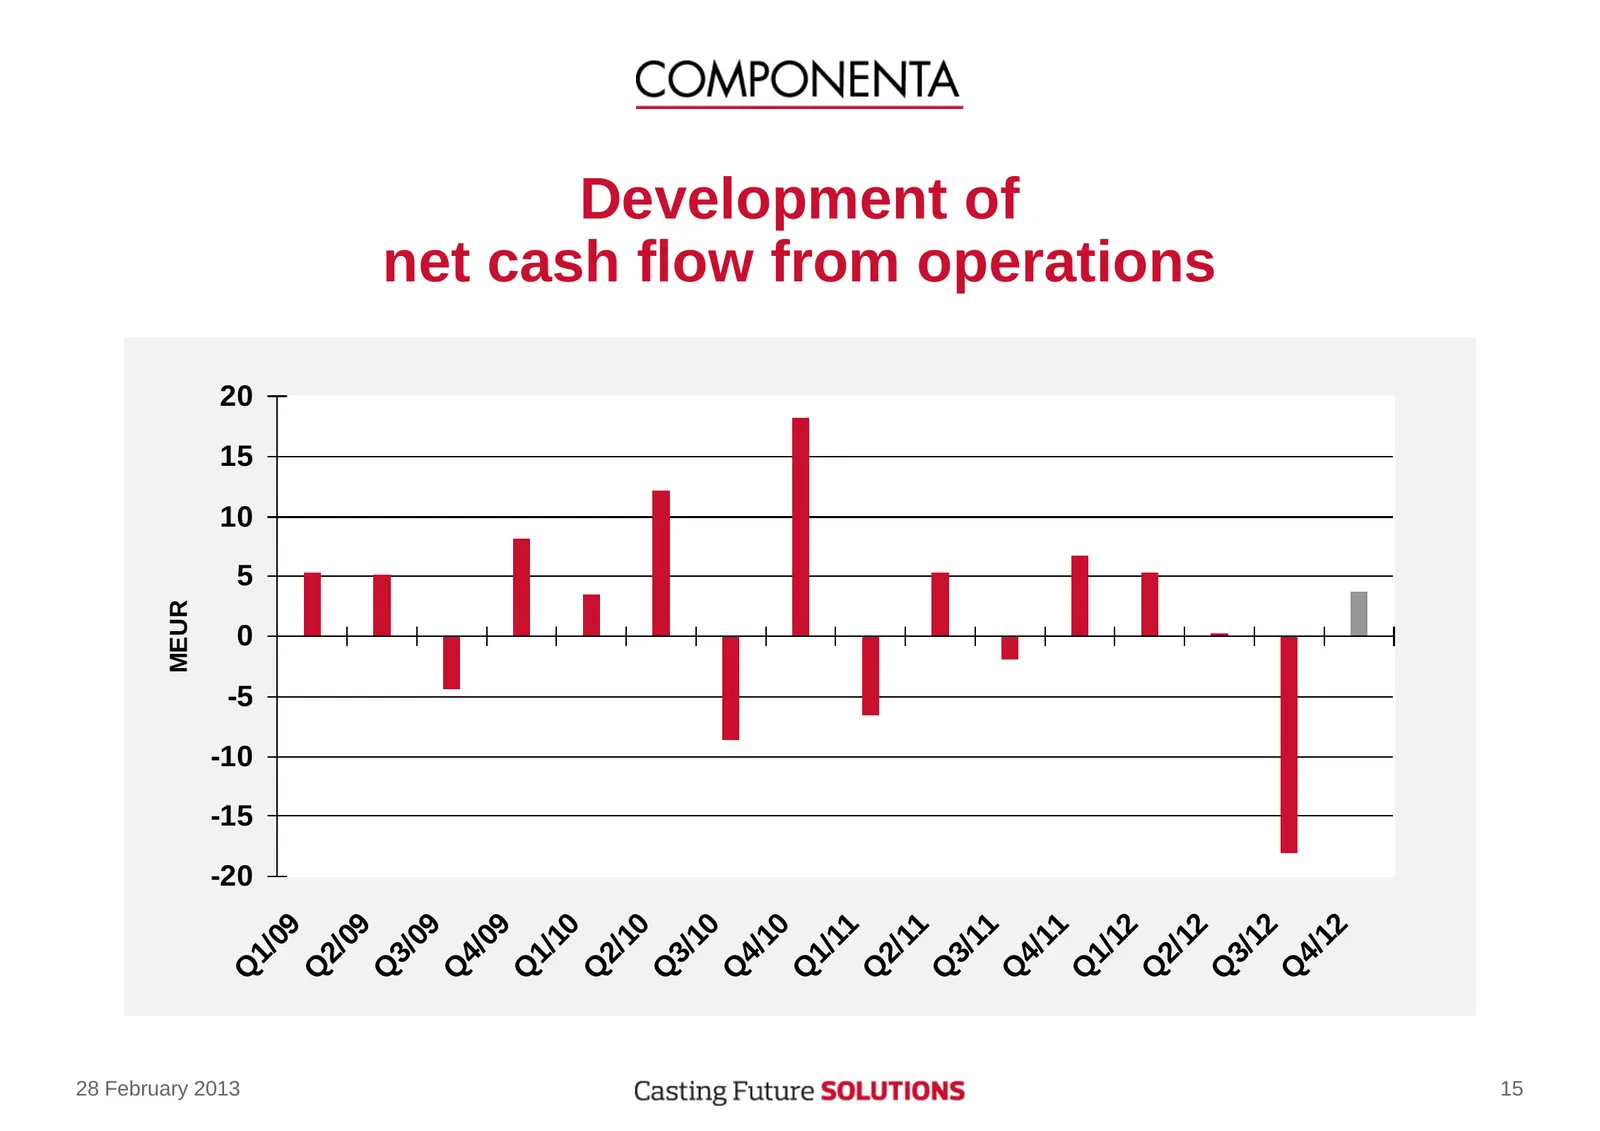
Slide 15: Development of net cash flow from operations
MEUR 28 February 2013 Q -20 -15 -10 -5 0 5 10 15 20 1/ 09 Q 2/ 09 Q 3/ 09 Q 4/ 09 Q 1/ 10 Q 2/ 10 Q 3/ 10 Q 4/ 10 Q 1/ 11 Q 2/ 11 Q 3/ 11 Development of Q 4/ 11 Q 1/ 12 Q 2/ 12 net cash flow from operations Q 3/ 12 Q 4/ 12 15
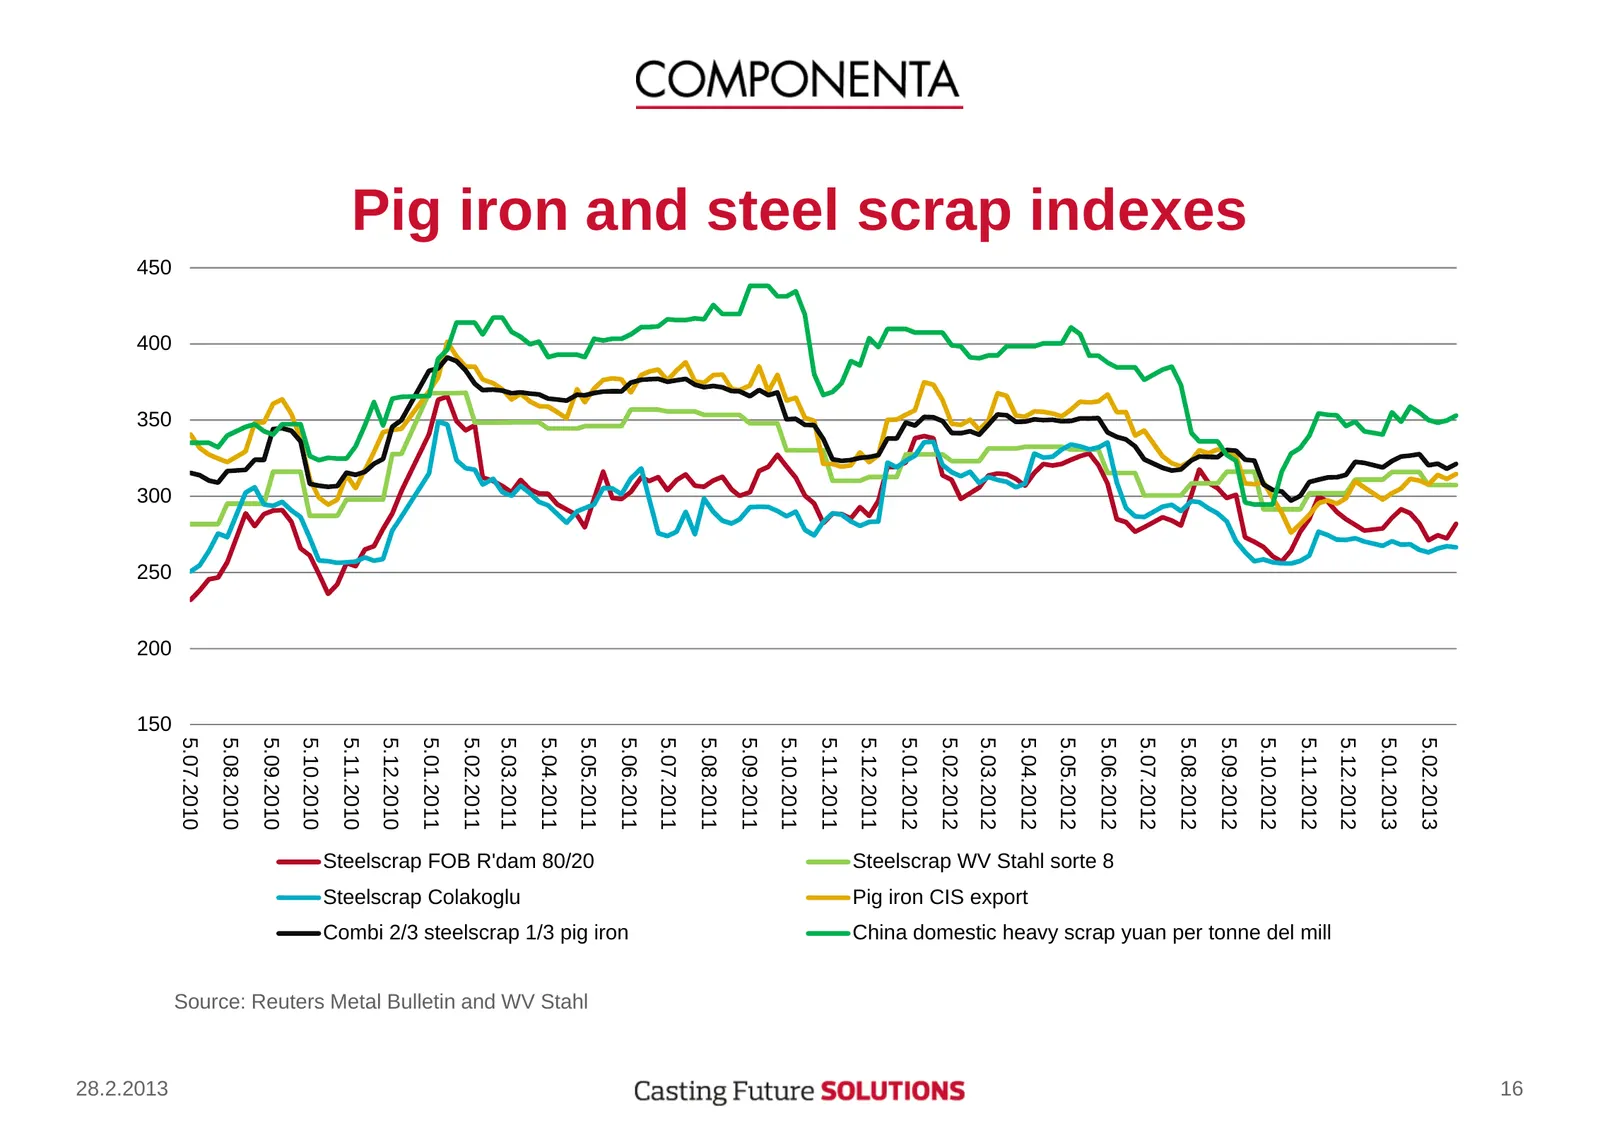
Slide 16: Pig iron and steel scrap indexes
16 5.02.2013 5.01.2013 5.12.2012 China domestic heavy scrap yuan per tonne del mill 5.11.2012 5.10.2012 Pig iron and steel scrap indexes 5.09.2012 5.08.2012 5.07.2012 5.06.2012 Steelscrap WV Stahl sorte 8 5.05.2012 5.04.2012 Pig iron CIS export 5.03.2012 5.02.2012 5.01.2012 5.12.2011 5.11.2011 5.10.
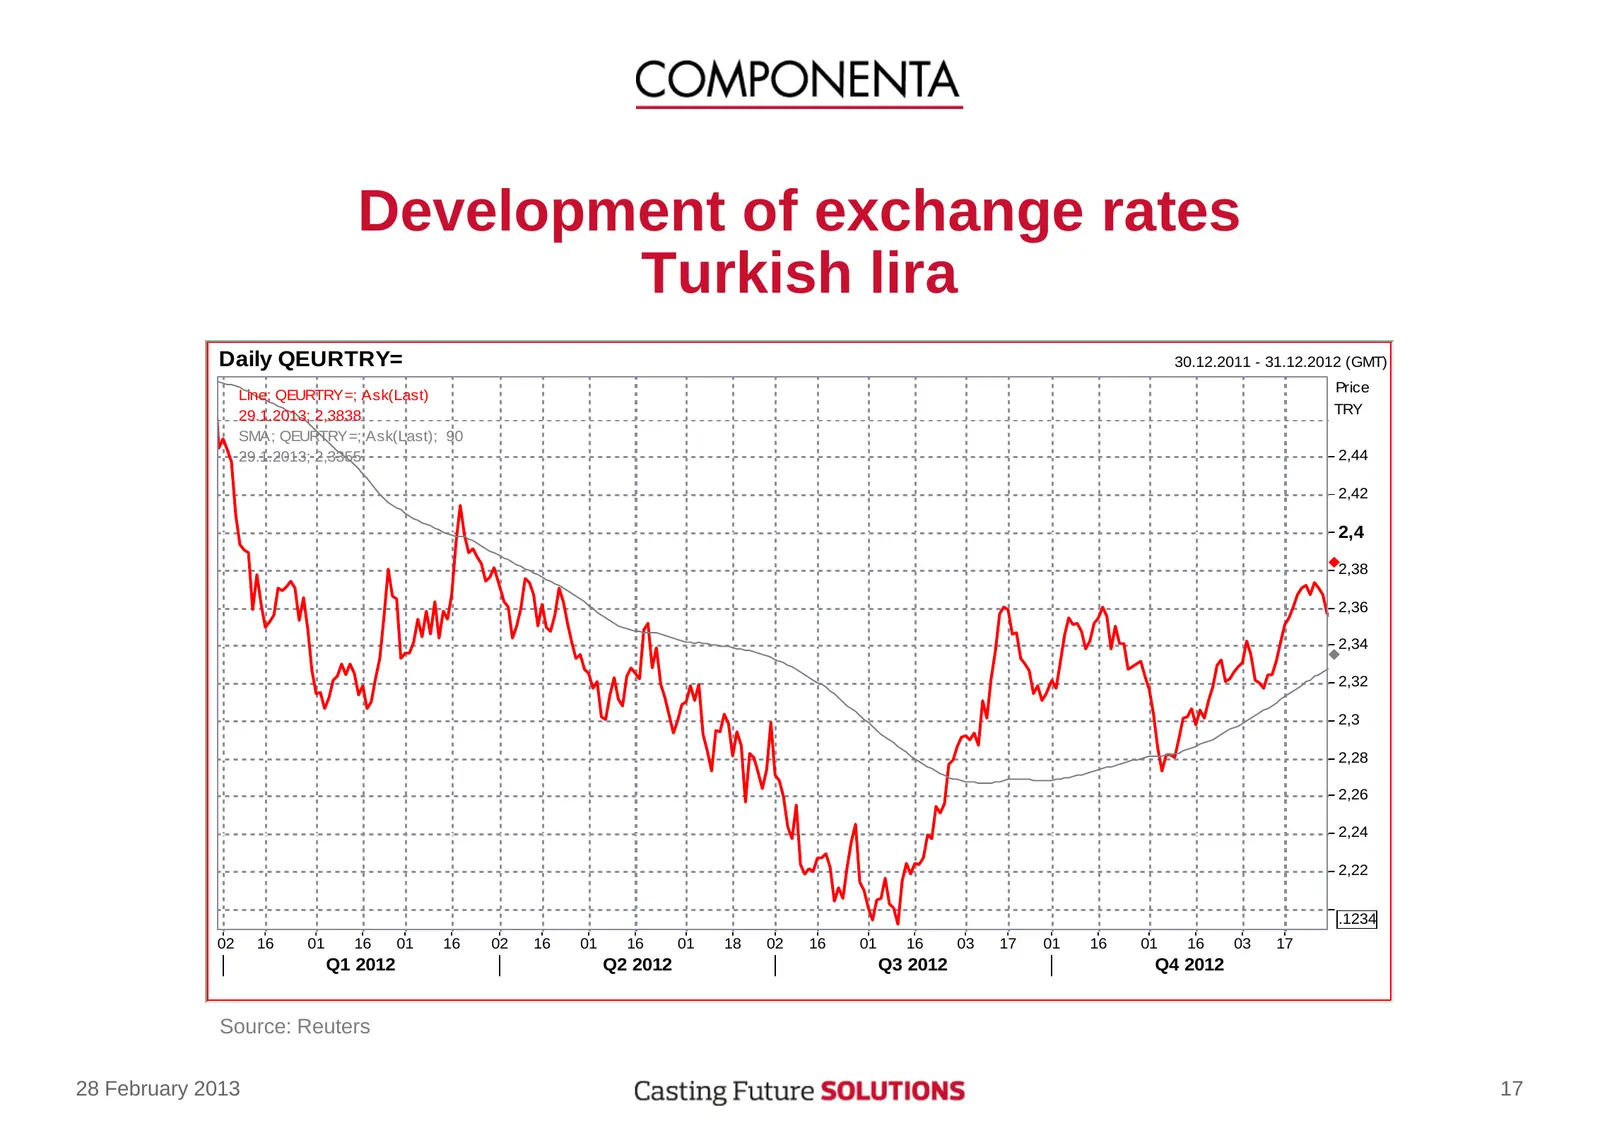
Slide 17: Development of exchange rates Turkish lira
Development of exchange rates Turkish lira Daily QEURTRY= 30.12.2011 - 31.12.2012 (GMT) Price Line; QEURTRY=; Ask(Last) 29.1.2013; 2,3838 TRY SMA; QEURTRY=; Ask(Last); 90 29.1.2013; 2,3355 2,44 2,42 2,4 2,38 2,36 2,34 2,32 2,3 2,28 2,26 2,24 2,22 .1234 02 16 01 16 01 16 02 16 01 16 01 18 02 16 01 16
Slide 18: Development of exchange rates Swedish krona
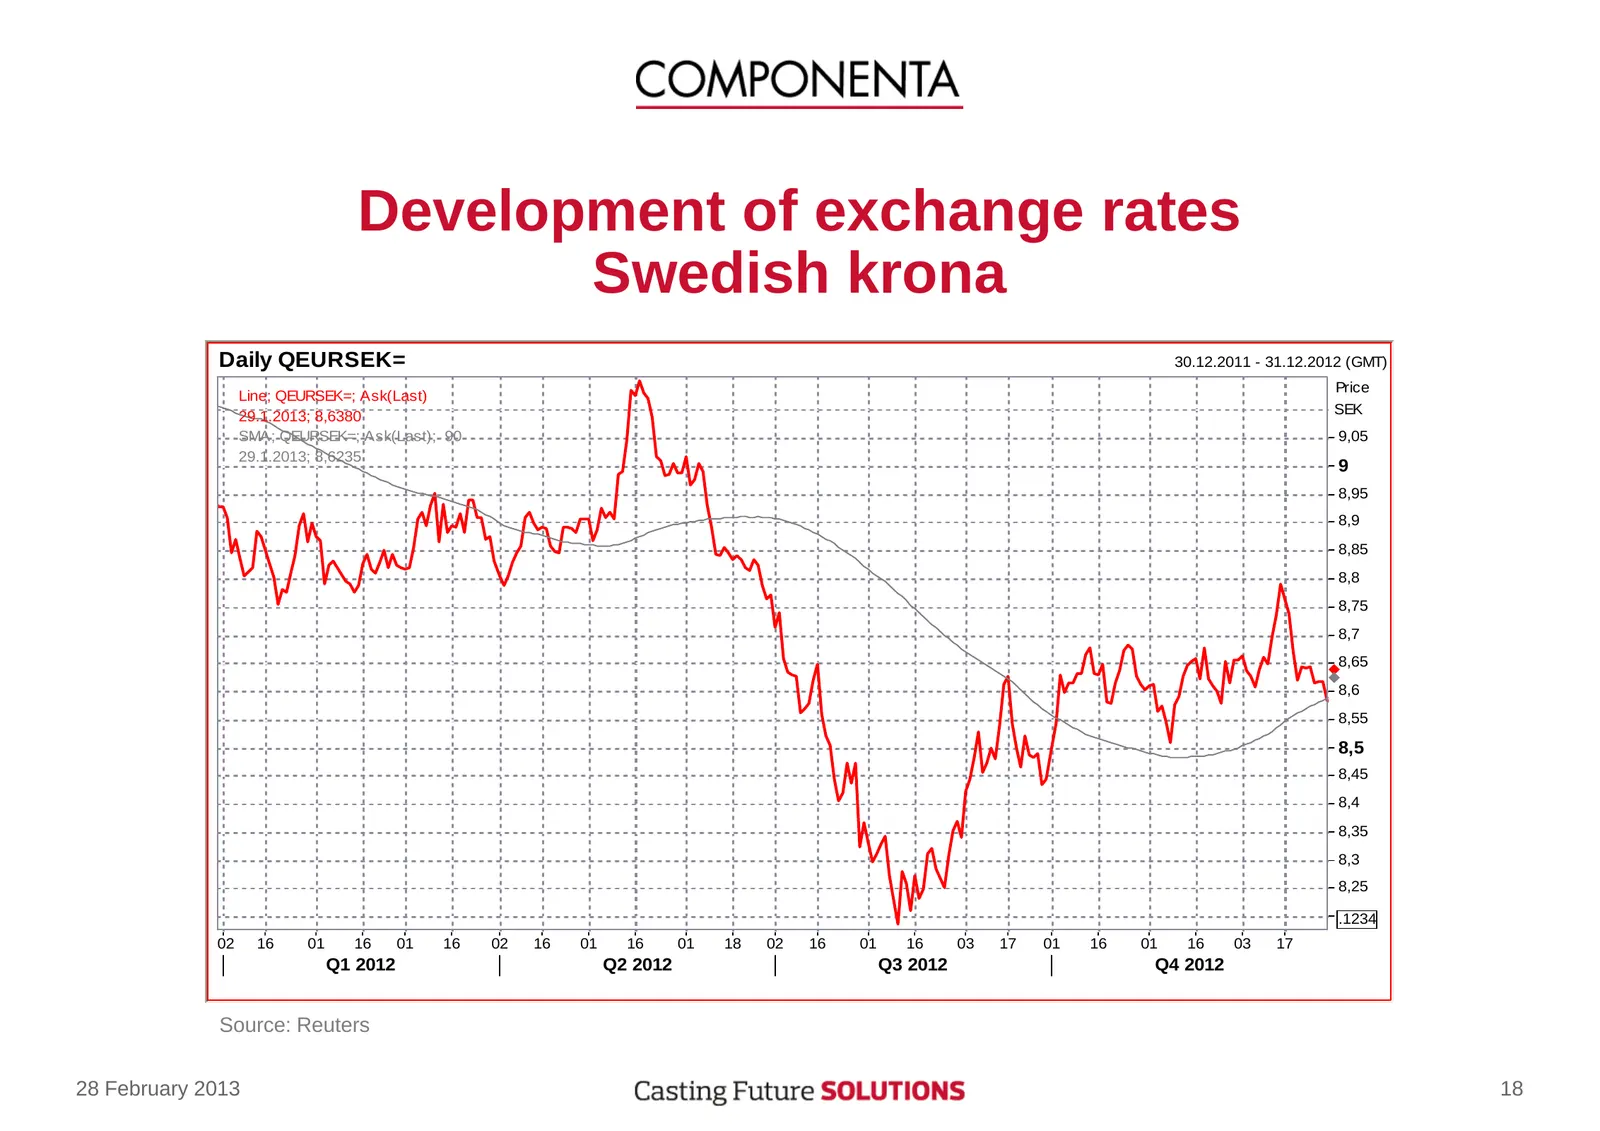
Development of exchange rates Swedish krona Daily QEURSEK= 30.12.2011 - 31.12.2012 (GMT) Price Line; QEURSEK=; Ask(Last) 29.1.2013; 8,6380 SEK SMA; QEURSEK=; Ask(Last); 90 9,05 29.1.2013; 8,6235 9 8,95 8,9 8,85 8,8 8,75 8,7 8,65 8,6 8,55 8,5 8,45 8,4 8,35 8,3 8,25 .1234 02 16 01 16 01 16 02 16 01 16
Slide 19: Indicators of economy
Indicators of economy 28 February 2013 19
Slide 20: Manufacturing Purchasing Manager Indices
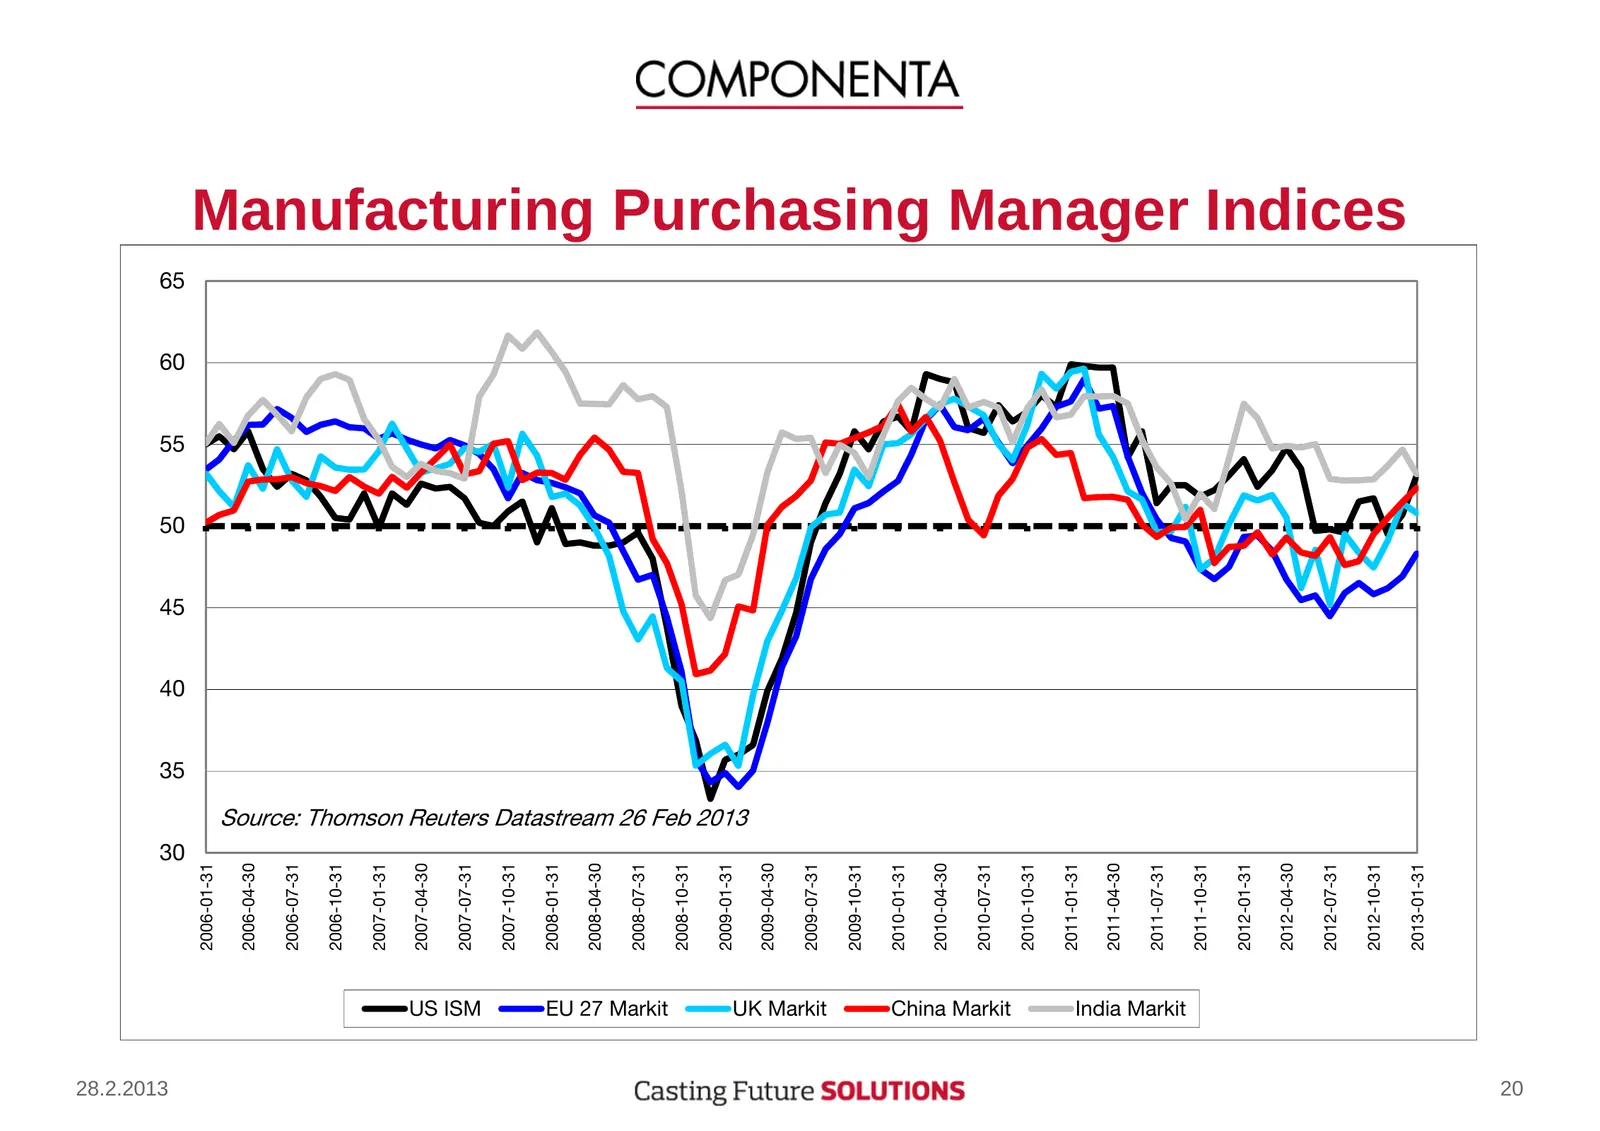
28.2.2013 PM PR QM QR RM RR SM SR OMMSJMNJPN OMMSJMQJPM OMMSJMTJPN OMMSJNMJPN OMMTJMNJPN OMMTJMQJPM OMMTJMTJPN rp=fpj OMMTJNMJPN OMMUJMNJPN OMMUJMQJPM OMMUJMTJPN br=OT=j~êâáí OMMUJNMJPN OMMVJMNJPN pçìêÅÉW=qÜçãëçå=oÉìíÉêë=a~í~ëíêÉ~ã OS=cÉÄ=OMNP OMMVJMQJPM OMMVJMTJPN rh=j~êâáí OMMVJNMJPN OMNMJMNJPN OM
Slide 21: CDS-index
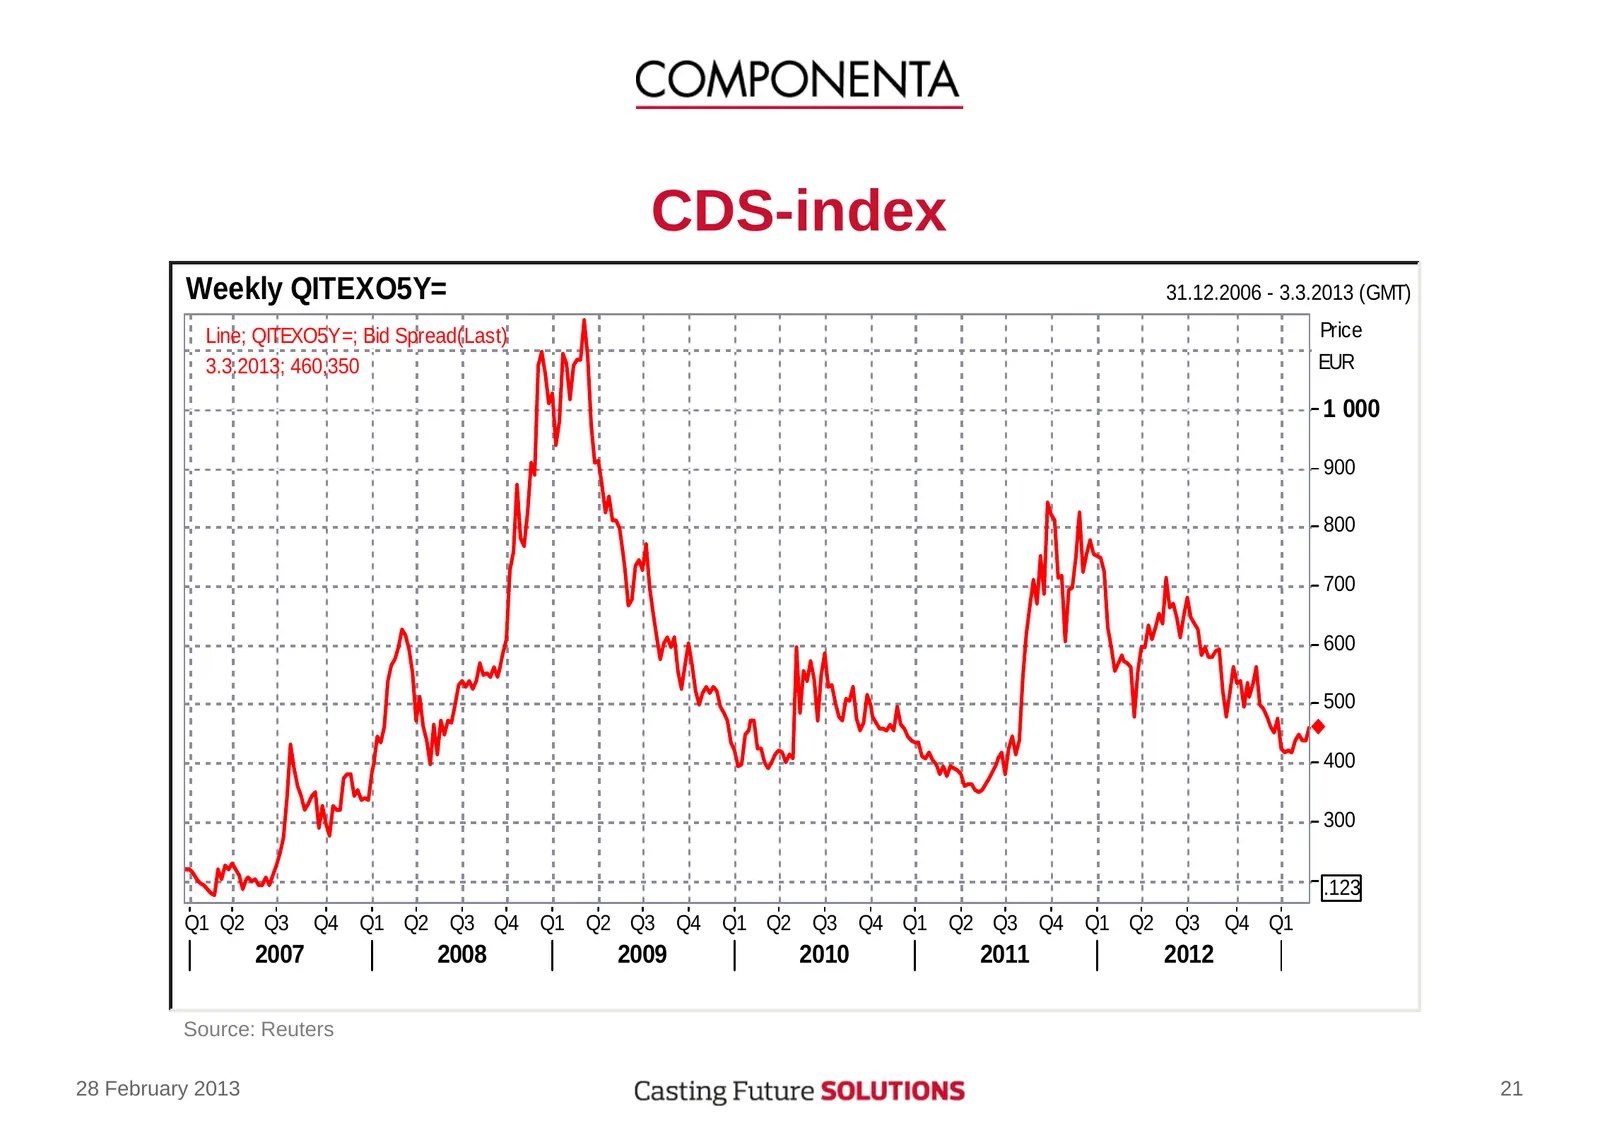
CDS-index Weekly QITEXO5Y= 31.12.2006 - 3.3.2013 (GMT) Line; QITEXO5Y=; Bid Spread(Last) Price 3.3.2013; 460,350 EUR 1 000 900 800 700 600 500 400 300 .123 Q1 Q2 Q3 Q4 Q1 Q2 Q3 Q4 Q1 Q2 Q3 Q4 Q1 Q2 Q3 Q4 Q1 Q2 Q3 Q4 Q1 Q2 Q3 Q4 Q1 2007 2008 2009 2010 2011 2012 Source: Reuters 28 February 2013 21

Slide 22: Development of sales and order book
Development of sales and order book 28 February 2013 22
Slide 23: Distribution of sales
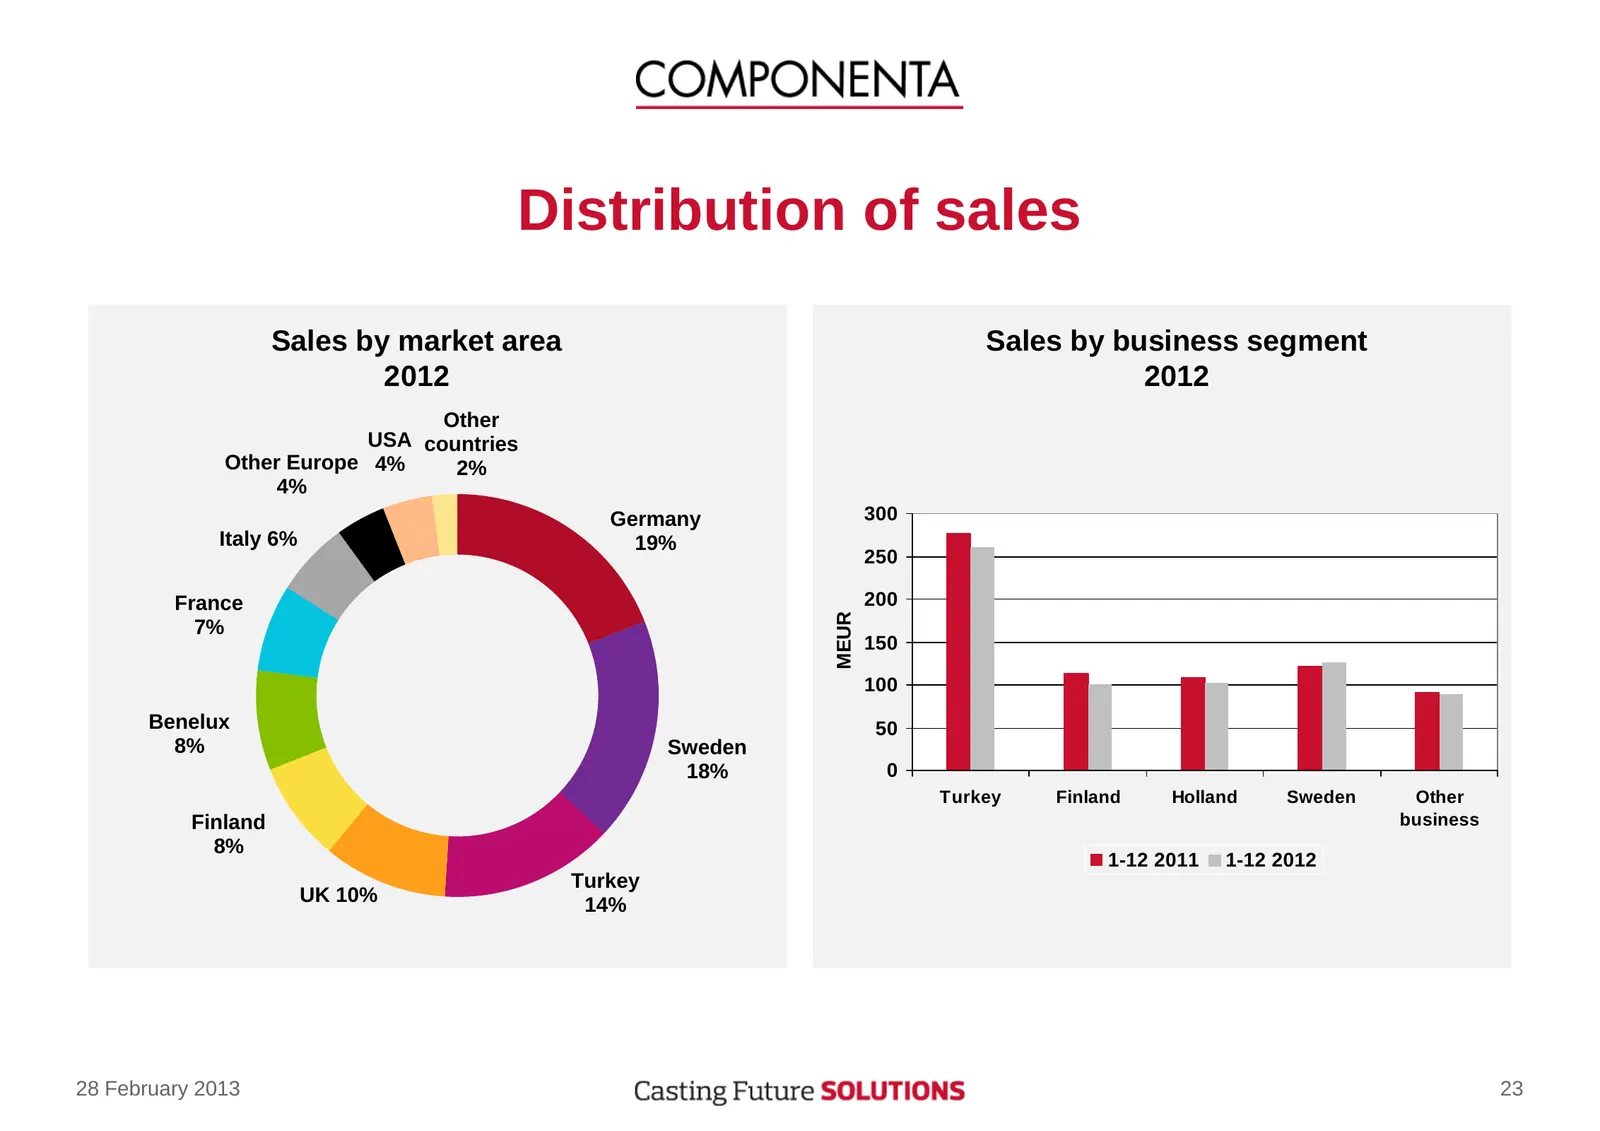
Distribution of sales Sales by market area Sales by business segment 2012 2012 Other USA countries Other Europe 4% 2% 4% Germany 300 Italy 6% 19% 250 France 200 MEUR 7% 150 100 Benelux 50 8% Sweden 18% 0 Turkey Finland Holland Sweden Other Finland business 8% 1-12 2011 1-12 2012 Turkey UK 10% 14% 28
Slide 24: Sales by customer industry 2012
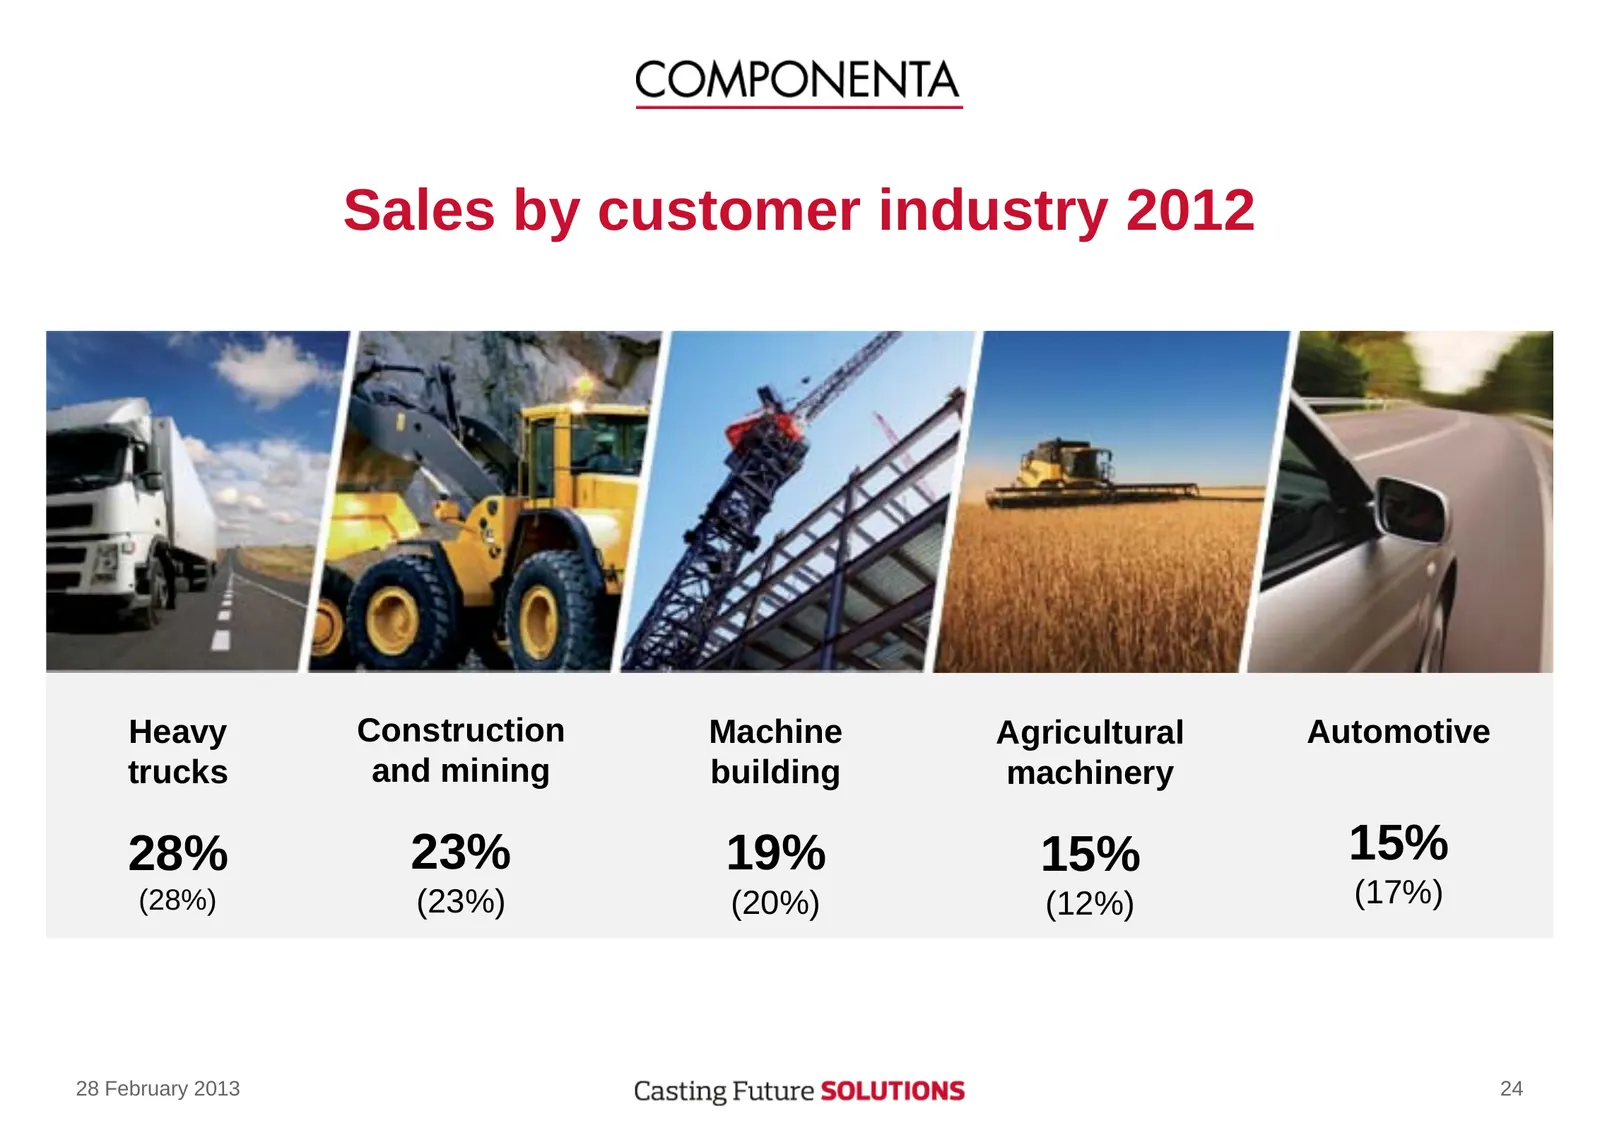
Sales by customer industry 2012 Heavy Construction Machine Agricultural Automotive trucks and mining building machinery 28% 23% 19% 15% 15% (28%) (23%) (20%) (12%) (17%) 28 February 2013 24
Slide 25: Development of sales and order book in heavy trucks industry
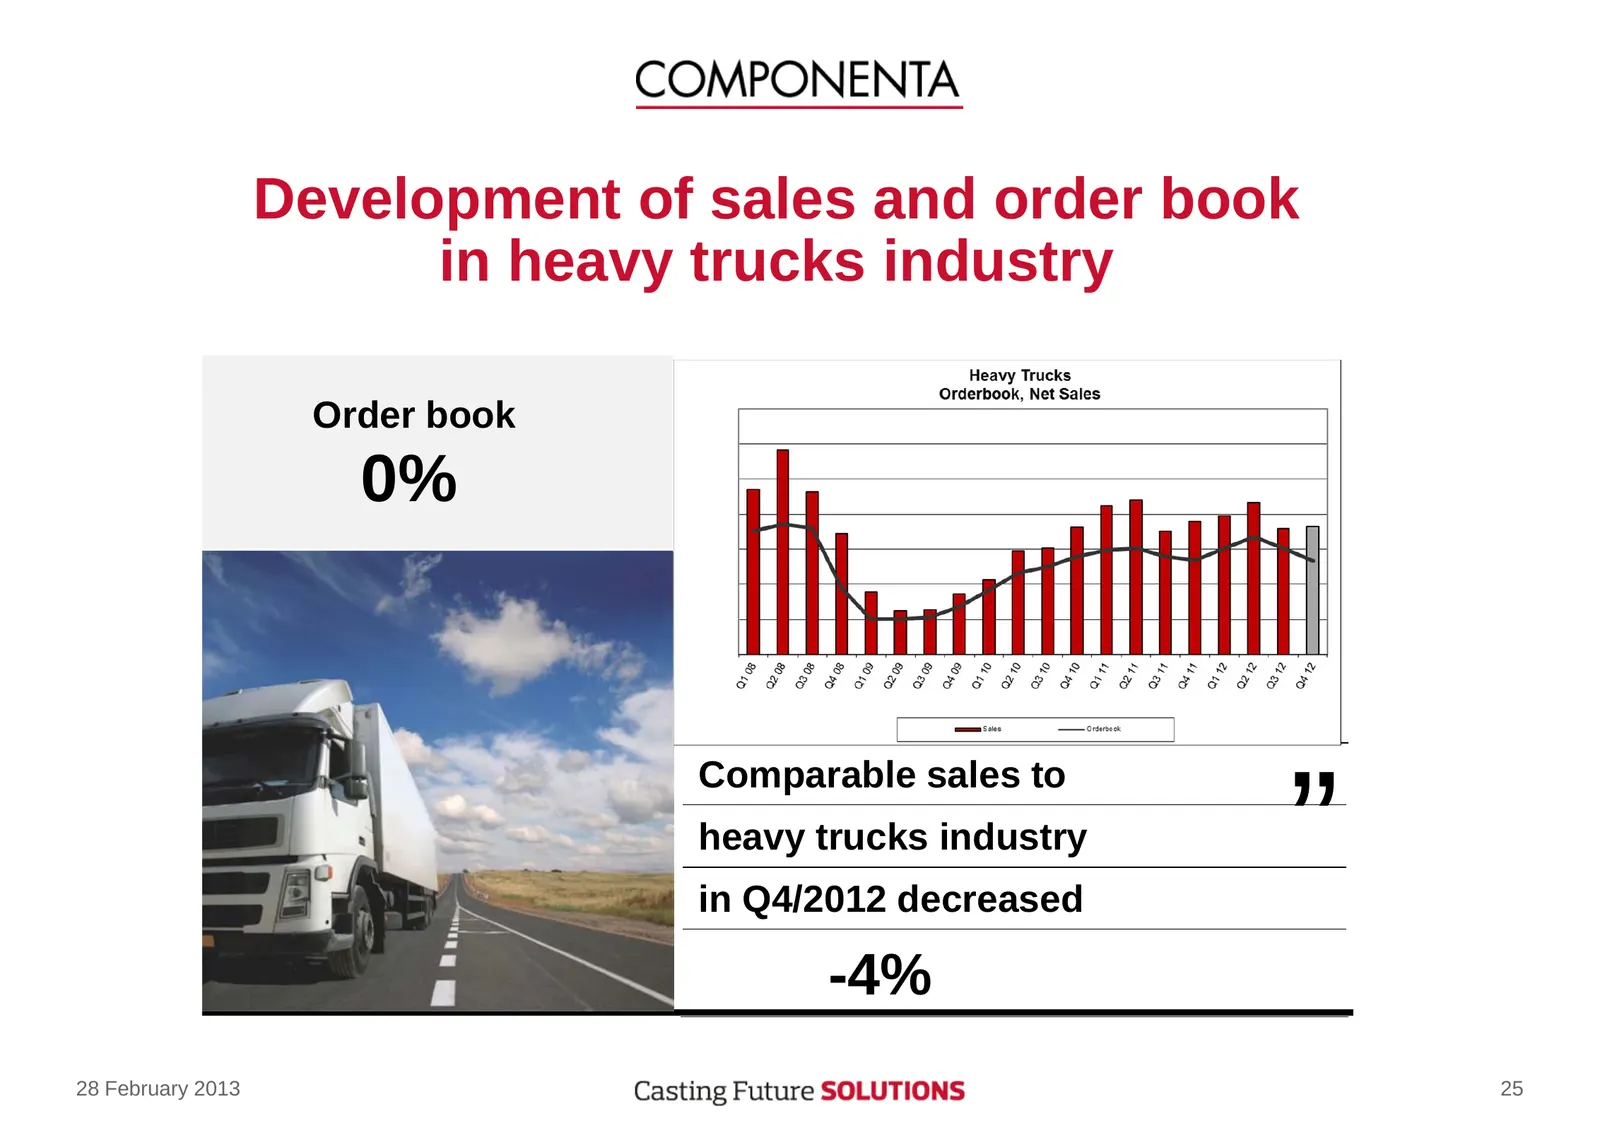
Development of sales and order book in heavy trucks industry Order book 0% Comparable sales to heavy trucks industry in Q4/2012 decreased ” -4% 28 February 2013 25
Slide 26: Development of supply chain in heavy trucks industry
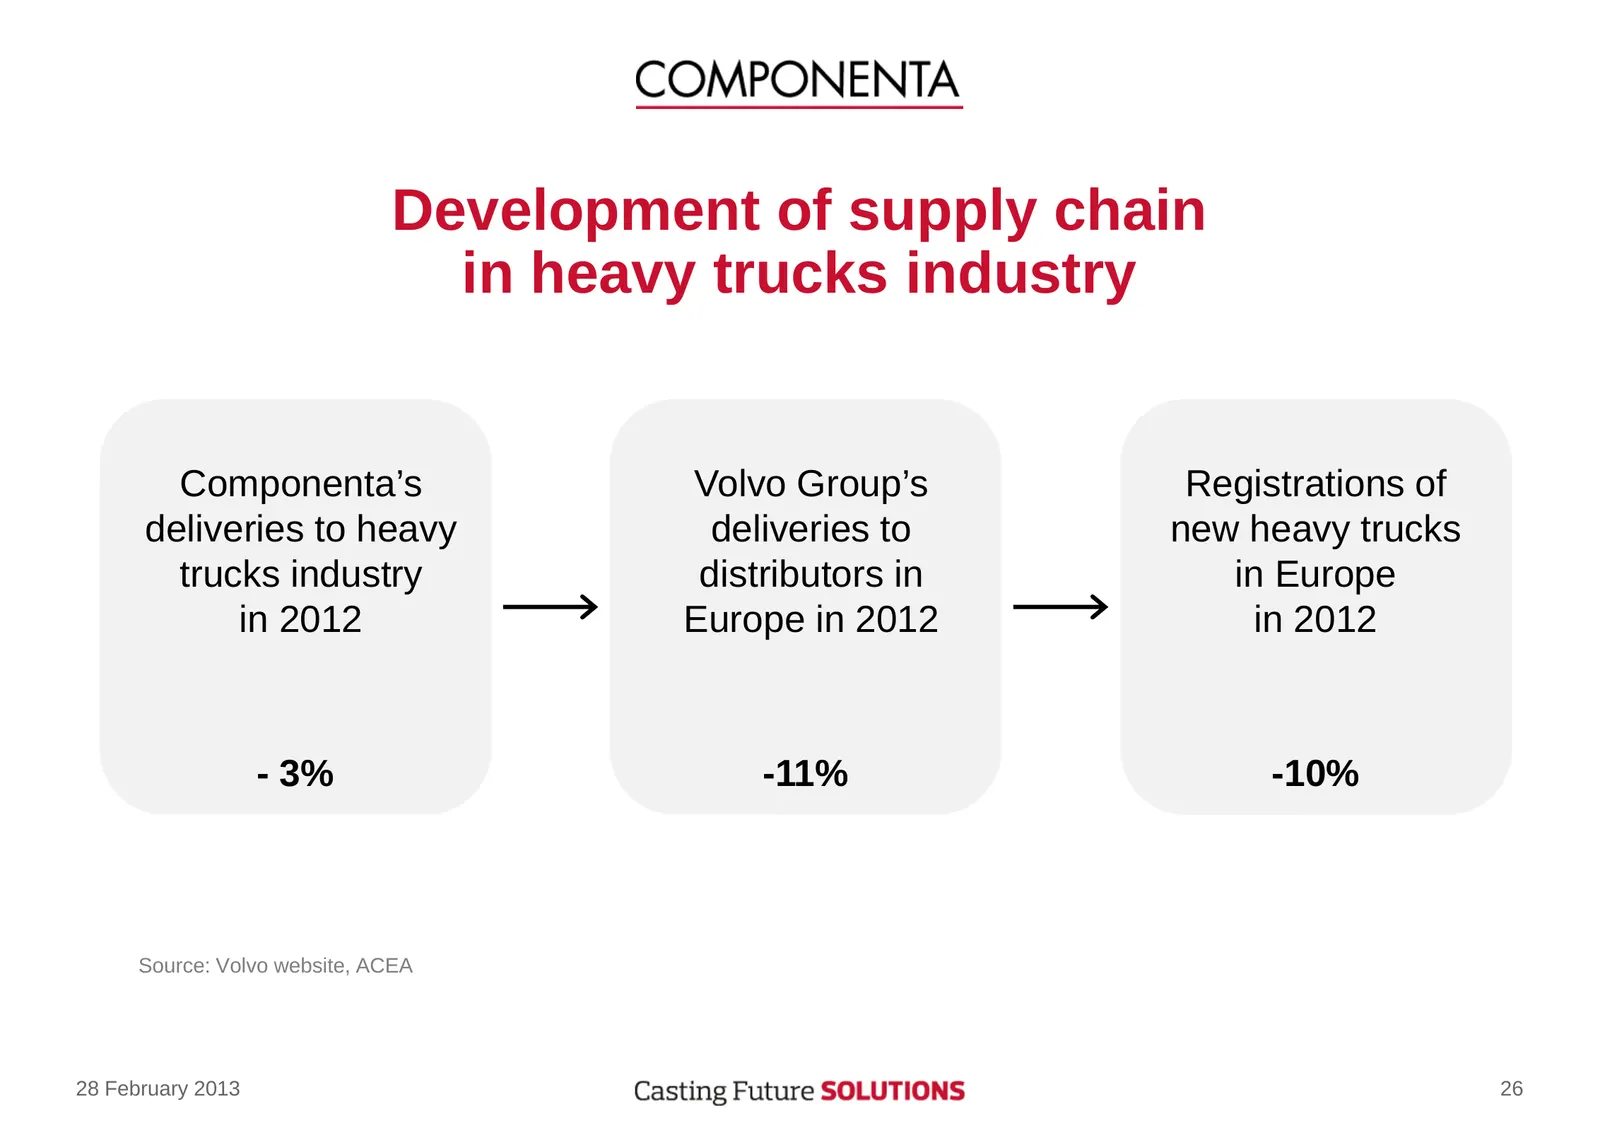
Development of supply chain in heavy trucks industry Componenta’s Volvo Group’s Registrations of deliveries to heavy deliveries to new heavy trucks trucks industry distributors in in Europe in 2012 Europe in 2012 in 2012 - 3% -11% -10% Source: Volvo website, ACEA 28 February 2013 26
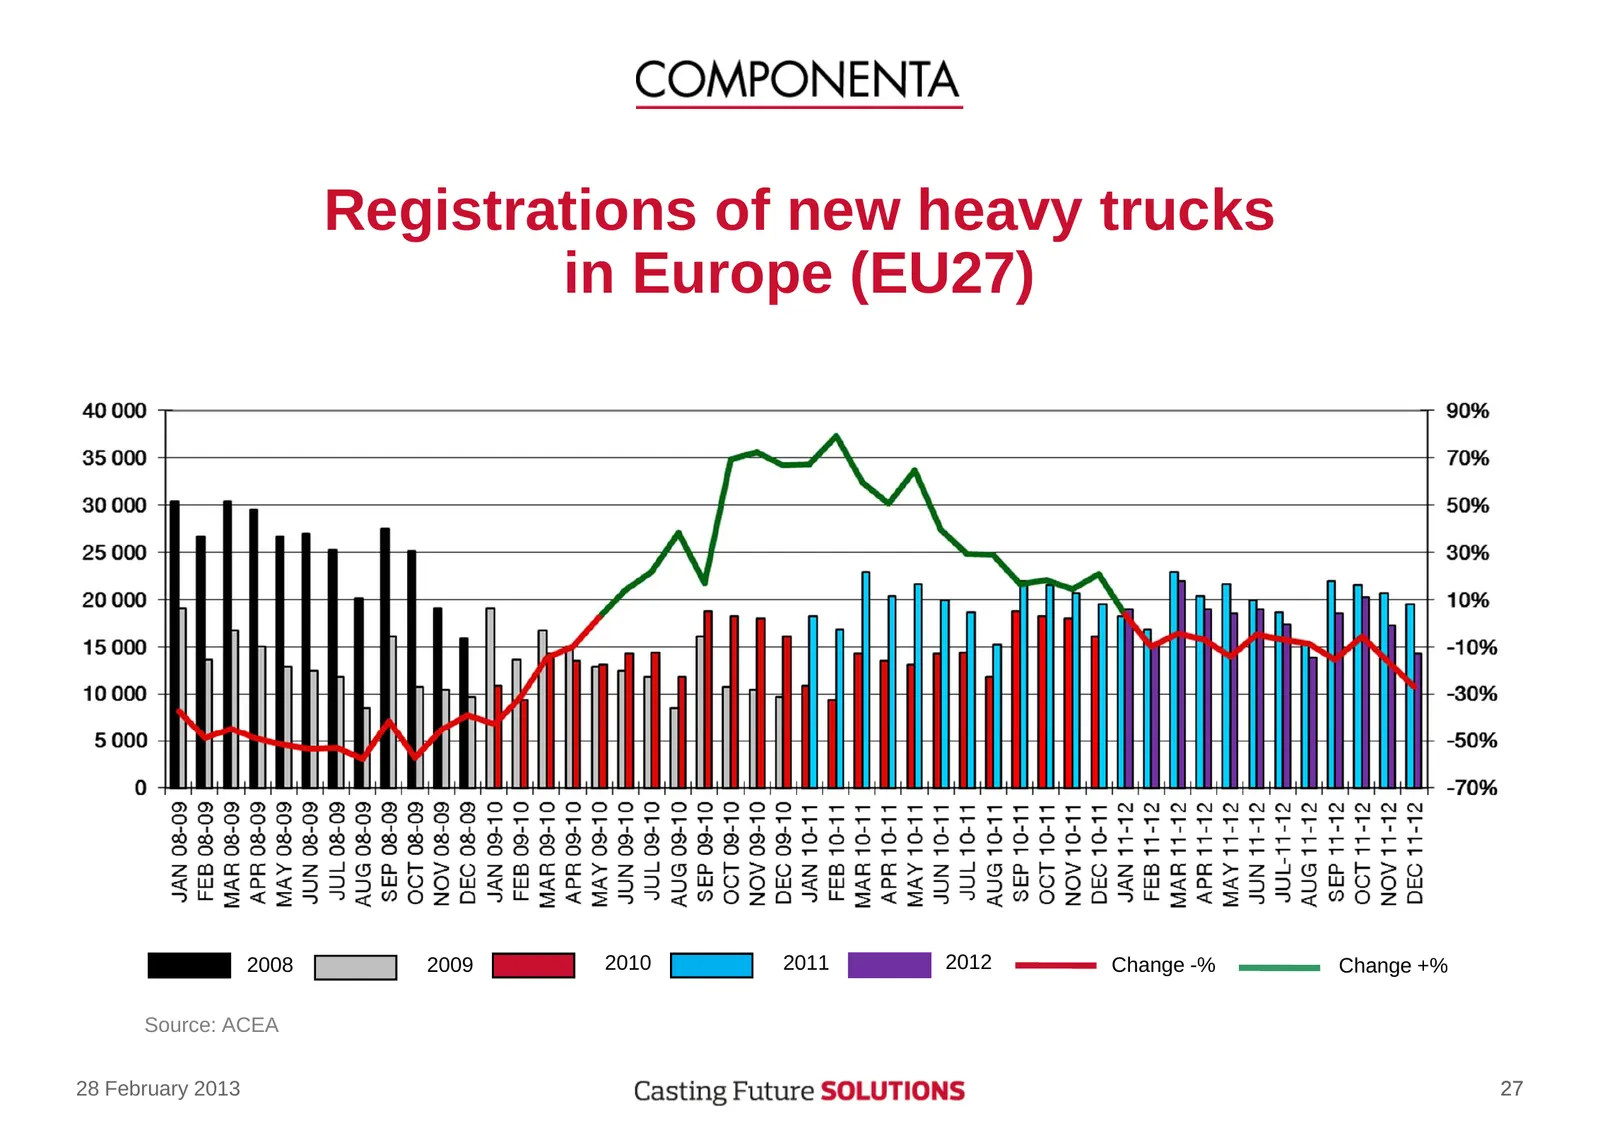
Slide 27: Registrations of new heavy trucks in Europe (EU27)
Registrations of new heavy trucks in Europe (EU27) 2008 2009 2010 2011 2012 Change -% Change +% Source: ACEA 28 February 2013 27
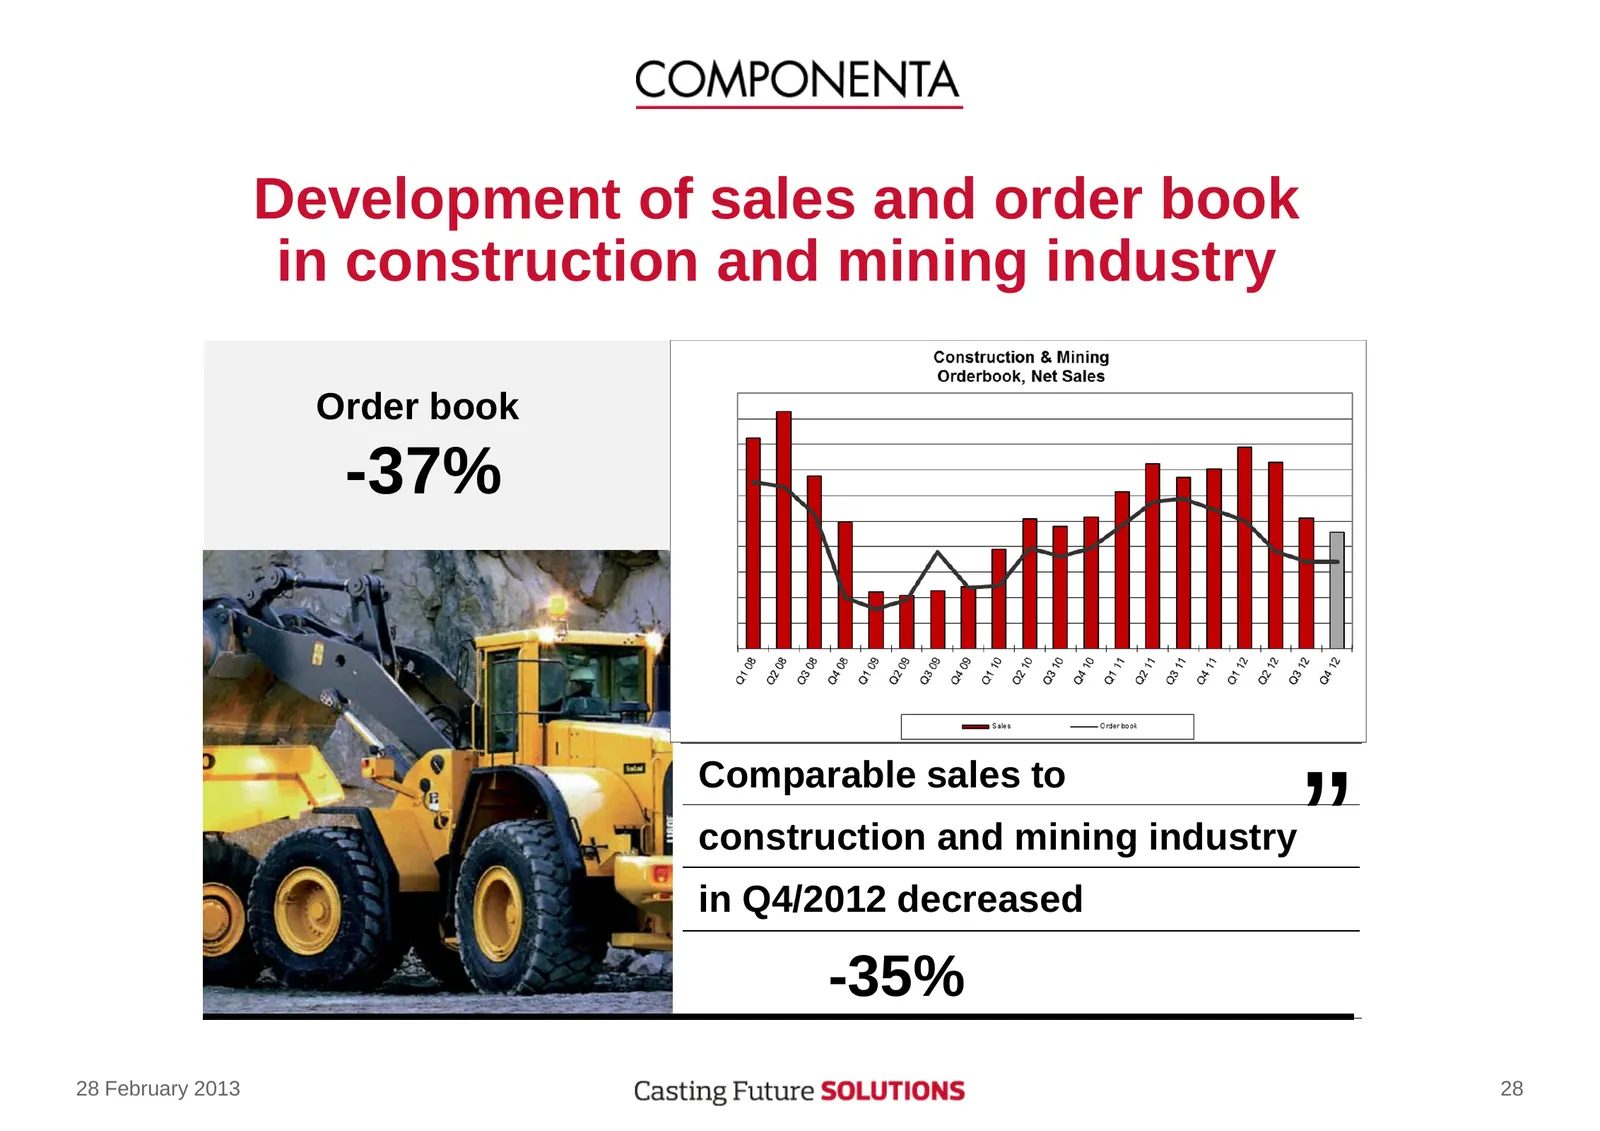
Slide 28: Development of sales and order book in construction and mining industry
Development of sales and order book in construction and mining industry Order book -37% Comparable sales to construction and mining industry in Q4/2012 decreased ” -35% 28 February 2013 28
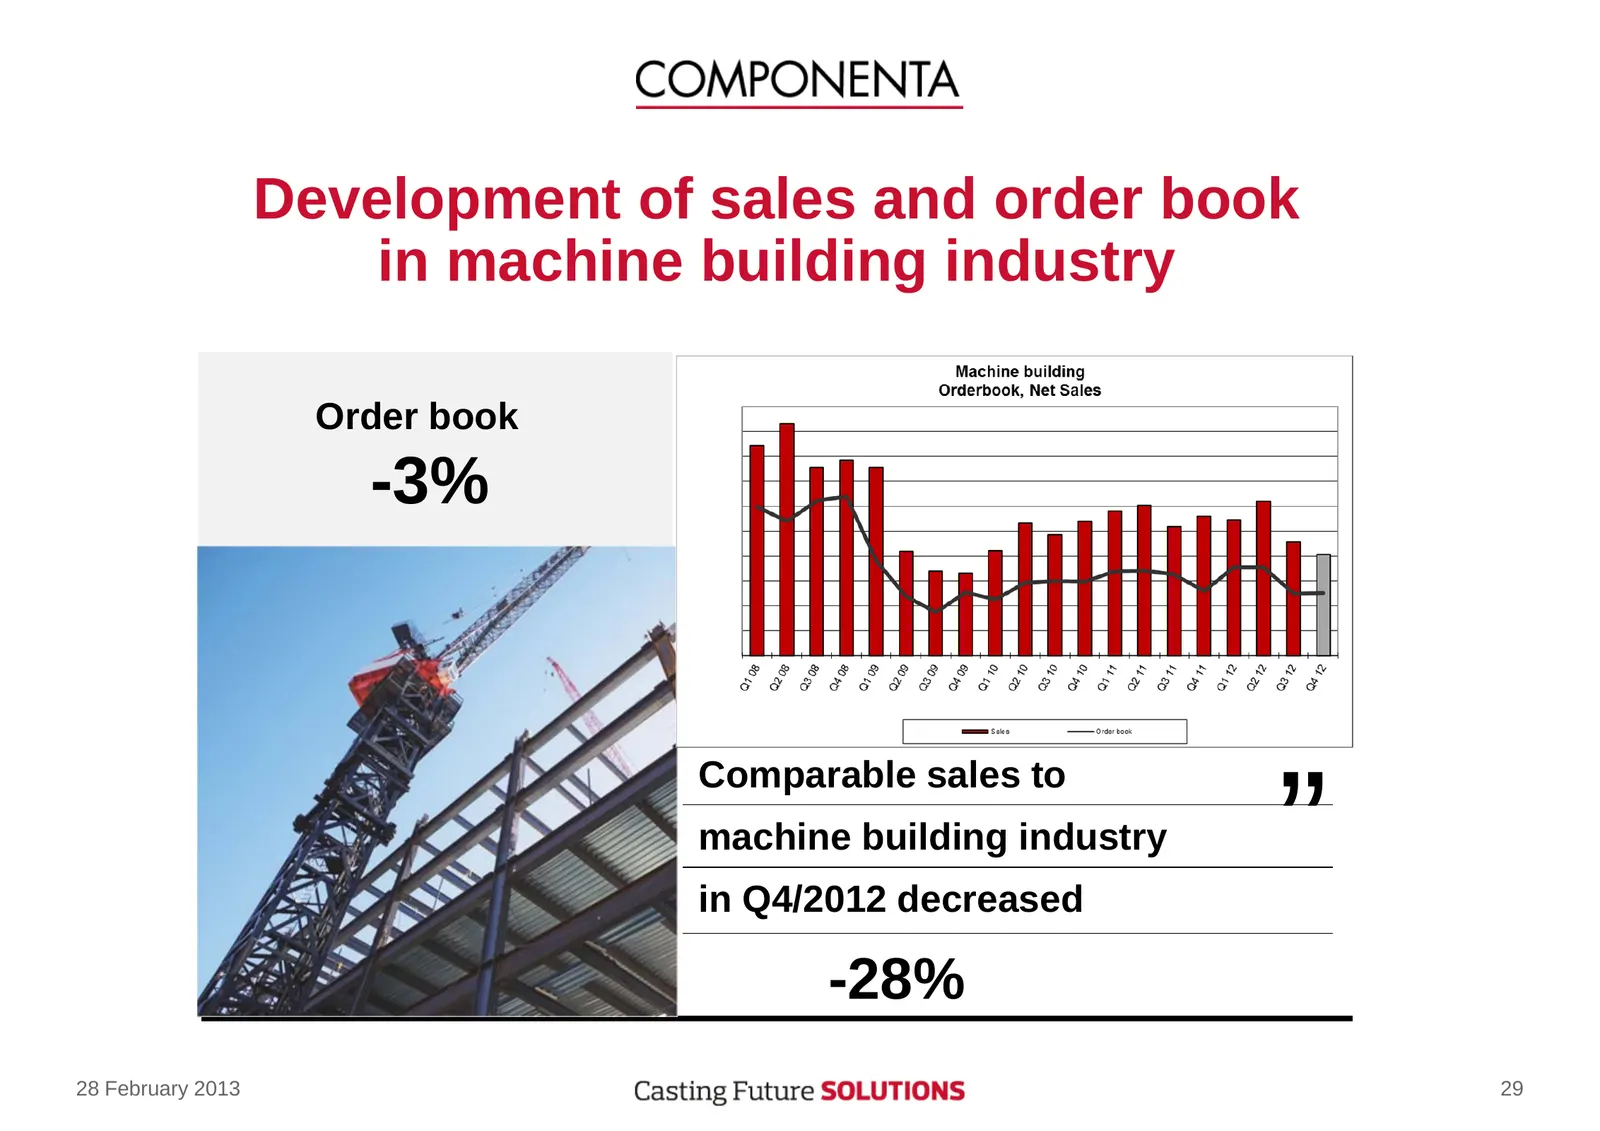
Slide 29: Development of sales and order book in machine building industry
Development of sales and order book in machine building industry Order book -3% Comparable sales to machine building industry in Q4/2012 decreased ” -28% 28 February 2013 29
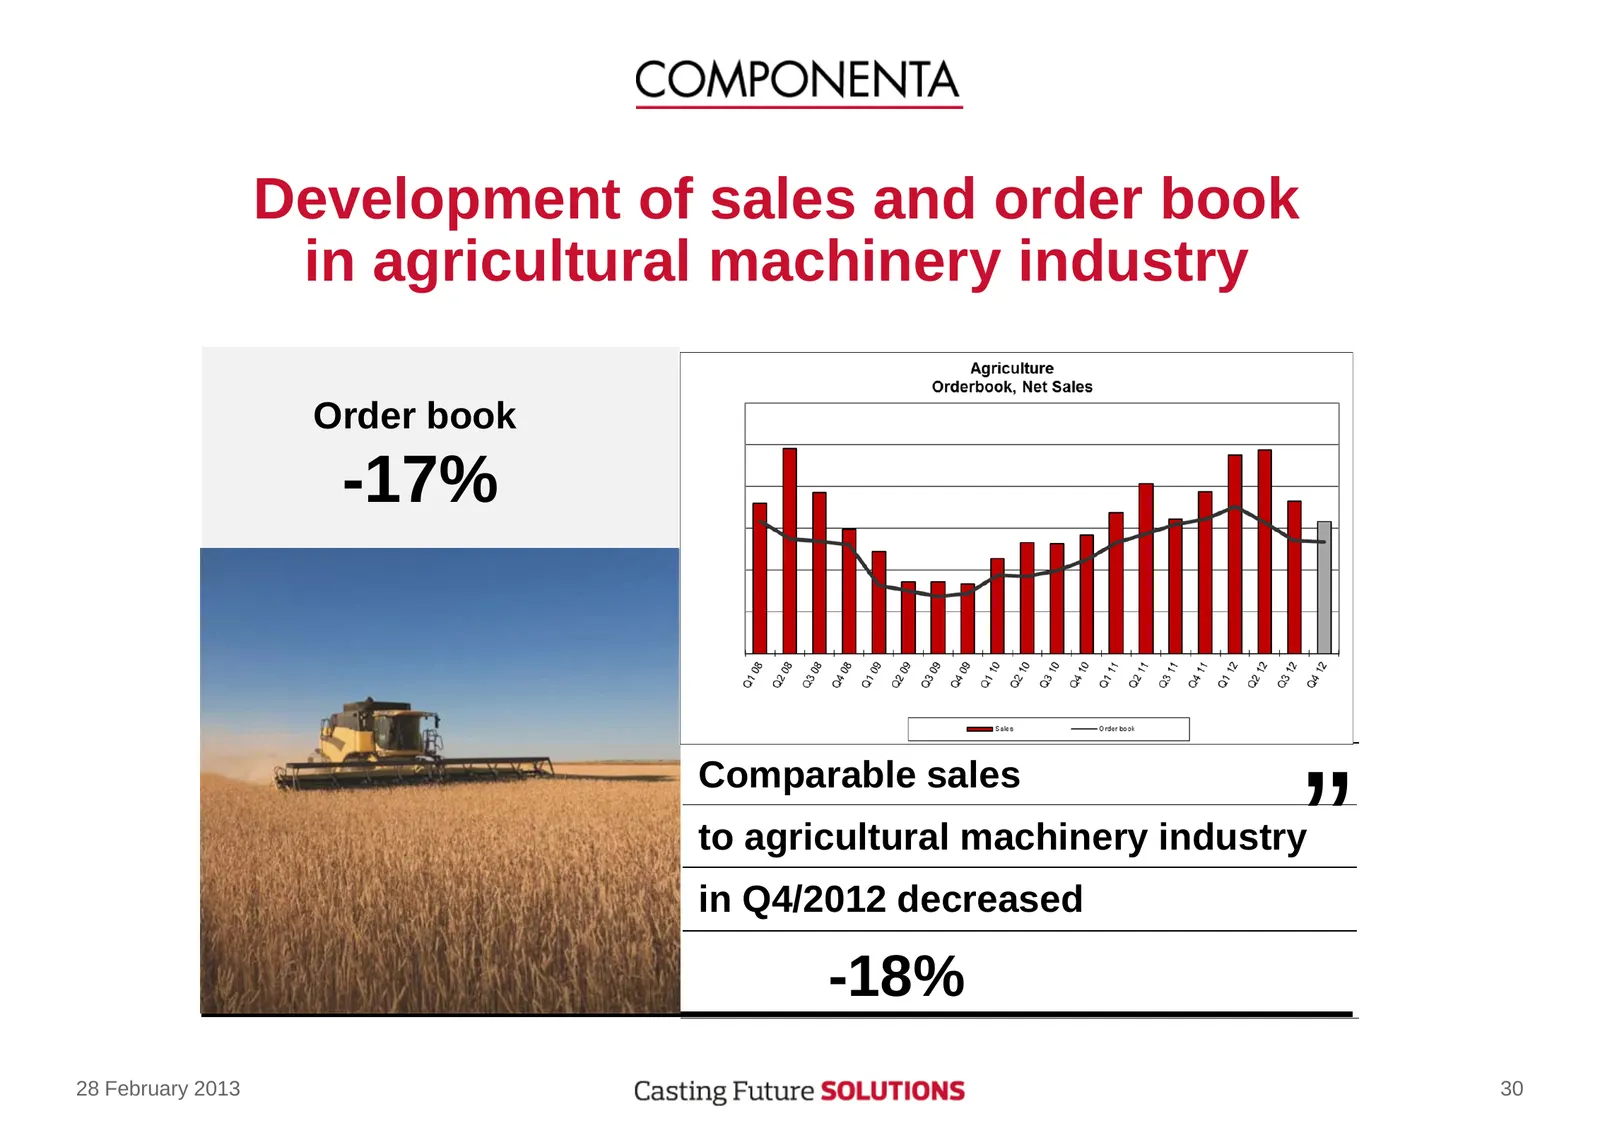
Slide 30: Development of sales and order book in agricultural machinery industry
Development of sales and order book in agricultural machinery industry Order book -17% Comparable sales ” to agricultural machinery industry in Q4/2012 decreased -18% 28 February 2013 30
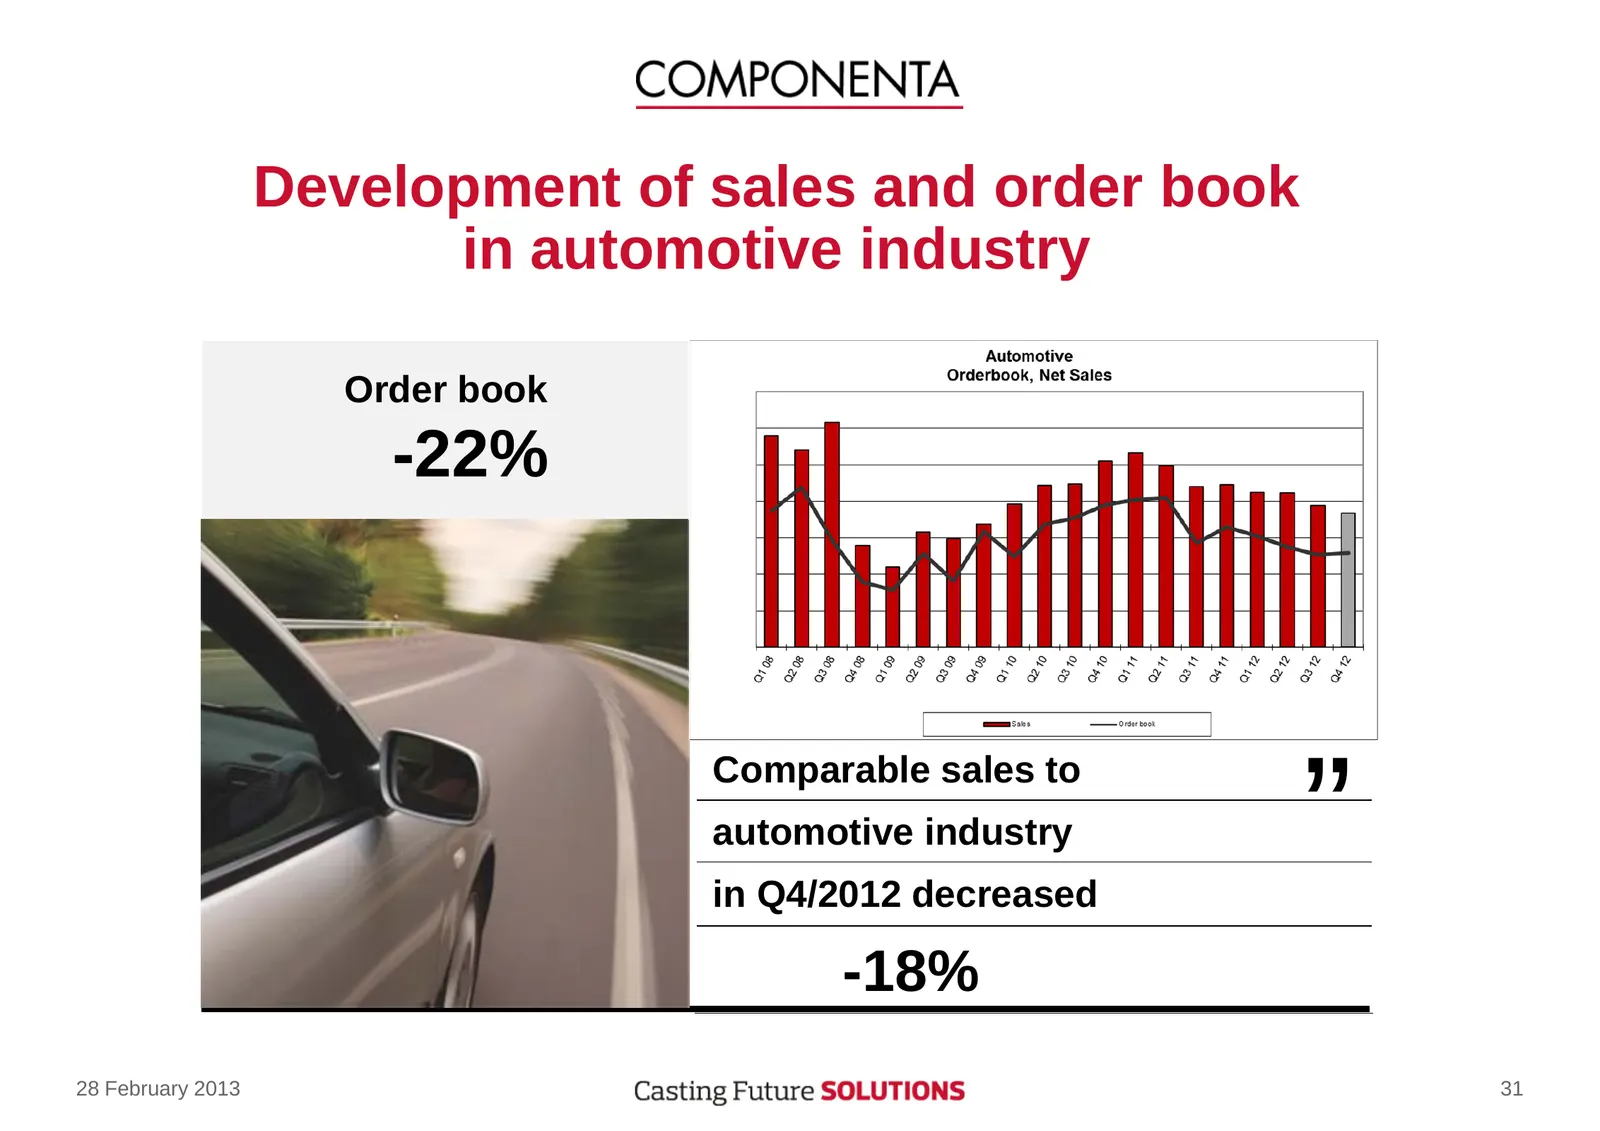
Slide 31: Development of sales and order book in automotive industry
Development of sales and order book in automotive industry Order book -22% ” Comparable sales to automotive industry in Q4/2012 decreased -18% 28 February 2013 31
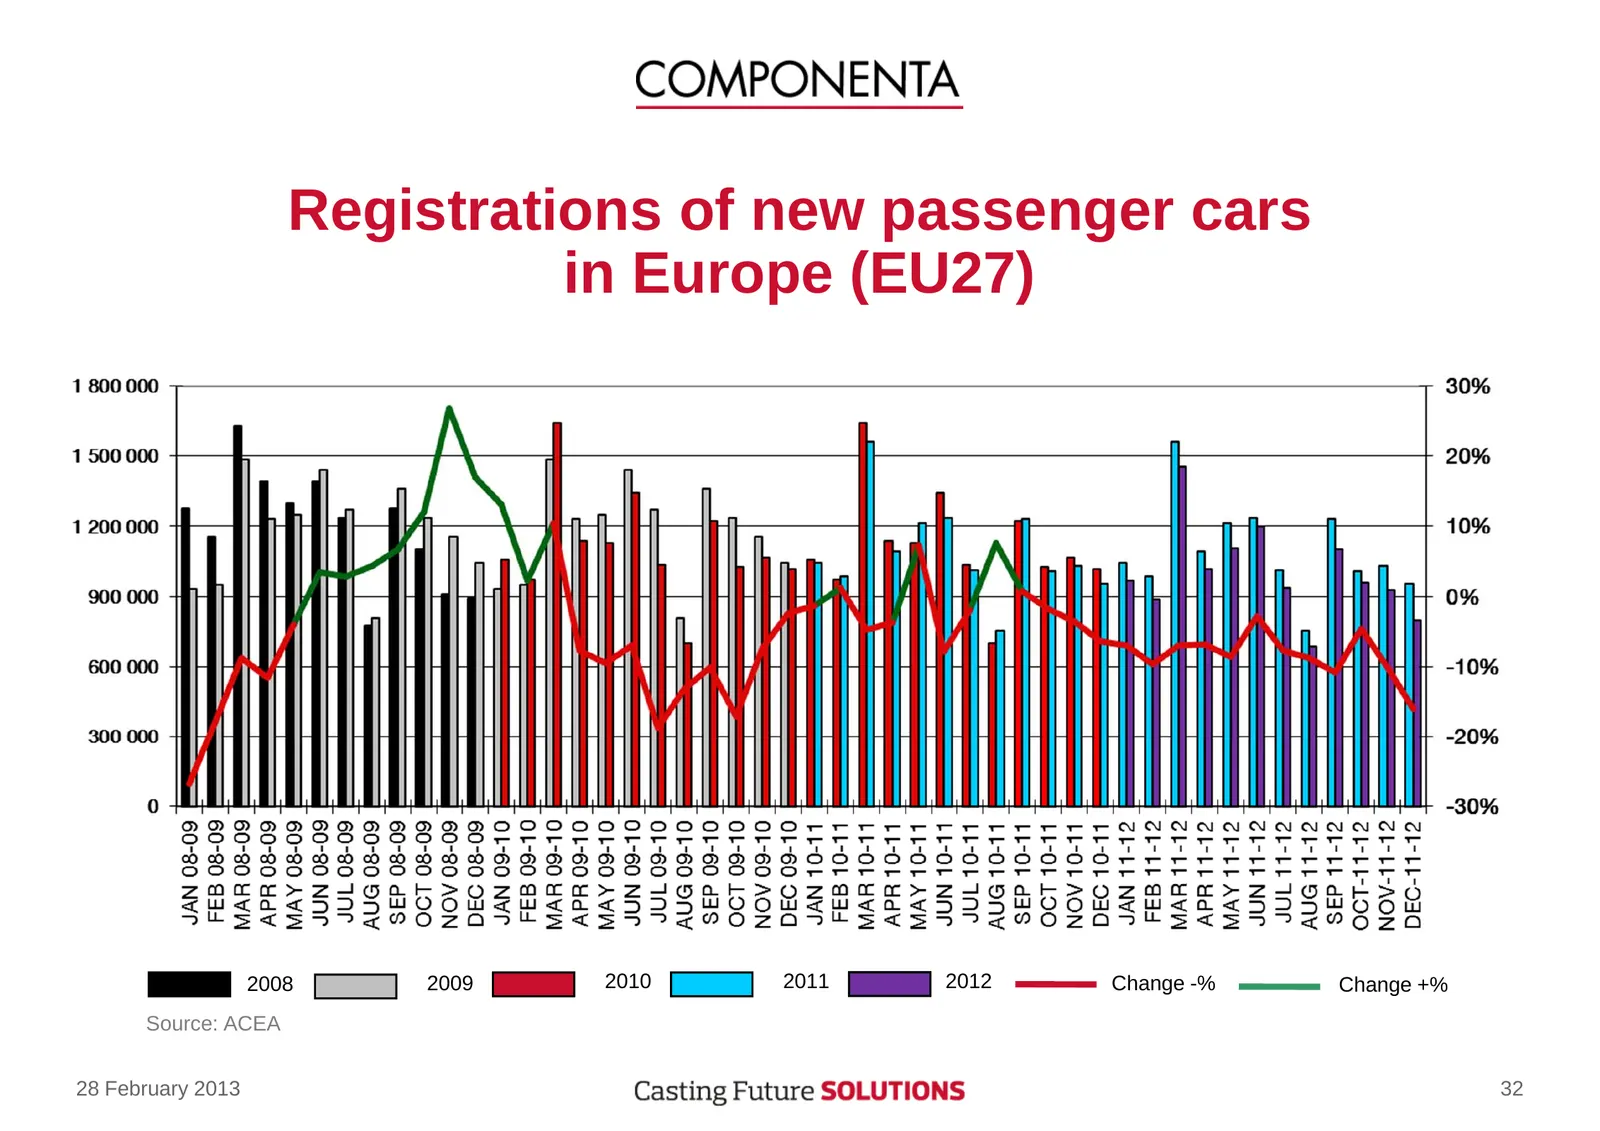
Slide 32: Registrations of new passenger cars in Europe (EU27)
Registrations of new passenger cars in Europe (EU27) 2008 2009 2010 2011 2012 Change -% Change +% Source: ACEA 28 February 2013 32
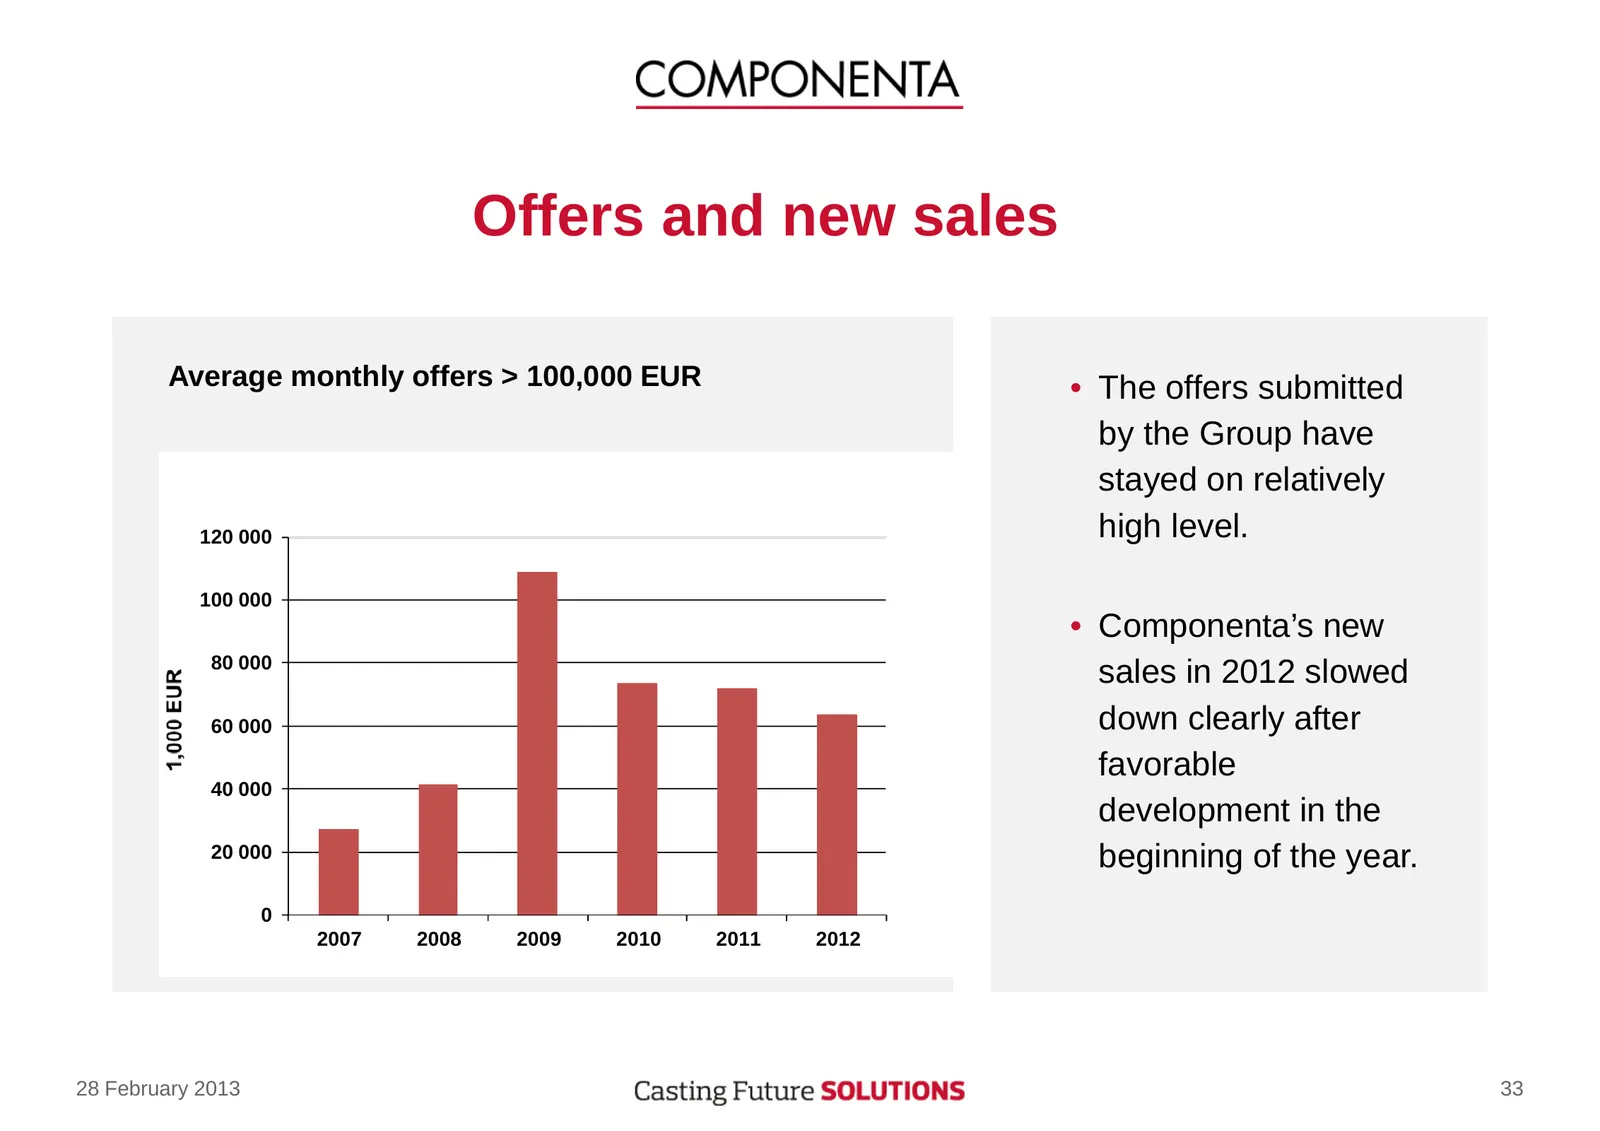
Slide 33: Offers and new sales
Offers and new sales Average monthly offers > 100,000 EUR • The offers submitted by the Group have stayed on relatively 120 000 high level. 100 000 • Componenta’s new 80 000 sales in 2012 slowed 60 000 down clearly after favorable 40 000 development in the 20 000 beginning of the year. 0 2007 2008 2
Slide 34: Development of business segments
Development of business segments 28 February 2013 34
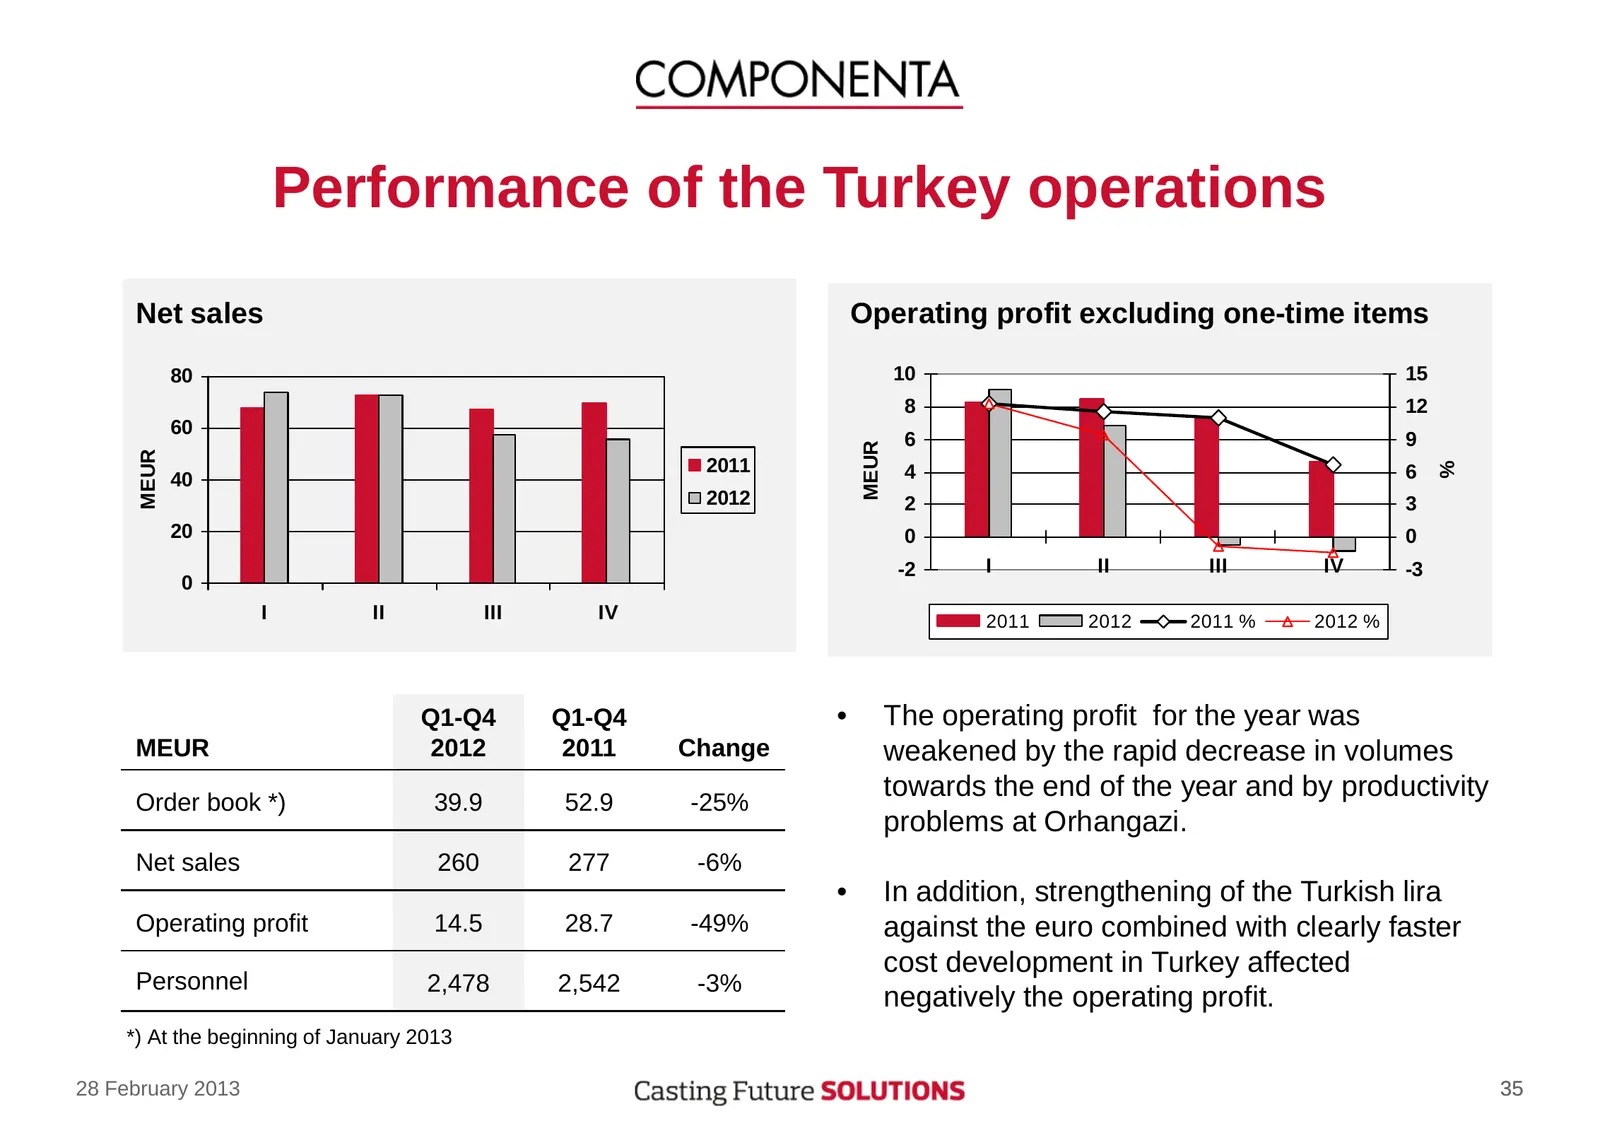
Slide 35: Performance of the Turkey operations
Performance of the Turkey operations Net sales Operating profit excluding one-time items 80 10 15 8 12 60 6 9 MEUR MEUR 2011 % 40 4 6 2012 2 3 20 0 0 -2 I II III IV -3 0 I II III IV 2011 2012 2011 % 2012 % Q1-Q4 Q1-Q4 • The operating profit for the year was MEUR 2012 2011 Change weakened by the rapi
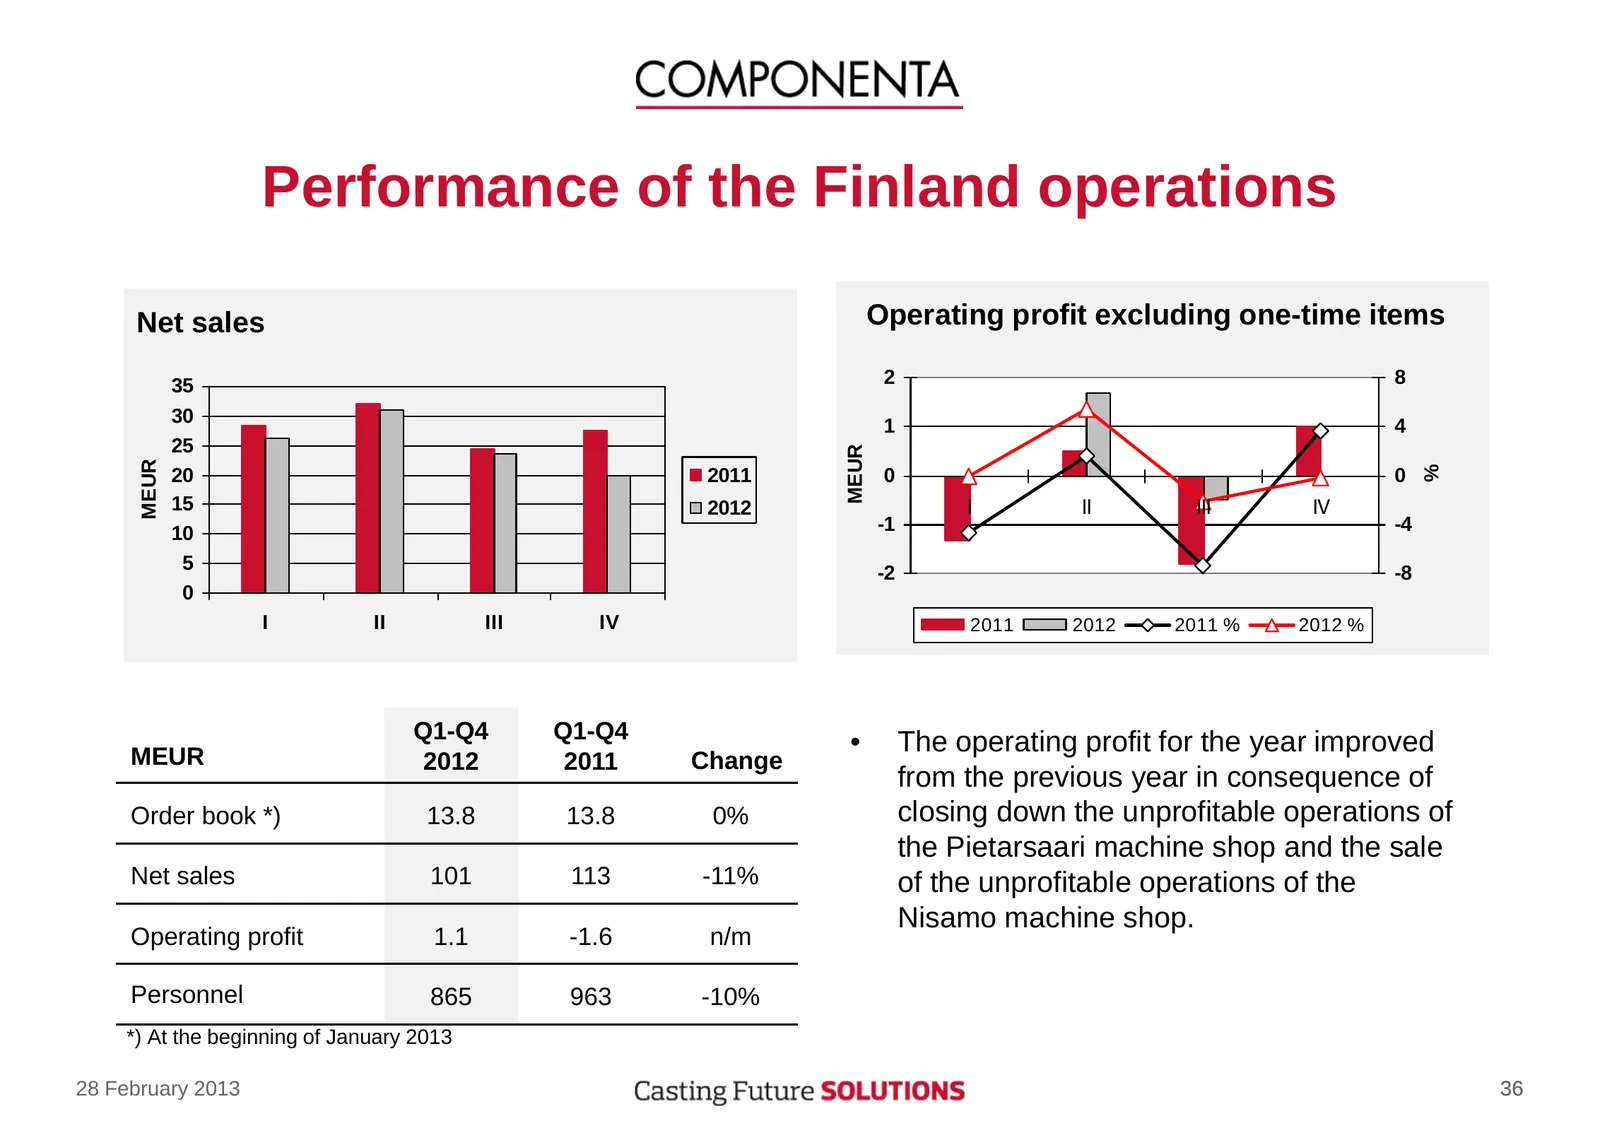
Slide 36: Performance of the Finland operations
Performance of the Finland operations Net sales Operating profit excluding one-time items 35 2 8 30 1 4 25 MEUR MEUR % 20 2011 0 0 15 2012 f ff fff fs 10 -1 -4 5 -2 -8 0 I II III IV 2011 2012 2011 % 2012 % Q1-Q4 Q1-Q4 • The operating profit for the year improved MEUR 2012 2011 Change from the previo
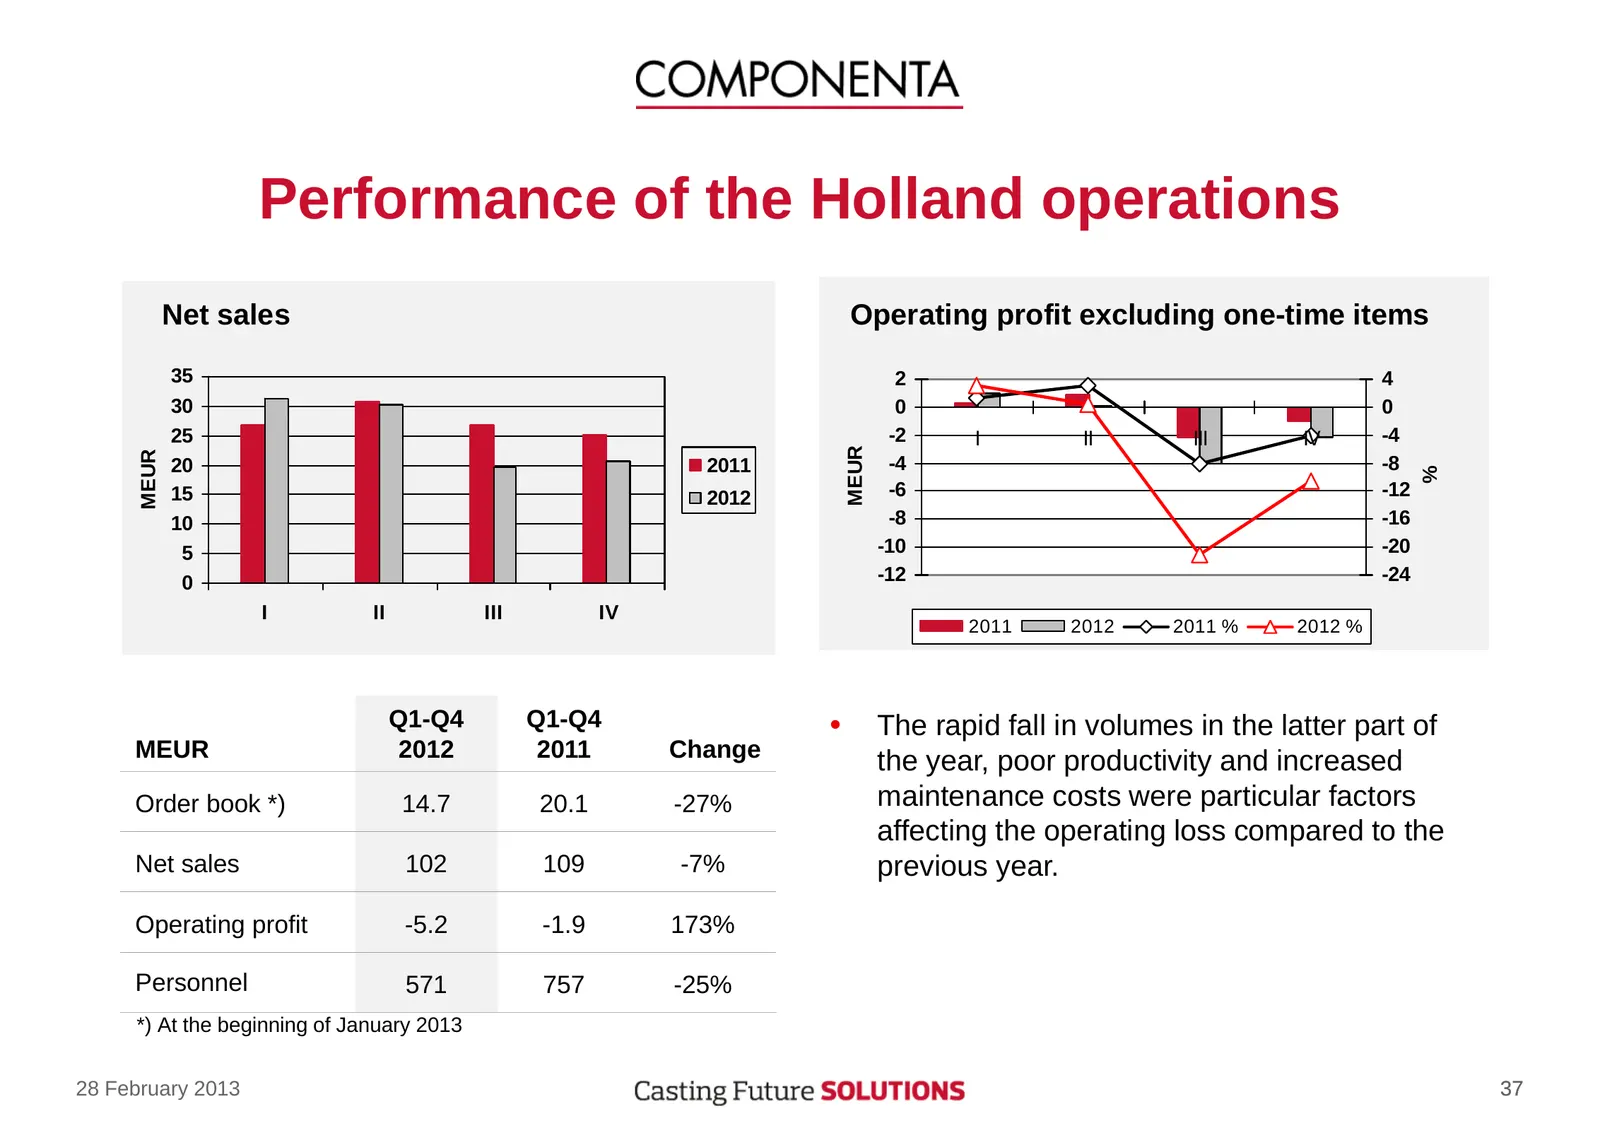
Slide 37: Performance of the Holland operations
Performance of the Holland operations Net sales Operating profit excluding one-time items 35 2 4 30 0 0 25 -2 f ff fff fs -4 MEUR MEUR 20 2011 -4 -8 % 15 2012 -6 -12 10 -8 -16 5 -10 -20 0 -12 -24 I II III IV 2011 2012 2011 % 2012 % Q1-Q4 Q1-Q4 • The rapid fall in volumes in the latter part of MEUR 2
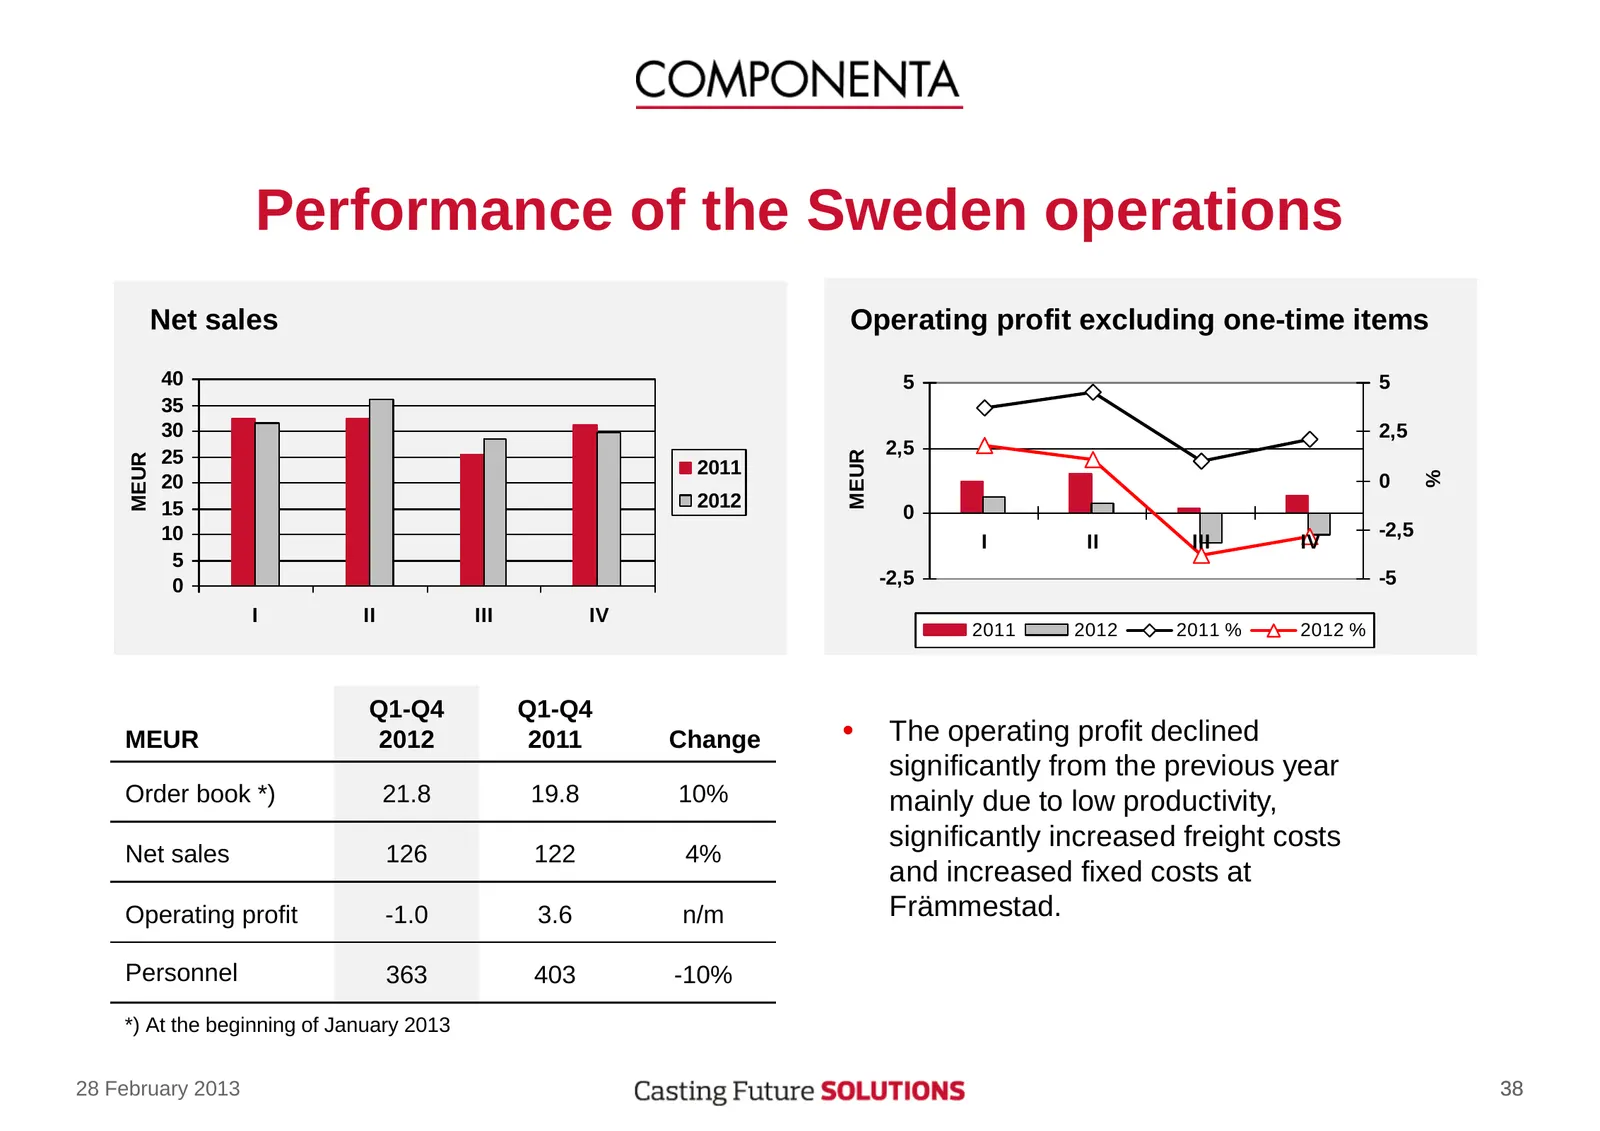
Slide 38: Performance of the Sweden operations
Performance of the Sweden operations Net sales Operating profit excluding one-time items 40 5 5 35 30 2,5 25 2,5 MEUR MEUR 2011 % 20 0 15 2012 0 10 -2,5 I II III IV 5 0 -2,5 -5 I II III IV 2011 2012 2011 % 2012 % Q1-Q4 Q1-Q4 MEUR 2012 2011 Change • The operating profit declined significantly from th
Slide 39: Events after the review period
Events after the review period 28 February 2013 39
Slide 40: Events after the review period
Events after the review period • In February Componenta decided to postpone the publishing of the financial statements for 2012 due to the change of the accounting principles. In the financial statements for the year 2012 Componenta will apply the re-valuation of the properties according to IAS 16 i

Slide 41: Business environment 2013
Business environment 2013 28 February 2013 41
Slide 42: Business environment 2013
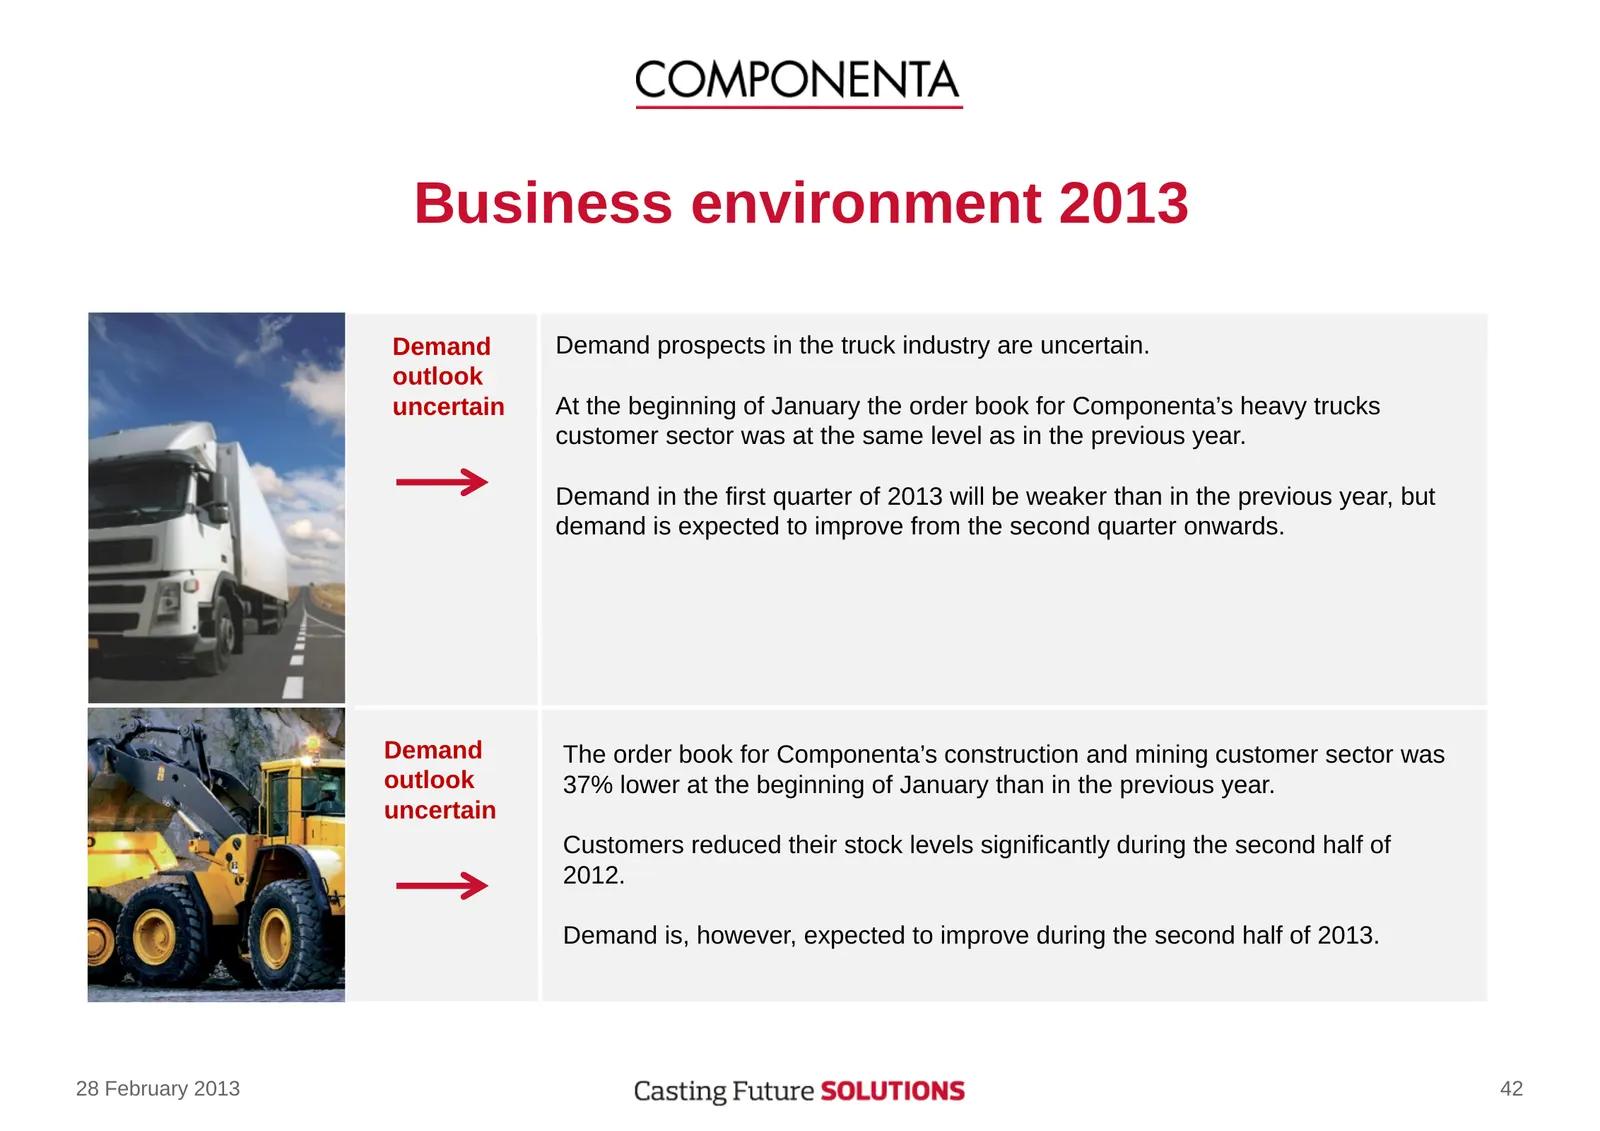
Business environment 2013 Demand Demand prospects in the truck industry are uncertain. outlook uncertain At the beginning of January the order book for Componenta’s heavy trucks customer sector was at the same level as in the previous year. Demand in the first quarter of 2013 will be weaker than in
Slide 43: Business environment 2013
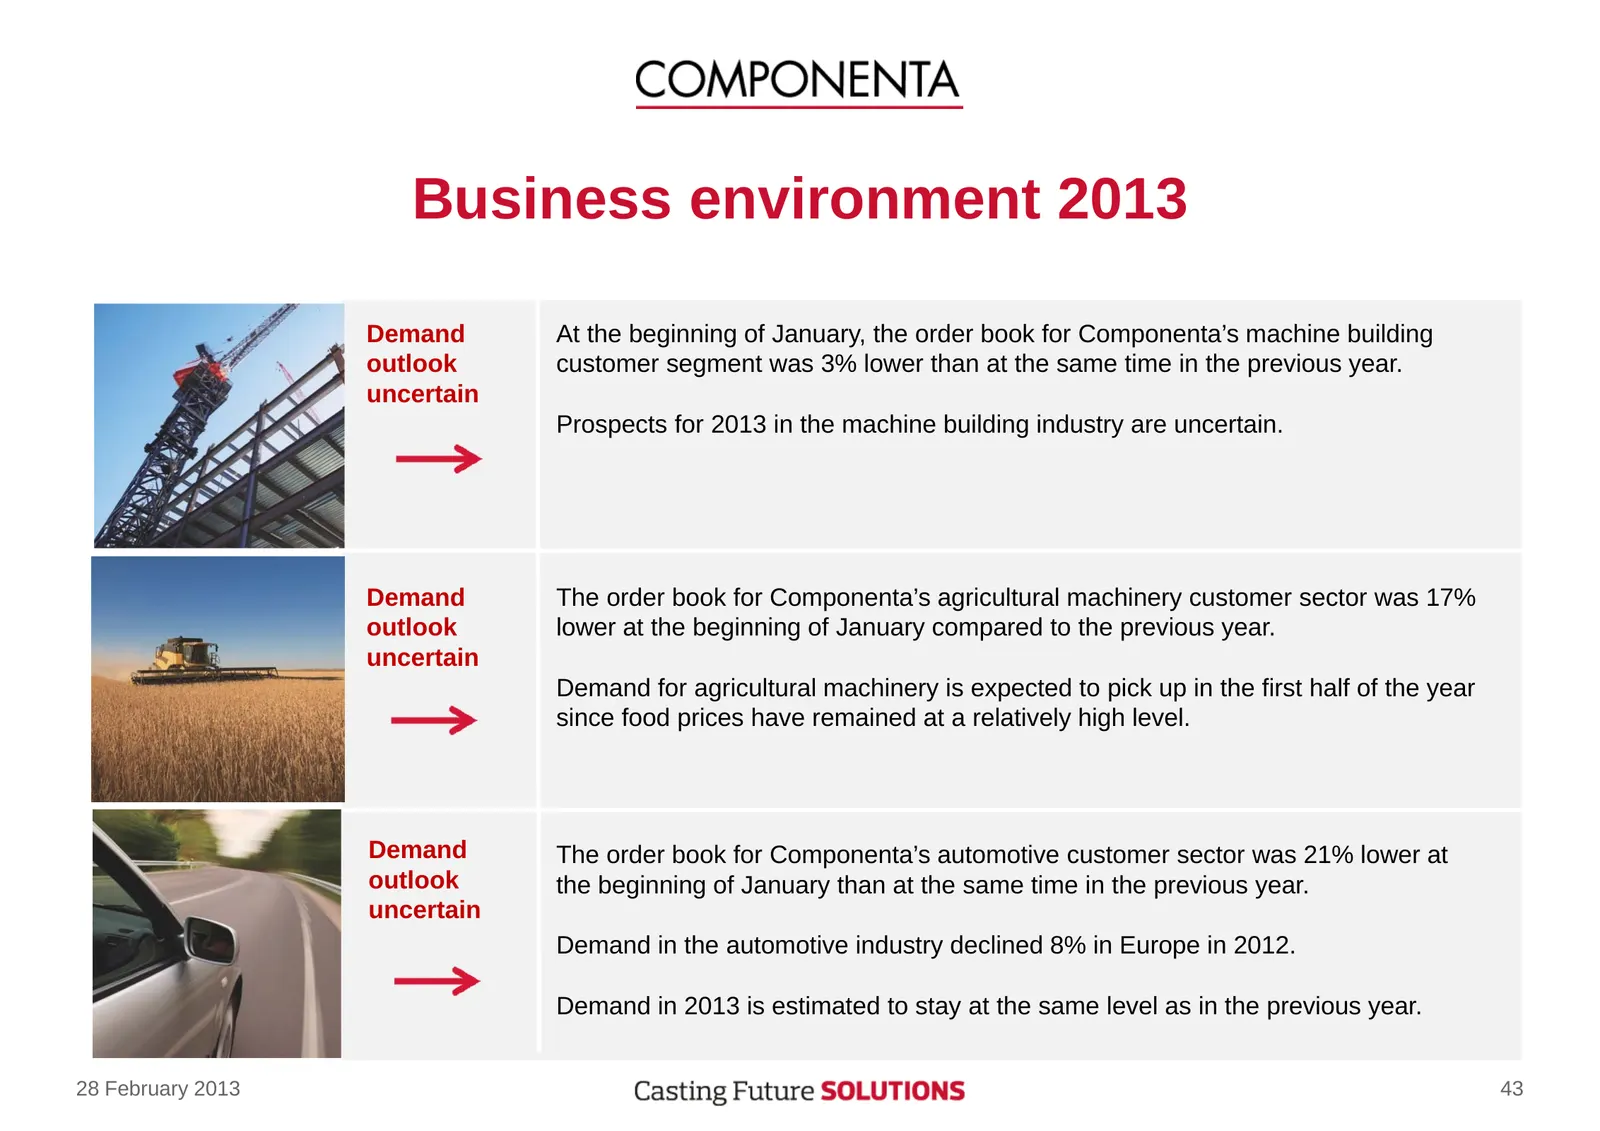
Business environment 2013 Demand At the beginning of January, the order book for Componenta’s machine building outlook customer segment was 3% lower than at the same time in the previous year. uncertain Prospects for 2013 in the machine building industry are uncertain. Demand The order book for Comp

Slide 44: Componenta prospects 2013
Componenta prospects 2013 28 February 2013 44
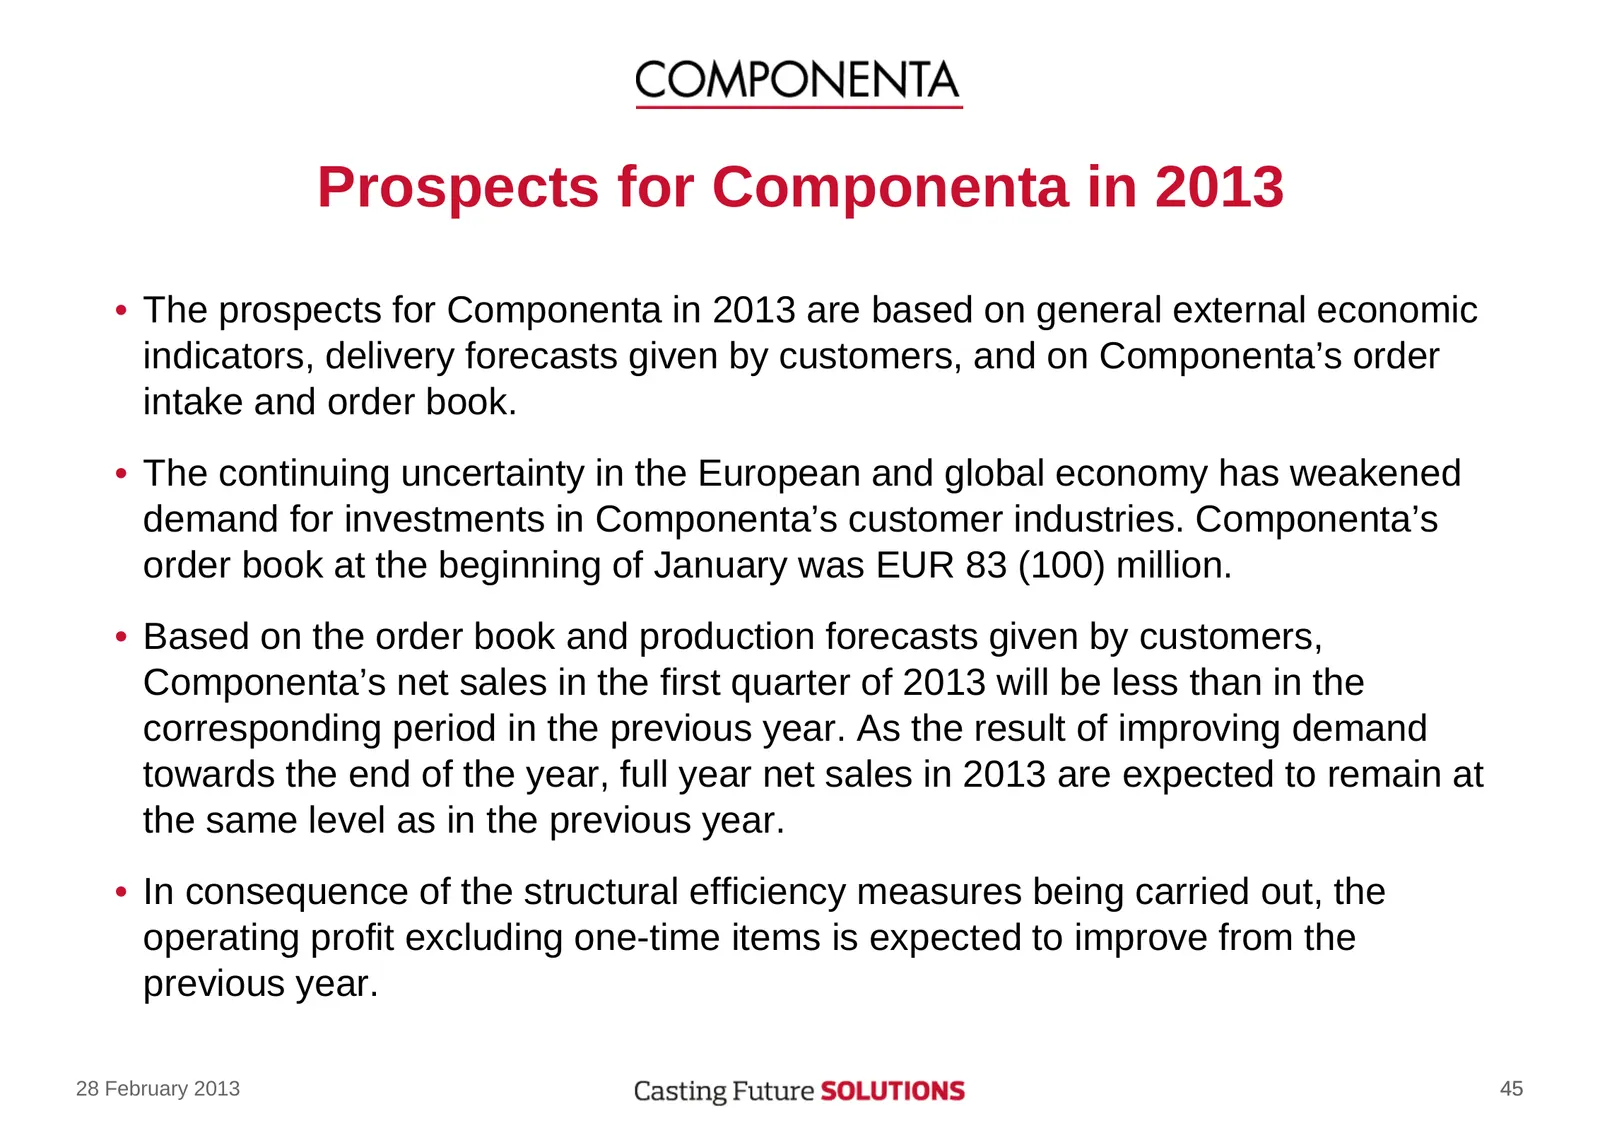
Slide 45: Prospects for Componenta in 2013
Prospects for Componenta in 2013 • The prospects for Componenta in 2013 are based on general external economic indicators, delivery forecasts given by customers, and on Componenta’s order intake and order book. • The continuing uncertainty in the European and global economy has weakened demand for i

Slide 46: 28 February 2013
28 February 2013 46
Source: Internet Archive copy of componenta.com
More decks from Componenta Oyj
 H1 2026 Earnings Presentation11 slides · Jul 23, 2026
 Q1 2026 Earnings Presentation10 slides · May 8, 2026
 FY2025 Earnings Presentation11 slides · Mar 6, 2026
 Q3 2025 Earnings Presentation12 slides · Oct 30, 2025
 H1 2025 Earnings Presentation12 slides · Jul 23, 2025
 Q1 2025 Earnings Presentation11 slides · May 9, 2025