Strategic Hotels and Resorts Inc
Strategic Hotels and Resorts — Investor Presentation (March 2011)
22 slides from Strategic Hotels and Resorts's investor presentation, Mar 14, 2011
Slide 1: Investor Presentation March 2011
Investor Presentation March 2011 Exhibit 99.1
Slide 2: Strategic Hotels Overview
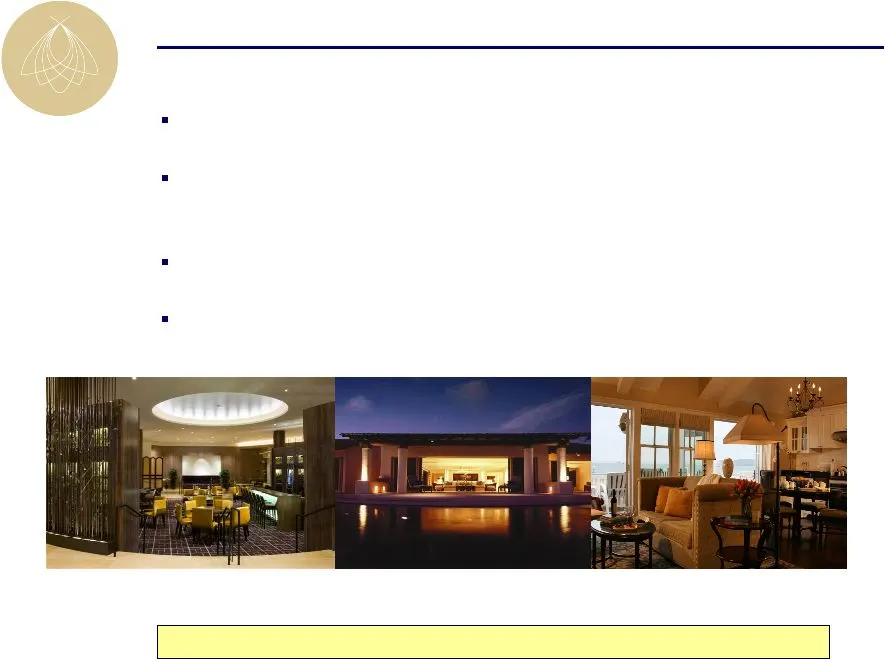
World-class luxury hotels supported by unique real-estate value Luxury segment has historically outperformed the overall industry in a recovery Industry leading asset management capabilities Management team and members with significant hospitality industry experience Strategic Hotels Overview Fairmo
Slide 3: World-Class Hotels in High Barrier to Entry Markets
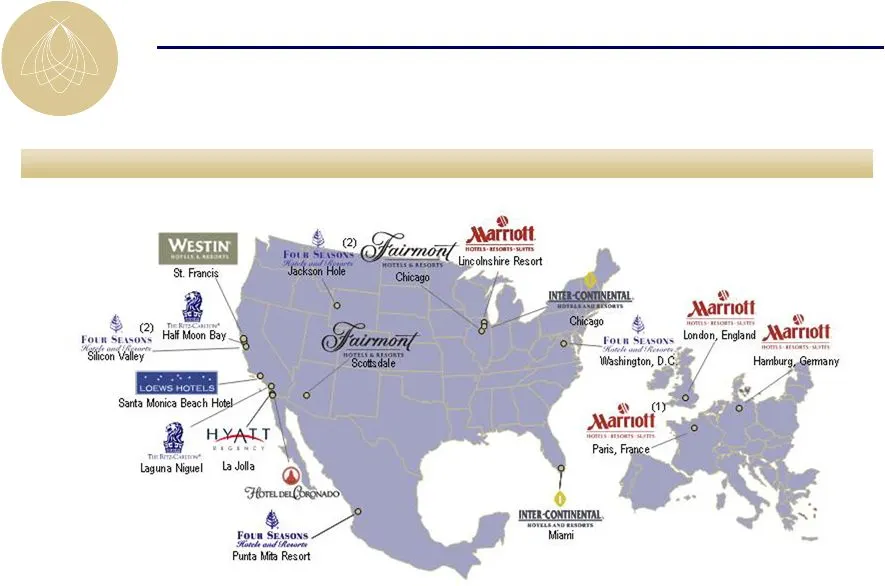
18 hotels and resorts with 7,954 rooms World-Class Hotels in High Barrier to Entry Markets (1) Currently under contract for sale (2) Currently under contract for purchase
Slide 4: Unique and Irreplaceable Hotel Portfolio
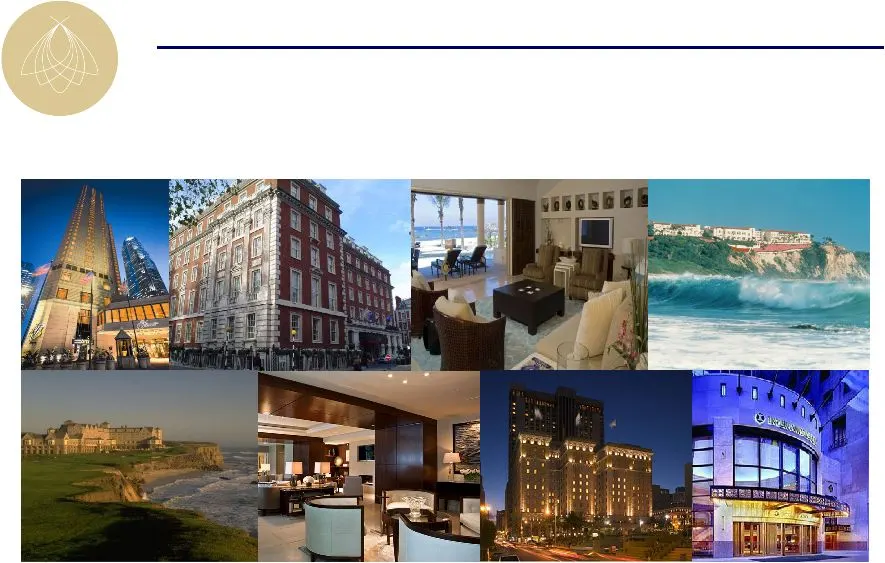
Fairmont Chicago Marriott Grosvenor Square Four Seasons Punta Mita Ritz-Carlton Laguna Niguel Ritz-Carlton Half Moon Bay Four Seasons Washington, D.C. Westin St. Francis InterContinental Chicago Unique and Irreplaceable Hotel Portfolio

Slide 5: Industry Leading Asset Management Capabilities
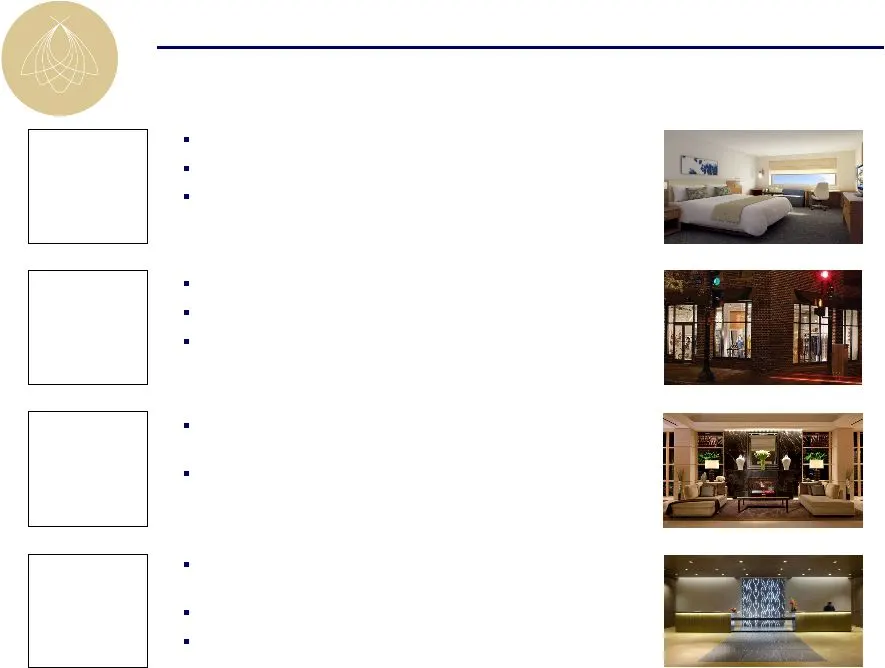
Revenue enhancement through market research based programs Exceptional asset management supported by internally developed operating systems Aggressive and early cost cutting initiatives implemented in advance of the downturn Proactively maintaining fixed cost reduction at hotels during recovery phas
Slide 6
Slide 7: Value Enhancement Projects
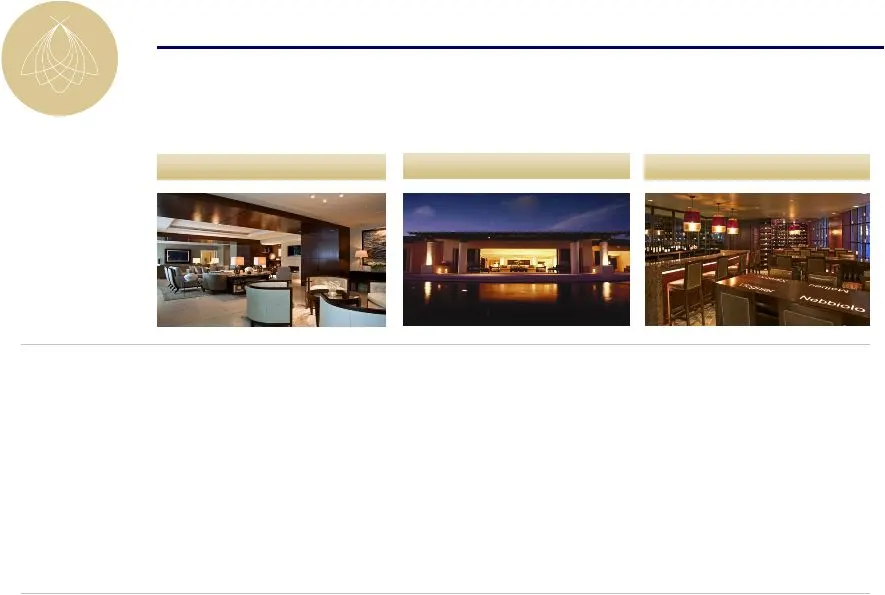
Four Seasons Washington, D.C. Four Seasons Punta Mita InterContinental Chicago Value Enhancement Projects 11.5% 8.5% 15.0% 2010 EBITDA Description: Bourbon Steakhouse and 11- room expansion Two, 5-bedroom suite expansion, 23-room expansion with river pool ENO wine room Year of project: 2008-2009 200
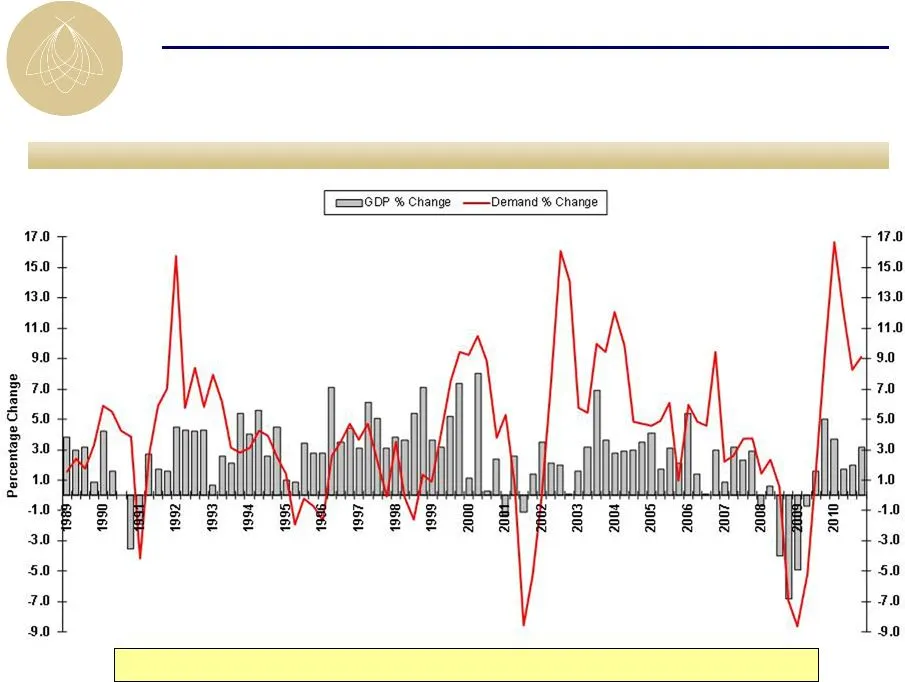
Slide 8: U.S. Luxury Demand Correlated with GDP
U.S. luxury demand vs. GDP growth U.S. Luxury Demand Correlated with GDP Quarterly percentage change to prior year Luxury demand is experiencing a strong rebound as GDP growth returns
Slide 9
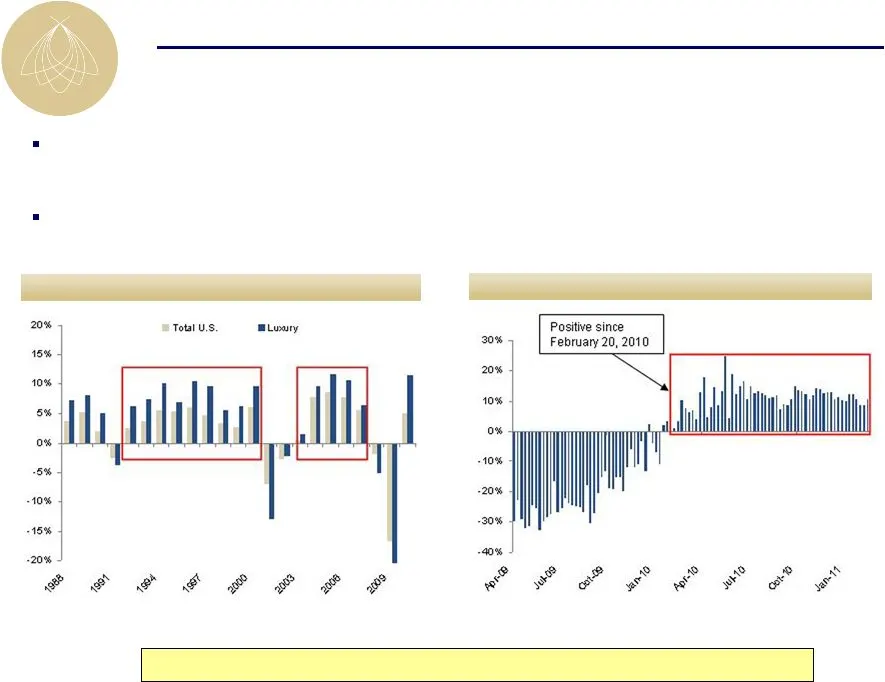
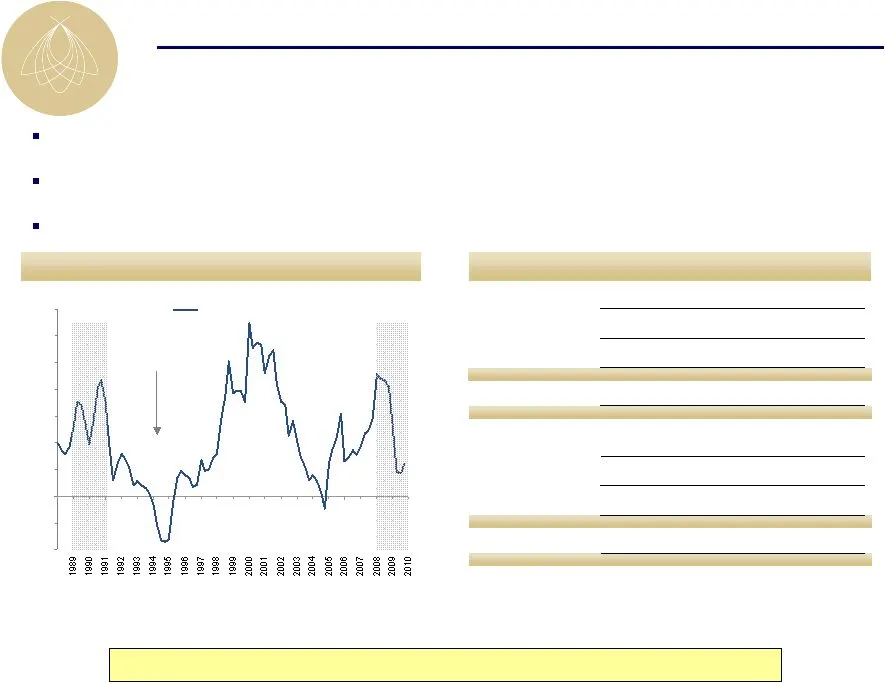
Slide 10: Luxury Hotels Outperform in a Recovery
Source: Smith Travel Research Note: Data represents trends within the United States Sustained growth is defined as 3 or more consecutive weeks of RevPAR growth or contraction Annual % change in RevPAR Weekly YoY % change in luxury RevPAR Luxury hotels have experienced prolonged RevPAR growth followi
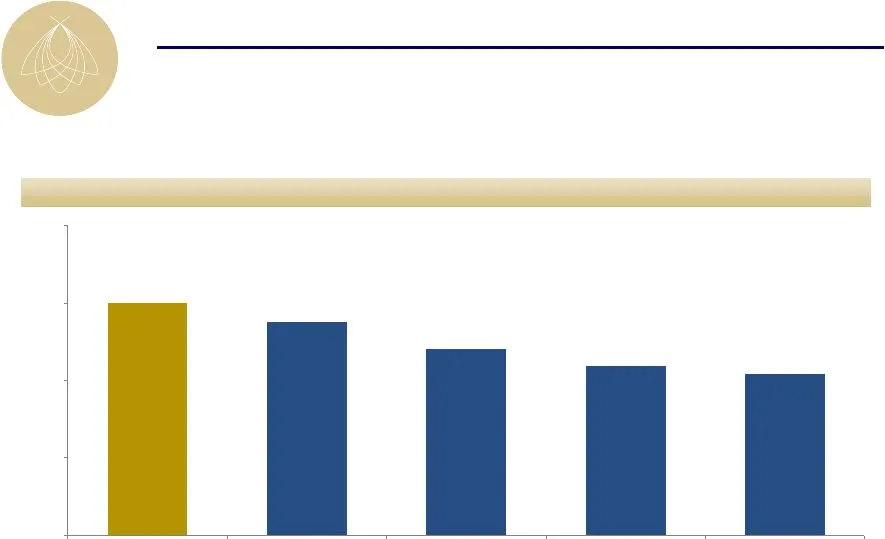
Slide 11: #1 in RevPAR in the Public Lodging Sector
$150 $137 $120 $109 $104 $0 $50 $100 $150 $200 BEE¹ LHO HST DRH SHO Full Year 2010 RevPAR Source: Company filings as of 12/31/10 North American portfolio #1 in RevPAR in the Public Lodging Sector
Slide 12: Woodbridge Transaction Overview
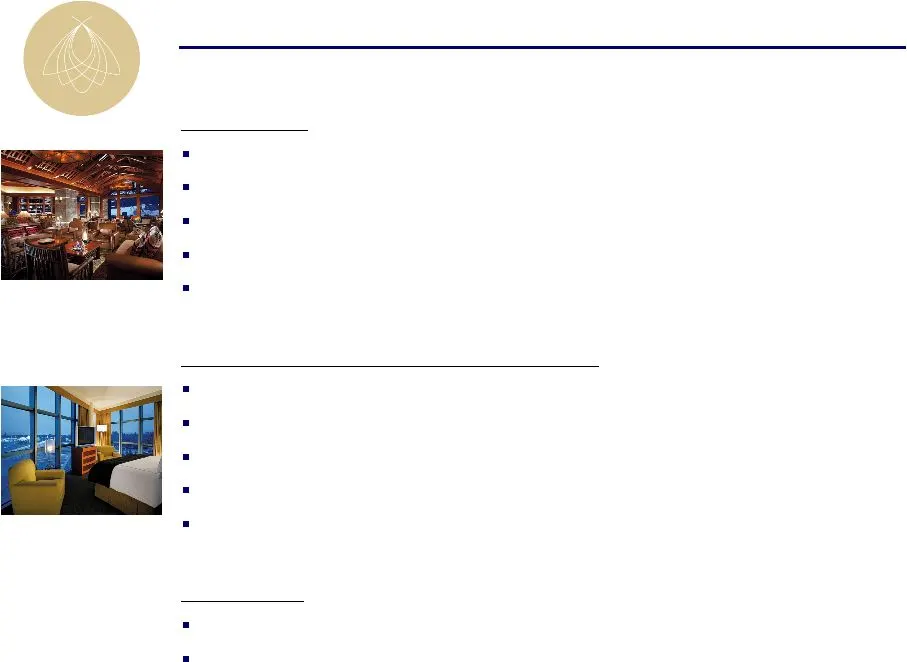
Acquisitions Four Seasons Jackson Hole & Four Seasons Silicon Valley 15.2 million shares of BEE common stock Agreed share price of $6.25 Implied valuation of $95 million ($293,000 per key) 11x 2011 EBITDA multiple PIPE (Private Placement in Public Equity) $50 million gross proceeds 8 million shares
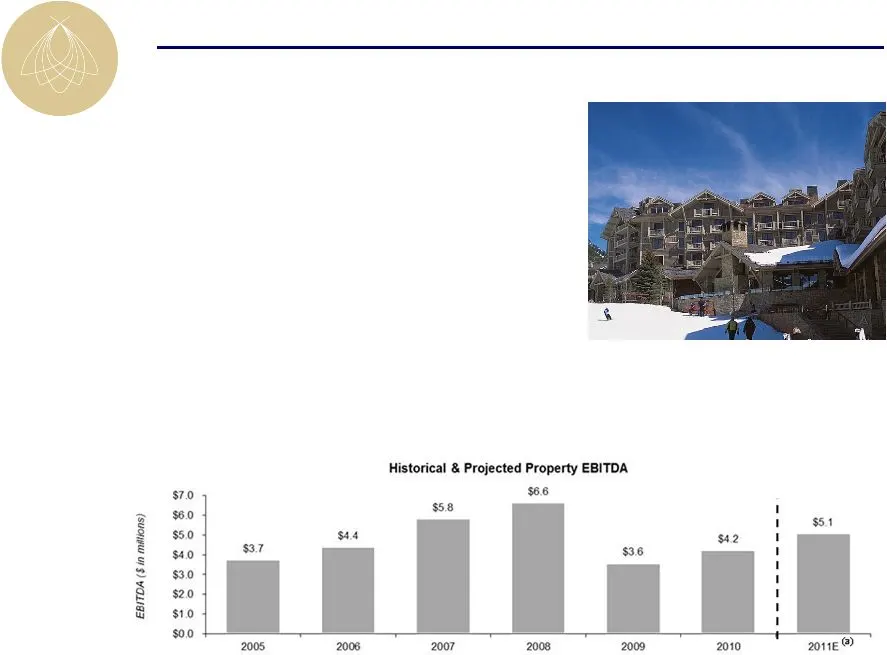
Slide 13: Four Seasons Jackson Hole
- 124 guestrooms, 45 private residences, 12 fractional units - Full-service 11,685 square foot spa with 16 treatment rooms - 8,000 square feet of indoor conference space & 4,000 square feet of outdoor space Four Seasons Jackson Hole - Located in Teton Village, Wyoming; close proximity to Yellowston
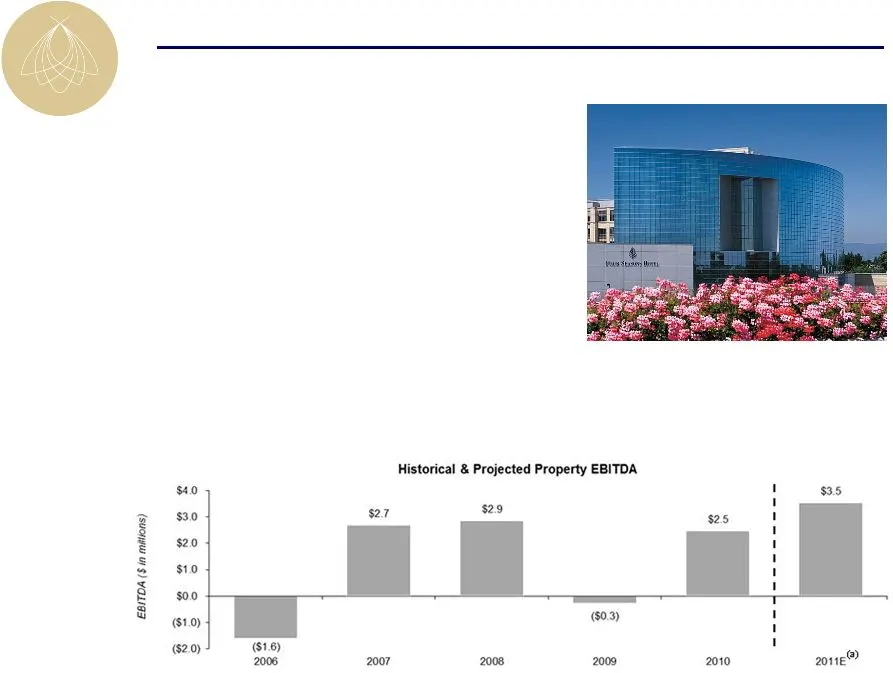
Slide 14: Four Seasons Silicon Valley
- 200 guestrooms, including 11 suites - Full-service spa, rooftop lap pool, fitness center & business center - 7,650 square feet of indoor conference space & 600 square feet of outdoor meeting space - Opened in 2006 Four Seasons Silicon Valley - Located in East Palo Alto, CA in vibrant Silicon Valle
Slide 15: 2010 Results
2010 Results (EBITDA in millions) (a) Adjusted for real estate tax refunds and cancellation fees (b) Excludes VCP expense of $12.6mm in 2010 and $0.1mm in 2009 Operations Corporate Results (b) EBITDA $120.0 10.0% $132.0 FFO / share ($0.30) n/a $0.05 (a) (North American Portfolio excl. Hotel del Coro
Slide 16: 2011 Guidance
2011 Guidance (EBITDA in millions) (a) 2010 results exclude $4.9 mm of real estate tax refunds and no adjustments for cancellation fees (b) 2010 excludes $12.6 mm of VCP expense; 2011 VCP expense excluded Operations Corporate Results (b) EBITDA $132.0 2%-14% $135.0-$150.0 FFO / share $0.05 n/a ($0.0
Slide 17: Historical Comparison
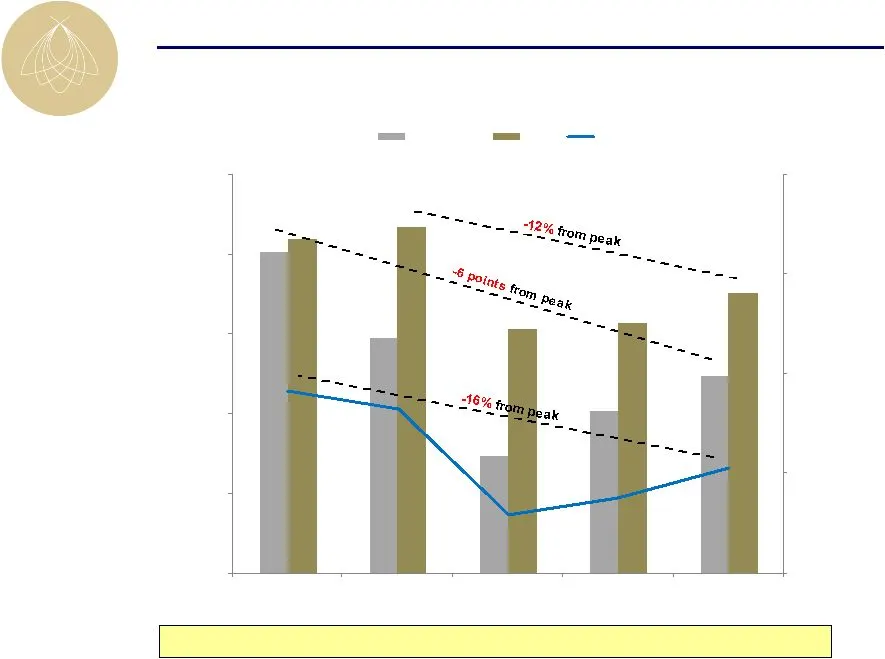
Historical Comparison Operating performance improving; still substantially below peak (North America excluding Hotel del Coronado) $120 $160 $200 $240 $280 60.0% 64.0% 68.0% 72.0% 76.0% 80.0% 2011F ADR / RevPAR Occupancy Occupancy ADR RevPAR

Slide 18: Recent Balance Sheet Strengthening Initiatives
05/10: $349mm equity offering and $180mm exchangeable note tender offer Extended certain property level debt – 05/10: Westin St. Francis & Fairmont Chicago – $318mm: Extension until 2017 02/11: Restructured Hotel del Coronado joint venture reducing outstanding debt and maintaining ownership particip
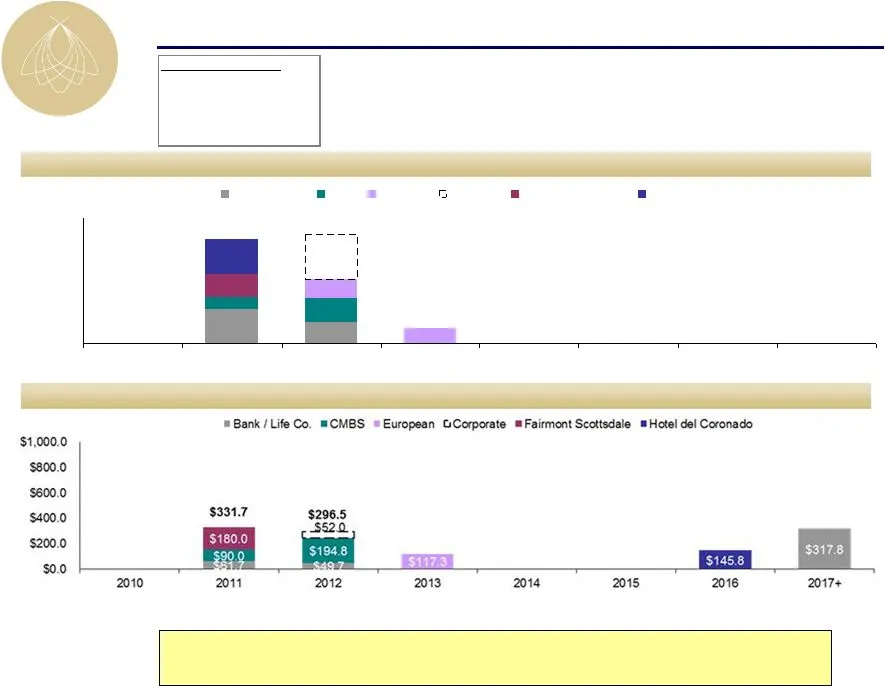
Slide 19: Debt Maturity Profile Update
$173.5 $0.0 $90.0 $194.8 $124.9 $281.7 $148.9 $180.0 $282.8 12/31/09 Actual ($mm) Today ($mm) ¹ Debt Maturity Profile Update $358.0 $0.0 $200.0 $400.0 $600.0 $800.0 $1,000.0 2017+ Bank / Life Co. CMBS European Corporate Fairmont Scottsdale Hotel del Coronado $834.5 $875.1 Significant accomplishments
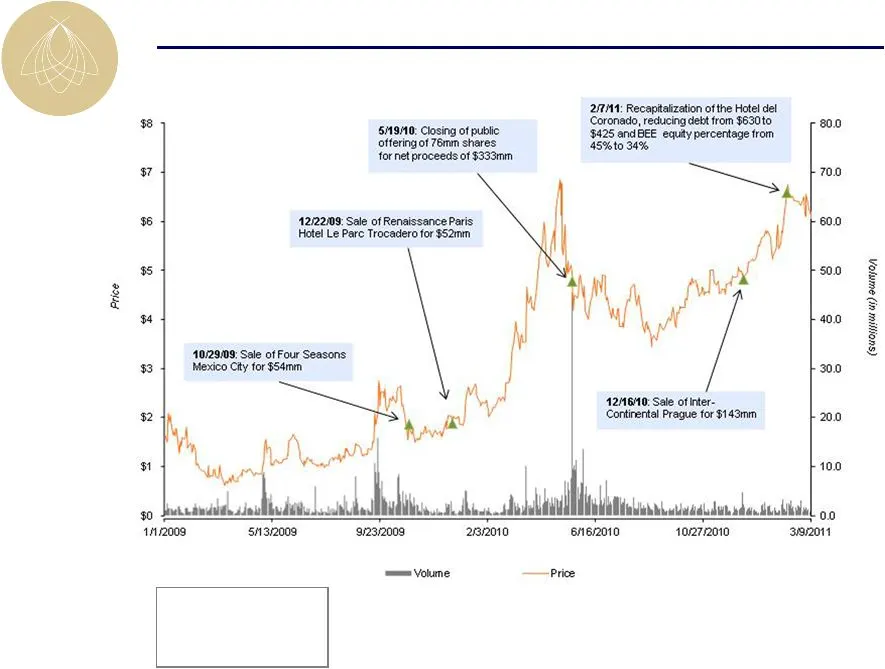
Slide 20: Stock Price Performance
Stock Price Performance 1/1/2009 – 3/9/2011 High (5/3/10): $6.85 Low (3/16/09): $0.61 2010 Return: 184.4% YTD 2011 Return 14.6%

Slide 21: 2011 Objectives
Increase operating margins Outperform competitive sets as measured by Smith Travel Research Refinance 2011 & 2012 maturities (1) ; engaged Eastdil Secured as debt placement advisor Extend / amend Line of Credit; potential execution of new line of credit Maintain significant liquidity (1) Excluding H
Slide 22: Strategic Hotels & Resorts
STRATEGIC Hotels 5 Resorts
Source: SEC EDGAR · 8-K filed Mar 14, 2011
More decks from Strategic Hotels and Resorts Inc
 Investor Presentation (June 2015)43 slides · Jun 1, 2015
 Investor Presentation (February 2015)43 slides · Feb 24, 2015
 Investor Presentation (January 2015)44 slides · Jan 26, 2015
 Investor Presentation (November 2014)50 slides · Nov 5, 2014
 Investor Presentation (October 2014)50 slides · Oct 3, 2014
 Investor Day (September 2014)67 slides · Sep 22, 2014