Blue Energy Limited · ASX:BLU
Blue Energy — Shareholder Meeting (November 2011)
38 slides from Blue Energy's shareholder meeting presentation, Nov 15, 2011
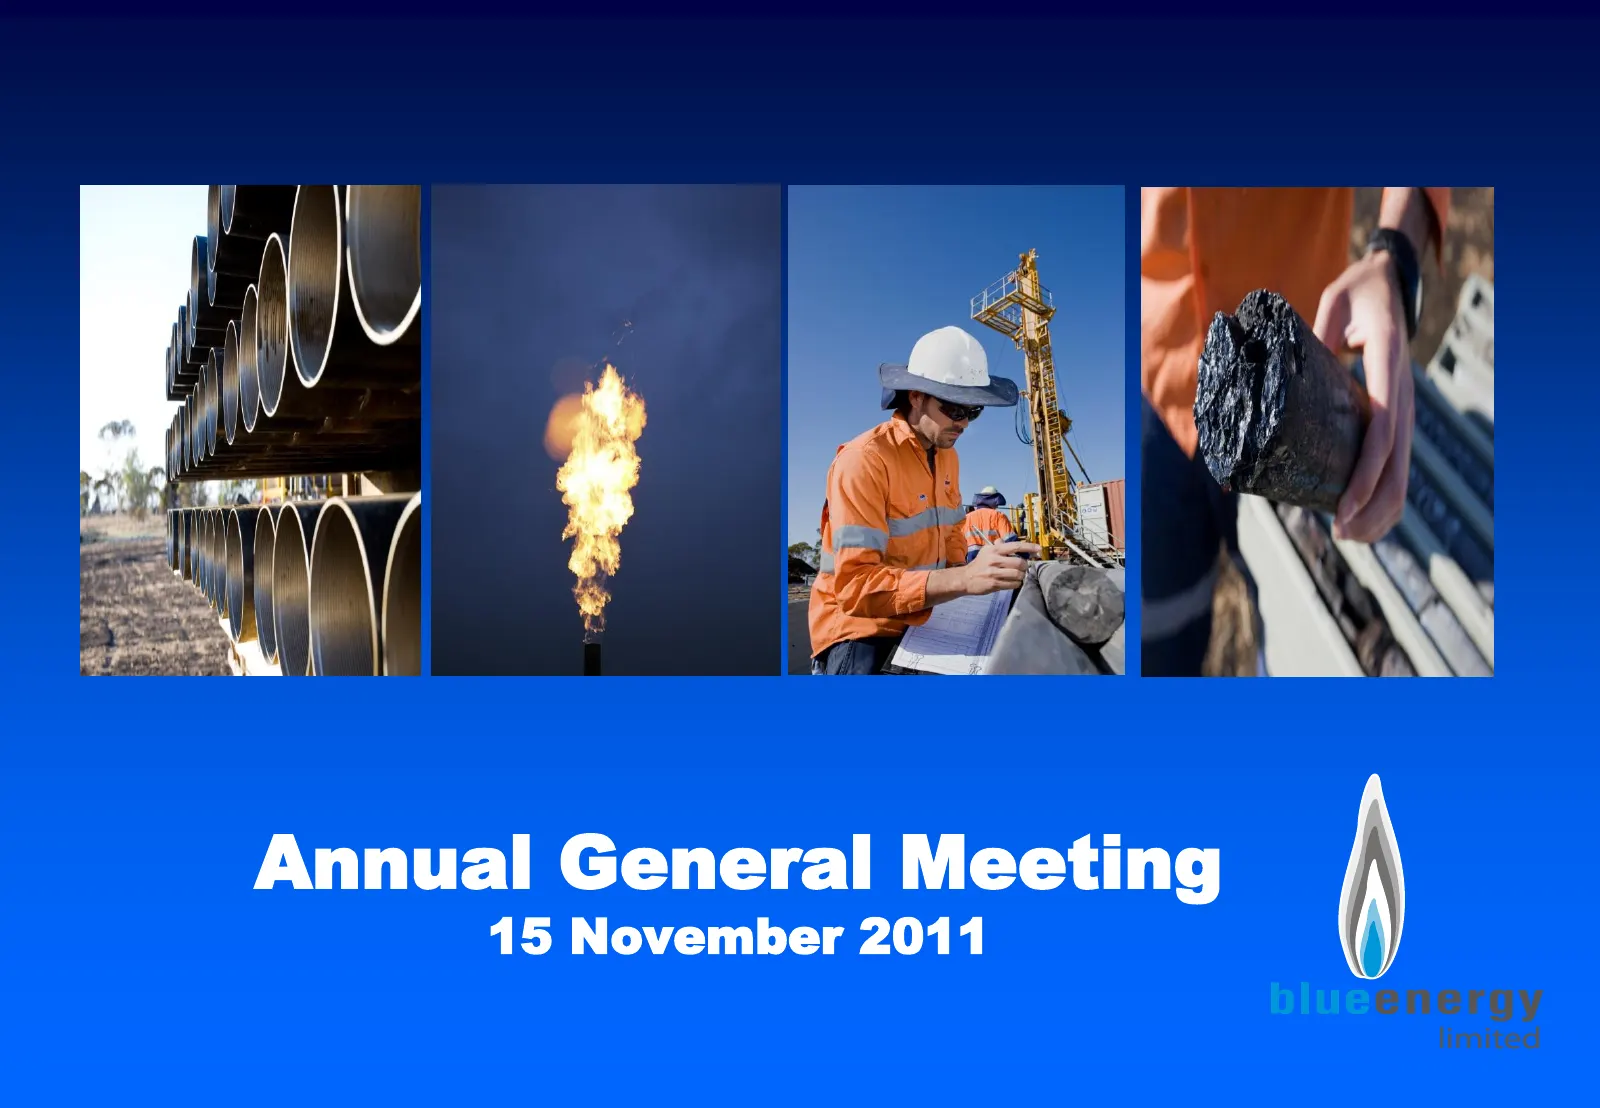
Slide 1: Annual General Meeting
Annual General Meeting 15 November 2011
Slide 2: Forward looking statements
This presentation may contain forward looking statements that are subject to risk factors associated with the gas and energy industry. It is believed that the expectations reflected in the statements contained within are reasonable, but they may be affected by a range of variables which could cause
Slide 3: Blue Energy's Vision
Blue Energy’s Vision 3,000PJ of 3P reserves in the eastern Australian LNG province by 2014
Slide 4: Strategy
Strategy • Low cost evaluation programs in high graded permits • Leverage information from adjacent competitor acreage • Convert resources to reserves with pilot production wells • Access upside in portfolio and seek new exploration opportunities
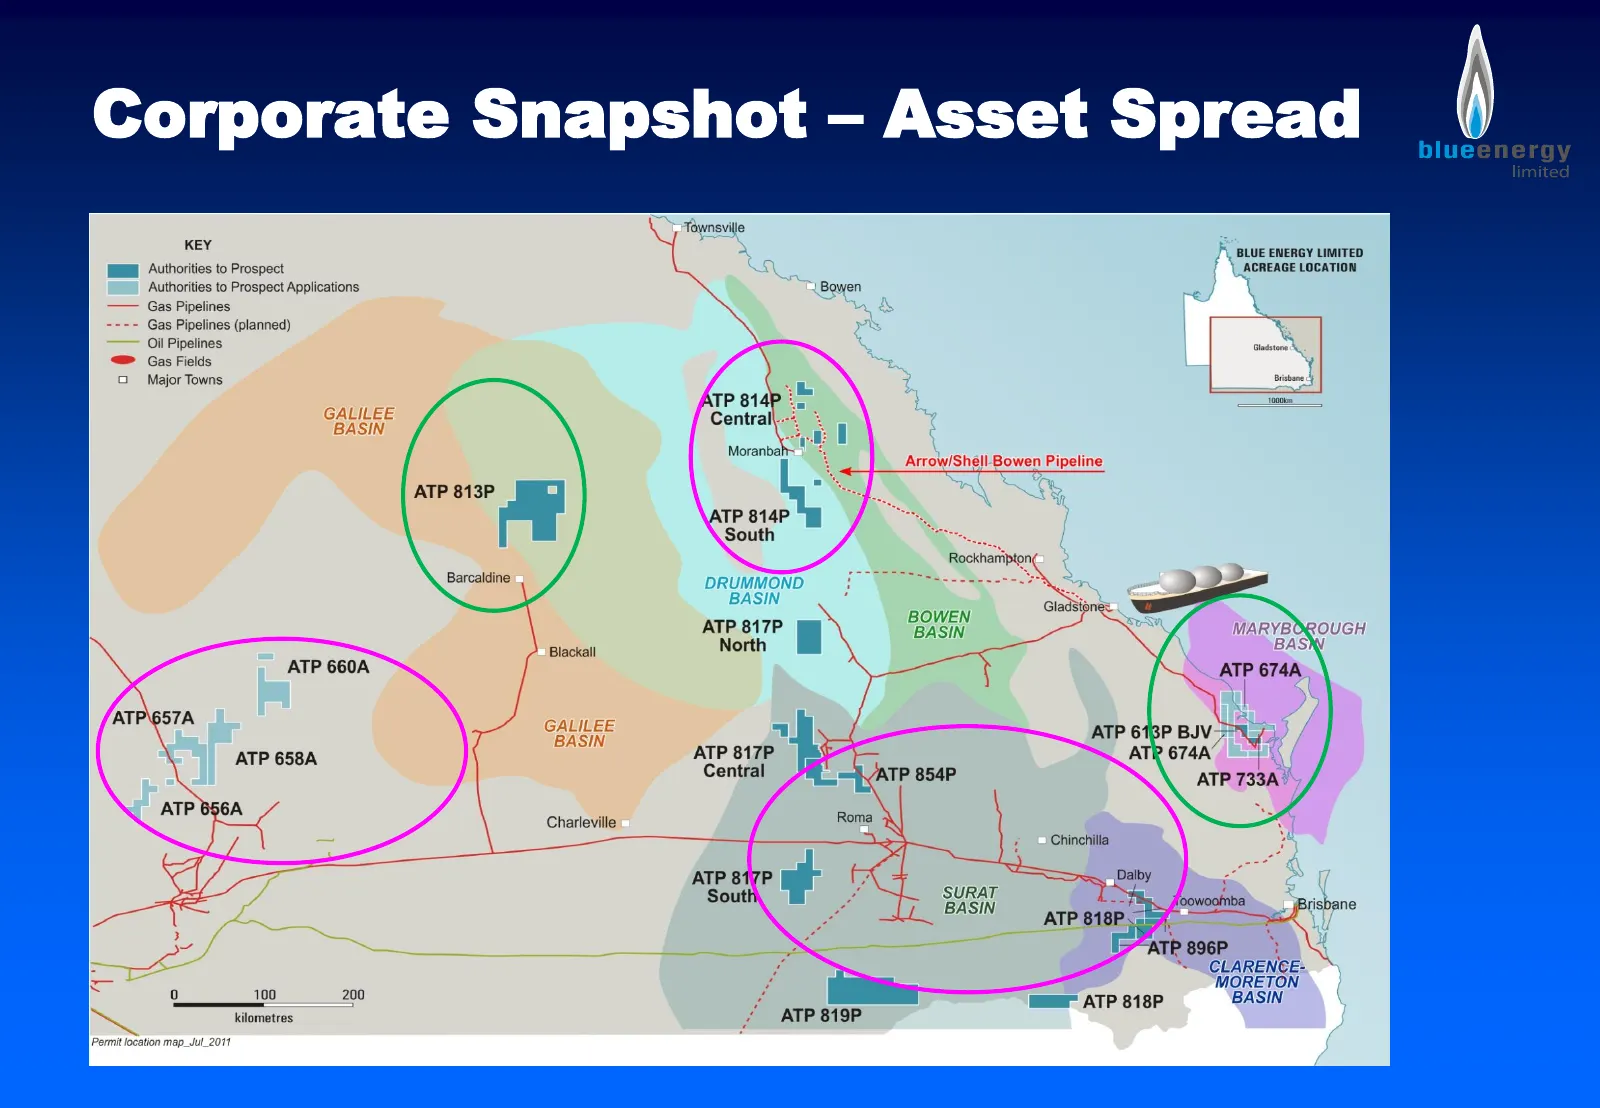
Slide 5: Corporate Snapshot – Asset Spread
Corporate Snapshot – Asset Spread
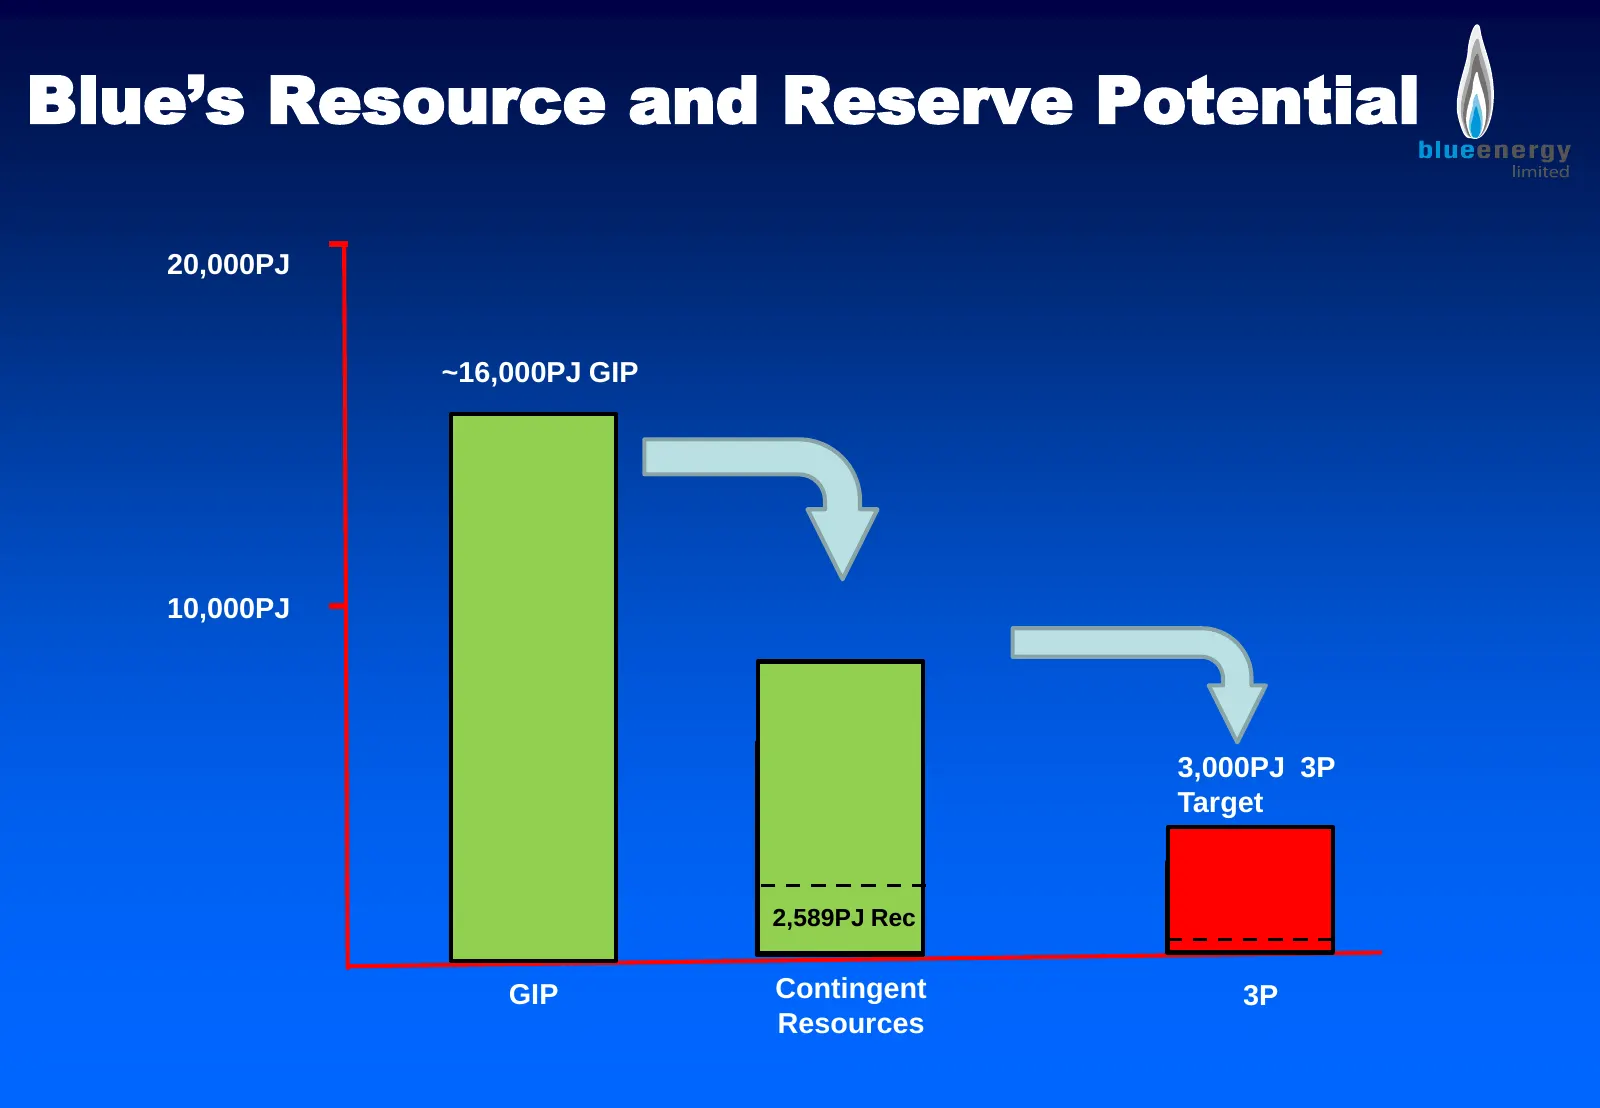
Slide 6: Blue's Resource and Reserve Potential
Blue’s Resource and Reserve Potential 20,000PJ ~16,000PJ GIP 10,000PJ 3,000PJ 3P Target 2,589PJ Rec GIP Contingent 3P Resources
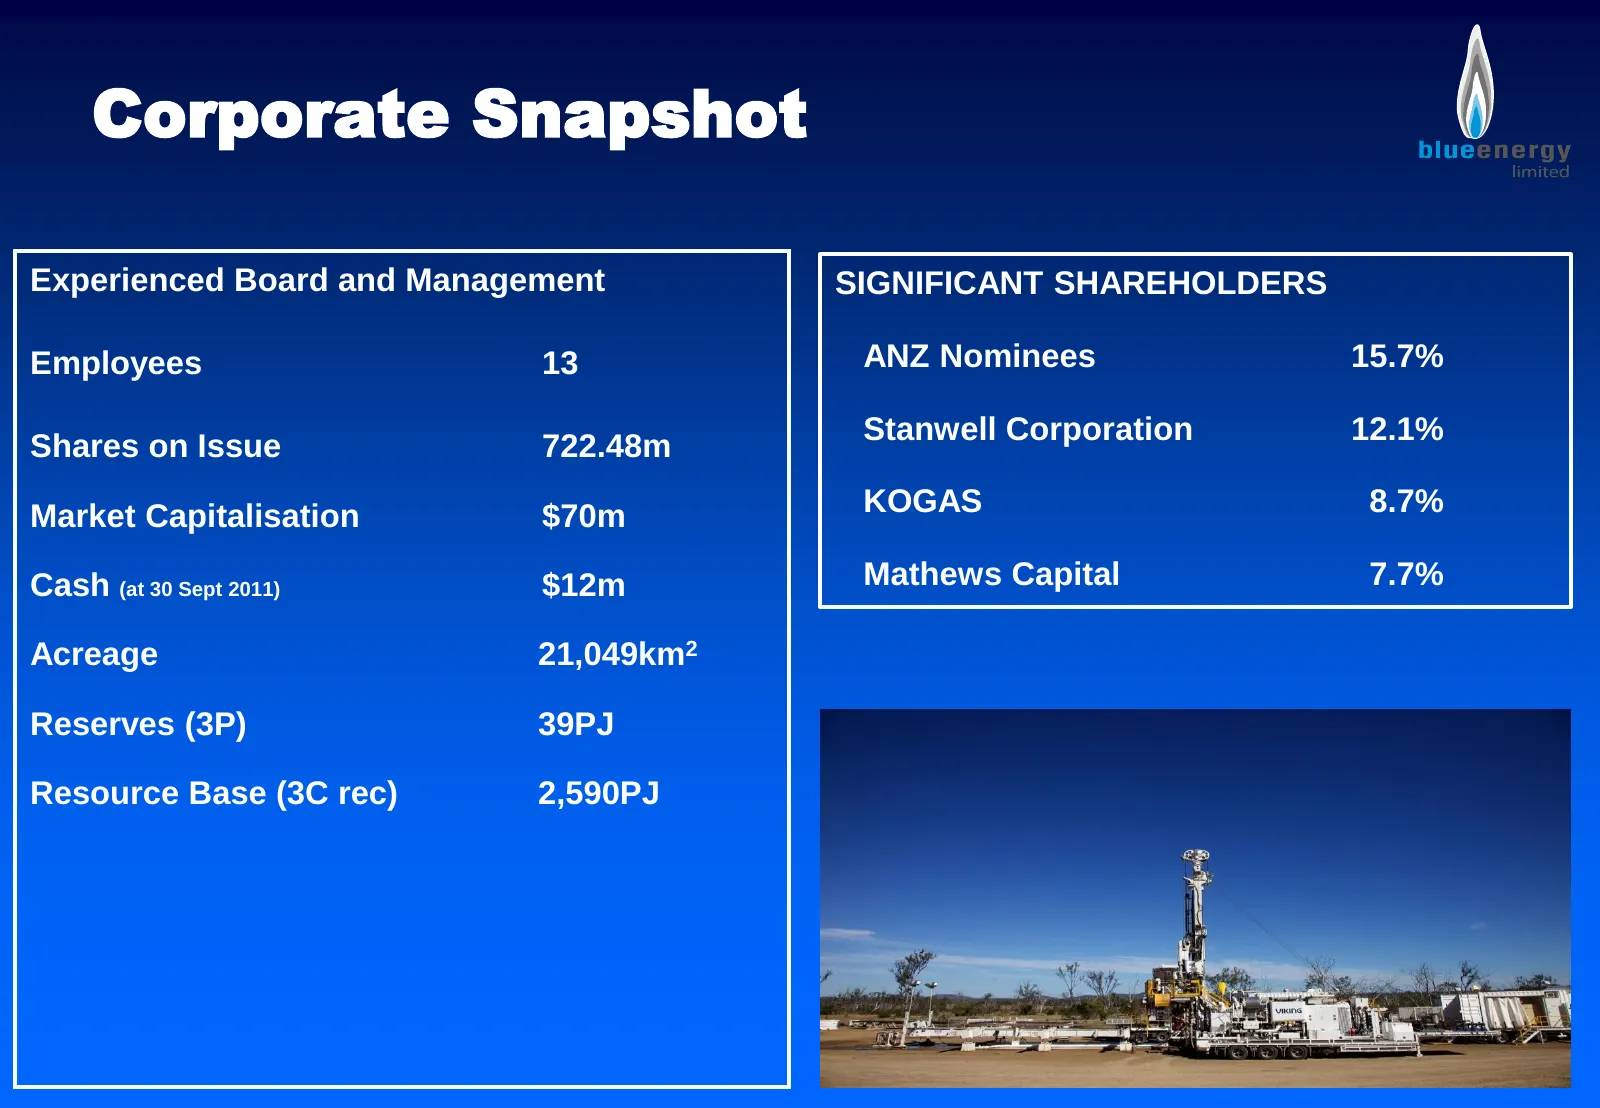
Slide 7: Corporate Snapshot
Corporate Snapshot Experienced Board and Management SIGNIFICANT SHAREHOLDERS Employees 13 ANZ Nominees 15.7% Stanwell Corporation 12.1% Shares on Issue 722.48m Market Capitalisation $70m KOGAS 8.7% Cash (at 30 Sept 2011) $12m Mathews Capital 7.7% Acreage 21,049km2 Reserves (3P) 39PJ Resource Base (3
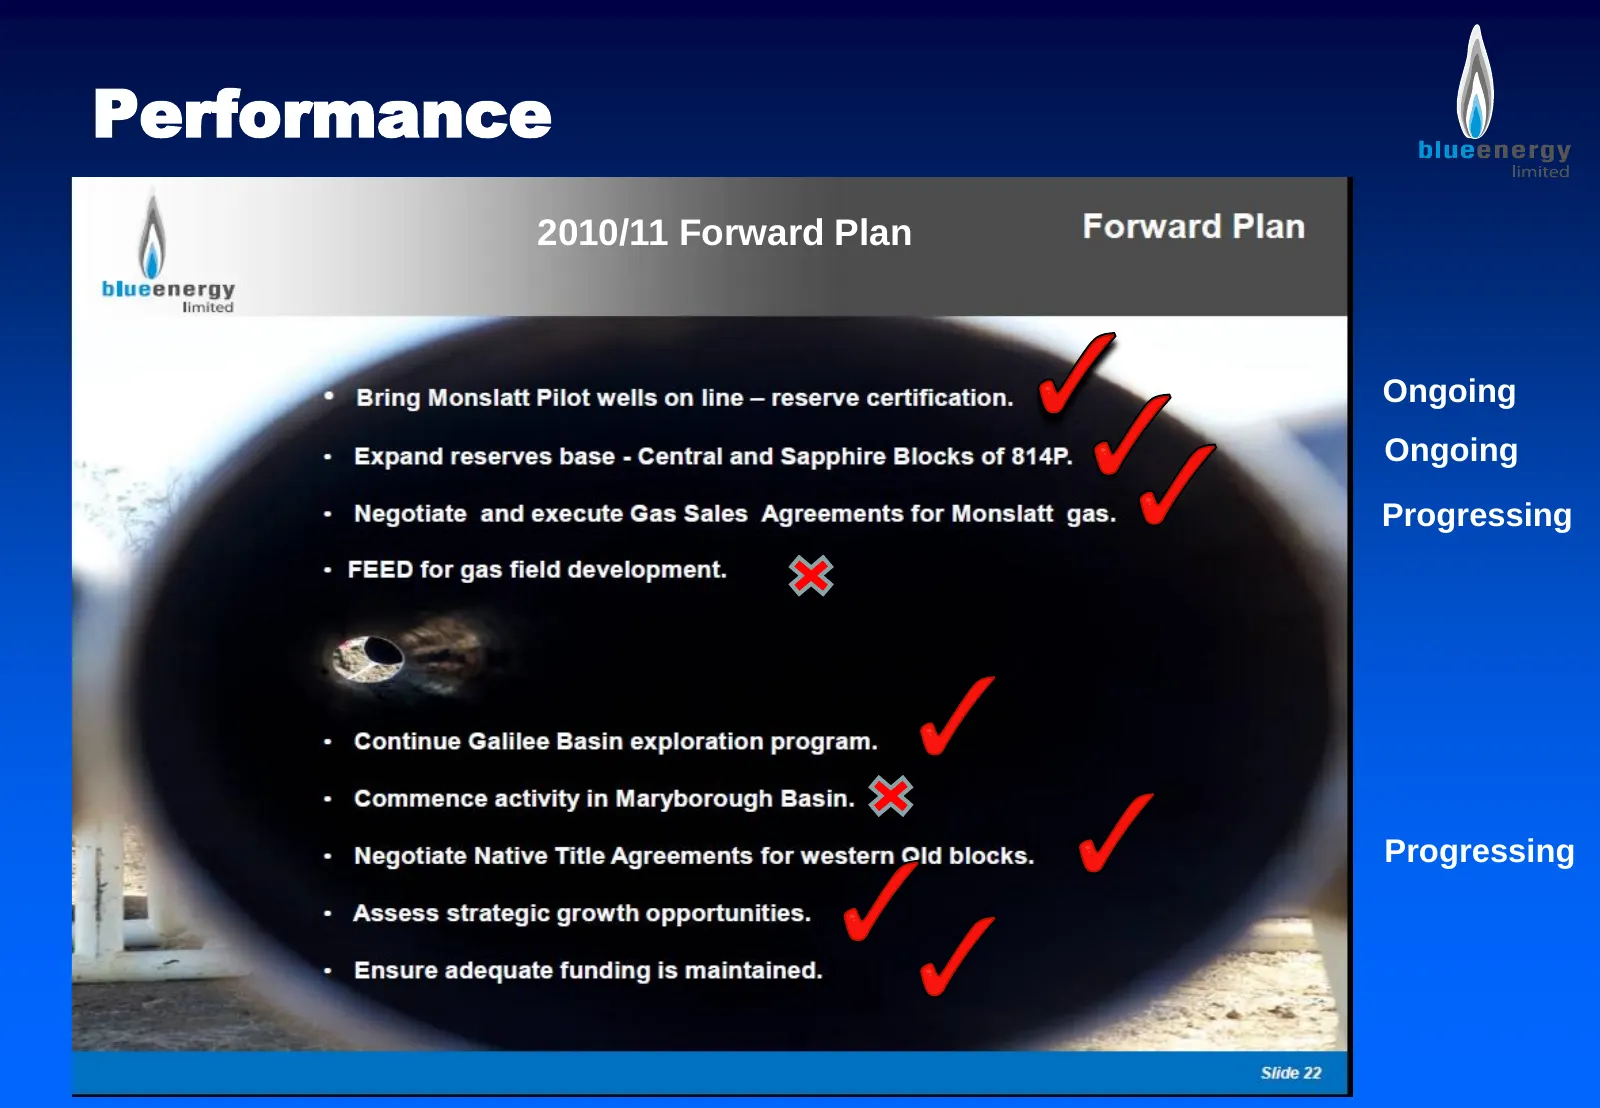
Slide 8: Performance
Performance 2010/11 Forward Plan Ongoing Ongoing Progressing Progressing
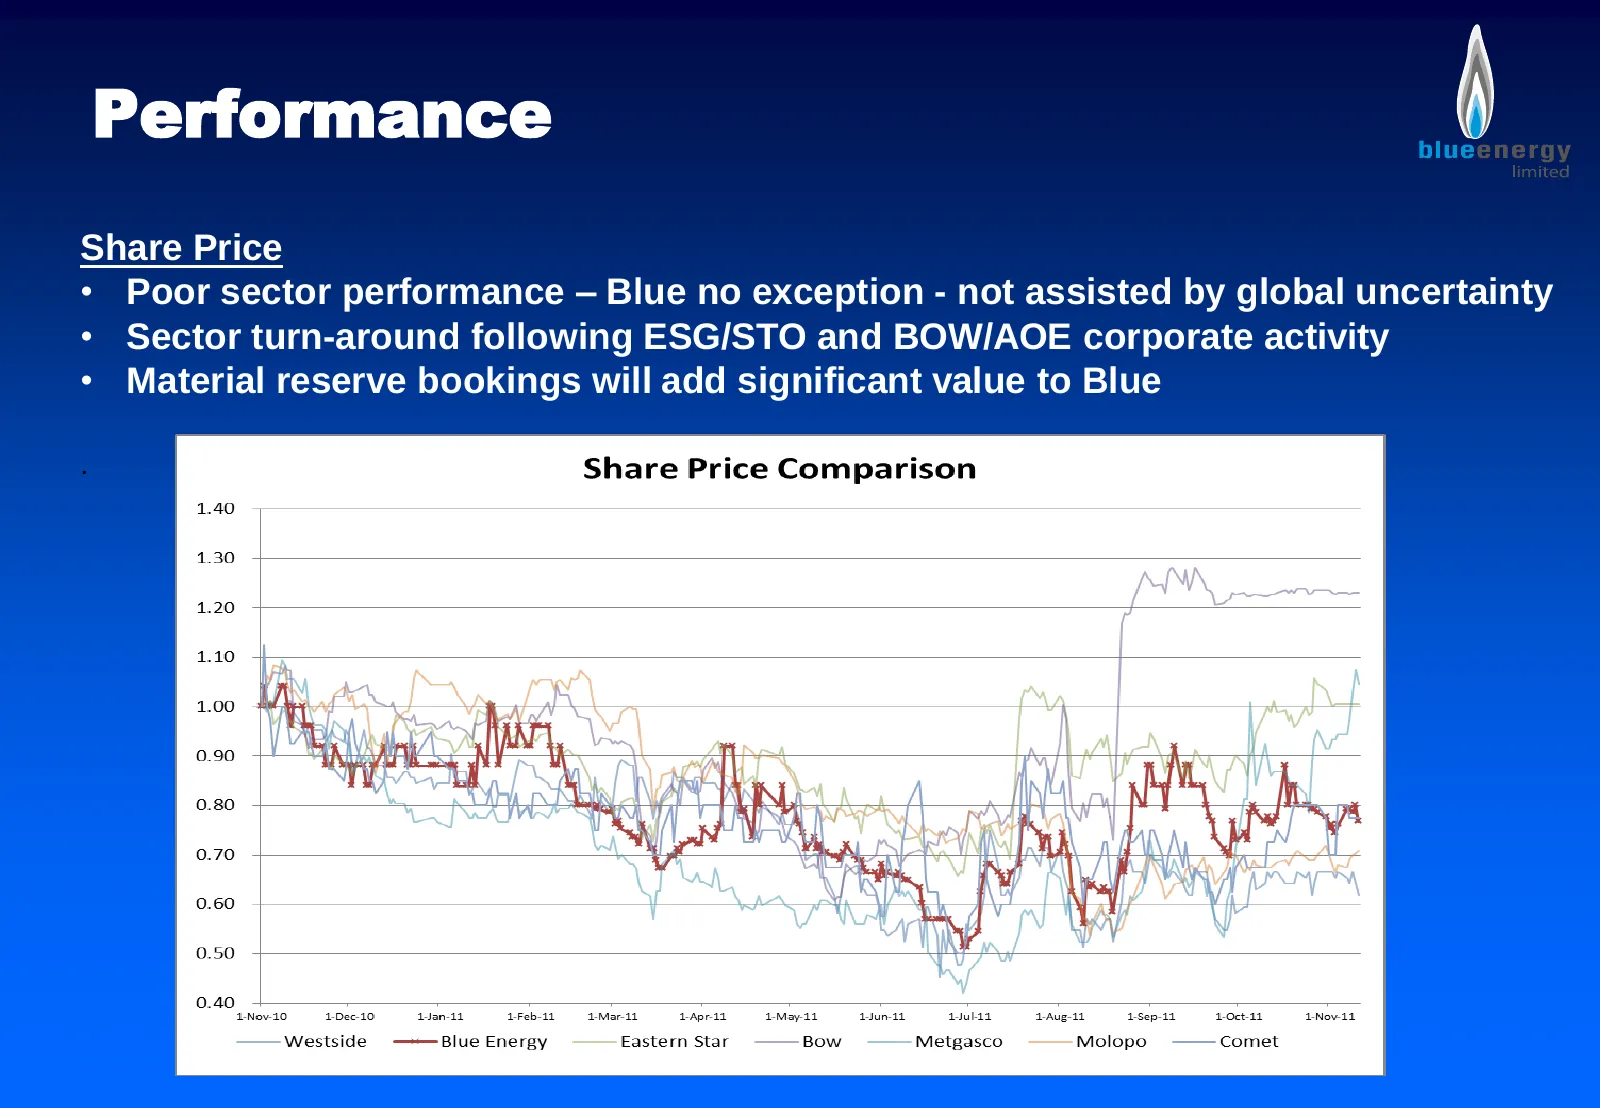
Slide 9: Performance – Share Price
Performance Share Price • Poor sector performance – Blue no exception - not assisted by global uncertainty • Sector turn-around following ESG/STO and BOW/AOE corporate activity • Material reserve bookings will add significant value to Blue .
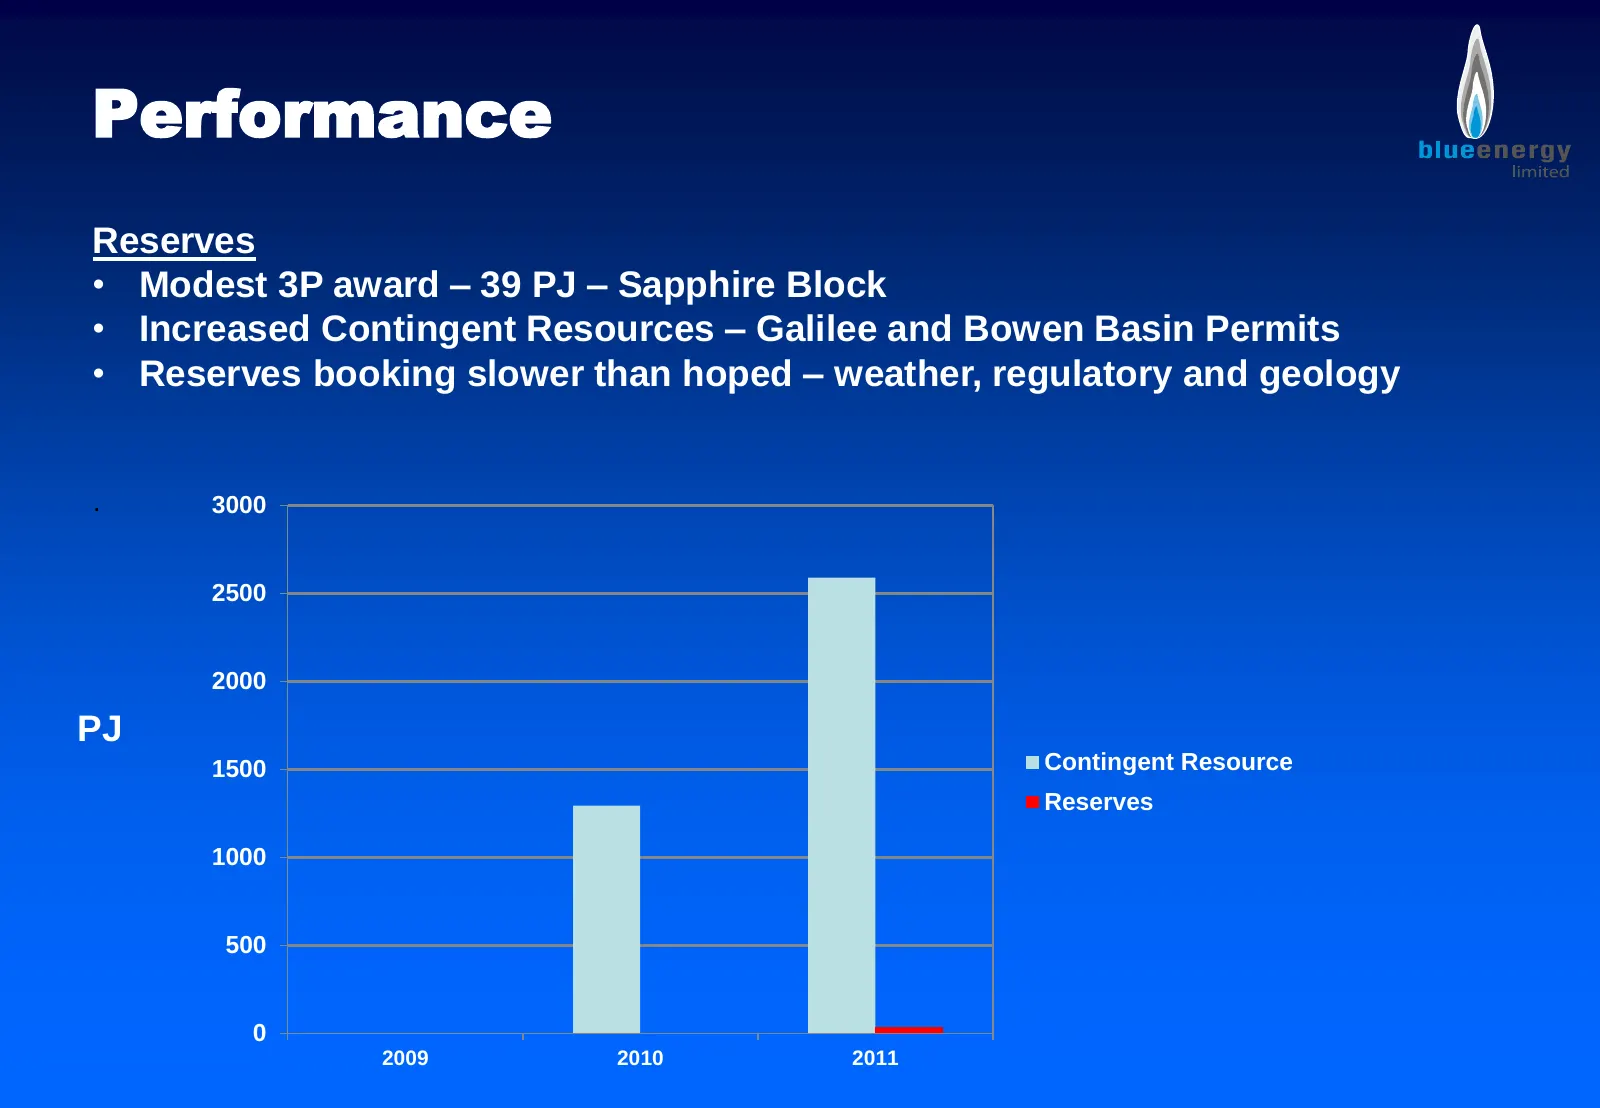
Slide 10: Performance – Reserves
Performance Reserves • Modest 3P award – 39 PJ – Sapphire Block • Increased Contingent Resources – Galilee and Bowen Basin Permits • Reserves booking slower than hoped – weather, regulatory and geology . 3000 2500 2000 PJ 1500 Contingent Resource Reserves 1000 500 0 2009 2010 2011
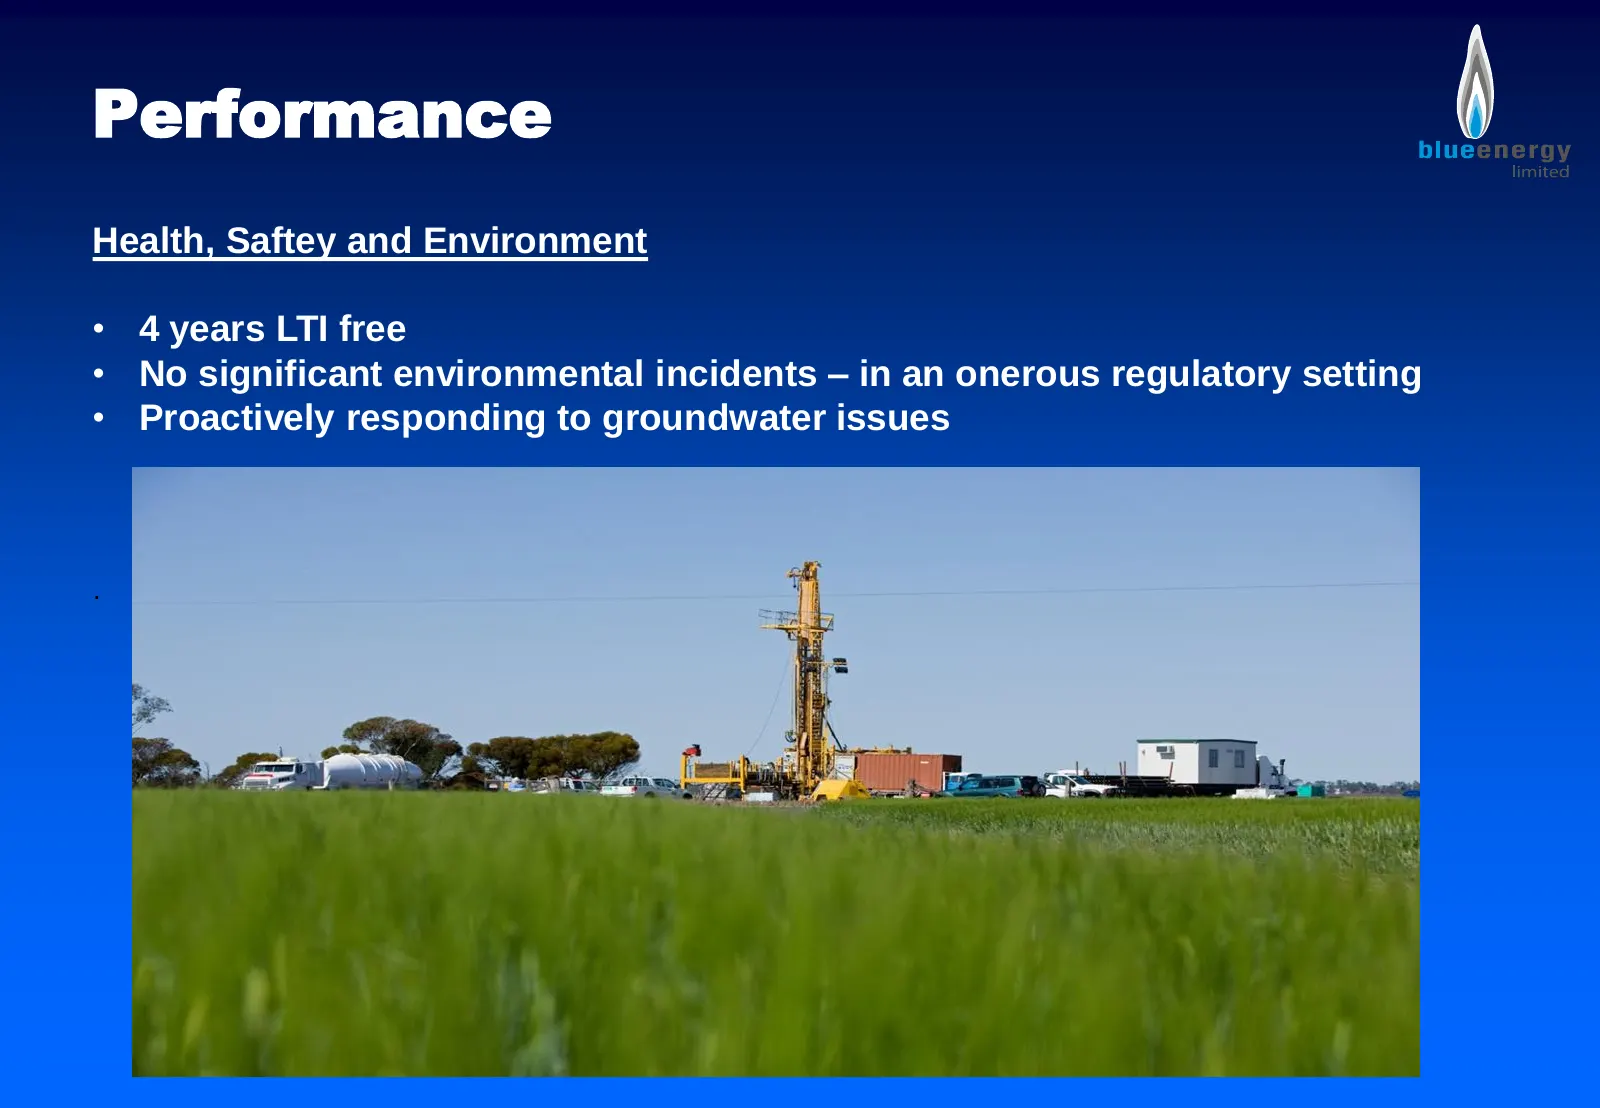
Slide 11: Performance – Health, Safety and Environment
Performance Health, Saftey and Environment • 4 years LTI free • No significant environmental incidents – in an onerous regulatory setting • Proactively responding to groundwater issues .
Slide 12: Commercialization Strategies
Commercialization Strategies • Domestic Gas Sales Potential domestic gas shortfall – upward price pressure • Gas Fired Power Generation Niche position around energy sinks – Bowen Basin coal fields • Micro LNG – Diesel Substitution High margin fuel substitution concept – low emission alternative Bowe
Slide 13: Summary
Summary • Blue has exposure to multiple resource plays in the principal Queensland hydrocarbon basins • Well positioned to benefit from the eastern Australian gas shortfall • Strategically located assets • Focused program to convert resource to reserves as pilot testing continues in core area • Mary
Slide 14: Bowen Basin
Asset Overview Bowen Basin ATP814P – Blue Energy 100%
Slide 15: Asset Overview – Bowen Basin
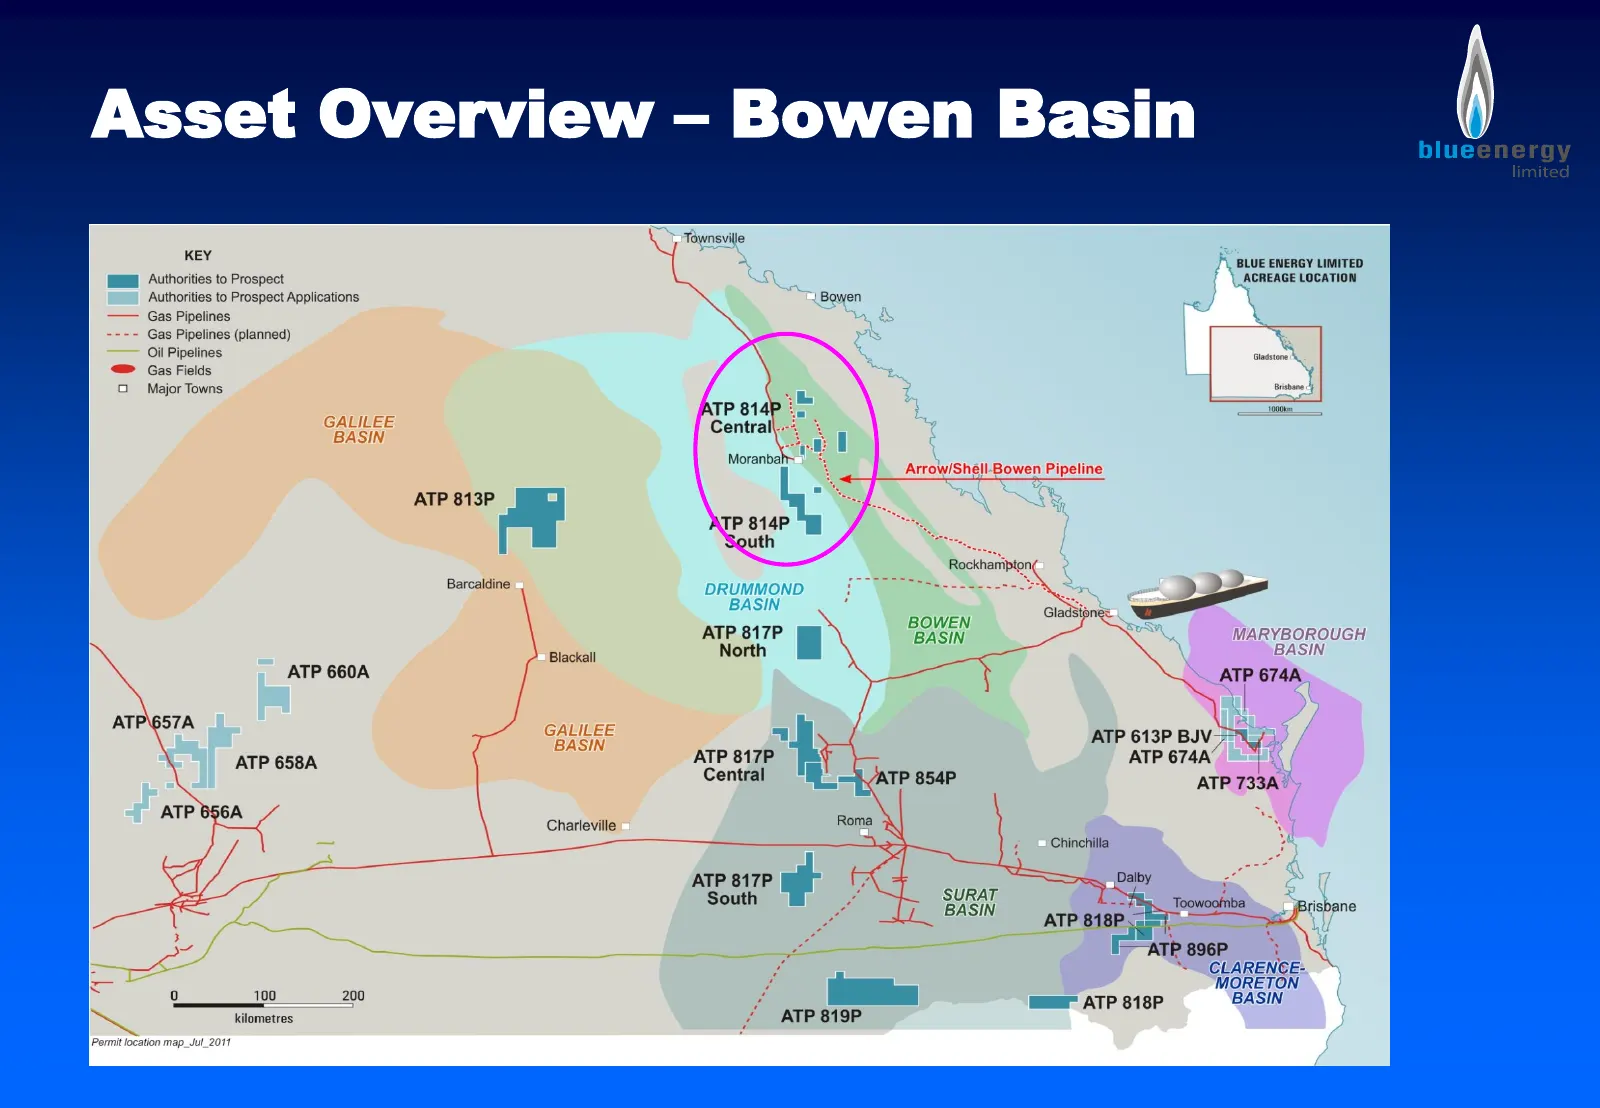
Asset Overview - Bowen Basin KEY Authorities to Prospect Authorities to Prospect Applications —— Gas Pipelines =+~ Gas Pipelines (planned) —— OilPipelines = Gas Fields 3 Major Towns GALILEE BASIN” ATP 813P Taynsvile : JA, BLUE ENERGY LIMITED ACREAGE LOCATION LBowen ATP 81. Central. Moranbal ATP 814P
Slide 16: Asset Overview – Bowen Basin
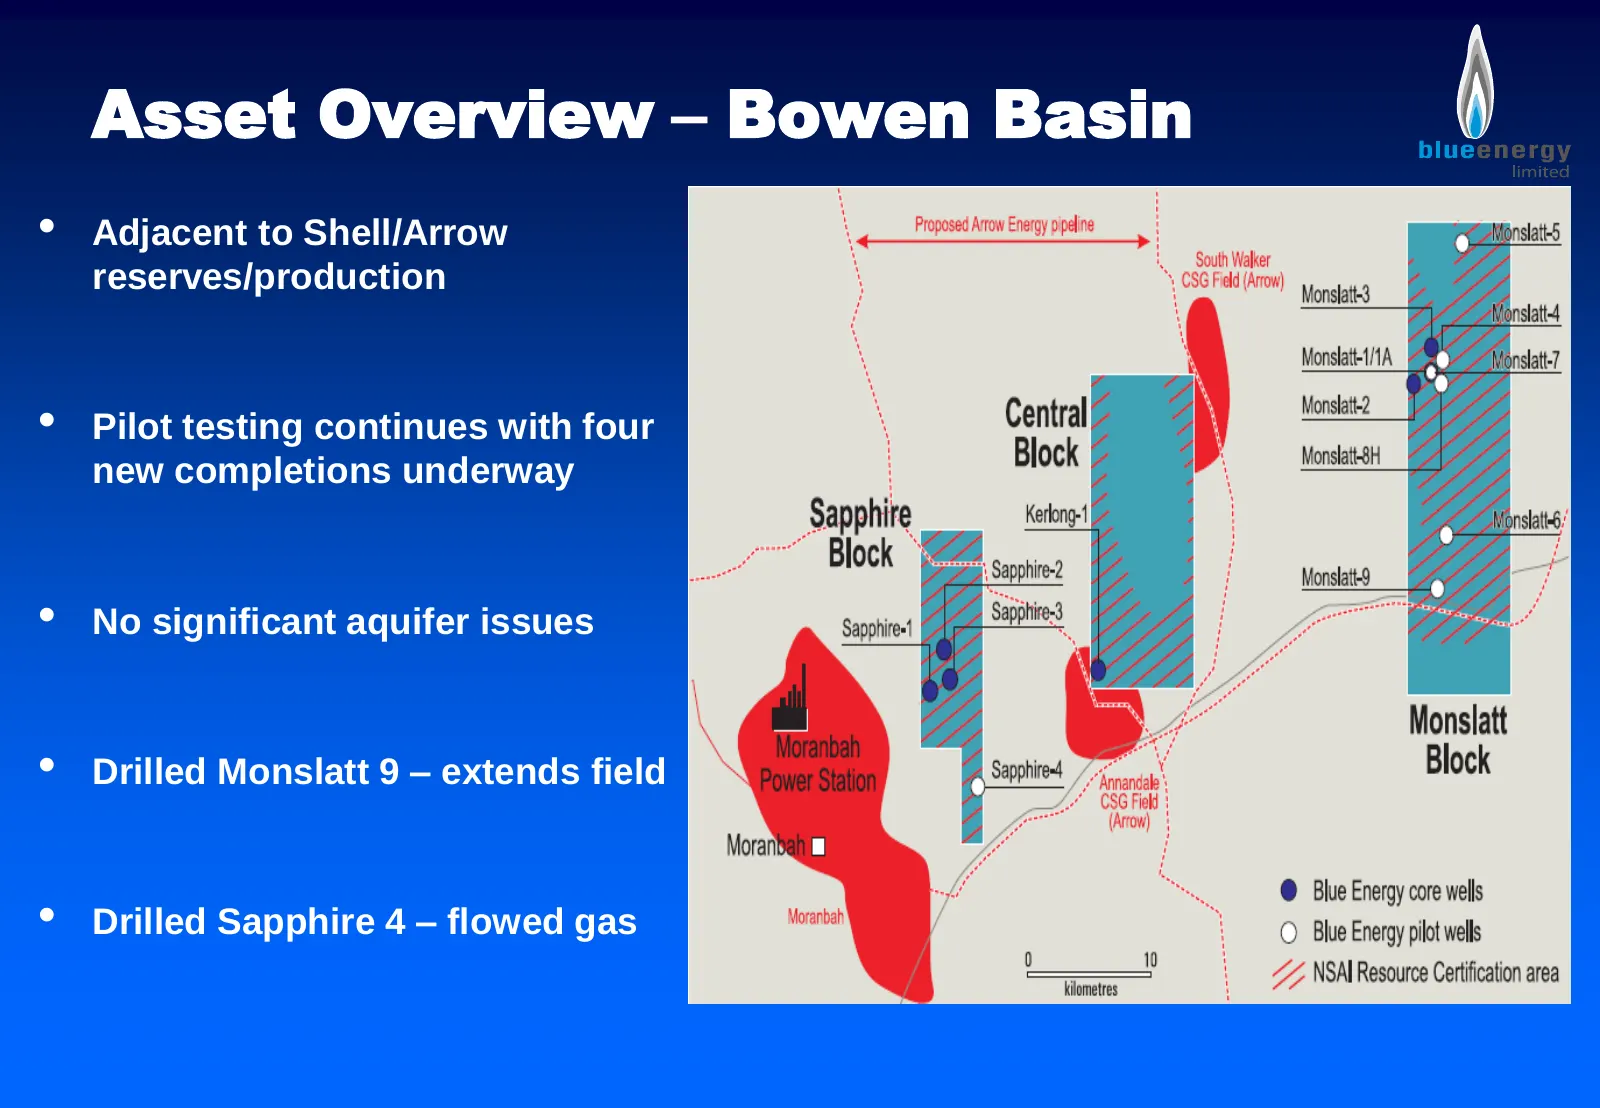
Asset Overview – Bowen Basin • Adjacent to Shell/Arrow reserves/production • Pilot testing continues with four new completions underway • No significant aquifer issues • Drilled Monslatt 9 – extends field • Drilled Sapphire 4 – flowed gas
Slide 17: Asset Overview – Bowen Basin
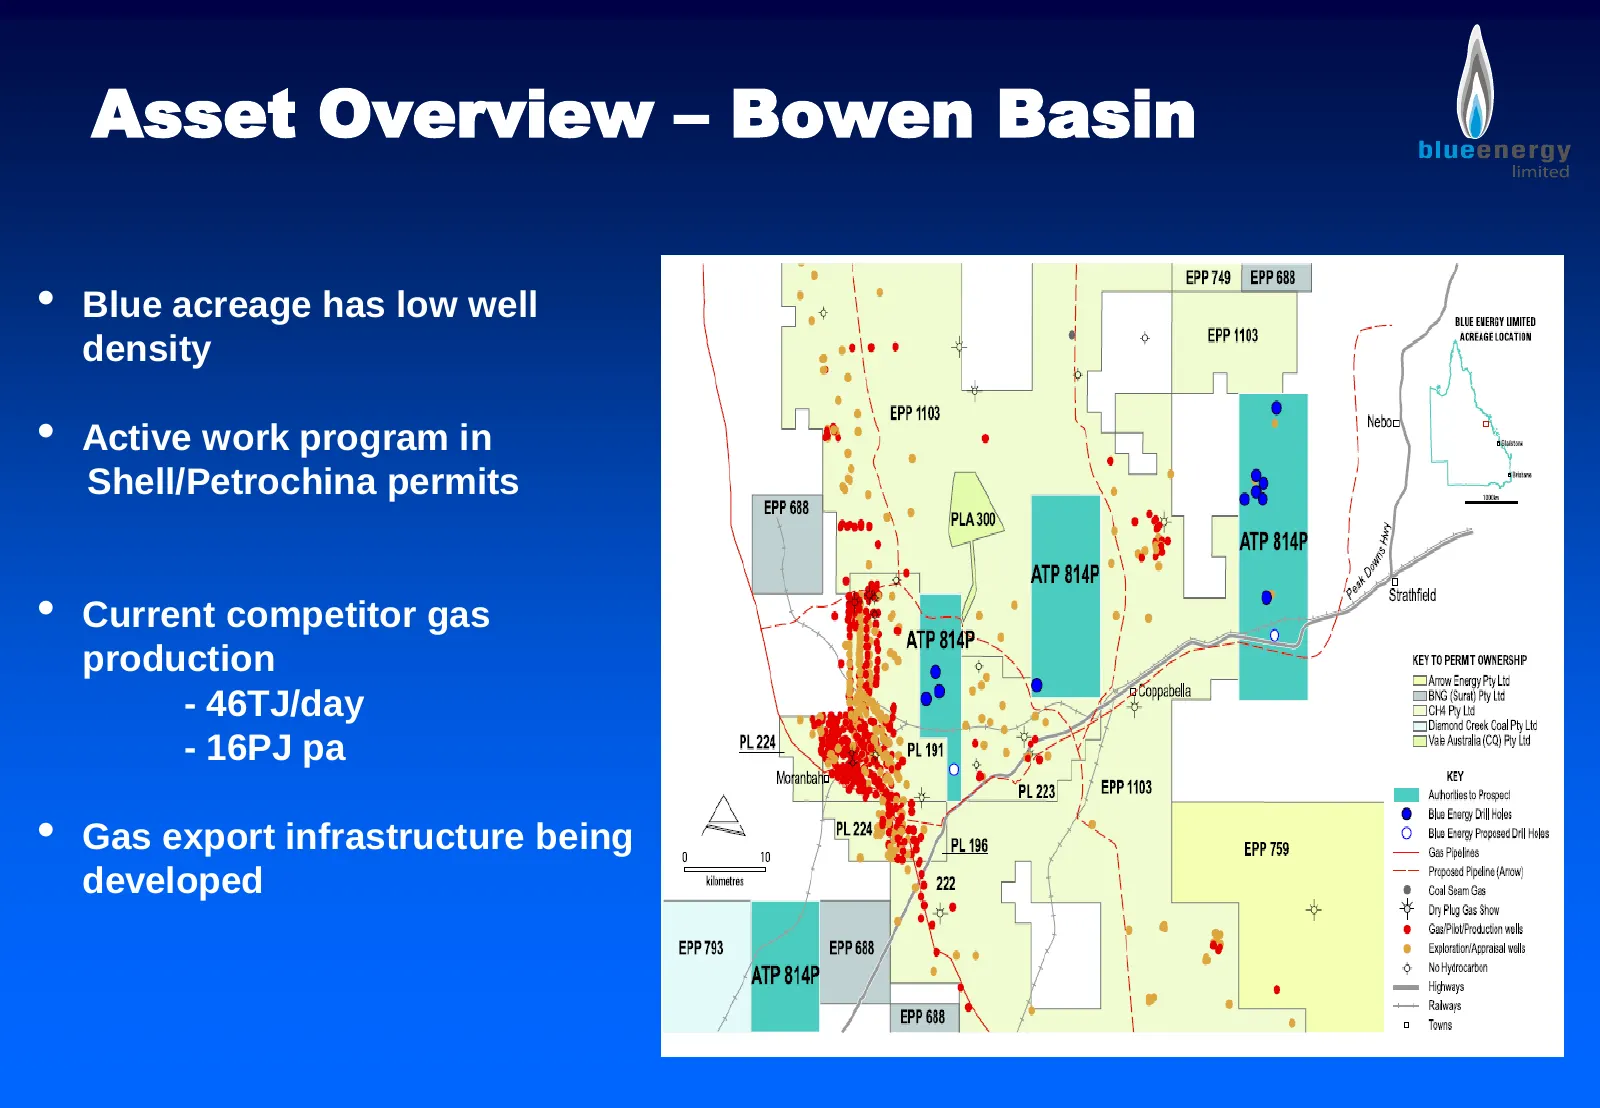
Asset Overview – Bowen Basin • Blue acreage has low well density • Active work program in Shell/Petrochina permits • Current competitor gas production - 46TJ/day - 16PJ pa • Gas export infrastructure being developed
Slide 18: Asset Overview – Bowen Basin
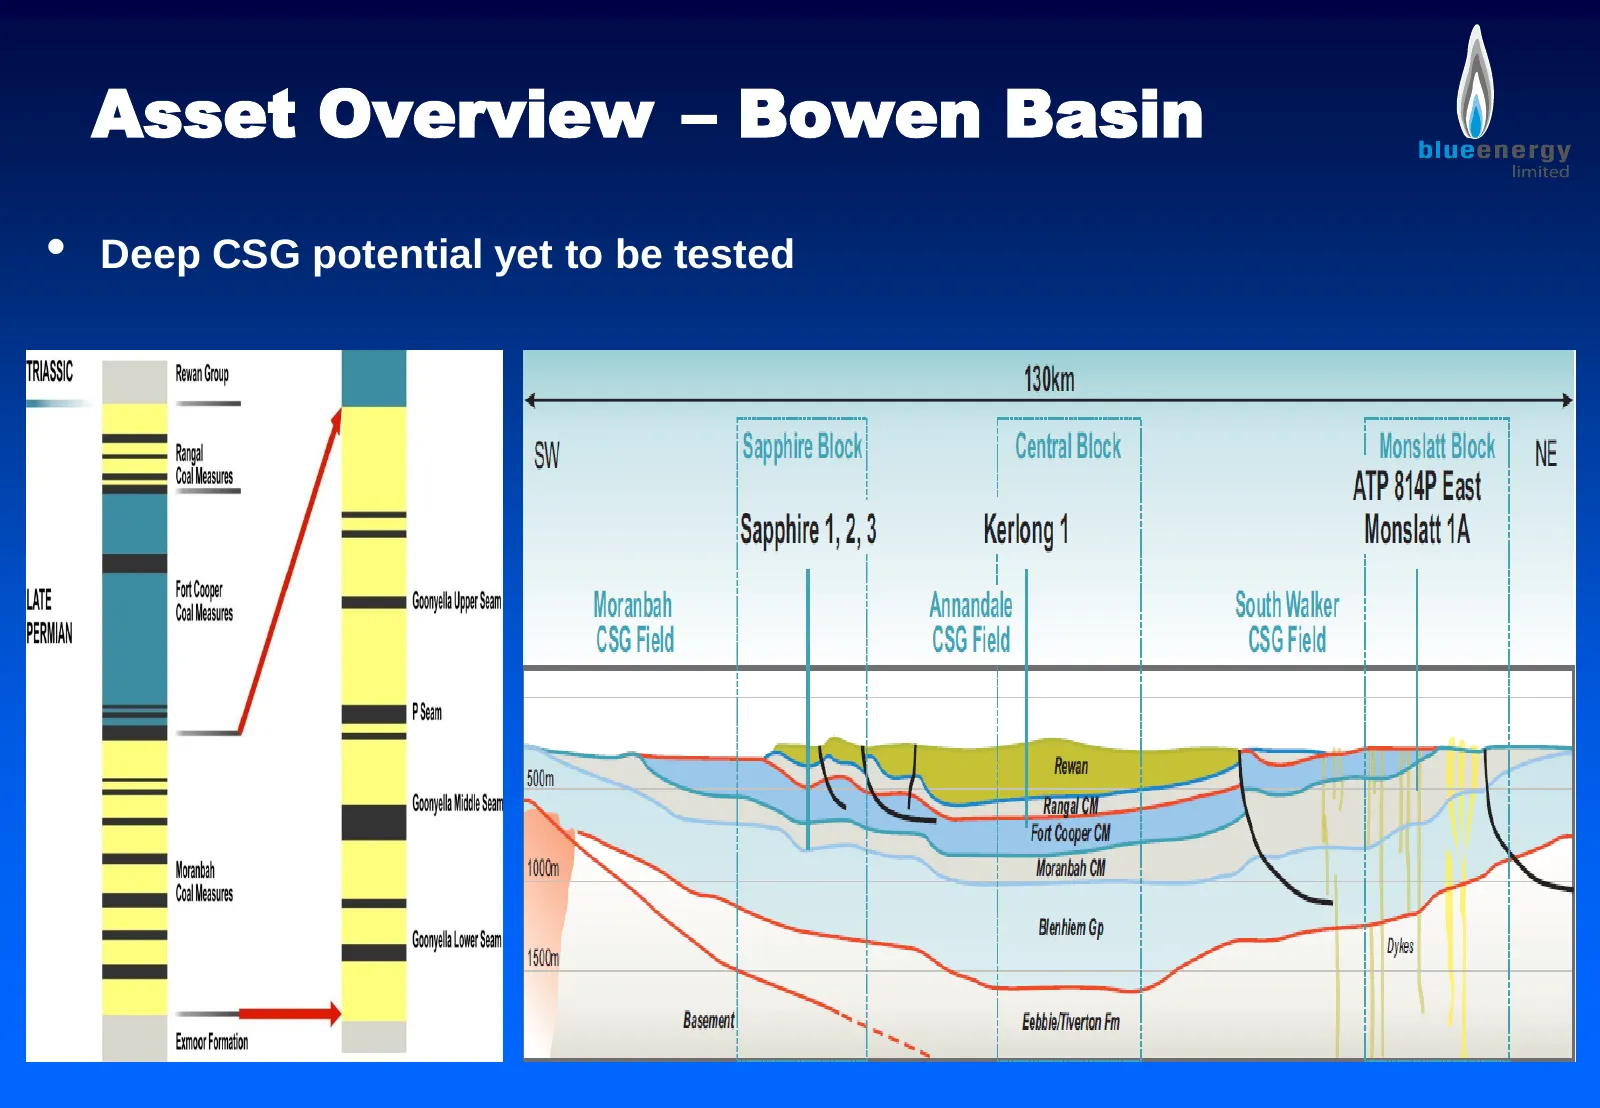
Asset Overview – Bowen Basin • Deep CSG potential yet to be tested
Slide 19: Galilee Basin
Asset Overview Galilee Basin ATP813P – Blue Energy 100%
Slide 20: Asset Overview – Galilee Basin
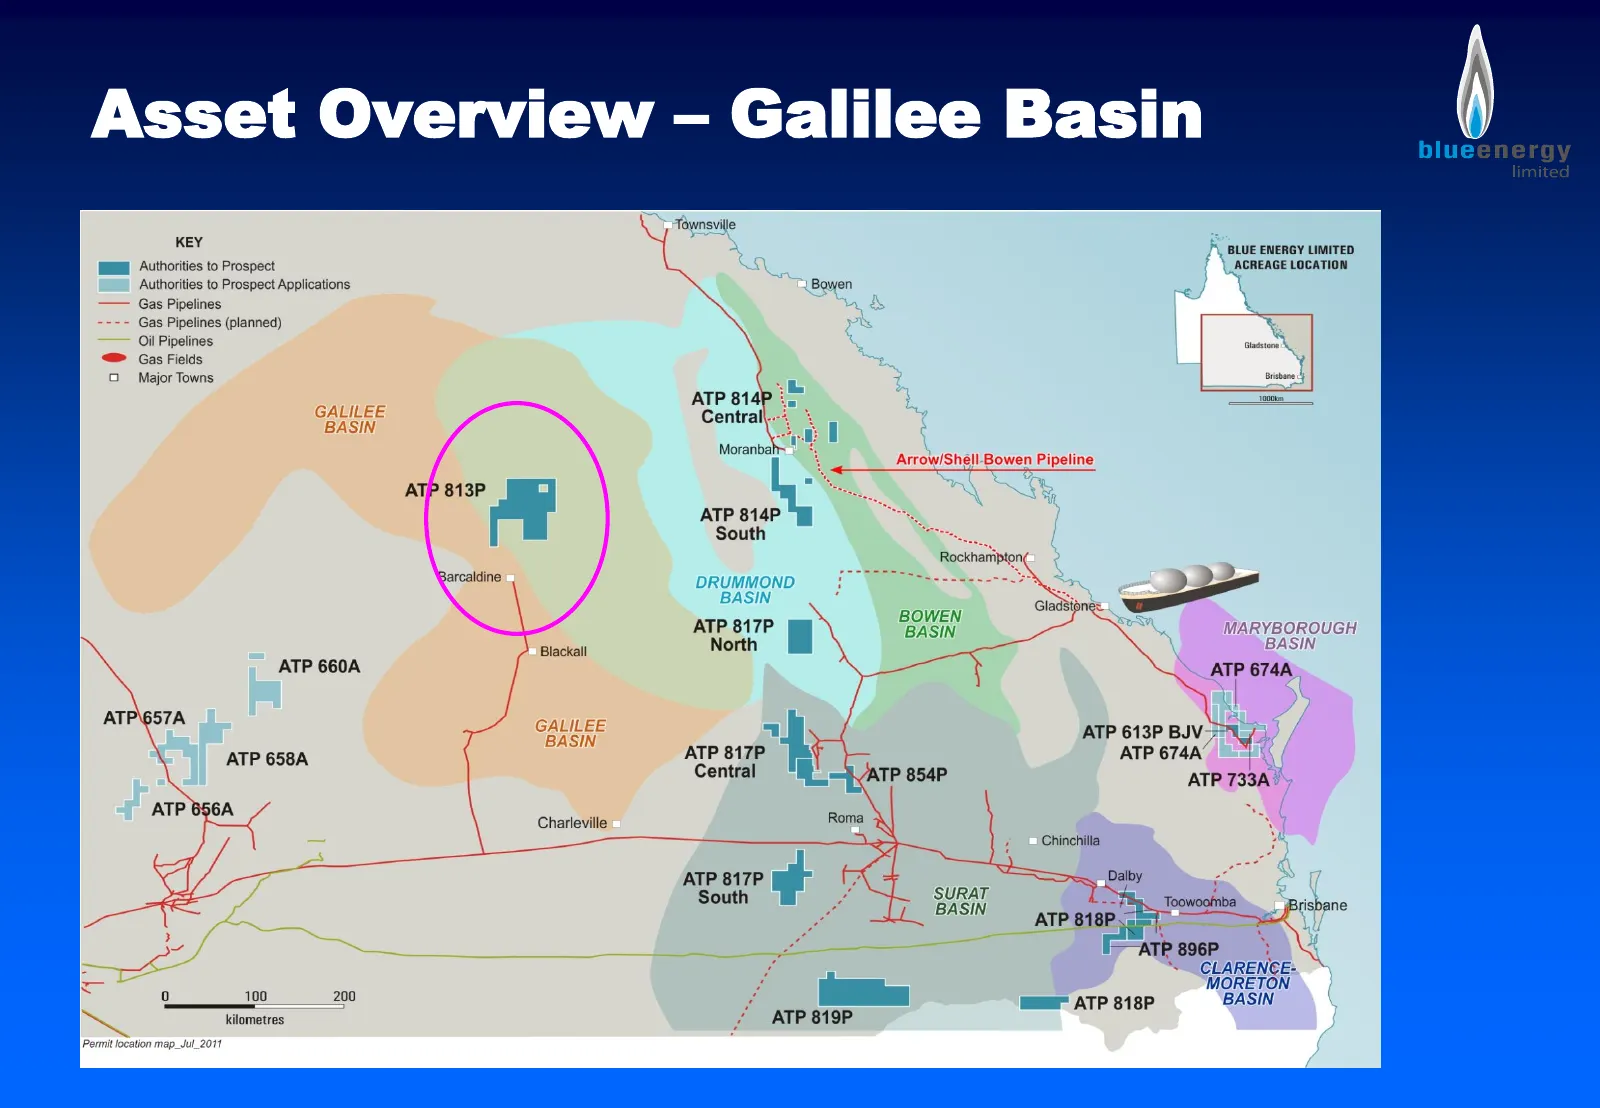
Asset Overview – Galilee Basin
Slide 21: Asset Overview – Galilee Basin
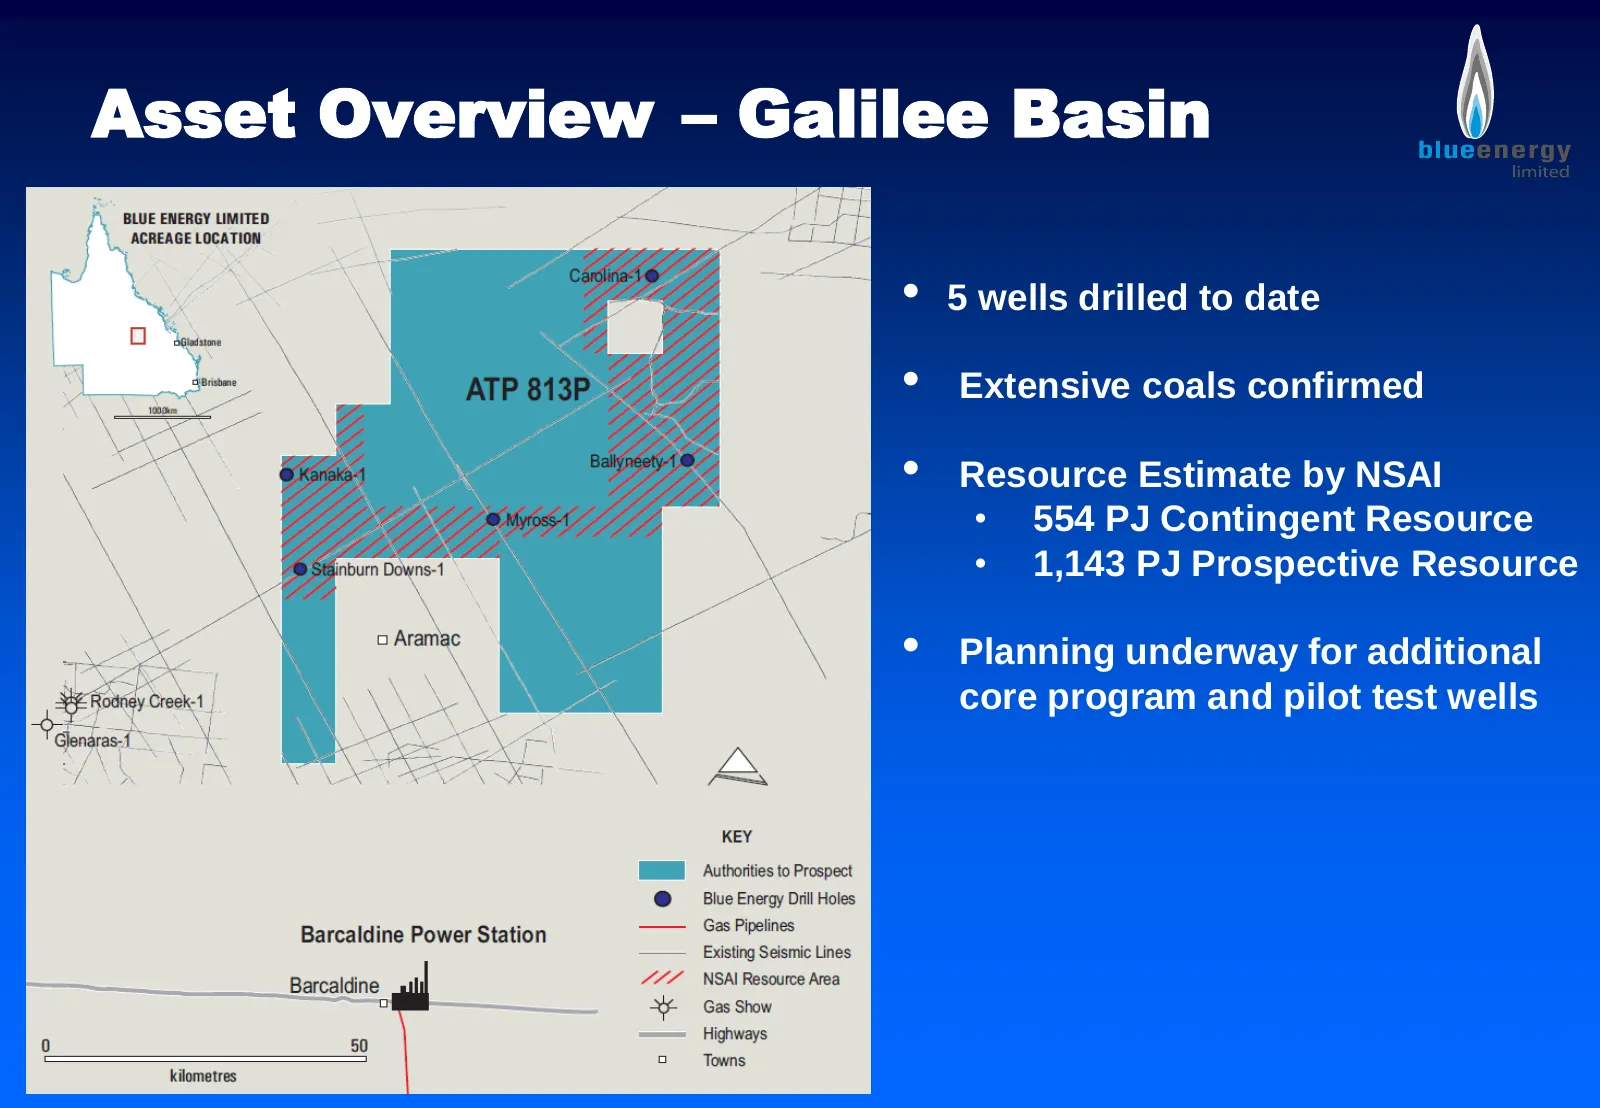
Asset Overview – Galilee Basin • 5 wells drilled to date • Extensive coals confirmed • Resource Estimate by NSAI • 554 PJ Contingent Resource • 1,143 PJ Prospective Resource • Planning underway for additional core program and pilot test wells
Slide 22: Asset Overview – Galilee Basin
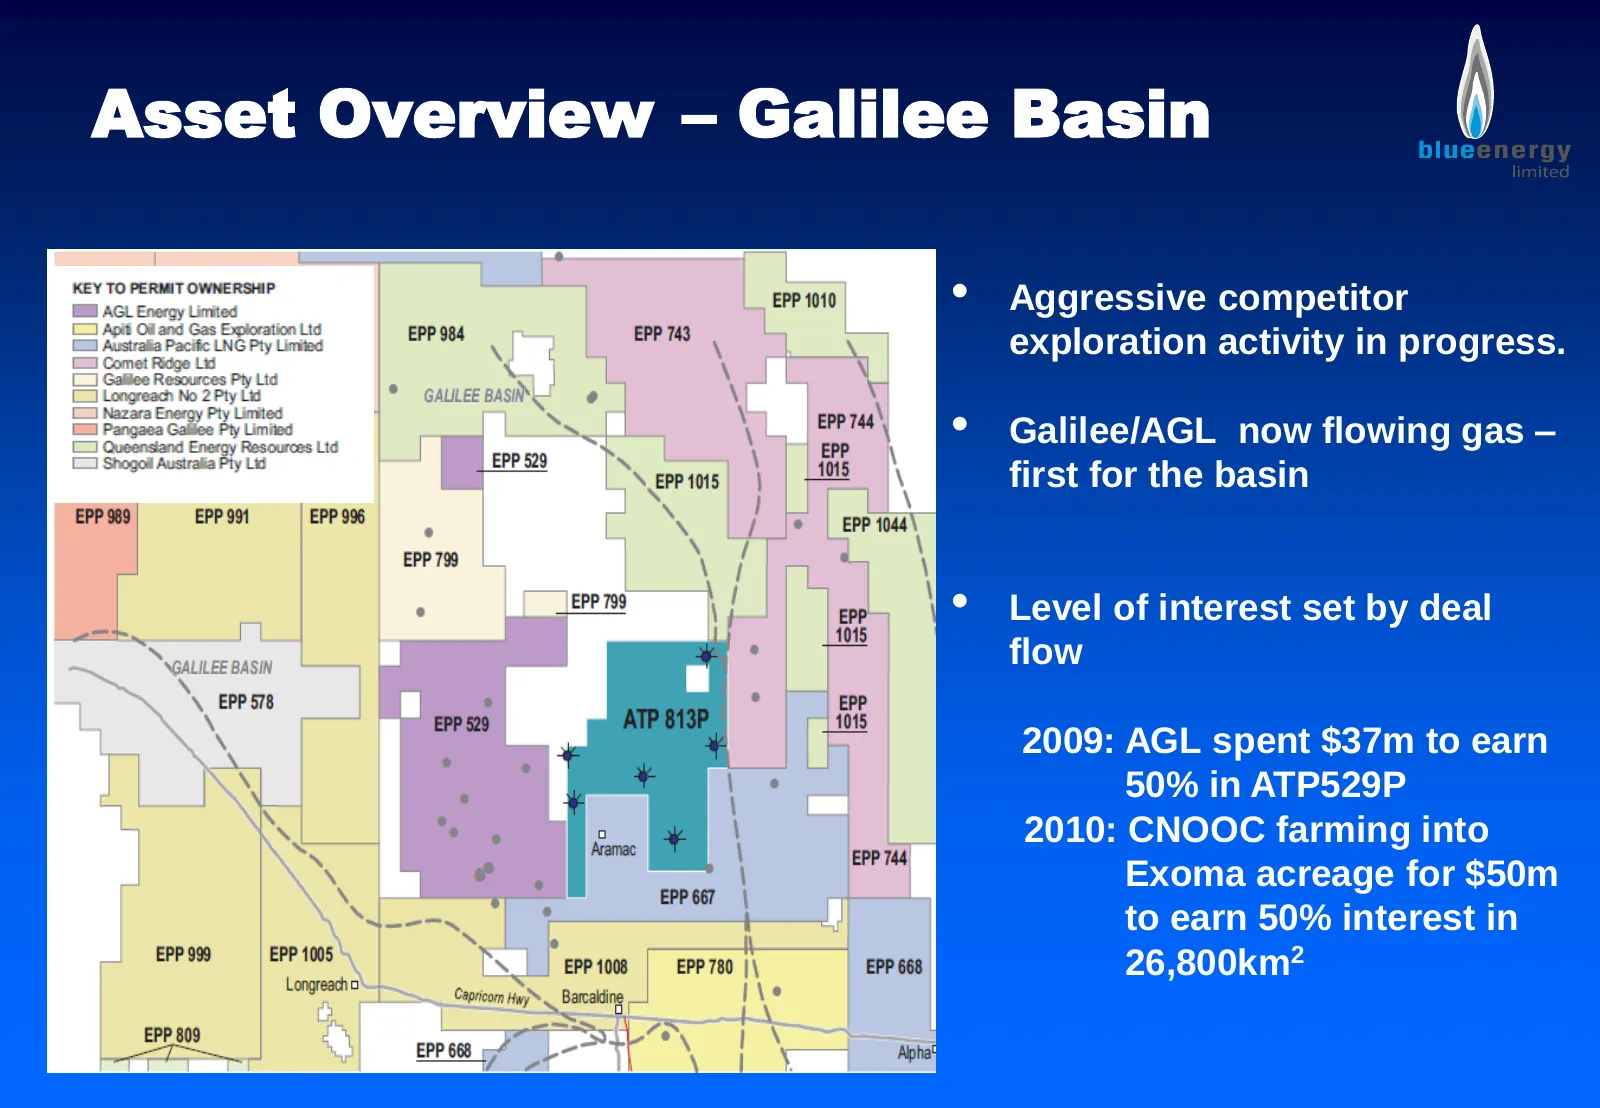
Asset Overview – Galilee Basin • Aggressive competitor exploration activity in progress. • Galilee/AGL now flowing gas – first for the basin • Level of interest set by deal flow 2009: AGL spent $37m to earn 50% in ATP529P 2010: CNOOC farming into Exoma acreage for $50m to earn 50% interest in 26,800
Slide 23: Asset Overview – Galilee Basin
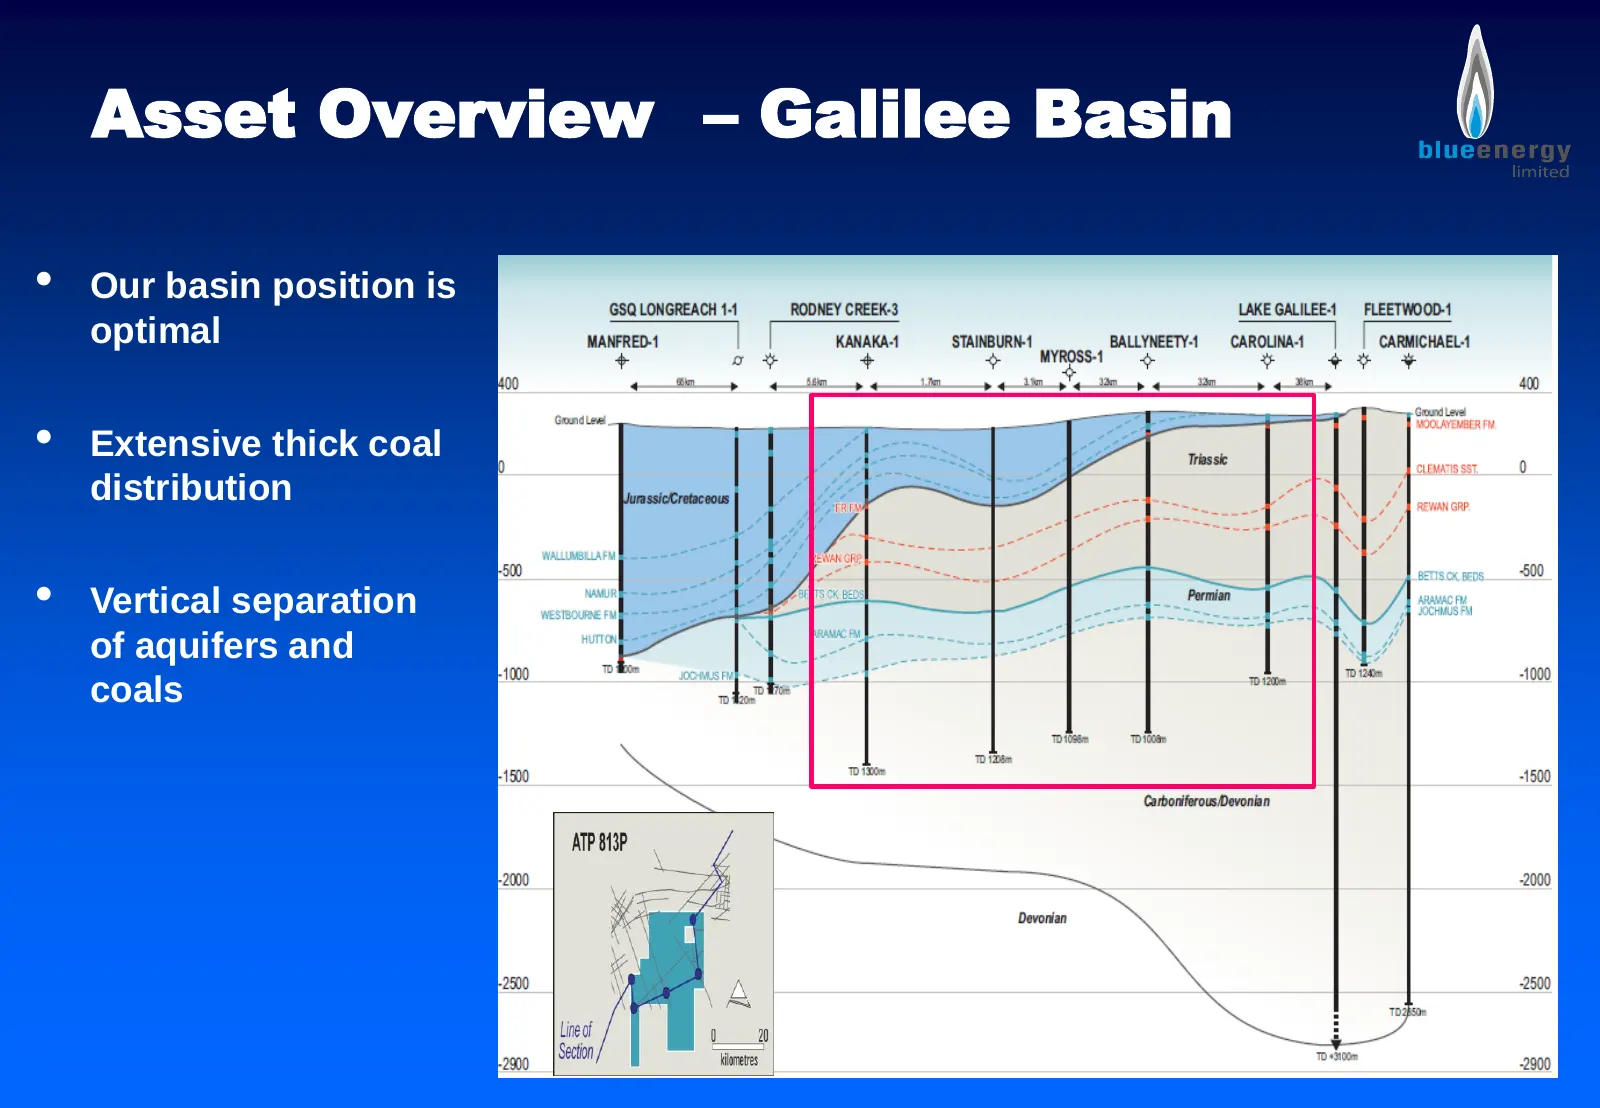
Asset Overview – Galilee Basin • Our basin position is optimal • Extensive thick coal distribution • Vertical separation of aquifers and coals
Slide 24: Maryborough Basin
Asset Overview Maryborough Basin ATP613P, ATP674A, ATP733A Blue Energy 75% (post farm in)
Slide 25: Asset Overview – Maryborough Basin
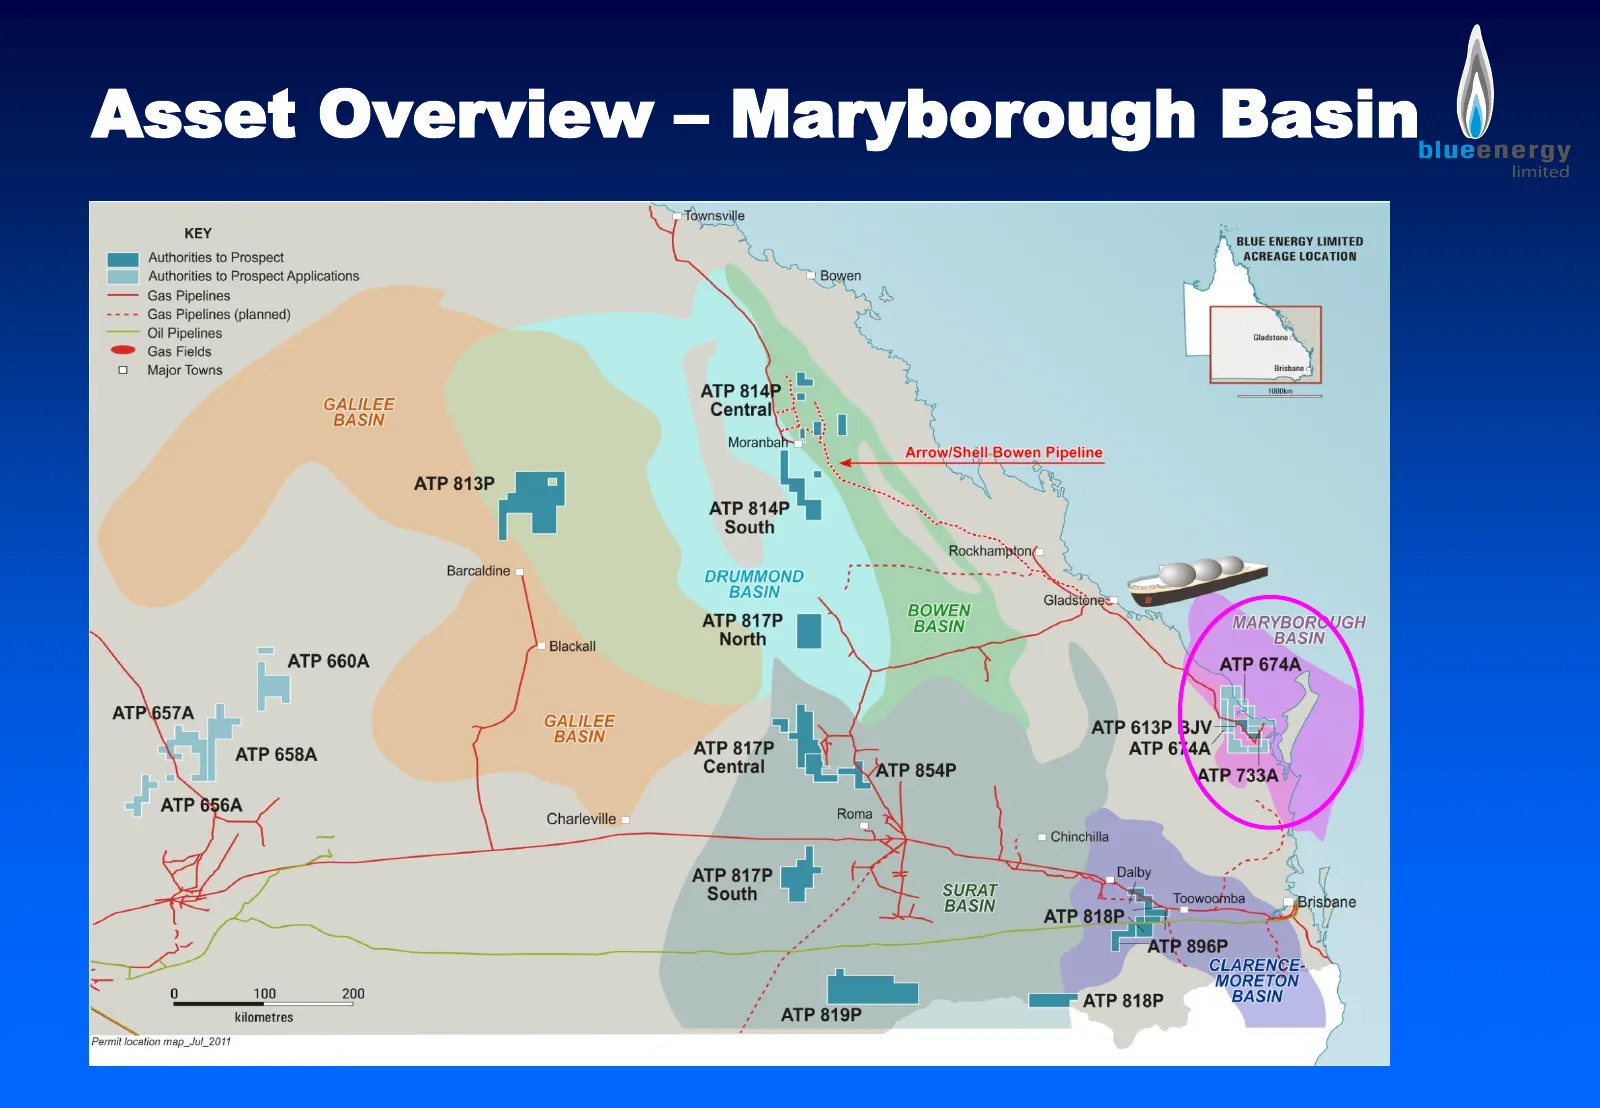
Asset Overview – Maryborough Basin
Slide 26: Asset Overview – Maryborough Basin
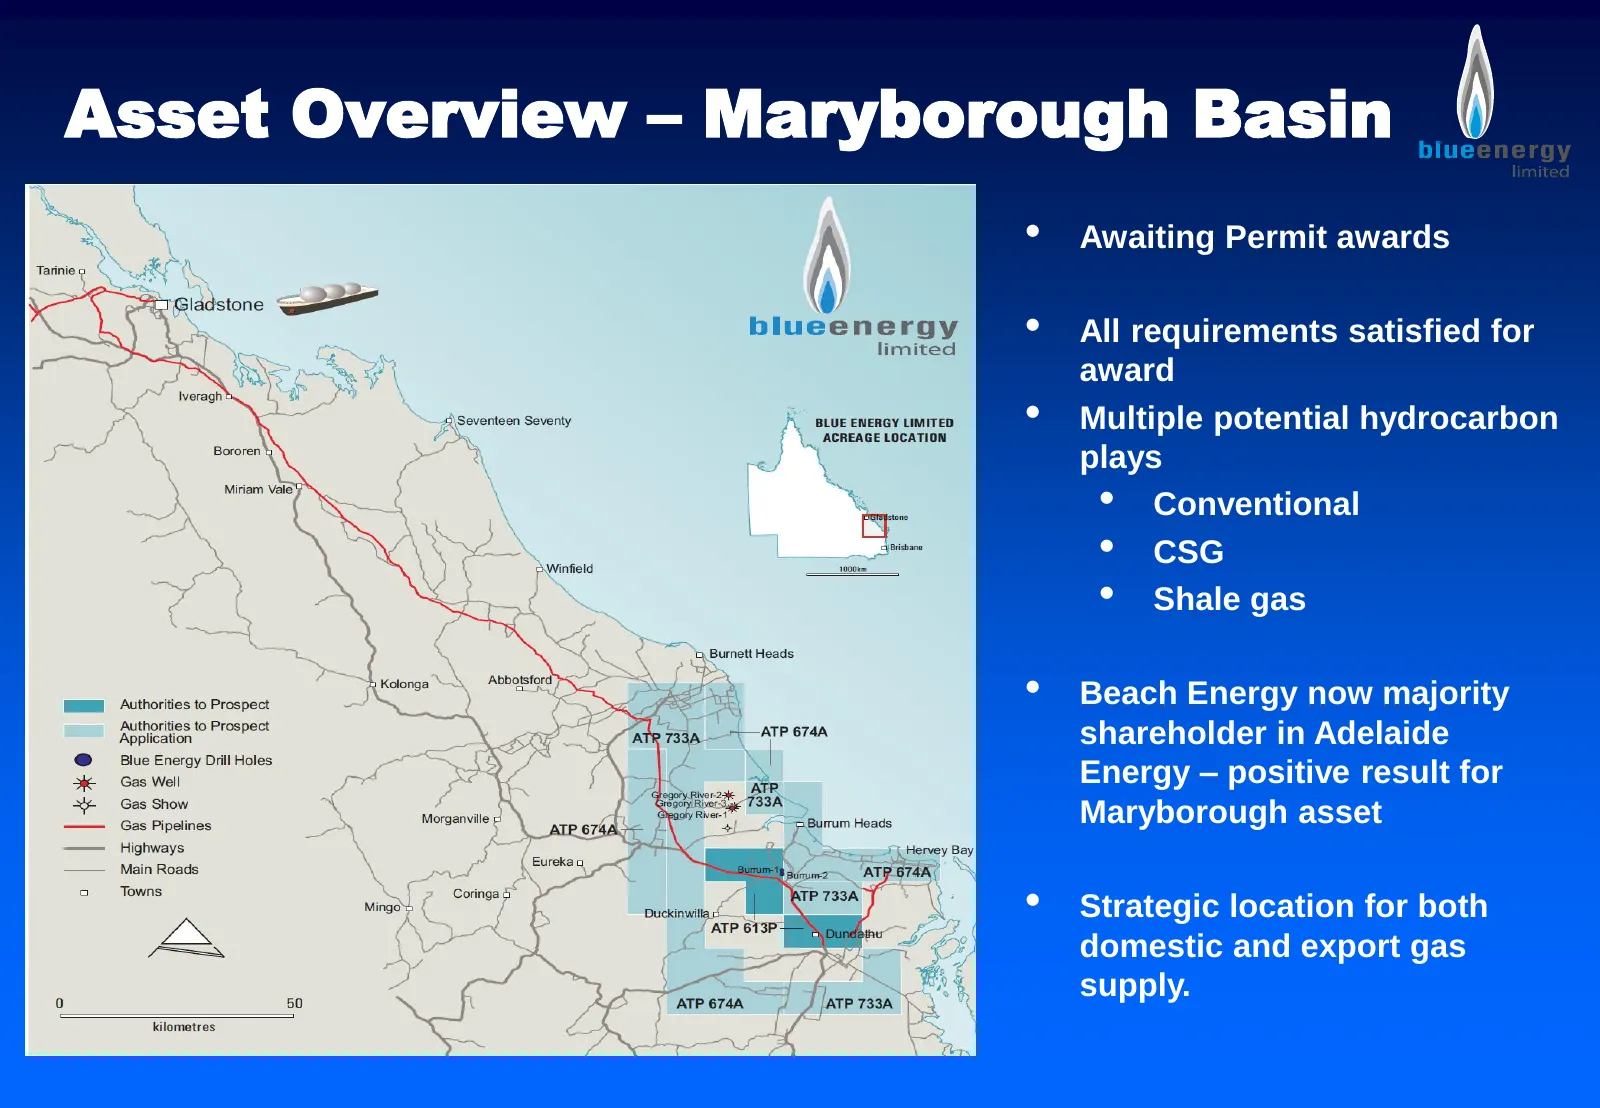
Asset Overview – Maryborough Basin • Awaiting Permit awards • All requirements satisfied for award • Multiple potential hydrocarbon plays • Conventional • CSG • Shale gas • Beach Energy now majority shareholder in Adelaide Energy – positive result for Maryborough asset • Strategic location for both
Slide 27: Asset Overview – Maryborough Plays
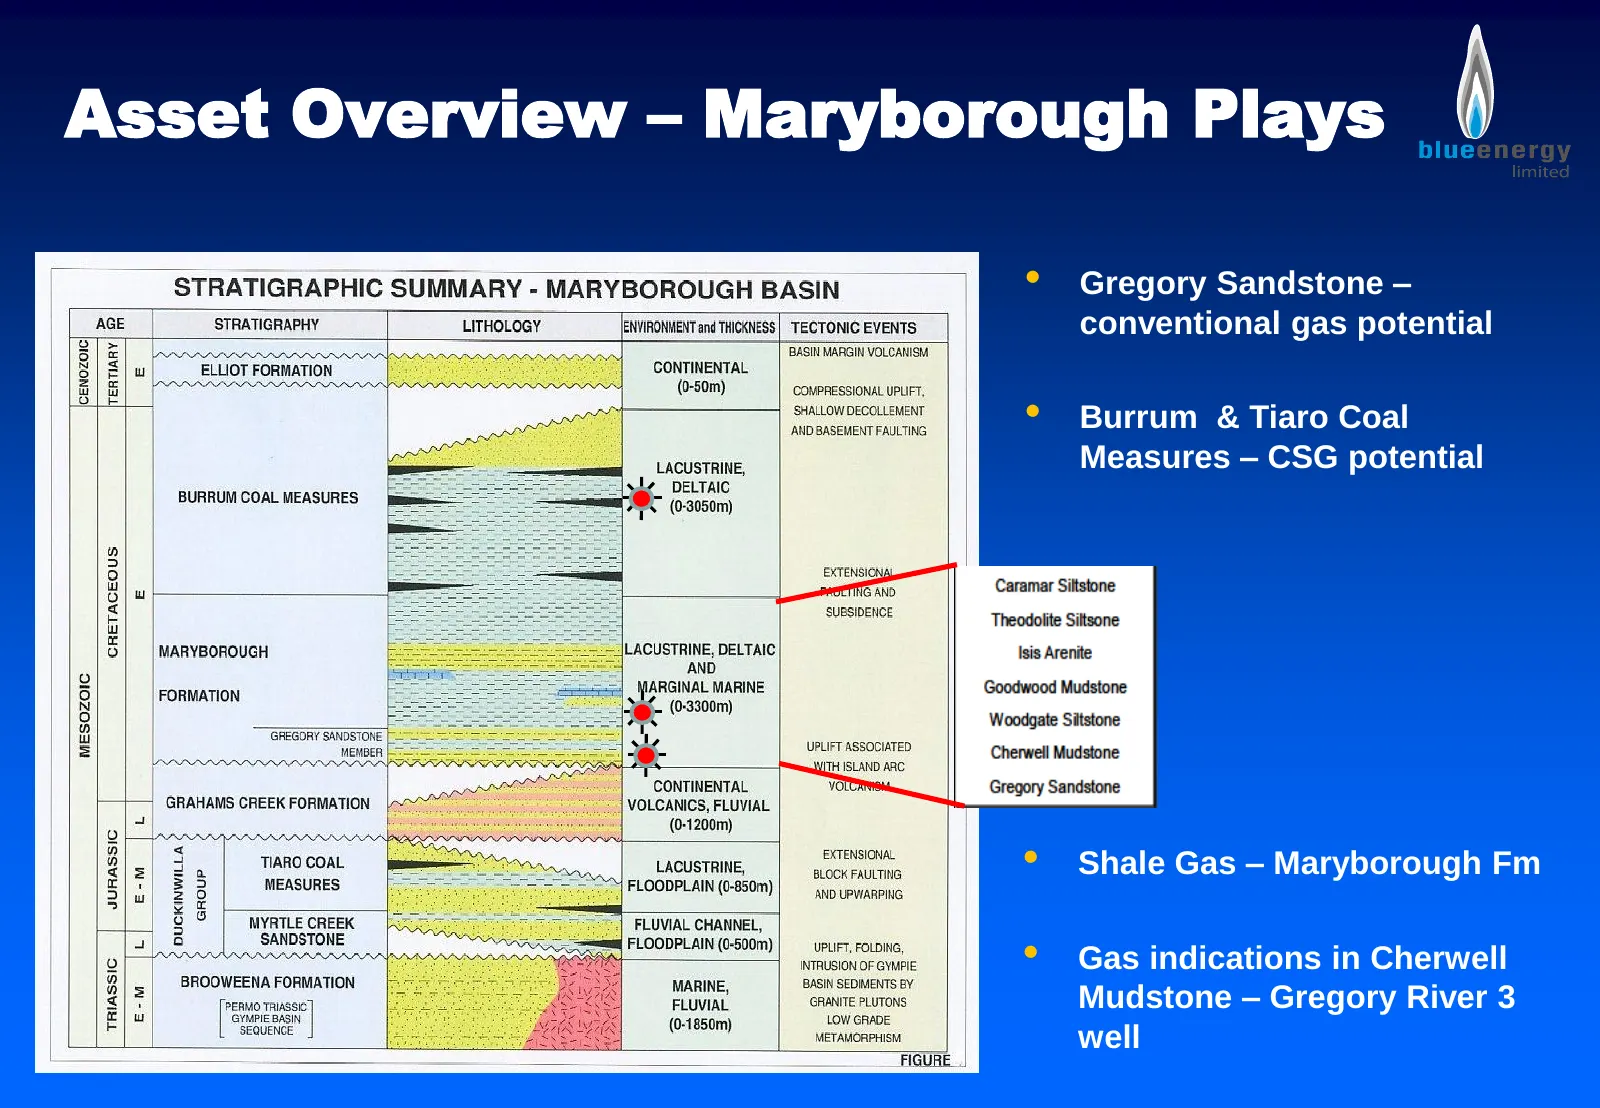
Asset Overview – Maryborough Plays • Gregory Sandstone – conventional gas potential • Burrum & Tiaro Coal Measures – CSG potential • Shale Gas – Maryborough Fm • Gas indications in Cherwell Mudstone – Gregory River 3 well
Slide 28: EIA Assessment
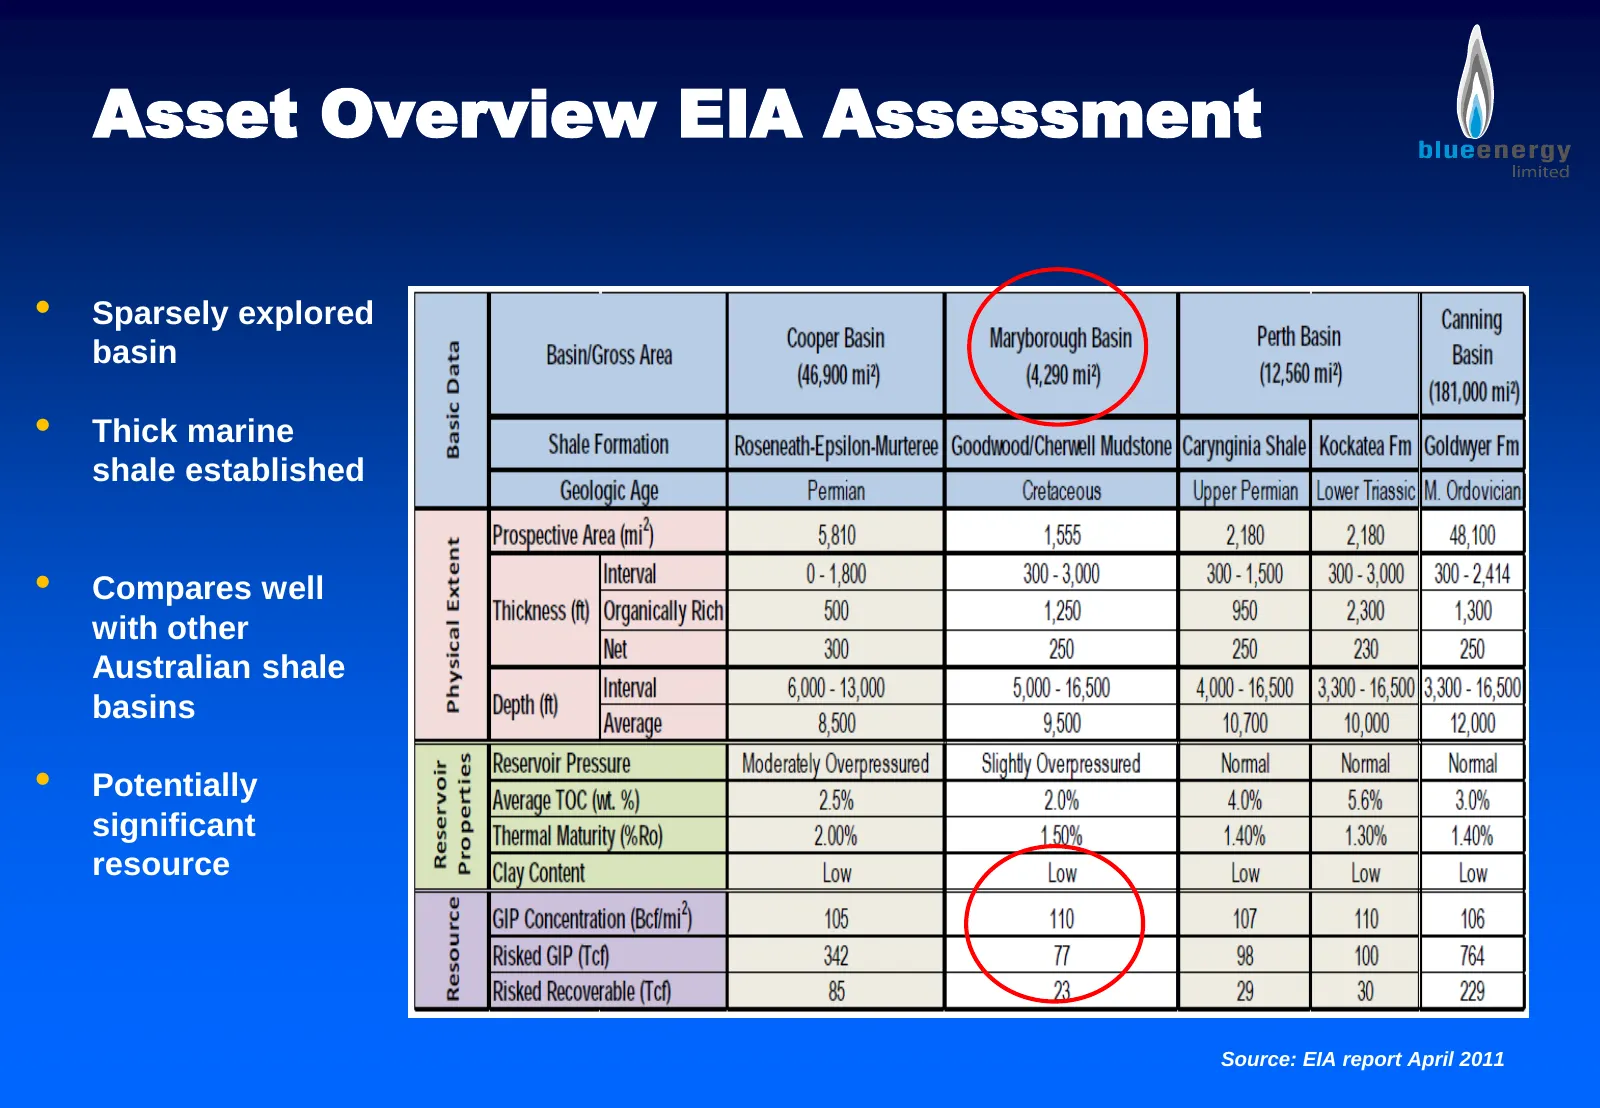
Asset Overview EIA Assessment • Sparsely explored basin • Thick marine shale established • Compares well with other Australian shale basins • Potentially significant resource Source: EIA report April 2011
Slide 29: Forward Plan
Forward Plan • Bowen acreage – Pilot testing continues over wet season - four new completions (Monslatt and Sapphire blocks) • Maryborough acreage - on award, commence work and drill deep gas well • Galilee acreage – pilot well program to establish production • Build exploration portfolio
Slide 30: Coal Seam Gas – Some Perspective
Coal Seam Gas – Some Perspective
Slide 31: CSG - some perspective
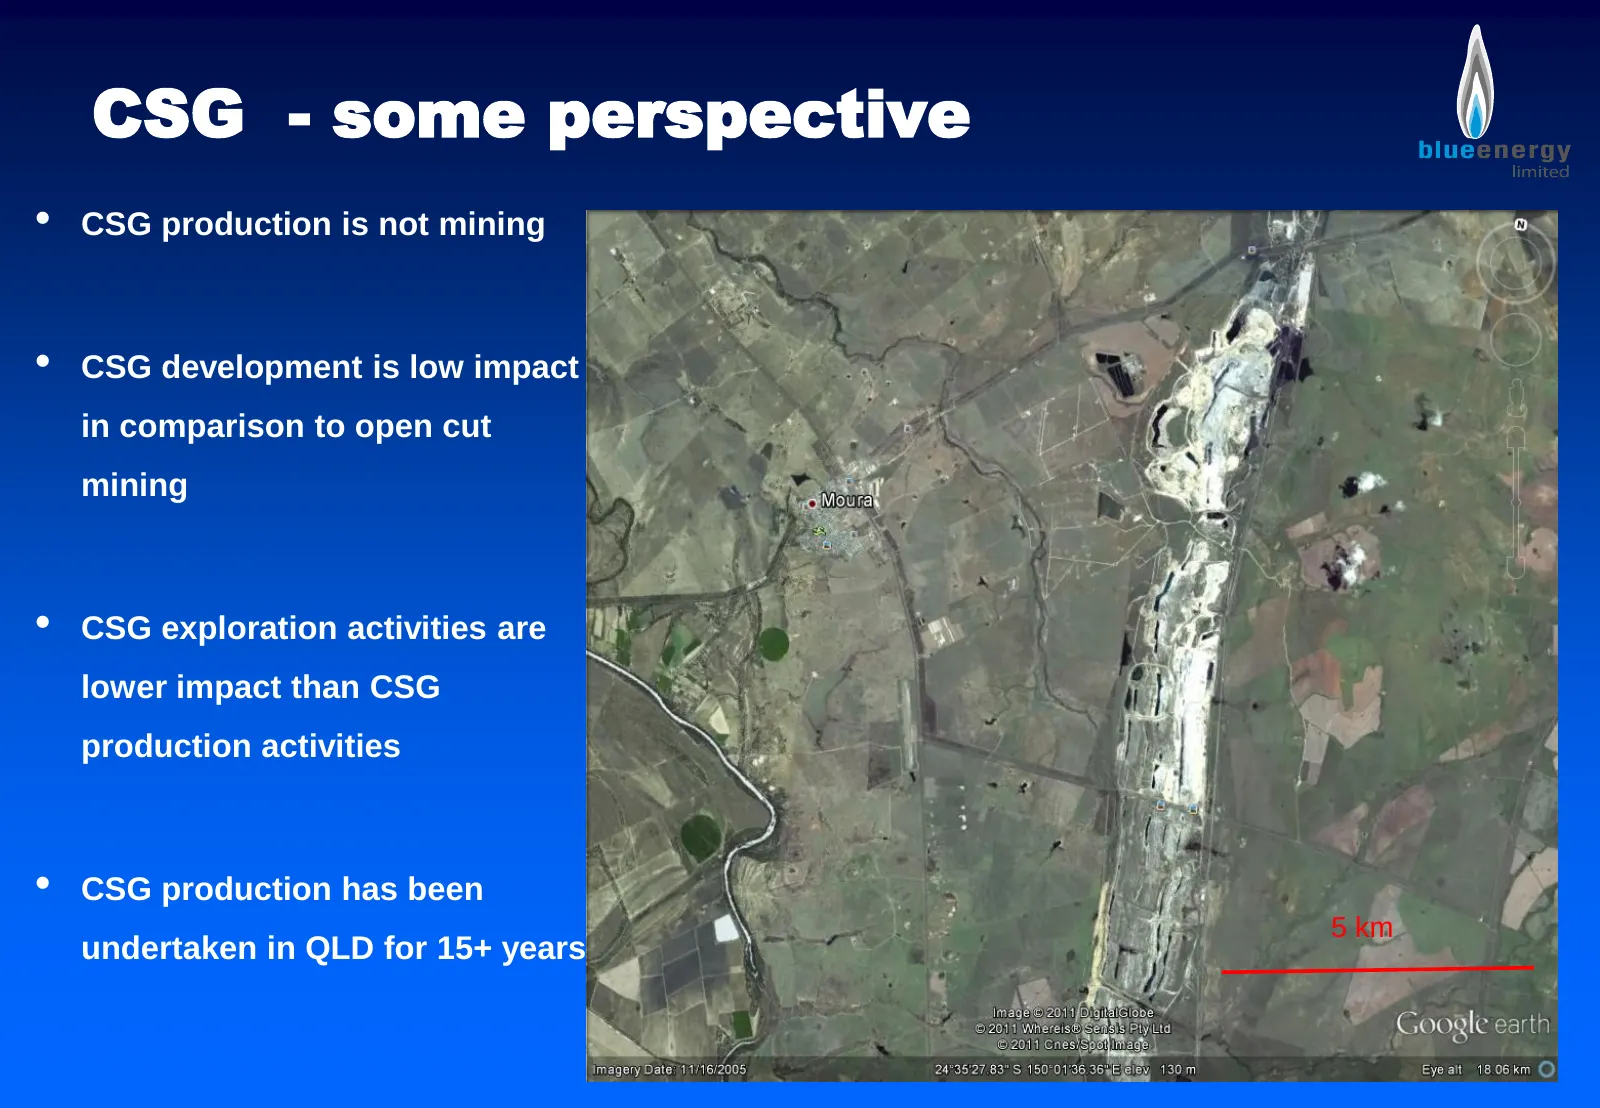
CSG - some perspective • CSG production is not mining • CSG development is low impact in comparison to open cut mining • CSG exploration activities are lower impact than CSG production activities • CSG production has been 5 km undertaken in QLD for 15+ years
Slide 32: CSG - some perspective
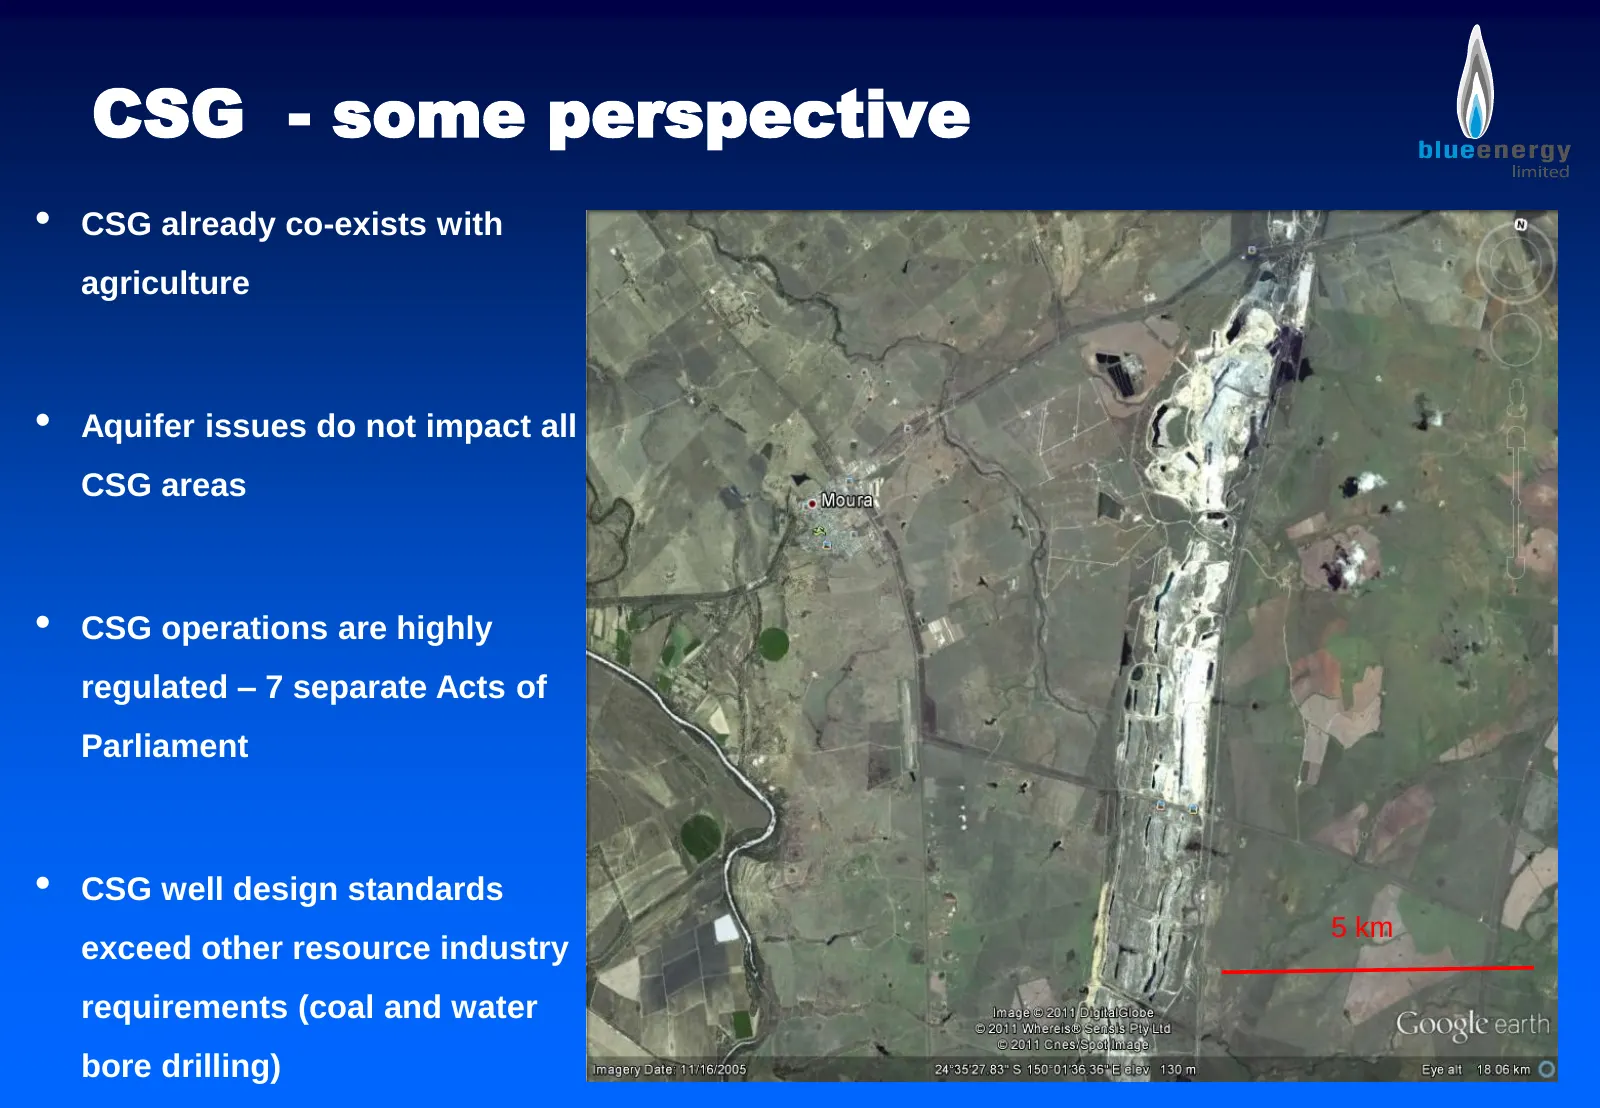
CSG - some perspective • CSG already co-exists with agriculture • Aquifer issues do not impact all CSG areas • CSG operations are highly regulated – 7 separate Acts of Parliament • CSG well design standards 5 km exceed other resource industry requirements (coal and water bore drilling)
Slide 33: CSG – some perspective
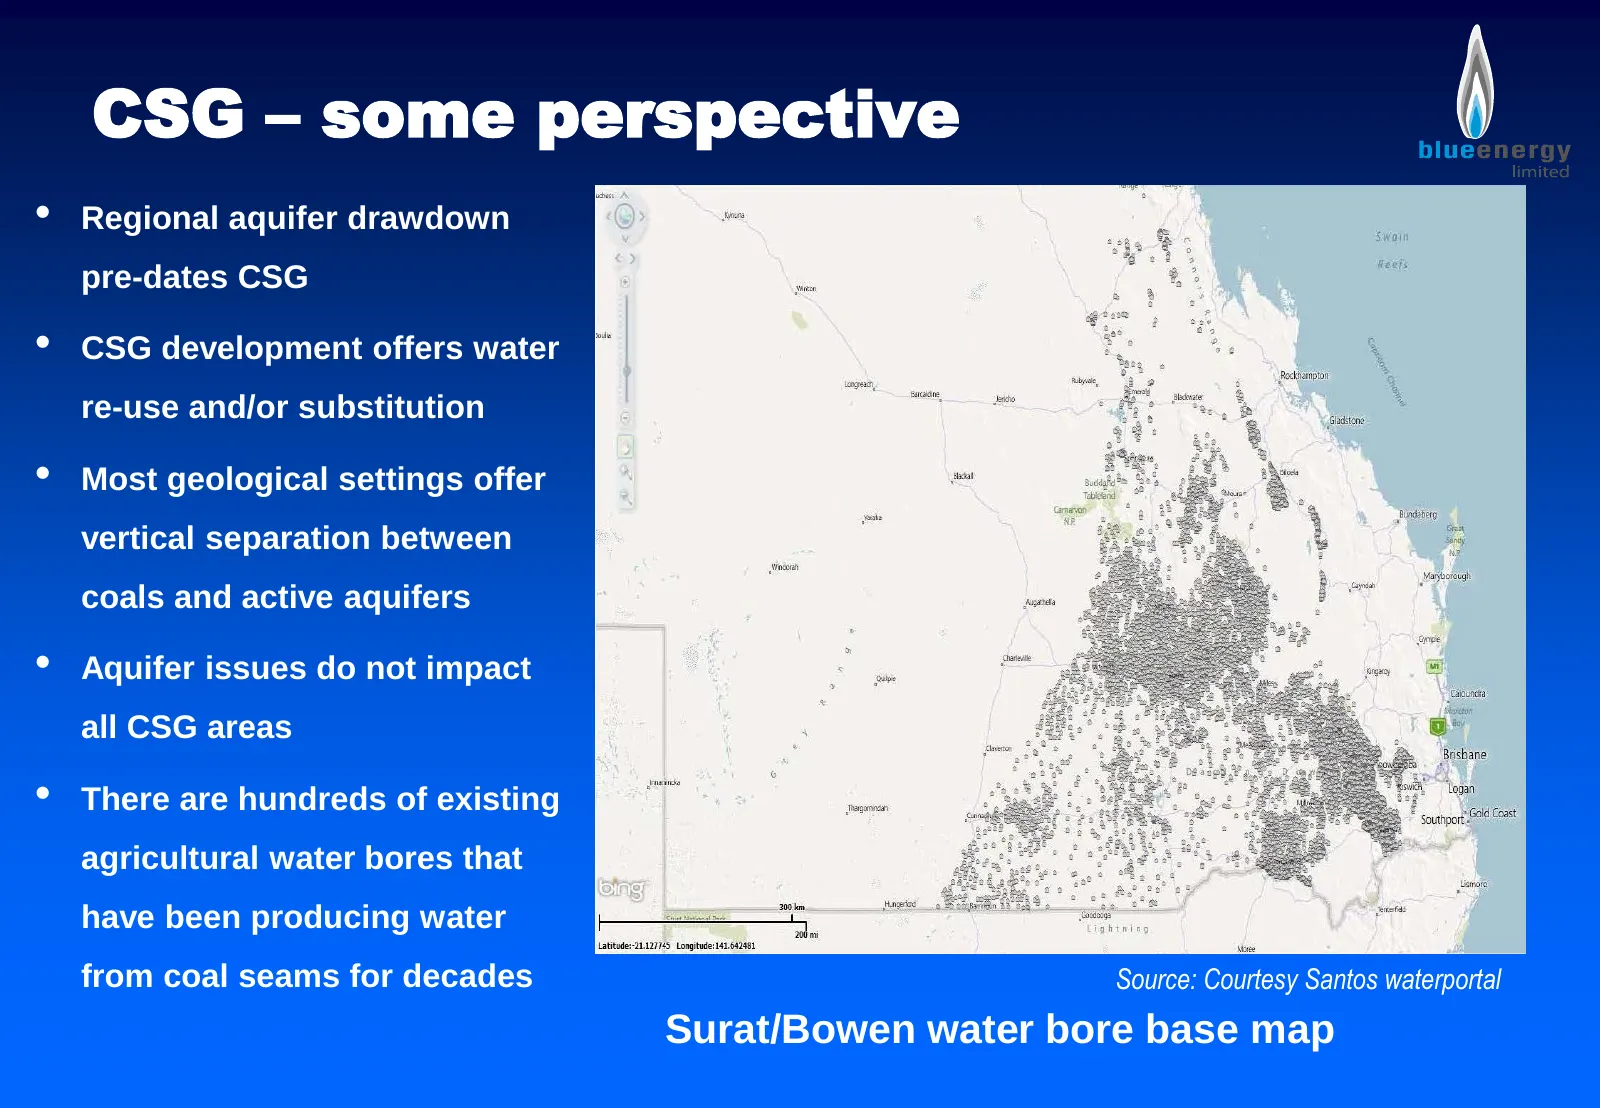
CSG – some perspective • Regional aquifer drawdown pre-dates CSG • CSG development offers water re-use and/or substitution • Most geological settings offer vertical separation between coals and active aquifers • Aquifer issues do not impact all CSG areas • There are hundreds of existing agricultural
Slide 34: Fossil Fuels – vital for electricity
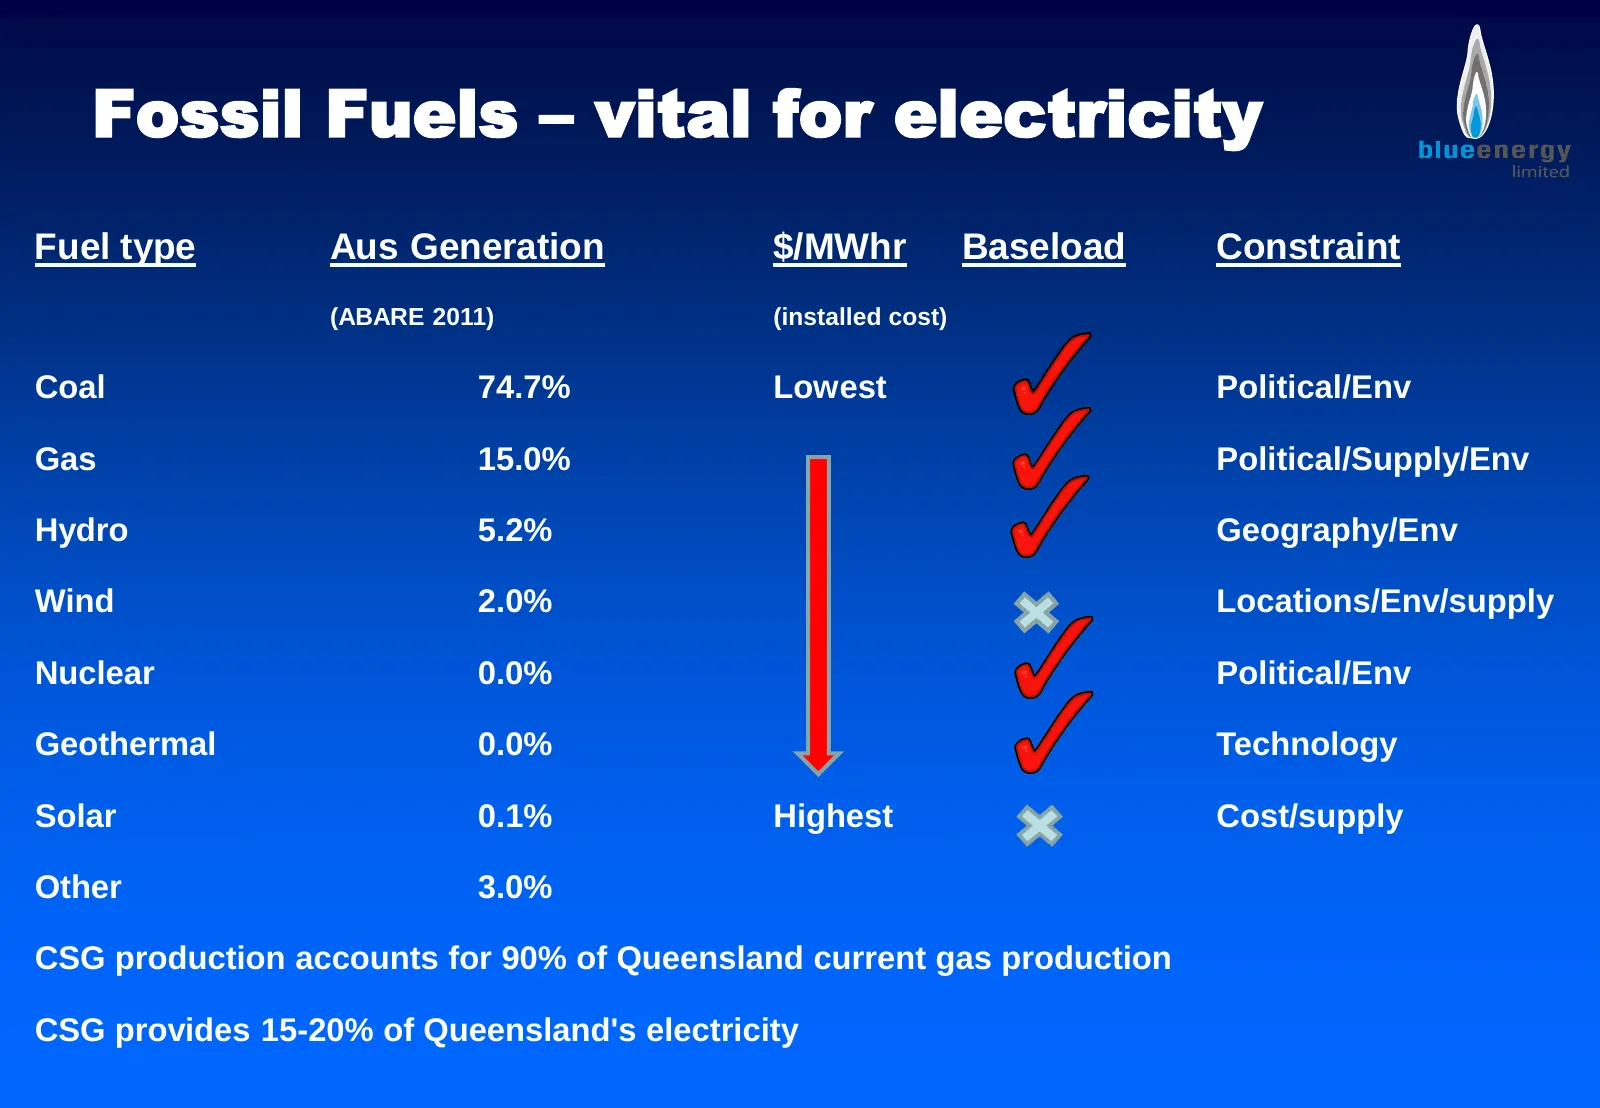
Fossil Fuels – vital for electricity Fuel type Aus Generation $/MWhr Baseload Constraint (ABARE 2011) (installed cost) Coal 74.7% Lowest Political/Env Gas 15.0% Political/Supply/Env Hydro 5.2% Geography/Env Wind 2.0% Locations/Env/supply Nuclear 0.0% Political/Env Geothermal 0.0% Technology Solar 0.
Slide 35: The Push for Renewables
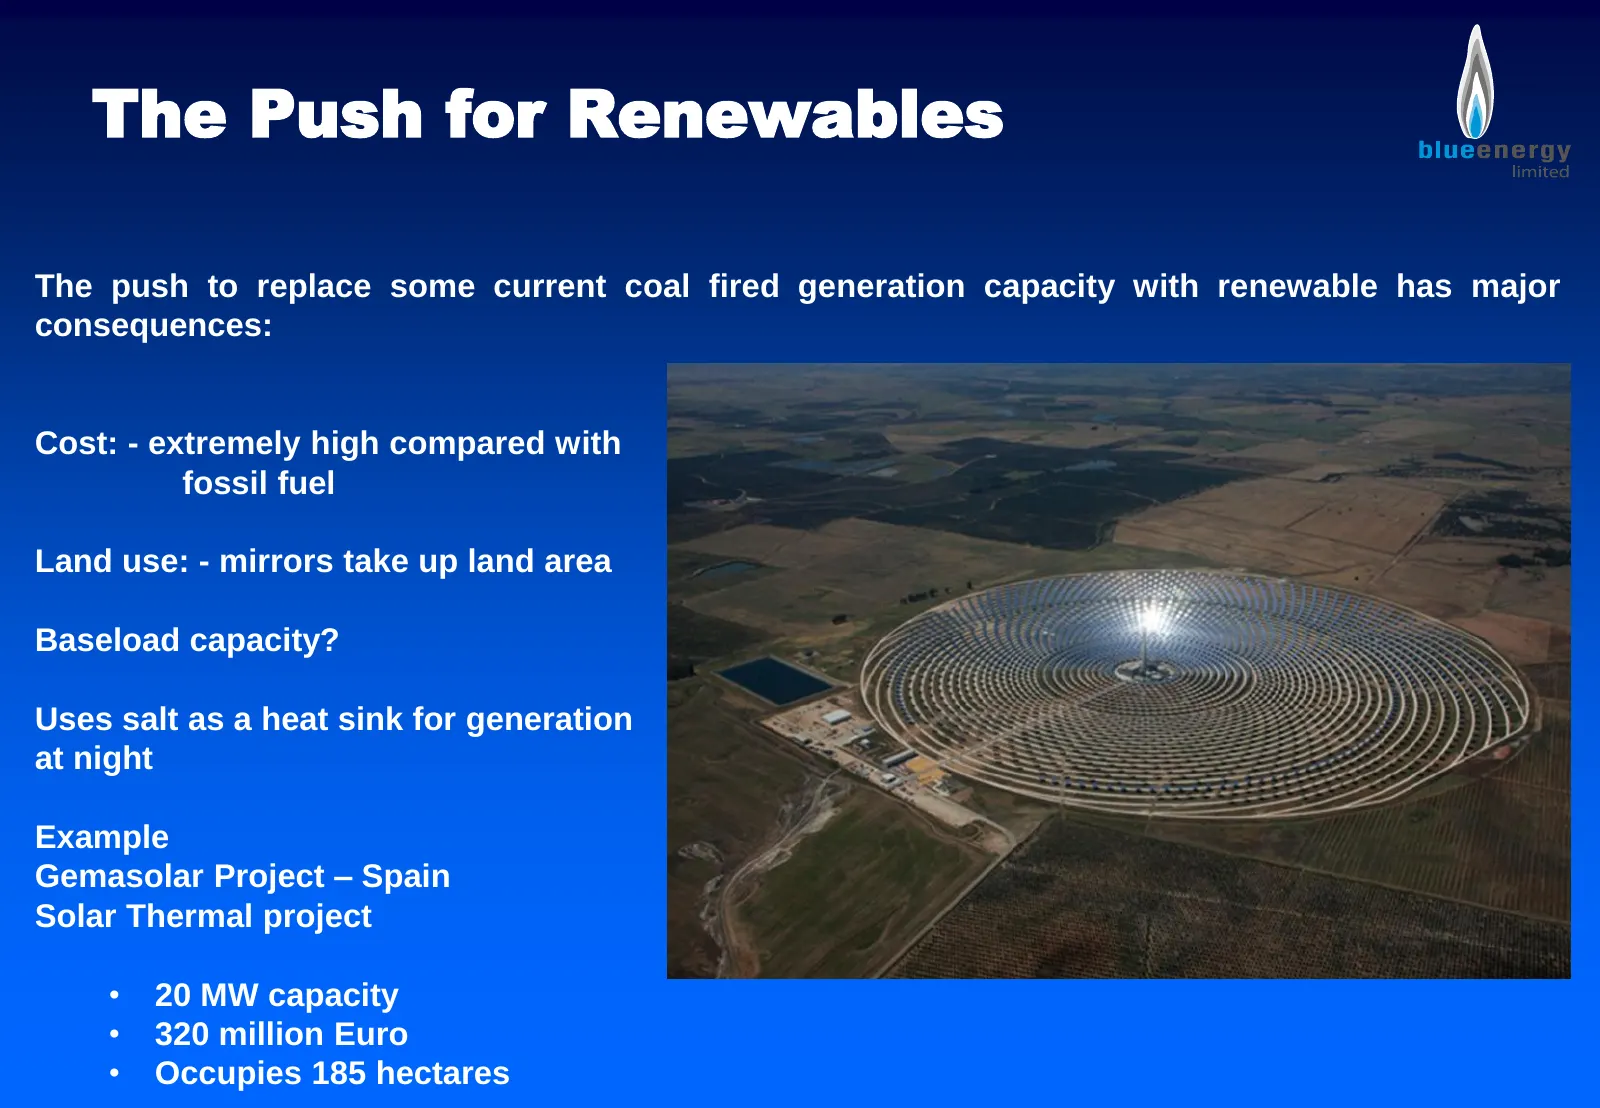
The Push for Renewables The push to replace some current coal fired generation capacity with renewable has major consequences: Cost: - extremely high compared with fossil fuel Land use: - mirrors take up land area Baseload capacity? Uses salt as a heat sink for generation at night Example Gemasolar
Slide 36: The Push for Renewables
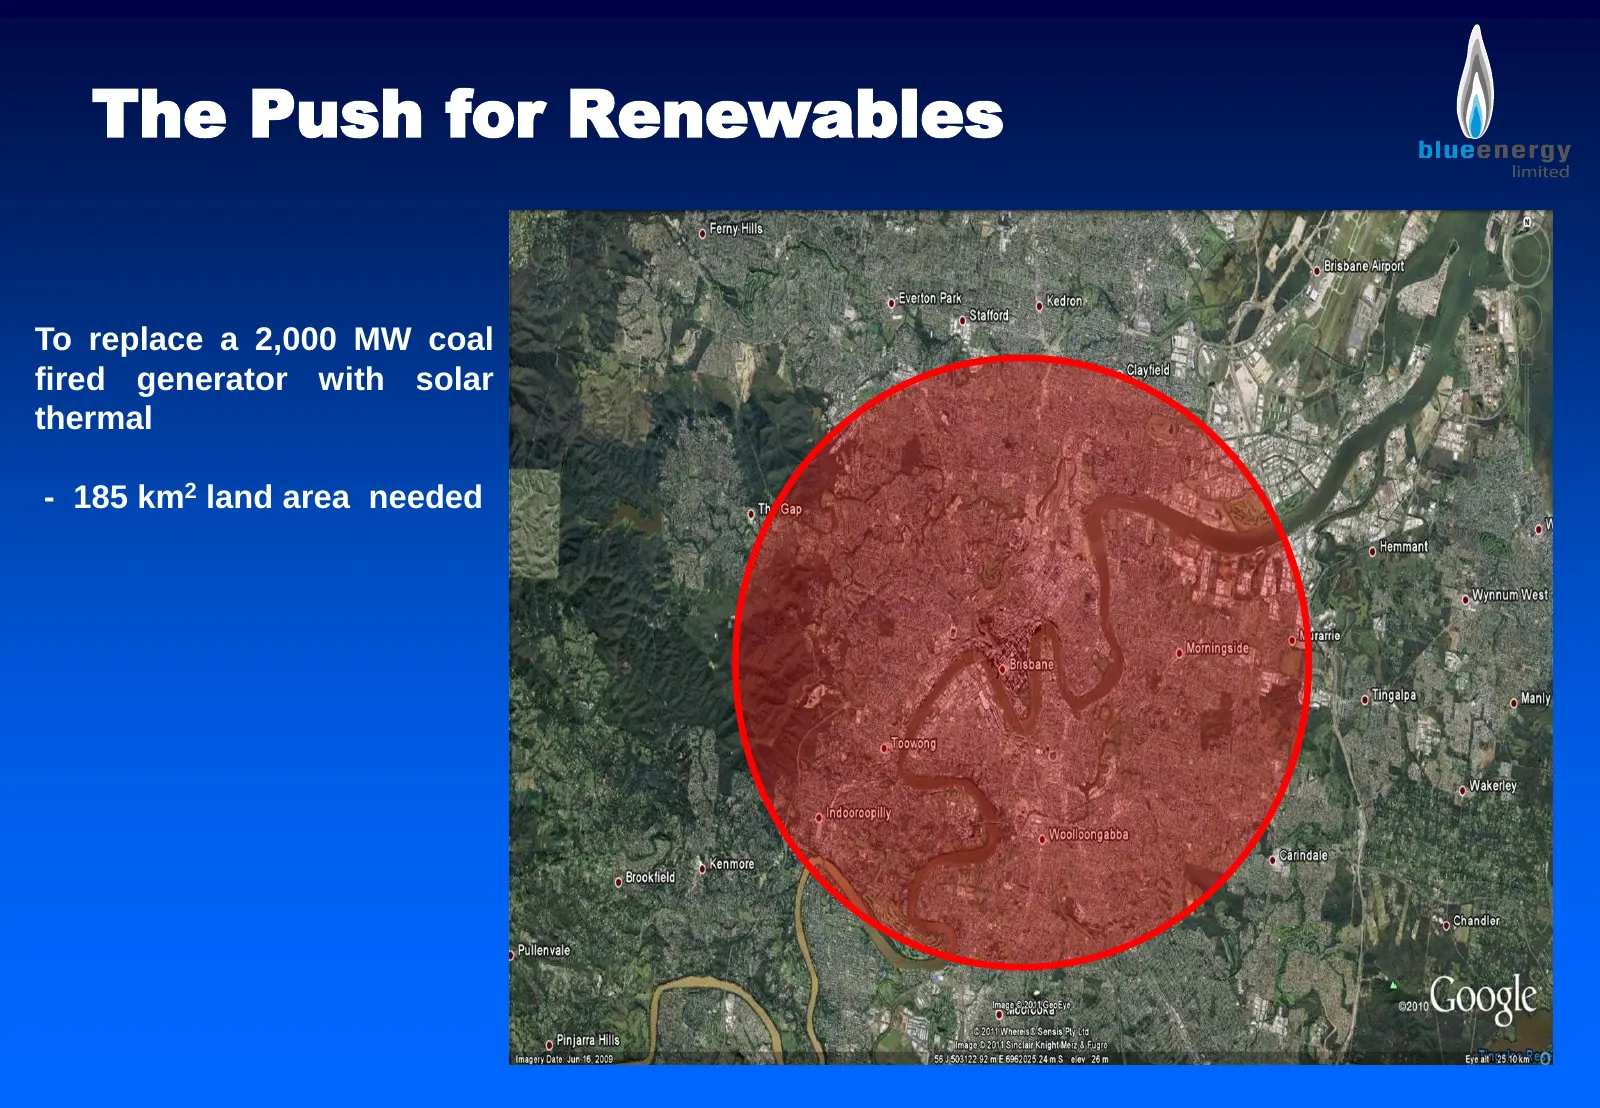
The Push for Renewables To replace a 2,000 MW coal fired generator with solar thermal - 185 km2 land area needed
Slide 37: There is an increasing role for Gas
There is an increasing role for Gas Domestically for power – but at an international price Globally – as LNG becomes a fuel of choice for developed nations …… and Blue Energy is well positioned to take advantage
Slide 38: www.blueenergy.com.au
www.blueenergy.com.au info@blueenergy.com.au
Source: Internet Archive copy of blueenergy.com.au
More decks from Blue Energy Limited
 Shareholder Meeting (November 2026)25 slides · Nov 17, 2026
 Shareholder Meeting (November 2025)21 slides · Nov 18, 2025
 Shareholder Meeting (November 2024)28 slides · Nov 12, 2024
 MST Financial Oil and Gas Forum 202420 slides · Jun 19, 2024
 Shareholder Meeting (November 2023)40 slides · Nov 14, 2023
 Corporate Update (June 2023)12 slides · Jun 20, 2023