Emaar Properties (P.J.S.C) · DFM:EMAAR
Emaar Properties (P.J.S.C) — H1 2022 Earnings Presentation
73 slides from Emaar Properties (P.J.S.C)'s earnings presentation, Sep 15, 2022
Slide 1: Prepared for the Future: Investor Presentation for H1-2022
Prepared for the Future Built on Strength, Prudence & Resilience. Investor Presentation for H1-2022 0 |
Slide 2: Disclaimer
Disclaimer Emaar Properties PJSC, for themselves and for Emaar Group, give notice that: The particulars of this presentation do not constitute any part of an offer or a contract. Given that the presentation contains information based on forecasts and roll outs, all statements contained in this prese
Slide 3: Discussion Summary
Discussion Summary Investing In Emaar Expanding Footprint in UAE & International Markets Business Strategy & Outlook H1 2022 Results Update Sustainability Annexure 2 |
Slide 4: Investing In Emaar
Investing In Emaar 3 |
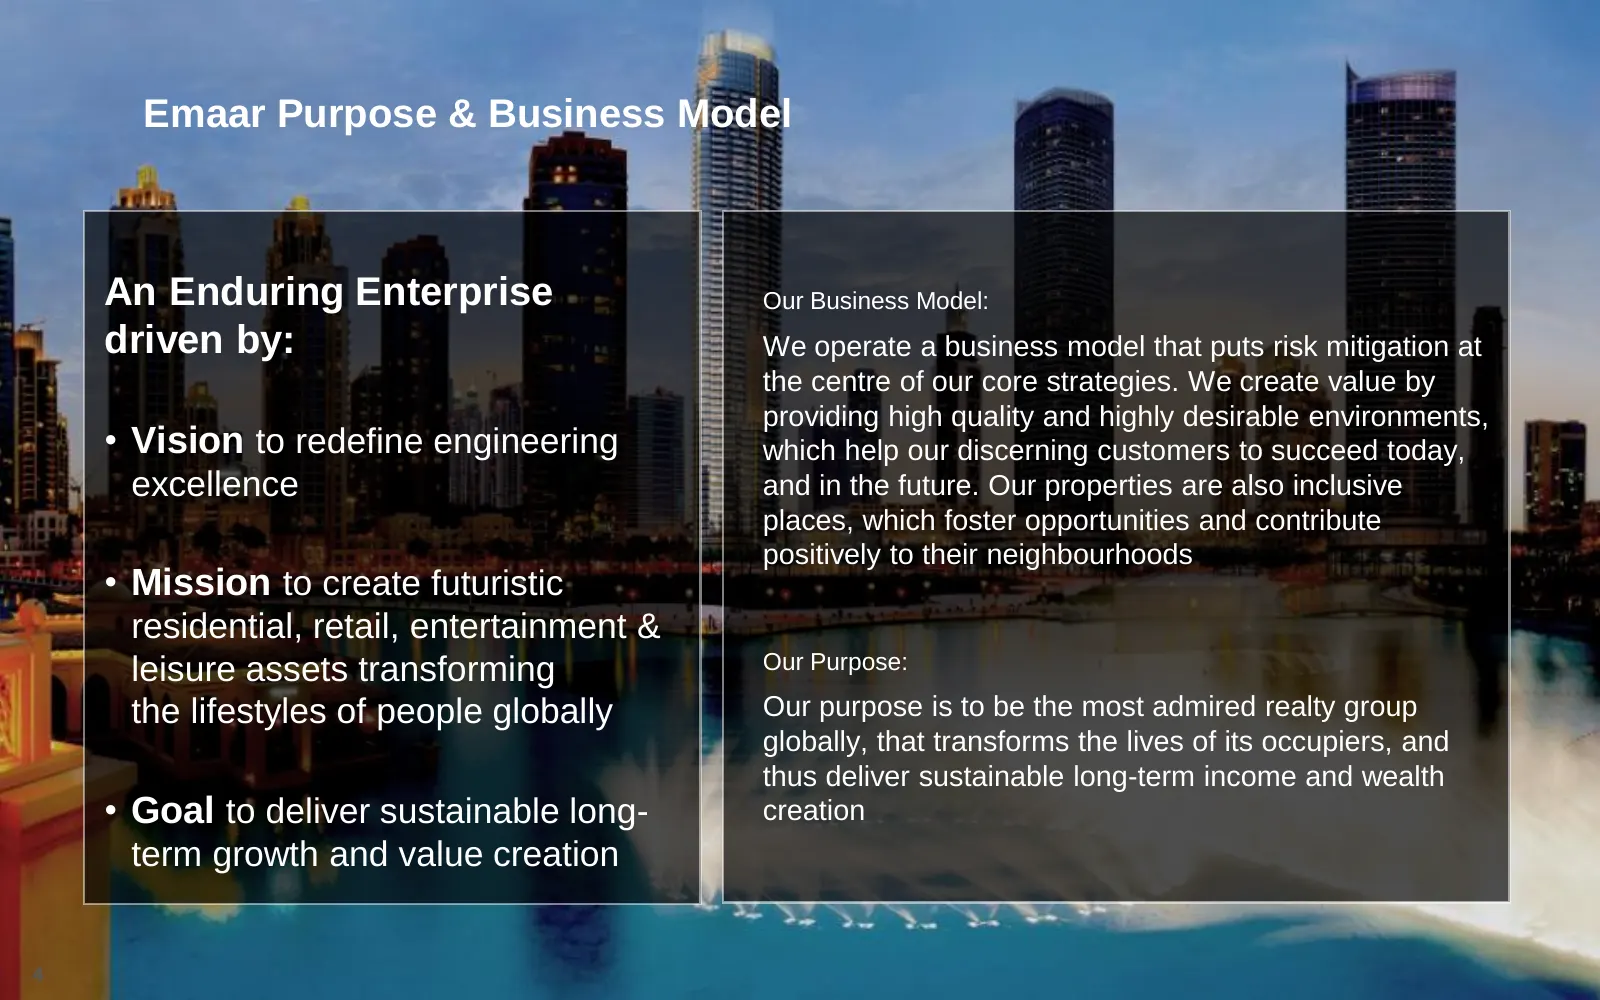
Slide 5: Emaar Purpose & Business Model
Emaar Purpose & Business Model An Enduring Enterprise Our Business Model: driven by: We operate a business model that puts risk mitigation at the centre of our core strategies. We create value by providing high quality and highly desirable environments, • Vision to redefine engineering which help ou
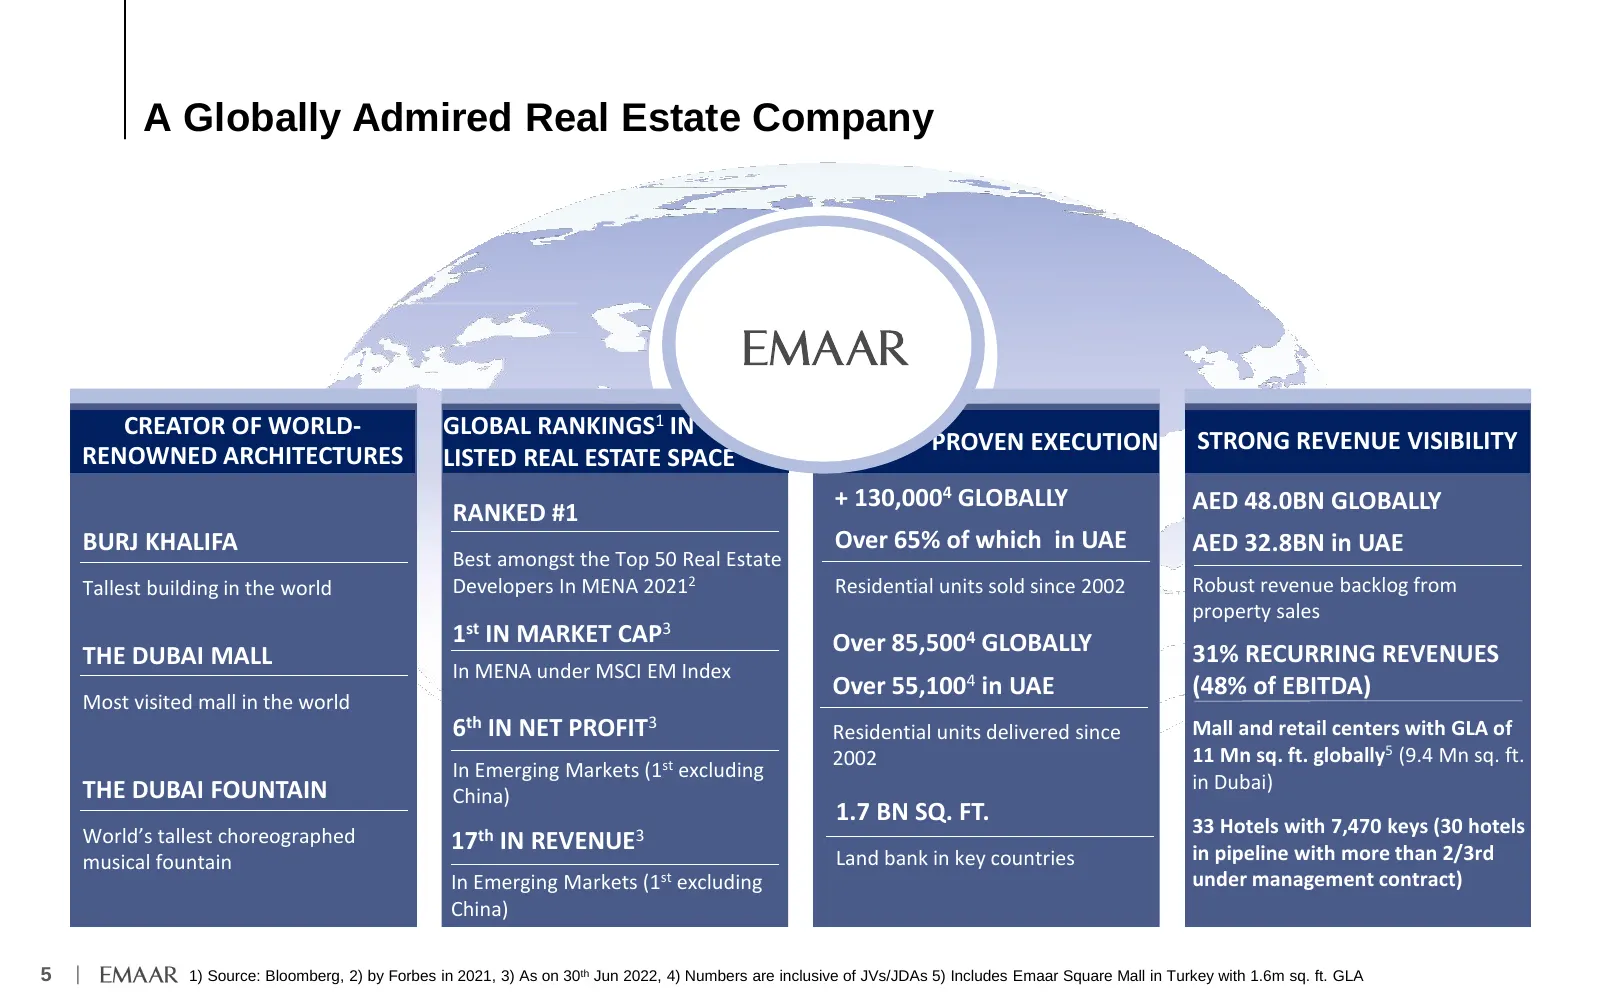
Slide 6: A Globally Admired Real Estate Company
A Globally Admired Real Estate Company CREATOR OF WORLD- GLOBAL RANKINGS1 IN PROVEN EXECUTION STRONG REVENUE VISIBILITY RENOWNED ARCHITECTURES LISTED REAL ESTATE SPACE + 130,0004 GLOBALLY AED 48.0BN GLOBALLY RANKED #1 BURJ KHALIFA Over 65% of which in UAE AED 32.8BN in UAE Best amongst the Top 50 Re
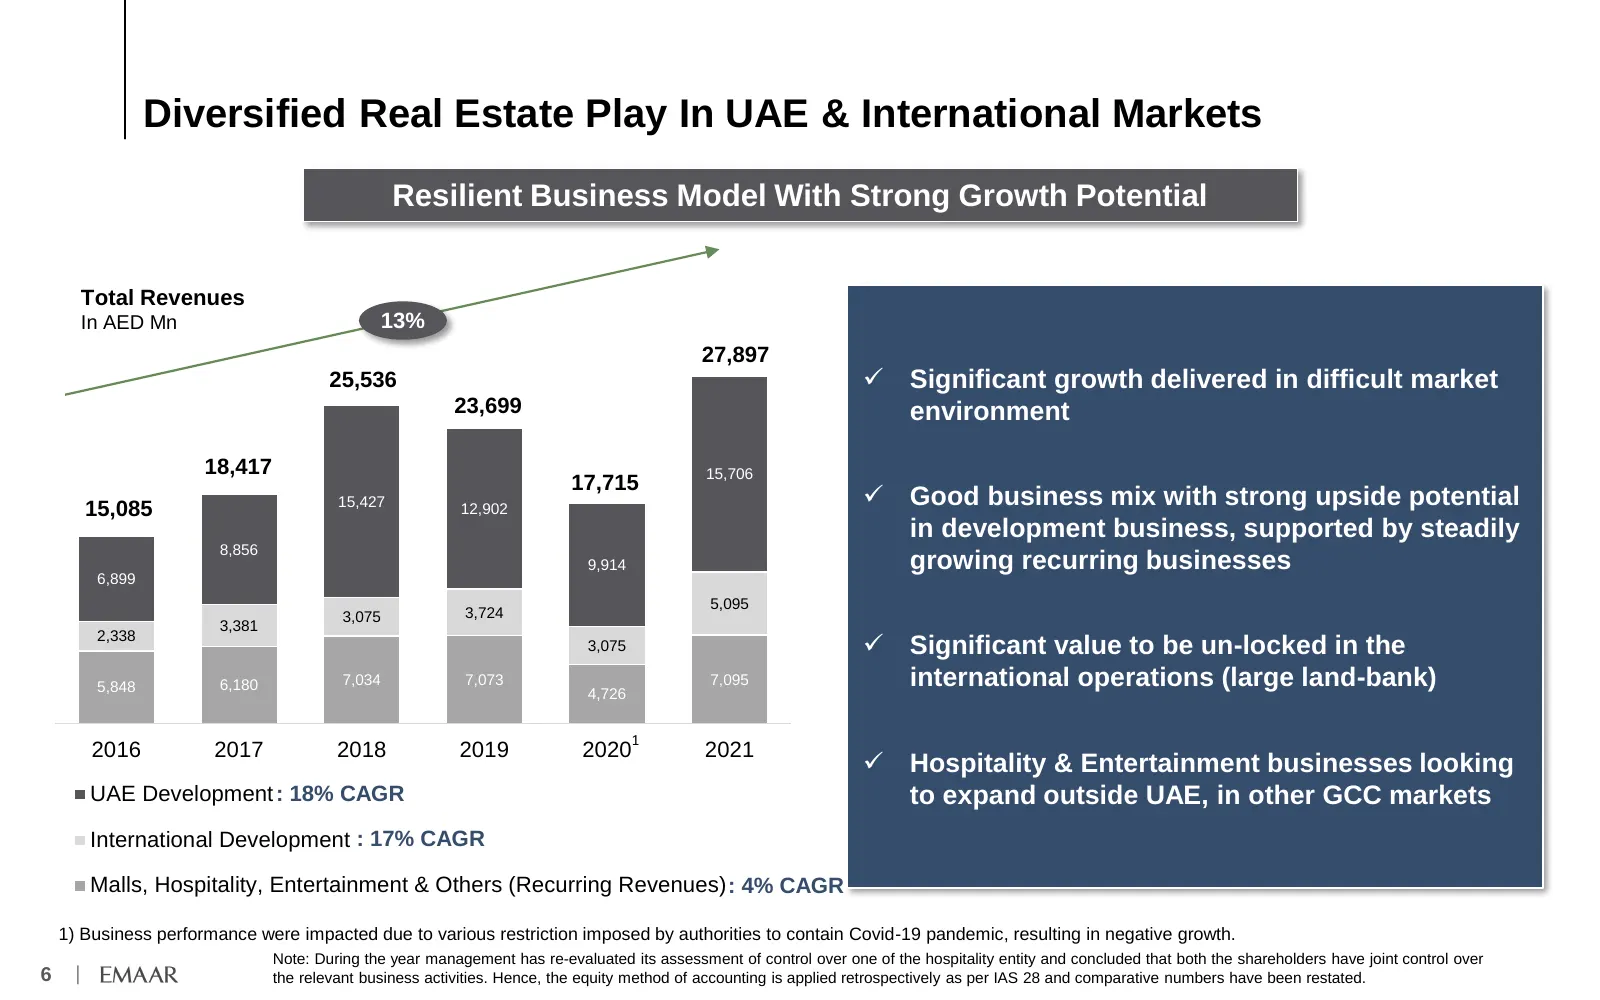
Slide 7: Diversified Real Estate Play In UAE & International Markets
Diversified Real Estate Play In UAE & International Markets Resilient Business Model With Strong Growth Potential Total Revenues In AED Mn 13% 27,897 25,536 ✓ Significant growth delivered in difficult market 23,699 environment 18,417 15,706 17,715 15,085 15,427 12,902 ✓ Good business mix with strong
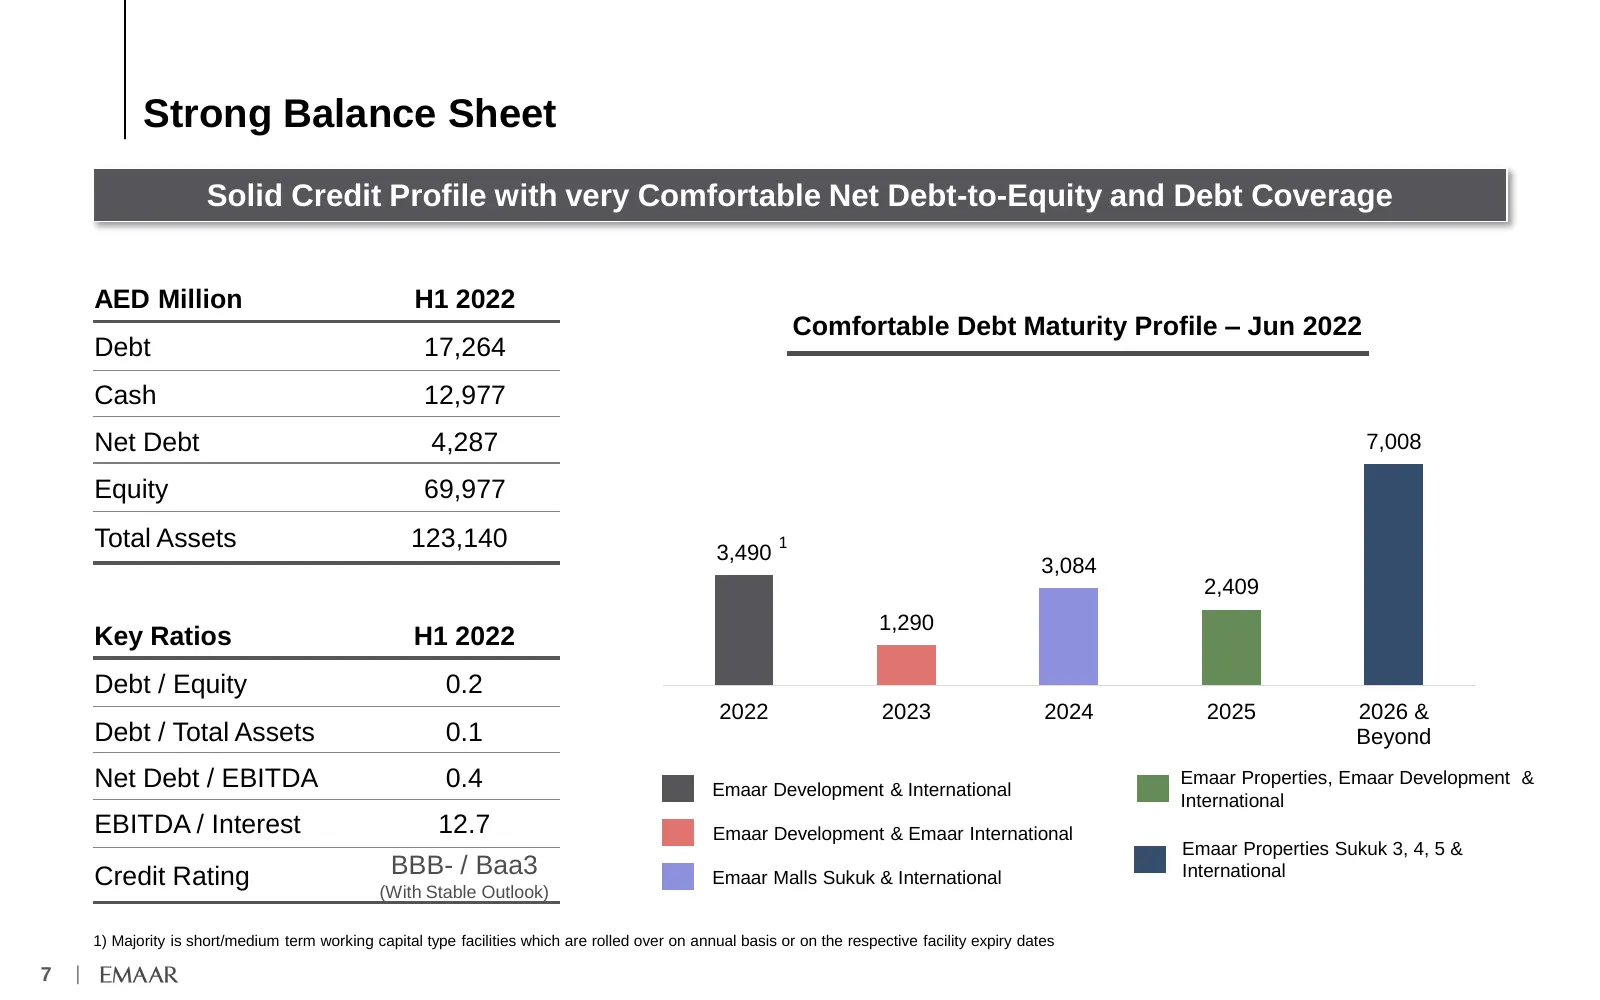
Slide 8: Strong Balance Sheet
Strong Balance Sheet Solid Credit Profile with very Comfortable Net Debt-to-Equity and Debt Coverage AED Million H1 2022 Comfortable Debt Maturity Profile – Jun 2022 Debt 17,264 Cash 12,977 Net Debt 4,287 7,008 Equity 69,977 Total Assets 123,140 3,490 1 3,084 2,409 1,290 Key Ratios H1 2022 Debt / Eq
Slide 9: Emaar In “The Value Zone”
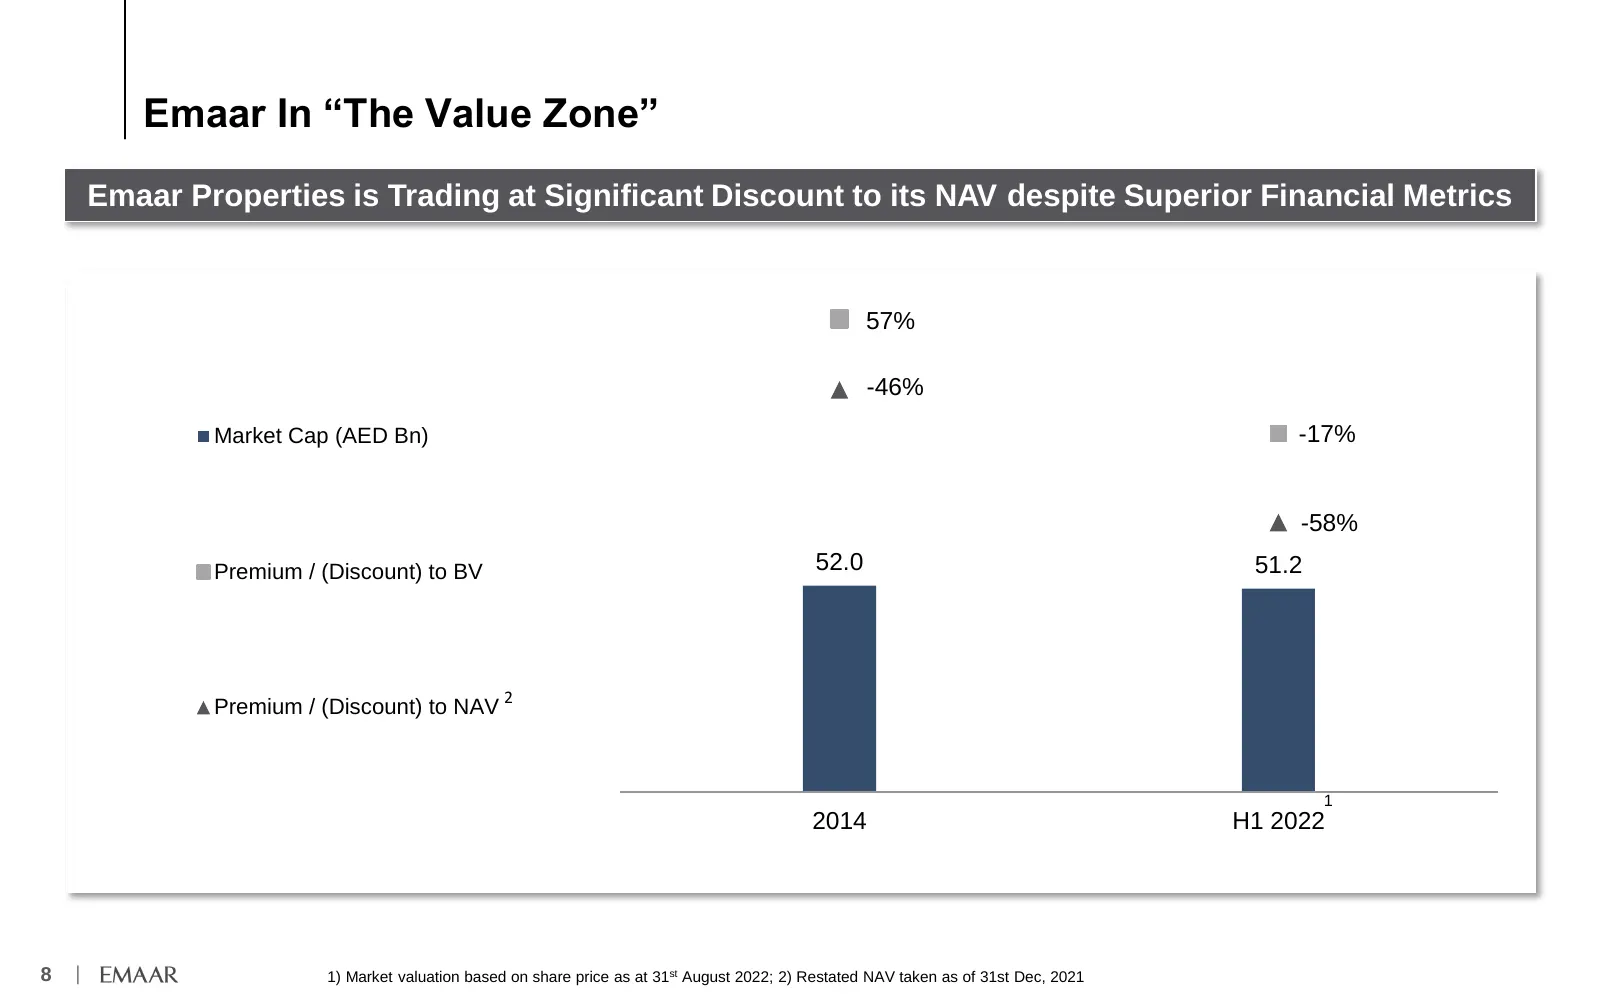
Emaar In “The Value Zone” Emaar Properties is Trading at Significant Discount to its NAV despite Superior Financial Metrics 57% -46% Market Cap (AED Bn) -17% -58% Premium / (Discount) to BV 52.0 51.2 2 Premium / (Discount) to NAV 1 2014 H1 2022 8 | 1) Market valuation based on share price as at 31st
Slide 10: Sum of The Parts Valuation Analysis
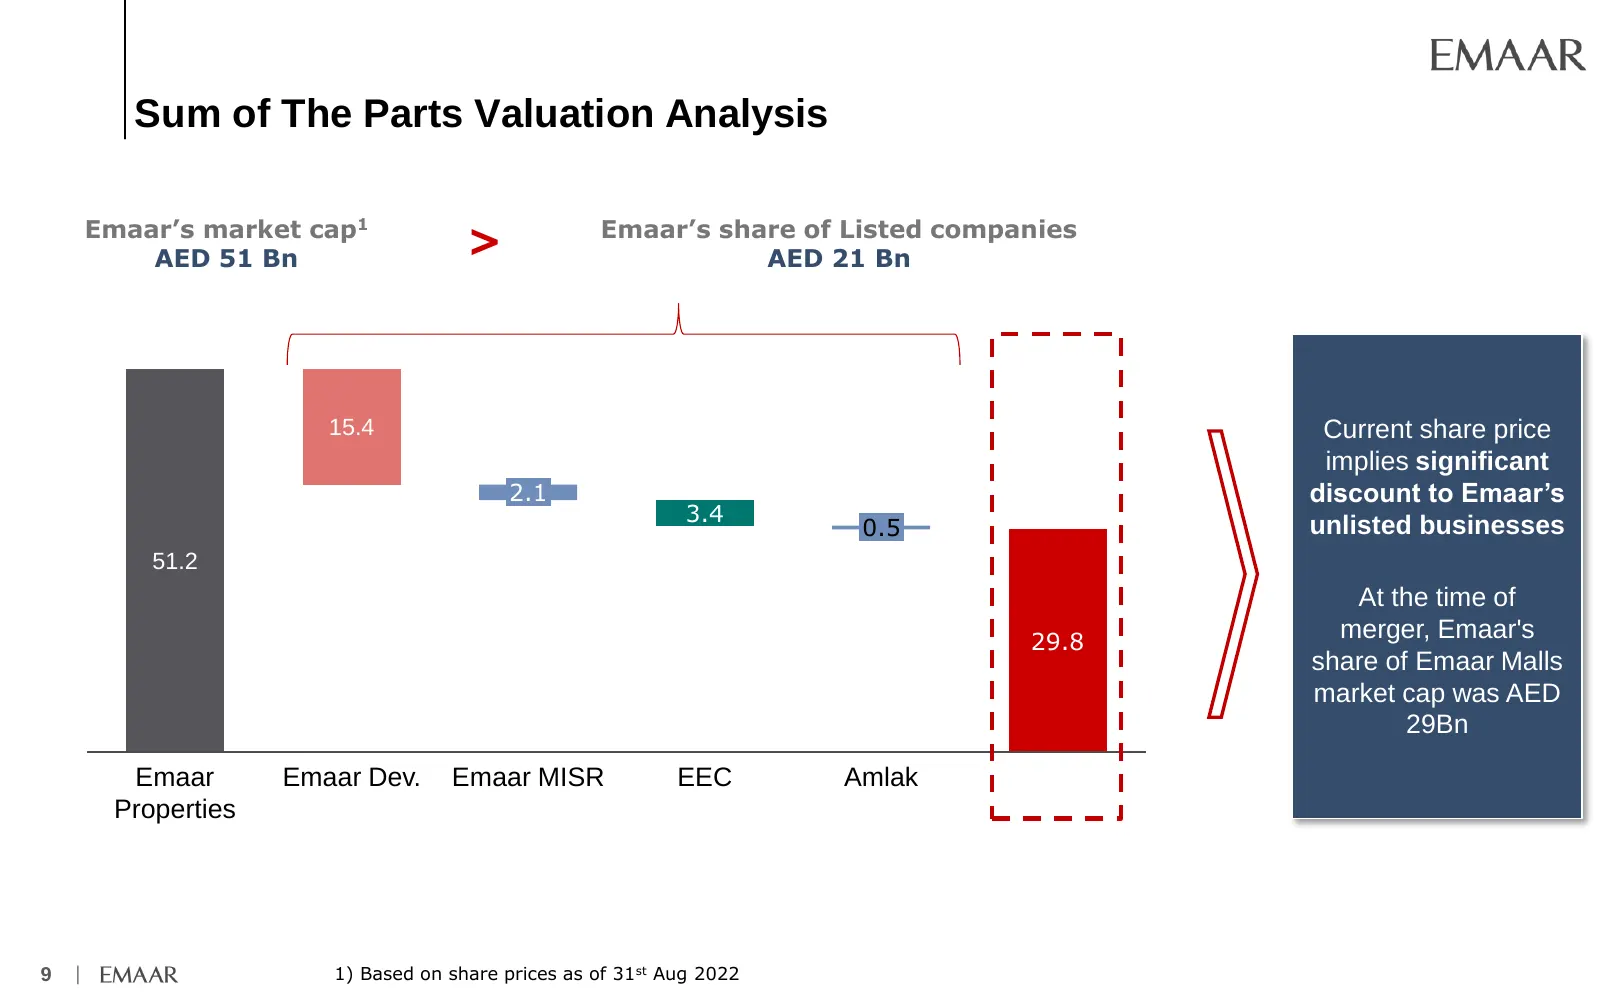
Sum of The Parts Valuation Analysis Emaar’s market cap1 Emaar’s share of Listed companies AED 51 Bn > AED 21 Bn 51.2 15.4 Current share price implies significant 2.1 discount to Emaar’s 3.4 29.8 0.5 unlisted businesses 51.2 At the time of 29.8 merger, Emaar's share of Emaar Malls market cap was AED
Slide 11: Expanding Footprint in UAE & International Markets
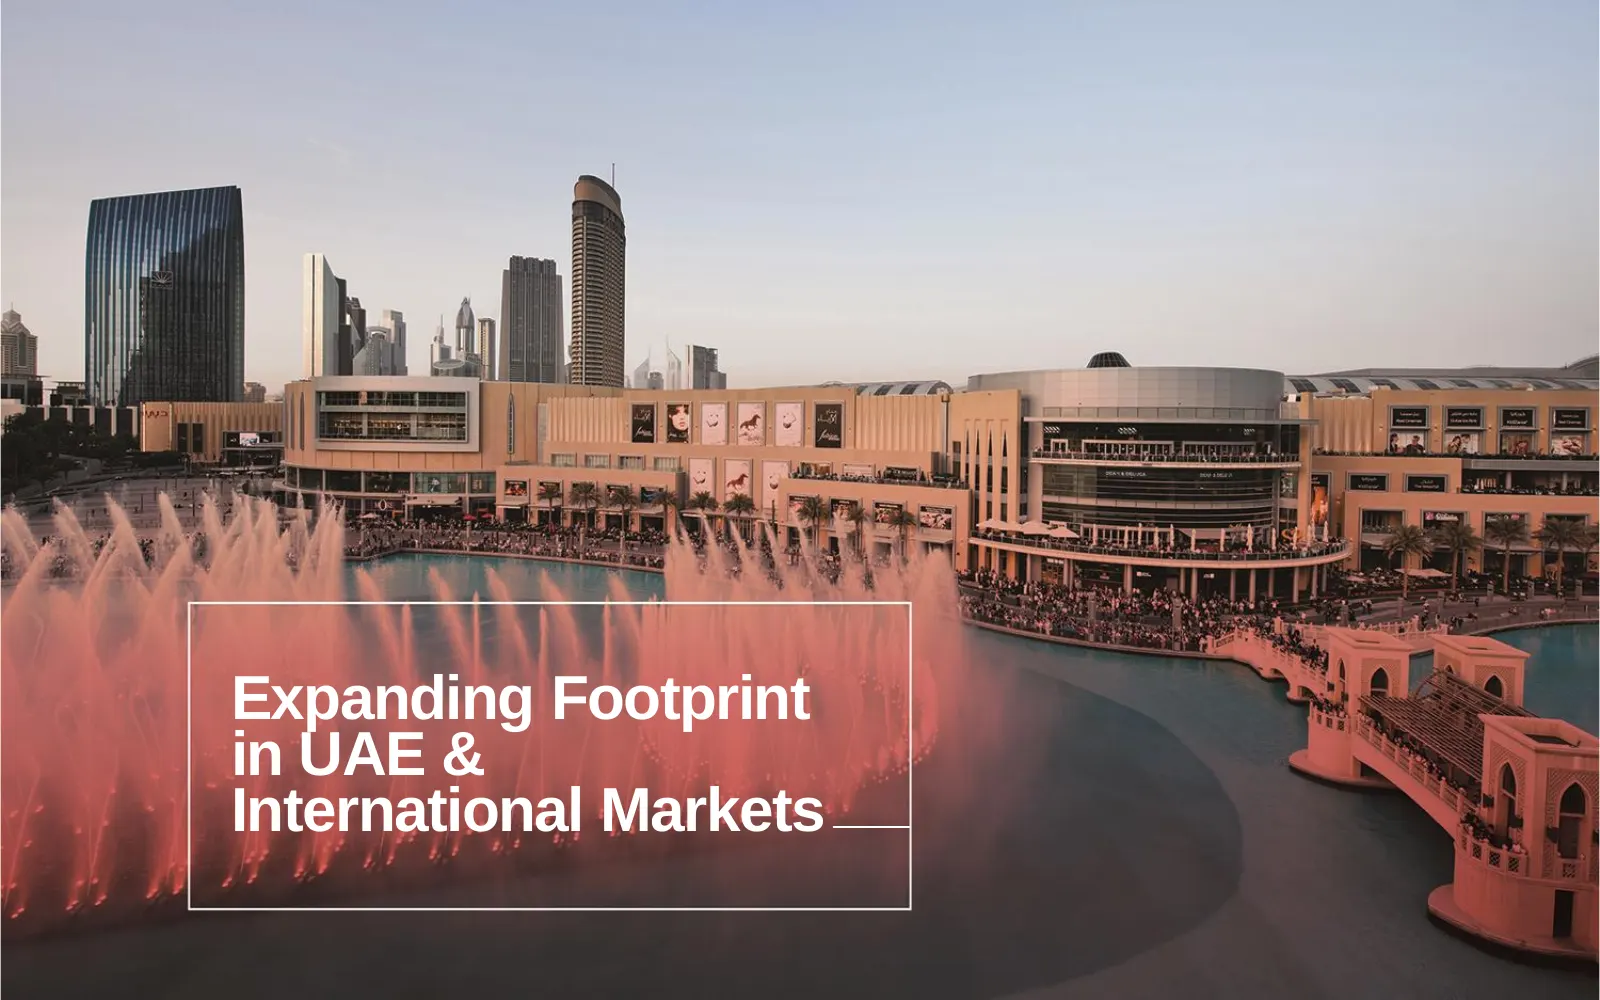
Expanding Footprint in UAE & International Markets 10 |
Slide 12: Developer of Iconic Master Plans Transforming Dubai
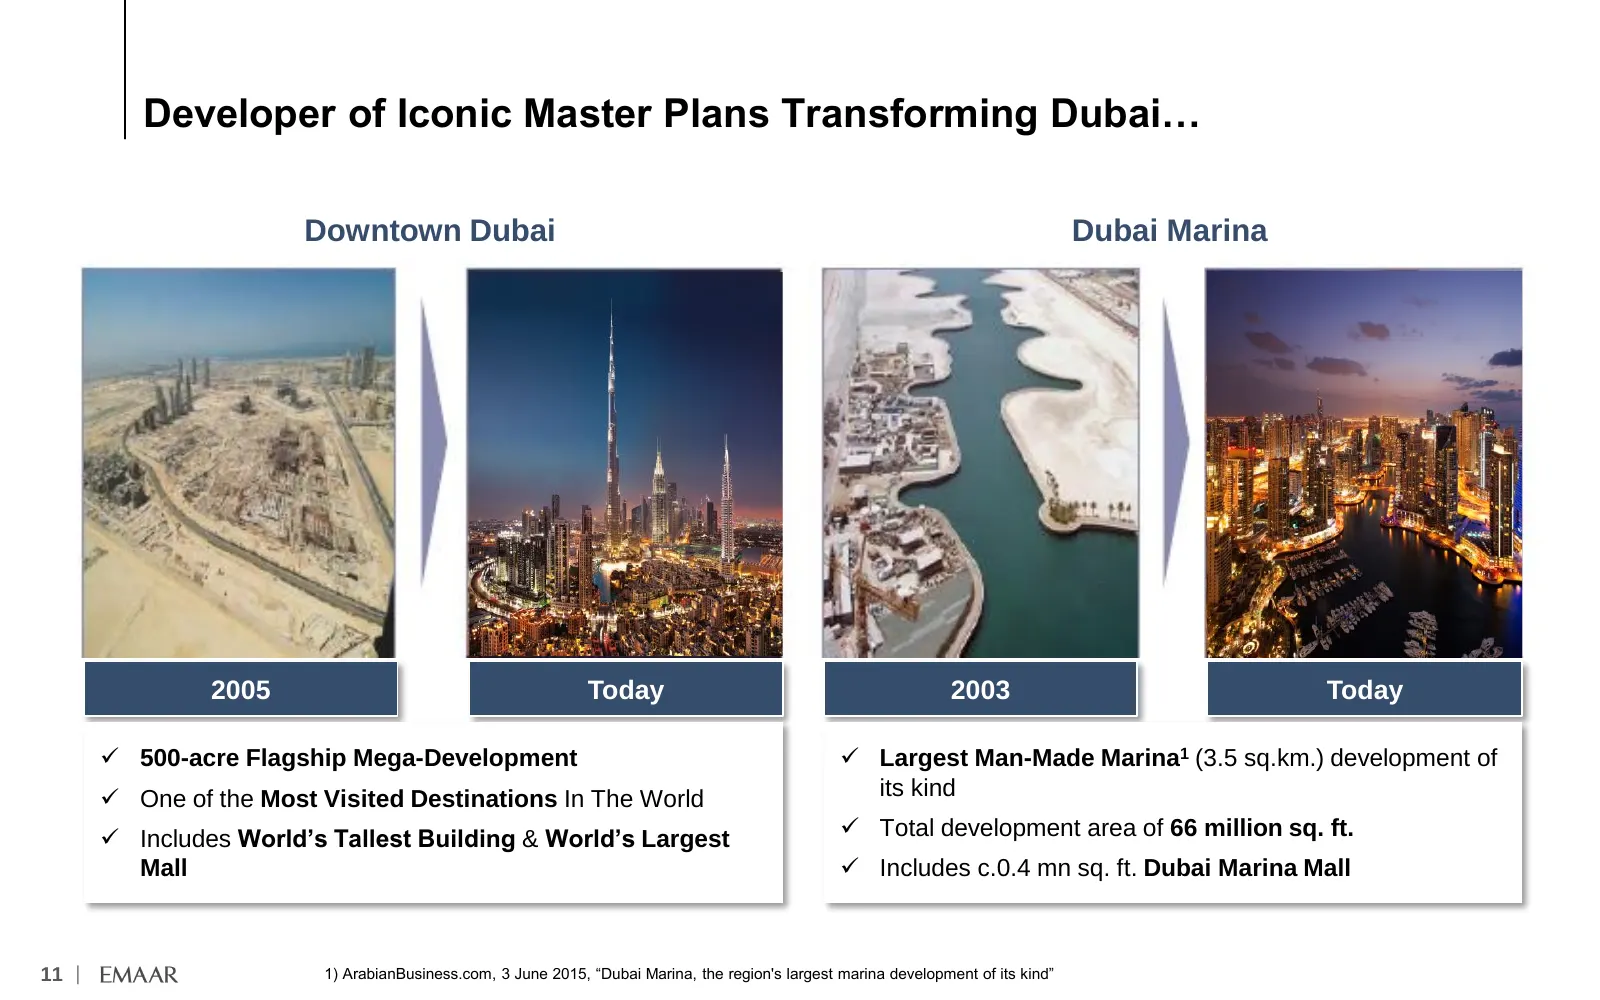
Developer of Iconic Master Plans Transforming Dubai… Downtown Dubai Dubai Marina 2005 Today 2003 Today ✓ 500-acre Flagship Mega-Development ✓ Largest Man-Made Marina1 (3.5 sq.km.) development of ✓ One of the Most Visited Destinations In The World its kind ✓ Includes World’s Tallest Building & World’
Slide 13: Having Stood Multiple Tests of Time
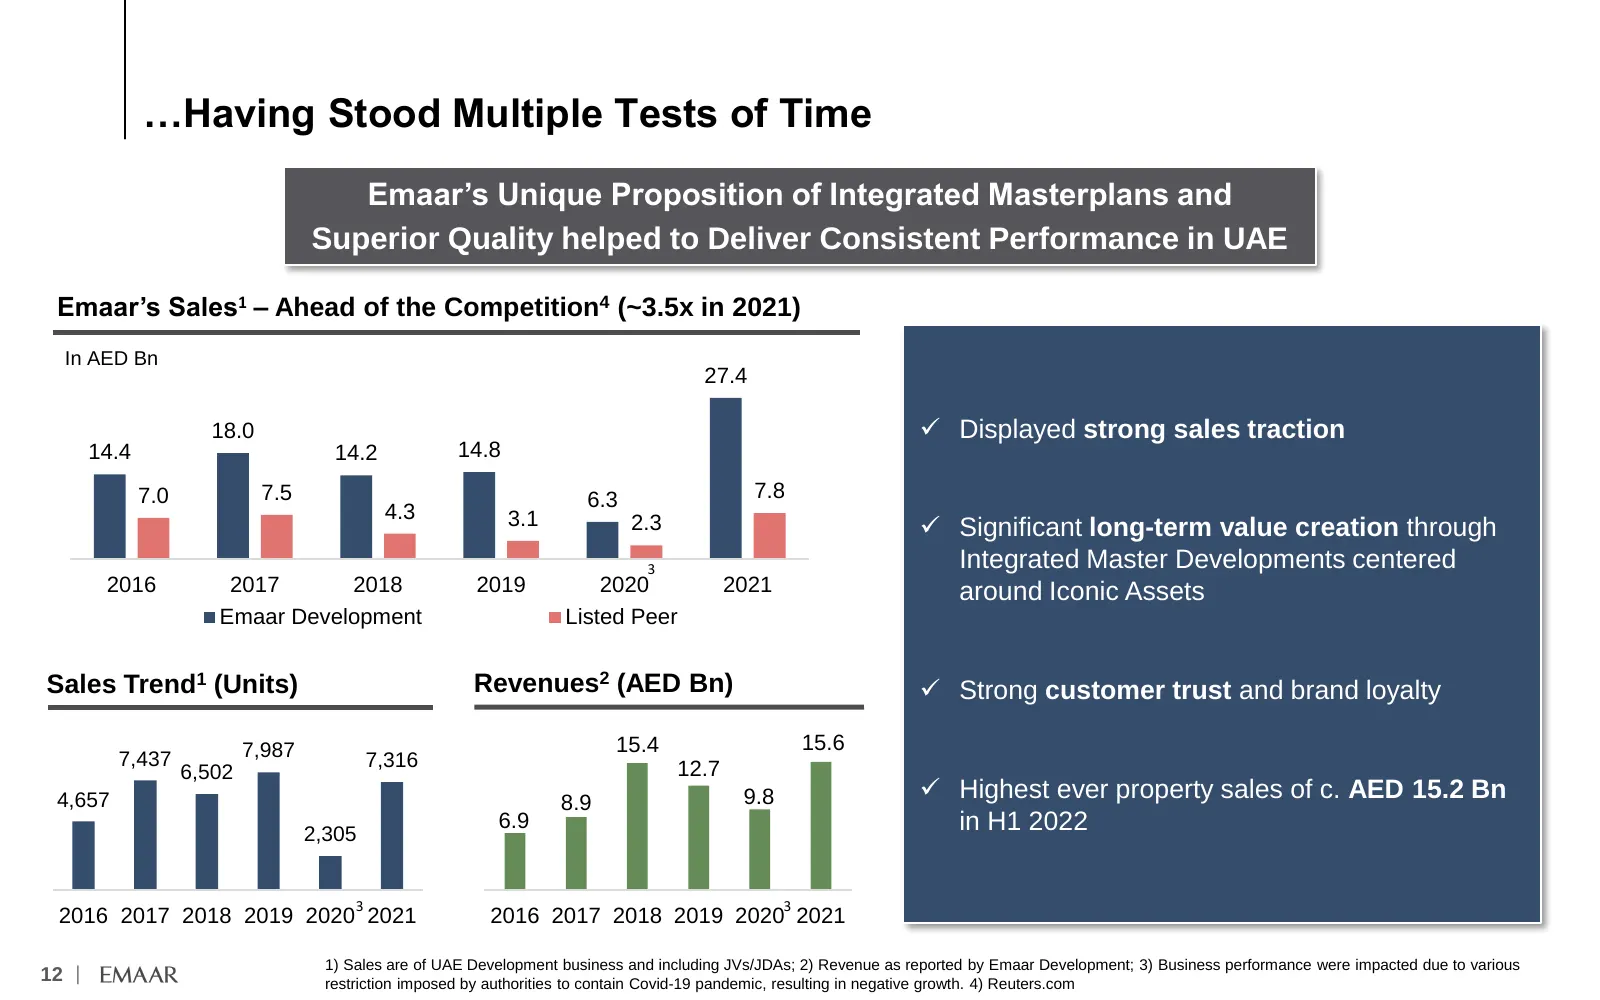
…Having Stood Multiple Tests of Time Emaar’s Unique Proposition of Integrated Masterplans and Superior Quality helped to Deliver Consistent Performance in UAE Emaar’s Sales1 – Ahead of the Competition4 (~3.5x in 2021) In AED Bn 27.4 18.0 ✓ Displayed strong sales traction 14.4 14.2 14.8 7.0 7.5 6.3 7
Slide 14: Renowned For Its Iconic Retail Assets
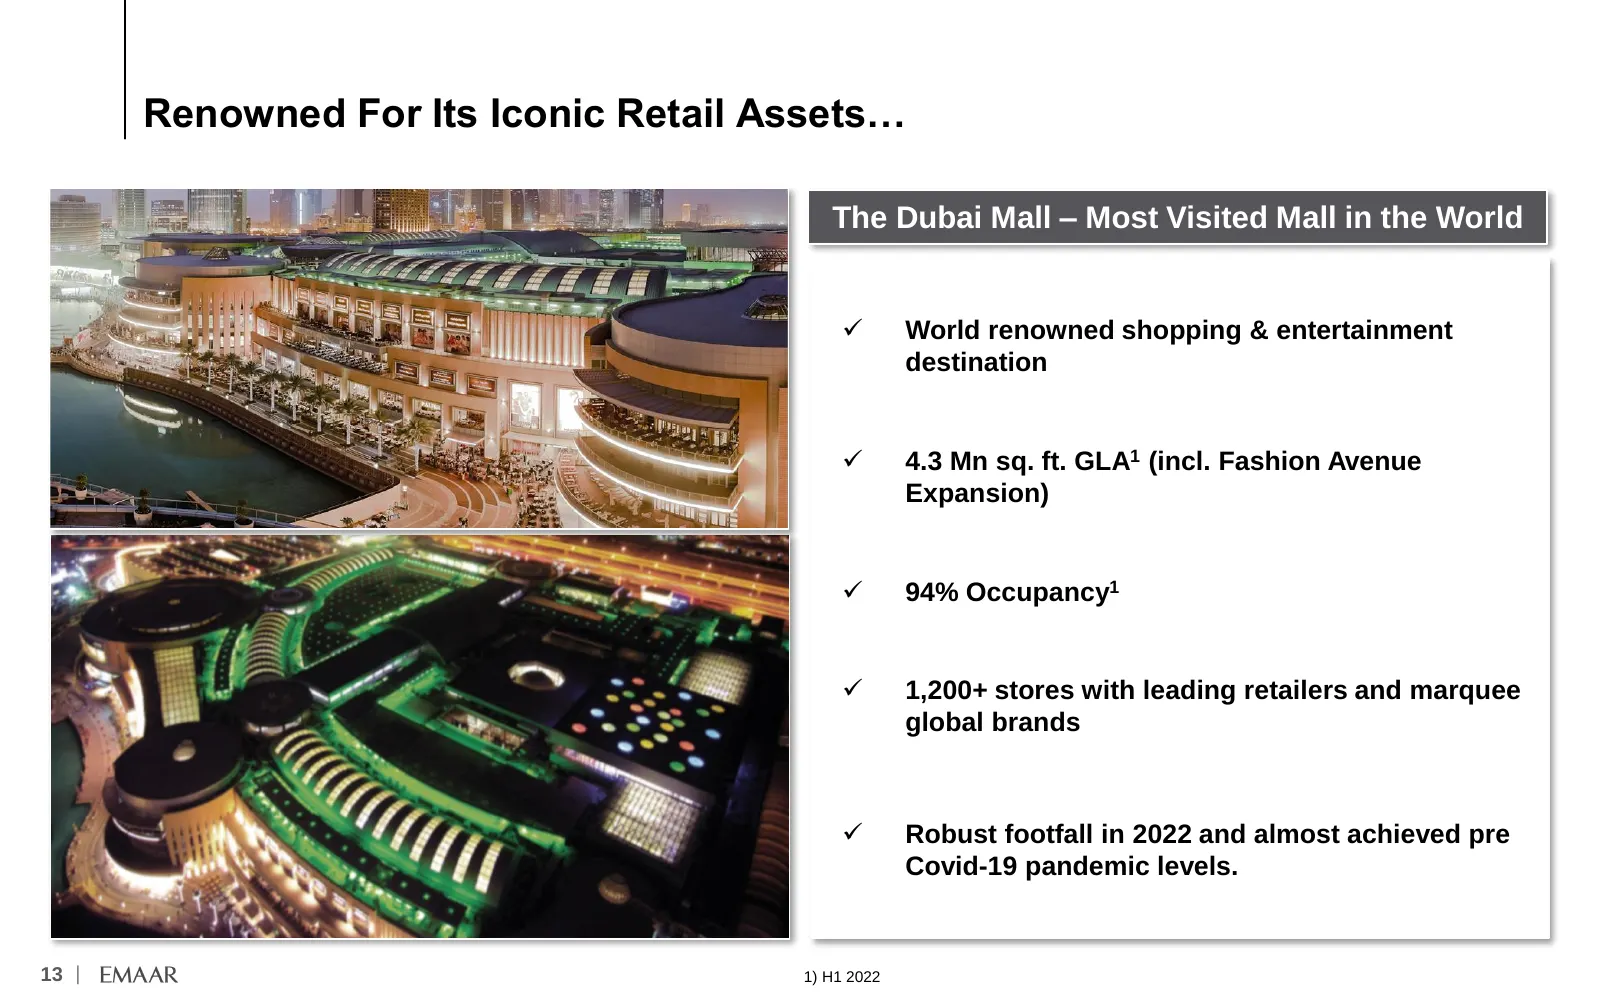
Renowned For Its Iconic Retail Assets… The Dubai Mall – Most Visited Mall in the World ✓ World renowned shopping & entertainment destination ✓ 4.3 Mn sq. ft. GLA1 (incl. Fashion Avenue Expansion) ✓ 94% Occupancy1 ✓ 1,200+ stores with leading retailers and marquee global brands ✓ Robust footfall in 2
Slide 15: Delivering Robust Growth
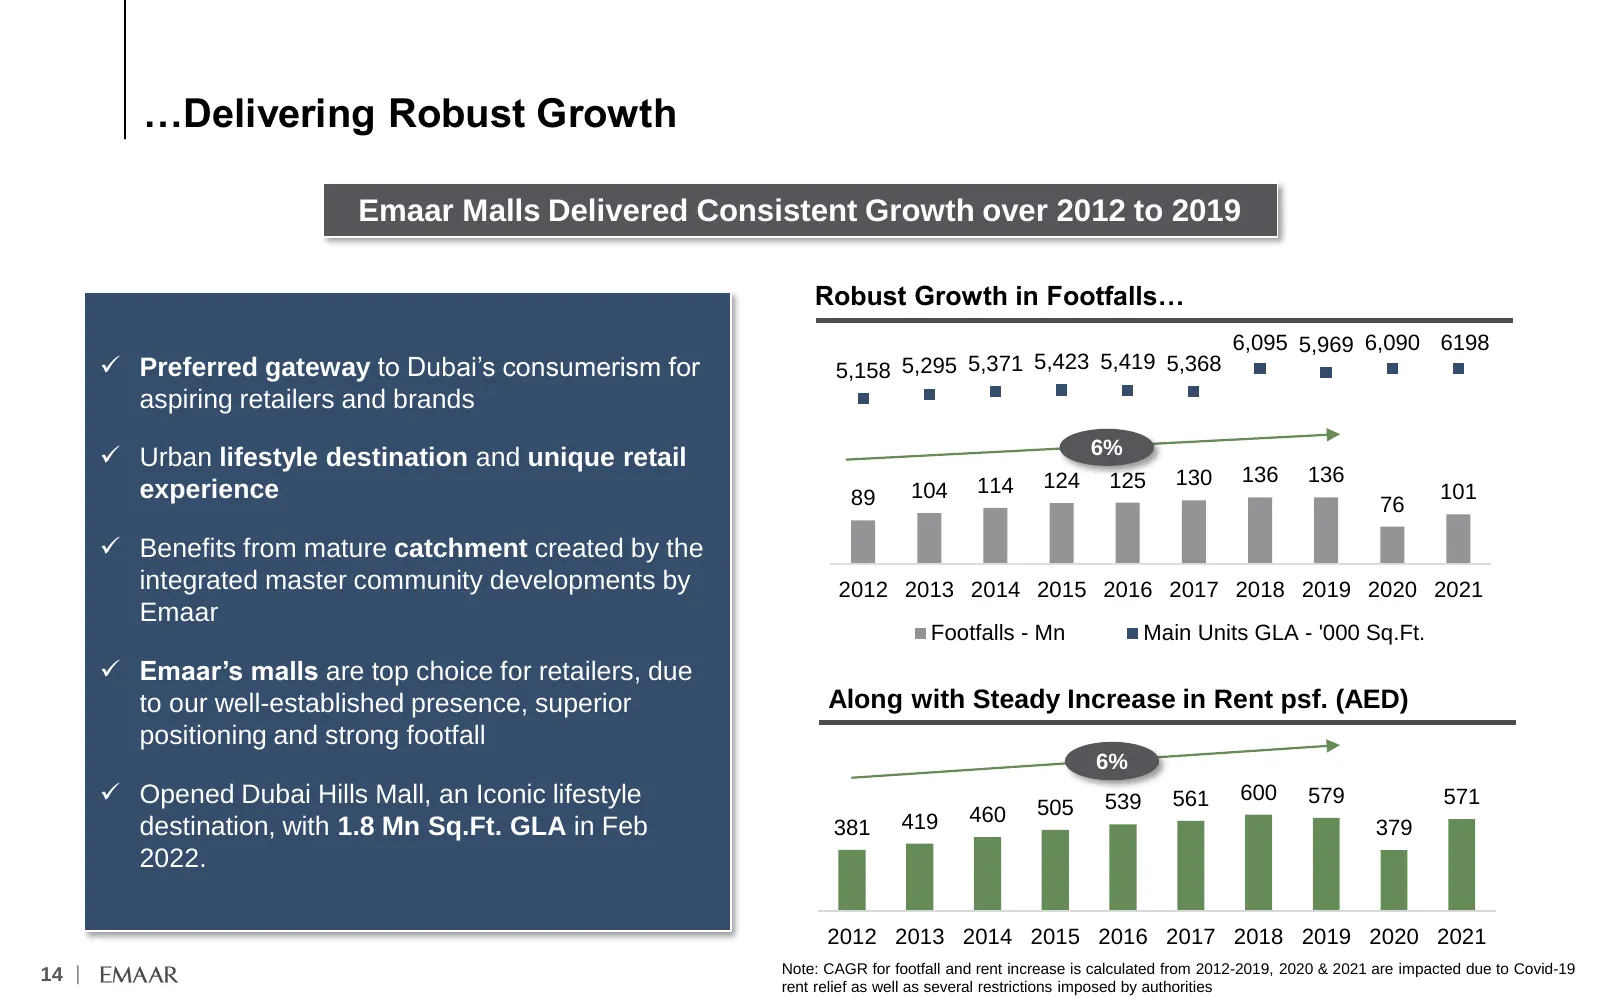
…Delivering Robust Growth Emaar Malls Delivered Consistent Growth over 2012 to 2019 Robust Growth in Footfalls… 6,095 5,969 6,090 6,100 6198 ✓ Preferred gateway to Dubai’s consumerism for 5,158 5,295 5,371 5,423 5,419 5,368 aspiring retailers and brands 6% ✓ Urban lifestyle destination and unique re
Slide 16: Complemented By Immersive Entertainment Avenues
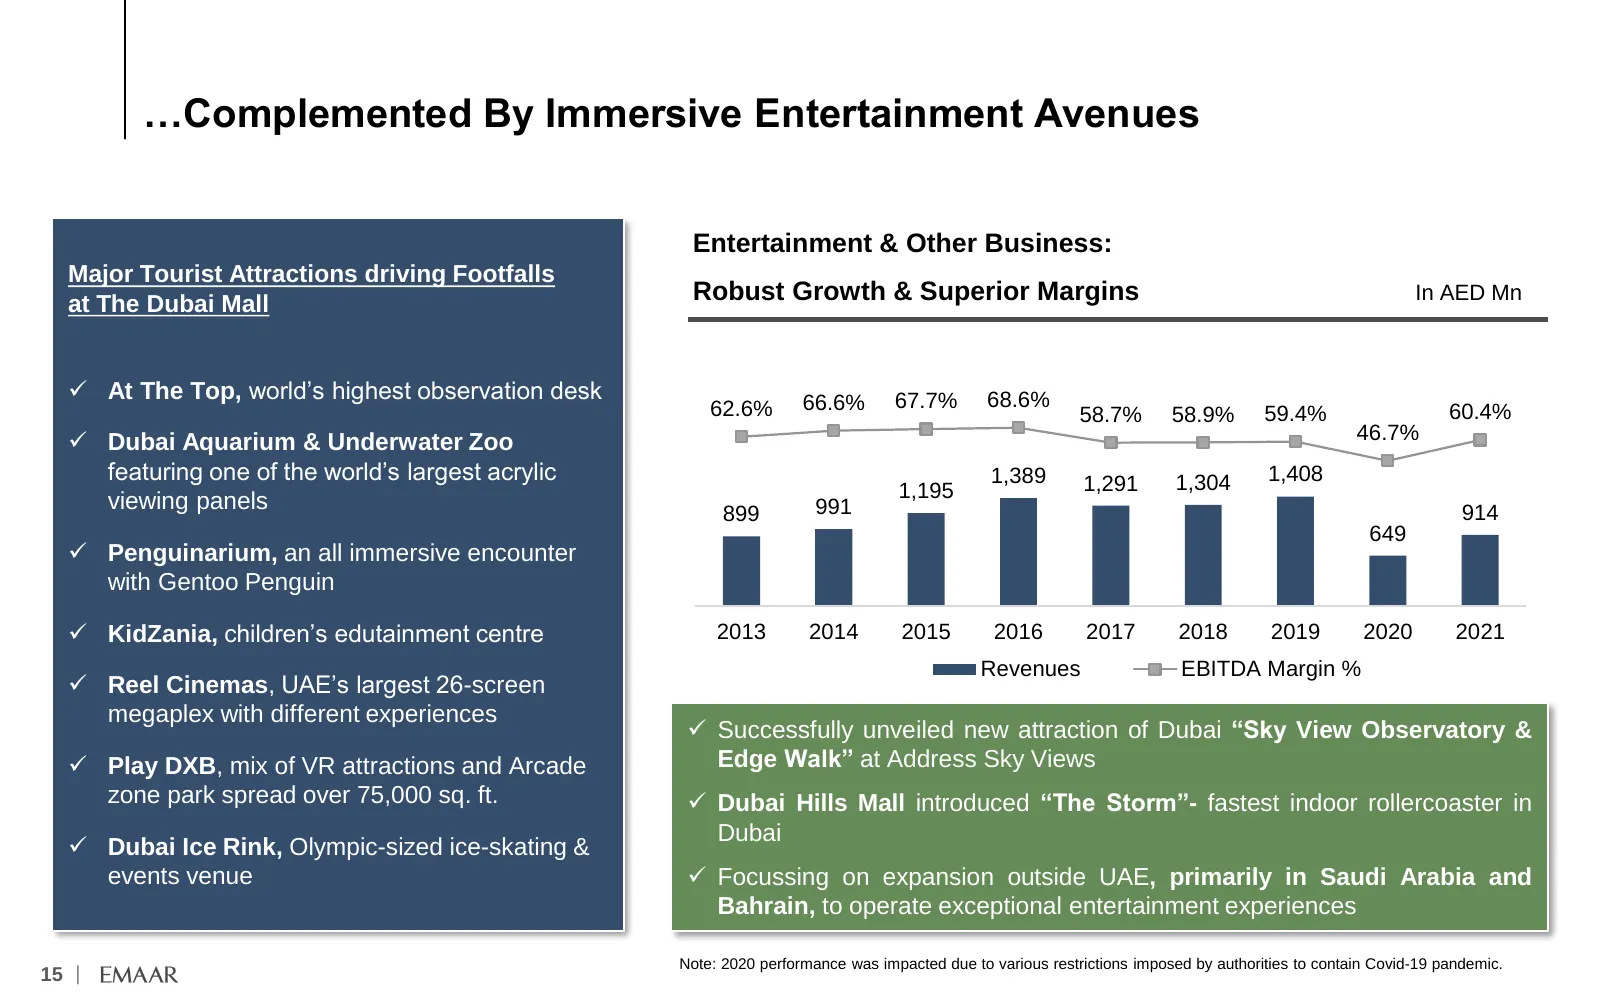
…Complemented By Immersive Entertainment Avenues Entertainment & Other Business: Major Tourist Attractions driving Footfalls at The Dubai Mall Robust Growth & Superior Margins In AED Mn ✓ At The Top, world’s highest observation desk 66.6% 67.7% 68.6% 62.6% 58.7% 58.9% 59.4% 60.4% ✓ Dubai Aquarium &
Slide 17: Hospitality Assets Deliver Steady Performance
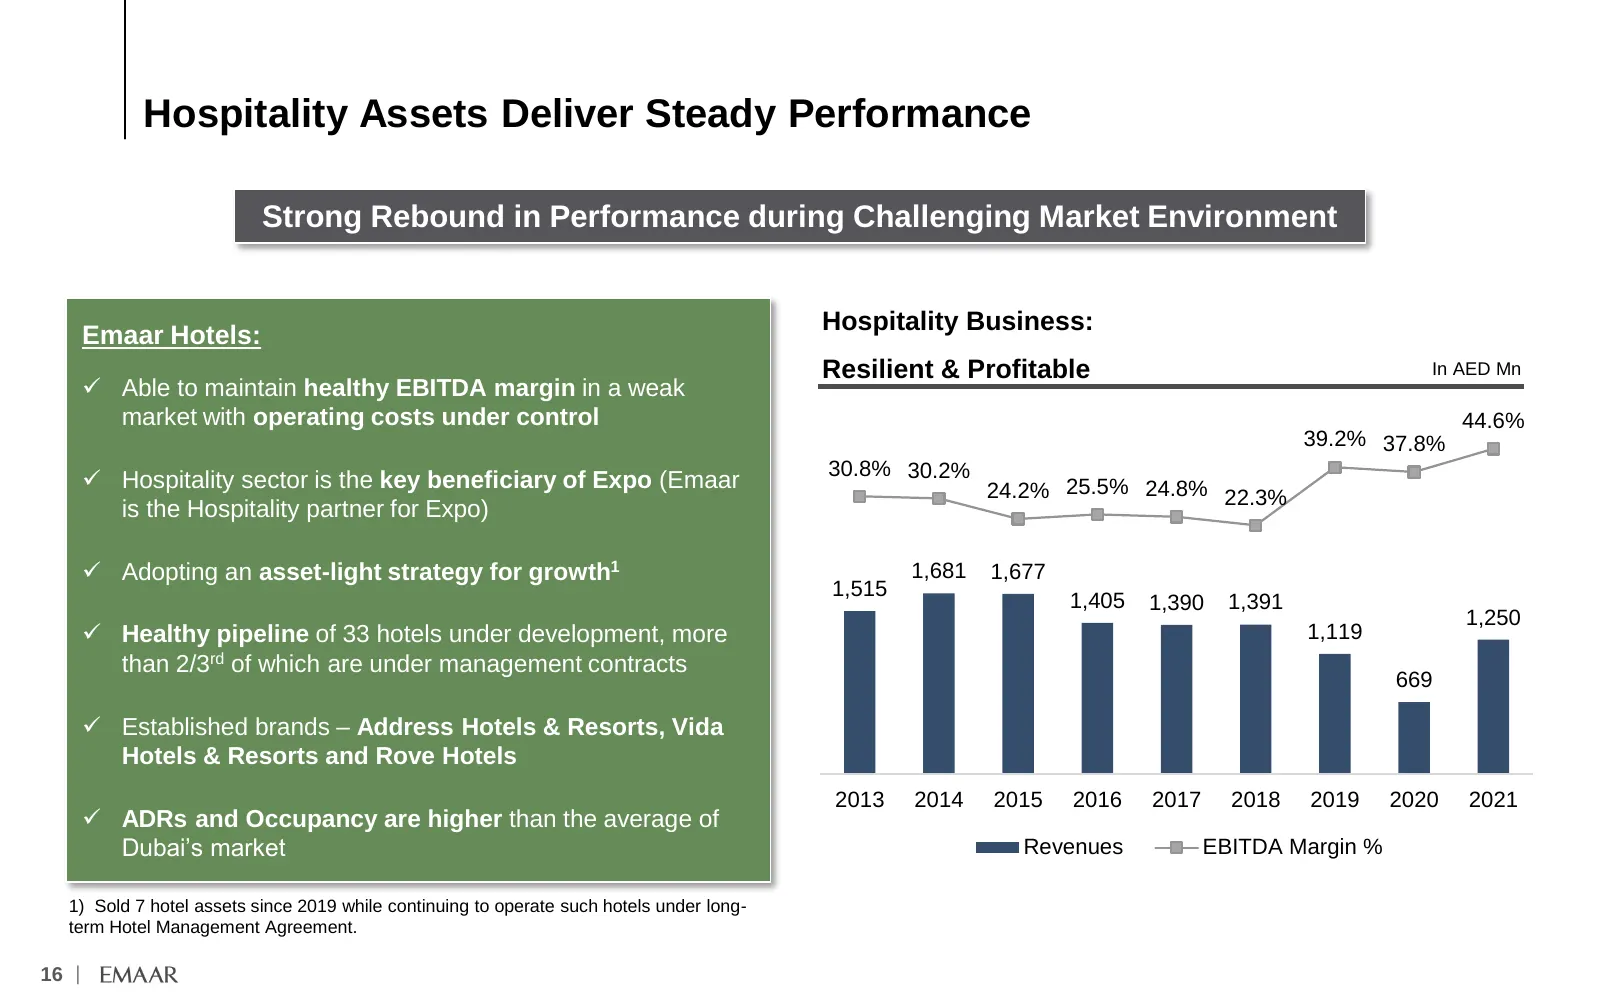
Hospitality Assets Deliver Steady Performance Strong Rebound in Performance during Challenging Market Environment Hospitality Business: Emaar Hotels: Resilient & Profitable In AED Mn ✓ Able to maintain healthy EBITDA margin in a weak market with operating costs under control 44.6% 39.2% 37.8% 30.8%
Slide 18: Replicating Our Success In International Markets
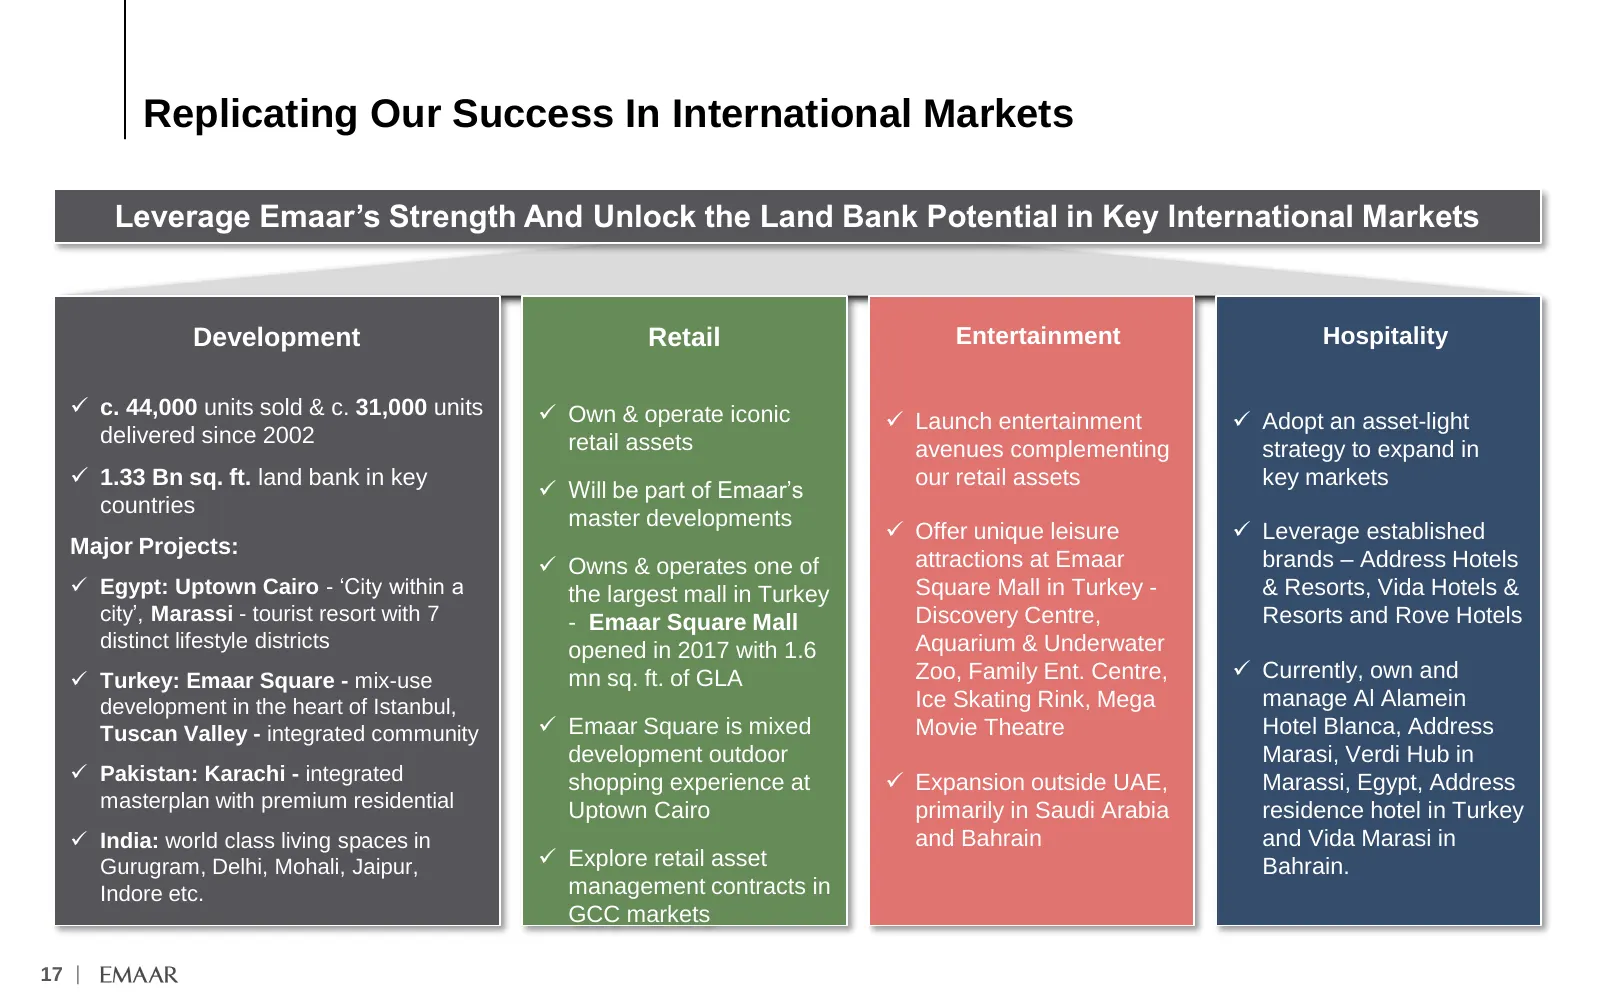
Replicating Our Success In International Markets Leverage Emaar’s Strength And Unlock the Land Bank Potential in Key International Markets Development Retail Entertainment Hospitality ✓ c. 44,000 units sold & c. 31,000 units ✓ Own & operate iconic ✓ Launch entertainment ✓ Adopt an asset-light delive
Slide 19: Business Strategy & Outlook
Business Strategy & Outlook 18 |
Slide 20: Top Priorities
Top 3 Priorities Maintain Leadership Position in Our Markets Focus on Execution & Cash Flow Generation Focus on Maximising Shareholder Returns 19 |
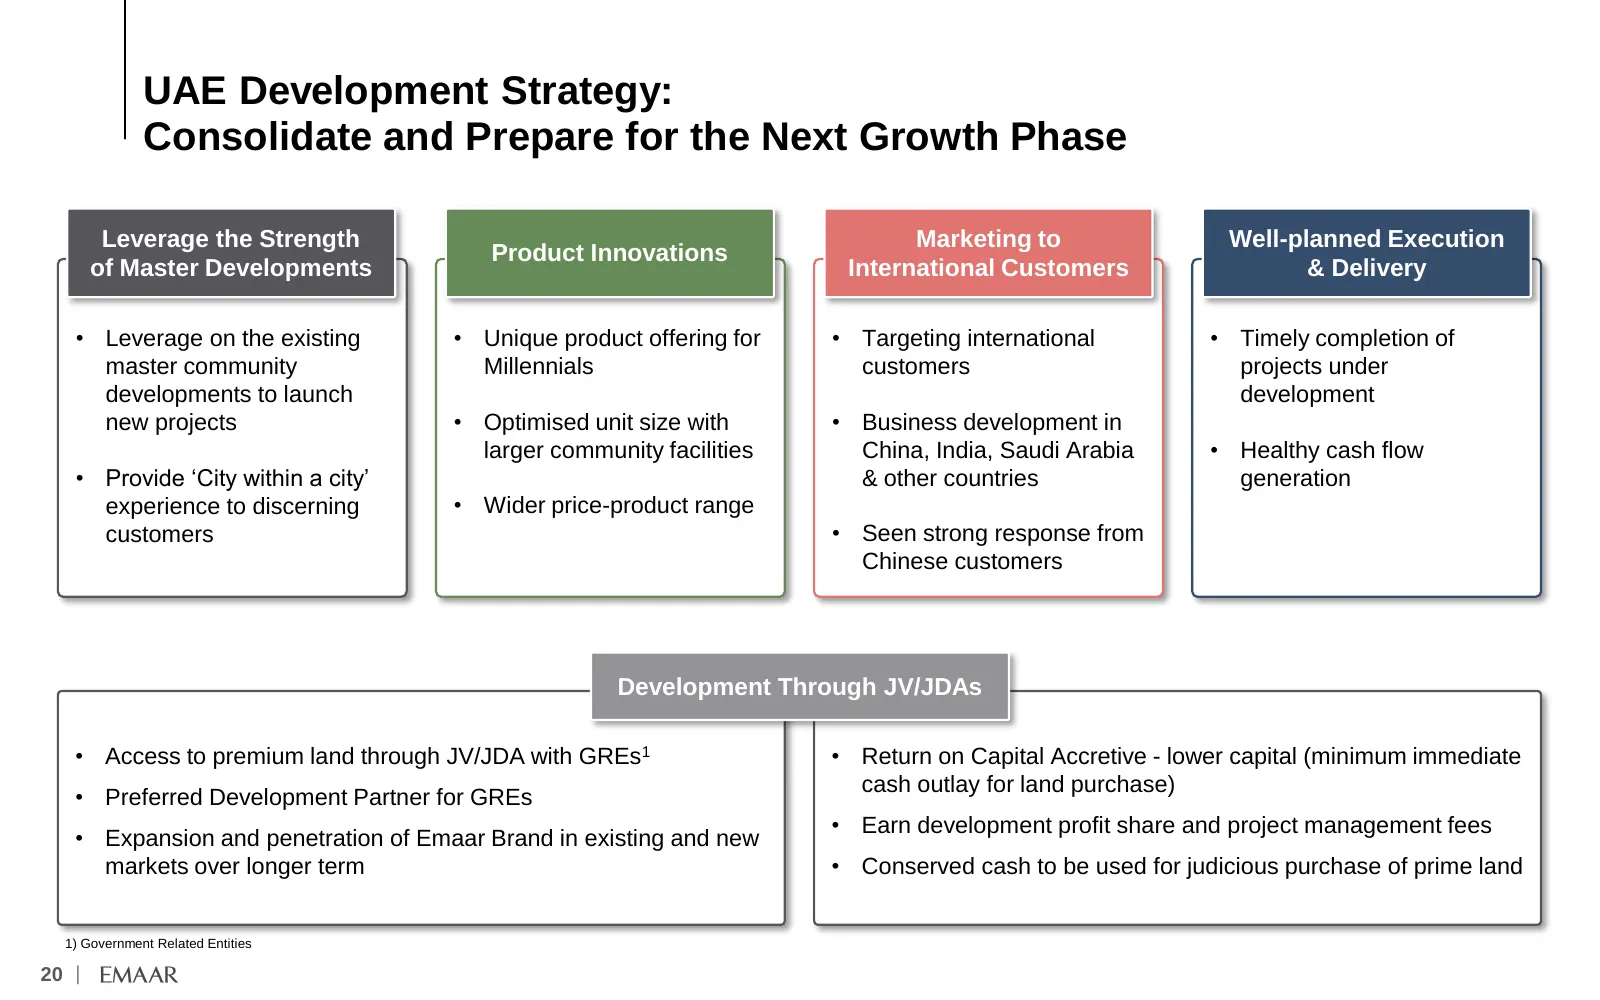
Slide 21: UAE Development Strategy: Consolidate and Prepare for the Next Growth Phase
UAE Development Strategy: Consolidate and Prepare for the Next Growth Phase Leverage the Strength Marketing to Well-planned Execution Product Innovations of Master Developments International Customers & Delivery • Leverage on the existing • Unique product offering for • Targeting international • Tim
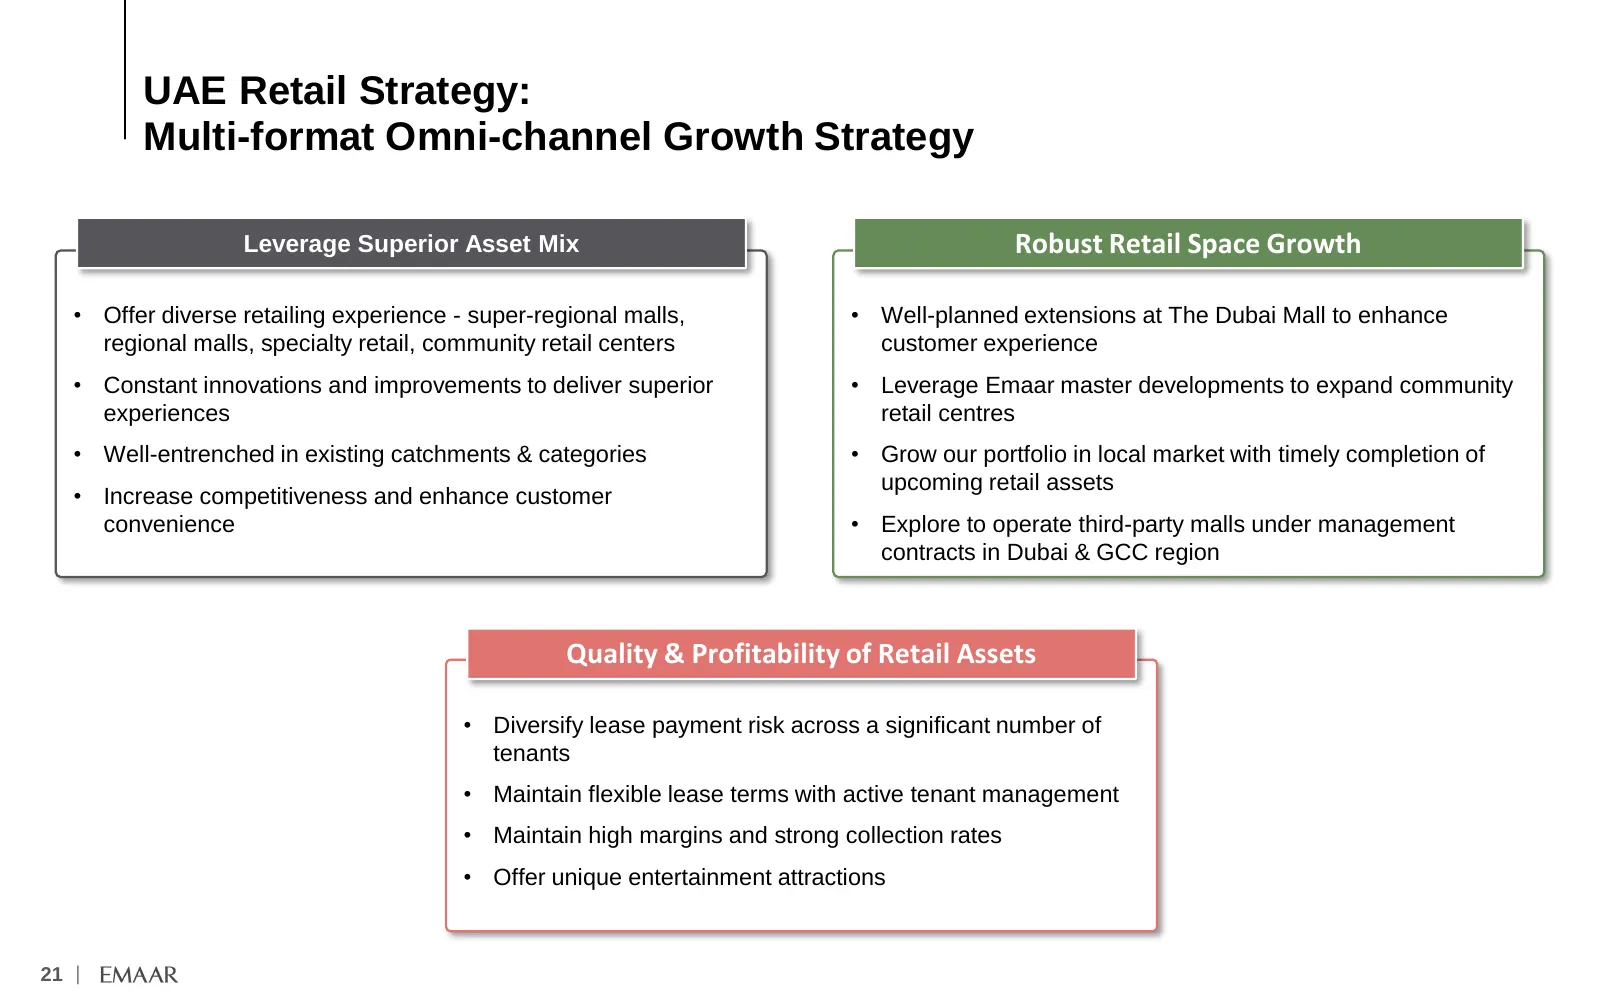
Slide 22: UAE Retail Strategy: Multi-format Omni-channel Growth Strategy
UAE Retail Strategy: Multi-format Omni-channel Growth Strategy Leverage Superior Asset Mix Robust Retail Space Growth • Offer diverse retailing experience - super-regional malls, • Well-planned extensions at The Dubai Mall to enhance regional malls, specialty retail, community retail centers custome
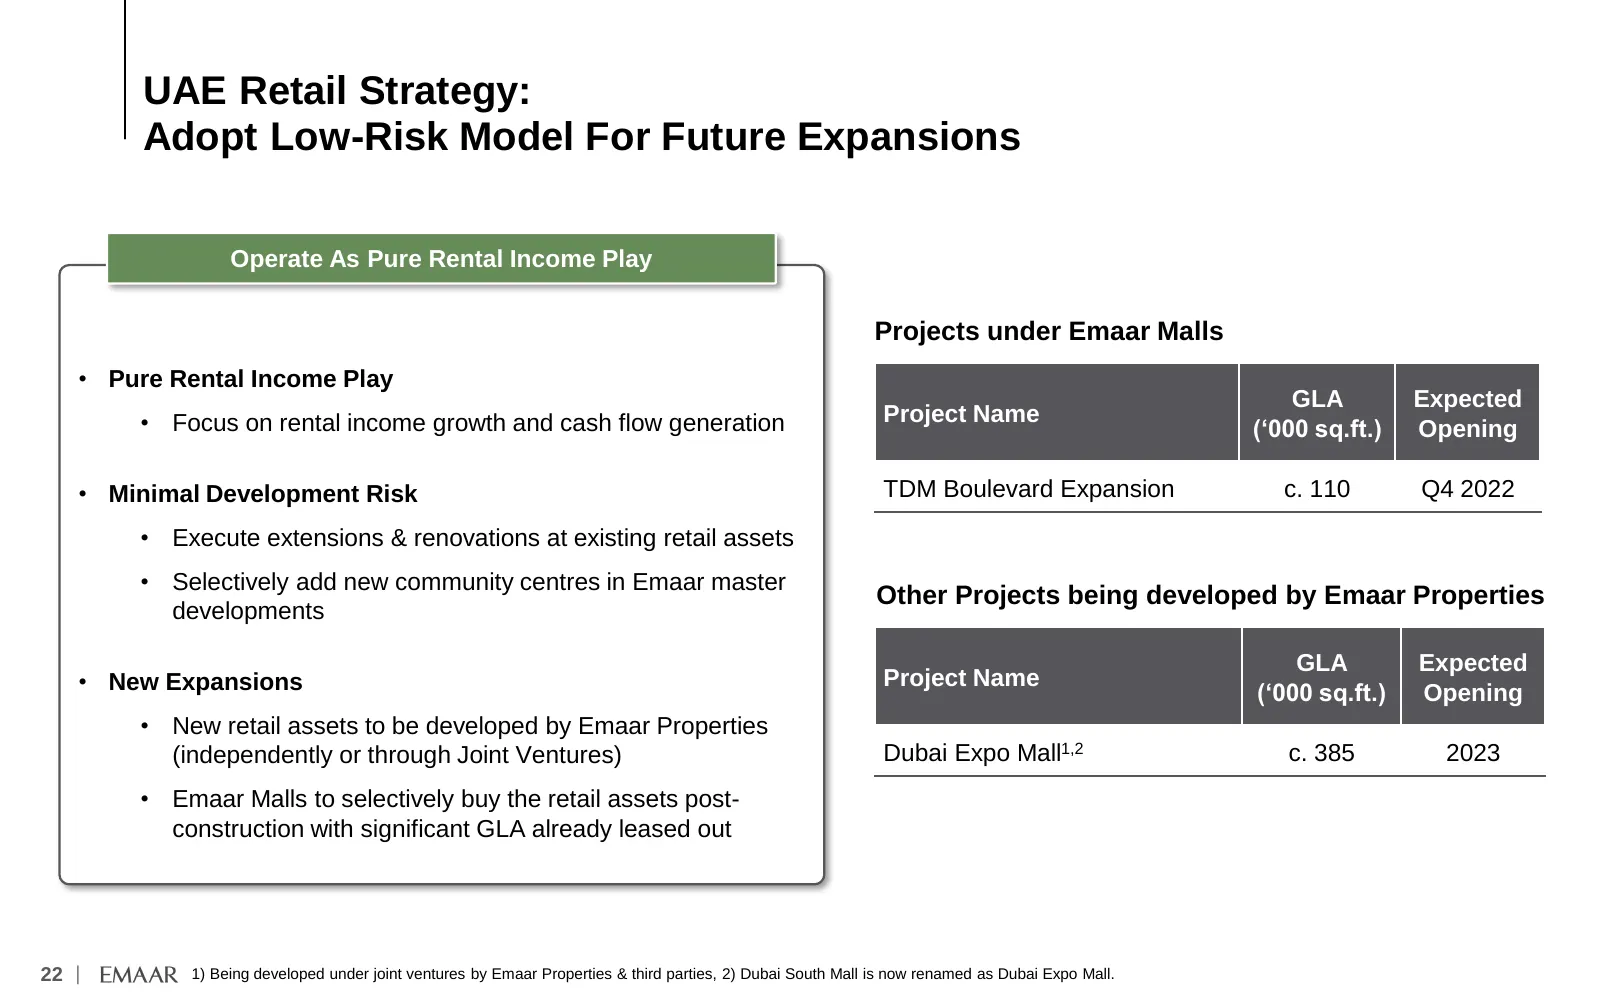
Slide 23: UAE Retail Strategy: Adopt Low-Risk Model For Future Expansions
UAE Retail Strategy: Adopt Low-Risk Model For Future Expansions Operate As Pure Rental Income Play Projects under Emaar Malls • Pure Rental Income Play GLA Expected • Focus on rental income growth and cash flow generation Project Name (‘000 sq.ft.) Opening • Minimal Development Risk TDM Boulevard Ex
Slide 24: Sustainability
Sustainability Environment, Social & Governance 23 |
Slide 25: Enhancing Focus on ESG
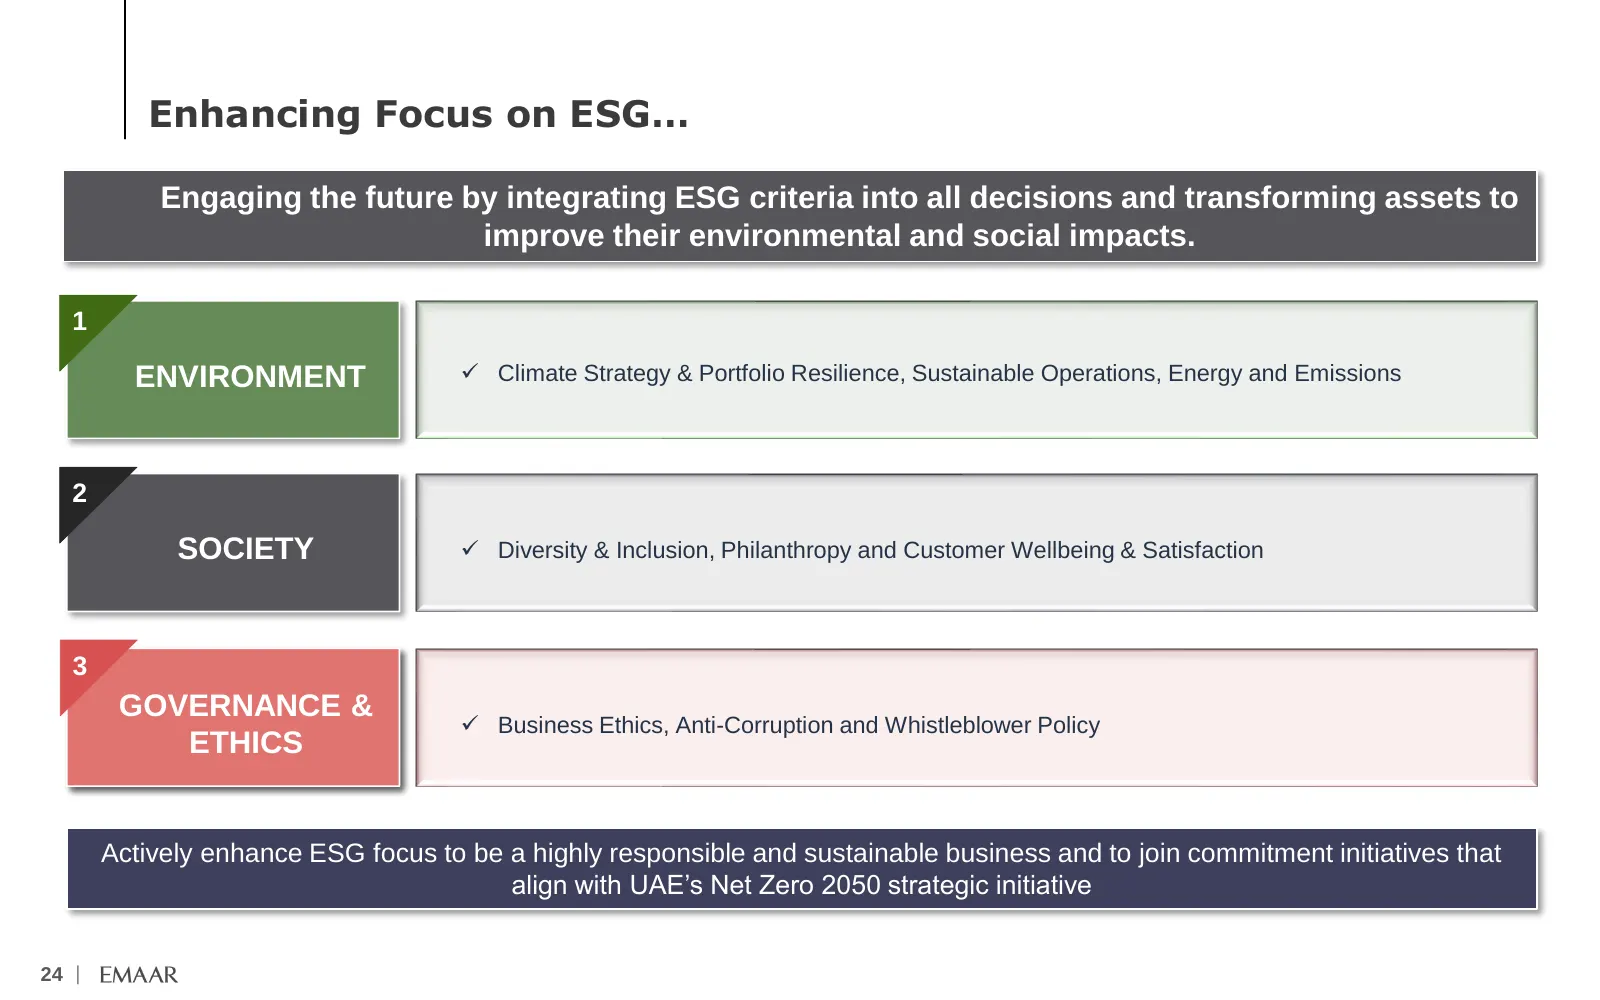
Enhancing Focus on ESG… Engaging the future by integrating ESG criteria into all decisions and transforming assets to improve their environmental and social impacts. 1 ENVIRONMENT ✓ Climate Strategy & Portfolio Resilience, Sustainable Operations, Energy and Emissions 2 SOCIETY ✓ Diversity & Inclusio
Slide 26: Enhancing Focus on ESG: Environment focus
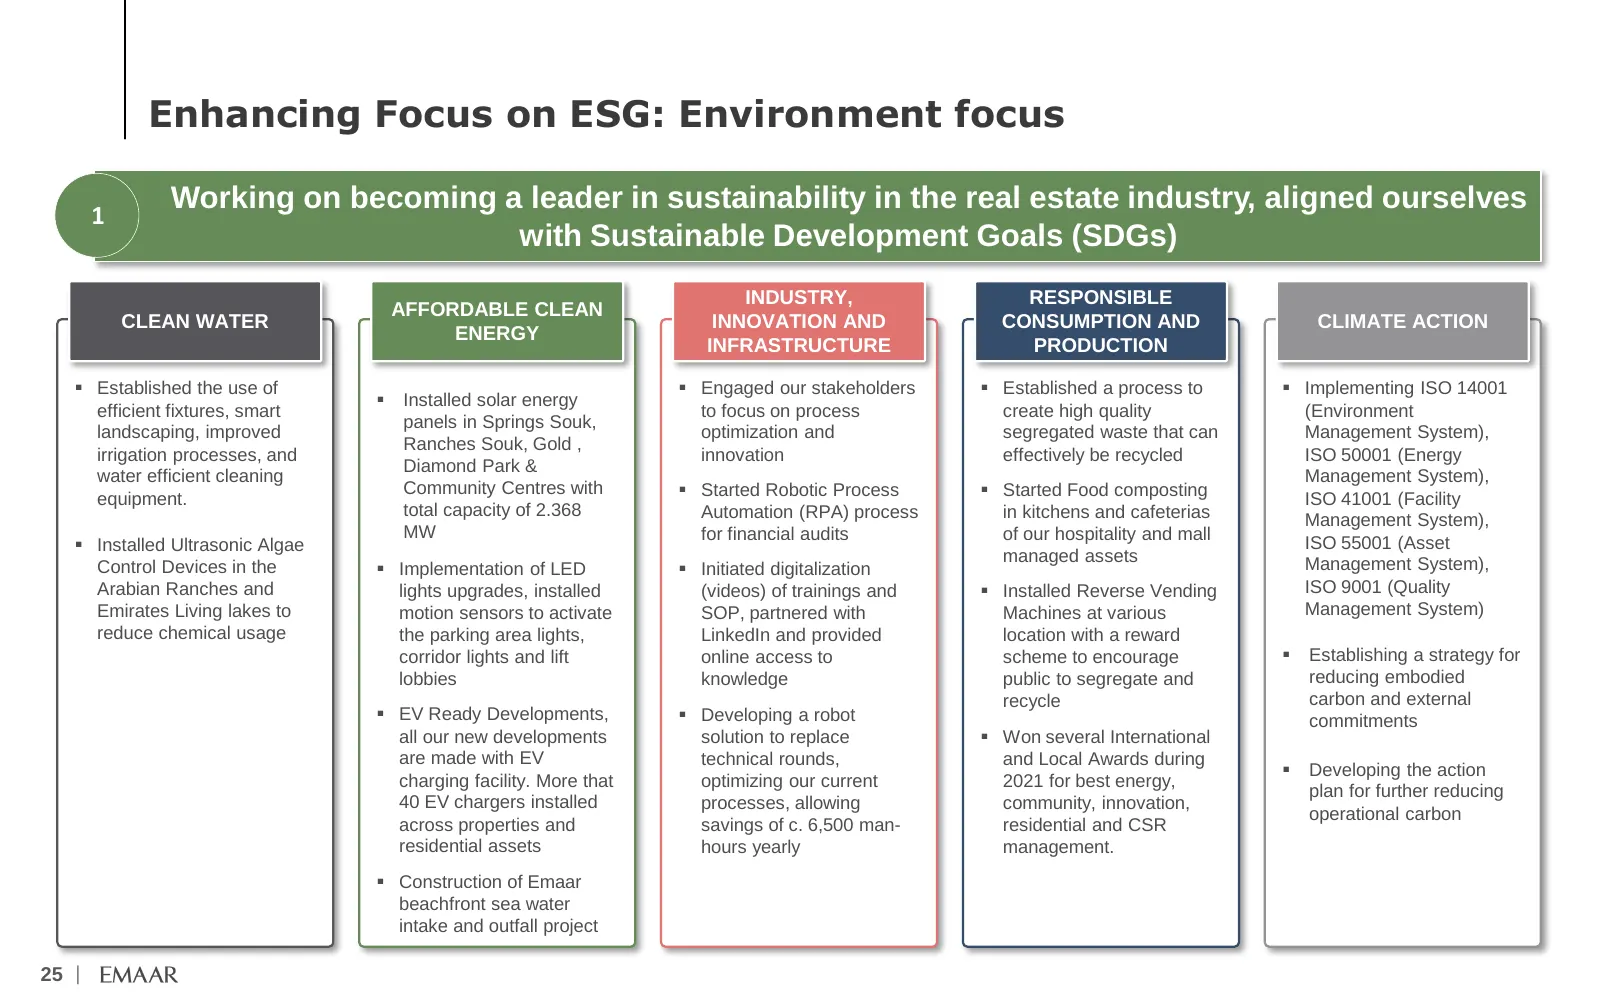
Enhancing Focus on ESG: Environment focus Working on becoming a leader in sustainability in the real estate industry, aligned ourselves 1 with Sustainable Development Goals (SDGs) INDUSTRY, RESPONSIBLE AFFORDABLE CLEAN CLEAN WATER INNOVATION AND CONSUMPTION AND CLIMATE ACTION ENERGY INFRASTRUCTURE P
Slide 27: Enhancing Focus on ESG: Social focus
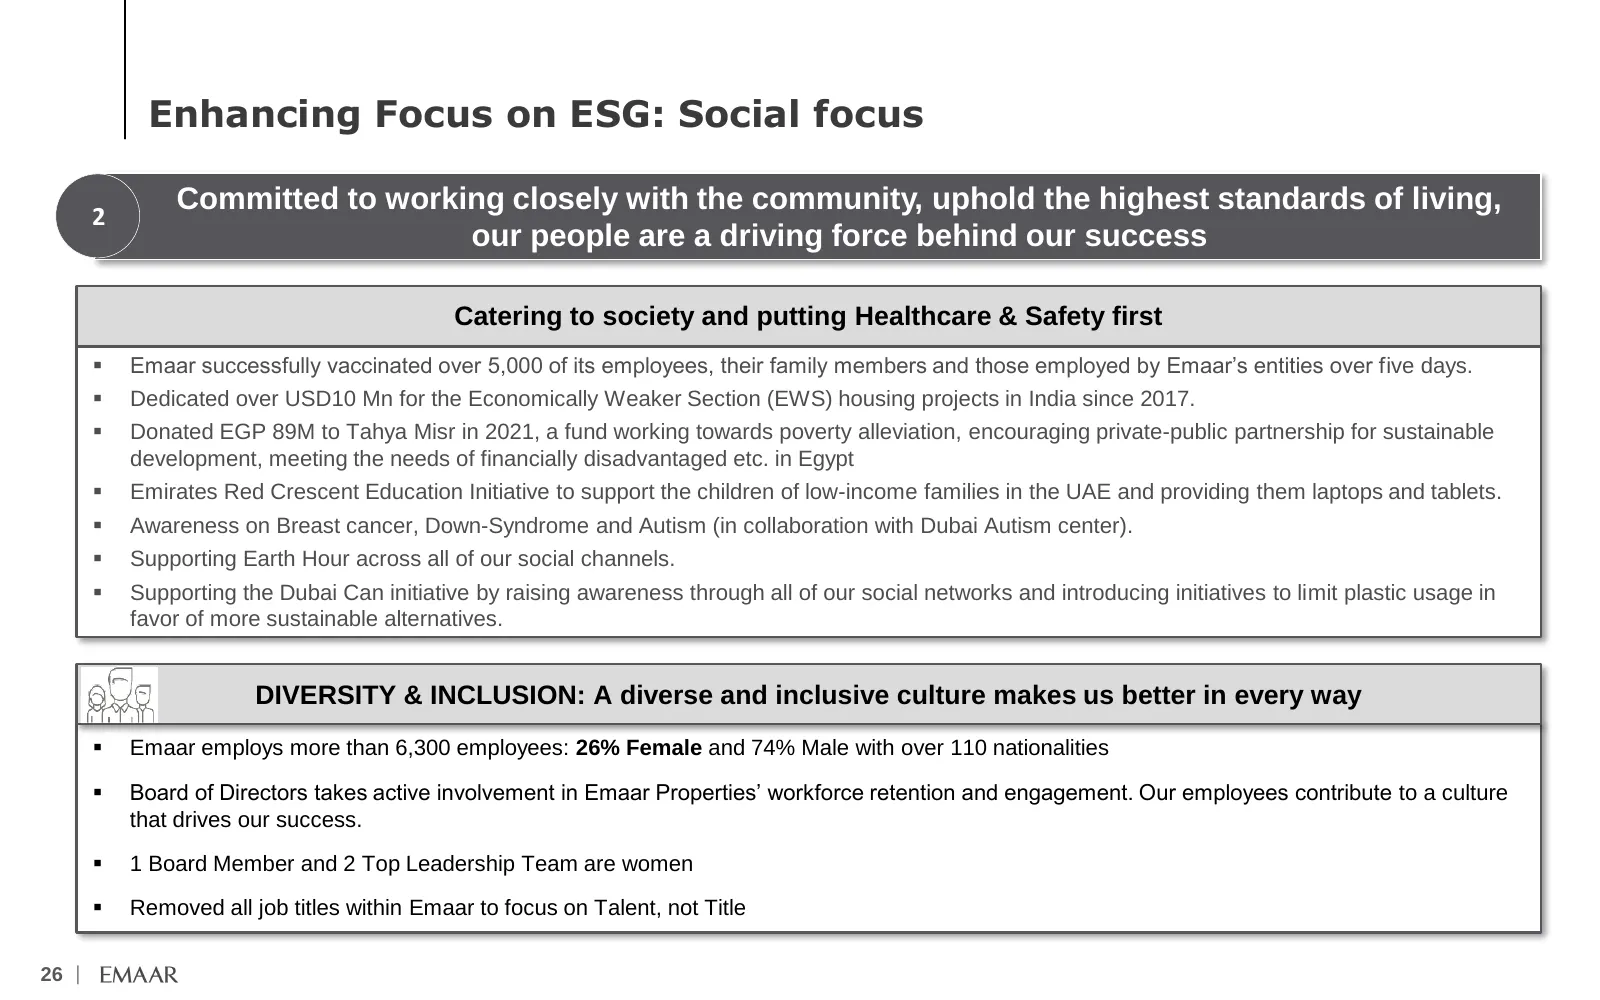
Enhancing Focus on ESG: Social focus Committed to working closely with the community, uphold the highest standards of living, 2 our people are a driving force behind our success Catering to society and putting Healthcare & Safety first ▪ Emaar successfully vaccinated over 5,000 of its employees, the
Slide 28: Enhancing Focus on ESG: Governance focus
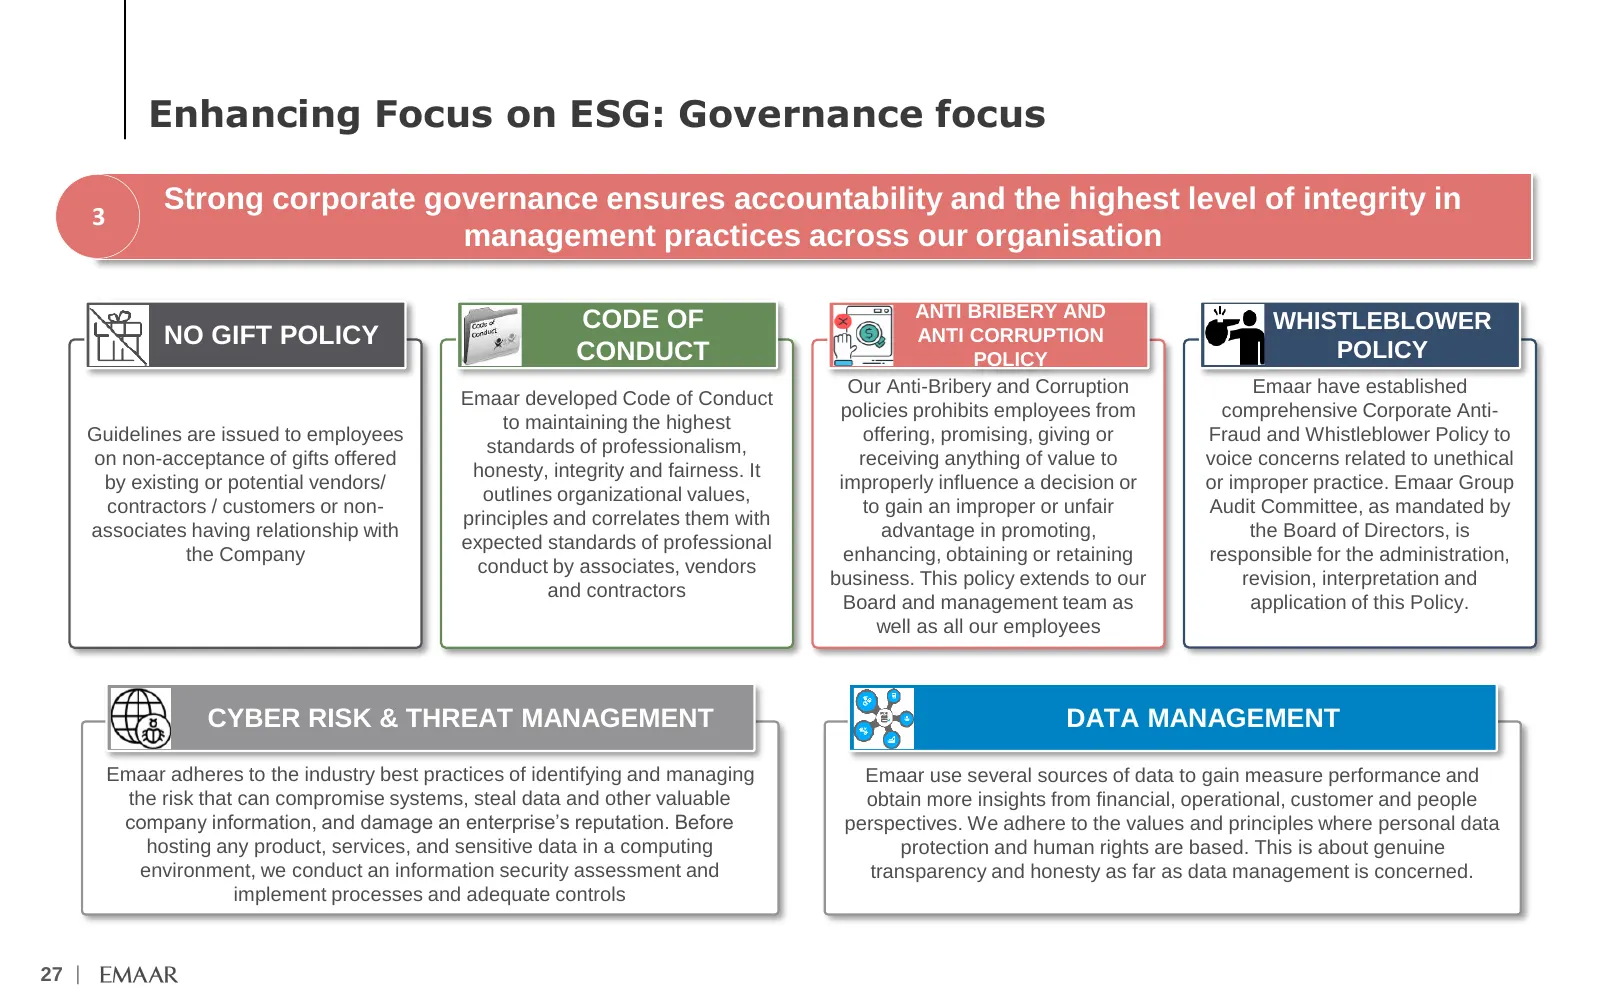
Enhancing Focus on ESG: Governance focus Strong corporate governance ensures accountability and the highest level of integrity in 3 management practices across our organisation ANTI BRIBERY AND CODE OF WHISTLEBLOWER NO GIFT POLICY ANTI CORRUPTION CONDUCT POLICY POLICY Our Anti-Bribery and Corruption
Slide 29: H1 2022 Results Update
H1 2022 Results Update —___
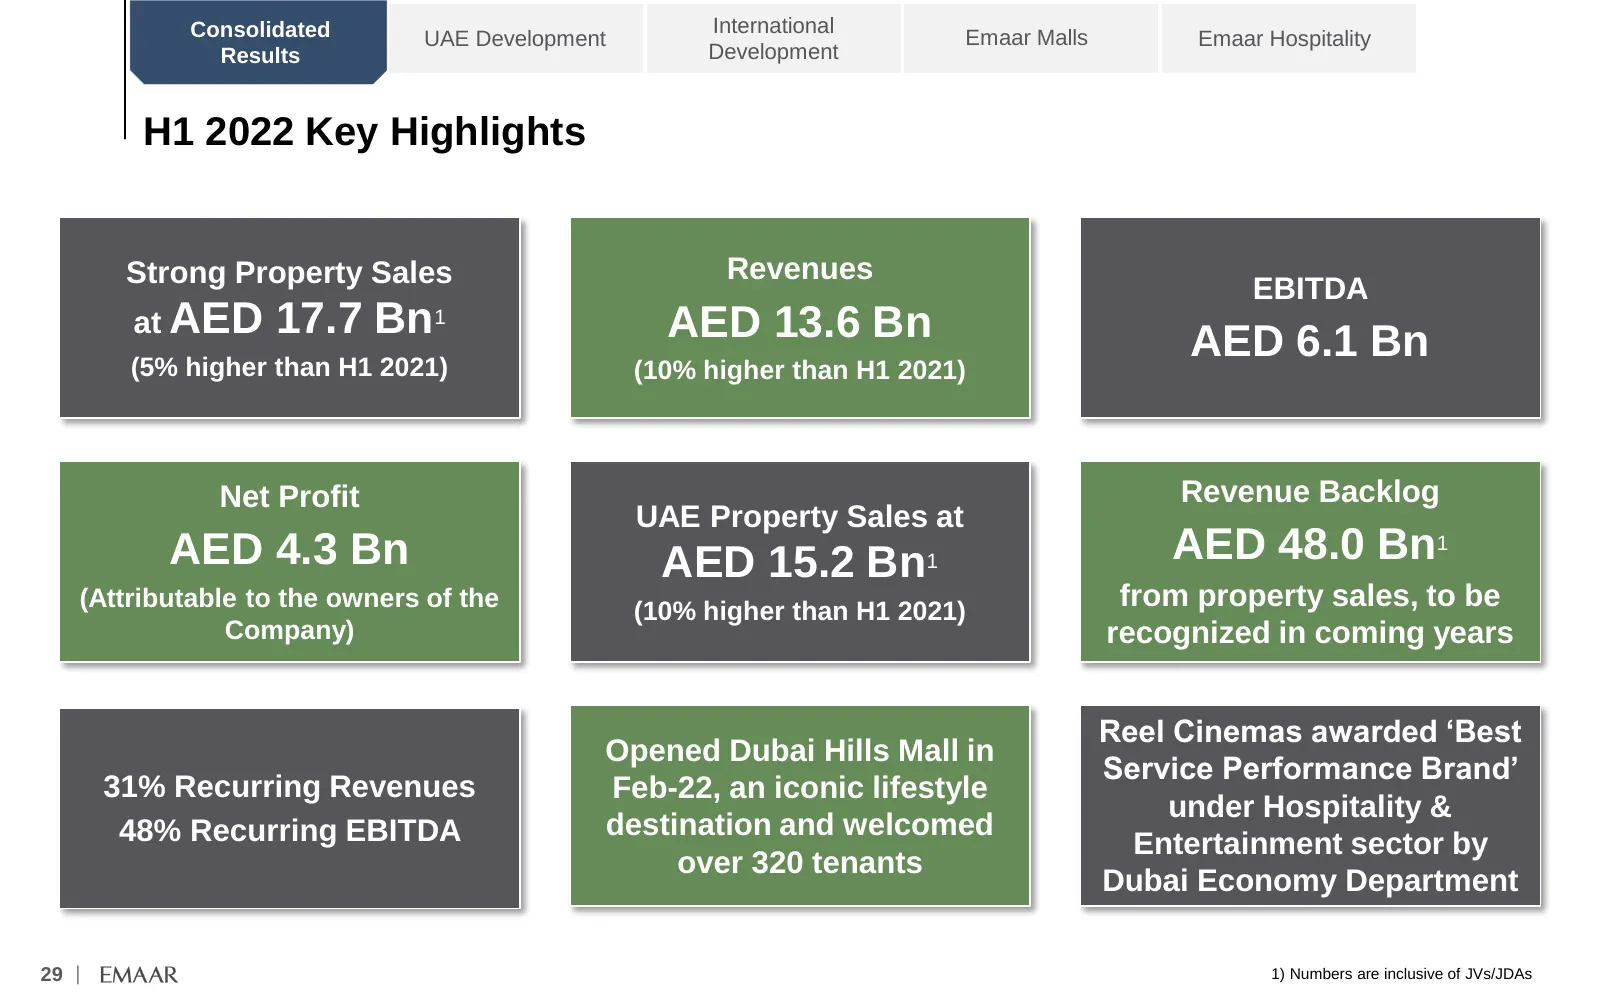
Slide 30: H1 2022 Key Highlights
Consolidated International UAE Development Emaar Malls Emaar Hospitality Results Development H1 2022 Key Highlights Strong Property Sales Revenues EBITDA at AED 17.7 Bn 1 AED 13.6 Bn (5% higher than H1 2021) AED 6.1 Bn (10% higher than H1 2021) Net Profit Revenue Backlog UAE Property Sales at AED 4.
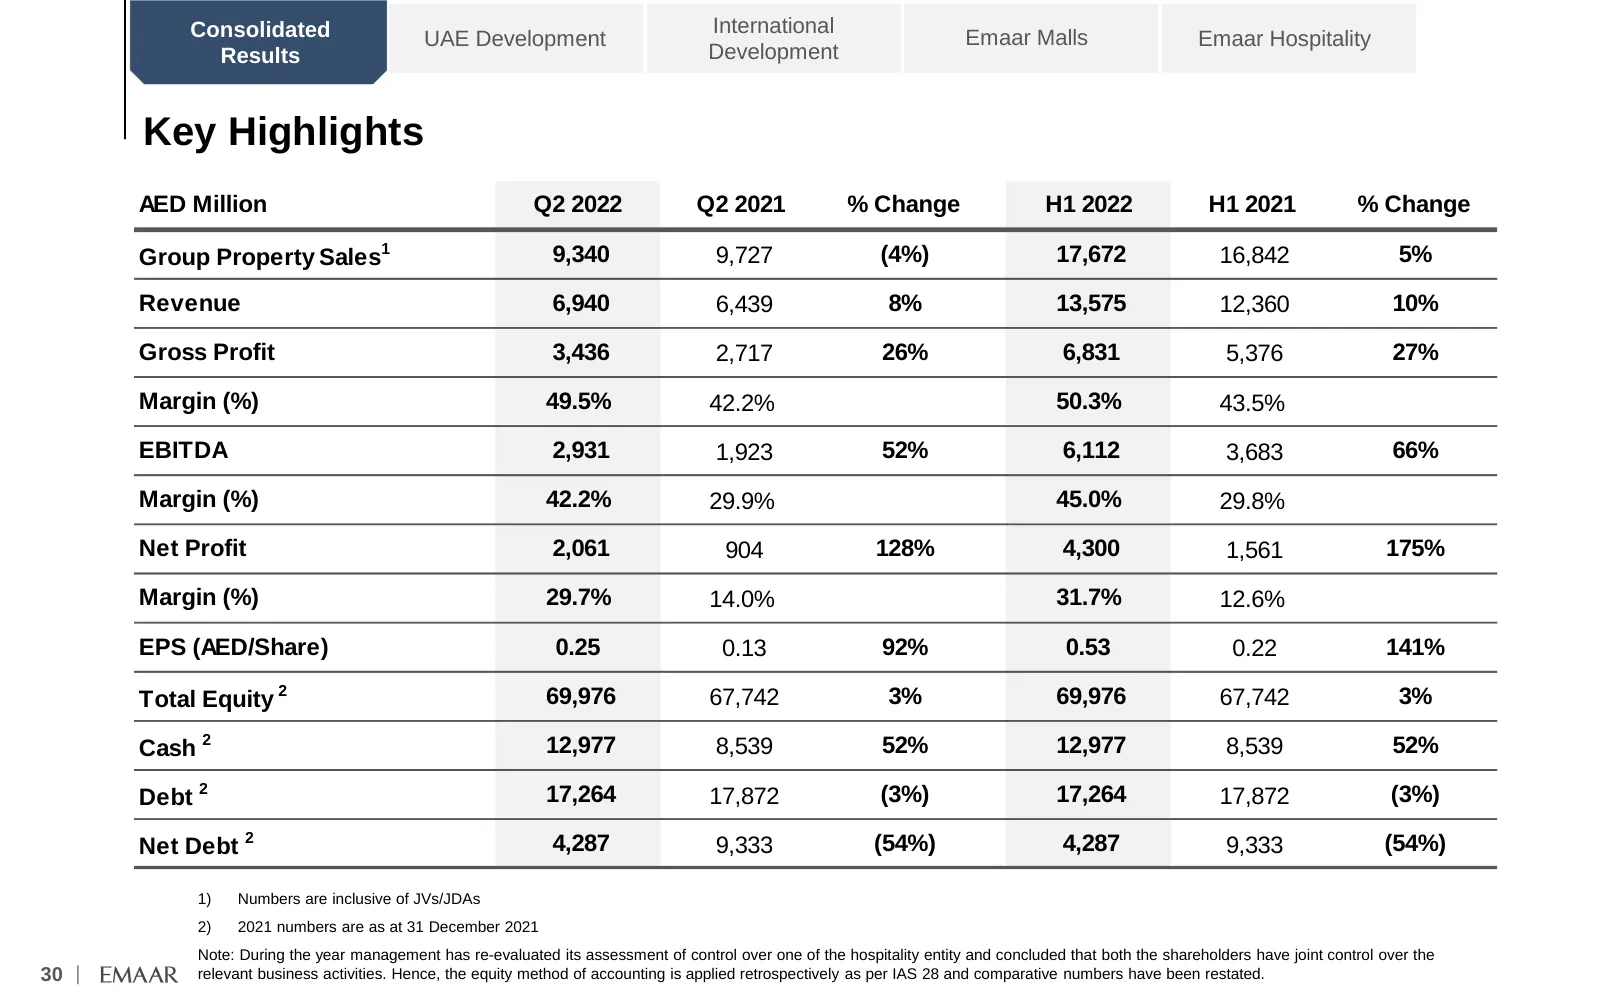
Slide 31: Key Highlights
Consolidated International UAE Development Emaar Malls Emaar Hospitality Results Development Key Highlights AED Million Q2 2022 Q2 2021 % Change H1 2022 H1 2021 % Change Group Property Sales1 9,340 9,727 (4%) 17,672 16,842 5% Revenue 6,940 6,439 8% 13,575 12,360 10% Gross Profit 3,436 2,717 26% 6,83
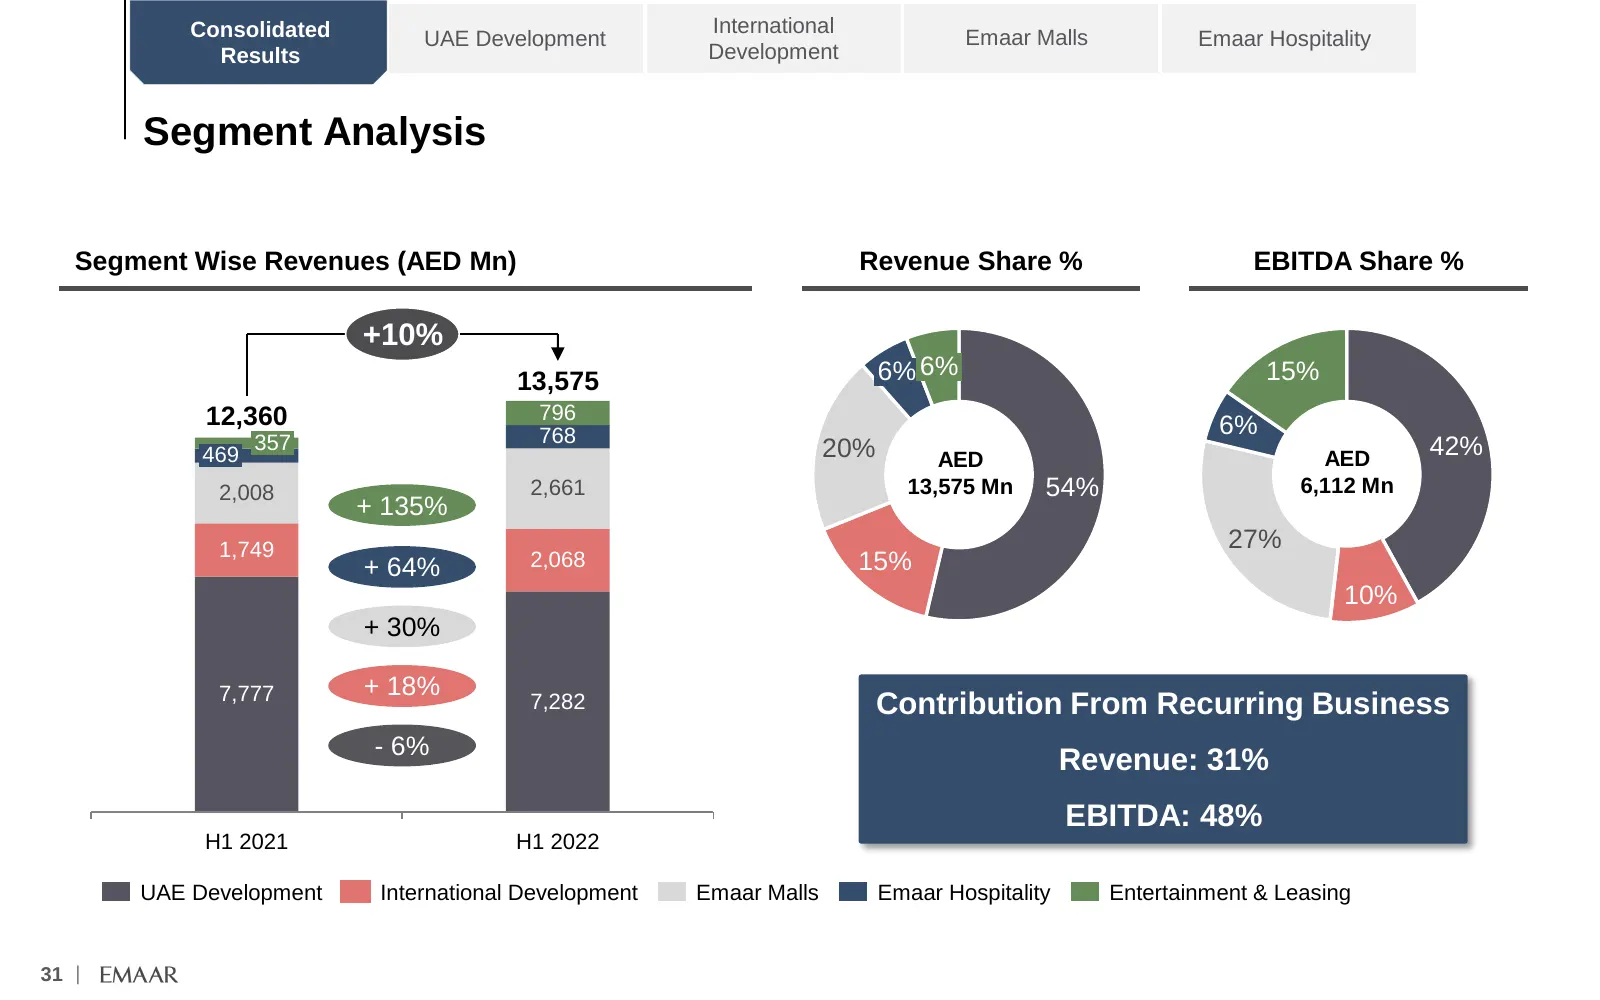
Slide 32: Segment Analysis
Consolidated International UAE Development Emaar Malls Emaar Hospitality Results Development Segment Analysis Segment Wise Revenues (AED Mn) Revenue Share % EBITDA Share % +10% 13,575 6% 6% 15% 12,360 796 768 6% 357 20% 42% 469 AED AED 2,008 2,661 13,575 Mn 54% 6,112 Mn + 135% 1,749 27% + 64% 2,068
Slide 33: Historical Trend
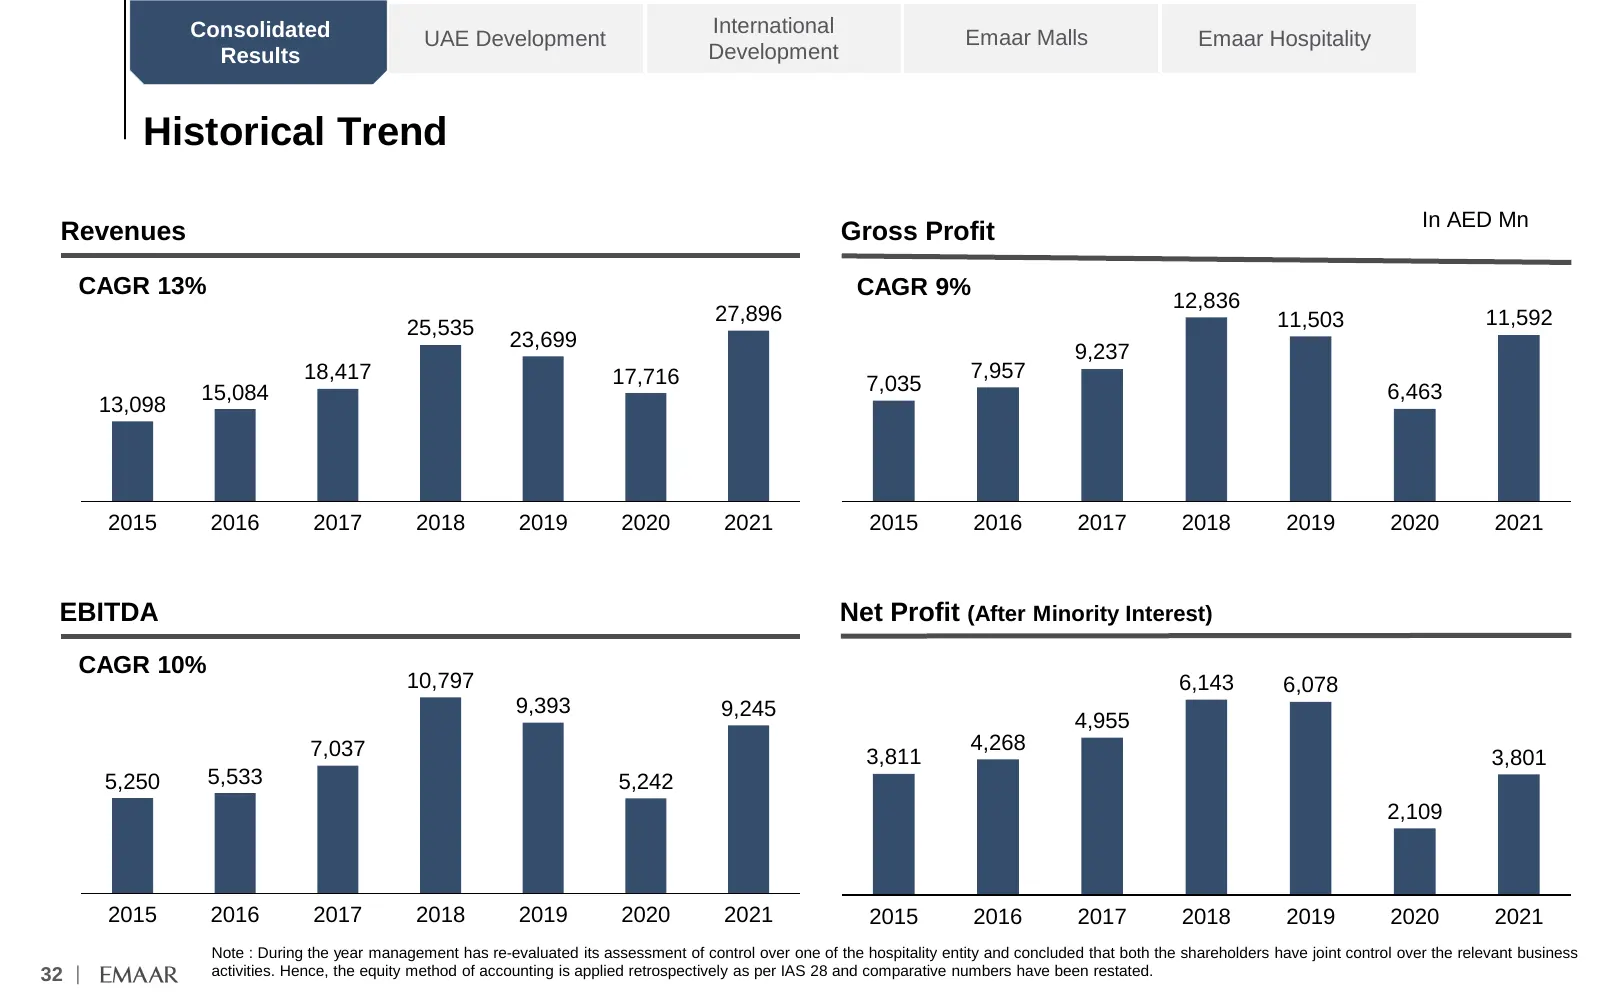
Consolidated International UAE Development Emaar Malls Emaar Hospitality Results Development Historical Trend In AED Mn Revenues Gross Profit CAGR 13% CAGR 9% 12,836 27,896 11,503 11,592 25,535 23,699 9,237 18,417 17,716 7,957 15,084 7,035 6,463 13,098 2015 2016 2017 2018 2019 2020 2021 2015 2016 20
Slide 34: Balance Sheet & Cash Flow Overview
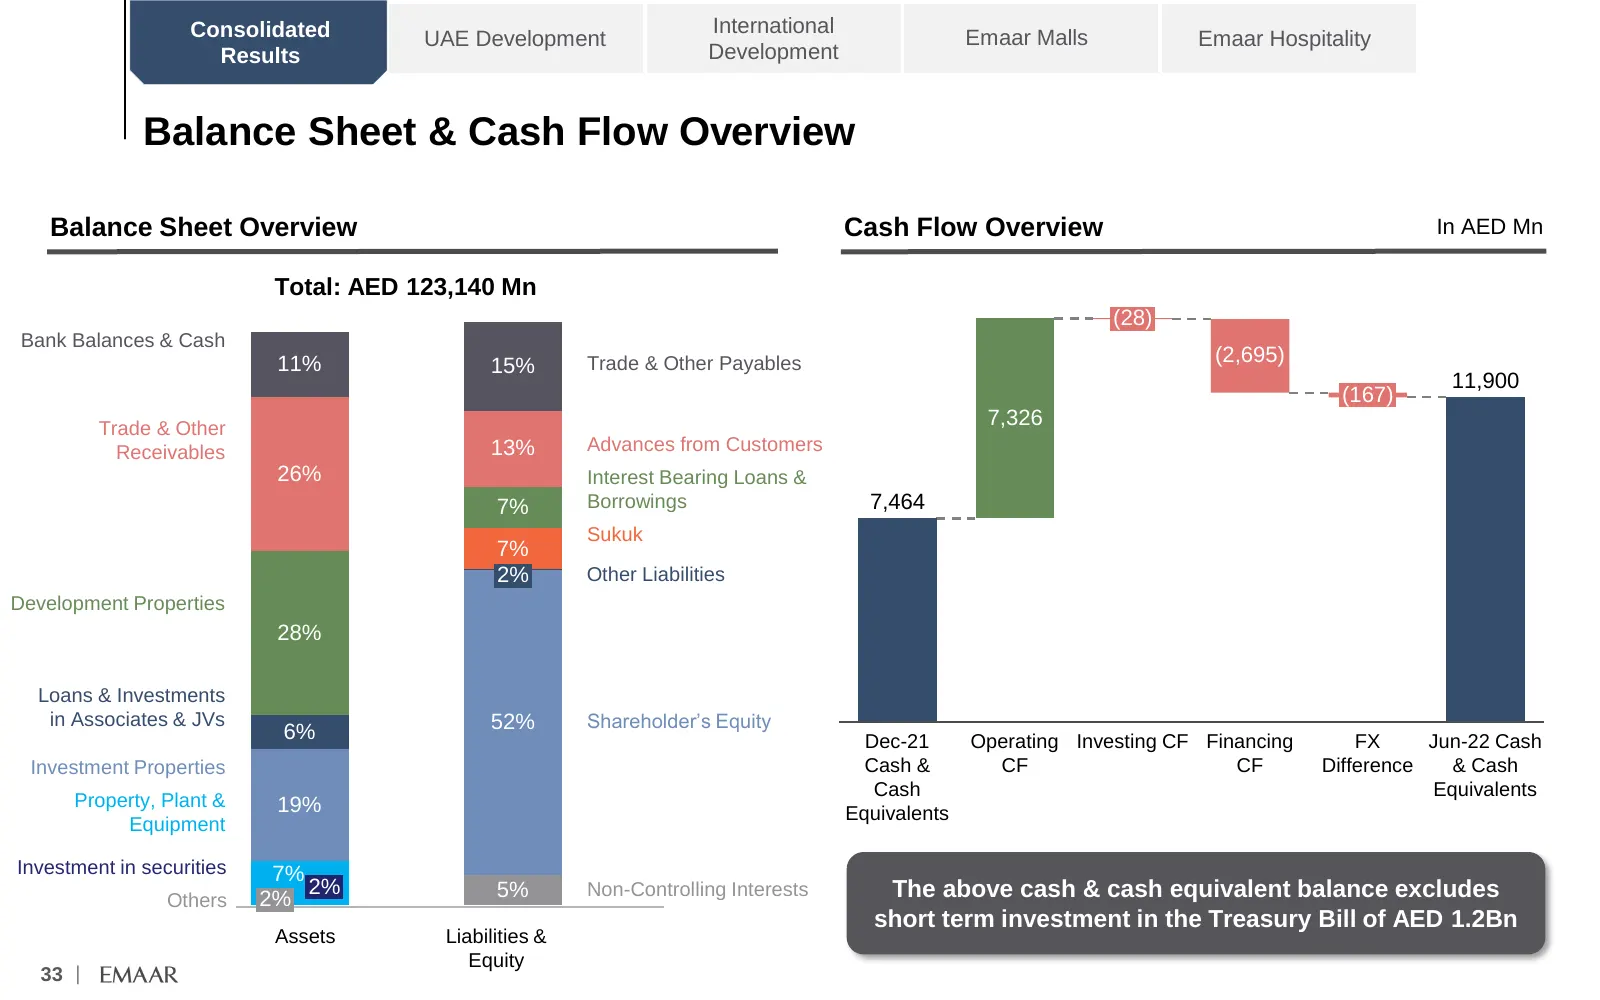
Consolidated International UAE Development Emaar Malls Emaar Hospitality Results Development Balance Sheet & Cash Flow Overview Balance Sheet Overview Cash Flow Overview In AED Mn Total: AED 123,140 Mn (28) Bank Balances & Cash 11% 15% Trade & Other Payables (2,695) 11,900 (167) Trade & Other 7,326
Slide 35: Emaar Development – Key Highlights
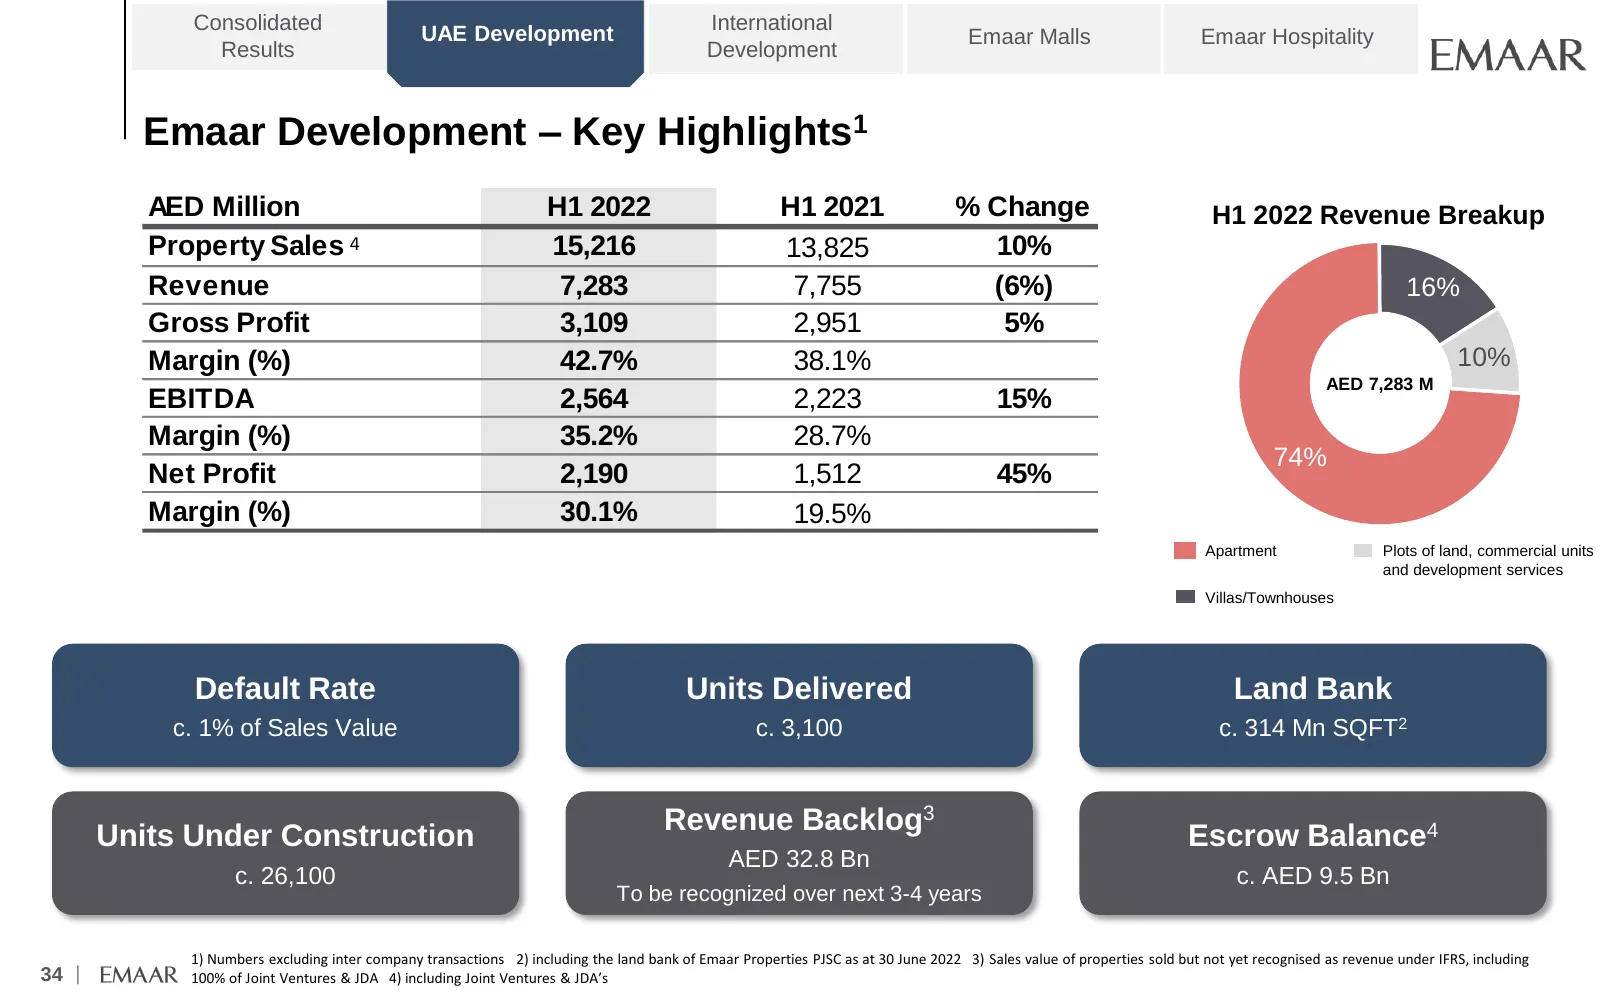
Consolidated UAE Development International Emaar Malls Emaar Hospitality Results Development Emaar Development – Key Highlights1 AED Million H1 2022 H1 2021 % Change H1 2022 Revenue Breakup Property Sales 4 15,216 13,825 10% Revenue 7,283 7,755 (6%) 16% Gross Profit 3,109 2,951 5% Margin (%) 42.7% 3
Slide 36: UAE Development – Current Project Status
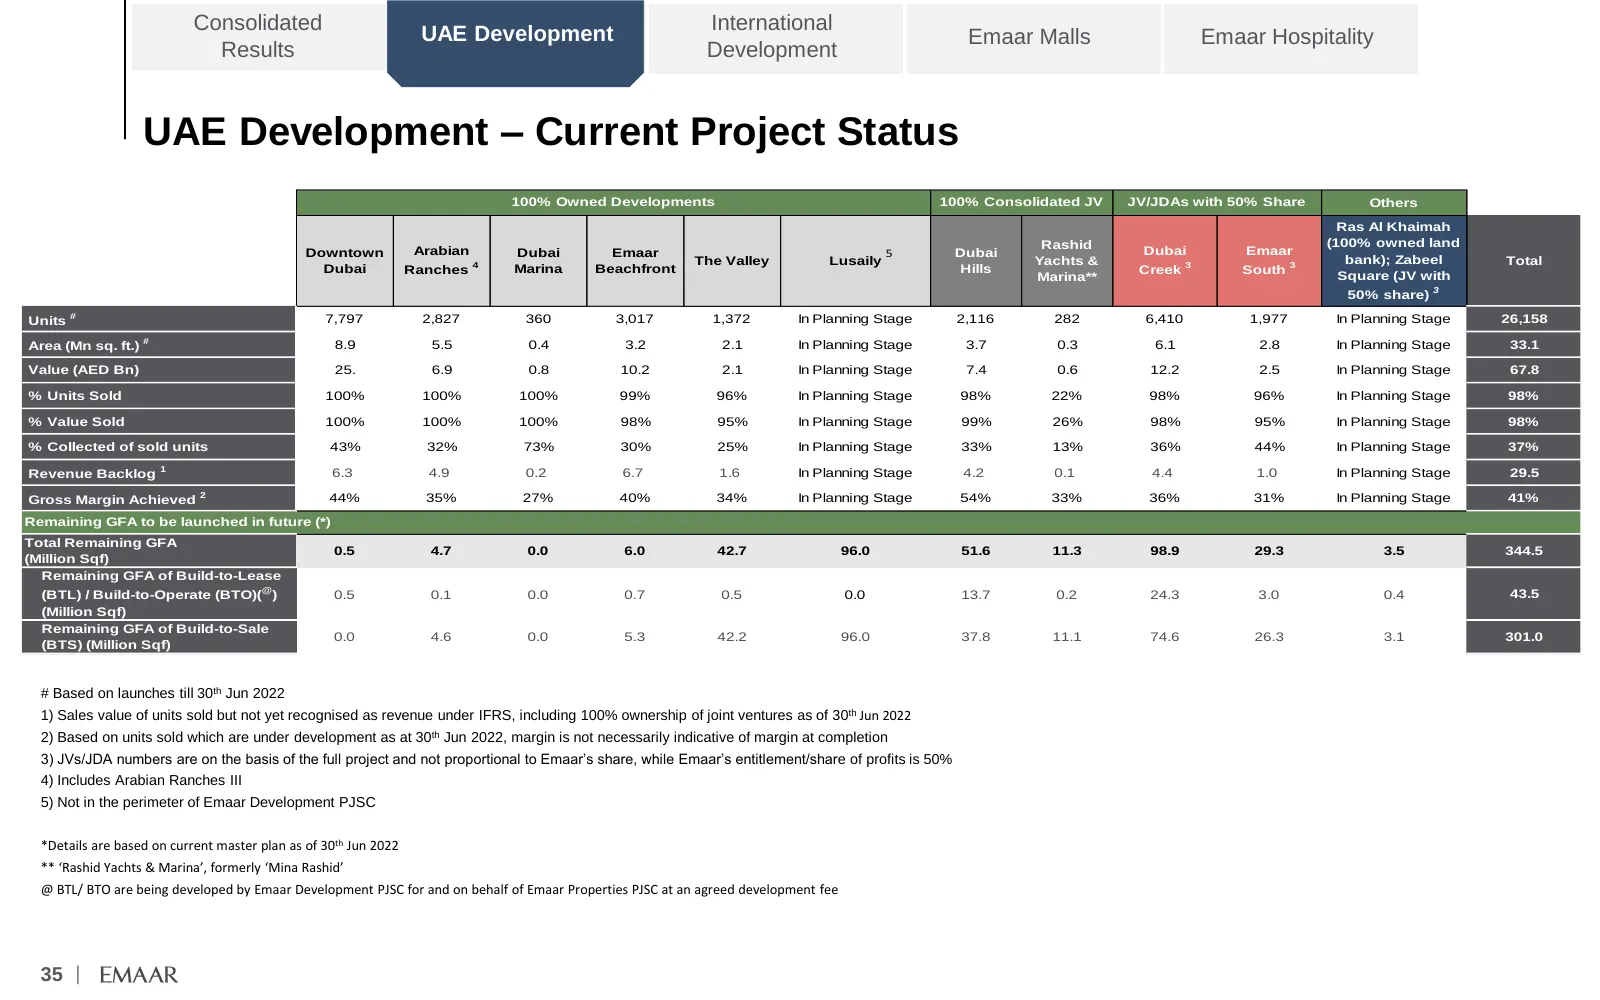
Consolidated UAE Development International Emaar Malls Emaar Hospitality Results Development UAE Development – Current Project Status 100% Owned Developments 100% Consolidated JV JV/JDAs with 50% Share Others Ras Al Khaimah Rashid (100% owned land Downtown Arabian Dubai Emaar 5 Dubai Dubai Emaar 4 T
Slide 37: Emaar Development – Historical Trend
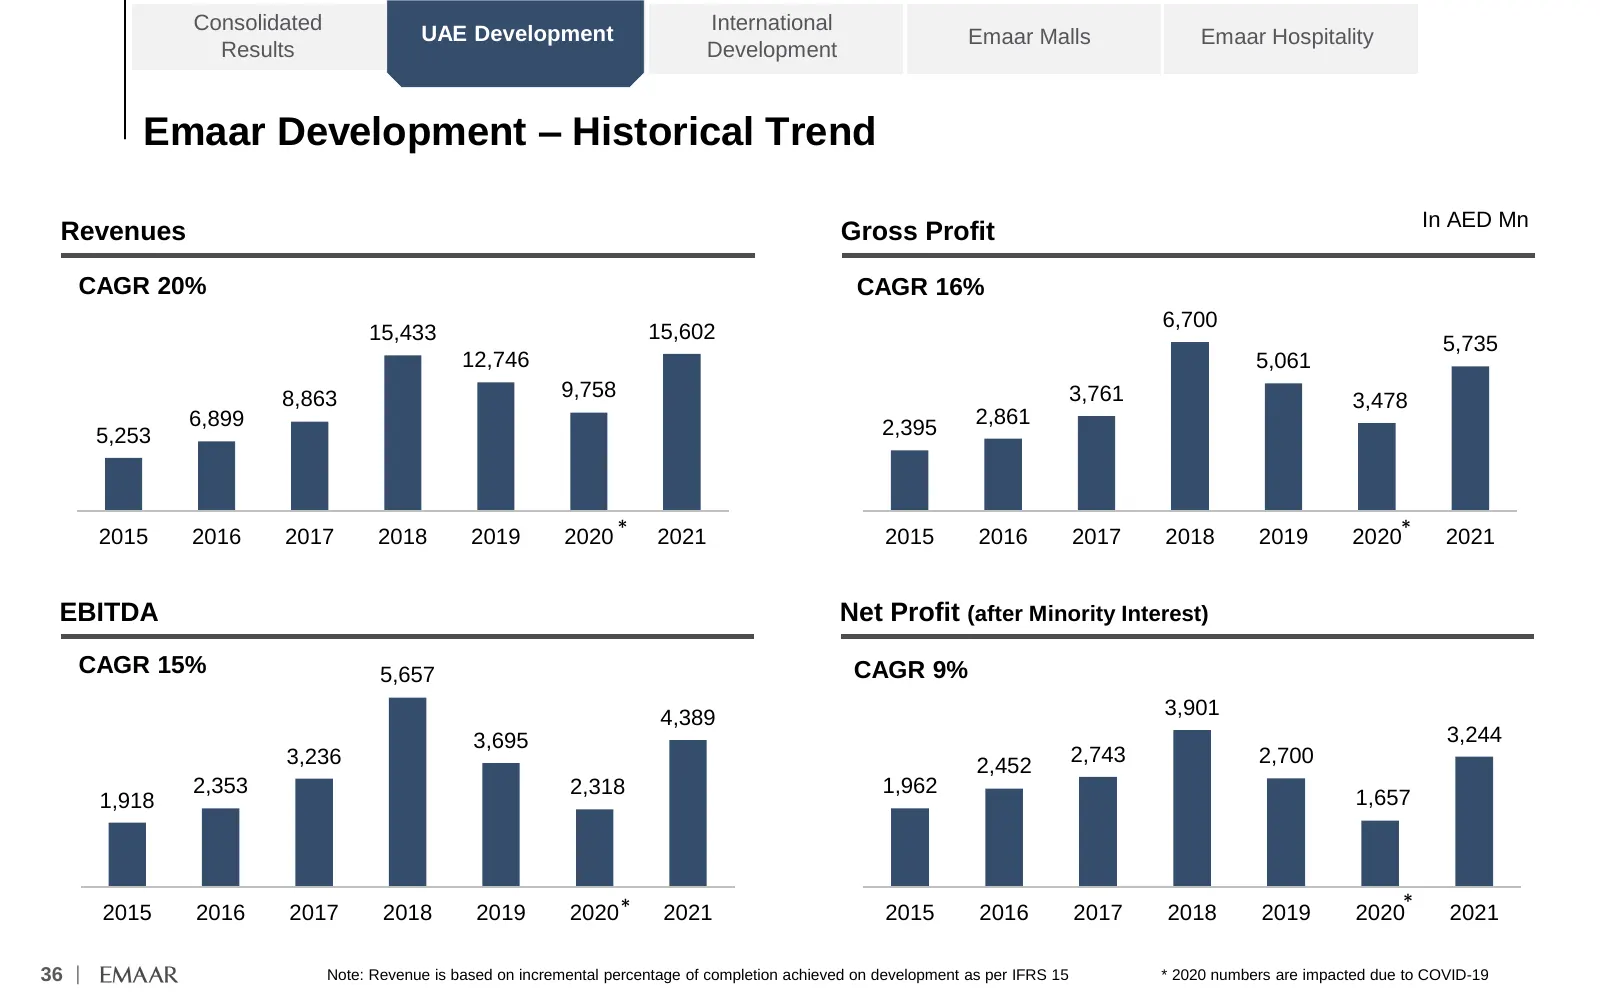
Consolidated UAE Development International Emaar Malls Emaar Hospitality Results Development Emaar Development – Historical Trend In AED Mn Revenues Gross Profit CAGR 20% CAGR 16% 6,700 15,433 15,602 5,735 12,746 5,061 8,863 9,758 3,761 3,478 6,899 2,861 5,253 2,395 2015 2016 2017 2018 2019 2020 * 2
Slide 38: International Development – Key Highlights
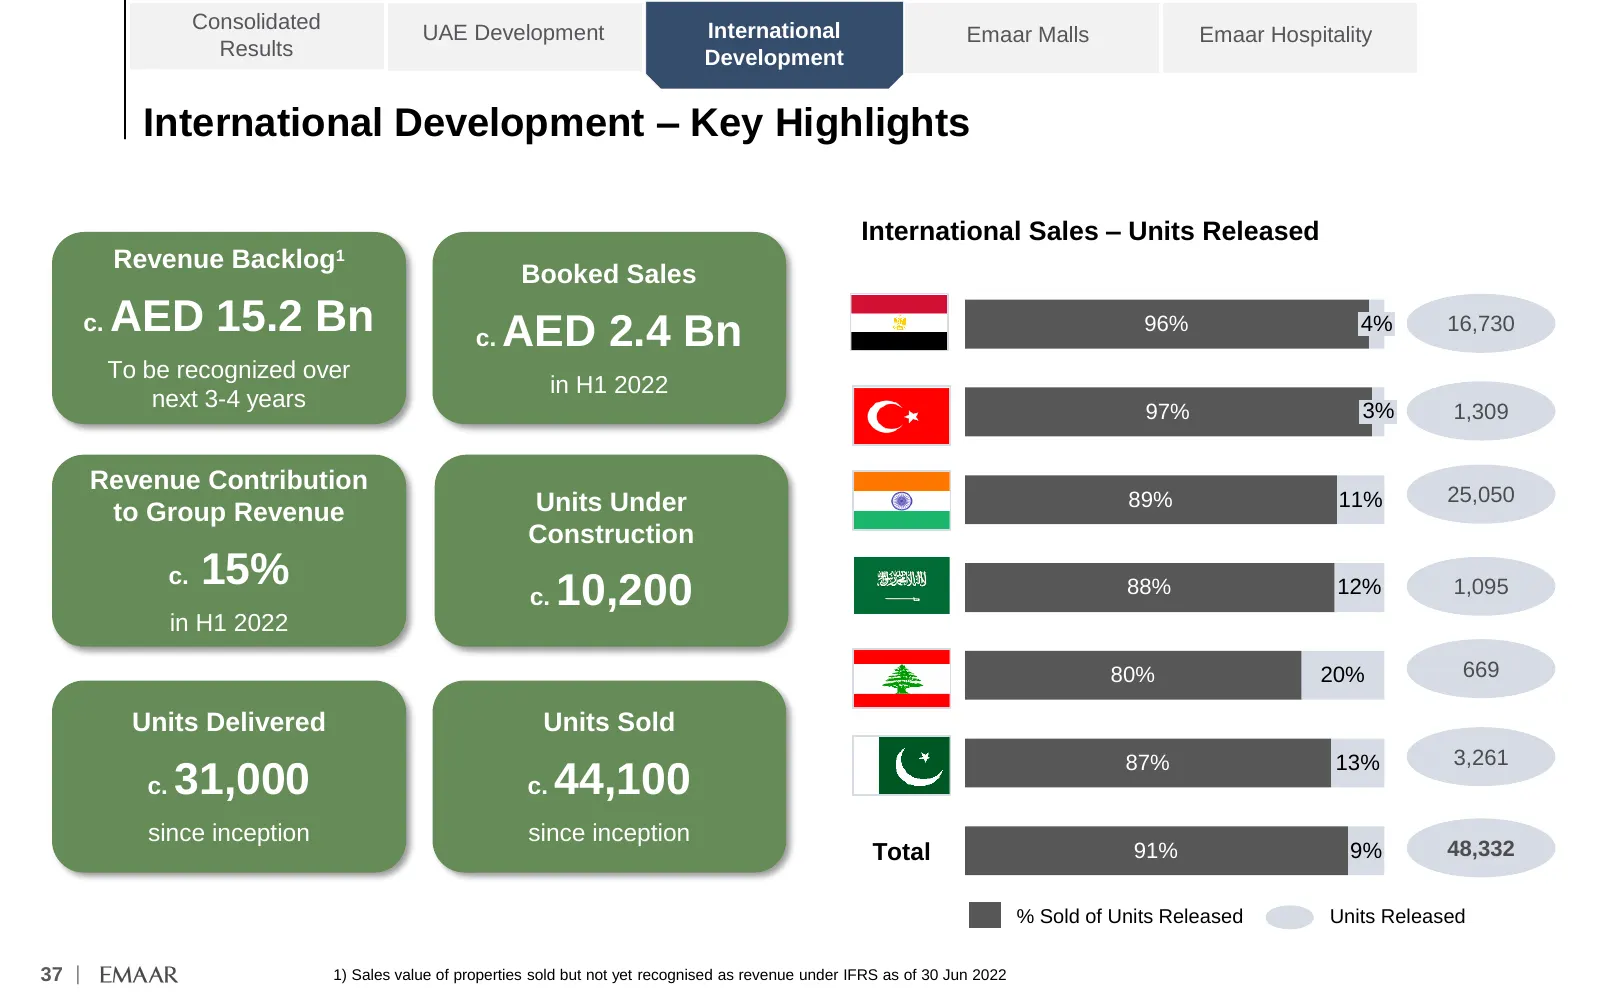
Consolidated UAE Development International Emaar Malls Emaar Hospitality Results Development International Development – Key Highlights International Sales – Units Released Revenue Backlog1 Booked Sales c. AED 15.2 Bn c. AED 2.4 Bn 96% 4% 16,730 To be recognized over in H1 2022 next 3-4 years 97% 3%
Slide 39: International Development – Key Highlights (Emaar Misr)
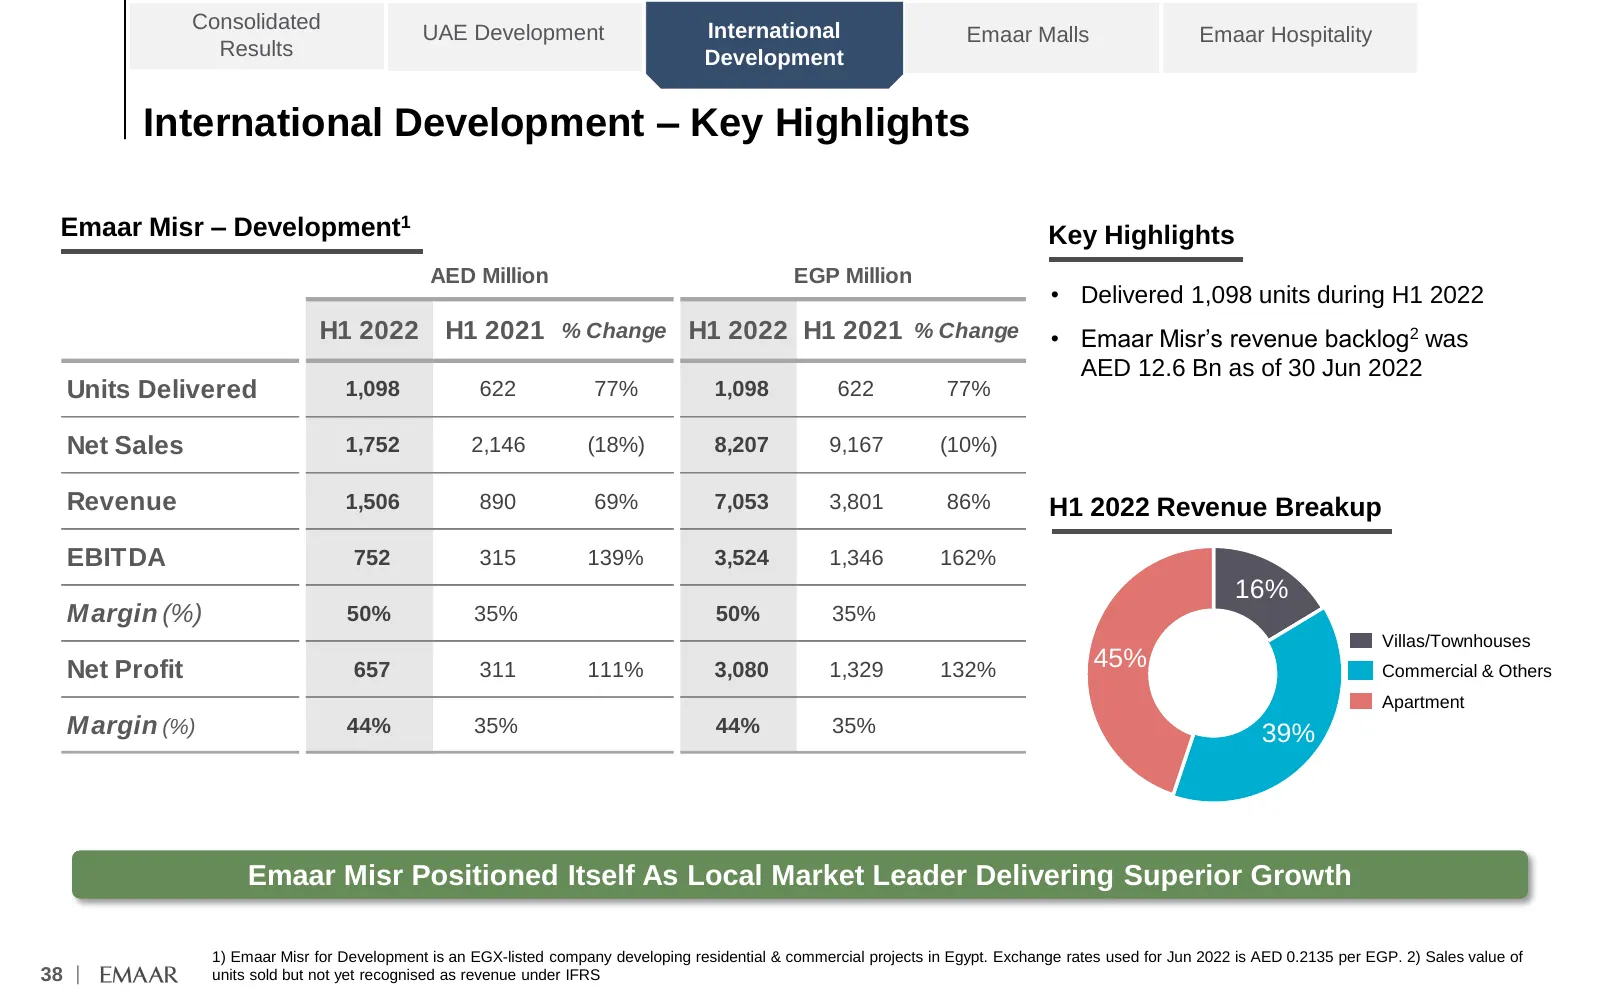
Consolidated UAE Development International Emaar Malls Emaar Hospitality Results Development International Development – Key Highlights Emaar Misr – Development1 Key Highlights AED Million EGP Million • Delivered 1,098 units during H1 2022 H1 2022 H1 2021 % Change H1 2022 H1 2021 % Change • Emaar Mi
Slide 40: Emaar Mall Management – Key Highlights
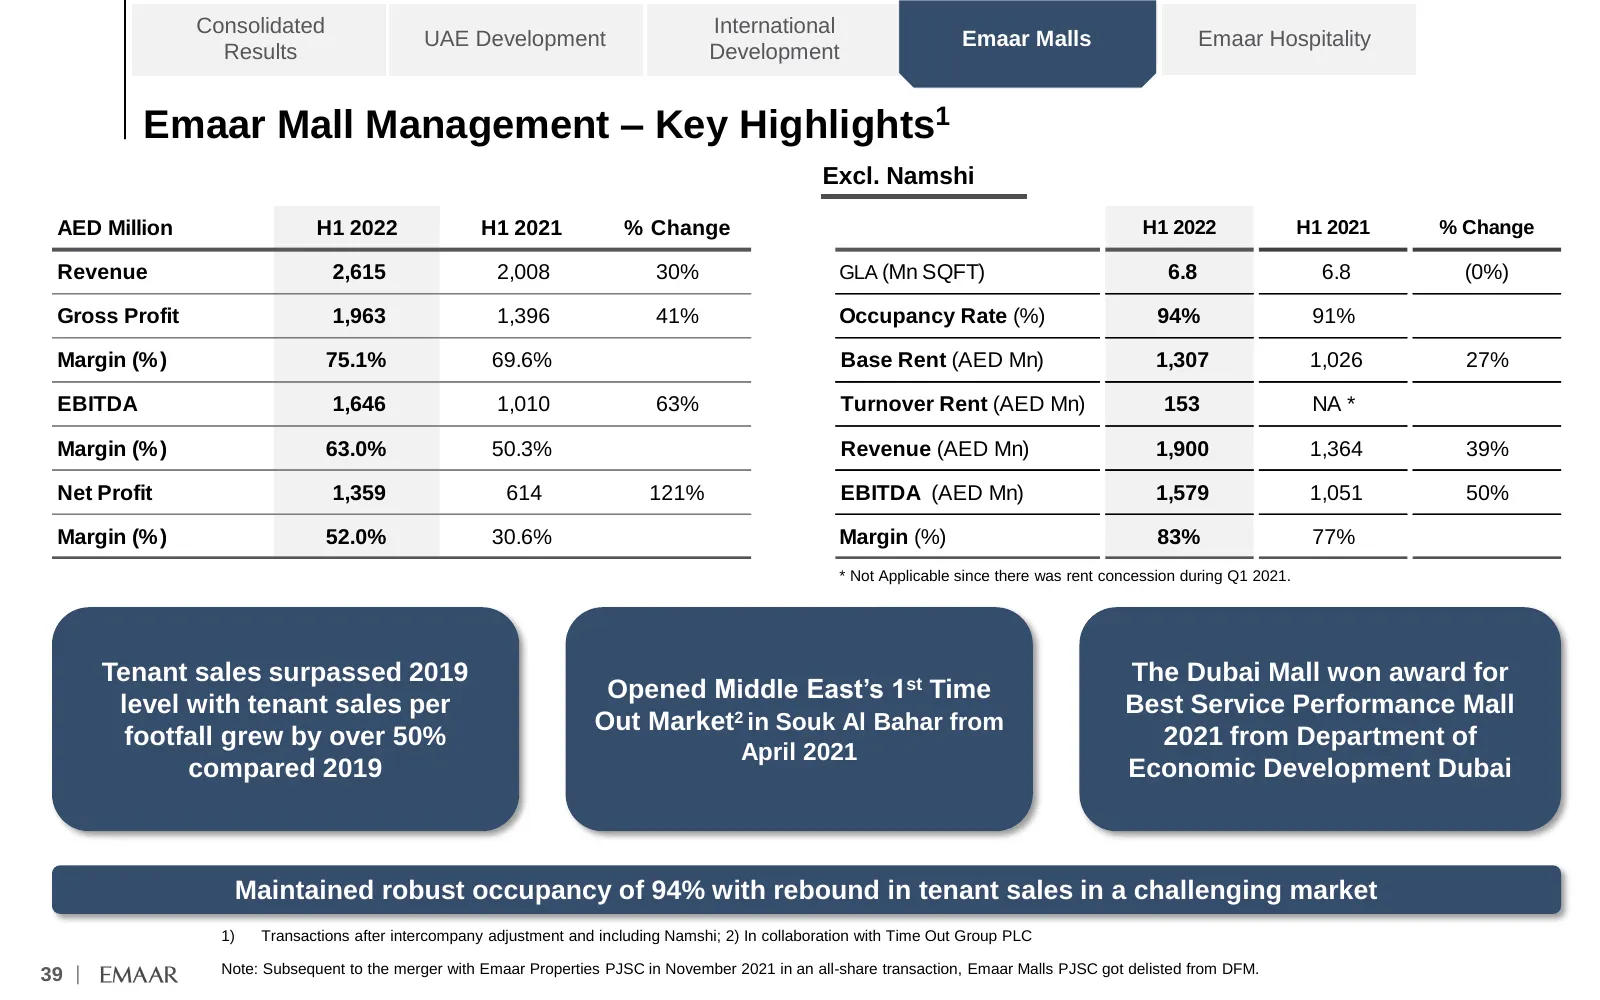
Consolidated International UAE Development Emaar Malls Emaar Hospitality Results Development Emaar Mall Management – Key Highlights1 Excl. Namshi AED Million H1 2022 H1 2021 % Change H1 2022 H1 2021 % Change Revenue 2,615 2,008 30% GLA (Mn SQFT) 6.8 6.8 (0%) Gross Profit 1,963 1,396 41% Occupancy Ra
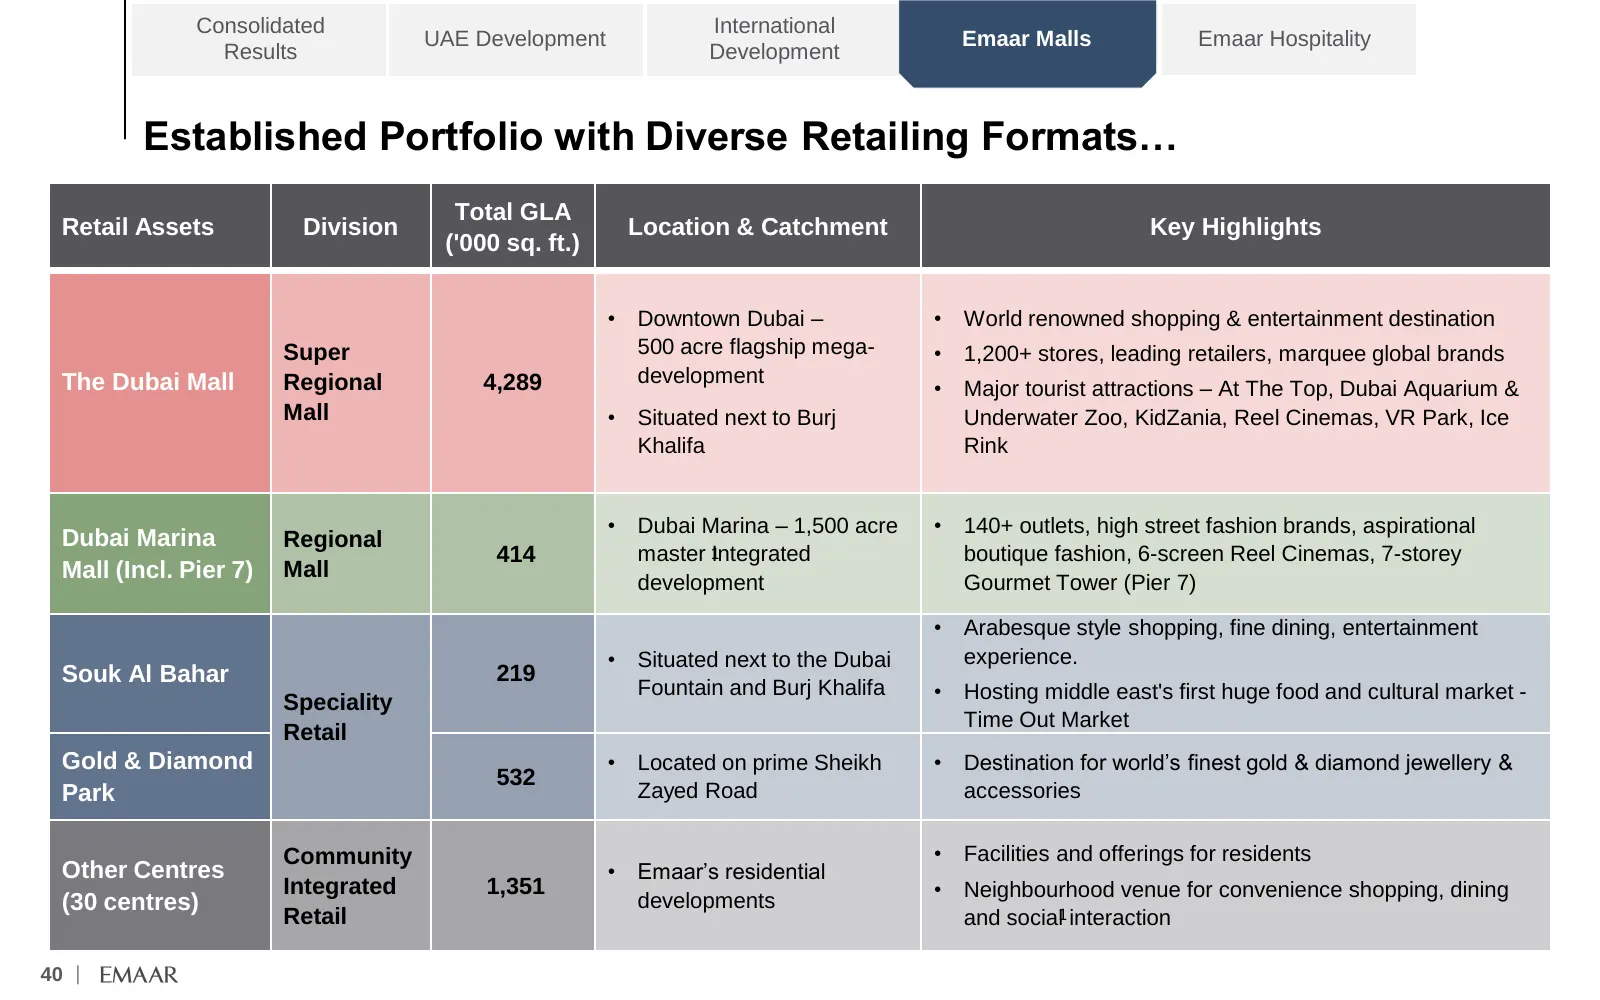
Slide 41: Established Portfolio with Diverse Retailing Formats
Consolidated International UAE Development Emaar Malls Emaar Hospitality Results Development Established Portfolio with Diverse Retailing Formats… Total GLA Retail Assets Division Location & Catchment Key Highlights ('000 sq. ft.) • Downtown Dubai – • World renowned shopping & entertainment destinat
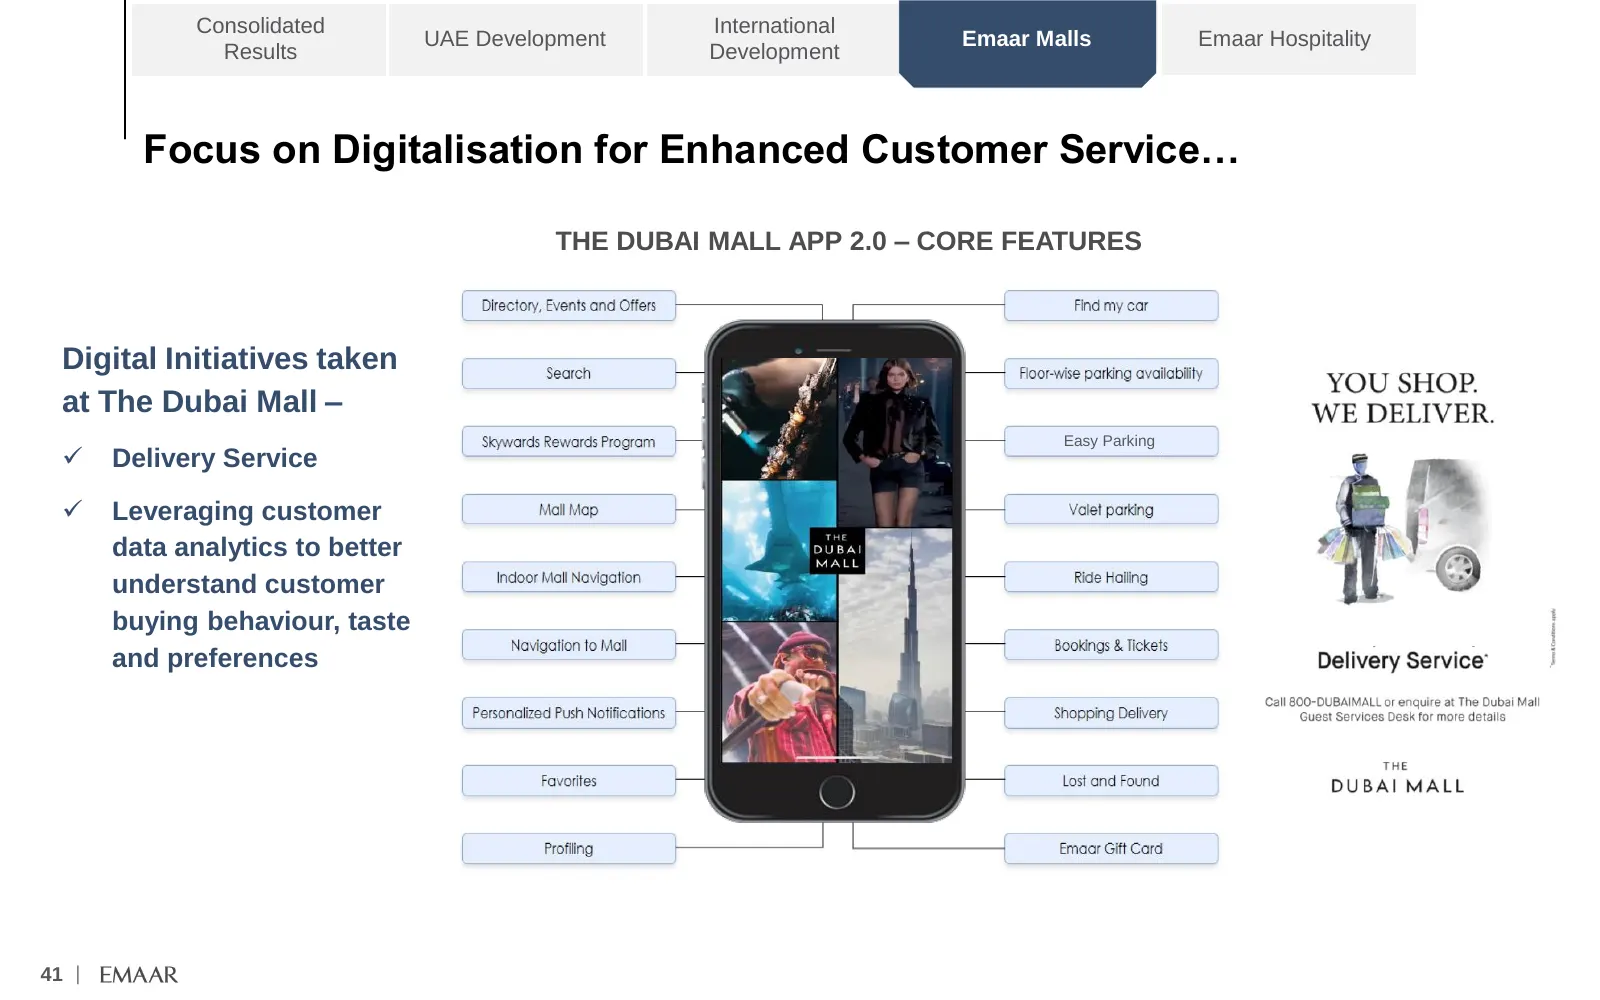
Slide 42: Focus on Digitalisation for Enhanced Customer Service
Consolidated International UAE Development Emaar Malls Emaar Hospitality Results Development Focus on Digitalisation for Enhanced Customer Service… THE DUBAI MALL APP 2.0 – CORE FEATURES Digital Initiatives taken at The Dubai Mall – Easy Parking ✓ Delivery Service ✓ Leveraging customer data analytic
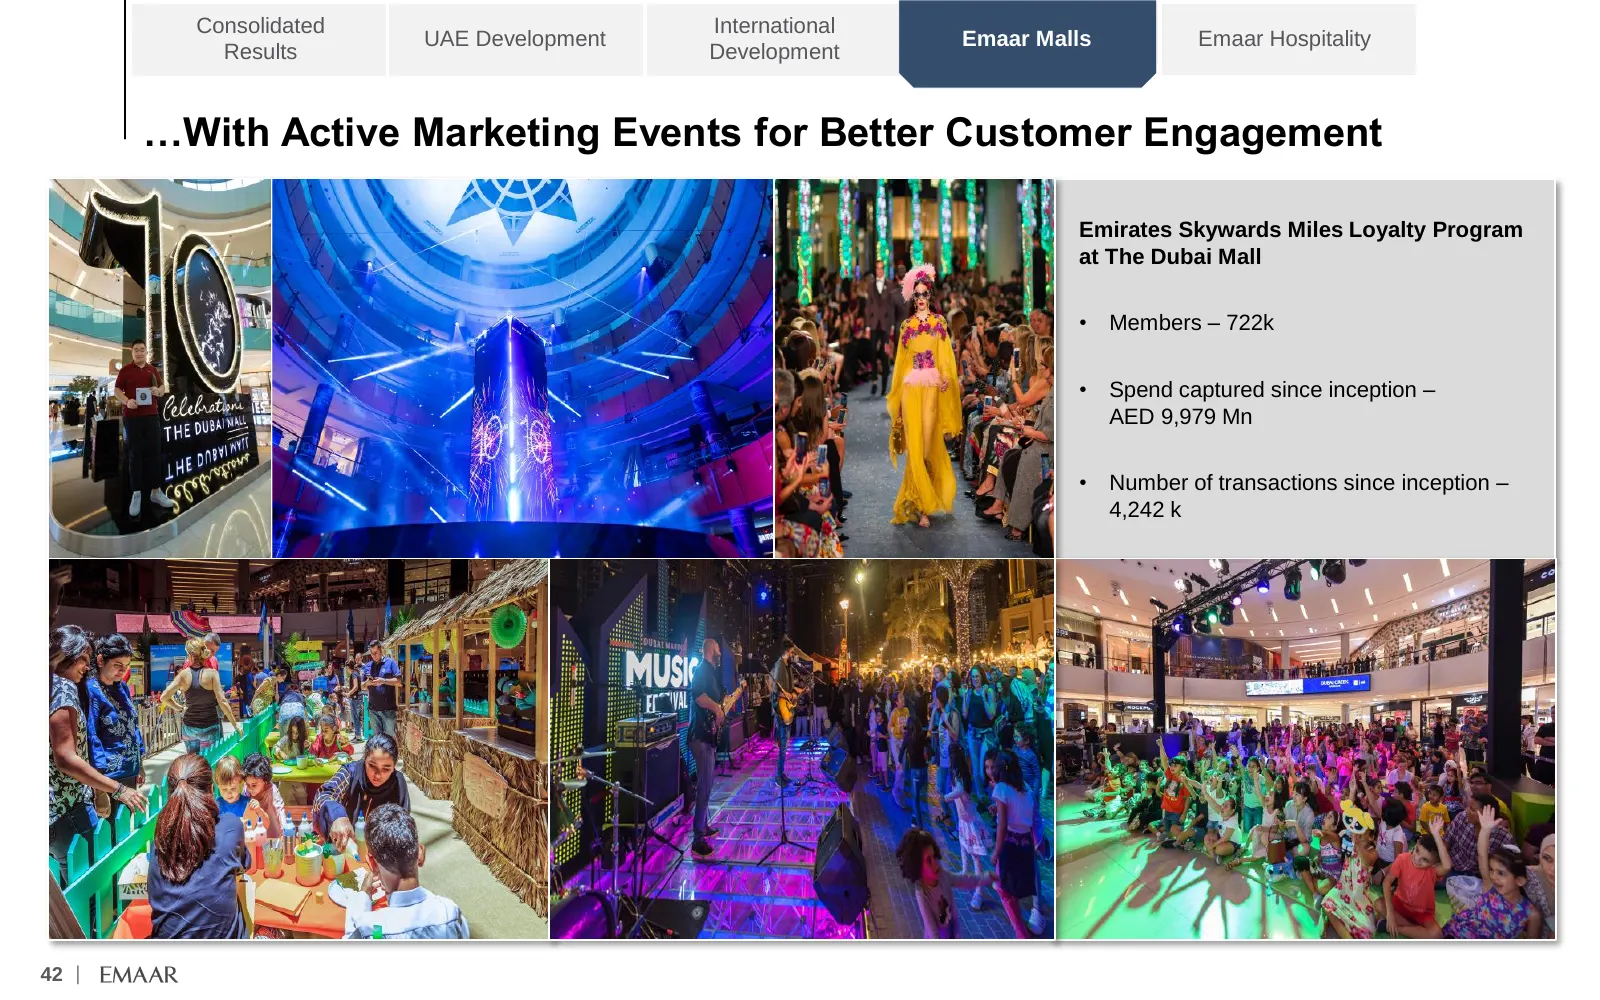
Slide 43: With Active Marketing Events for Better Customer Engagement
Consolidated International UAE Development Emaar Malls Emaar Hospitality Results Development …With Active Marketing Events for Better Customer Engagement Emirates Skywards Miles Loyalty Program at The Dubai Mall • Members – 722k • Spend captured since inception – AED 9,979 Mn • Number of transaction
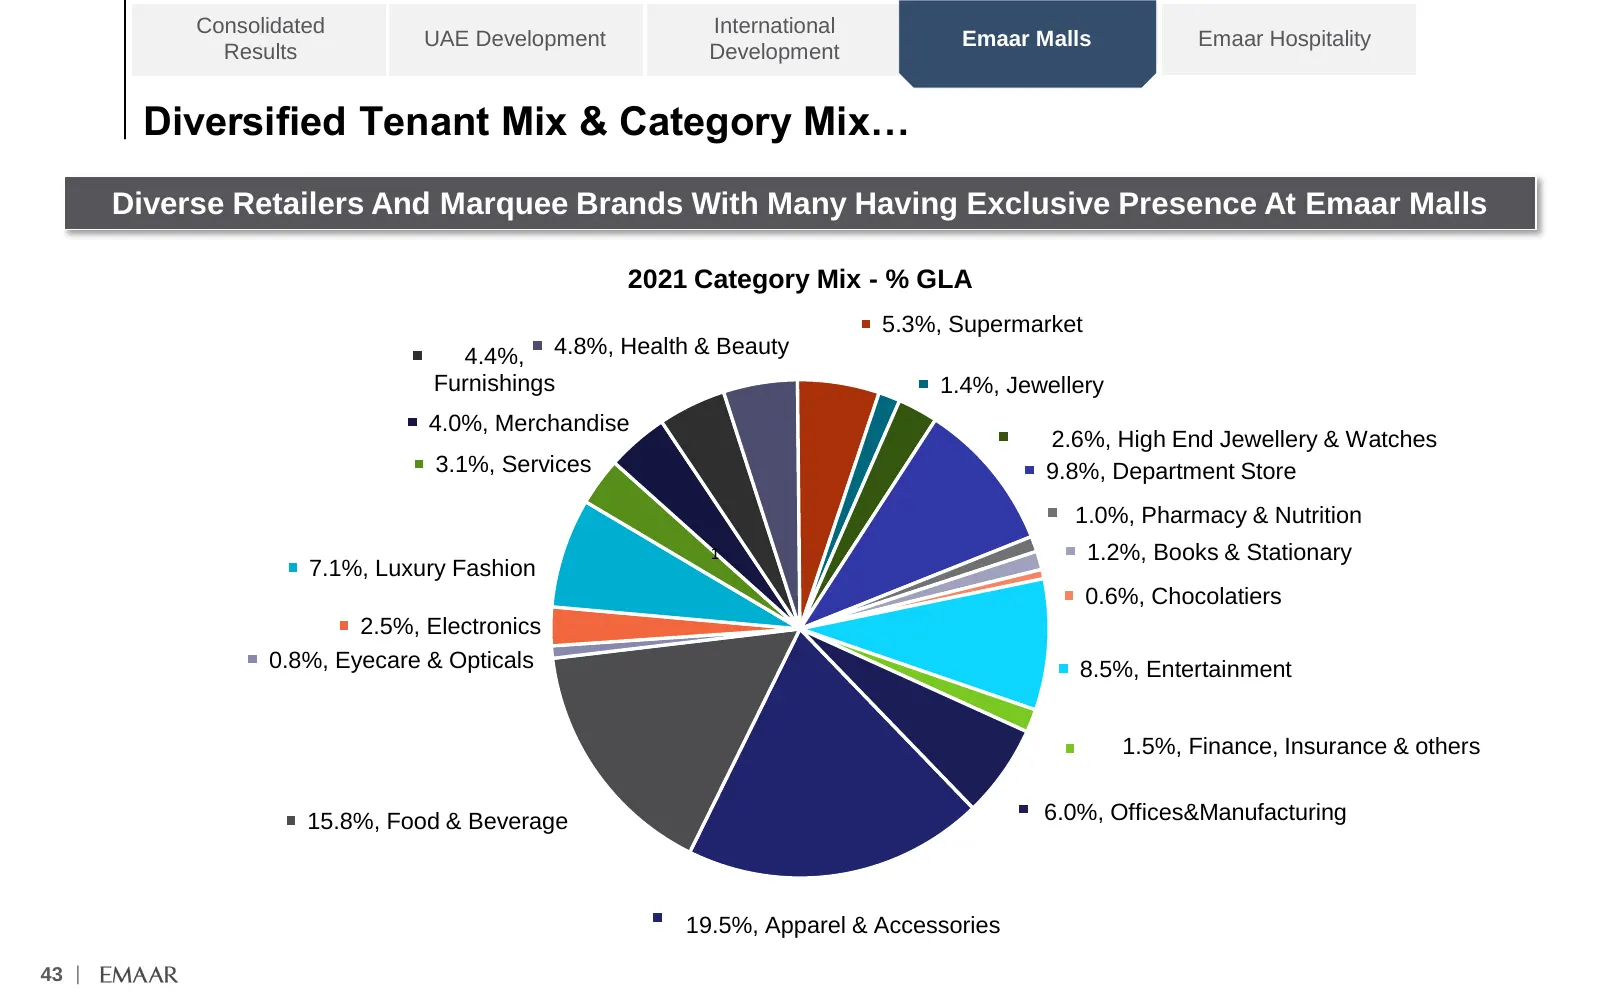
Slide 44: Diversified Tenant Mix & Category Mix
Consolidated International UAE Development Emaar Malls Emaar Hospitality Results Development Diversified Tenant Mix & Category Mix… Diverse Retailers And Marquee Brands With Many Having Exclusive Presence At Emaar Malls 2021 Category Mix - % GLA 5.3%, Supermarket 4.4%, 4.8%, Health & Beauty Furnishi
Slide 45: Active Tenant & Space Management with Healthy Lease Renewals
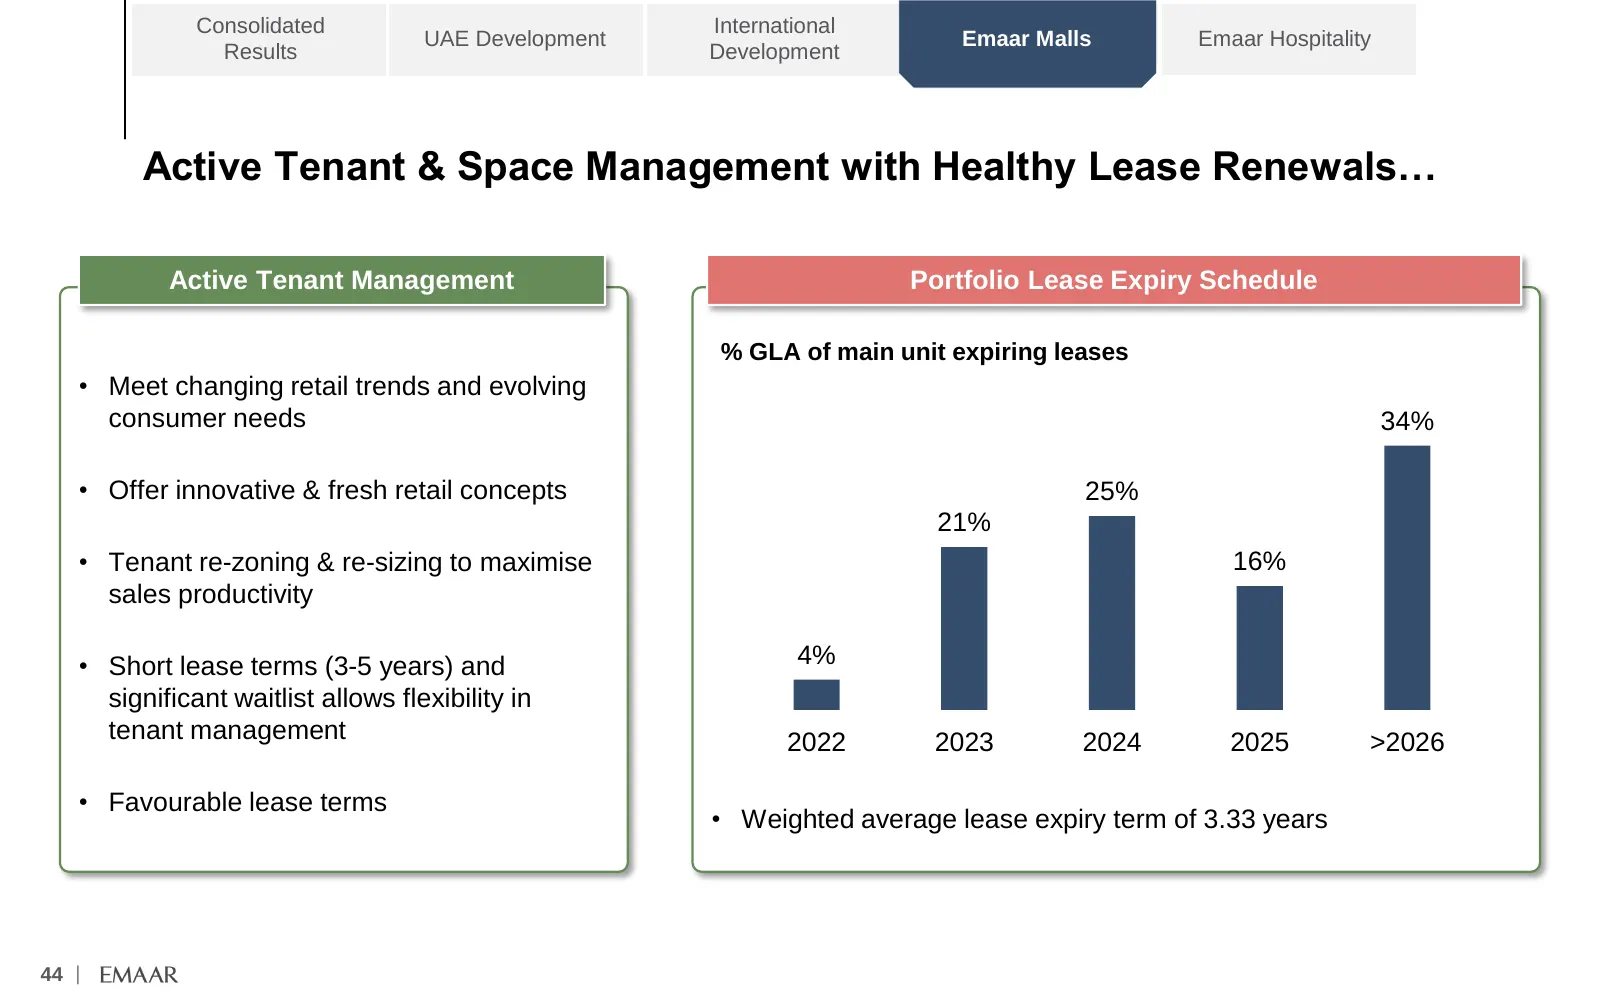
Consolidated International UAE Development Emaar Malls Emaar Hospitality Results Development Active Tenant & Space Management with Healthy Lease Renewals… Active Tenant Management Portfolio Lease Expiry Schedule % GLA of main unit expiring leases • Meet changing retail trends and evolving consumer n
Slide 46: Steady Rental Income Growth, High Operating Profitability
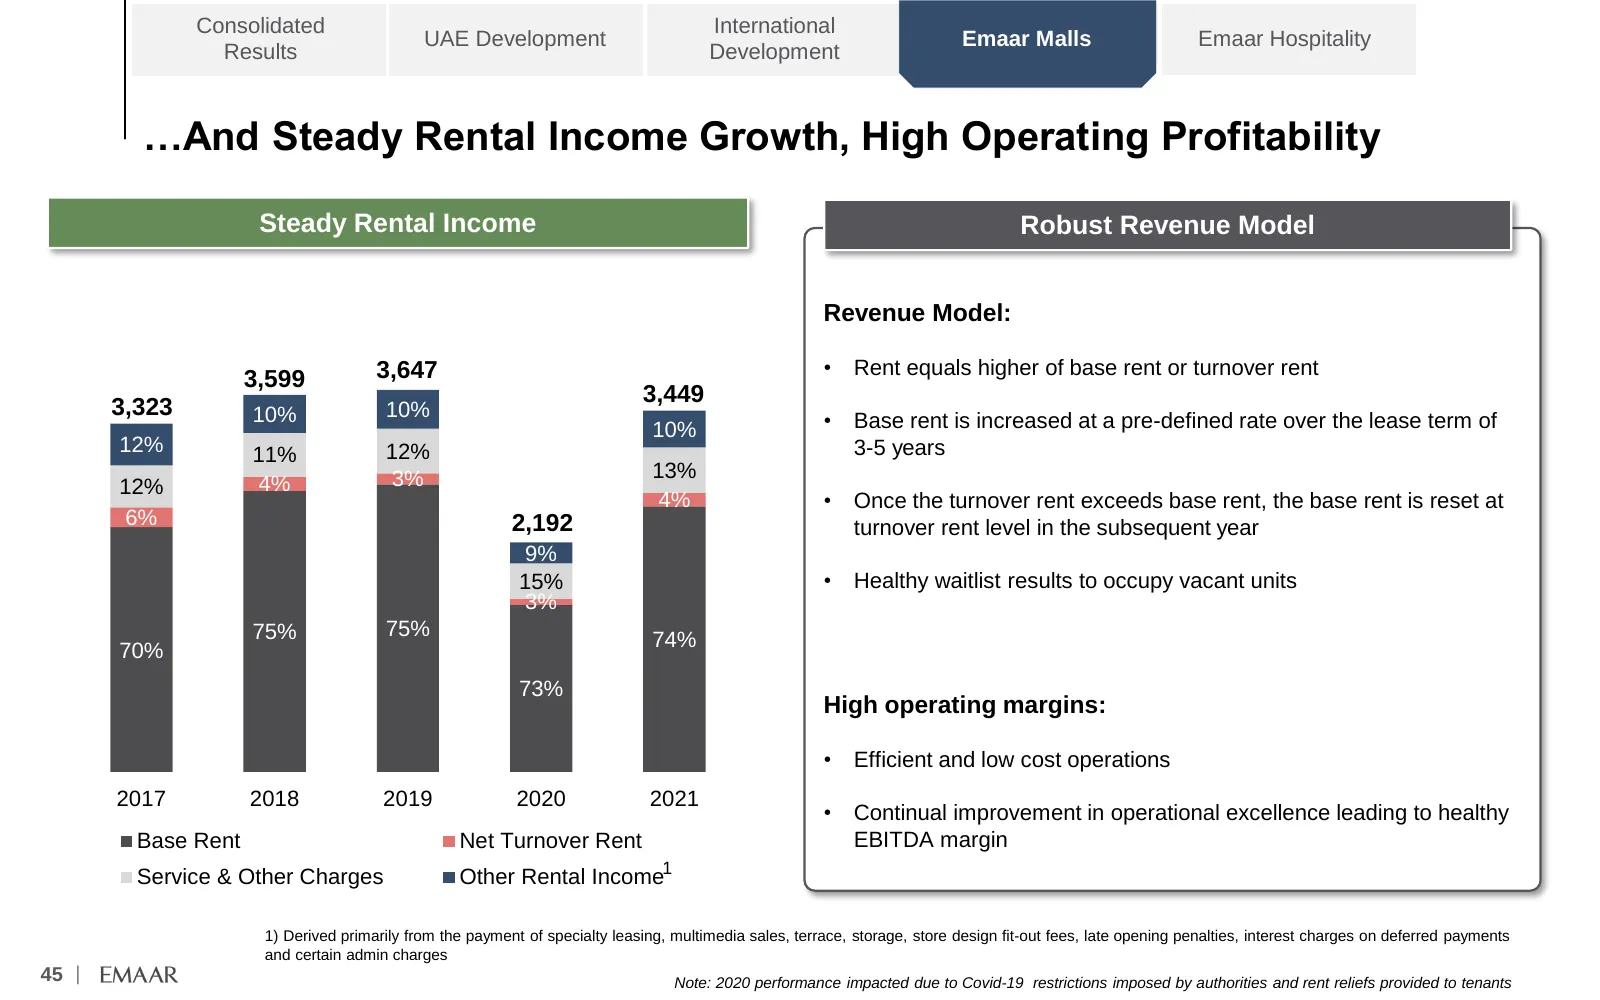
Consolidated International UAE Development Emaar Malls Emaar Hospitality Results Development …And Steady Rental Income Growth, High Operating Profitability Steady Rental Income Robust Revenue Model Chart Title Revenue Model: 3,647 • Rent equals higher of base rent or turnover rent 3,599 3,449 3,323
Slide 47: New Expansions – Dubai Hills Mall
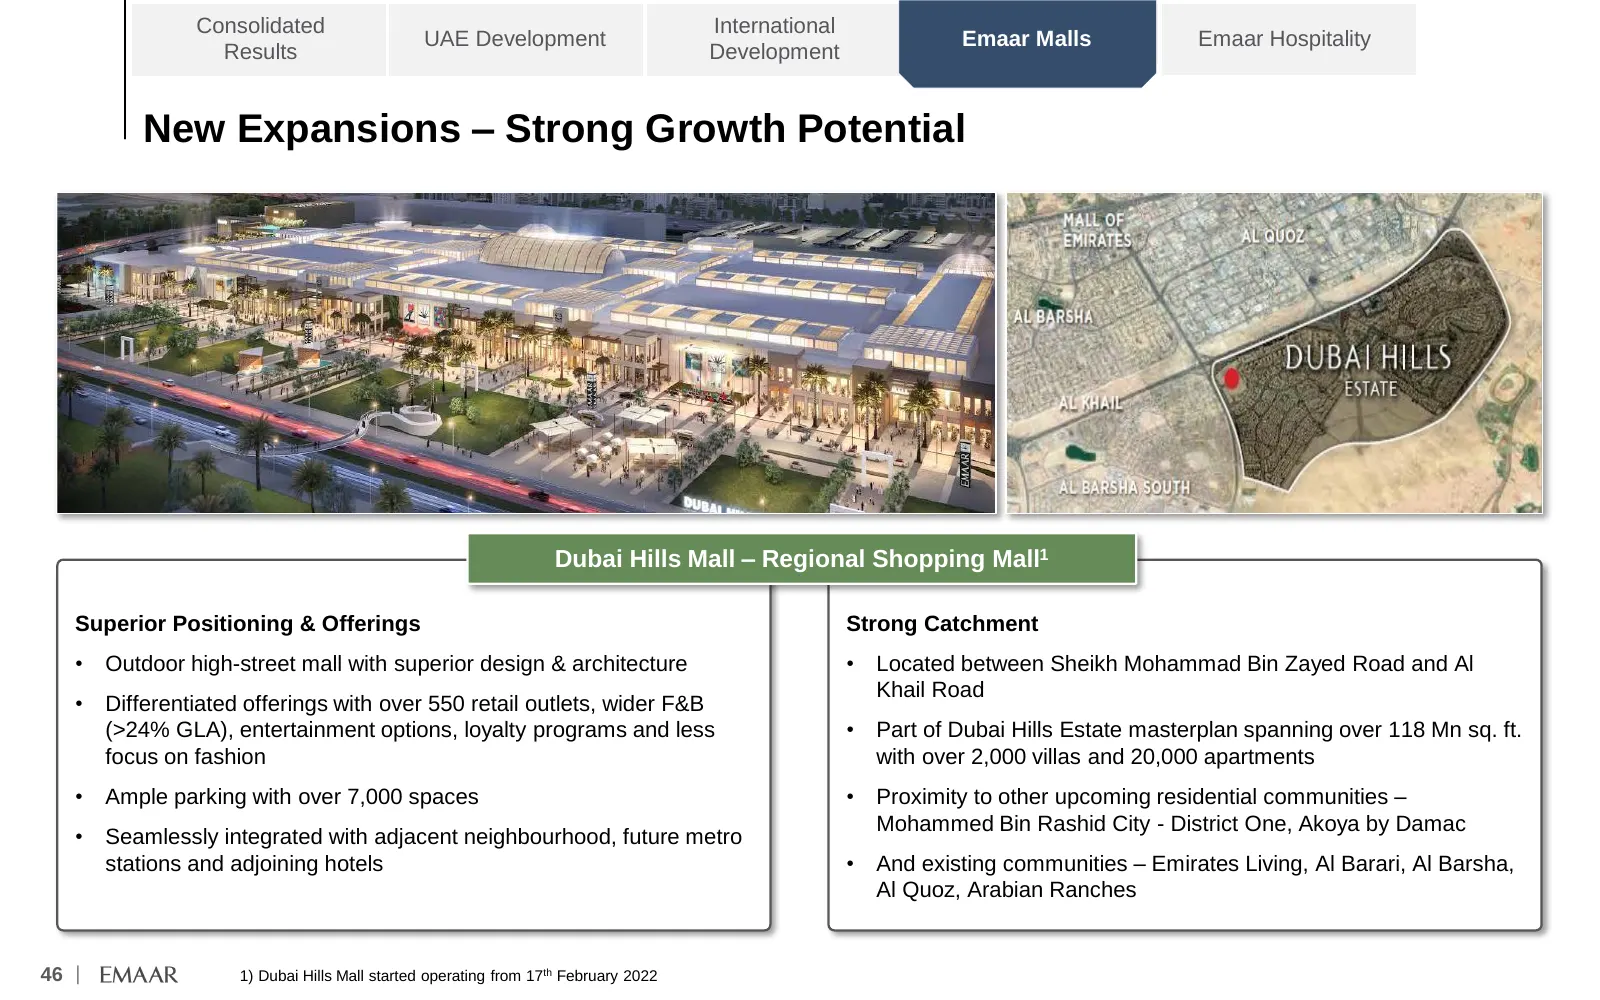
Consolidated International UAE Development Emaar Malls Emaar Hospitality Results Development New Expansions – Strong Growth Potential 1 – Regional Shopping Mall1 Dubai Hills Mall Superior Positioning & Offerings Strong Catchment • Outdoor high-street mall with superior design & architecture • Locate
Slide 48: New Expansions – Dubai Expo Mall
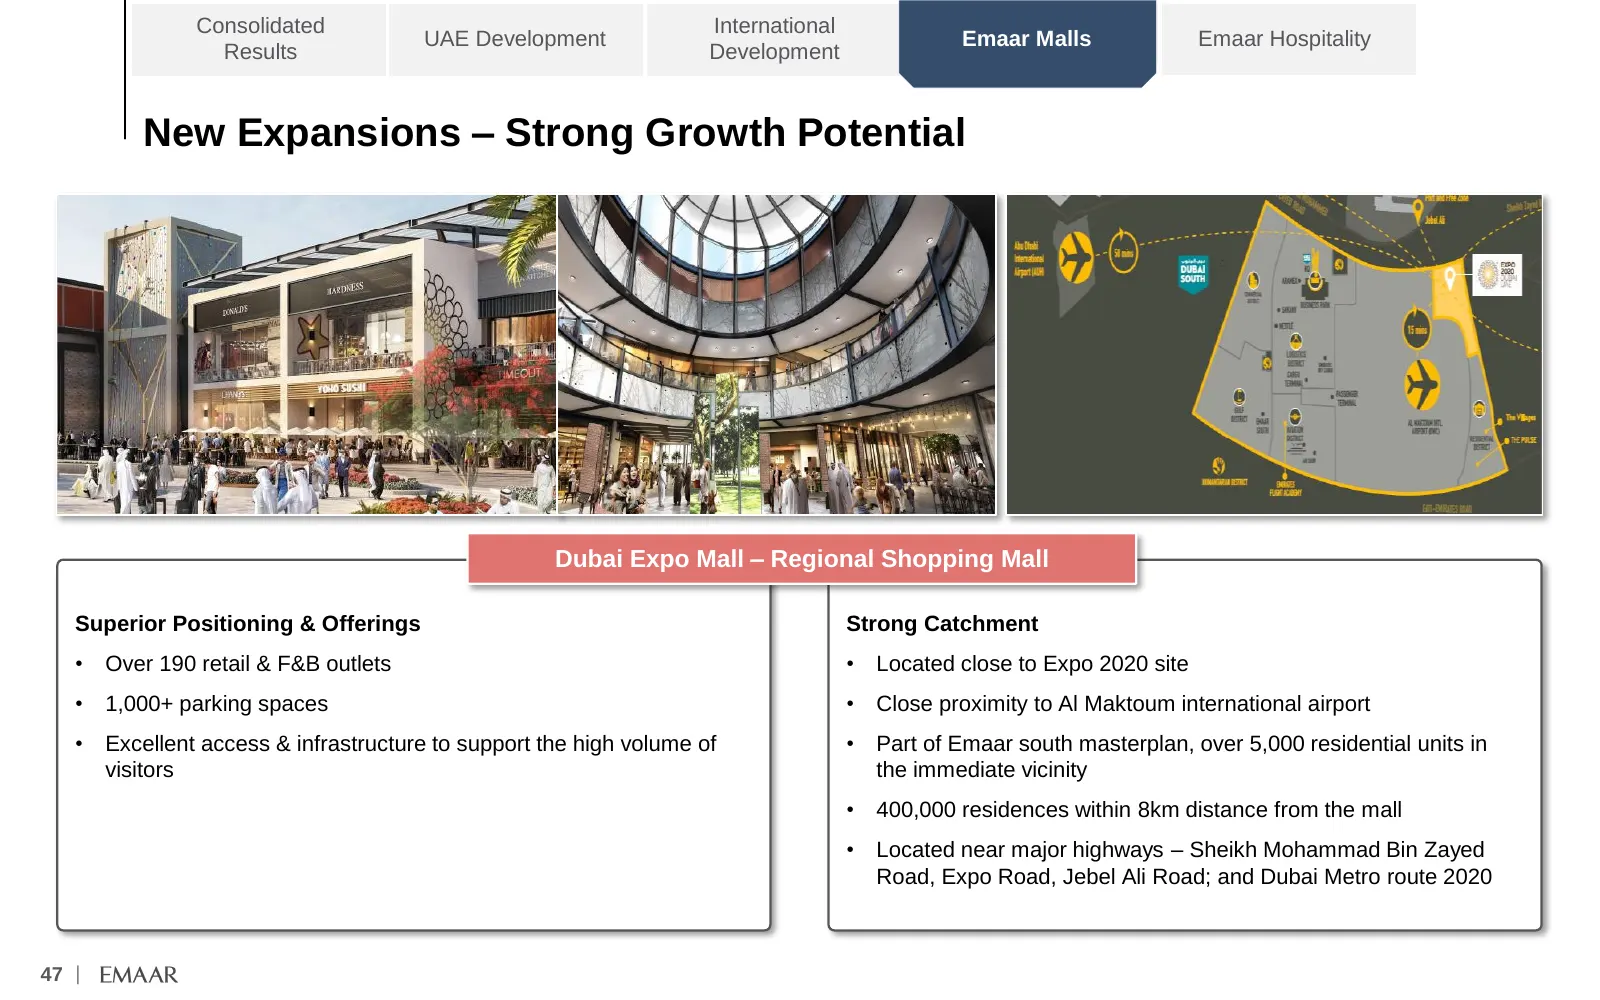
Consolidated International UAE Development Emaar Malls Emaar Hospitality Results Development New Expansions – Strong Growth Potential 1 Dubai Expo Mall – Regional Shopping Mall Superior Positioning & Offerings Strong Catchment • Over 190 retail & F&B outlets • Located close to Expo 2020 site • 1,000
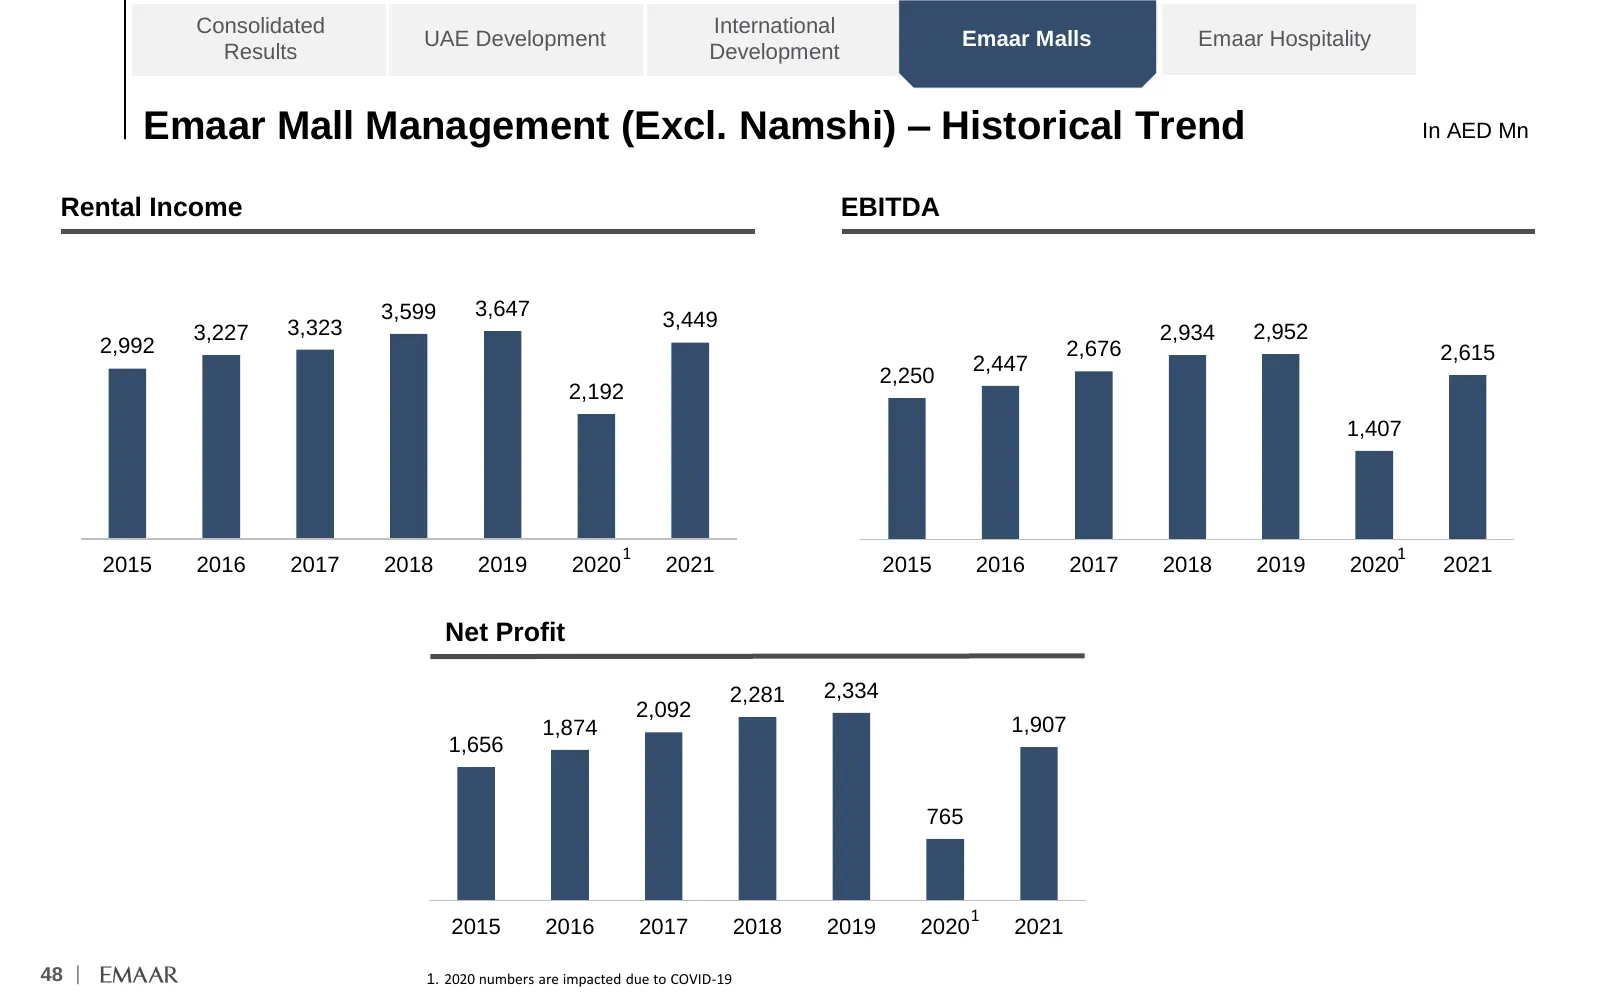
Slide 49: Emaar Mall Management (Excl. Namshi) – Historical Trend
Consolidated International UAE Development Emaar Malls Emaar Hospitality Results Development Emaar Mall Management (Excl. Namshi) – Historical Trend In AED Mn Rental Income EBITDA 3,599 3,647 3,323 3,449 3,227 2,934 2,952 2,992 2,676 2,615 2,447 2,250 2,192 1,407 1 1 2015 2016 2017 2018 2019 2020 20
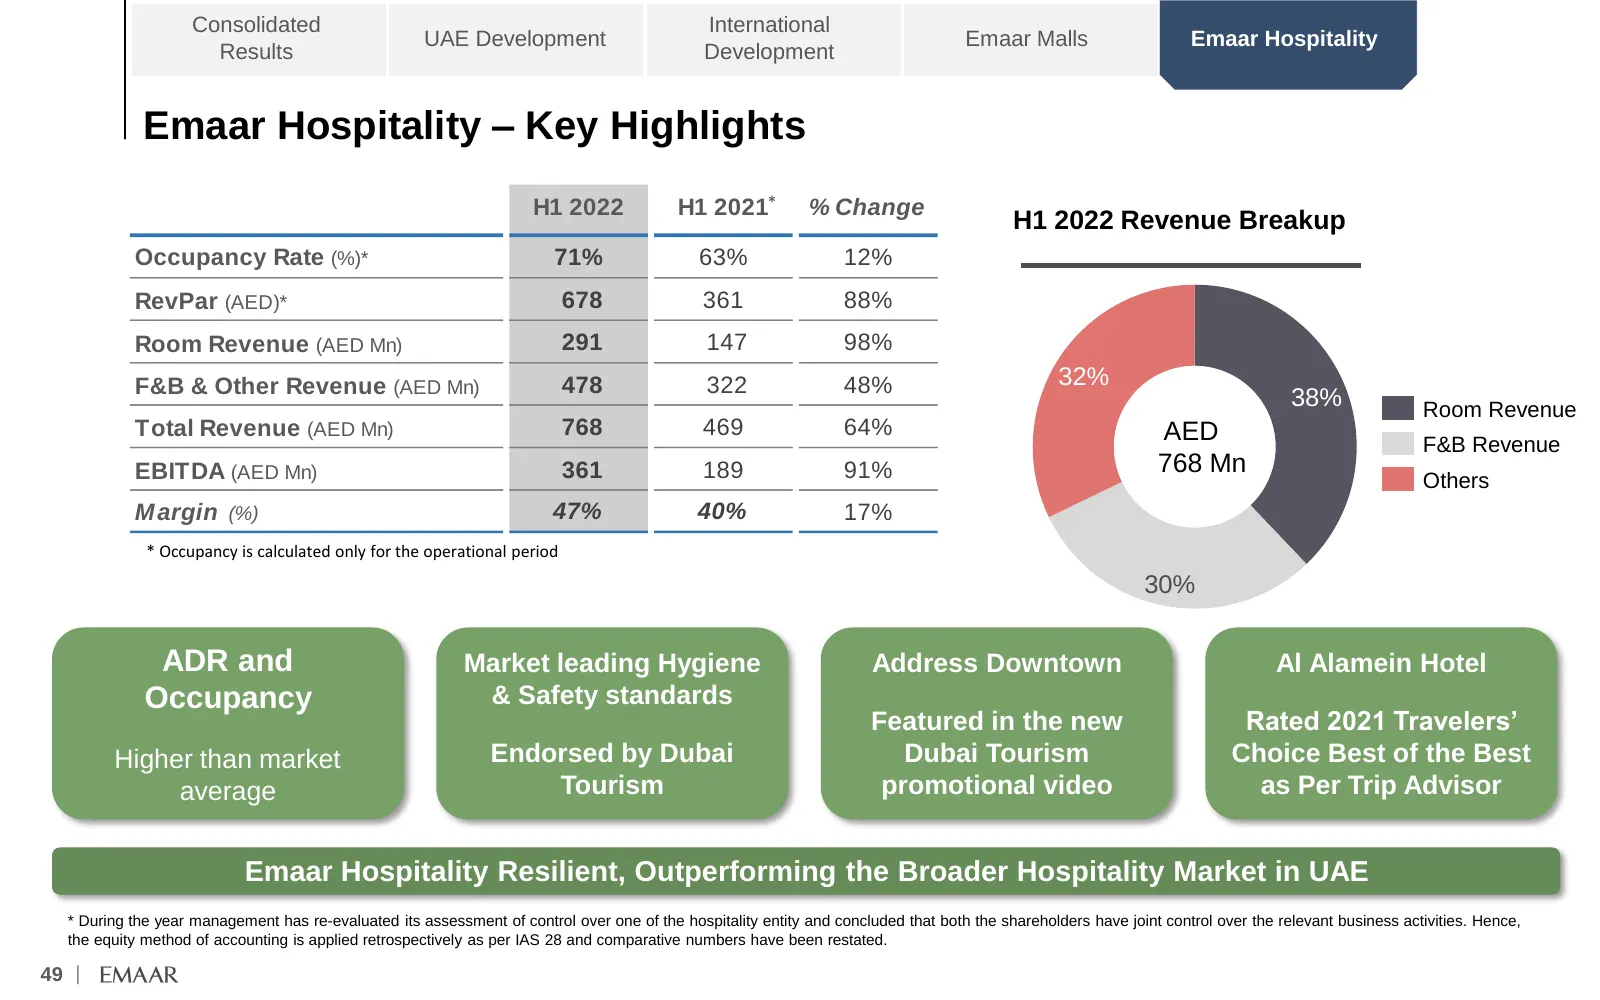
Slide 50: Emaar Hospitality – Key Highlights
Consolidated International UAE Development Emaar Malls Emaar Hospitality Results Development Emaar Hospitality – Key Highlights H1 2022 H1 2021* % Change H1 2022 Revenue Breakup Occupancy Rate (%)* 71% 63% 12% RevPar (AED)* 678 361 88% Room Revenue (AED Mn) 291 147 98% F&B & Other Revenue (AED Mn) 4
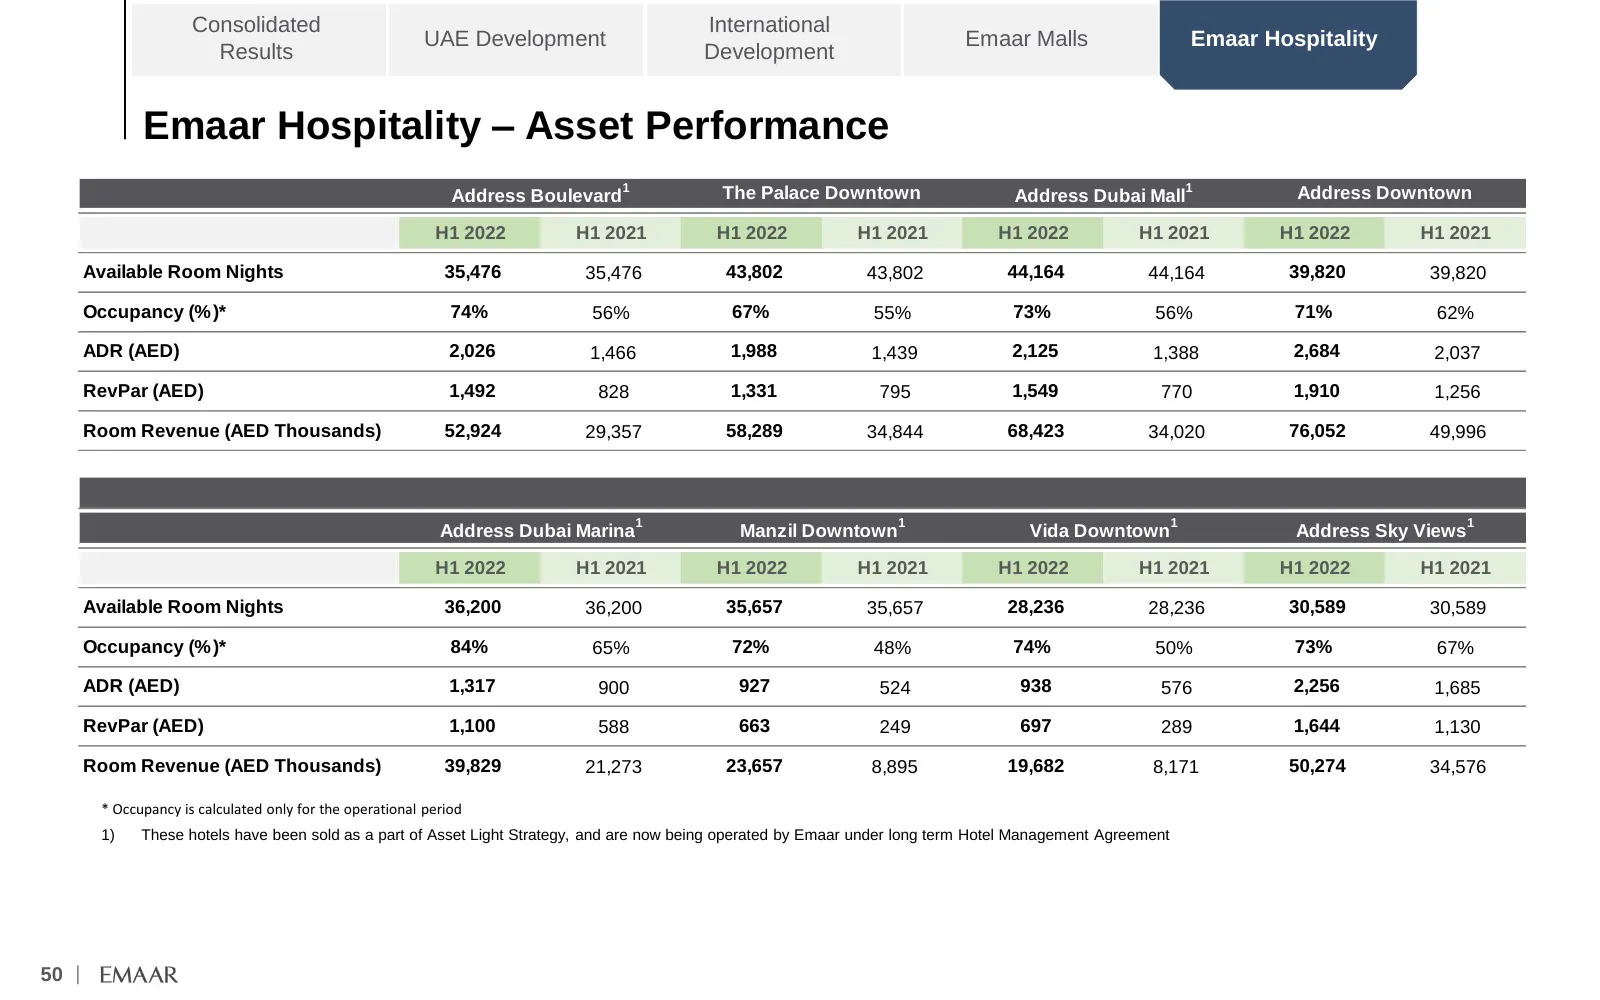
Slide 51: Emaar Hospitality – Asset Performance
Consolidated International UAE Development Emaar Malls Emaar Hospitality Results Development Emaar Hospitality – Asset Performance Address Boulevard 1 The Palace Downtown Address Dubai Mall1 Address Downtown H1 2022 H1 2021 H1 2022 H1 2021 H1 2022 H1 2021 H1 2022 H1 2021 Available Room Nights 35,476
Slide 52: Annexure
= AVY 7 SE he he del wT) = ana HTT Te wir [TIRE Annexure
Slide 53: Divisions Overview
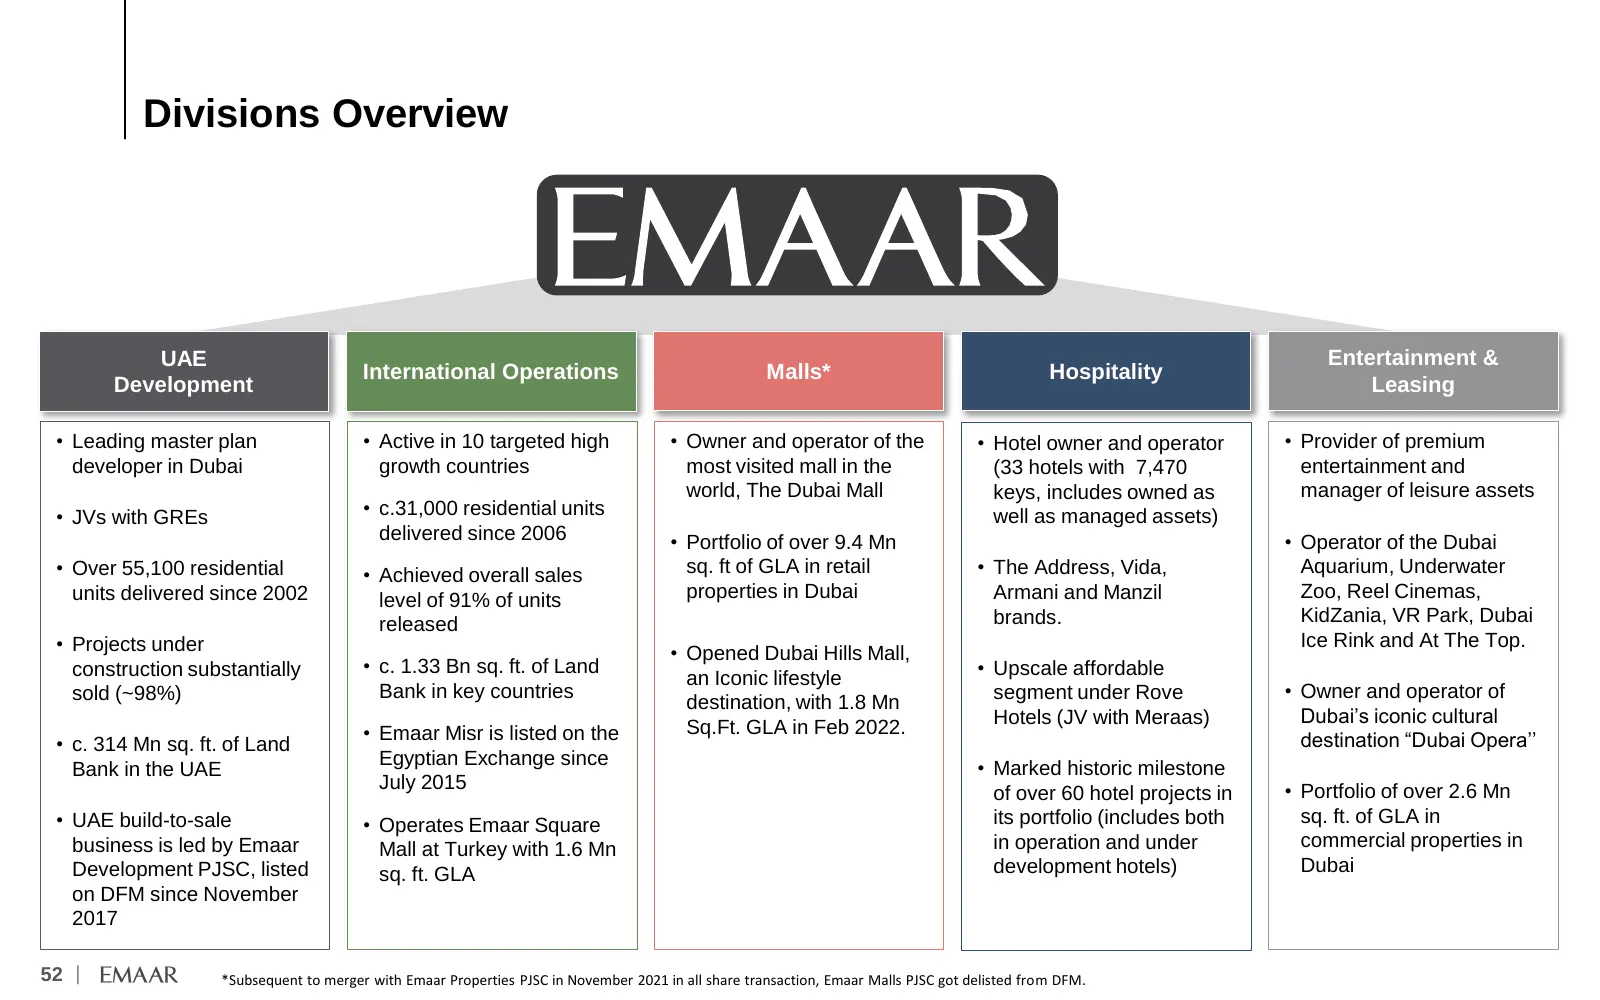
Divisions Overview UAE Entertainment & International Operations Malls* Hospitality Development Leasing • Leading master plan • Active in 10 targeted high • Owner and operator of the • Hotel owner and operator • Provider of premium developer in Dubai growth countries most visited mall in the (33 hote
Slide 54: UAE Development – Projects Overview
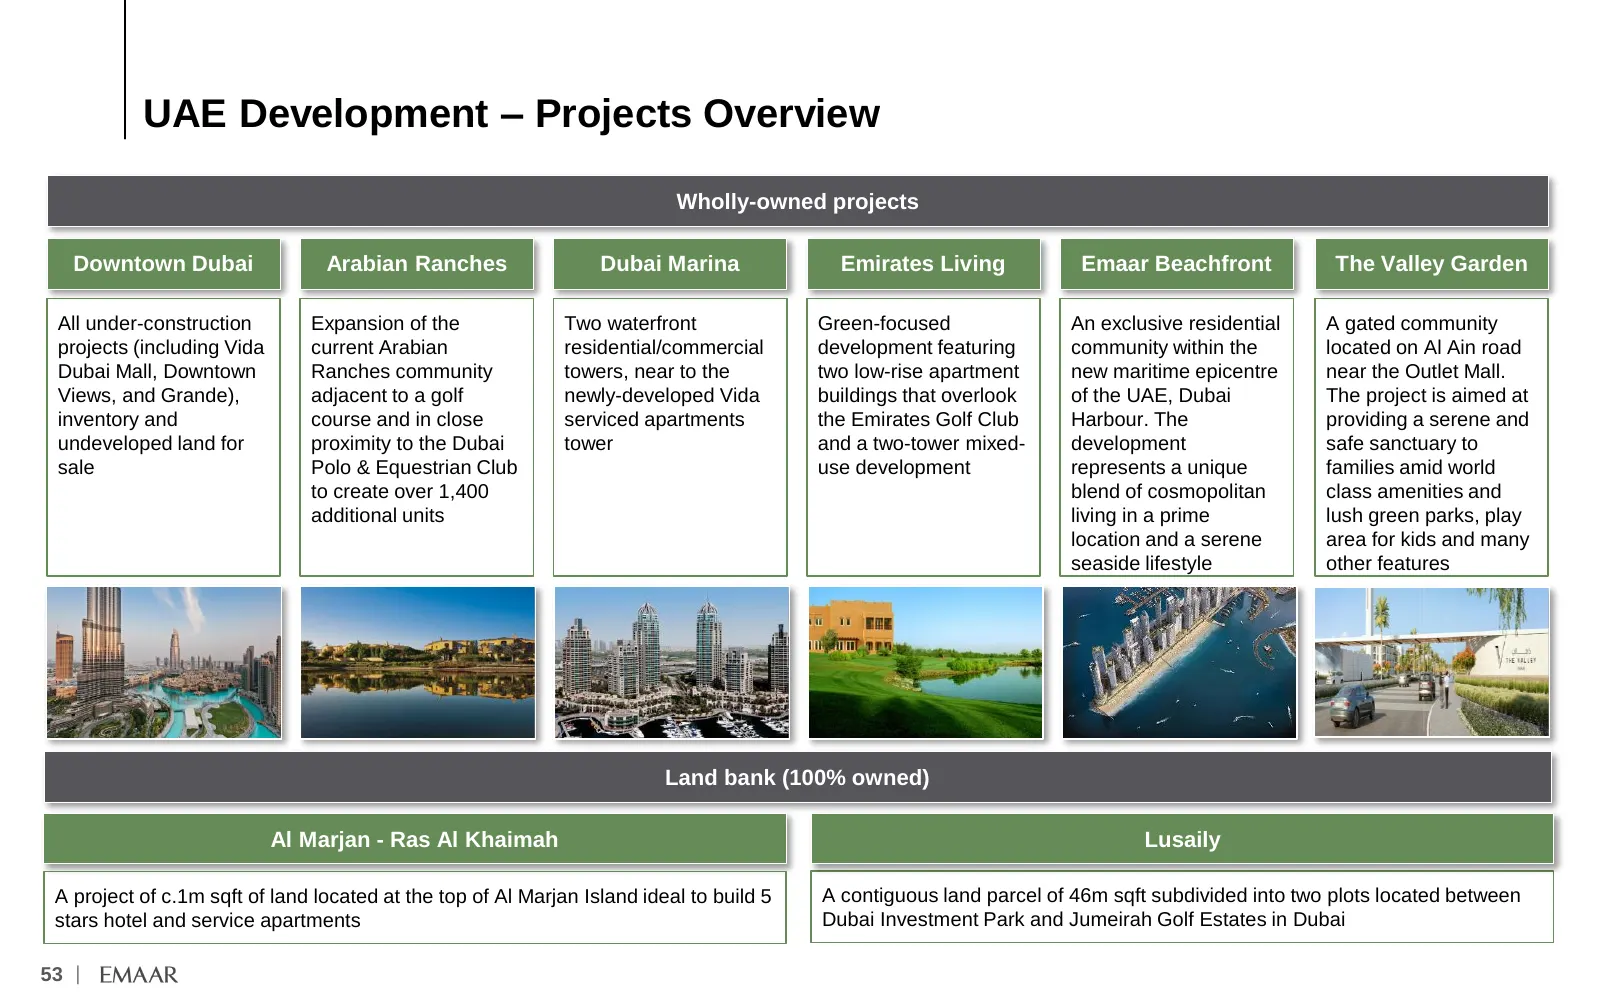
UAE Development – Projects Overview Wholly-owned projects Downtown Dubai Arabian Ranches Dubai Marina Emirates Living Emaar Beachfront The Valley Garden All under-construction Expansion of the Two waterfront Green-focused An exclusive residential A gated community projects (including Vida current Ar
Slide 55: UAE Development – Projects Overview (JVs)
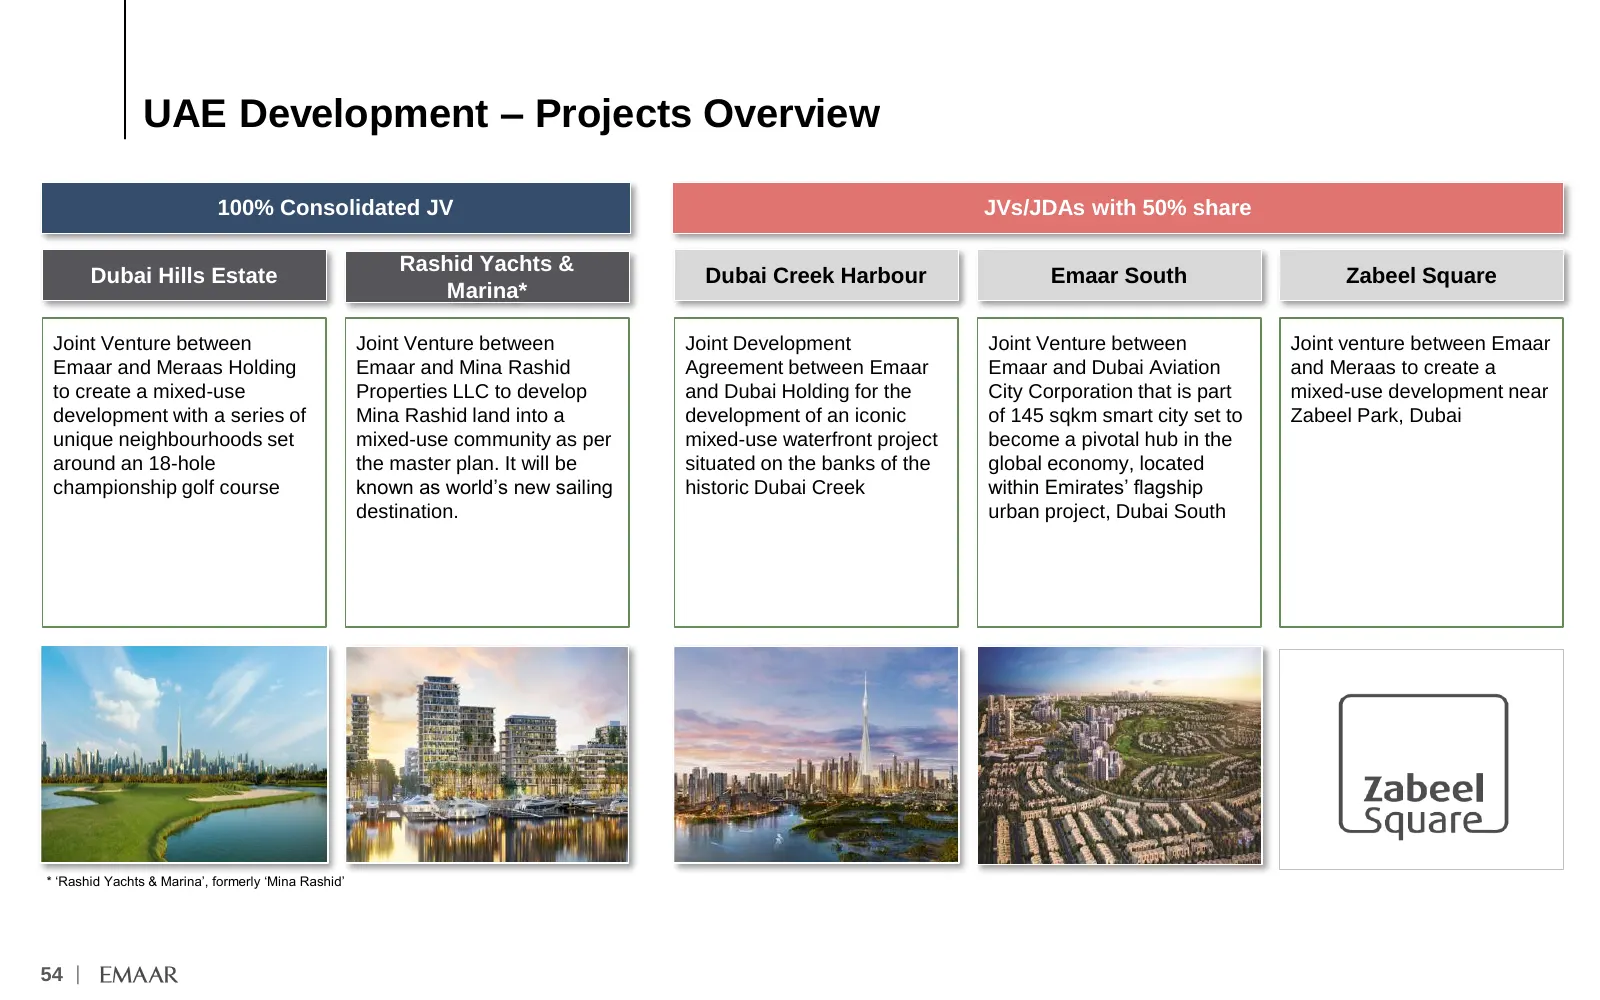
UAE Development – Projects Overview 100% Consolidated JV JVs/JDAs with 50% share Rashid Yachts & Dubai Hills Estate Dubai Creek Harbour Emaar South Zabeel Square Marina* Joint Venture between Joint Venture between Joint Development Joint Venture between Joint venture between Emaar Emaar and Meraas H
Slide 56: UAE Development – Projects Under Development (100% Owned)
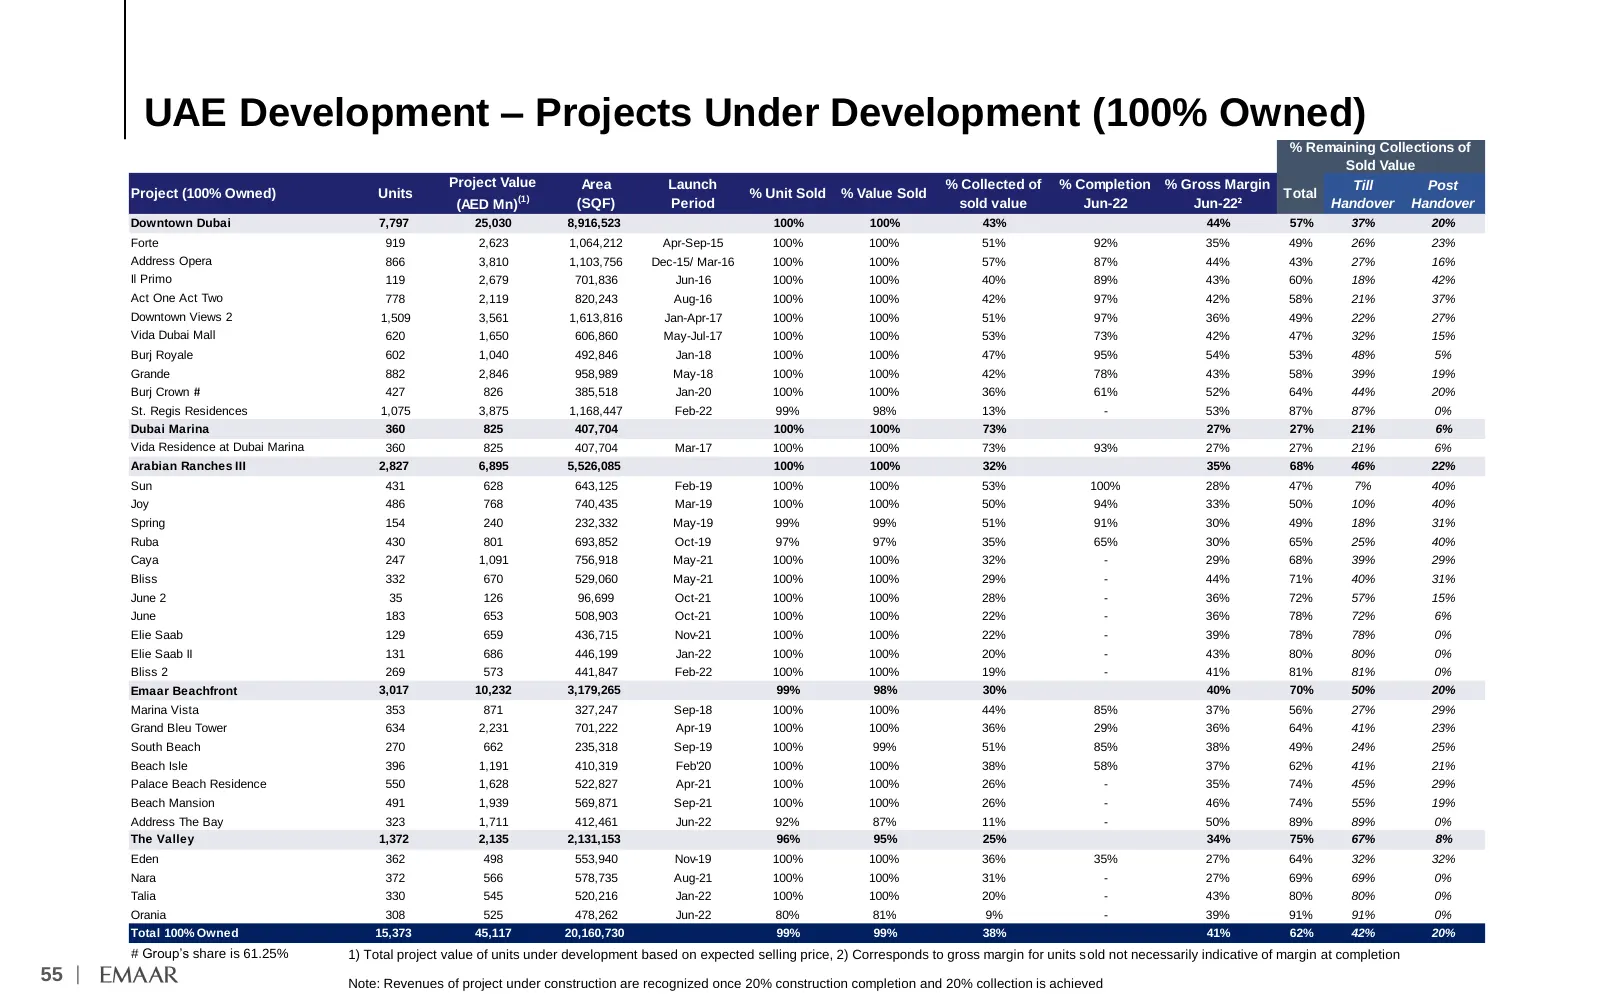
UAE Development – Projects Under Development (100% Owned) % Remaining Collections of Sold Value Project Value Area Launch % Collected of % Completion % Gross Margin Till Post Project (100% Owned) Units % Unit Sold % Value Sold Total (AED Mn)(1) (SQF) Period sold value Jun-22 Jun-22² Handover Handove
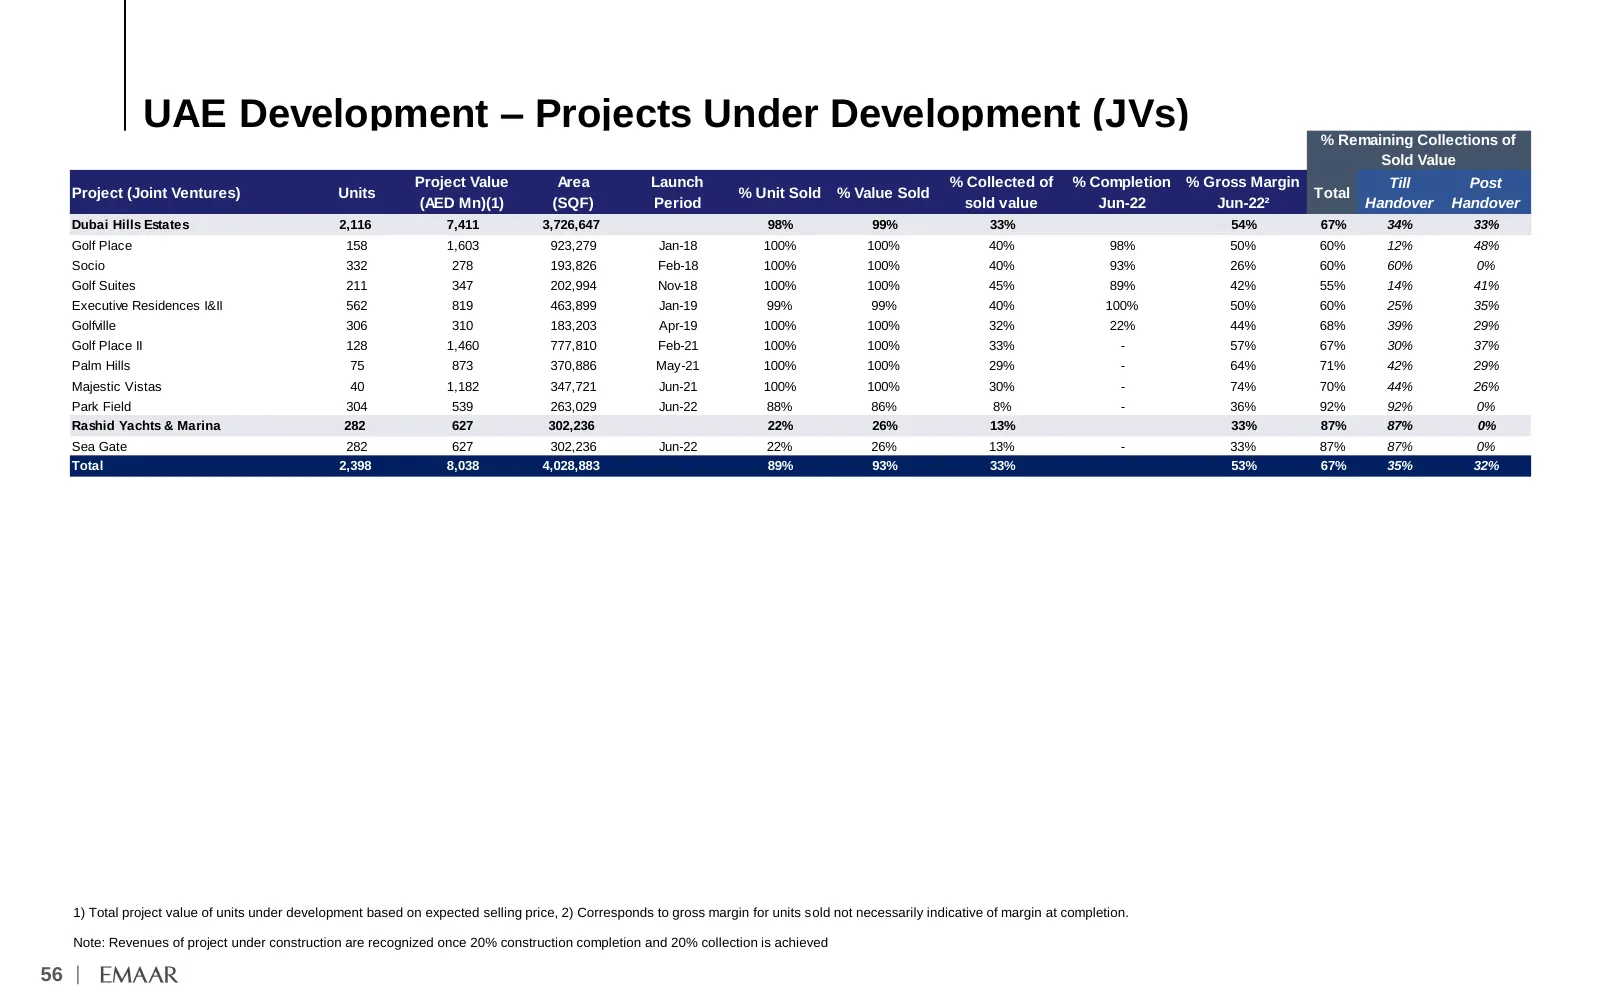
Slide 57: UAE Development – Projects Under Development (JVs)
UAE Development – Projects Under Development (JVs) % Remaining Collections of Sold Value Project Value Area Launch % Collected of % Completion % Gross Margin Till Post Project (Joint Ventures) Units % Unit Sold % Value Sold Total (AED Mn)(1) (SQF) Period sold value Jun-22 Jun-22² Handover Handover D
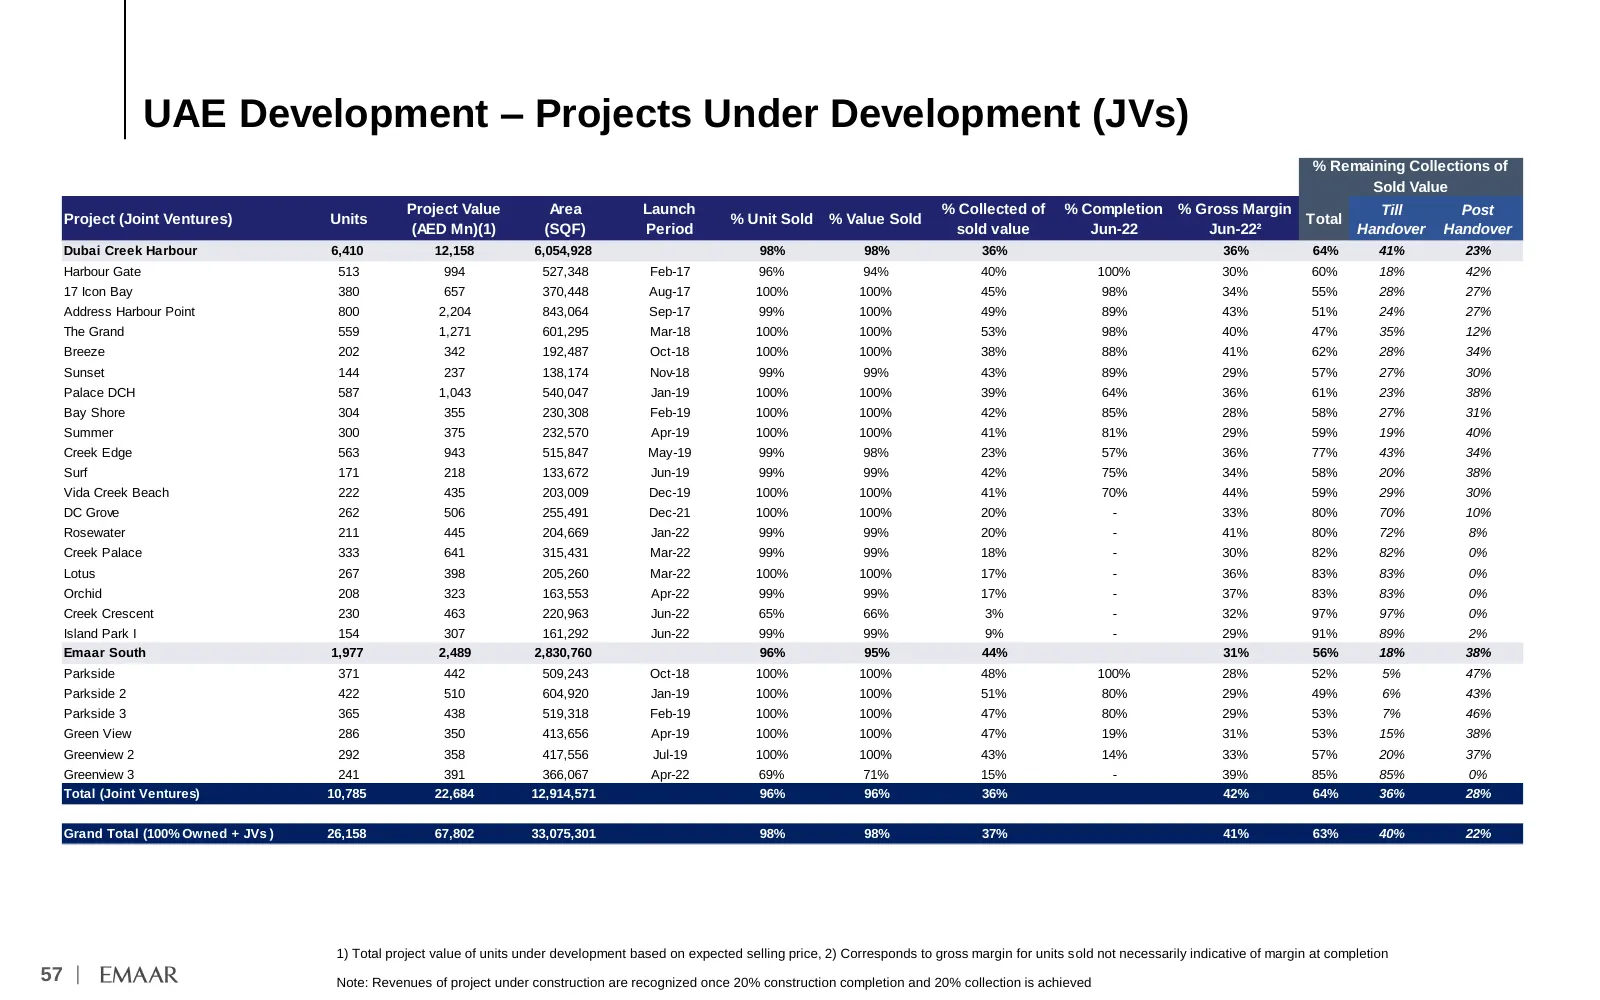
Slide 58: UAE Development – Projects Under Development (JVs)
UAE Development – Projects Under Development (JVs) % Remaining Collections of Sold Value Project Value Area Launch % Collected of % Completion % Gross Margin Till Post Project (Joint Ventures) Units % Unit Sold % Value Sold Total (AED Mn)(1) (SQF) Period sold value Jun-22 Jun-22² Handover Handover D
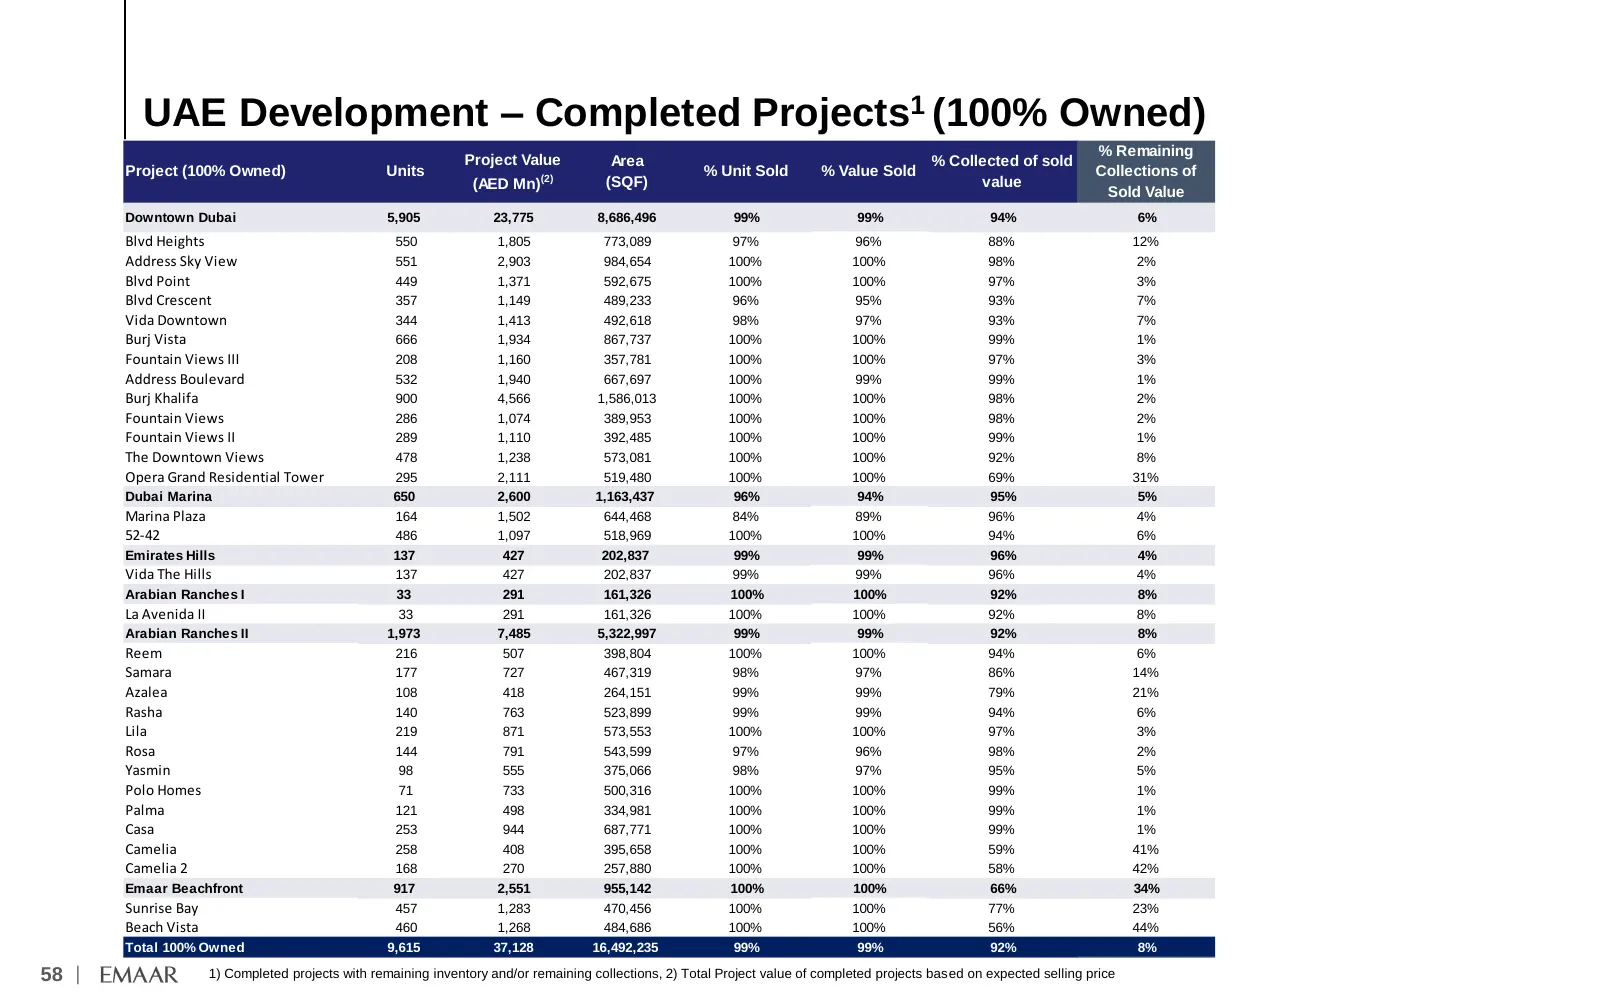
Slide 59: UAE Development – Completed Projects (100% Owned)
UAE Development – Completed Projects1 (100% Owned) % Remaining Project Value Area % Collected of sold Project (100% Owned) Units (2) % Unit Sold % Value Sold Collections of (AED Mn) (SQF) value Sold Value Downtown Dubai 5,905 23,775 8,686,496 99% 99% 94% 6% Blvd Heights 550 1,805 773,089 97% 96% 88%
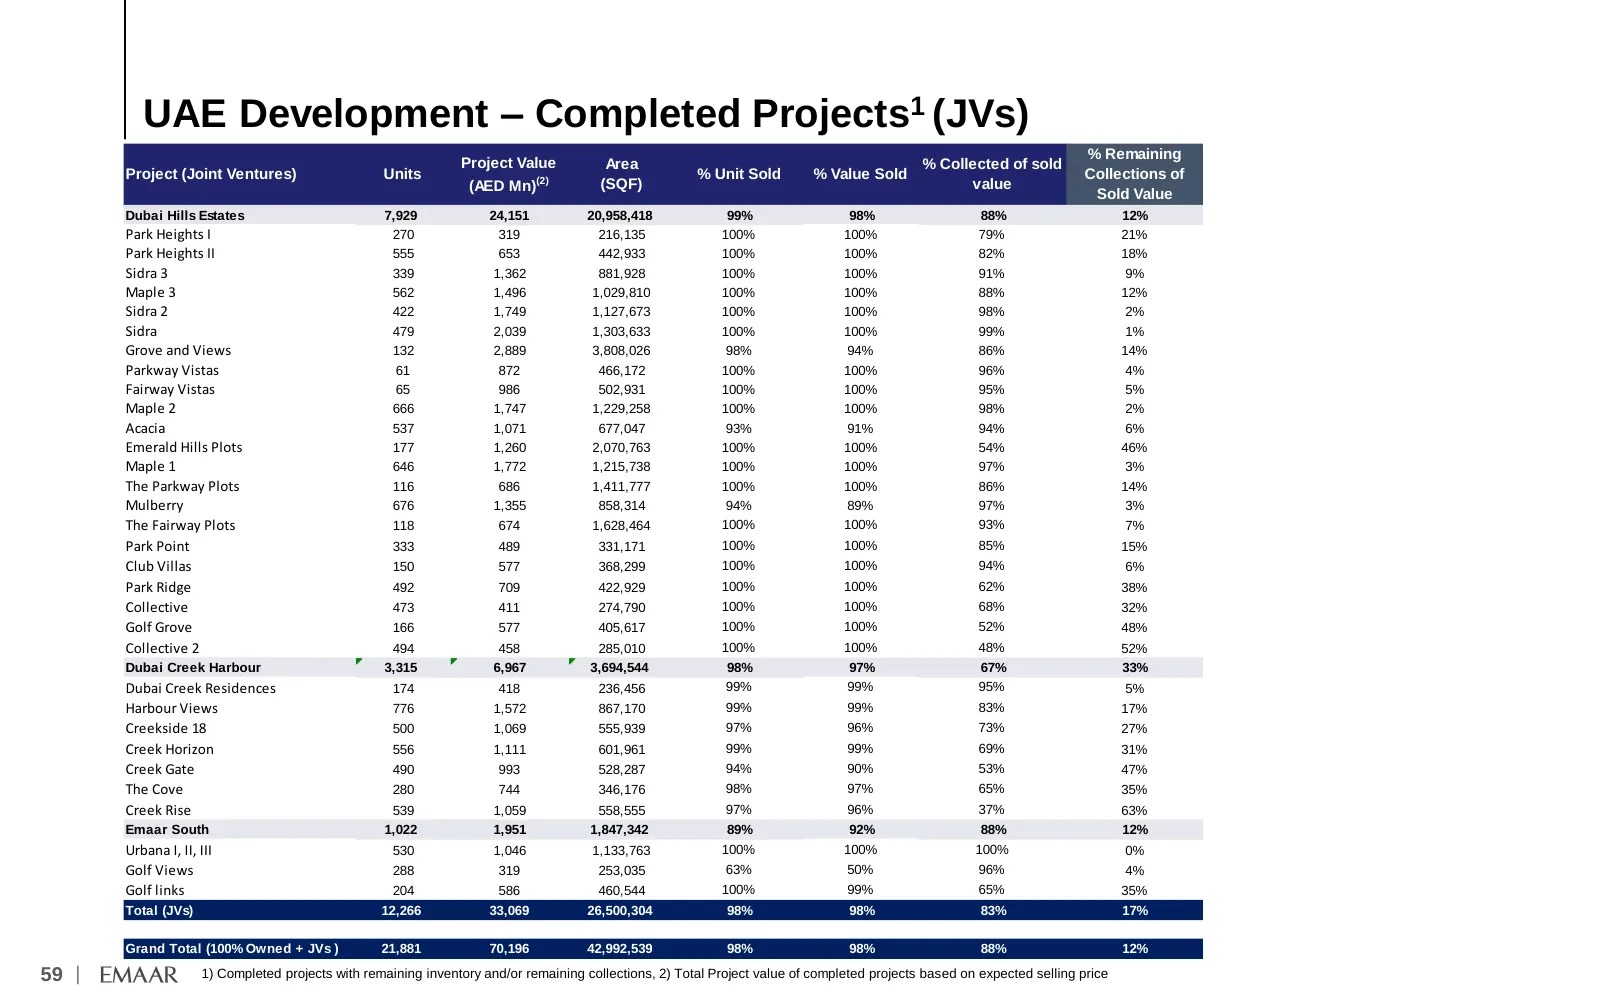
Slide 60: UAE Development – Completed Projects (JVs)
UAE Development – Completed Projects1 (JVs) % Remaining Project Value Area % Collected of sold Project (Joint Ventures) Units (2) % Unit Sold % Value Sold Collections of (AED Mn) (SQF) value Sold Value Dubai Hills Estates 7,929 24,151 20,958,418 99% 98% 88% 12% Park Heights I 270 319 216,135 100% 10
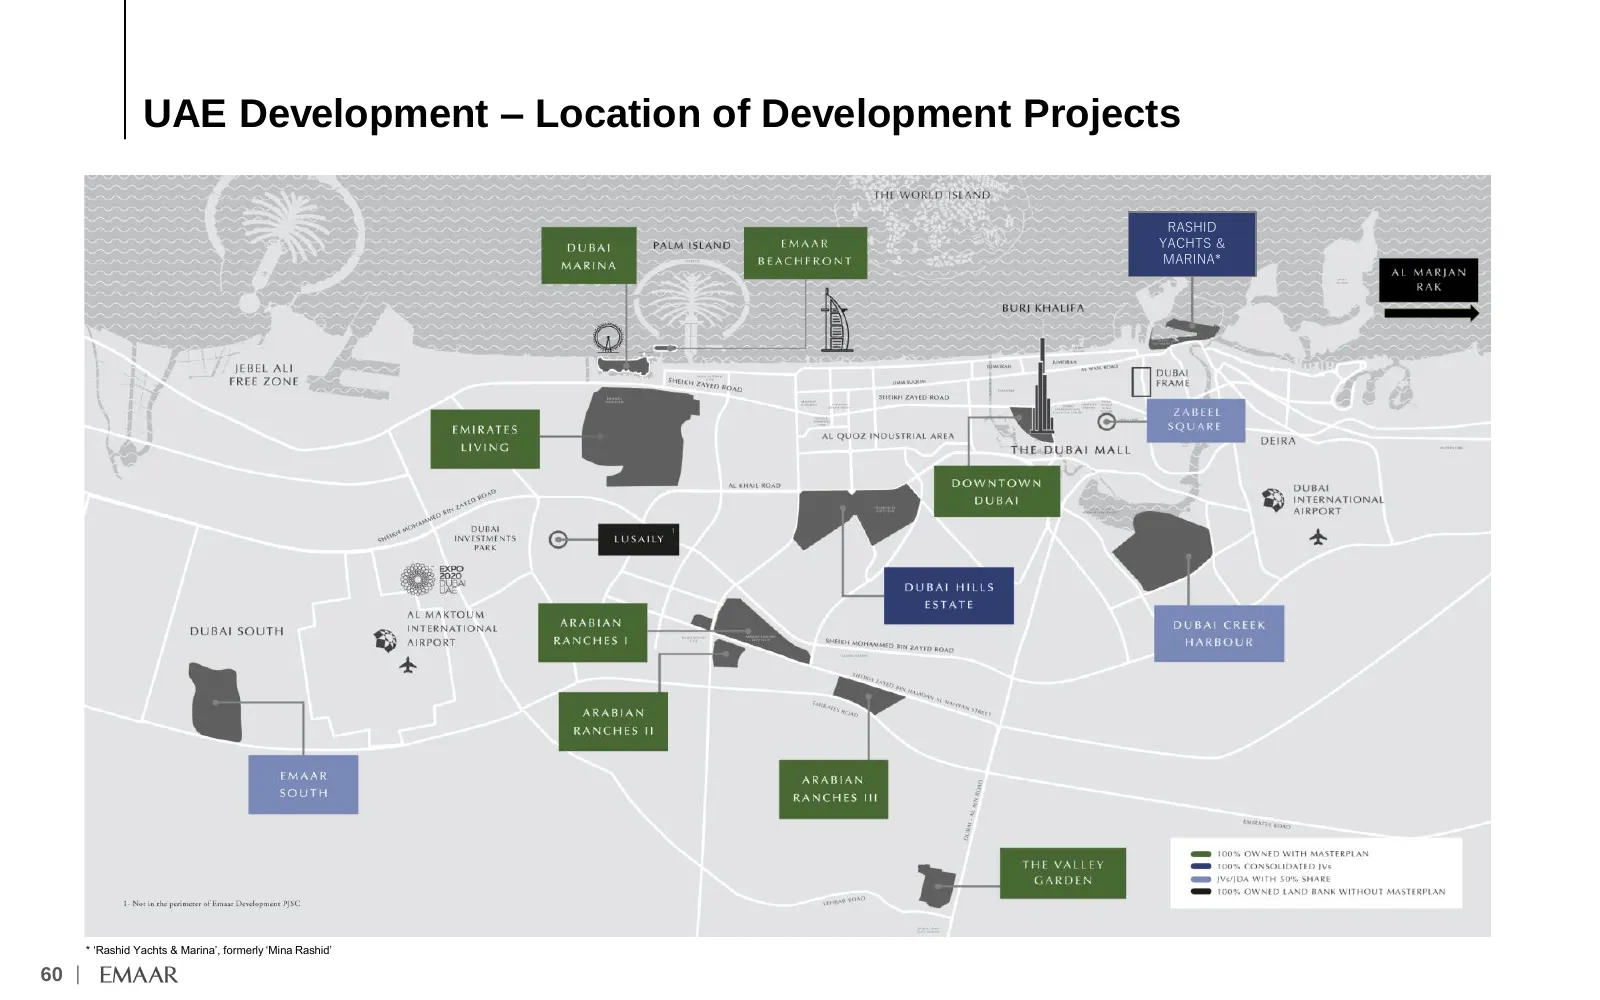
Slide 61: UAE Development – Location of Development Projects
UAE Development – Location of Development Projects RASHID YACHTS & MARINA* * ‘Rashid Yachts & Marina’, formerly ‘Mina Rashid’ 60 |
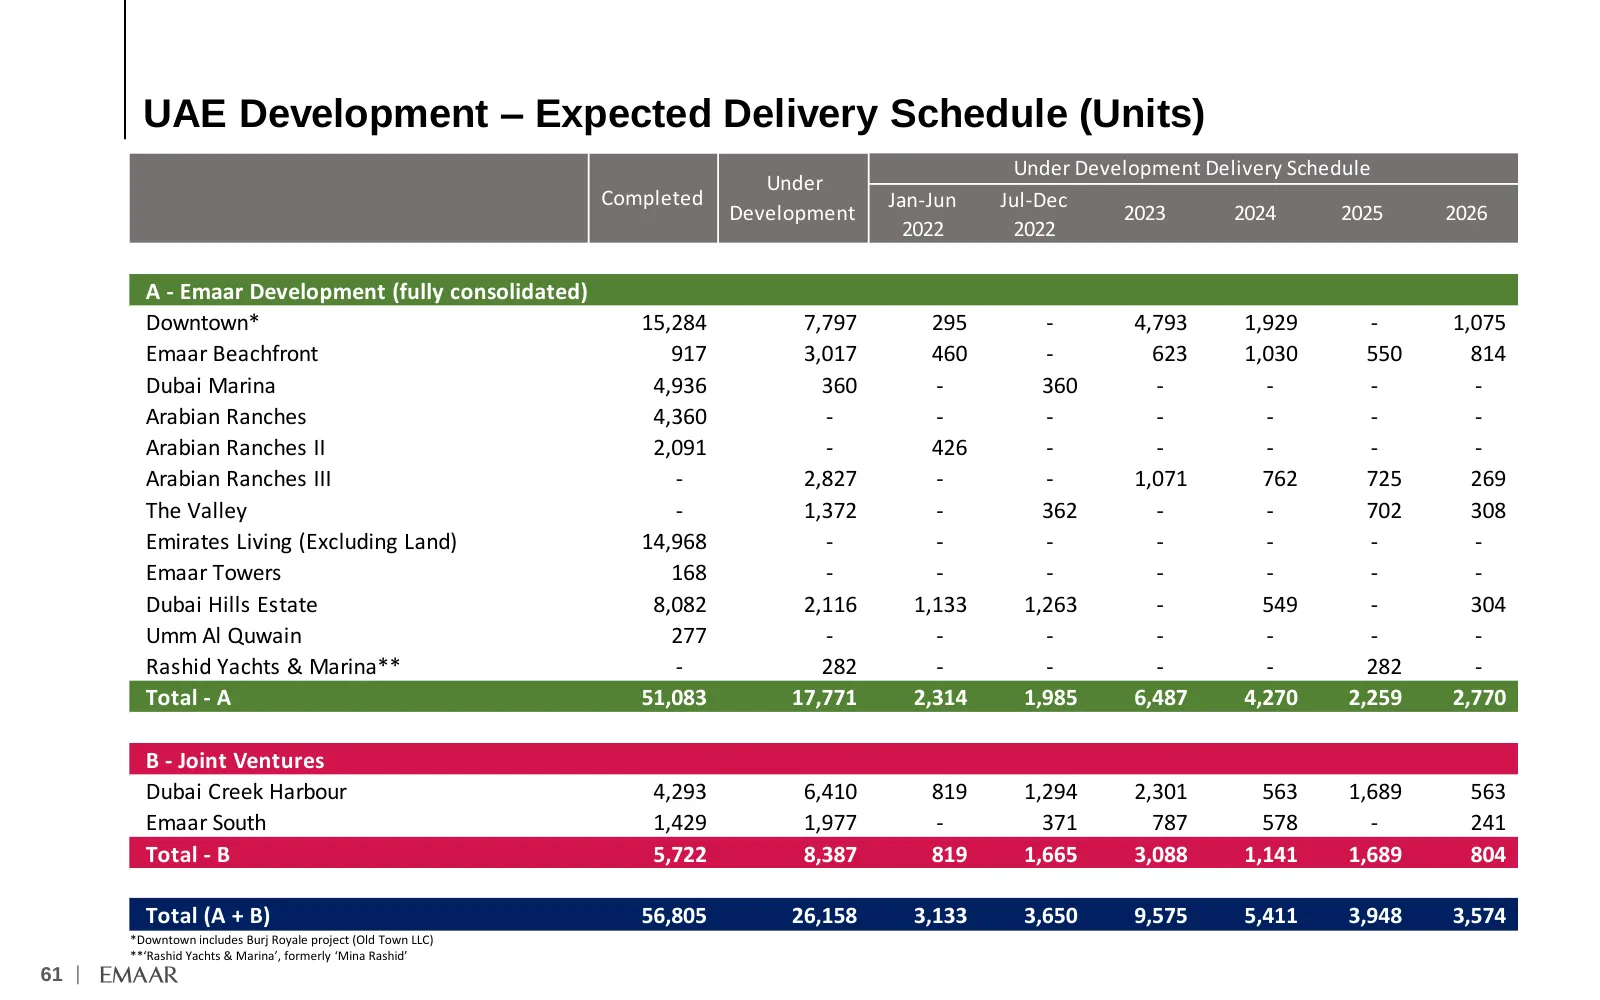
Slide 62: UAE Development – Expected Delivery Schedule (Units)
UAE Development – Expected Delivery Schedule (Units) Under Development Delivery Schedule Under Completed Jan-Jun Jul-Dec Development 2023 2024 2025 2026 2022 2022 - A - Emaar Development (fully consolidated) Downtown* 15,284 7,797 295 - 4,793 1,929 - 1,075 Emaar Beachfront 917 3,017 460 - 623 1,030
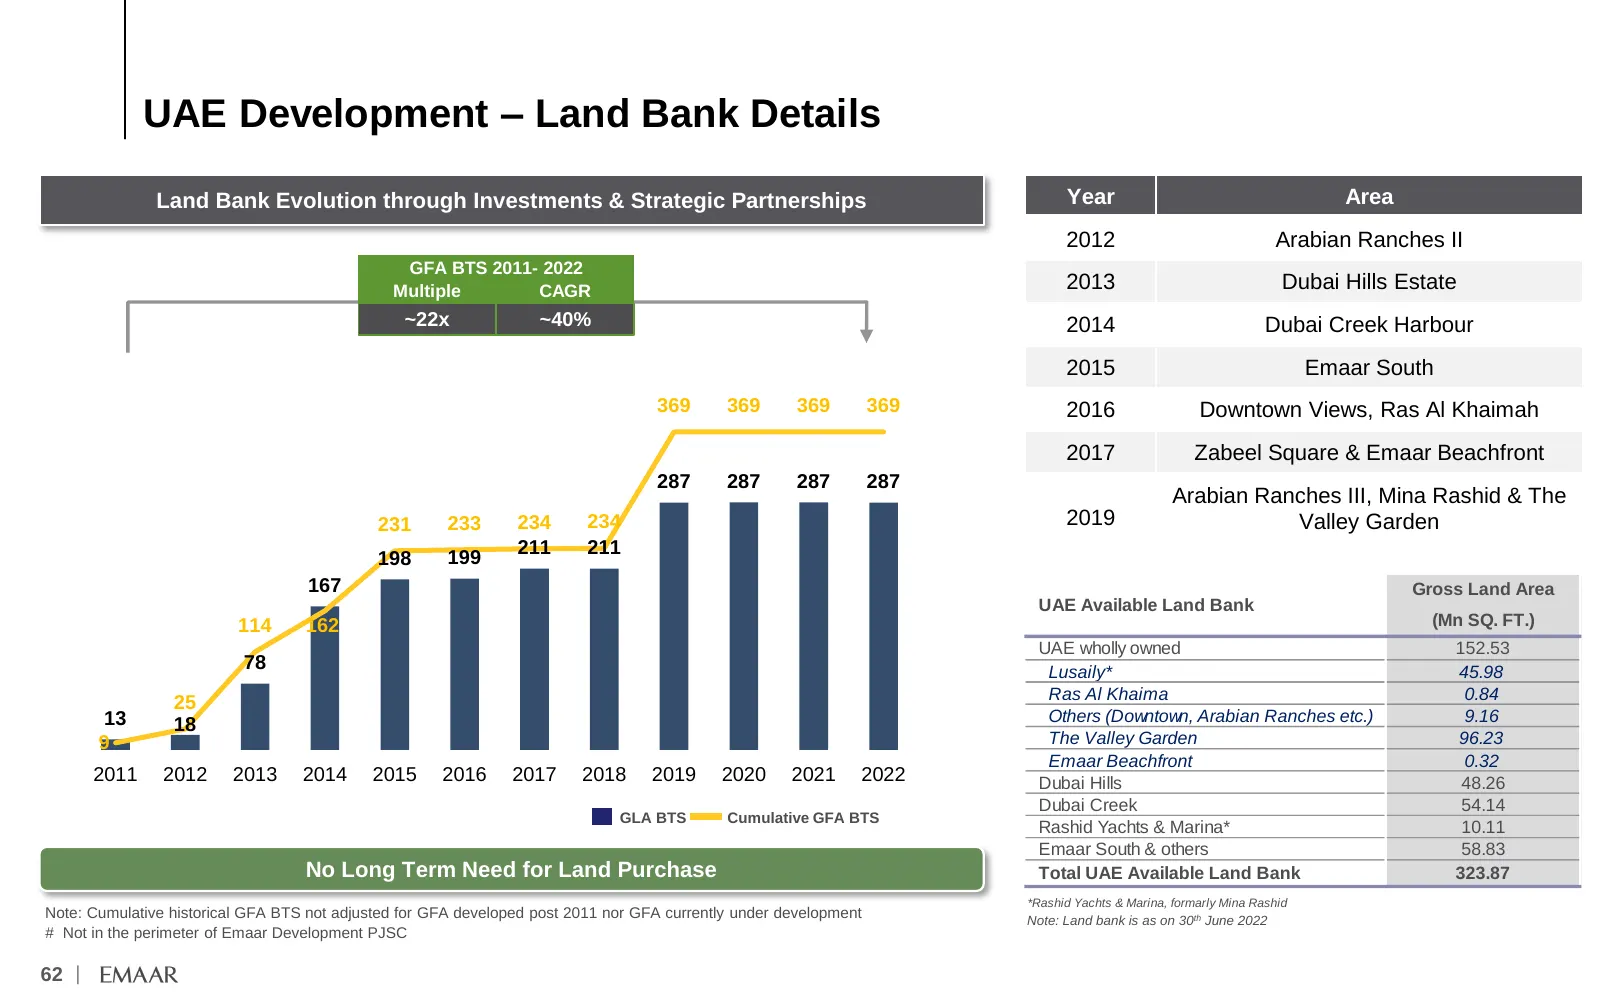
Slide 63: UAE Development – Land Bank Details
UAE Development – Land Bank Details Land Bank Evolution through Investments & Strategic Partnerships Year Area 2012 Arabian Ranches II (million sq ft) GFA BTS 2011- 2022 Multiple CAGR 2013 Dubai Hills Estate ~22x ~40% 2014 Dubai Creek Harbour 2015 Emaar South 369 369 369 369 2016 Downtown Views, Ras
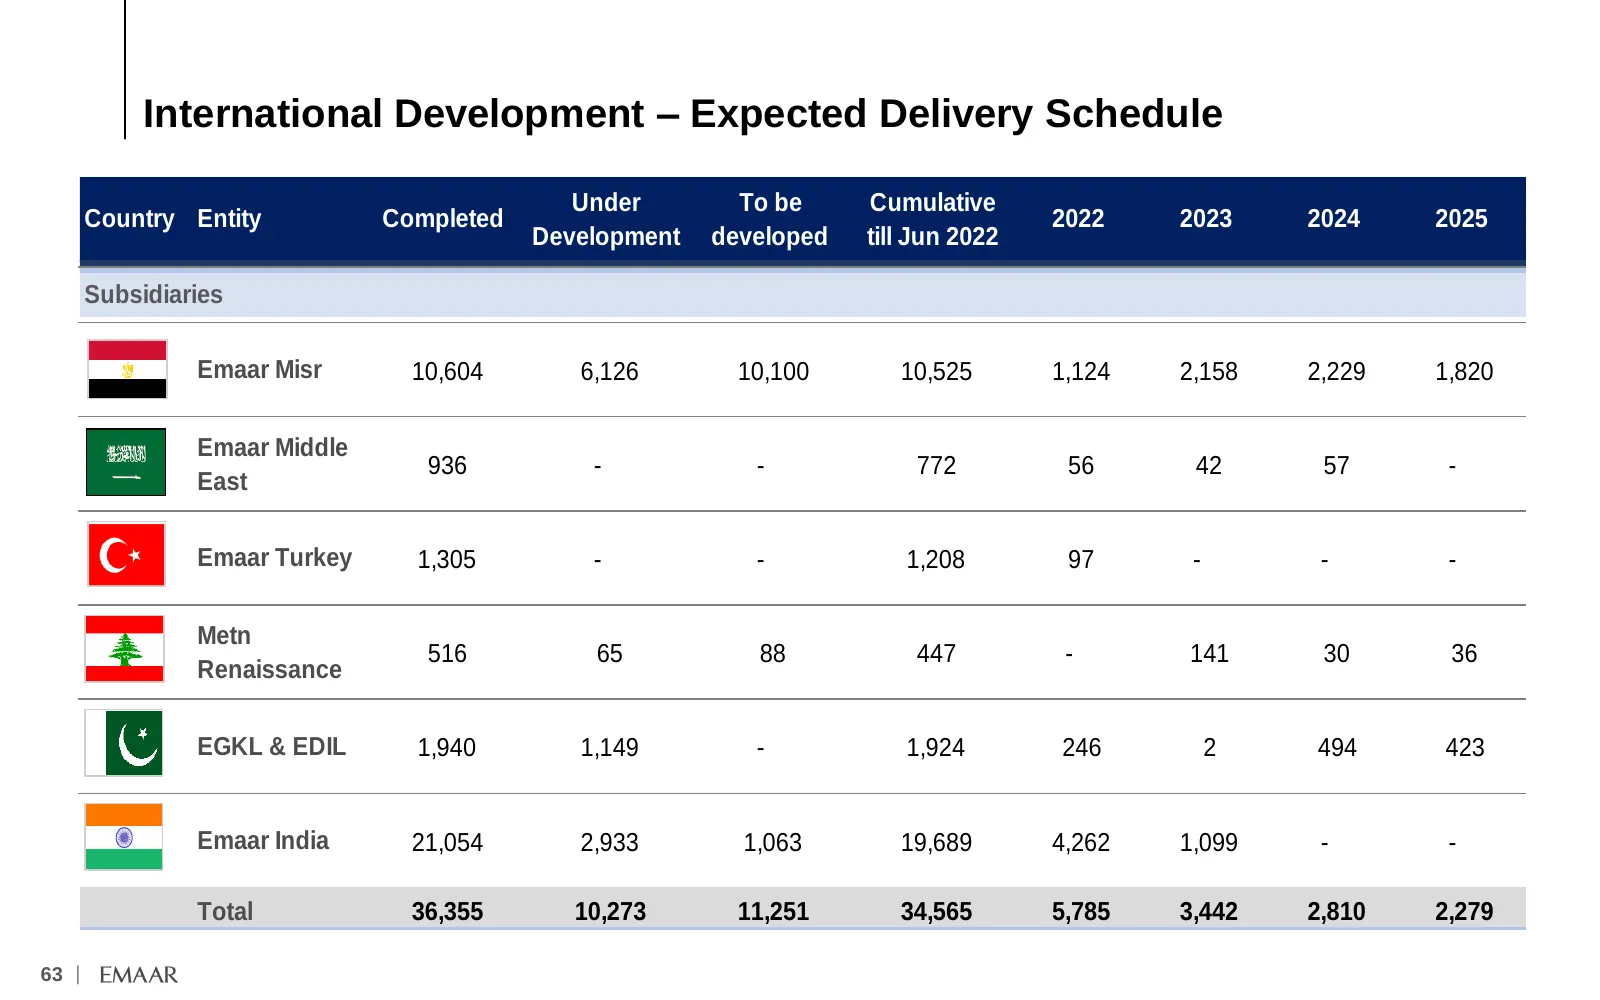
Slide 64: International Development – Expected Delivery Schedule
International Development – Expected Delivery Schedule Under To be Cumulative Country Entity Completed 2022 2023 2024 2025 Development developed till Jun 2022 Subsidiaries Emaar Misr 10,604 6,126 10,100 10,525 1,124 2,158 2,229 1,820 Emaar Middle 936 - - 772 56 42 57 - East Emaar Turkey 1,305 - - 1,
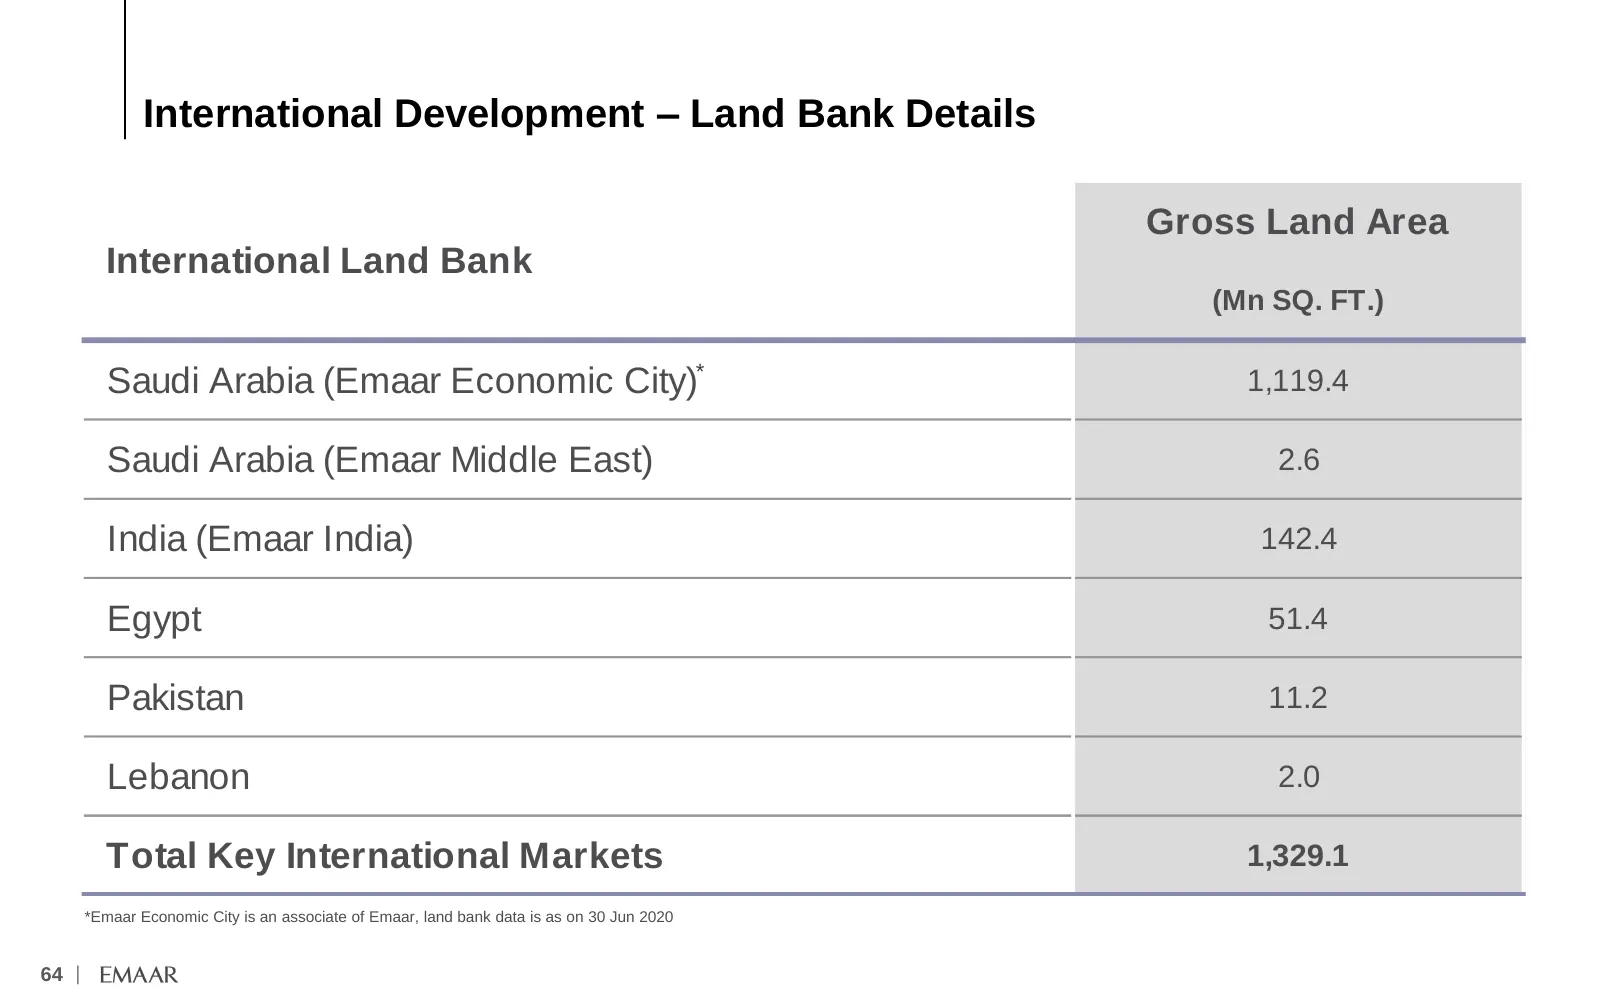
Slide 65: International Development – Land Bank Details
International Development – Land Bank Details Gross Land Area International Land Bank (Mn SQ. FT.) Saudi Arabia (Emaar Economic City)* 1,119.4 Saudi Arabia (Emaar Middle East) 2.6 India (Emaar India) 142.4 Egypt 51.4 Pakistan 11.2 Lebanon 2.0 Total Key International Markets 1,329.1 *Emaar Economic C
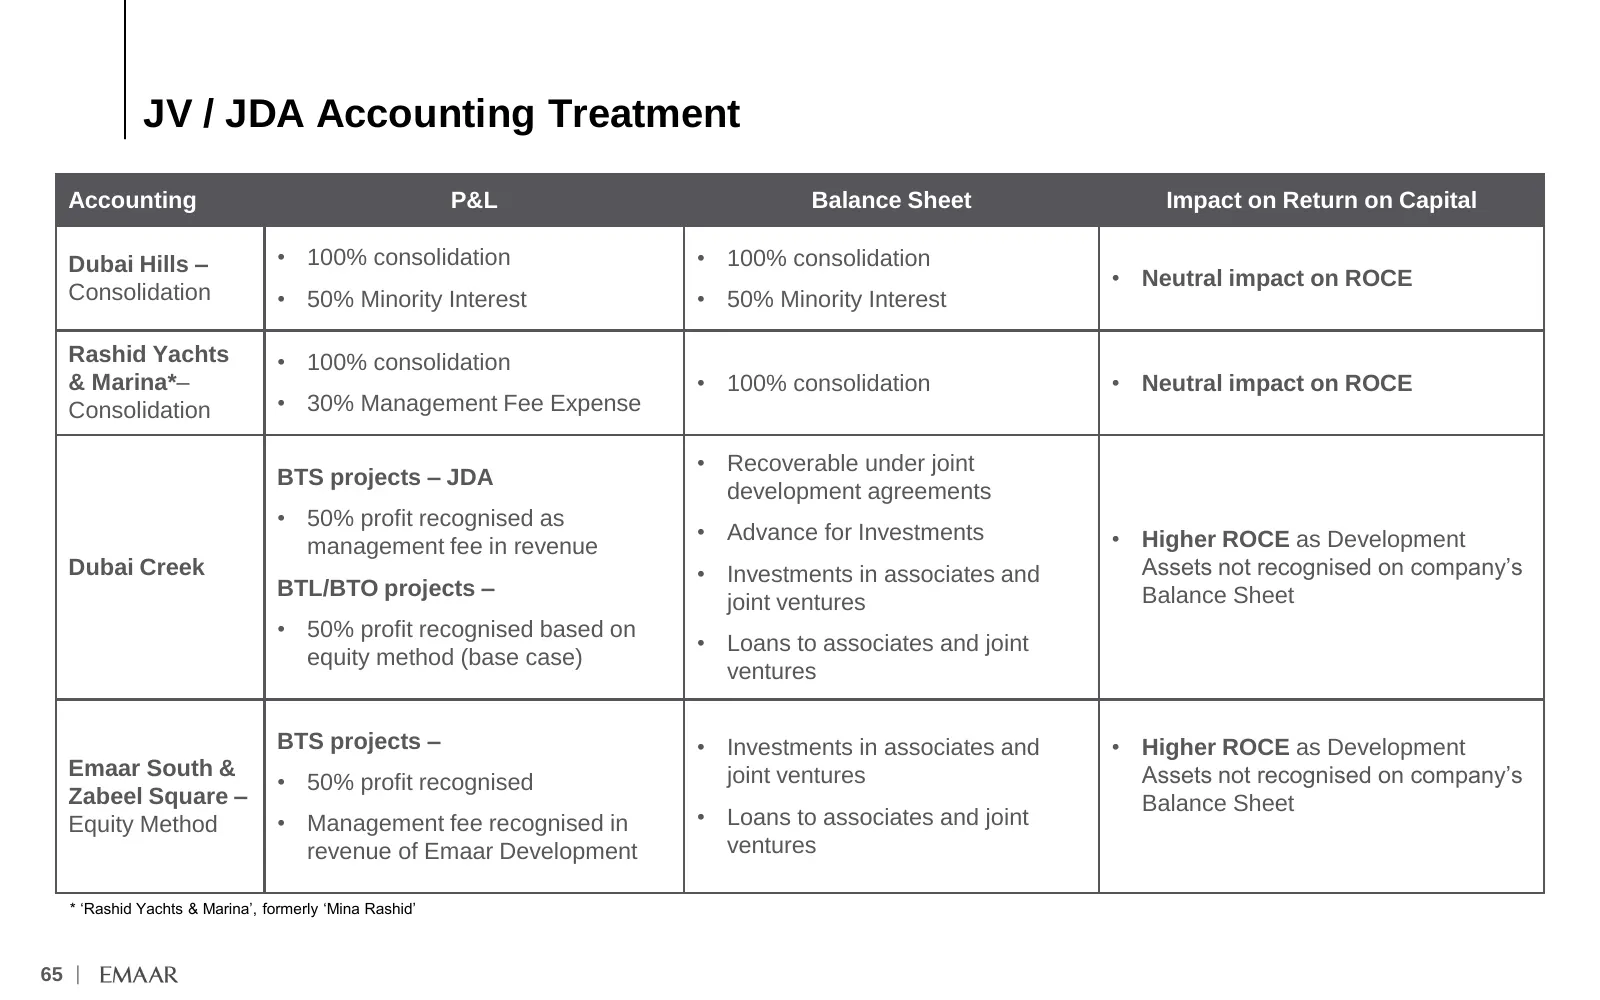
Slide 66: JV / JDA Accounting Treatment
JV / JDA Accounting Treatment Accounting P&L Balance Sheet Impact on Return on Capital Dubai Hills – • 100% consolidation • 100% consolidation • Neutral impact on ROCE Consolidation • 50% Minority Interest • 50% Minority Interest Rashid Yachts • 100% consolidation & Marina*– • 100% consolidation • N
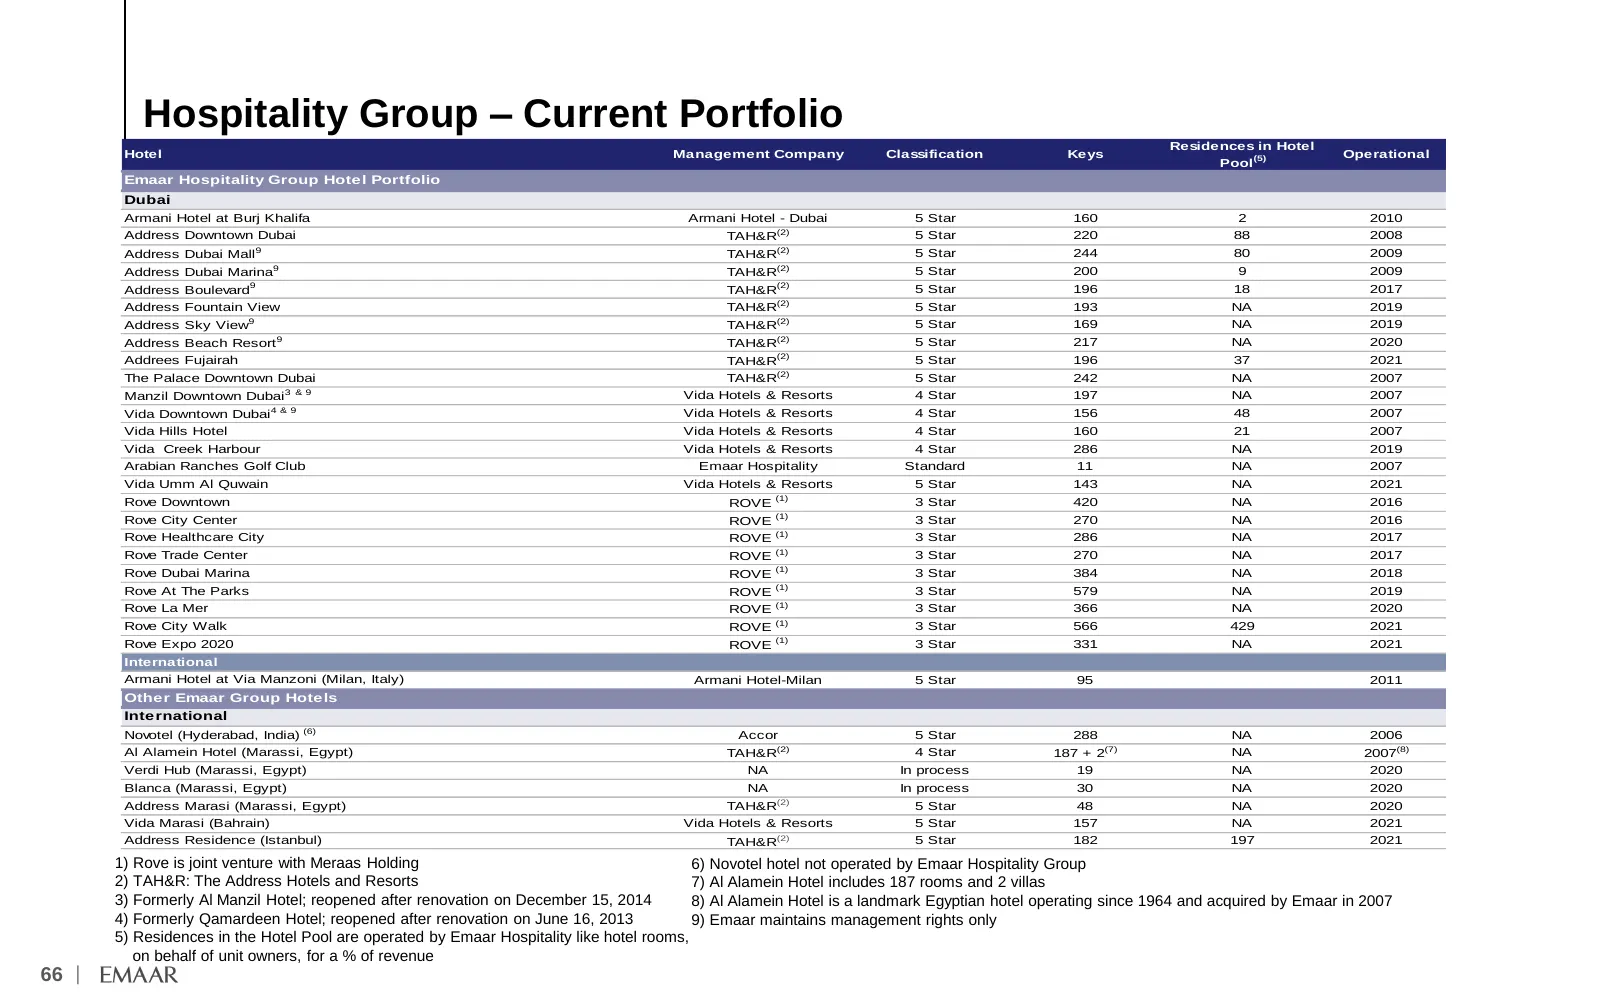
Slide 67: Hospitality Group – Current Portfolio
Hospitality Group – Current Portfolio Residences in Hotel Hotel Management Company Classification Keys Operational Pool (5) Emaar Hospitality Group Hote l Portfolio Dubai Armani Hotel at Burj Khalifa Armani Hotel - Dubai 5 Star 160 2 2010 Address Downtown Dubai TAH&R(2) 5 Star 220 88 2008 9 (2) Addr
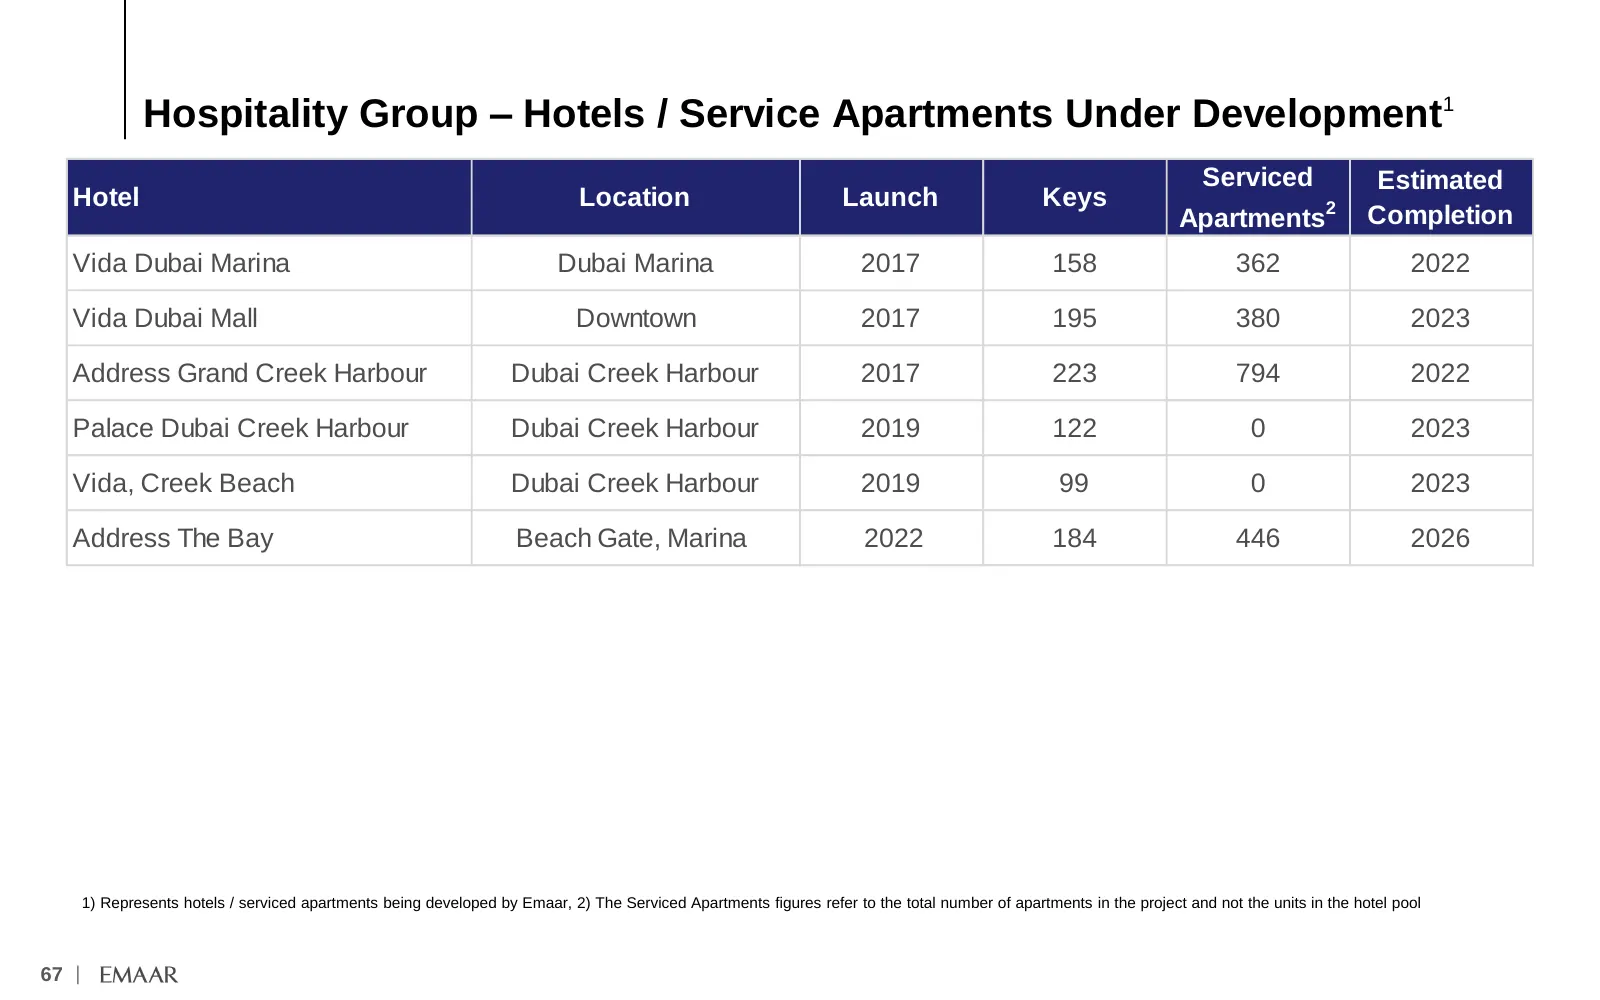
Slide 68: Hospitality Group – Hotels / Service Apartments Under Development
Hospitality Group – Hotels / Service Apartments Under Development1 Serviced Estimated Hotel Location Launch Keys 2 Apartments Completion Vida Dubai Marina Dubai Marina 2017 158 362 2022 Vida Dubai Mall Downtown 2017 195 380 2023 Address Grand Creek Harbour Dubai Creek Harbour 2017 223 794 2022 Palac
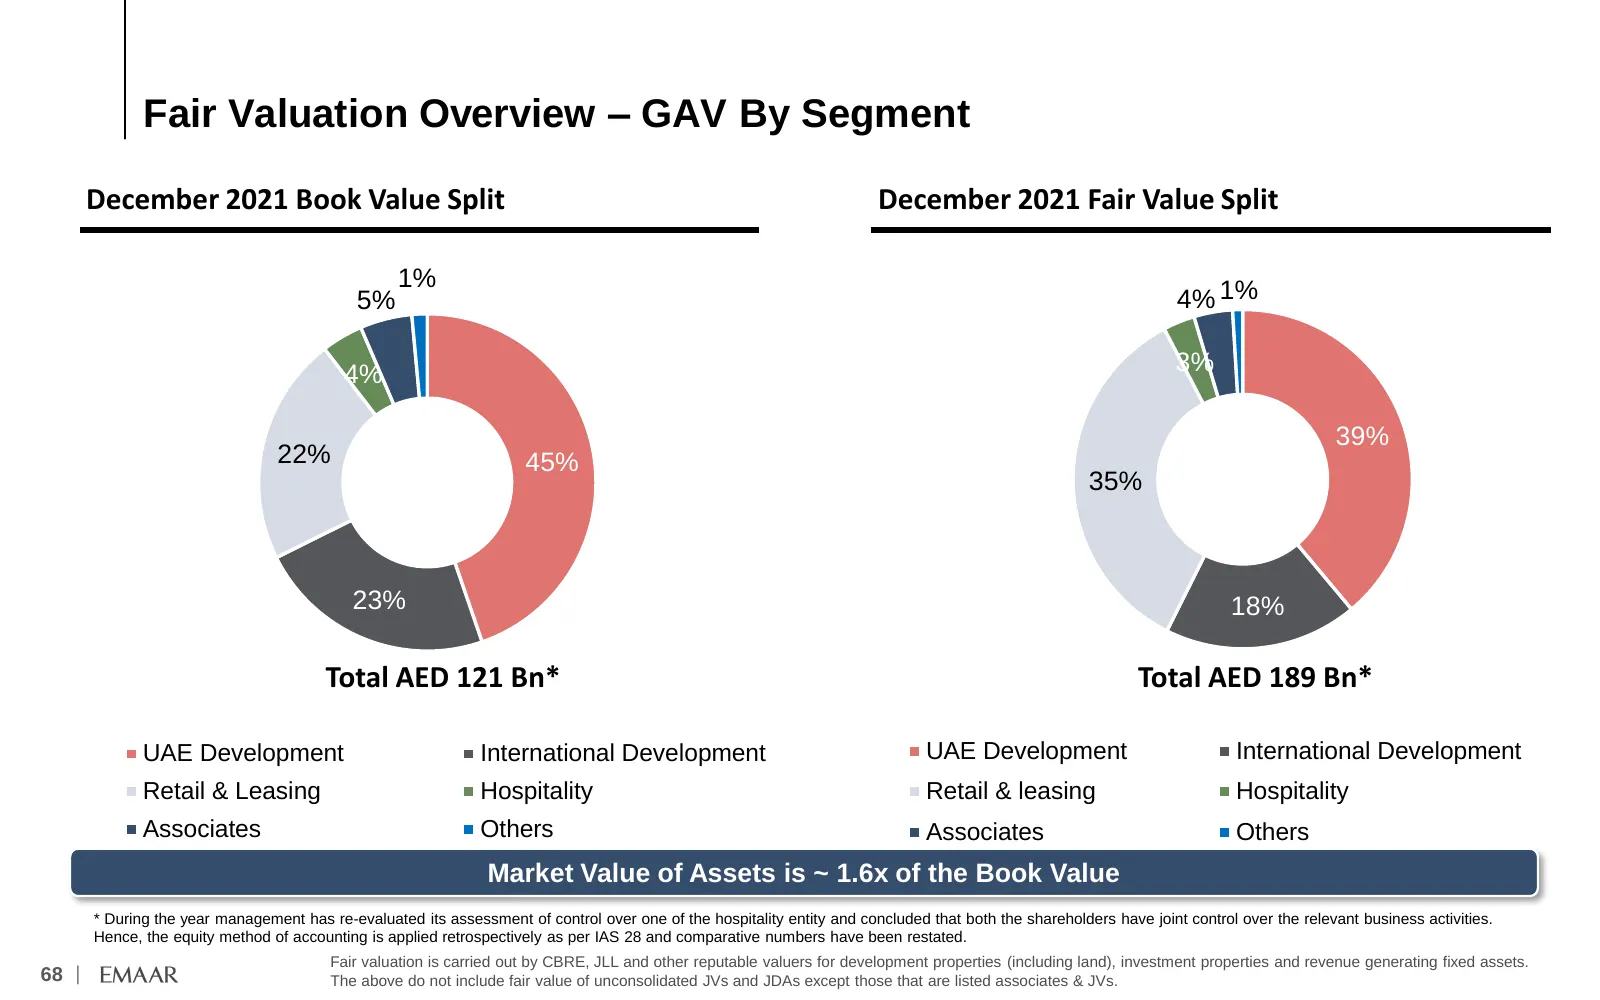
Slide 69: Fair Valuation Overview – GAV By Segment
Fair Valuation Overview – GAV By Segment December 2021 Book Value Split December 2021 Fair Value SalesSplit Sales 1% 5% 4% 1% 4% 3% 39% 22% 45% 35% 23% 18% Total AED 121 Bn* Total AED 189 Bn* UAE Development International Development UAE Development International Development Retail & Leasing Hospita
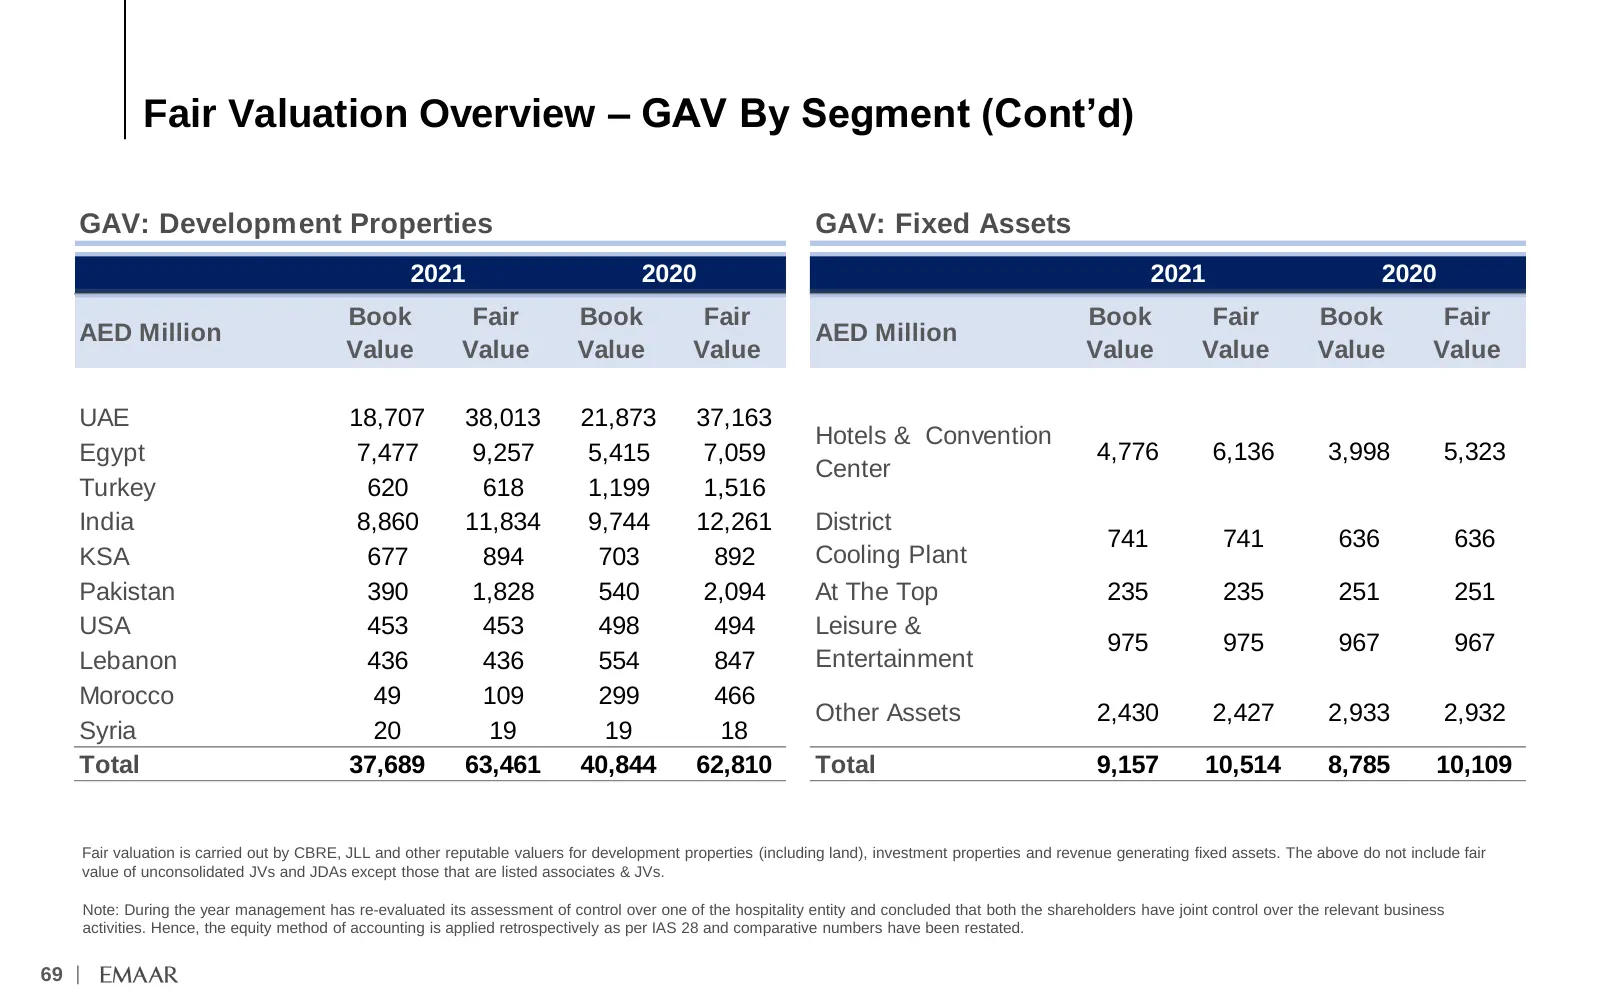
Slide 70: Fair Valuation Overview – GAV By Segment (Cont’d)
Fair Valuation Overview – GAV By Segment (Cont’d) GAV: Development Properties GAV: Fixed Assets 2021 2020 2021 2020 Book Fair Book Fair Book Fair Book Fair AED Million AED Million Value Value Value Value Value Value Value Value UAE 18,707 38,013 21,873 37,163 Hotels & Convention Egypt 7,477 9,257 5,
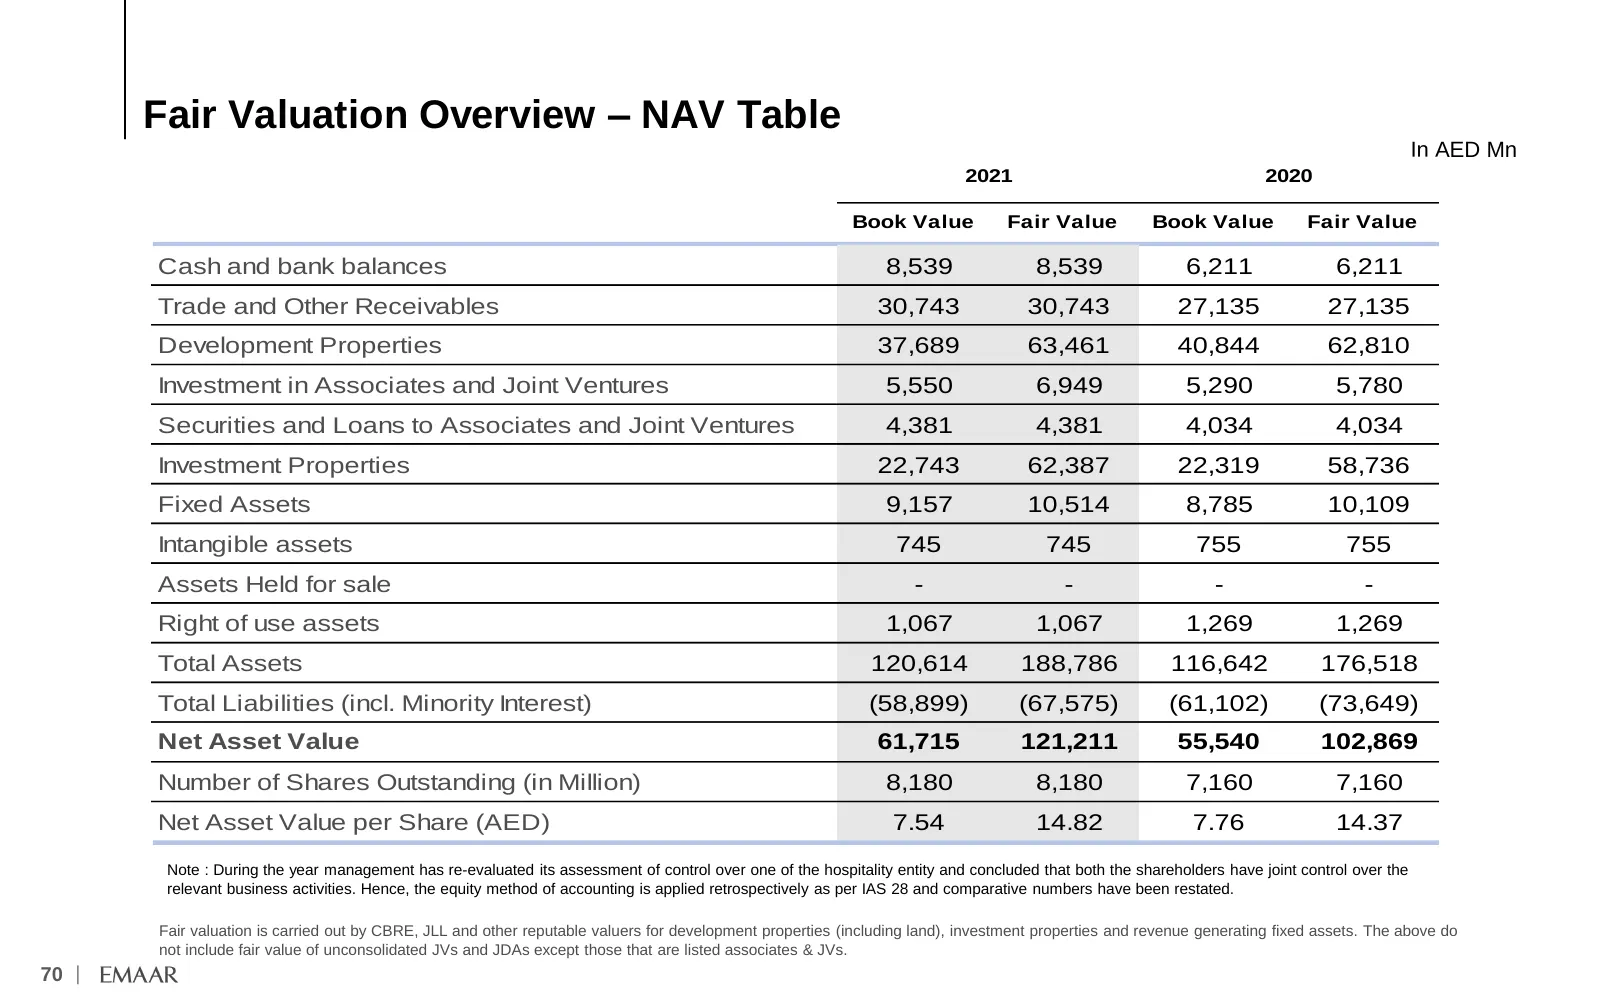
Slide 71: Fair Valuation Overview – NAV Table
Fair Valuation Overview – NAV Table In AED Mn 2021 2020 Book Value Fair Value Book Value Fair Value Cash and bank balances 8,539 8,539 6,211 6,211 Trade and Other Receivables 30,743 30,743 27,135 27,135 Development Properties 37,689 63,461 40,844 62,810 Investment in Associates and Joint Ventures 5,
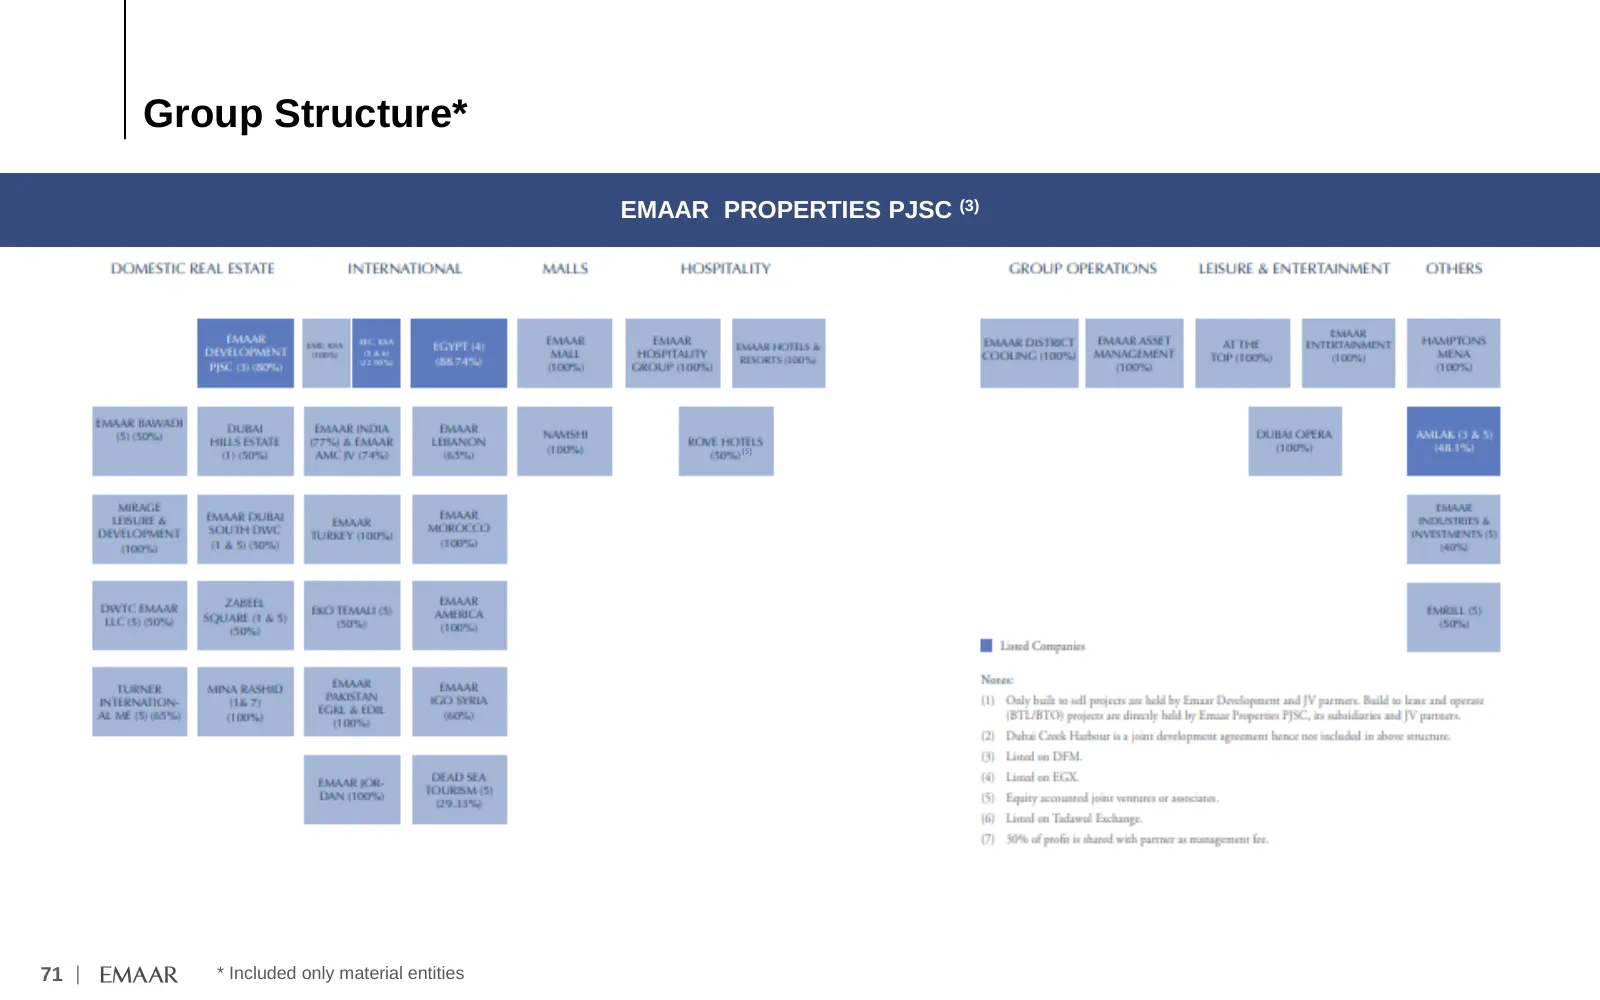
Slide 72: Group Structure
Group Structure* EMAAR PROPERTIES PJSC (3) (5) 71 | * Included only material entities
Slide 73: Thank You
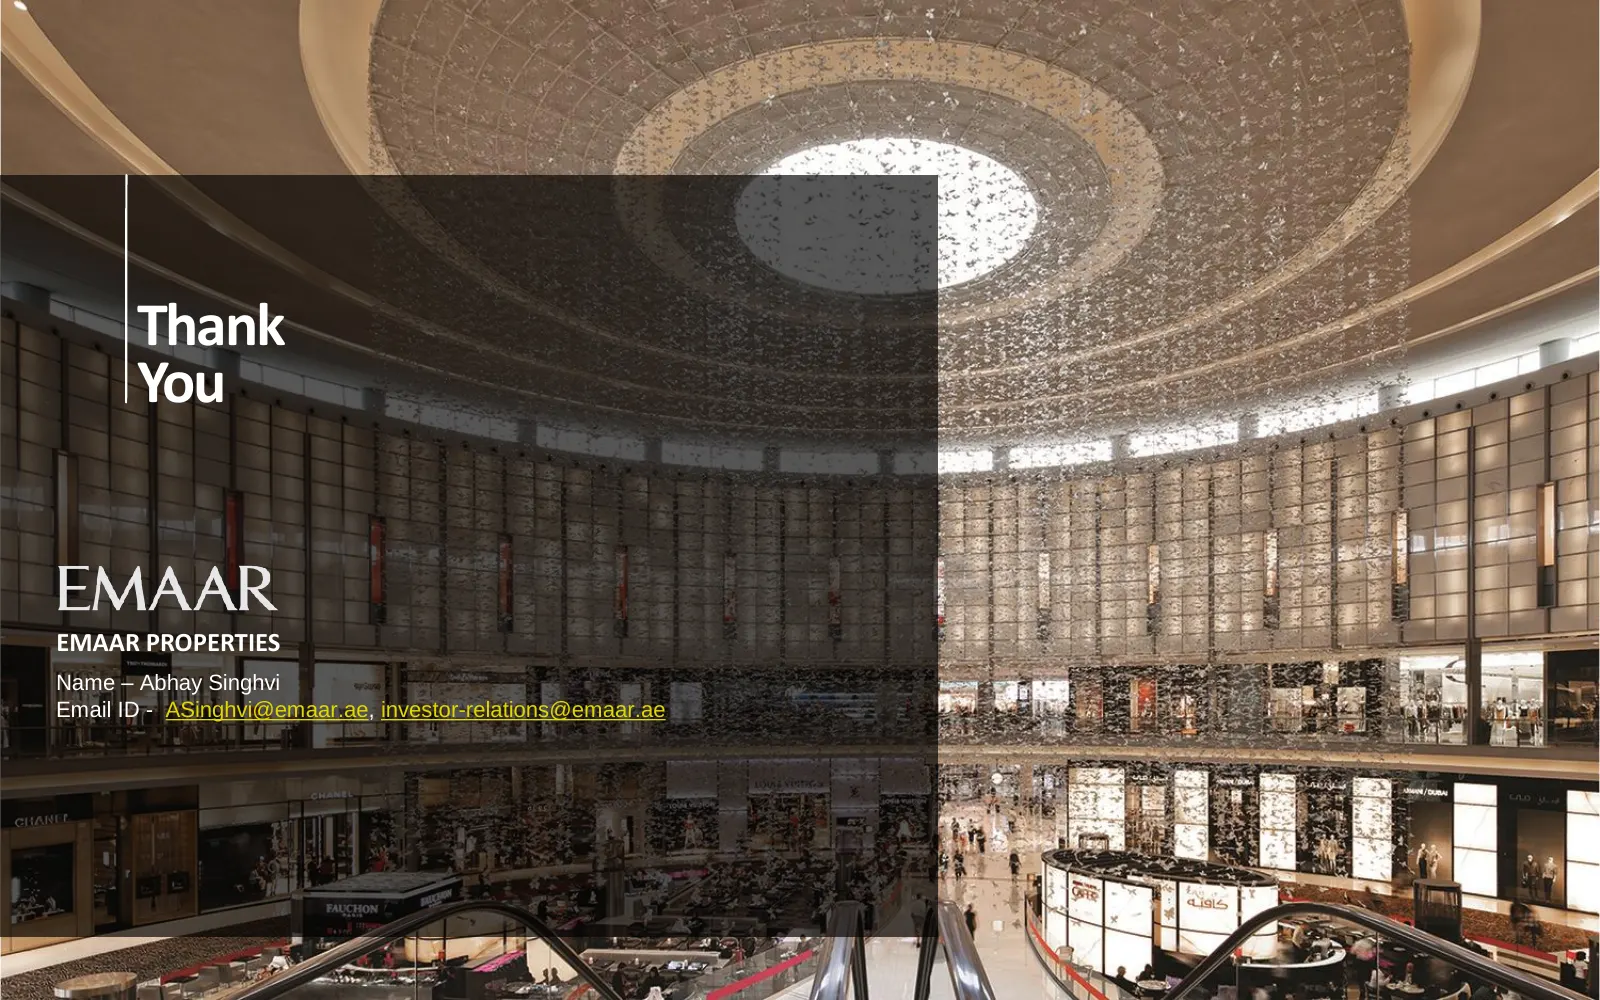
Thank You EMAAR PROPERTIES Name – Abhay Singhvi Email ID - ASinghvi@emaar.ae, investor-relations@emaar.ae 72 |
Source: Internet Archive copy of propdubaidc.emaar.com
More decks from Emaar Properties (P.J.S.C)
 H1 2026 Earnings Presentation78 slides · 2026
 Emaar Properties — 9M 2025 Earnings Presentation69 slides · November 2025
 H1 2025 Earnings Presentation69 slides · August 2025
 Emaar Properties — Q1 2025 Earnings Presentation68 slides · May 2025
 Emaar Properties — FY2025 Earnings Presentation71 slides · May 2025
 FY2024 Earnings Presentation70 slides · Feb 24, 2025