National Penn Bancshares — Q3 2009 Earnings Presentation
30 slides from National Penn Bancshares's earnings presentation, Nov 3, 2009

Slide 1: 3Q2009 National Penn Bancshares, Inc. Staying Strong, Moving Forward
3Q2009 National Penn Bancshares, Inc. Staying Strong, Moving Forward

Slide 2: Safe Harbor Regarding Forward Looking Statements
Safe Harbor Regarding Forward Looking Statements This presentation contains forward-looking information about National Penn Bancshares, Inc. that is intended to be covered by the safe harbor for forward-looking statements provided by the Private Securities Litigation Reform Act of 1995. Forward- loo

Slide 3: Positioning National Penn for the Future
Positioning National Penn for the Future l Improved capital levels l Increased allowance for loan losses l Decrease in non-performing assets plus loans 90-days past due l Exiting troubled investment class (CDO’s) l Continuing improvement to net interest margin l Focused cost containment l Strengthen

Slide 4: Capital Position - September 30, 2009
Sept 30, 2009 Dec 31, 2008 Well-capitalized minimum Tangible Common Equity to Tangible assets 6.85% 5.00% n/a Regulatory Total capital ratio 13.72% 11.85% 10% Regulatory Tier 1 capital ratio 12.46% 10.65% 6% Regulatory Tier 1 leverage ratio 9.00% 8.50% 5% Capital Position - September 30, 2009 l $153

Slide 5: National Penn Snapshot
As of September 30, 2009 National Penn Snapshot l Founded 1874, headquartered in eastern PA l NASDAQ ticker: NPBC l $9.7 billion in total assets l 127 community offices l Part of S&P SmallCap 600 Index l Successful acquirer/integrator over the past 18 years: – 11 community banks and thrifts – 5 bran
Slide 6: Attractive Franchise in the Heart of the Mid-Atlantic Region
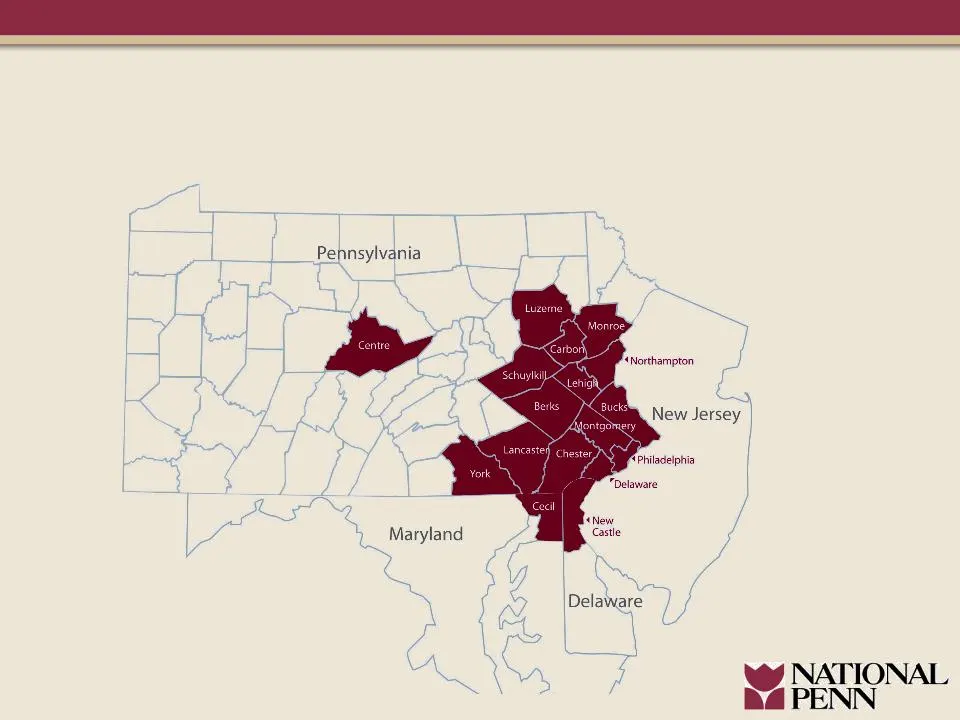
Attractive Franchise in the Heart of the Mid-Atlantic Region
Slide 7: Strong Market Share in Demographically Attractive Counties
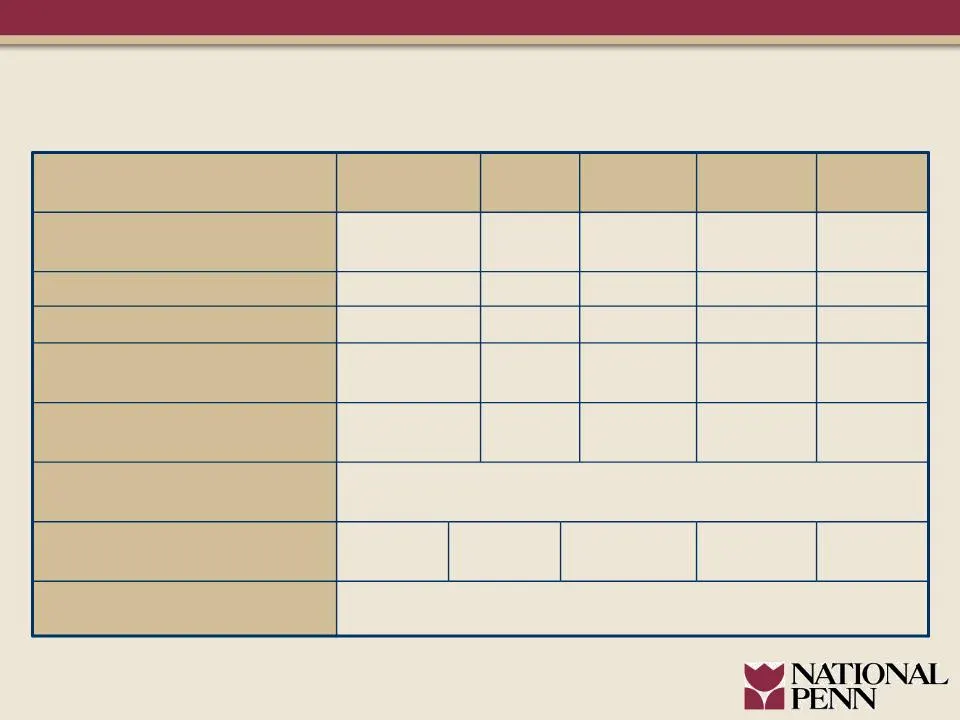
4.1% Nationwide Projected Income Growth $54.7 Nationwide Median HH Income ($000) $87.3 $47.6 $58.9 $58.6 $60.2 Median Household Income ($000) 7.4% 7.3% 4.2% 5.0% 6.1% Projected Income Growth: ’09 - - ’14 Community Banking Offices 9.3% 16.8% 22.0% 9.3% 21.1% Market Share Market Rank 13.1% 5.3% 24.6%

Slide 8: Market Disruption is a Key Opportunity
l Wachovia / Wells Fargo l Citizens / Royal Bank of Scotland l Sovereign / Banco Santander l Commerce / Toronto-Dominion l Bank of America l Harleysville / First Niagara (pending) Deposits in NPBC Region (Dollars in Billions) $34.9 $16.9 $11.7 $10.7 $6.3 $4.0 Includes all deposits in the counties in

Slide 9: Reconciliation Table for Non-GAAP Financial Measures
*YTD 2009 includes ALLL provision of $107 million versus $14 million for the comparable 2008 period. Reconciliation Table for Non-GAAP Financial Measures YTD (Dollars in 000’s) 3 rd Qtr 2009 September 30, 2009* Net (Loss)/Income available to Common Shareholders $ (65,187) $ (73,084) - After-tax impa
Slide 10: Net Interest Margin Improving
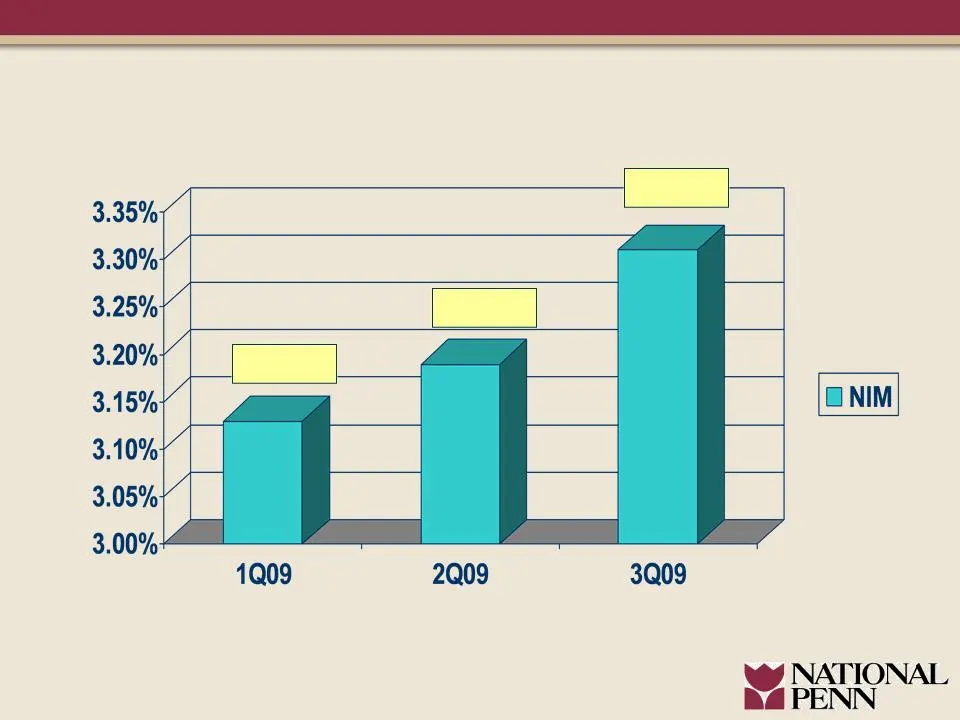
3.13% 3.19% 3.31% Net Interest Margin Improving
Slide 11: Core Non Interest Income Stable
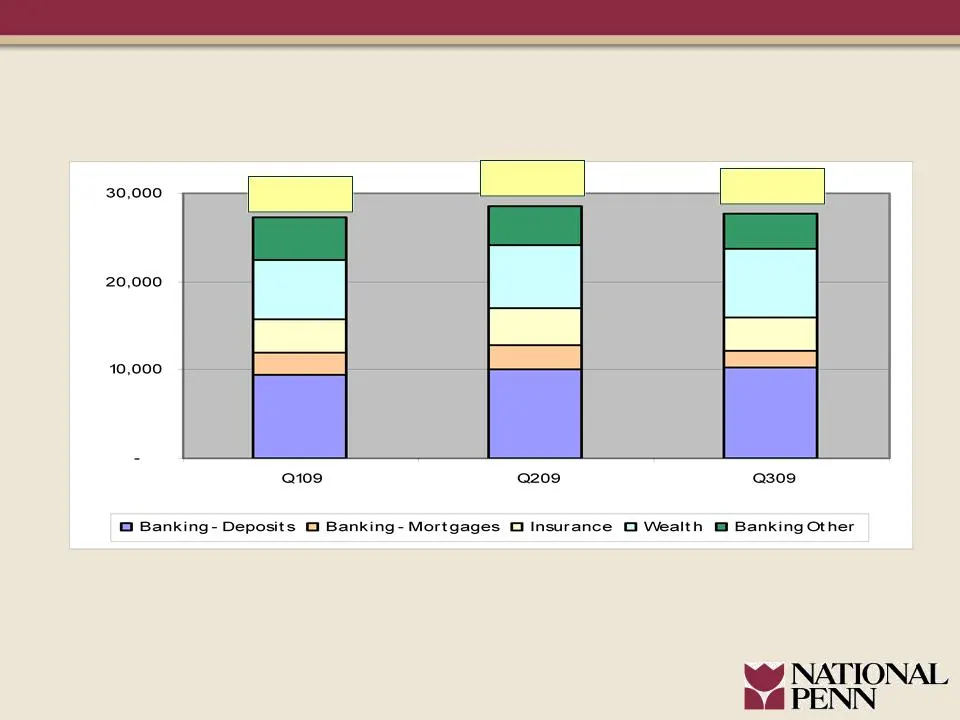
*The core non-interest income numbers shown above are non-GAAP financial measures as they exclude other-than- temporary impairment on CDO investments, net losses/(gains) from fair value changes on National Penn’s trust preferred securities, and net losses on sales of investment securities. These amo
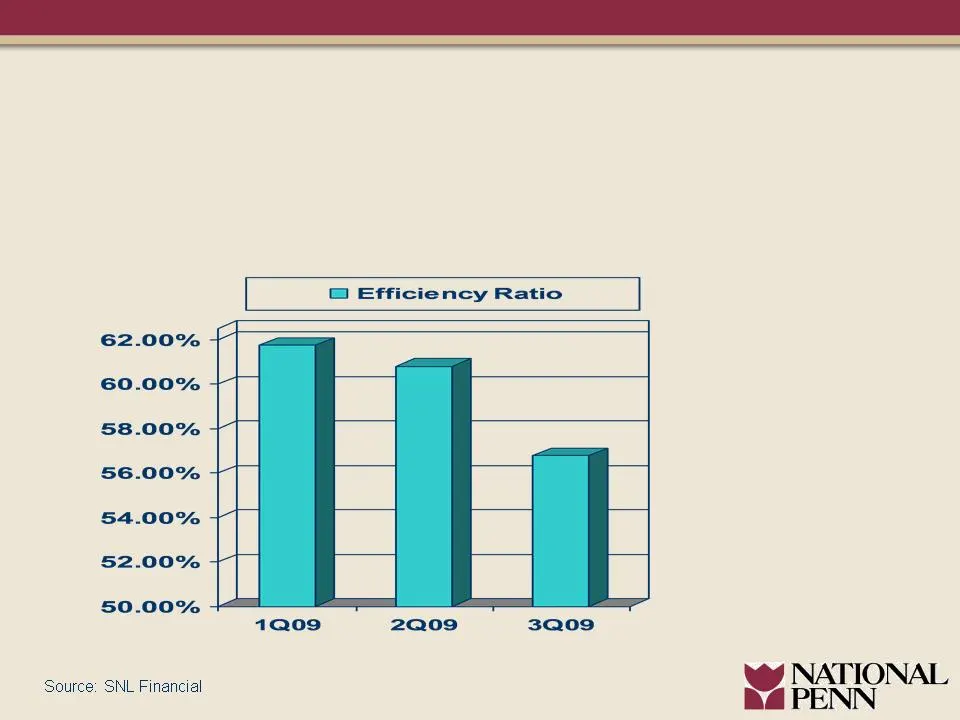
Slide 12: NPBC - Low Cost Provider
Non Interest Expense Efficiency Ratio Q109 $54,753 61.75% Q209 $56,124 60.81% Q309 $54,282 56.77% NPBC - - Low Cost Provider
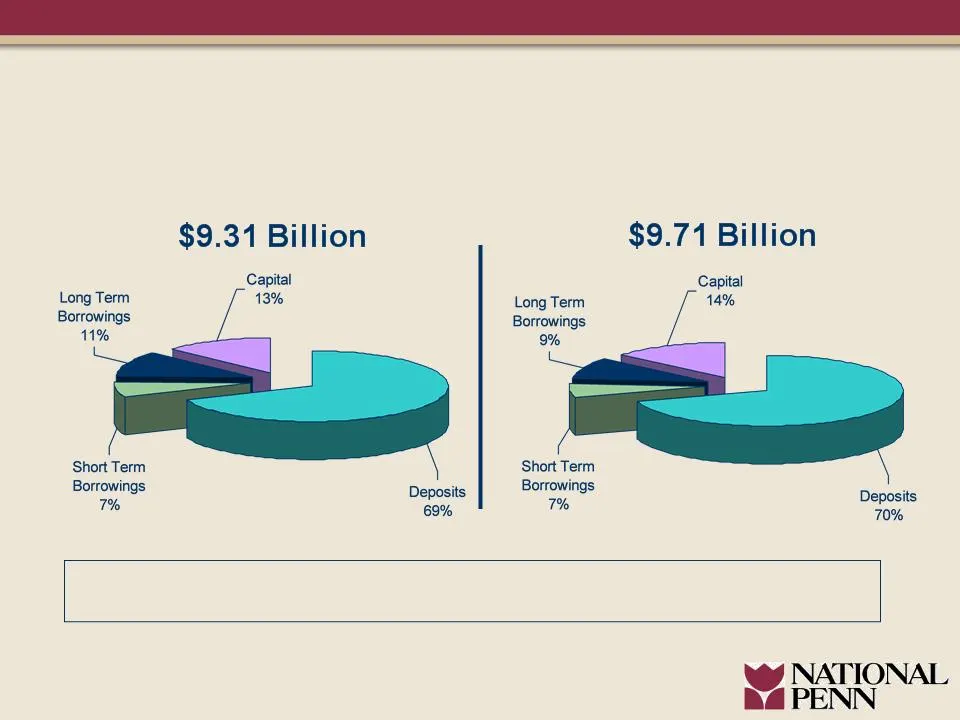
Slide 13: Improved Sources of Funding
December 31, 2008 September 30, 2009 Dec 31, 2008 Sept 30, 2009 Total Deposits ($000) $6,389,886 $6,798,662 Improved Sources of Funding
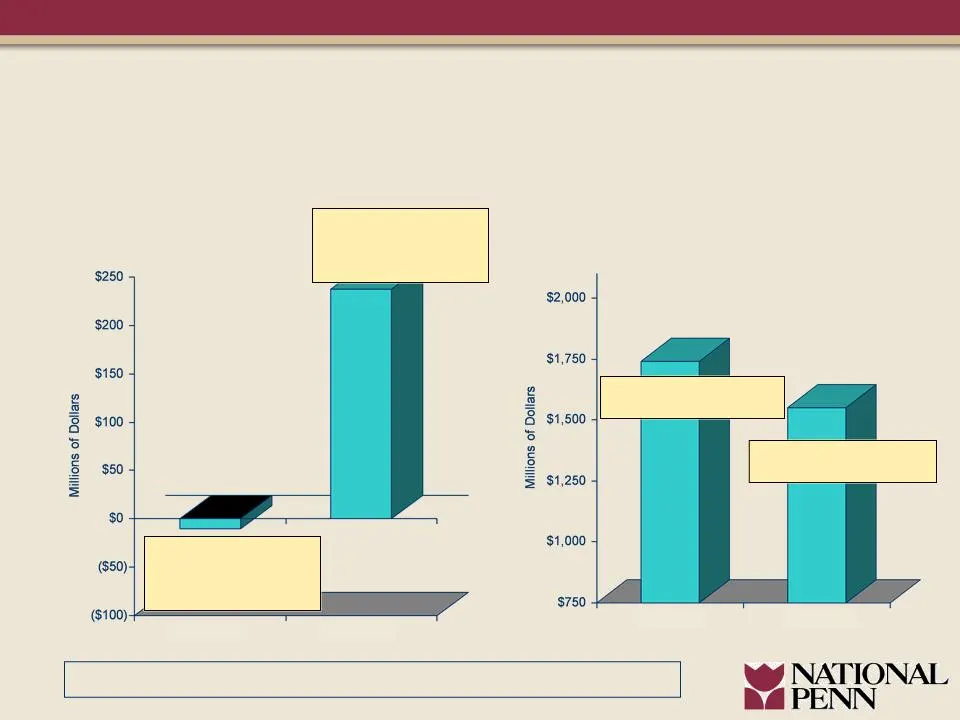
Slide 14: Strong Liquidity Position
Total Borrowed Funds Strong Liquidity Position $10 million Purchased $238 million Sold $1.74 billion $1.55 billion NPBC Unused Borrowing Capacity in Excess of $1 Billion 9/30/09 12/31/08 9/30/09 12/31/08 Daily Funds Position

Slide 15: Capital Retention Due to Decreased Dividend
Capital Retention Due to Decreased Dividend $.05 Previous Dividend $.01 Dividend Declared 4Q2009 Result: $5,028,000 Quarterly Savings $20,112,000 Annualized Savings

Slide 16: Intention to Dispose of CDO Portfolio
Intention to Dispose of CDO Portfolio l Continued deterioration in underlying issuers results in additional reclassification of OCI into OTTI l Deterioration in collateral/future cashflows available l Structure of securities - lower rated tranches l Deterioration in value not primarily market relate

Slide 17: Overview of the Impact of Our Intention to Dispose of CDO Portfolio
(Dollars in millions) Pre Tax After Tax Per Share Capital* Unamortized cost as of June 30, 2009 $31 -- -- $(20) OCI related to CDO as of June 30, 2009 57 -- -- -- Value as of September 30, 2009 3 -- -- 2 Impact of intention to dispose $85 $55 $0.55 $(18) *GAAP basis Overview of the Impact of Our Int

Slide 18: Overview of Tax Advantageous Timing
Overview of Tax Advantageous Timing l Carry-back available for a portion of the loss results in expected refund of previously paid taxes approximately $27 million l Remainder of loss available to offset future taxable income l Sales to take place beginning in 4Q09

Slide 19: Deferred Tax Asset
Deferred Tax Asset l Net of carry back available of approximately $27 million, the net deferred tax asset is $72 million l Deferred tax asset as an industry (and NPBC) increasing due to items expensed for GAAP but not for tax, such as: – Increased loan loss reserve with expense not recognized for ta
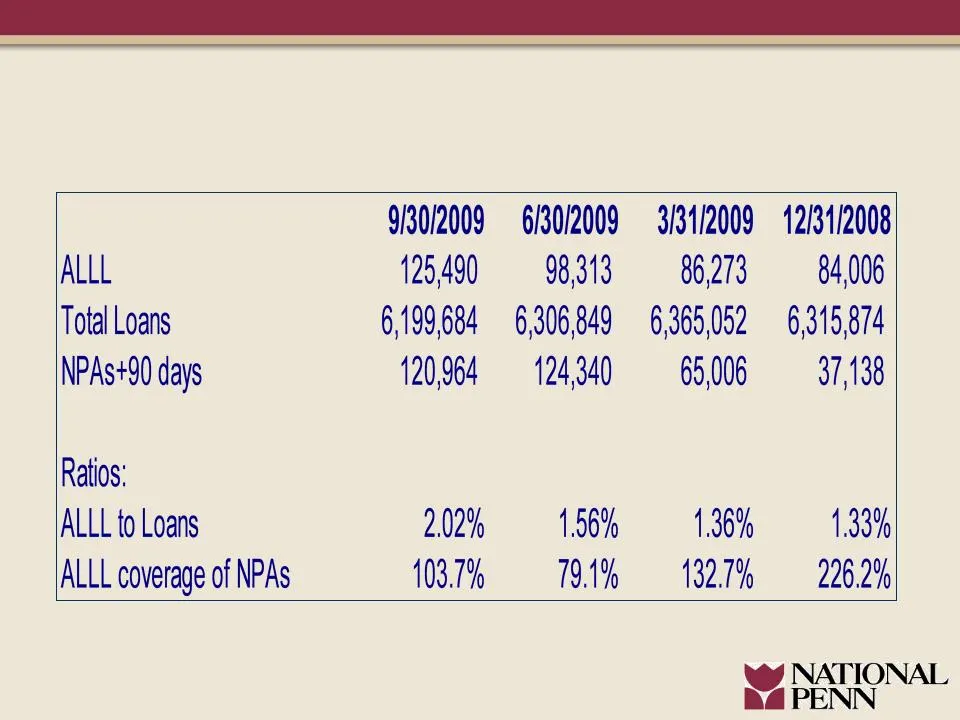
Slide 20: NPBC Asset Quality Ratios
NPBC Asset Quality Ratios $(000)
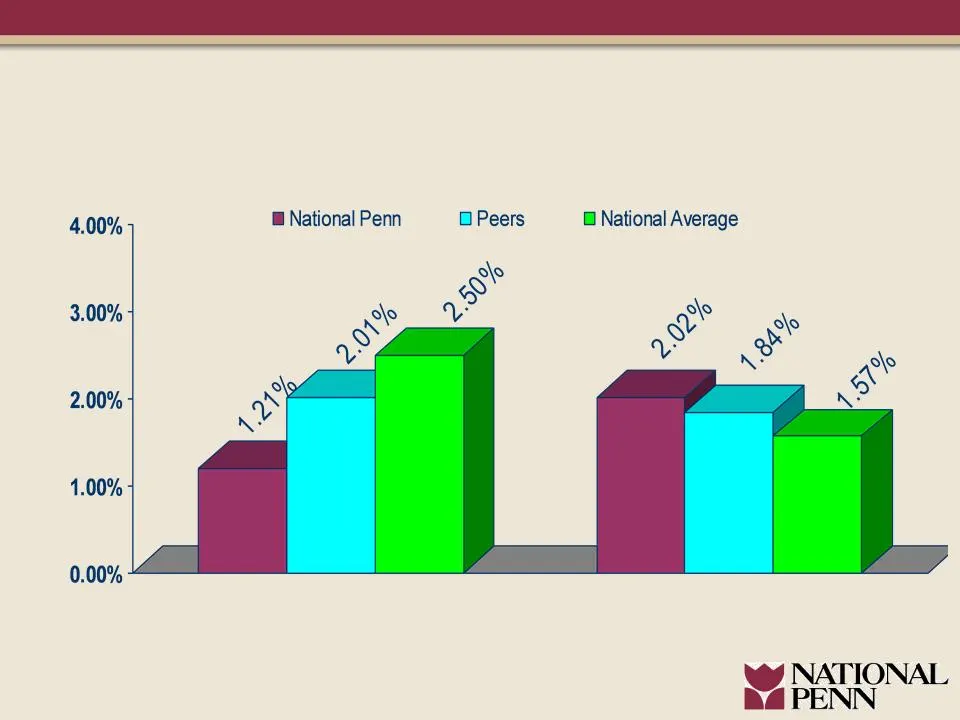
Slide 21: Credit Quality Compares Favorably to Peers
Non-performing assets to total assets Allowance for loan loss to loans As of September 30, 2009 Peer group as disclosed in NPBC 2009 Proxy Statement National Average is the average value for all regulated depositories nationwide Source: SNL Financial Credit Quality Compares Favorably to Peers

Slide 22: Loan Risk Profile September 30, 2009
$ in thousands 9/30/2009 Balance % of Loans Classified*/ Loans Non Performing/Loans YTD Net Chargeoffs (annualized)/Avg. Loans Total Past Due/Loans Commercial 2,898,084 46% 9.97% 1.46% 1.48% 0.24% CRE Permanent 836,718 14% 5.23% 1.82% 0.90% 0.35% CRE Construction 443,775 7% 28.23% 9.77% 3.94% 1.45%

Slide 23: Non-Performing Assets: 9/30/09
Non-Performing Assets: 9/30/09 Total: $120.9 million l 86% Commercial ($104.6 million) – $45.3 million in C&I – $43.5 million in Commercial Real Estate Construction l 14% Consumer

Slide 24: Net Charge Offs: 9/30/09
Net Charge Offs: 9/30/09 Total: $24.8 million l C&I $11.8 l CRE $10.2 l Other $2.8

Slide 25: Home Equity Loan Portfolio: 9/30/09
Home Equity Loan Portfolio: 9/30/09 l High quality, self originated portfolio l Includes revolving and installment 1 st and 2 nd lien loans of ~$800 million l Average FICO score of 760 l Average loan to value ratio of 66% l One-third of portfolio is in 1 st lien position

Slide 26: Commercial Real Estate Major Components: 9/30/09
Multi family $227.9 million 21.7% Retail & shopping centers $214.3 million 16.7% Residential investment 1-4 family $194.2 million 15.1% Residential subdivisions $167.9 million 13.1% Office buildings $153.8 million 12.0% Land $72.9 million 5.7% Commercial Real Estate Major Components: 9/30/09

Slide 27: Commercial Real Estate Land Exposure: 9/30/09
Commercial Real Estate Land Exposure: 9/30/09 Total: $72.9 million l Unapproved: $24.5 million l Approved but unimproved: $30.1 million l Improved: $18.3 million

Slide 28: Thorough Credit Review Process
Thorough Credit Review Process • C & I portfolio • Grade 5 (Acceptable Risk) or worse rated relationships • $3 million+ in relationship size • Monthly reviews by account with Executive Management • Commercial Real Estate Oversight Committee • In place since July • Bi-weekly reviews by account with E

Slide 29: Positioning National Penn for the Future
Positioning National Penn for the Future l Improved capital levels l Increased allowance for loan losses l Decrease in Non-Performing Assets plus Loans 90-days Past Due l Exiting troubled investment class (CDO’s) l Continuing improvement to net interest margin l Focused cost containment l Strengthen

Slide 30: Investor Relations Information
Investor Relations Information l The following information can be found on our Investor Relations Web site at www.nationalpennbancshares.com l SEC Filings l Corporate News l Analyst Estimates l and much more l Contact information – Michael J. Hughes, Chief Financial Officer 610.369.6284 | michael.hu
Source: SEC EDGAR · 8-K filed Nov 3, 2009
More decks from National Penn Bancshares
 BB&T Global Financial Services Conference (September 2015)33 slides · Sep 16, 2015
 Merger or Acquisition (August 2015)13 slides · Aug 18, 2015
 Q2 2015 Earnings Presentation17 slides · Jul 23, 2015
 Q1 2015 Earnings Presentation18 slides · Apr 24, 2015
 Investor Presentation (February 2015)36 slides · Feb 11, 2015
 Q4 2014 Earnings Presentation16 slides · Jan 22, 2015