F-Secure Oyj · OMXHEX:FSECURE
F-Secure Oyj — Q3 2021 Earnings Presentation
17 slides from F-Secure Oyj's earnings presentation, October 2021
Slide 1: Solid Growth in Corporate Security Products
SOLID GROWTH IN CORPORATE SECURITY PRODUCTS Q3/2021 Highlights Juhani Hintikka, President & CEO
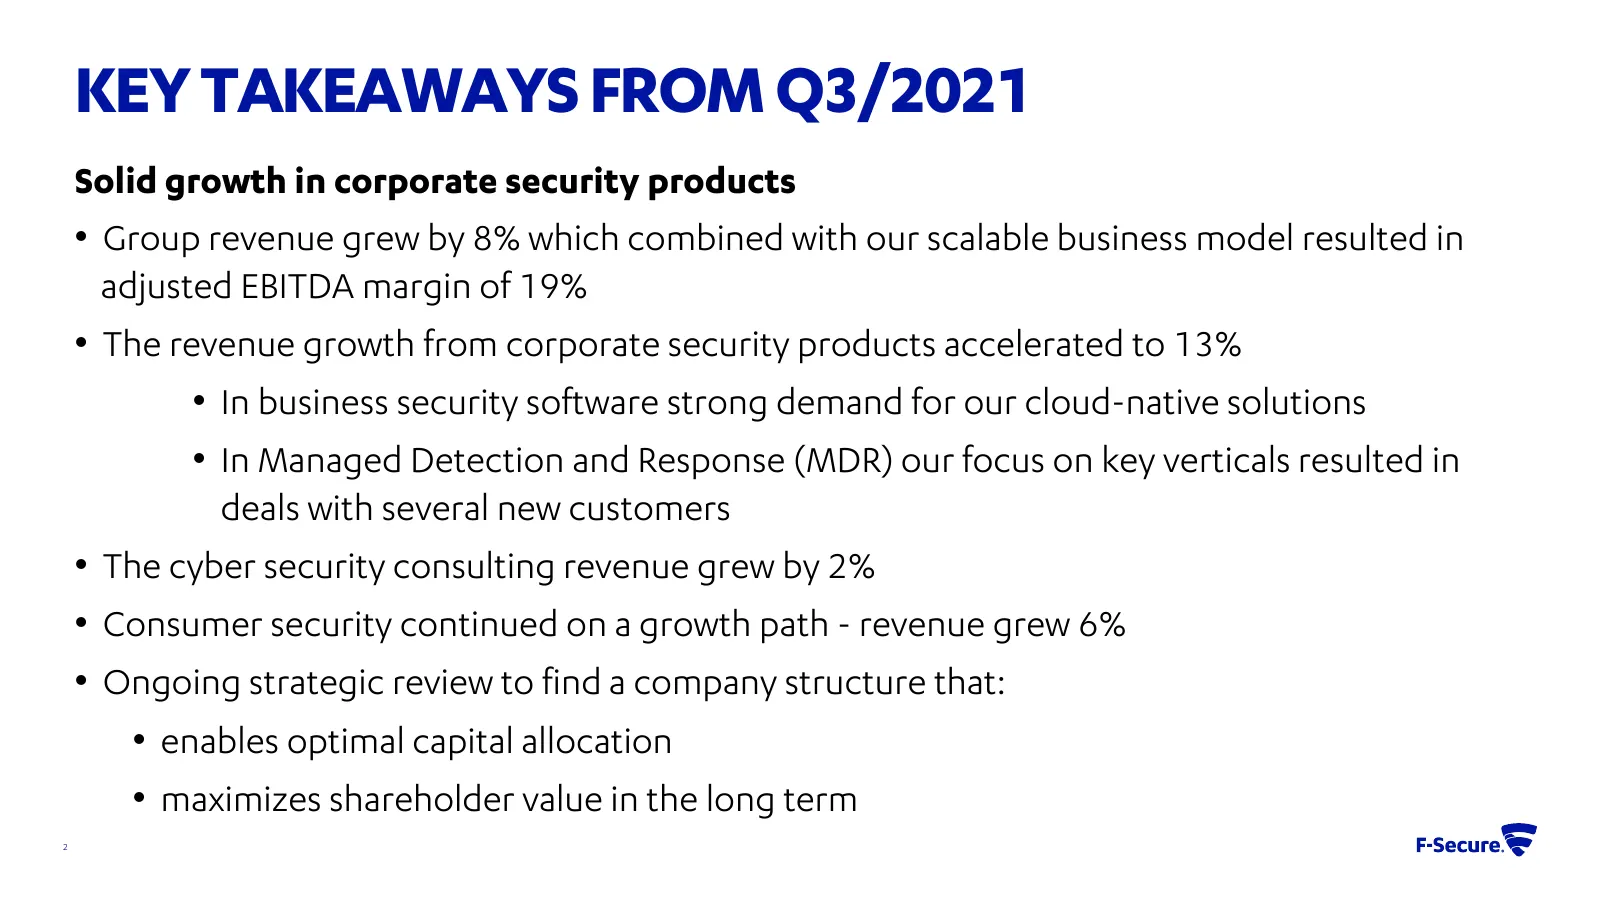
Slide 2: Key Takeaways from Q3/2021
KEY TAKEAWAYS FROM Q3/2021 Solid growth in corporate security products • Group revenue grew by 8% which combined with our scalable business model resulted in adjusted EBITDA margin of 19% • The revenue growth from corporate security products accelerated to 13% • In business security software strong
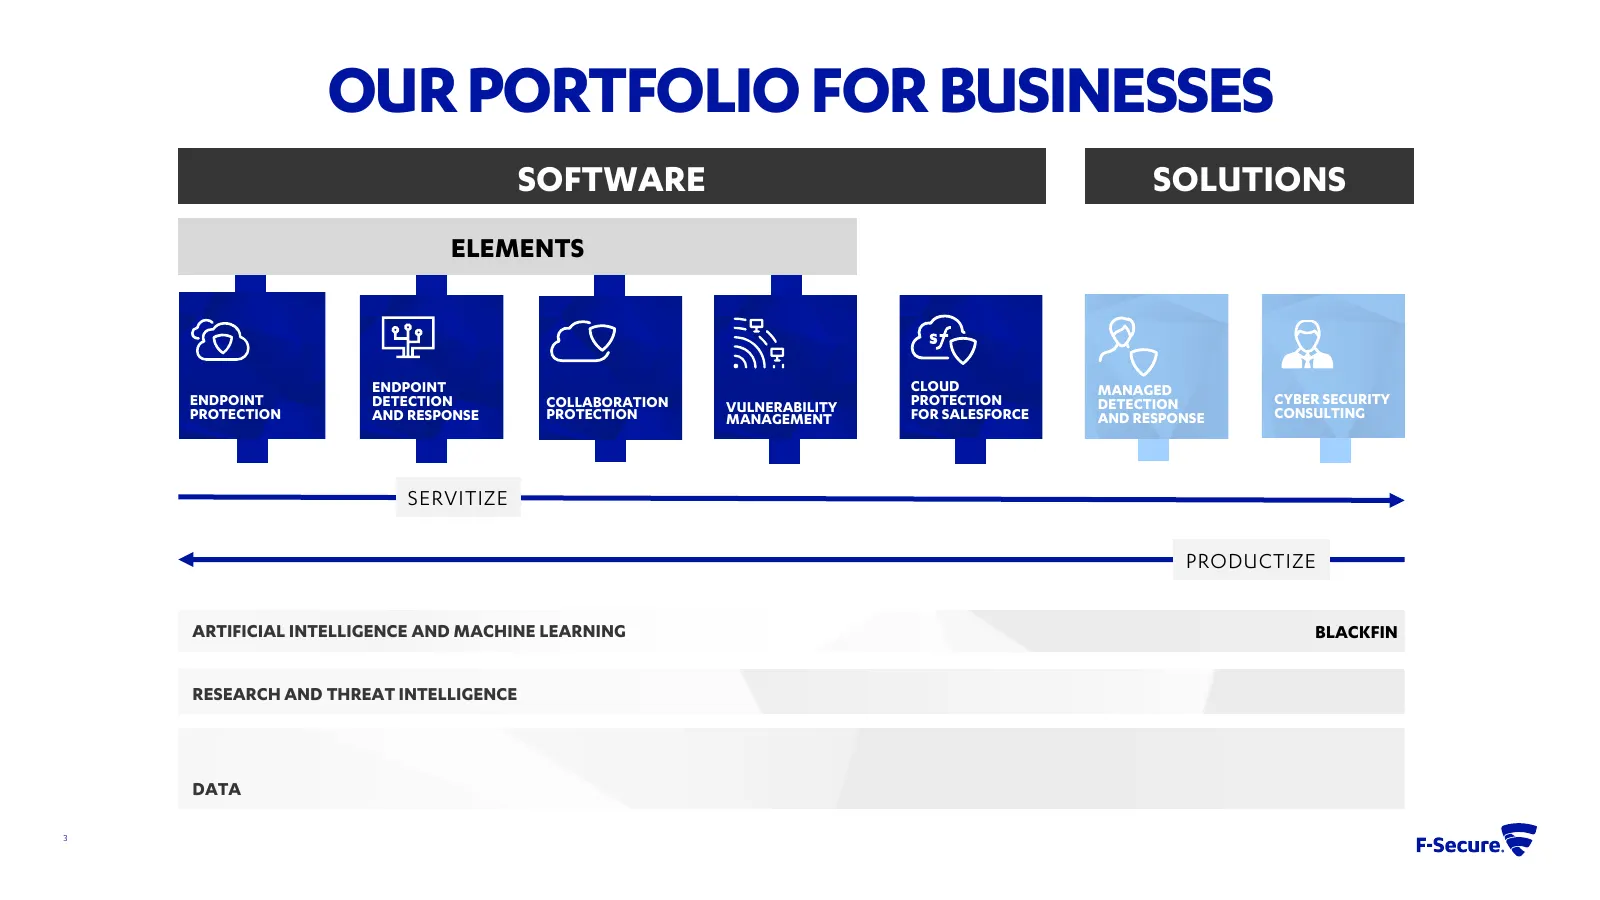
Slide 3: Our Portfolio for Businesses
OUR PORTFOLIO FOR BUSINESSES SOFTWARE SOLUTIONS ELEMENTS ENDPOINT CLOUD CLOUD MANAGED ENDPOINT DETECTION COLLABORATION VULNERABILITY PROTECTION PROTECTION DETECTION CYBER SECURITY PROTECTION AND RESPONSE PROTECTION MANAGEMENT FOR FORSALESFORCE SALESFORCE AND RESPONSE CONSULTING SERVITIZE PRODUCTIZE
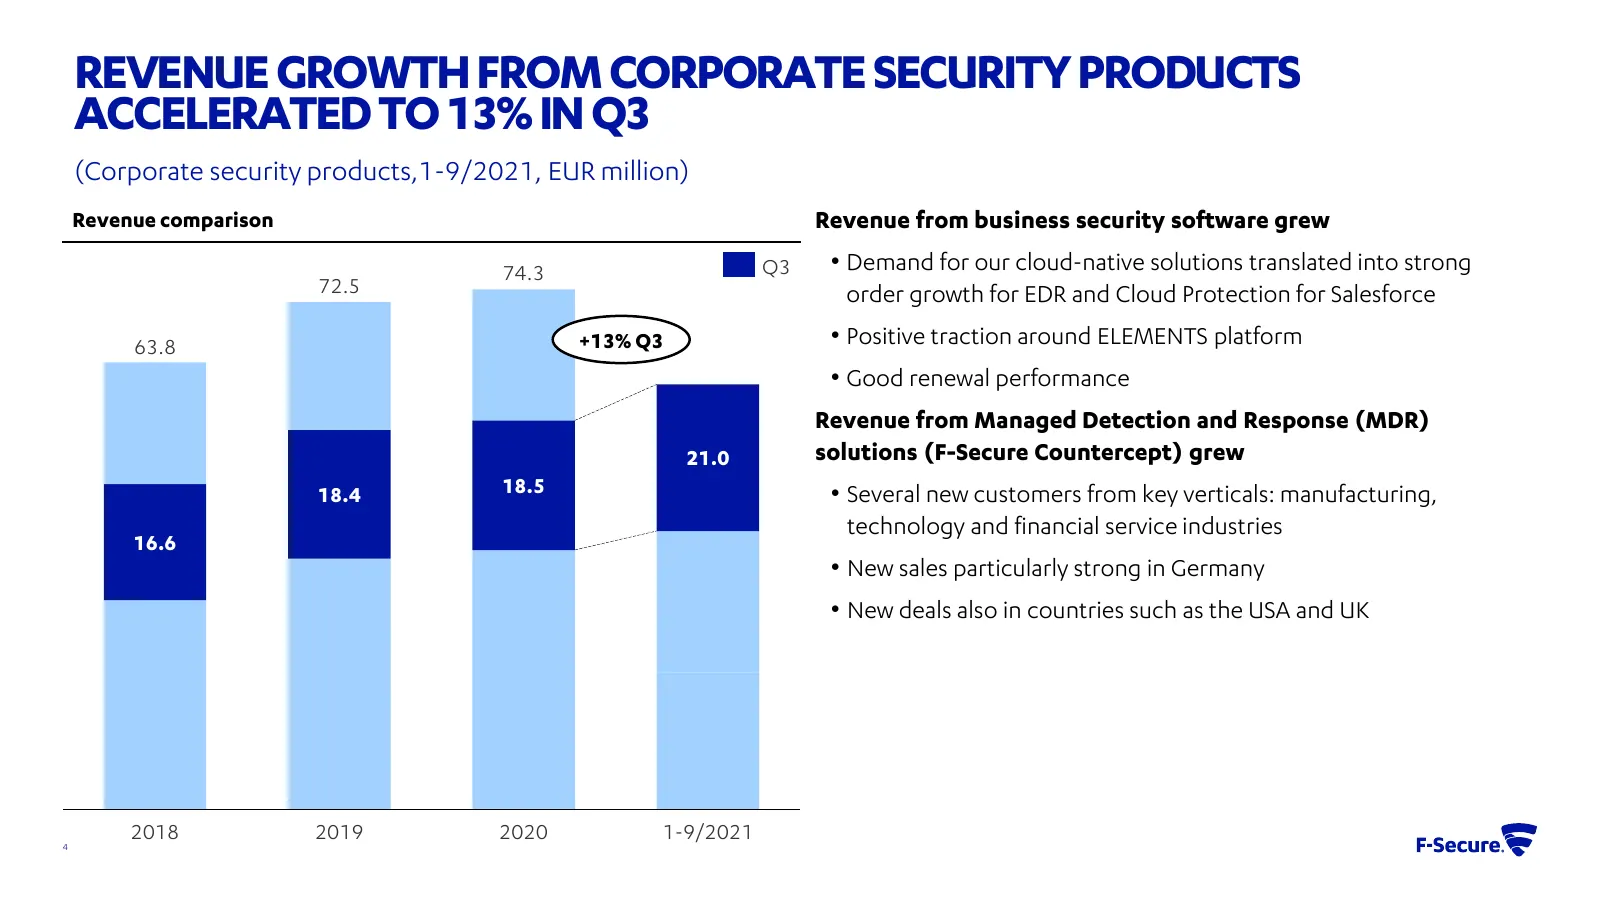
Slide 4: Revenue Growth from Corporate Security Products Accelerated to 13% in Q3
REVENUE GROWTH FROM CORPORATE SECURITY PRODUCTS ACCELERATED TO 13% IN Q3 (Corporate security products,1-9/2021, EUR million) Revenue comparison Revenue from business security software grew 74.3 Q3 • Demand for our cloud-native solutions translated into strong 72.5 order growth for EDR and Cloud Prot
Slide 5: Regional Variations in Cyber Security Consulting Continued
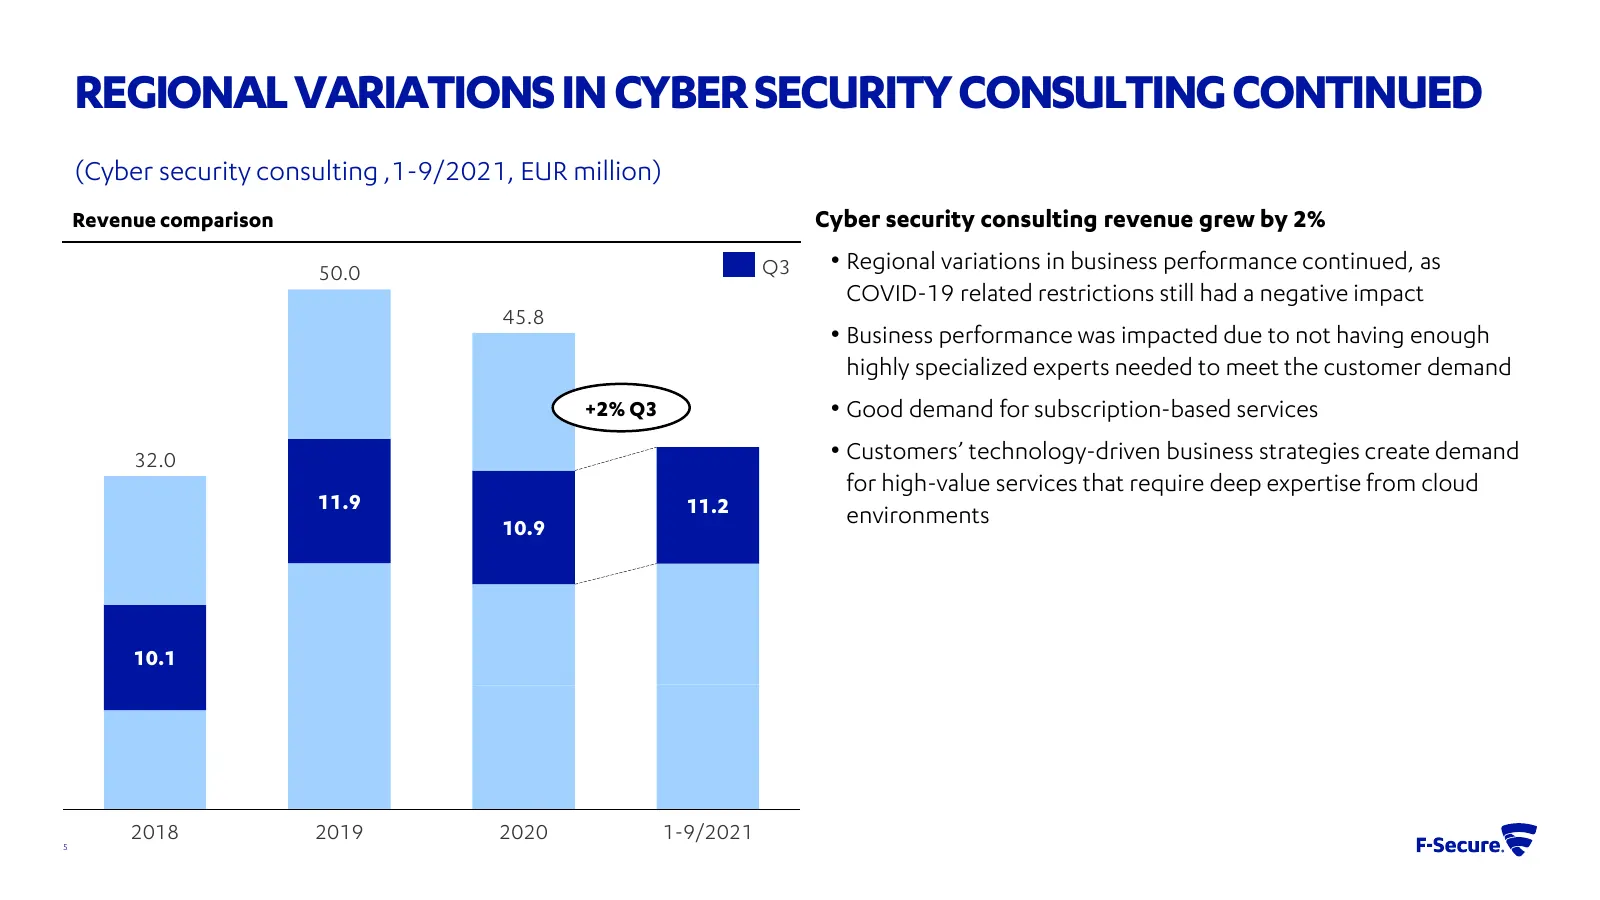
REGIONAL VARIATIONS IN CYBER SECURITY CONSULTING CONTINUED (Cyber security consulting ,1-9/2021, EUR million) Revenue comparison Cyber security consulting revenue grew by 2% 50.0 Q3 • Regional variations in business performance continued, as COVID-19 related restrictions still had a negative impact
Slide 6: Consumer Security Continued on a Growth Path – Revenue Up by 6%
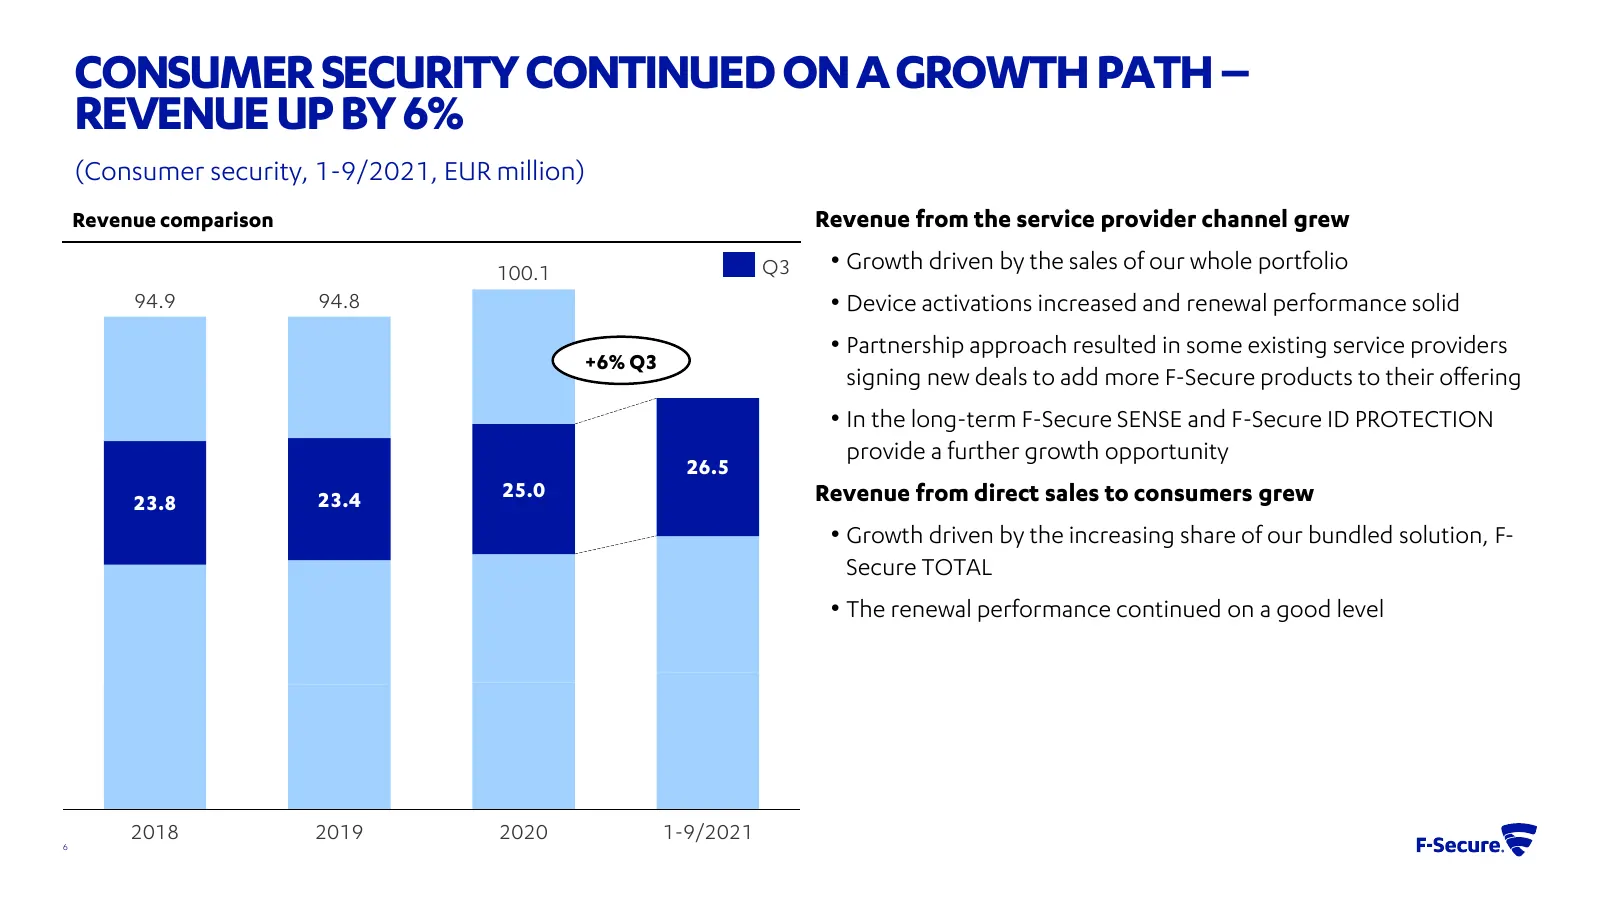
CONSUMER SECURITY CONTINUED ON A GROWTH PATH – REVENUE UP BY 6% (Consumer security, 1-9/2021, EUR million) Revenue comparison Revenue from the service provider channel grew 100.1 Q3 • Growth driven by the sales of our whole portfolio 94.9 94.8 • Device activations increased and renewal performance s
Slide 7: ID Protection - Consumer Behavior and Changes in Operative Landscape Create Business Opportunities
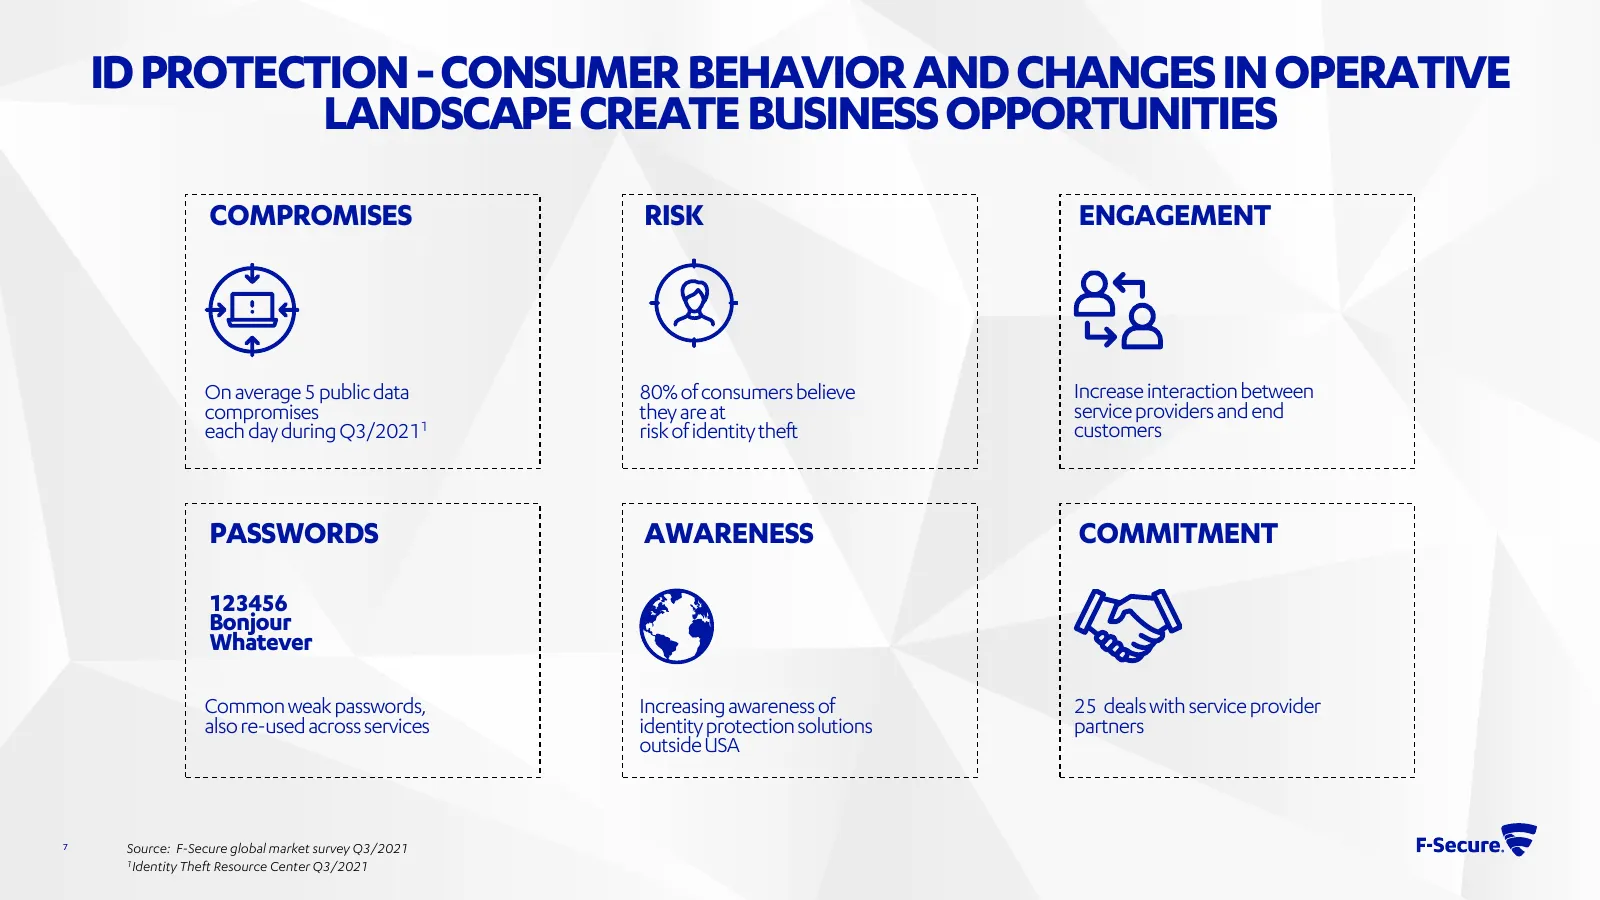
ID PROTECTION -CONSUMER BEHAVIOR AND CHANGES IN OPERATIVE LANDSCAPE CREATE BUSINESS OPPORTUNITIES COMPROMISES RISK ENGAGEMENT On average 5 public data 80% of consumers believe Increase interaction between compromises they are at service providers and end each day during Q3/20211 risk of identity the
Slide 8: F-Secure's 1-9/2021 in Brief
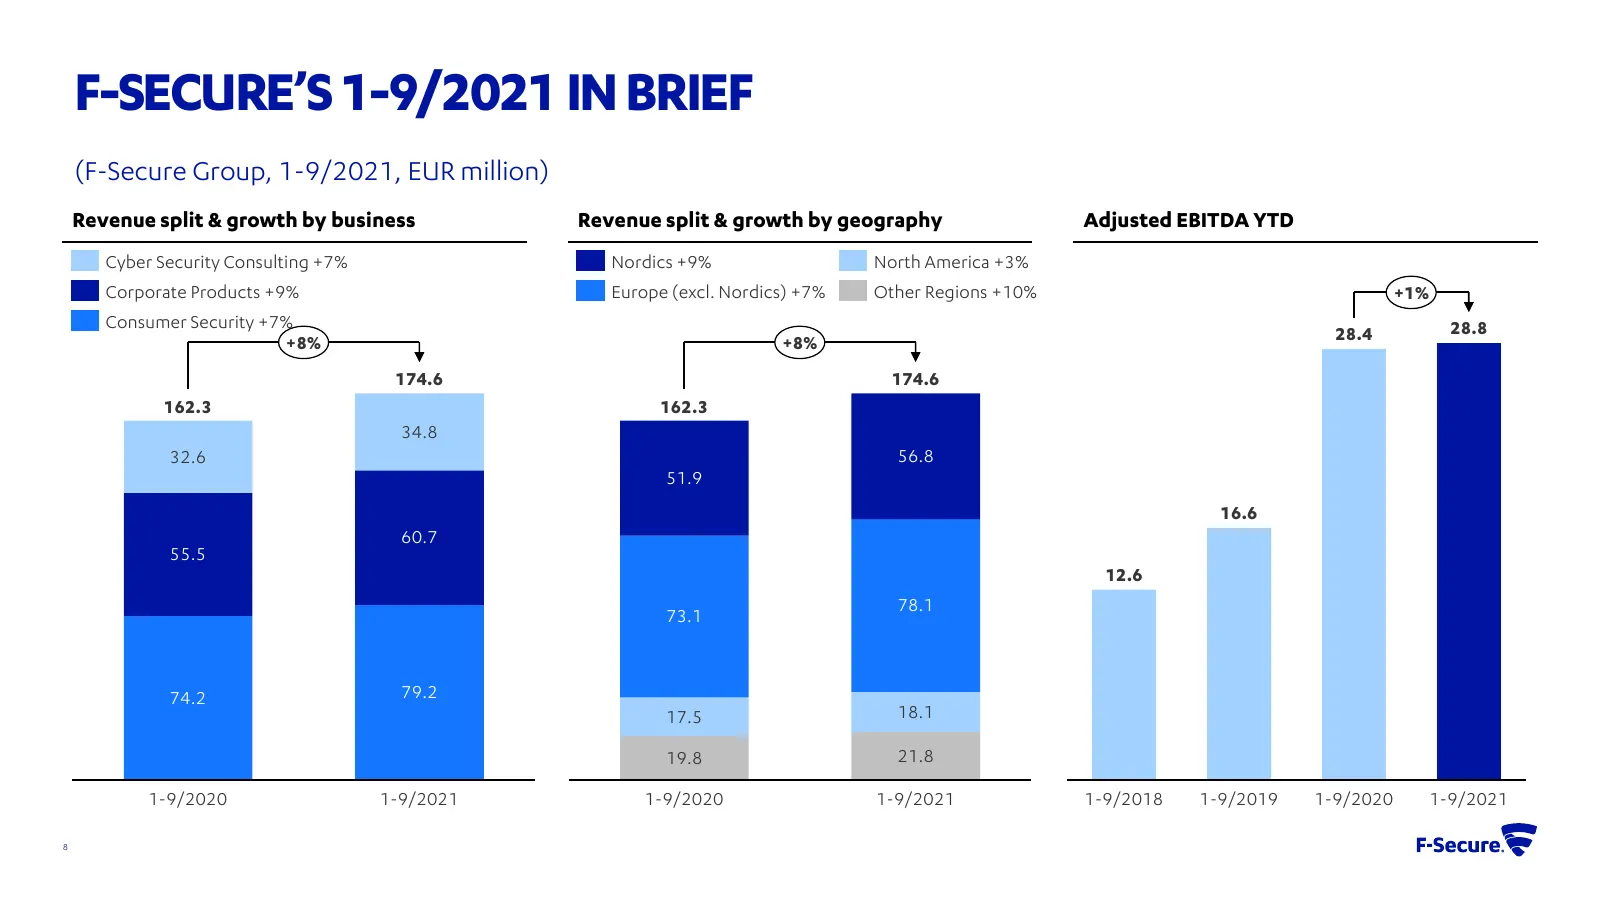
F-SECURE’S 1-9/2021 IN BRIEF (F-Secure Group, 1-9/2021, EUR million) Revenue split & growth by business Revenue split & growth by geography Adjusted EBITDA YTD Cyber Security Consulting +7% Nordics +9% North America +3% Corporate Products +9% Europe (excl. Nordics) +7% Other Regions +10% +1% Consume
Slide 9: Q3 adjusted EBITDA - best performance to date in 2021
Q3 adjusted EBITDA - best performance to date in 2021 Q3/2021 Financial review Tom Jansson, CFO 9
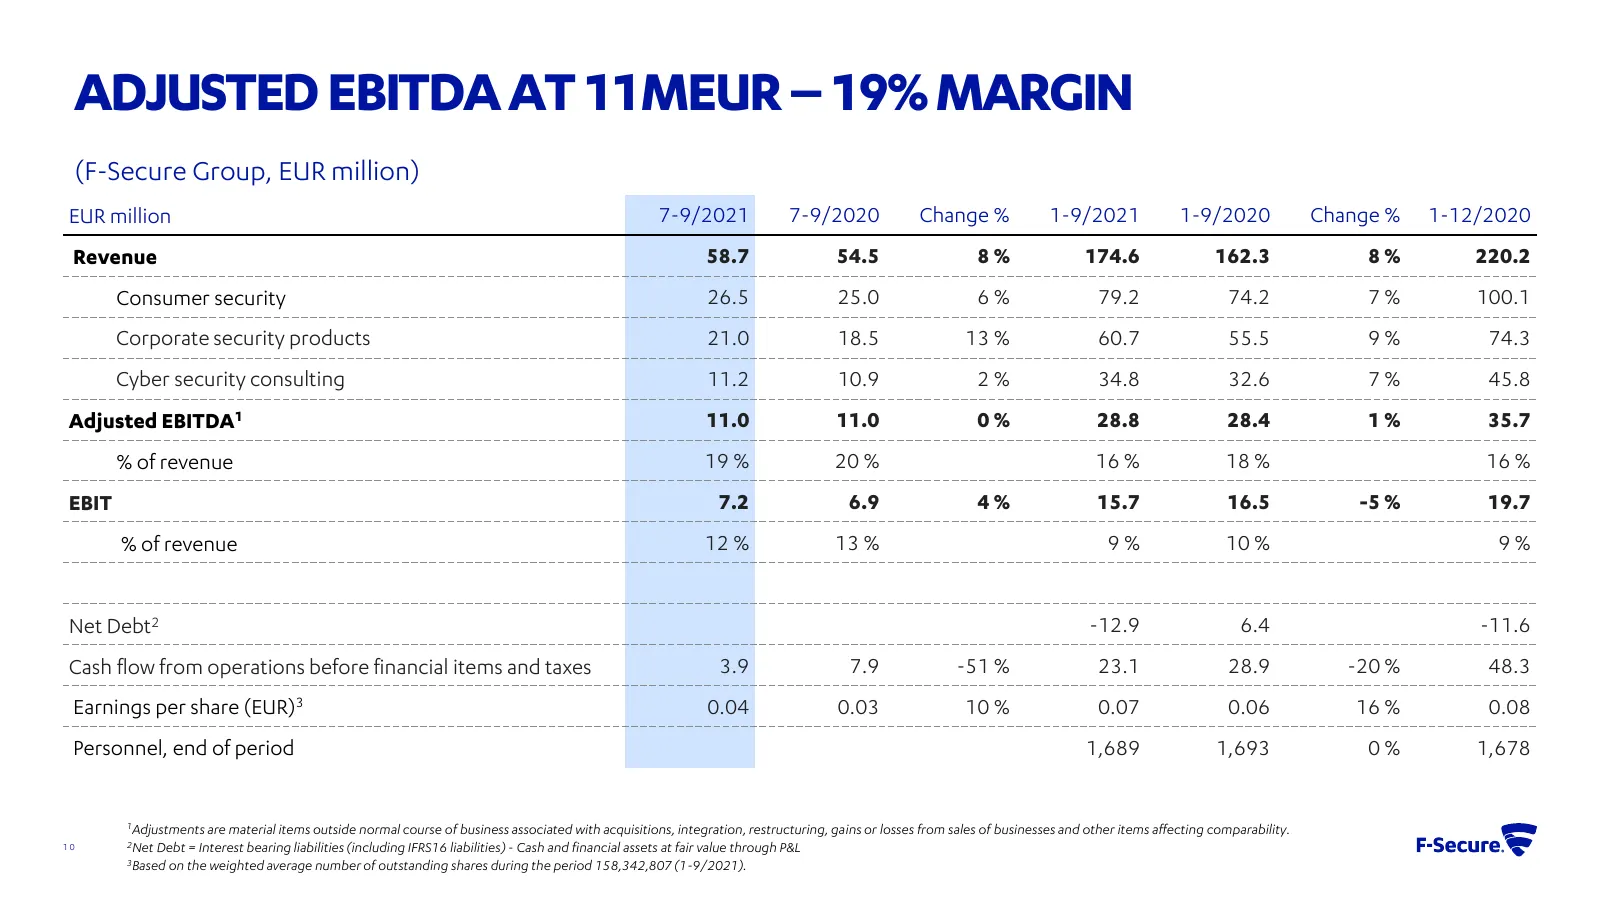
Slide 10: Adjusted EBITDA at 11MEUR – 19% Margin
ADJUSTED EBITDA AT 11MEUR – 19% MARGIN (F-Secure Group, EUR million) EUR million 7-9/2021 7-9/2020 Change % 1-9/2021 1-9/2020 Change % 1-12/2020 Revenue 58.7 54.5 8% 174.6 162.3 8% 220.2 Consumer security 26.5 25.0 6% 79.2 74.2 7% 100.1 Corporate security products 21.0 18.5 13 % 60.7 55.5 9% 74.3 Cy
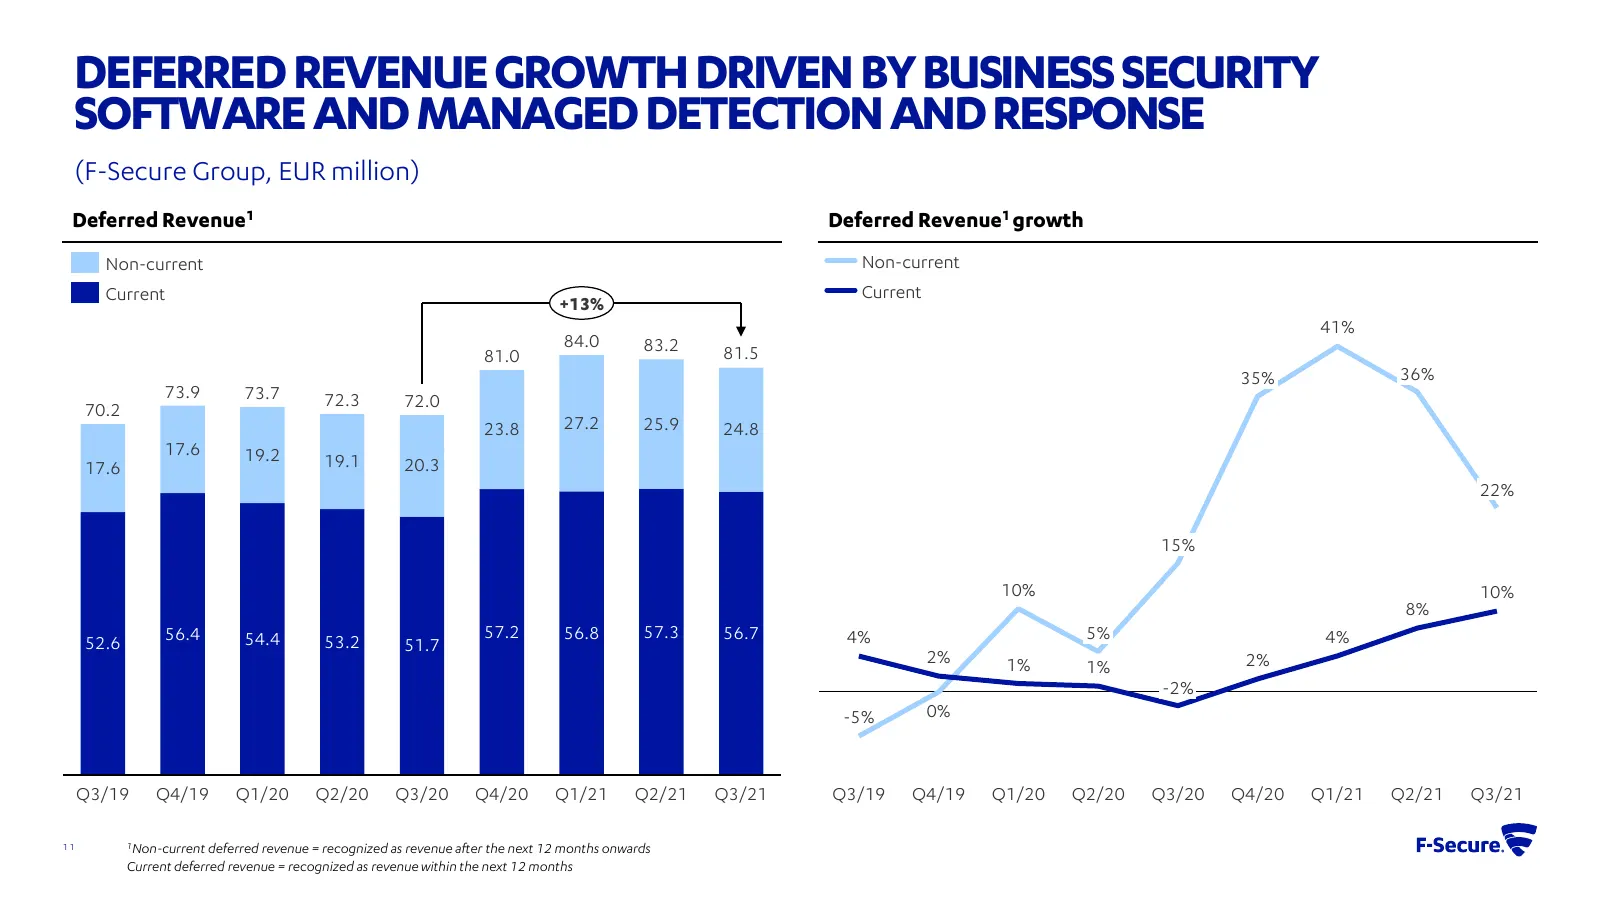
Slide 11: Deferred Revenue Growth Driven by Business Security Software and MDR
DEFERRED REVENUE GROWTH DRIVEN BY BUSINESS SECURITY SOFTWARE AND MANAGED DETECTION AND RESPONSE (F-Secure Group, EUR million) Deferred Revenue1 Deferred Revenue1 growth Non-current Non-current Current Current +13% 41% 84.0 83.2 81.0 81.5 35% 36% 73.9 73.7 72.3 72.0 70.2 23.8 27.2 25.9 24.8 17.6 19.2
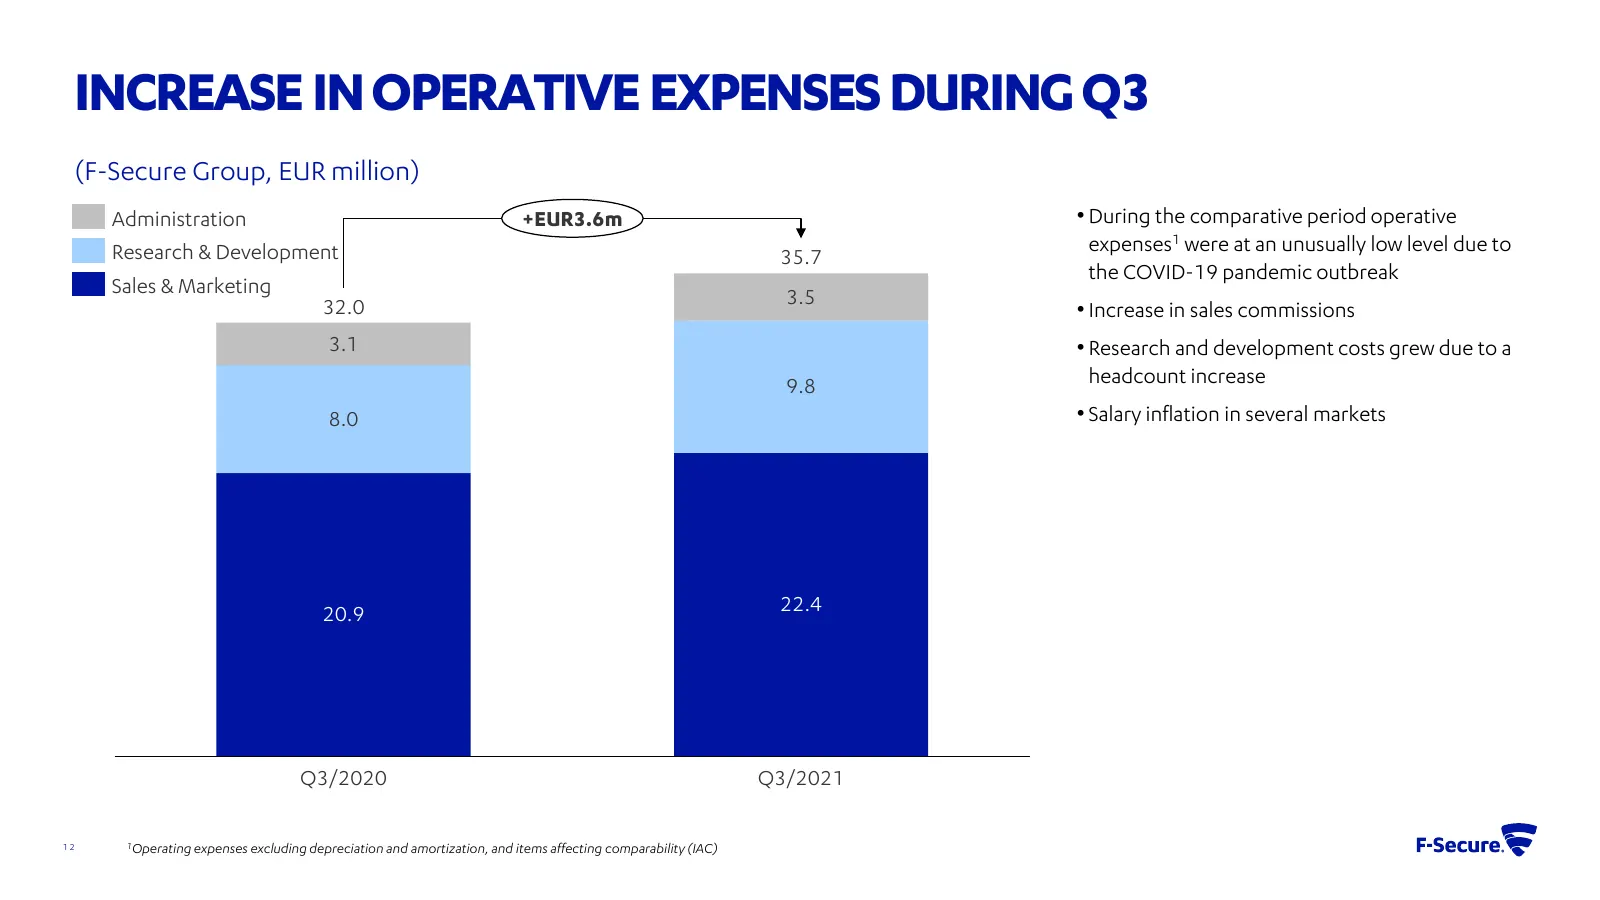
Slide 12: Increase in Operative Expenses During Q3
INCREASE IN OPERATIVE EXPENSES DURING Q3 (F-Secure Group, EUR million) Administration +EUR3.6m • During the comparative period operative Research & Development expenses1 were at an unusually low level due to 35.7 the COVID-19 pandemic outbreak Sales & Marketing 3.5 32.0 • Increase in sales commissio
Slide 13: Profitability Development
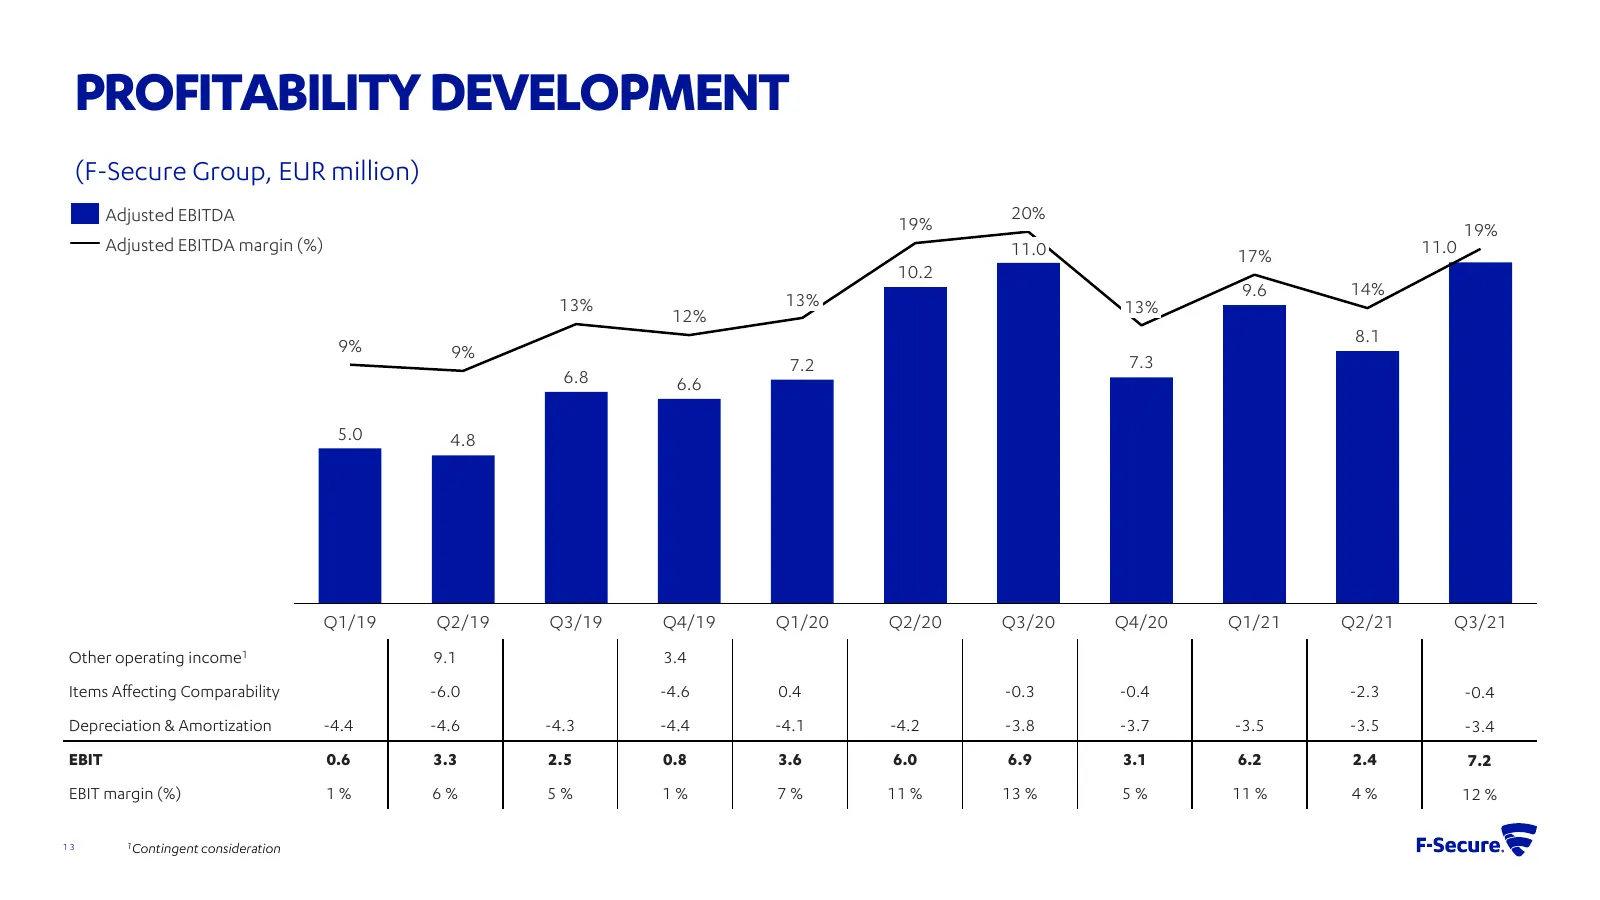
PROFITABILITY DEVELOPMENT (F-Secure Group, EUR million) Adjusted EBITDA 20% 19% 19% Adjusted EBITDA margin (%) 11.0 11.0 17% 10.2 9.6 14% 13% 13% 13% 12% 9% 8.1 9% 7.2 7.3 6.8 6.6 5.0 4.8 Q1/19 Q2/19 Q3/19 Q4/19 Q1/20 Q2/20 Q3/20 Q4/20 Q1/21 Q2/21 Q3/21 Other operating income1 9.1 3.4 Items Affectin
Slide 14: Operative Cash Flow Impacted by Changes in Networking Capital
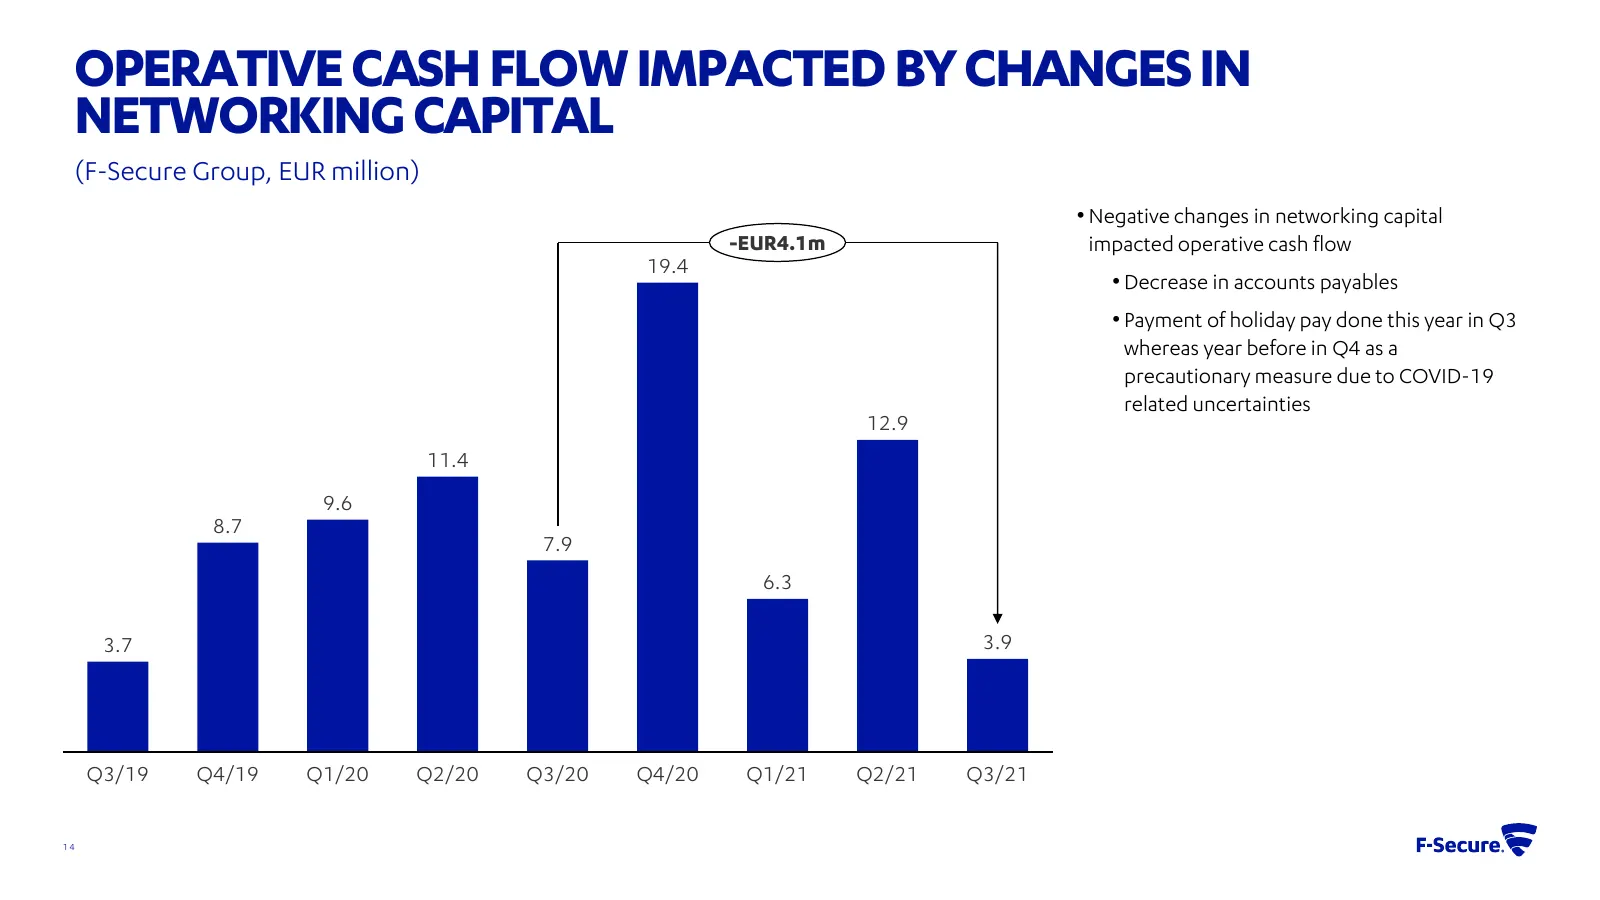
OPERATIVE CASH FLOW IMPACTED BY CHANGES IN NETWORKING CAPITAL (F-Secure Group, EUR million) • Negative changes in networking capital -EUR4.1m impacted operative cash flow 19.4 • Decrease in accounts payables • Payment of holiday pay done this year in Q3 whereas year before in Q4 as a precautionary m
Slide 15: Outlook for 2021 Unchanged
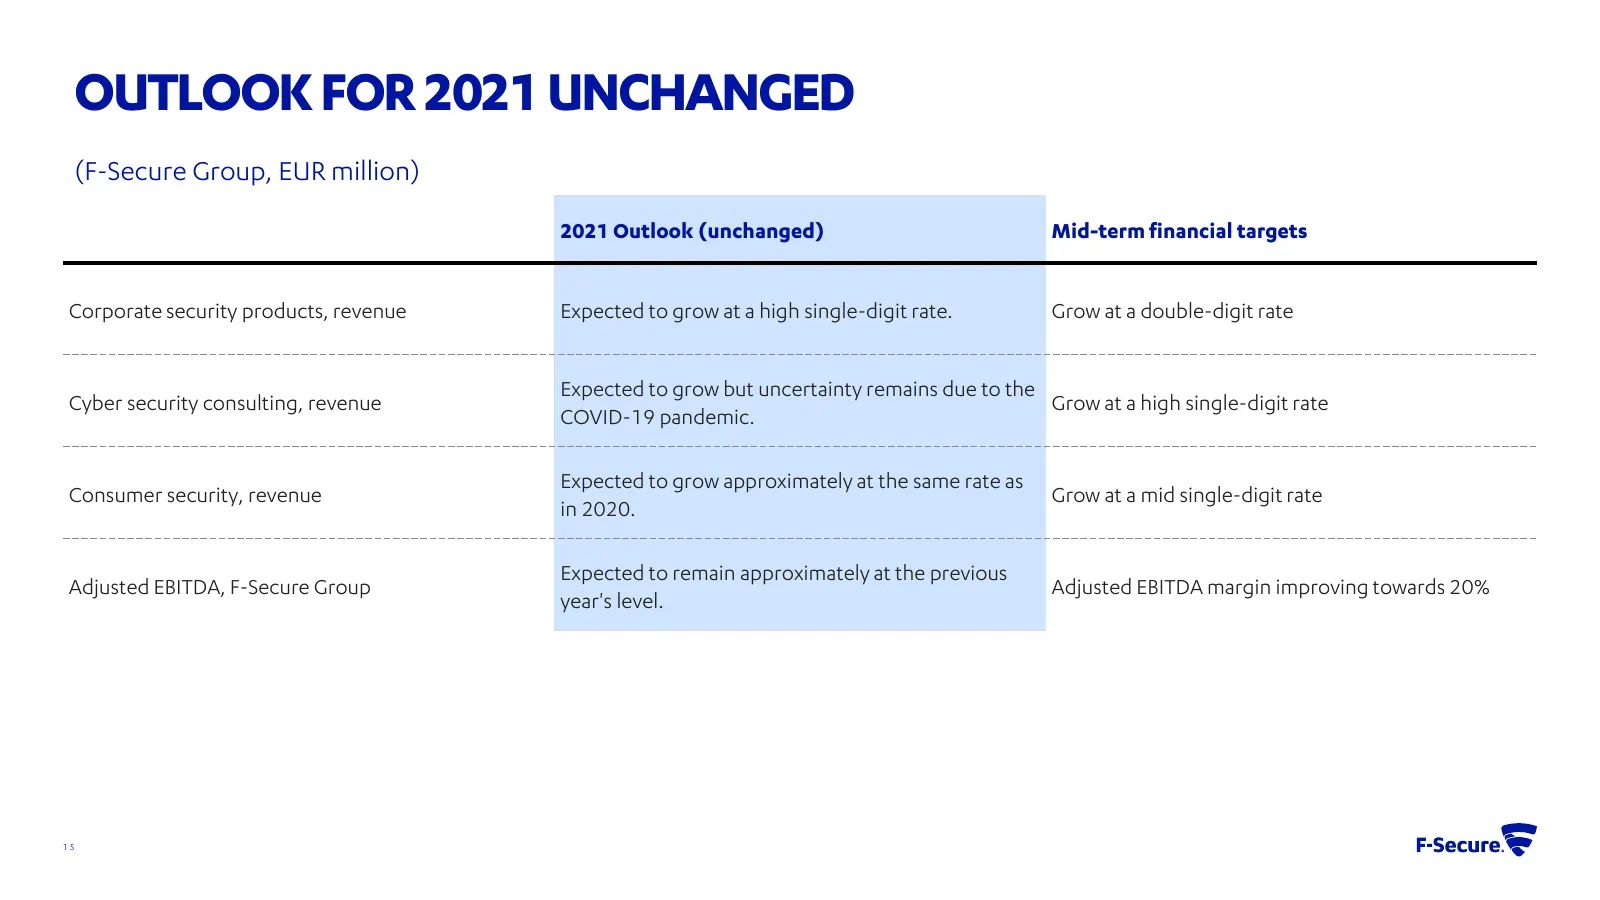
OUTLOOK FOR 2021 UNCHANGED (F-Secure Group, EUR million) 2021 Outlook (unchanged) Mid-term financial targets Corporate security products, revenue Expected to grow at a high single-digit rate. Grow at a double-digit rate Expected to grow but uncertainty remains due to the Cyber security consulting, r

Slide 16: Q&A
Q&A 16

Slide 17: F-Secure
—_ od F-Secure.
Source: Internet Archive copy of f-secure.com
More decks from F-Secure Oyj
 Q3 2026 Earnings Presentation23 slides · Oct 28, 2026
 Q2 2026 Earnings Presentation20 slides · Jul 17, 2026
 Investor Day (June 2026)42 slides · Jun 4, 2026
 Q1 2026 Earnings Presentation19 slides · Apr 29, 2026
 Q4 2025 Earnings Presentation29 slides · Feb 5, 2026
 Q3 2025 Earnings Presentation18 slides · Oct 28, 2025