Commercial Capital Bancorp Inc
Commercial Capital Bancorp — Merger or Acquisition (February 2004)
39 slides from Commercial Capital Bancorp's merger presentation, Feb 24, 2004
Slide 1: Powerful Synergies
Powerful Synergies February 24, 2004
Slide 2: Forward-looking statements / Regulation FD
This presentation may include forward-looking statements (related to the plans, beliefs and goals of CCBI and its subsidiaries), which involve certain risks and uncertainties that could cause actual results to differ materially from those in the forward-looking statements. Such risks and uncertainti
Slide 3: Forward Looking Statements
Forward Looking Statements This presentation contains forward-looking statements regarding CCBI's acquisition of Hawthorne. These forward-looking statements involve certain risks and uncertainties. Factors that may cause actual results to differ materially from those contemplated by such forward-loo
Slide 4: CCBI Highlights
CCBI Highlights Financial Position December 31, 2003 Total Assets $1.72 billion Loans Held for Investment $1.05 billion Deposits $646 million Equity $102 million Tangible Equity $89 million Quarter Ended Quarter Ended Financial Results 12/31/2003 12/30/2002 Net Income $6.2 million $3.2 million Retur
Slide 5: Summary of the Proposed Transaction
Summary of the Proposed Transaction Fixed Exchange Ratio: 1.933 shares of CCBI for each share of HTHR Purchase price per HTHR share: $37.92 (based on 1/27/04 closing price of CCBI) Aggregate purchase price: $493 million, fully diluted Structure: 100% Stock – tax free exchange Anticipated closing: Mi
Slide 6: Strategically Compelling
Strategically Compelling CCBI Hawthorne Franchise positioned for stronger growth Leading statewide lender High quality asset generator Fastest growing bank in CA, with very efficient deposit franchise (1) Third largest originator of multi- family loans in CA (2) Amongst the most efficient operations
Slide 7: Pro Forma Impact – Key Assumptions
Pro Forma Impact – Key Assumptions CCBI earnings based on First Call estimates 2004 GAAP EPS of $1.06 for CCBI 2005 GAAP EPS of $1.62 for CCBI Hawthorne earnings based on First Call estimates 2004 GAAP EPS of $2.43 for HTHR 2005 GAAP EPS of $2.68 for HTHR Upfront transaction charges of approximately
Slide 8: Acquisition Benefits
Acquisition Benefits (1) Assumptions and calculations for the pro forma GAAP and cash EPS for 2004 are outlined in our presentation on the Hawthorne acquisition, dated January 27, 2004. Immediately accretive to CCBI Pro Forma GAAP (12%) and cash (13%) EPS (1) Immediately accretive to CCBI Pro Forma
Slide 9: Low Risk Transaction
Low Risk Transaction CCBI team has significant acquisition and integration experience Hawthorne team successfully integrated First Fidelity No expected branch consolidations CCBI to migrate to majority of HTHR systems
Slide 10: CCBI's Growing Franchise Presence
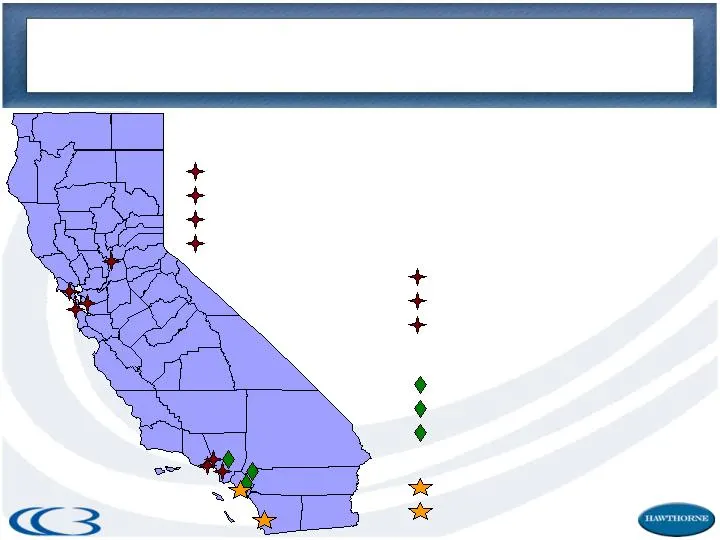
CCBI’s Growing Franchise Presence Northern California Loan Offices Sacramento Corte Madera (Marin County) Burlingame Oakland Southern California Loan Offices Woodland Hills Encino West Los Angeles Banking Offices Rancho Santa Margarita Riverside Beverly Hills (Summer 2004) Banking & Loan Offices Irv
Slide 11: CCBI and HTHR Deposit Franchise
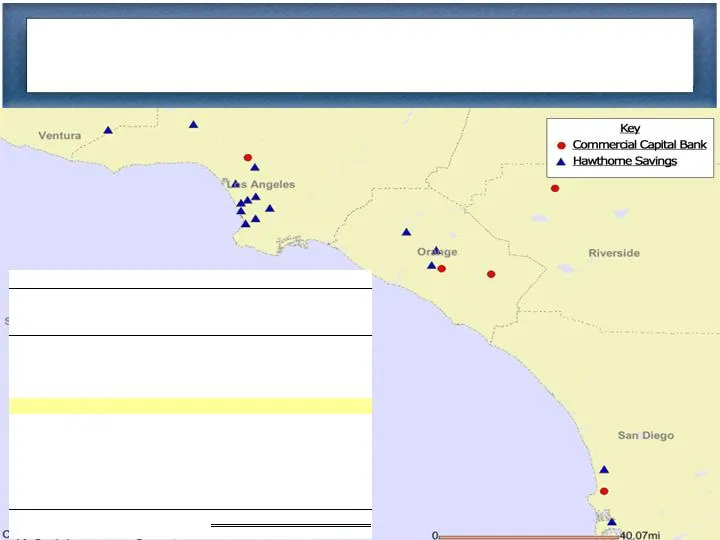
CCBI and HTHR Deposit Franchise Hawthorne's South Bay Deposit Strength as of June 30, 2003 (dollars in thousands) Institution Ranking Deposits % of Total Bank of America 3,518,813 $ 21.8% WAMU 2,451,676 15.2% Wells Fargo 1,561,296 9.7% Union Bank 1,258,488 7.8% Hawthorne Savings 986,421 6.1% Citigro
Slide 12: Combined Statewide Presence
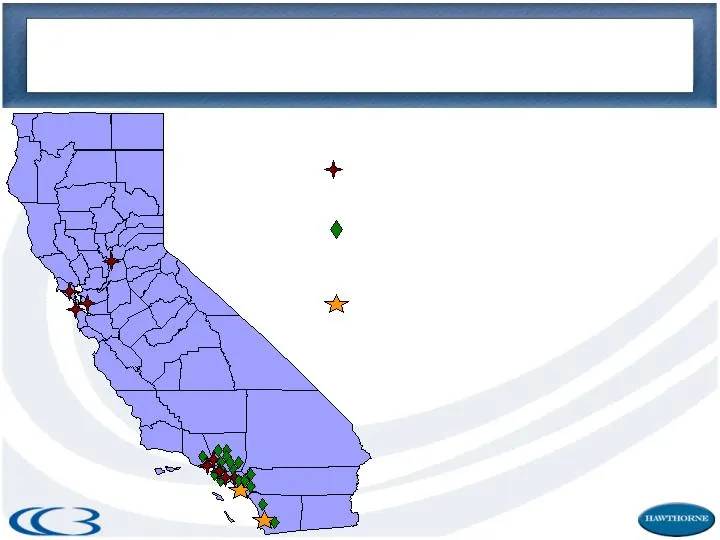
Combined Statewide Presence 9 Loan Offices 17 Banking Offices (#18 in Beverly Hills scheduled to open in Summer 2004) 2 Banking & Loan Offices
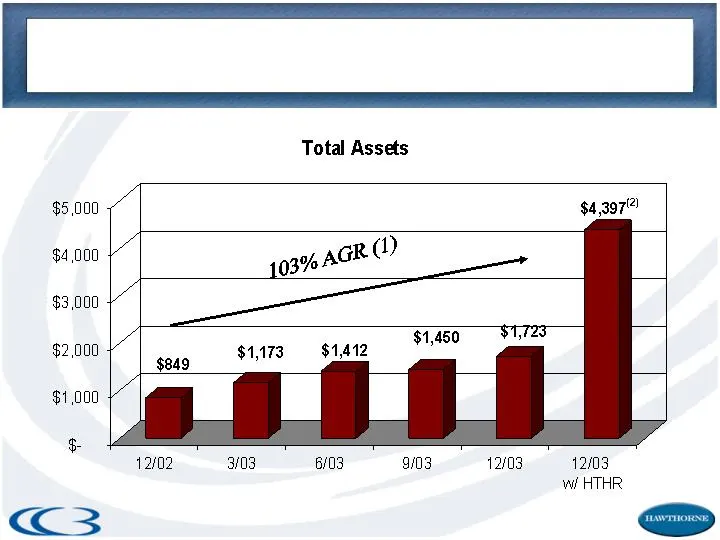
Slide 13: Balance Sheet Growth
(1) AGR – Annual Growth Rate: 12/02 to 12/03 (2)Does not reflect potential purchase accounting adjustments. ($ in millions) Balance Sheet Growth
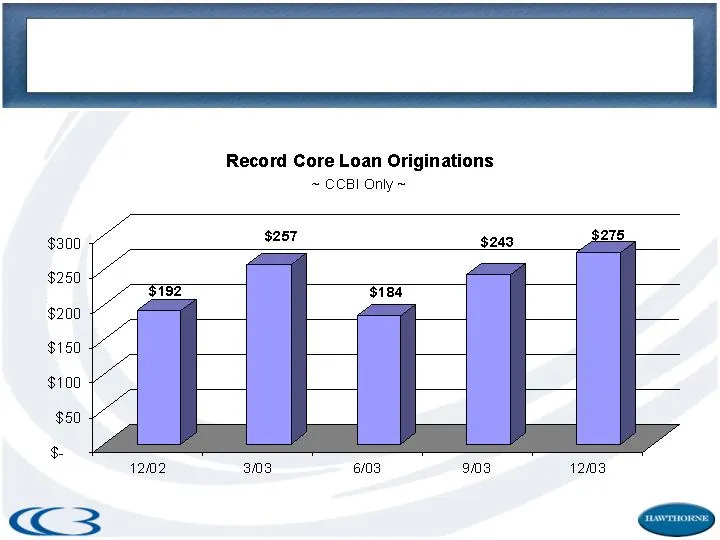
Slide 14: Balance Sheet Growth Generated Internally
Balance Sheet Growth Generated Internally ($ in millions)
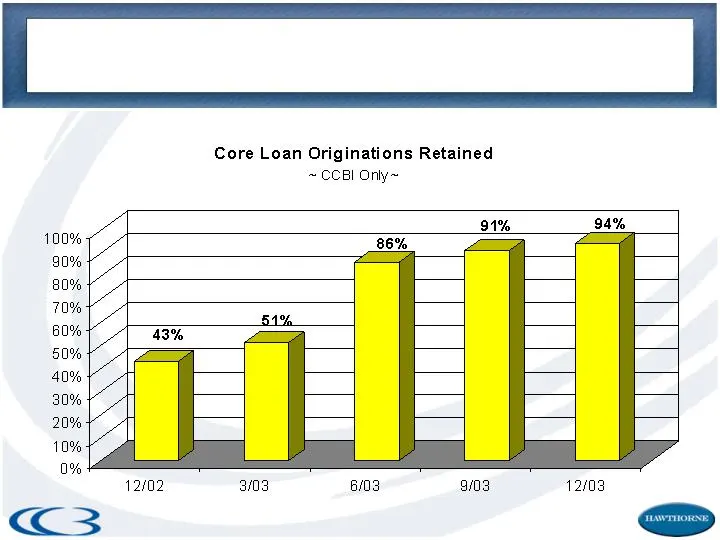
Slide 15: Historic Driver of Balance Sheet Growth
Historic Driver of Balance Sheet Growth
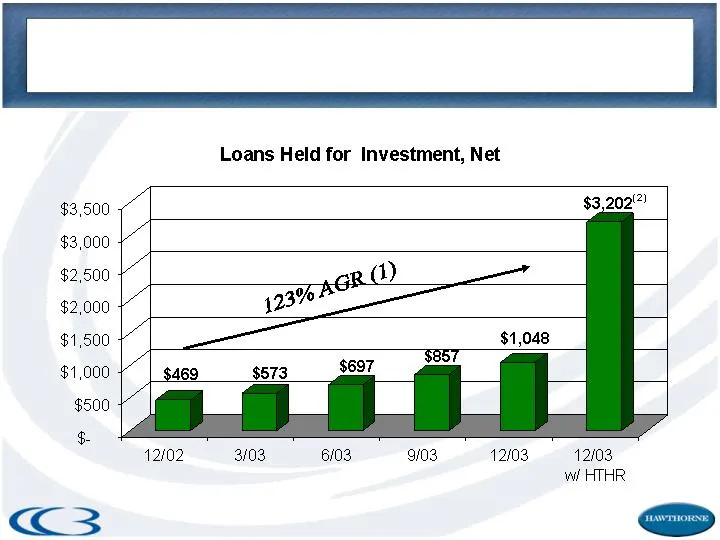
Slide 16: Balance Sheet Growth
($ in millions) Balance Sheet Growth (1) AGR – Annual Growth Rate: 12/02 to 12/03 (2)Does not reflect potential purchase accounting adjustments.
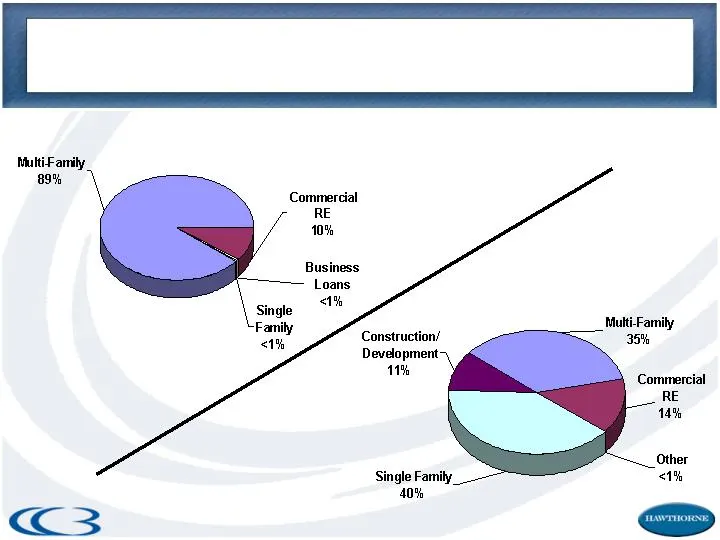
Slide 17: Loan Portfolio Mix
Loan Portfolio Mix CCBI at 12/31/2003 HTHR at 12/31/2003
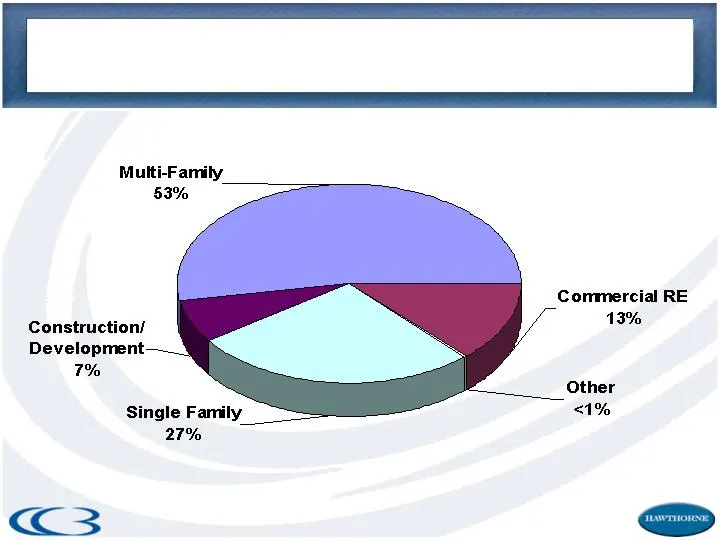
Slide 18: Loan Portfolio Mix
Loan Portfolio Mix CCBI & HTHR Combined (1) at 12/31/2003 (1)Does not reflect potential purchase accounting adjustments.
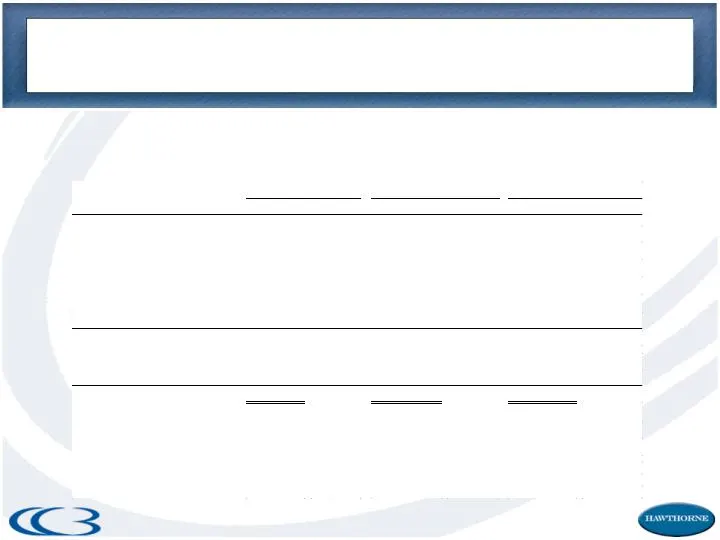
Slide 19: Strategically Compelling
Strategically Compelling More diversified loan portfolio with core multi-family driver - Reserve coverage remains very strong Loan Portfolio ($ in millions) $ % $ % $ % Loans Single Family $3.2 0.3% $864.5 39.8% $867.7 26.9% Multi-Family 935.1 88.8% 764.1 35.1% 1,699.2 52.7% Commercial Real Estate 1
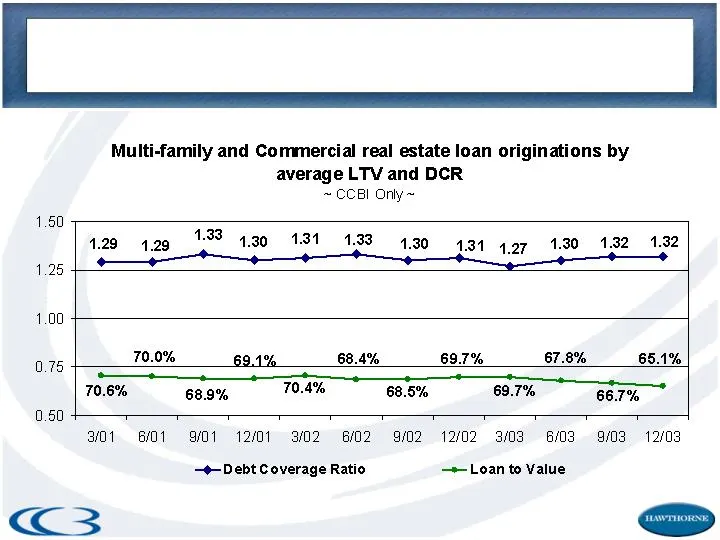
Slide 20: Multi-family and Commercial RE originations by LTV and DCR
Multi-family and Commercial real estate loan originations by average LTV and DCR ~ CCBI Only~ 1.60 129 429 133 130 131 133) 430 431 427 130 182 1.32 124° san ame =e a 1.00 any 70.0% 69.1% 68.4% 697% 67.8% 65.1% a a ee 70.6% 68.9% 70.4% 68.5% 69.7% 66.7% 0.80 a1 a1 9/01 12/01 9/02 82 9/02 12/02 a3 6/
Slide 21: Multi-Family and Commercial RE LTV and DCR
Multi-Family Loan to Value 69.2% Debt Coverage Ratio 1.29:1 Commercial RE Loan to Value 65.6% Debt Coverage Ratio 1.35:1 Values are weighted average ratios, at origination LTV and DCR of December 31, 2003 Portfolio ~ CCBI Only ~
Slide 22: Asset Quality of Multi-family Loans
Noncurrent Loans/ Nationwide Total Loans (1) Multi-family 0.16% Single family 0.85% Commercial Real Estate 1.03% Construction and Land Loans 1.14% Business Loans 1.52% Consumer 0.69% Multi-family Loans CCBI 0.00% Western Region Thrifts 0.07% Nationwide Thrifts 0.16% (1) Based upon 9/30/03 Thrift Fin
Slide 23: Funding Asset Growth
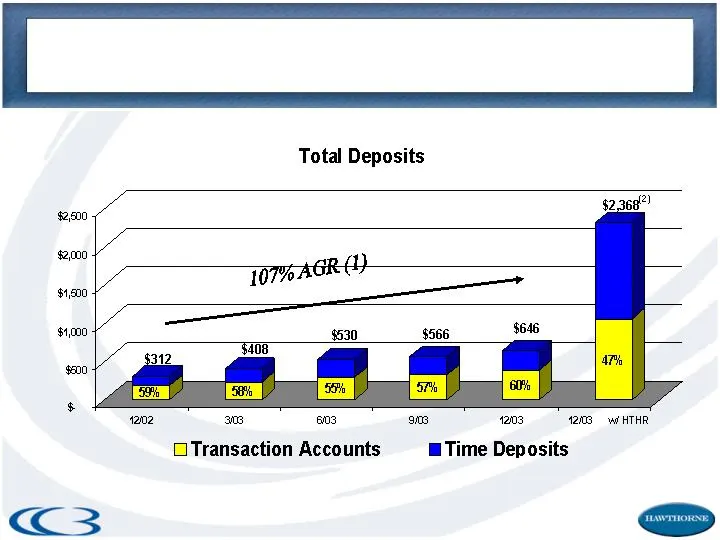
($ in millions) Funding Asset Growth (1) AGR – Annual Growth Rate: 12/02 to 12/03 (2) Does not reflect potential purchase accounting adjustments.
Slide 24: Funding Structure
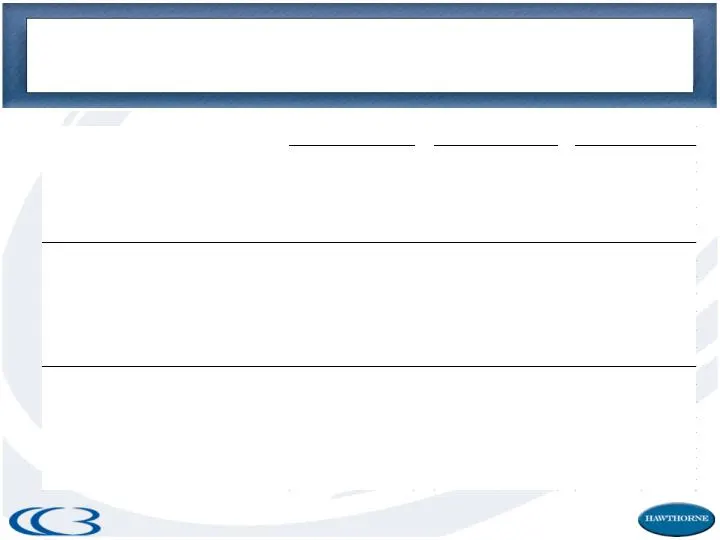
Strategically Compelling Funding Structure ($ in millions) $ % $ % $ % Deposits Noninterest-bearing Demand $13.1 2.0% $51.7 3.0% $64.8 2.7% Interest-bearing Demand, Savings, MMDA 375.0 58.1% 668.1 38.8% 1,043.1 44.1% Time Deposits 257.5 39.9% 1,002.8 58.2% 1,260.3 53.2% Total Deposits $645.6 100.0%
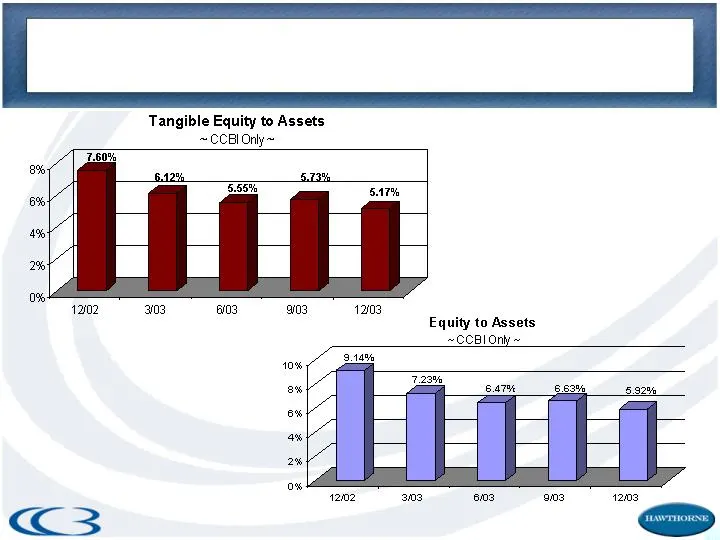
Slide 25: Tangible Equity to Assets
Tangible Equity to Assets ~CCBIOny~ 102 03 03 03 1003 Equity to Assets ~CCBI Only ~ pen 10% 2% 6% 4% 2% 0% 1202 303 6103 m3 1203
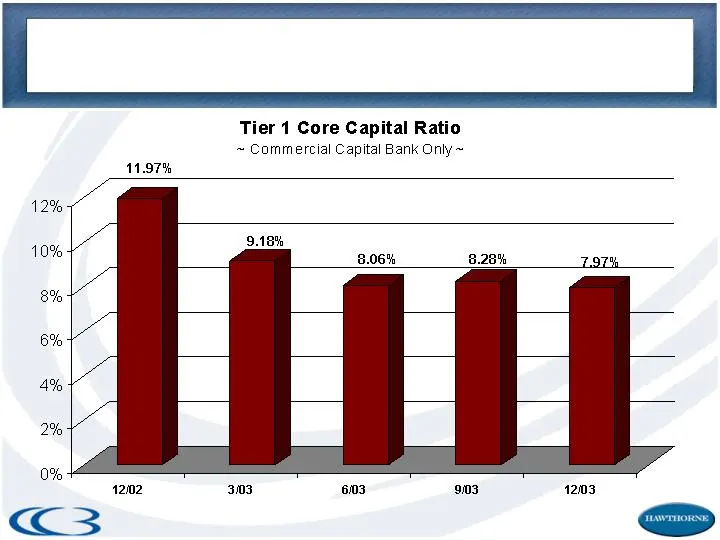
Slide 26: Tier 1 Core Capital Ratio
Tier 1 Core Capital Ratio ~ Commercial Capital Bank Only ~ 11.97% 1202 303 6103 9103 1203
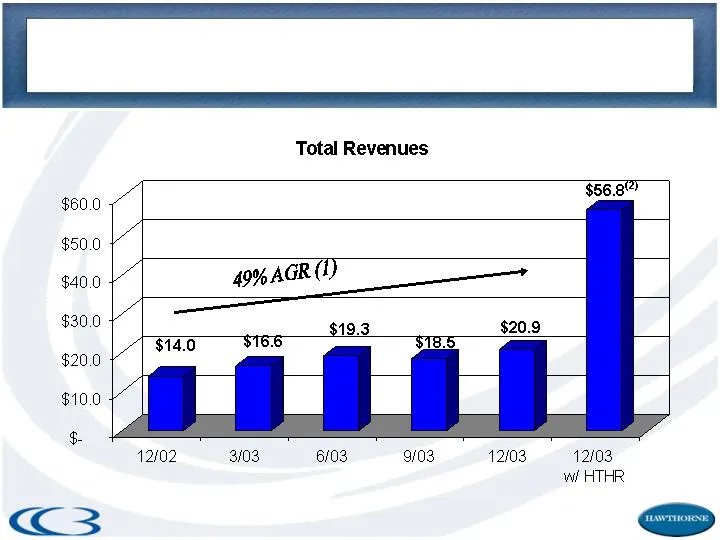
Slide 27: Operating Performance
Operating Performance ($ in millions) (1) AGR – Annual Growth Rate: 12/02 to 12/03 (2) Combination of HTHR and CCBI results from the fourth quarter of 2003. Does not reflect potential purchase accounting adjustments.
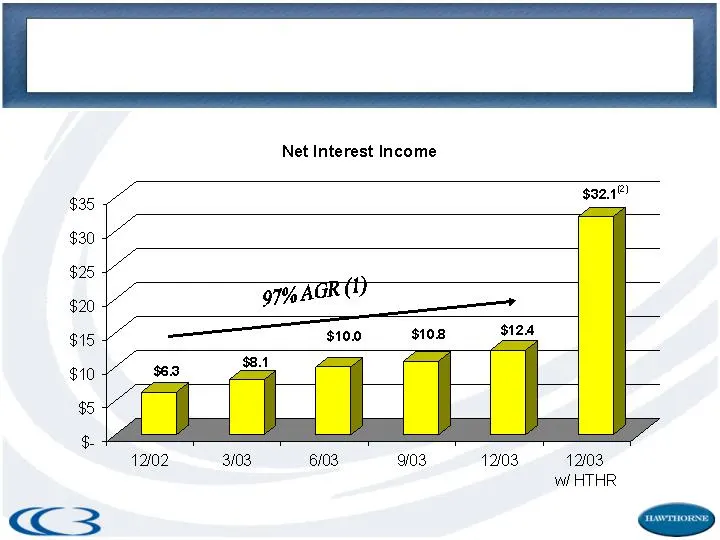
Slide 28: Operating Performance
($ in millions) Operating Performance (1) AGR – Annual Growth Rate: 12/02 to 12/03 (2) Combination of HTHR and CCBI results from the fourth quarter of 2003. Does not reflect potential purchase accounting adjustments.
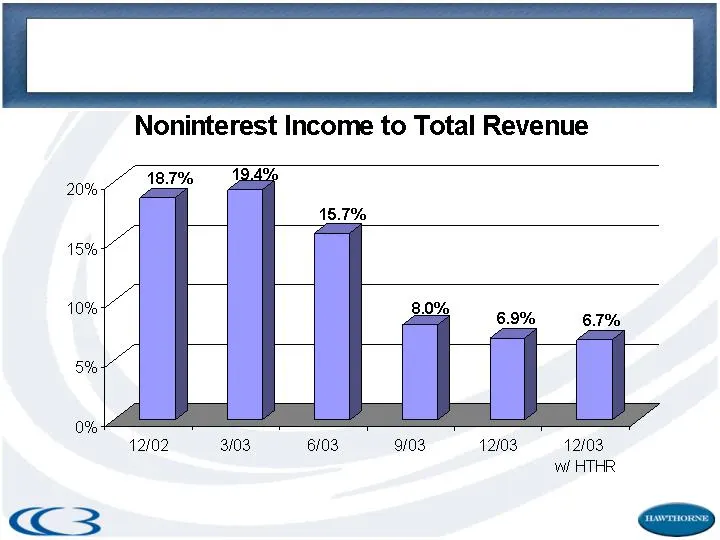
Slide 29: Operating Performance
Operating Performance (1) Combination of HTHR and CCBI results from the fourth quarter of 2003. Does not reflect potential purchase accounting adjustments.
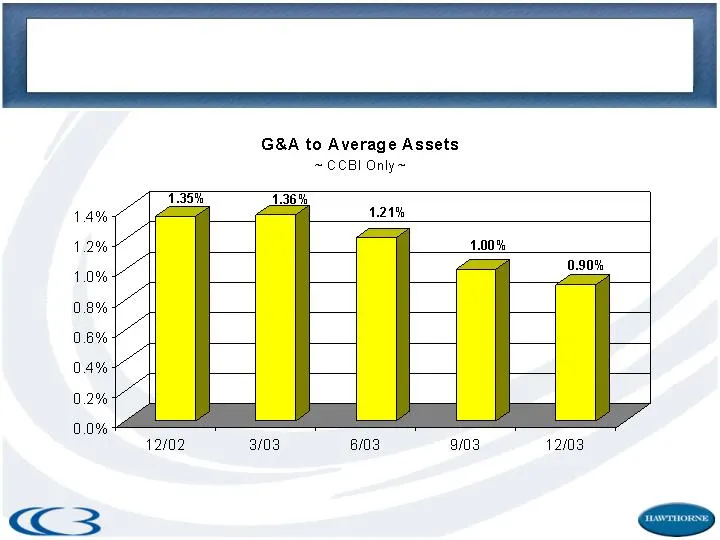
Slide 30: Operating Performance Ratios
Operating Performance Ratios
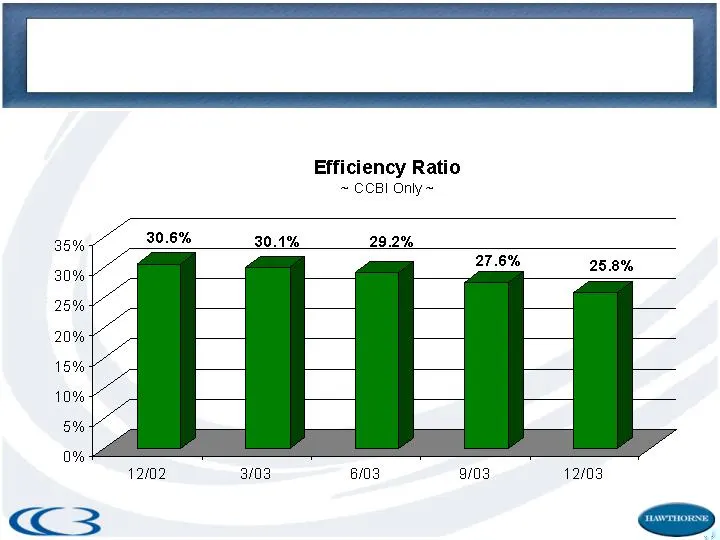
Slide 31: Operating Performance Ratios
Operating Performance Ratios
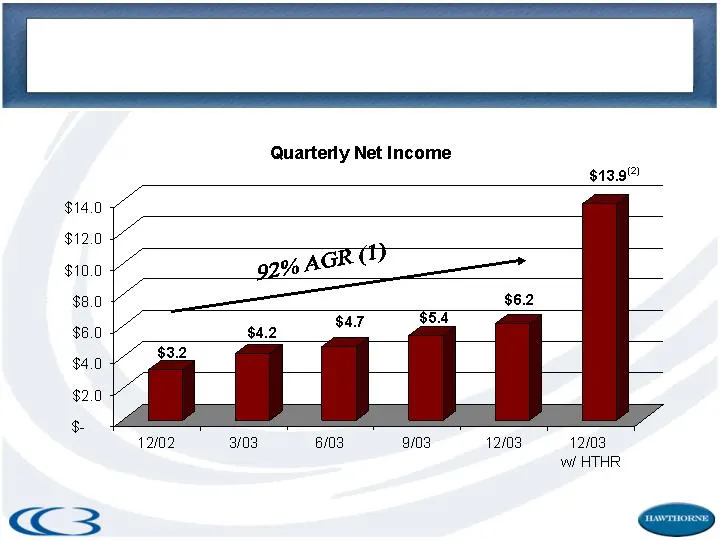
Slide 32: Earnings Performance
($ in millions) Earnings Performance (1) AGR – Annual Growth Rate: 12/02 to 12/03 (2) Combination of HTHR and CCBI results from the fourth quarter of 2003. Does not reflect potential purchase accounting adjustments.
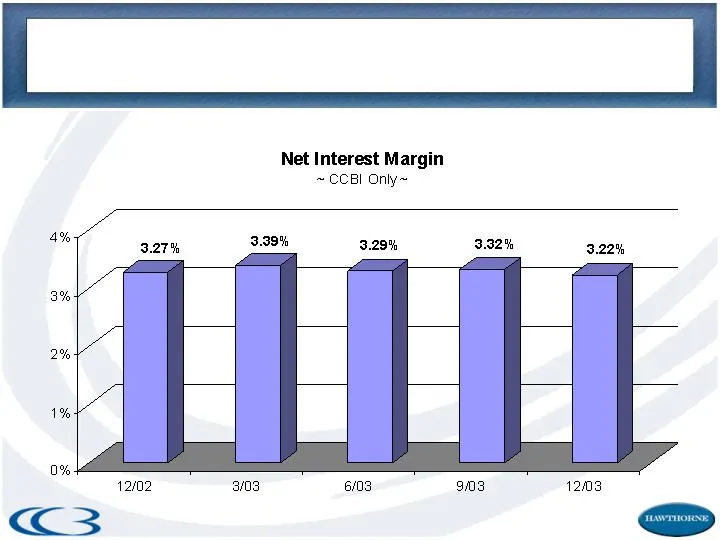
Slide 33: Net Interest Margin
4% 3% 2% 1% 0% <K Net Interest Margin ~ CCBI Only~ 1202 3/03 6/03 903 12103 2 S>
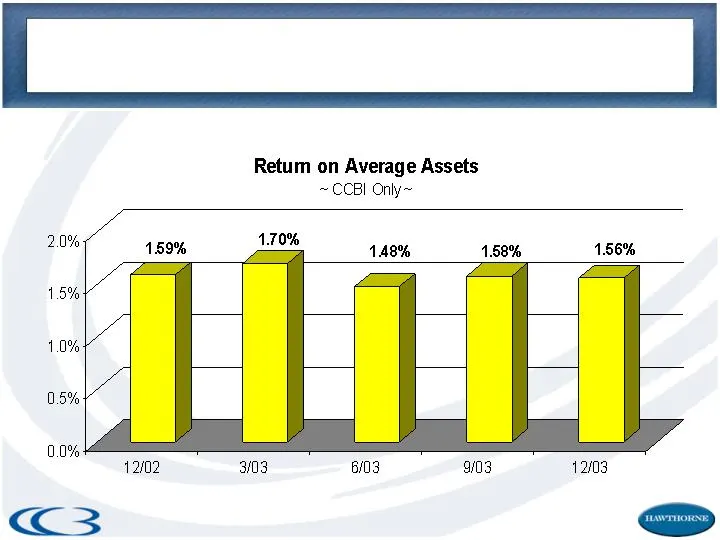
Slide 34: Return on Average Assets
Retum on Average Assets ~CCBI Only~ 148% 158% 156% 12/02 303 6/03 9/03 12/03
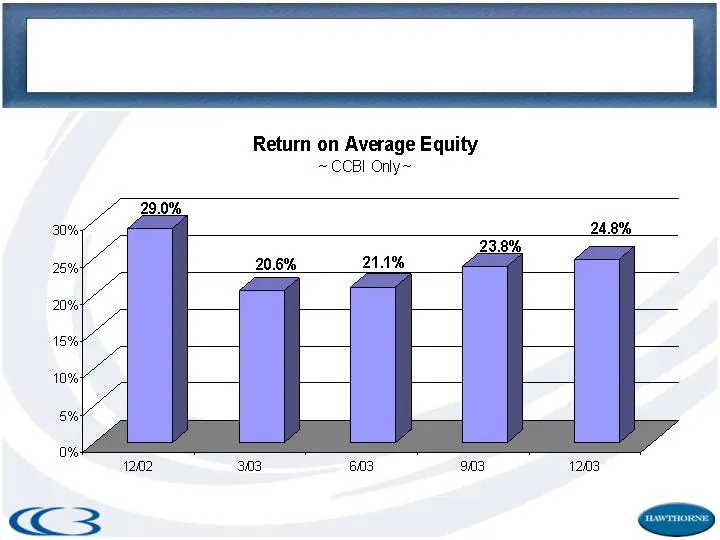
Slide 35: Return on Average Equity
Return on Average Equity ~CCBI Only~ 29.0% 20.6% 21.1% 1202 303 603 903 1208
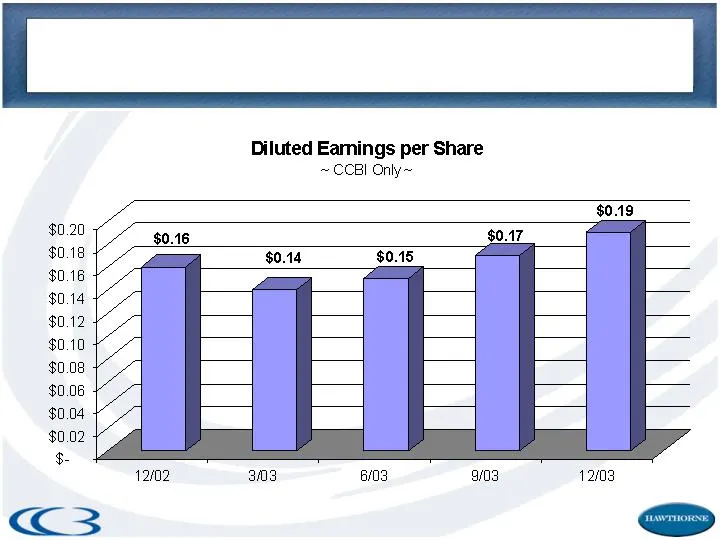
Slide 36: Diluted Earnings per Share
Diluted Eamings per Share ~CCBI Only~ $0.19 $0.16 $0.17 z $0.14 $0.15 12102 ama 603 903 12103
Slide 37: Transaction Summary
Transaction Summary Financially Attractive One of the Few Statewide Franchises in California Stronger Foundation for Continued Growth Upside Potential
Slide 38: Solicitation material and Form S-4 notice
This presentation may be deemed to be solicitation material with respect to the proposed acquisition of Hawthorne and the issuance of shares of common stock by CCBI pursuant to the merger. In connection with the proposed transaction, a registration statement on Form S-4 will be filed with the SEC. T
Slide 39: Commercial Capital Bancorp, Inc.
Cc 3s COMMERCIAL CAPITAL BANCORP, INC. NASDAQ National Market Ticker: “CCBI” February 24, 2004
Source: SEC EDGAR · 8-K filed Feb 24, 2004
More decks from Commercial Capital Bancorp Inc
 Investor Presentation (February 2006)36 slides · Feb 23, 2006
 Q4 2005 Earnings Presentation31 slides · Jan 23, 2006
 Q3 2005 Earnings Presentation29 slides · Oct 24, 2005
 Q1 2005 Earnings Presentation33 slides · Apr 25, 2005
 Merger or Acquisition (February 2005)11 slides · Feb 7, 2005
 Q3 2004 Earnings Presentation34 slides · Oct 25, 2004