TTM Technologies, Inc. · NASDAQ:TTMI
TTM Technologies — 13th Annual Needham Growth Conference (January 2011)
28 slides from TTM Technologies's conference presentation, Jan 13, 2011
Slide 1: Company Overview
Company Overview January 13th, 2011 13th Annual Needham Growth Conference
Slide 2: Disclosure Safe Harbor
2 2 Disclosure Safe Harbor During the course of this presentation, the company will make forward- looking statements subject to known and unknown risks and uncertainties that could cause actual results to differ materially from those expressed or implied by such statements. Such risks and uncertaint
Slide 3: Table of Contents
3 3 Company Overview Industry & Market Overview Future Plans & Strategies Financial Overview Table of Contents
Slide 4: Company Overview
Company Overview Pa |
Slide 5: Global Leader in PCB Manufacturing
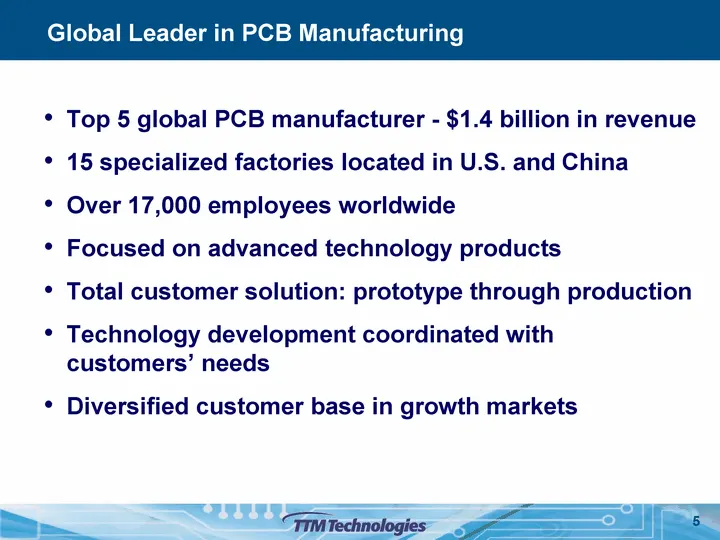
5 Global Leader in PCB Manufacturing Top 5 global PCB manufacturer - $1.4 billion in revenue 15 specialized factories located in U.S. and China Over 17,000 employees worldwide Focused on advanced technology products Total customer solution: prototype through production Technology development coordin
Slide 6: Q3 2010 Highlights
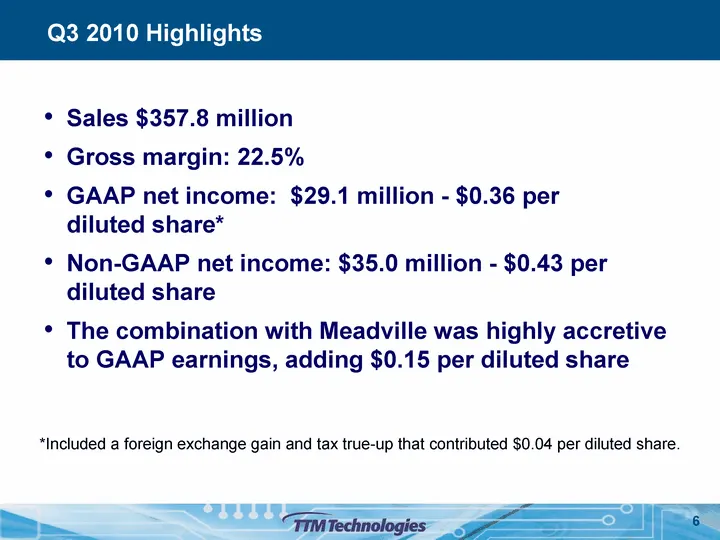
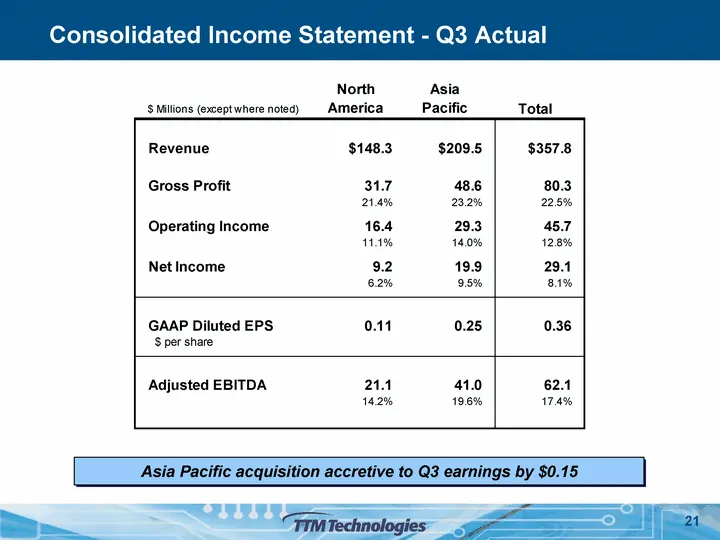
6 Q3 2010 Highlights Sales $357.8 million Gross margin: 22.5% GAAP net income: $29.1 million - $0.36 per diluted share* Non-GAAP net income: $35.0 million - $0.43 per diluted share The combination with Meadville was highly accretive to GAAP earnings, adding $0.15 per diluted share 6 *Included a fore
Slide 7: TTM Revenue History
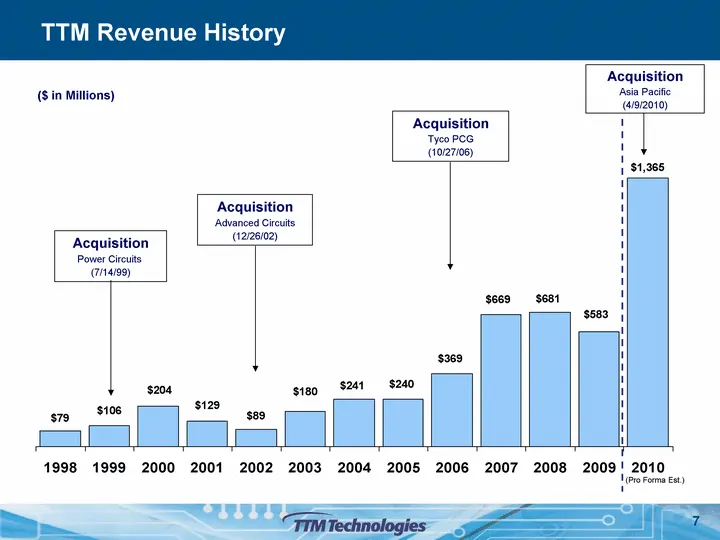
7 7 TTM Revenue History 1998 1999 2000 2001 2002 2003 2004 2005 2006 2007 2008 2009 2010 Sales 79 106 204 129 89 180 241 240 369 669 681 583 1365 ($ in Millions) Acquisition Power Circuits (7/14/99) Acquisition Advanced Circuits (12/26/02) Acquisition Tyco PCG (10/27/06) Acquisition Asia Pacific (4/
Slide 8: Specialized Facilities Provide Optimal Growth
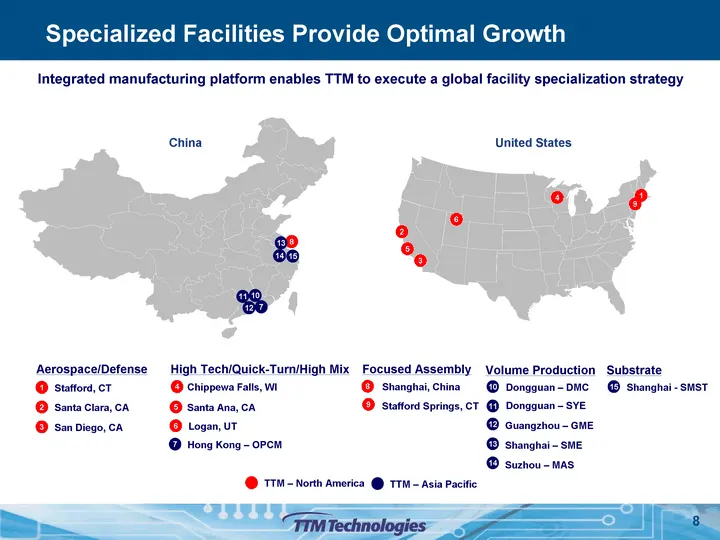
8 8 Specialized Facilities Provide Optimal Growth Integrated manufacturing platform enables TTM to execute a global facility specialization strategy Focused Assembly 8 Shanghai, China 1 Stafford, CT 3 San Diego, CA Aerospace/Defense 5 High Tech/Quick-Turn/High Mix 4 Chippewa Falls, WI 2 Santa Clara,
Slide 9: Global Ranking Top World PCB Makers
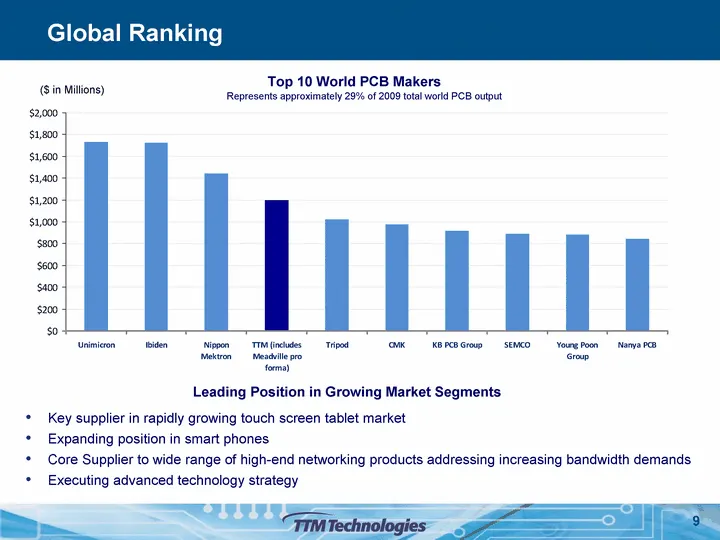
9 Global Ranking Top 10 World PCB Makers Represents approximately 29% of 2009 total world PCB output ($ in Millions) Key supplier in rapidly growing touch screen tablet market Expanding position in smart phones Core Supplier to wide range of high-end networking products addressing increasing bandwid
Slide 10: Industry & Market Overview
10 10 Industry & Market Overview
Slide 11: World PCB Outlook
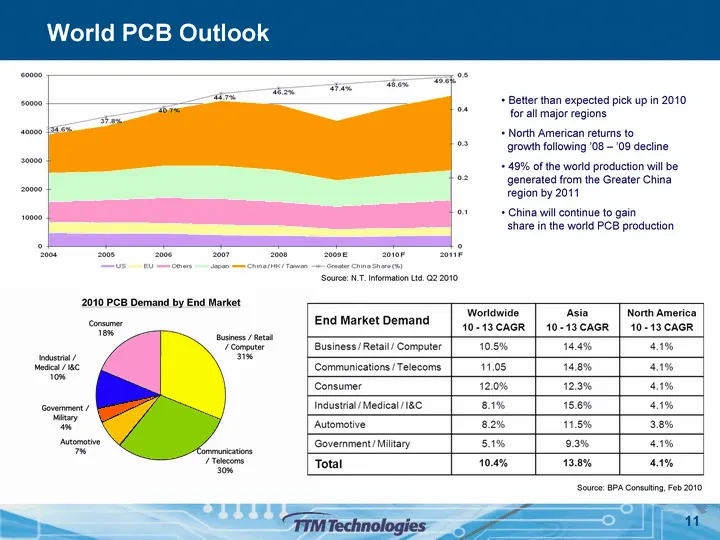
11 Source: N.T. Information Ltd. Q2 2010 Better than expected pick up in 2010 for all major regions North American returns to growth following '08 - '09 decline 49% of the world production will be generated from the Greater China region by 2011 China will continue to gain share in the world PCB prod
Slide 12: Diversified End Market & Customer Base
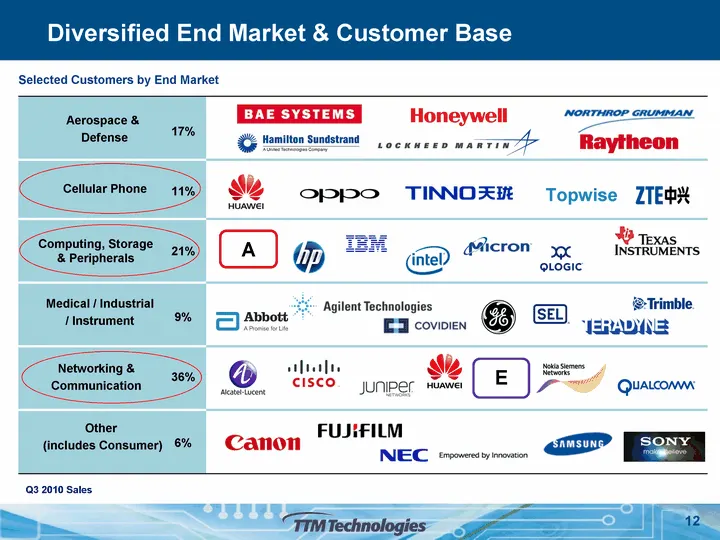
Topwise A E 12 12 Diversified End Market & Customer Base Q3 2010 Sales Selected Customers by End Market 17% 21% 9% 36% 6% 11% Aerospace & Defense Cellular Phone Computing, Storage & Peripherals Medical / Industrial / Instrument Networking & Communication Other (includes Consumer)
Slide 13: Future Plans & Strategies
13 13 Future Plans & Strategies
Slide 14: Positioned for Revolutionary Growth
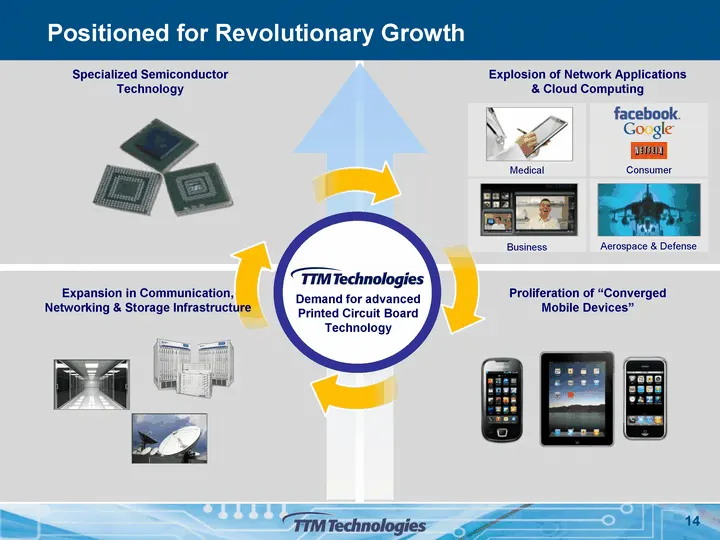
14 14 Positioned for Revolutionary Growth Specialized Semiconductor Technology Proliferation of "Converged Mobile Devices" Explosion of Network Applications & Cloud Computing Consumer Aerospace & Defense Business Medical Demand for advanced Printed Circuit Board Technology Expansion in Communication
Slide 15: Advanced Technology, Value Added Strategy
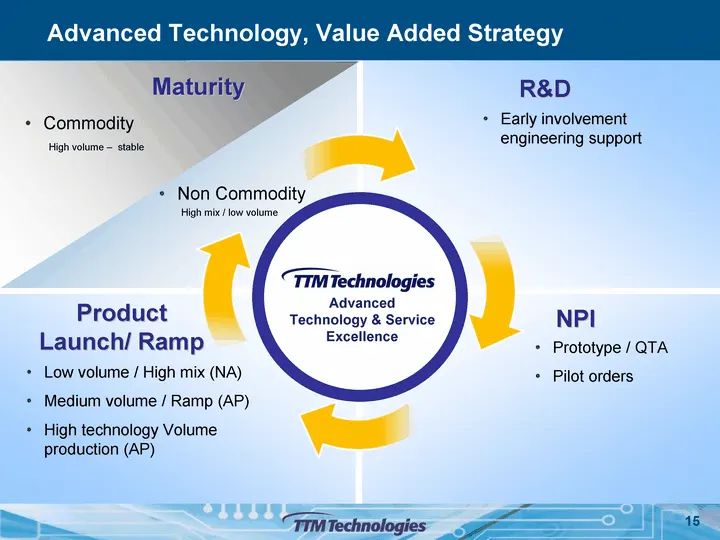
15 15 Advanced Technology, Value Added Strategy Advanced Technology & Service Excellence Early involvement engineering support Prototype / QTA Pilot orders Low volume / High mix (NA) Medium volume / Ramp (AP) High technology Volume production (AP) Product Launch/ Ramp NPI R&D Maturity Non Commodity
Slide 16: Serving Advanced Technology Markets
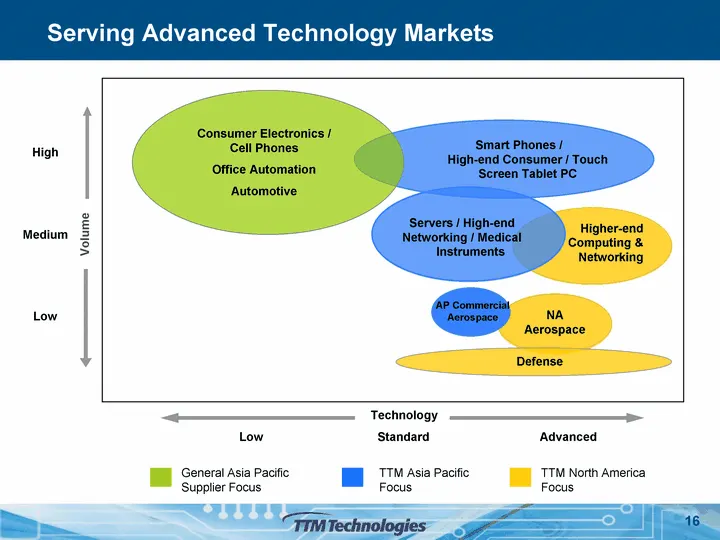
16 16 Serving Advanced Technology Markets Low Medium High Volume Standard Advanced Low Technology NA Aerospace Consumer Electronics / Cell Phones Office Automation Automotive AP Commercial Aerospace Higher-end Computing & Networking Smart Phones / High-end Consumer / Touch Screen Tablet PC Defense S
Slide 17: Growth Driver - Asia Pacific
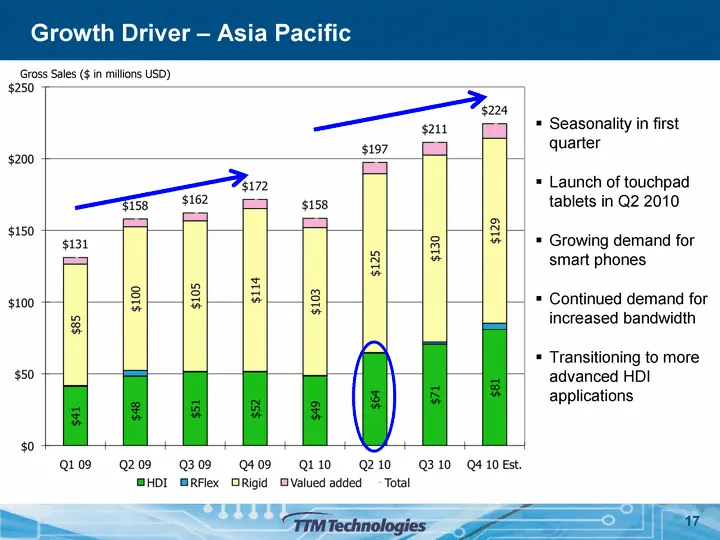
17 Growth Driver - Asia Pacific 17 Seasonality in first quarter Launch of touchpad tablets in Q2 2010 Growing demand for smart phones Continued demand for increased bandwidth Transitioning to more advanced HDI applications Gross Sales ($ in millions USD)
Slide 18: Technology & ASP
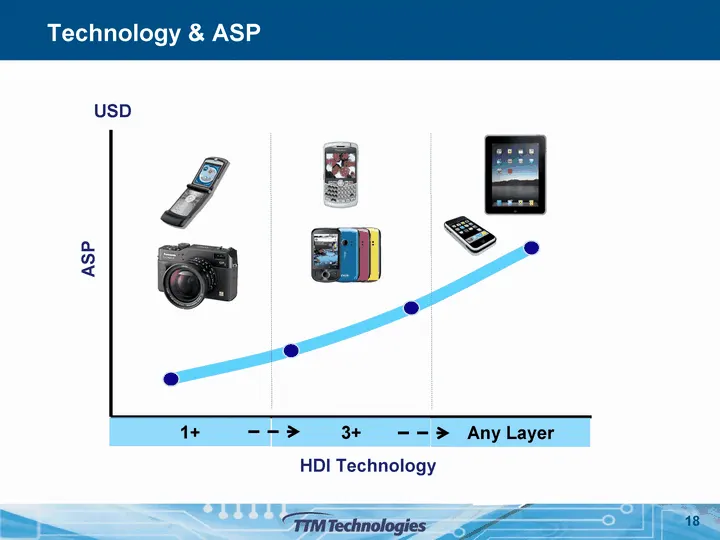
Technology & ASP 18 ASP HDI Technology USD
Slide 19: Strategic Growth Objectives
19 19 Strategic Growth Objectives Invest in advanced technology Focus on the early stages of the product life cycle Leverage our leadership position and global footprint Service customers in growth end markets Customer-driven culture
Slide 20: Financial Overview
Financial Overview Pe a —o | (re
Slide 21: Consolidated Income Statement - Q3 Actual
21 21 Consolidated Income Statement - Q3 Actual Asia Pacific acquisition accretive to Q3 earnings by $0.15
Slide 22: Target Model
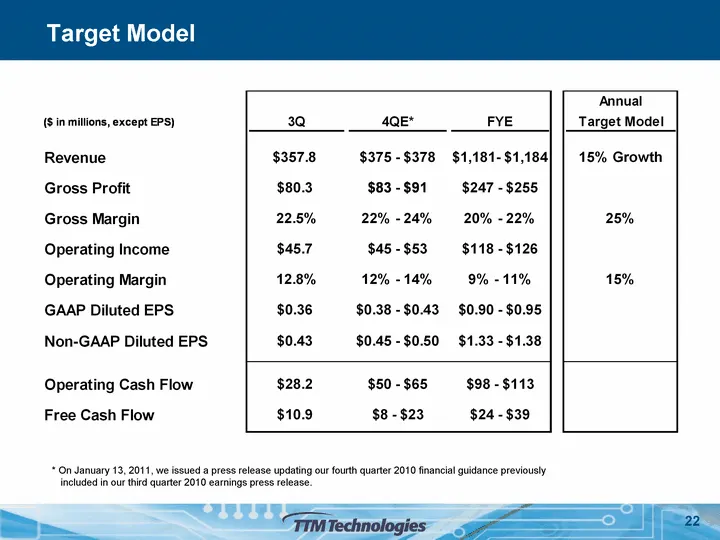
22 22 Target Model * On January 13, 2011, we issued a press release updating our fourth quarter 2010 financial guidance previously included in our third quarter 2010 earnings press release.
Slide 23: Balance Sheet
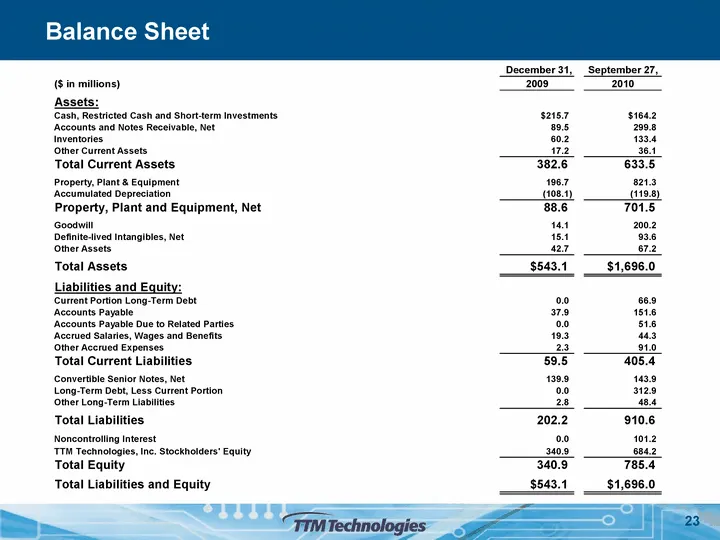
Balance Sheet December31, _ September 27, (Sin millions) 72008, 2010 Other Current Assets Total Current Assets Property, Pant & Equipment ‘Accumulated Depreciation Property, Plant and Equipment, Net Gooawit Defiitesived itangibes, Net Other Assets Total Assets $543.4 $1,696.0 Liabilities and Equity:
Slide 24: Cash Flow
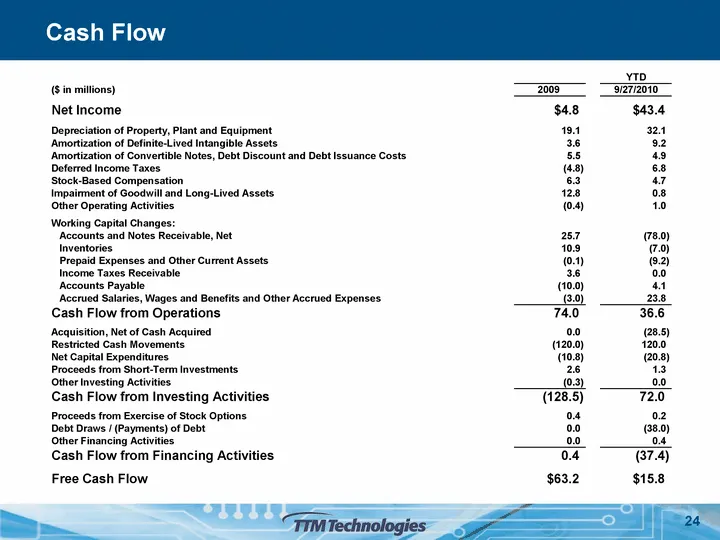
Cash Flow (S in millions) Net Income $4.8 Depreciation of Property, Plant and Equipment 194 “Amortization of Definite-Lived Intangible Assets 38 ‘Amortization of Convertible Notes, Debt Discount and Debt Issuance Costs 35 Deferred income Taxes a) Stock-Based Compensation 63 Impairment of Goodwill an
Slide 25: Investment Highlights
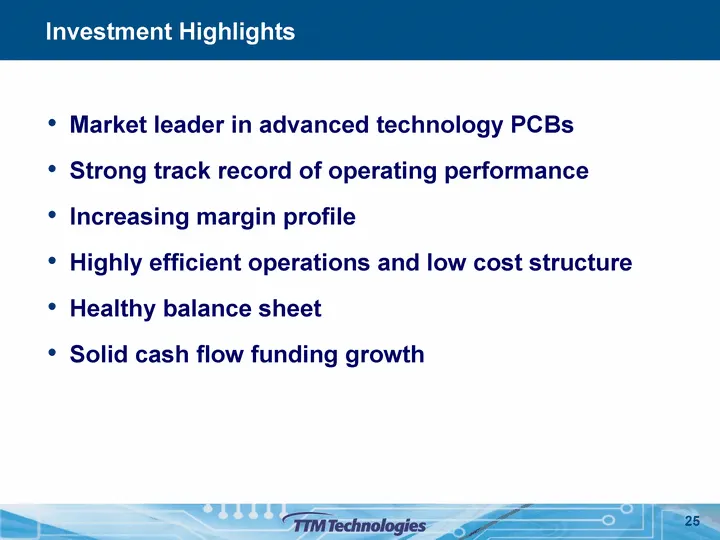
25 25 Investment Highlights Market leader in advanced technology PCBs Strong track record of operating performance Increasing margin profile Highly efficient operations and low cost structure Healthy balance sheet Solid cash flow funding growth
Slide 26: Appendix
26 26 Appendix
Slide 27: Appendix
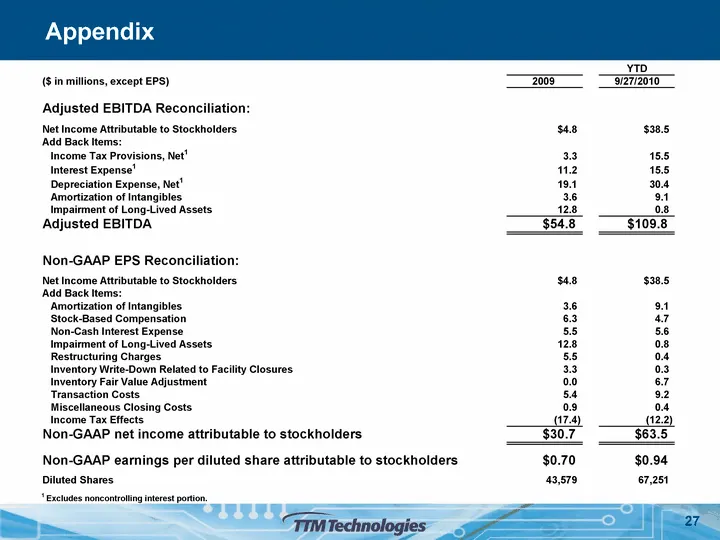
ae Appendix —=—_- —2- (Sinmilions, except EPS) 20087 S2T200 Adjusted EBITDA Reconci Net Income Attributable to Stockhol ‘Add Back tems: Income Tax Provisions, Net’ Interest Expense’ Depreciation Expense, Net" Amortization of Intangibles Impairment of Long-Lived Assets Adjusted EBITDA, Non-GAAP EPS R
Slide 28: IR Contacts
28 IR Contacts Asia Pacific Audrey Sim VP, Investor Relations & Business Development Email: audrey.sim@meadvillegroup.com North America Steve Richards CFO & Investor Relations Email: steve.richards@ttmtech.com
Source: SEC EDGAR · 8-K filed Jan 13, 2011
More decks from TTM Technologies, Inc.
 Q3 2026 Earnings Presentation15 slides · Oct 22, 2026
 Investor Presentation (August 2026)9 slides · Aug 17, 2026
 Q2 2026 Earnings Presentation14 slides · Aug 5, 2026
 Investor Day (May 2026)70 slides · May 27, 2026
 Q1 2026 Earnings Presentation12 slides · Apr 29, 2026
 Q4 2025 Earnings Presentation14 slides · Feb 4, 2026