Clarke Inc. · TSX:CKI
Clarke — Beacon Securities Investment Conference 2008
35 slides from Clarke's conference presentation, Sep 11, 2008
Slide 1: Beacon Securities Investment Conference
Beacon Securities Investment Conference September 11, 2008 Blair Cook Chief Financial Officer Navigating a course toward long-term value
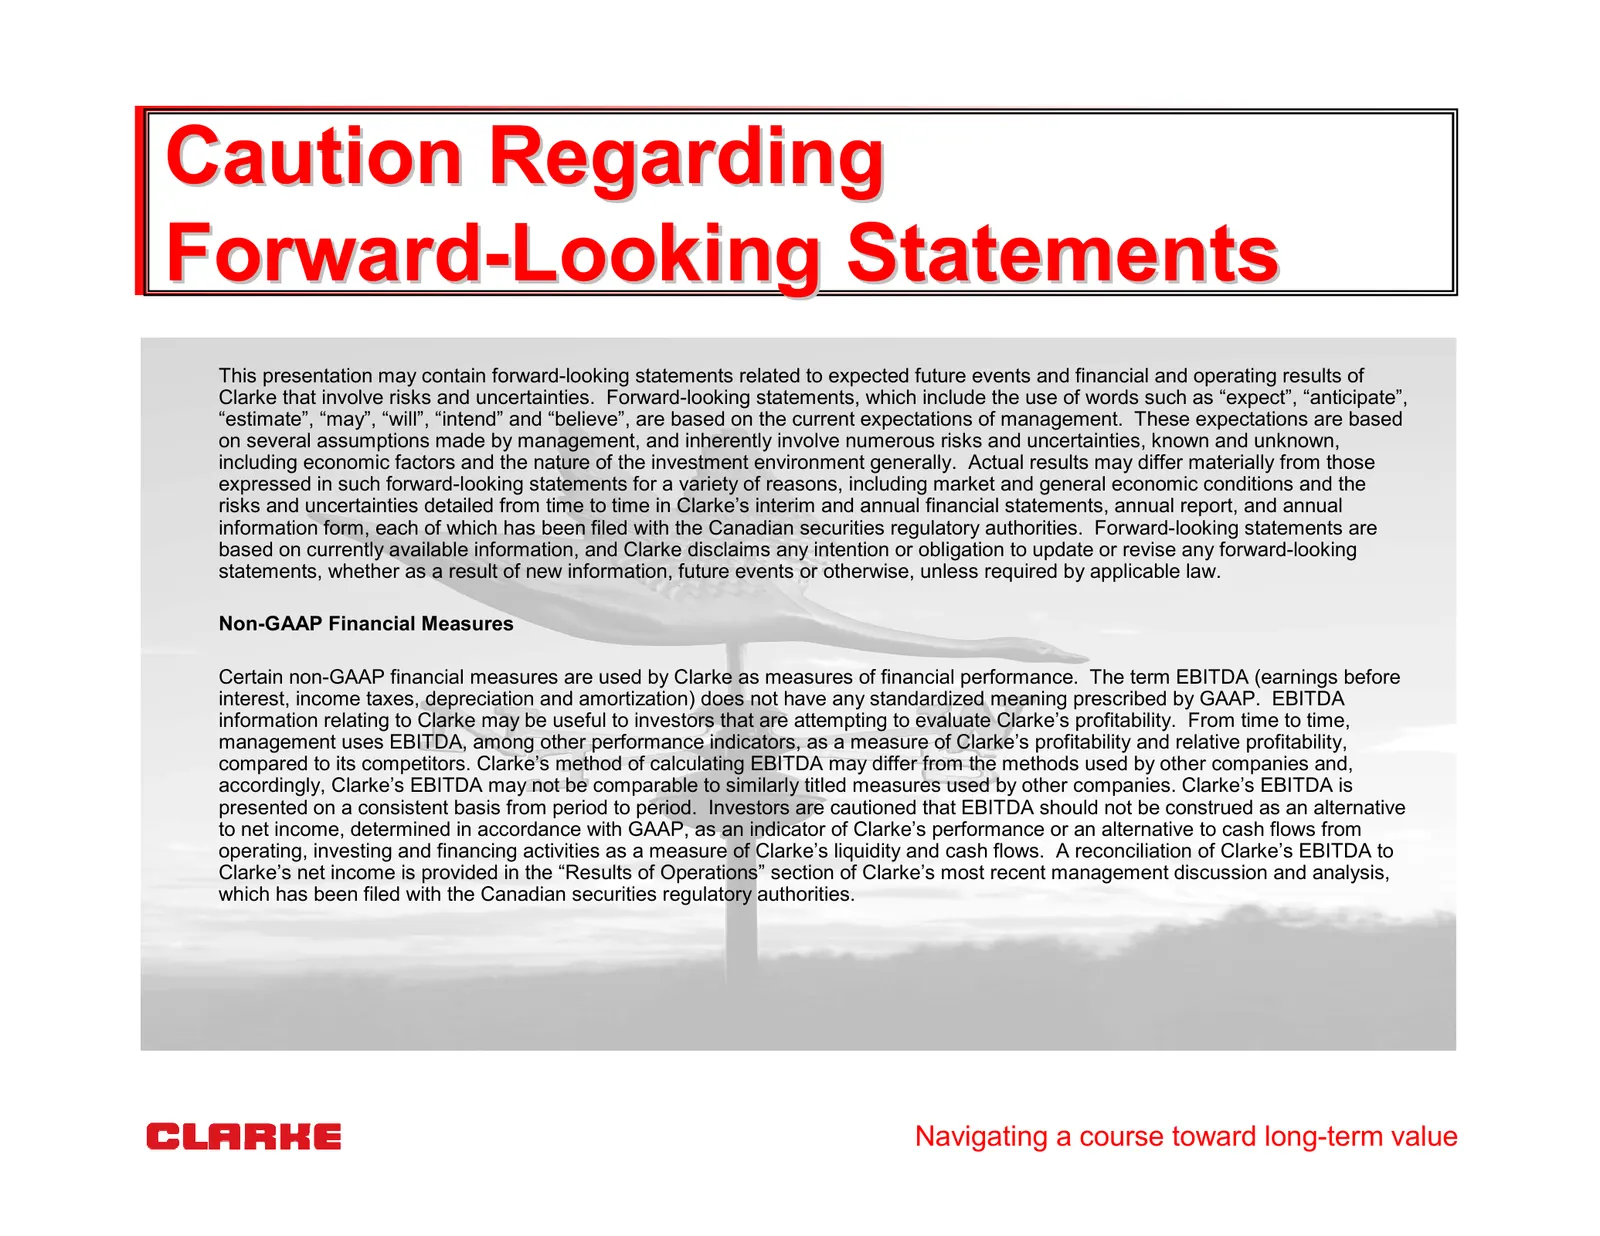
Slide 2: Caution Regarding Forward-Looking Statements
Caution Regarding Forward-Looking Statements This presentation may contain forward-looking statements related to expected future events and financial and operating results of Clarke that involve risks and uncertainties. Forward-looking statements, which include the use of words such as “expect”, “an
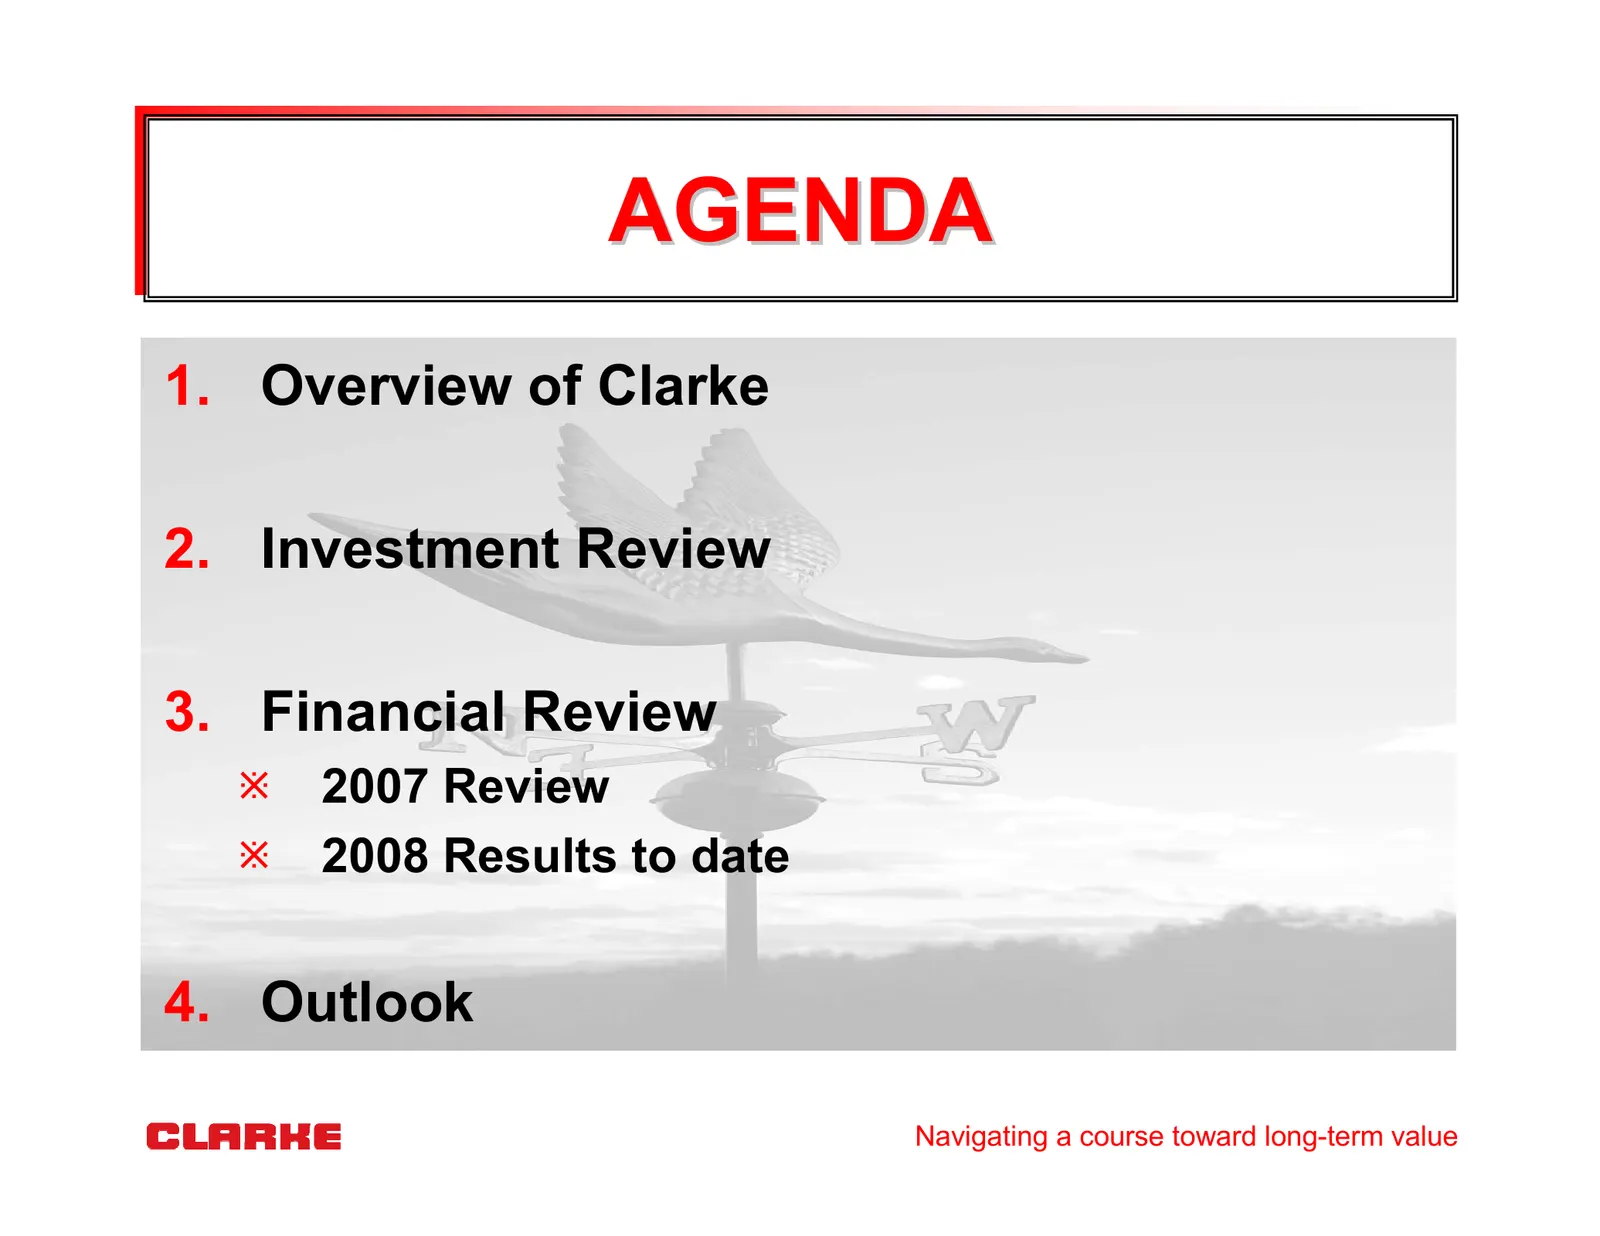
Slide 3: Agenda
AGENDA 1. Overview of Clarke 2. Investment Review 3. Financial Review 2007 Review 2008 Results to date 4. Outlook Navigating a course toward long-term value
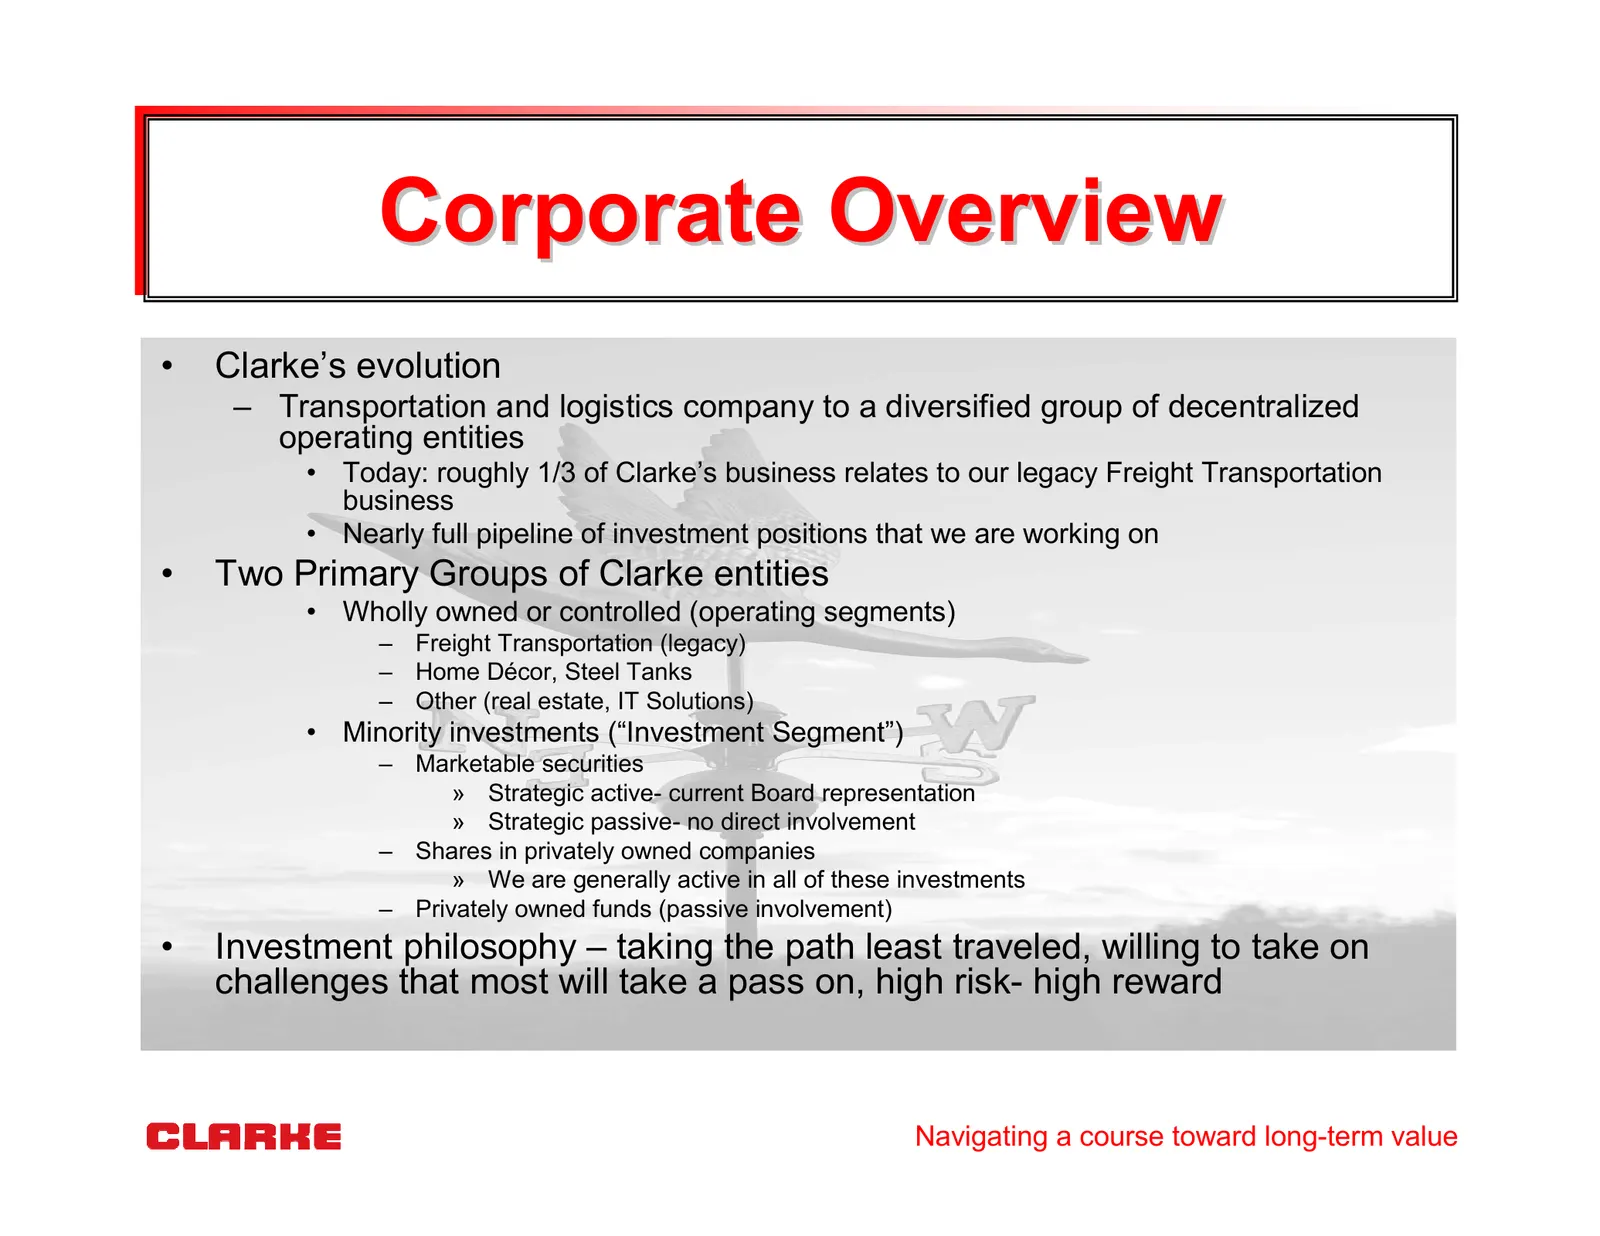
Slide 4: Corporate Overview
Corporate Overview • Clarke’s evolution – Transportation and logistics company to a diversified group of decentralized operating entities • Today: roughly 1/3 of Clarke’s business relates to our legacy Freight Transportation business • Nearly full pipeline of investment positions that we are working
Slide 5: Management & Board of Directors
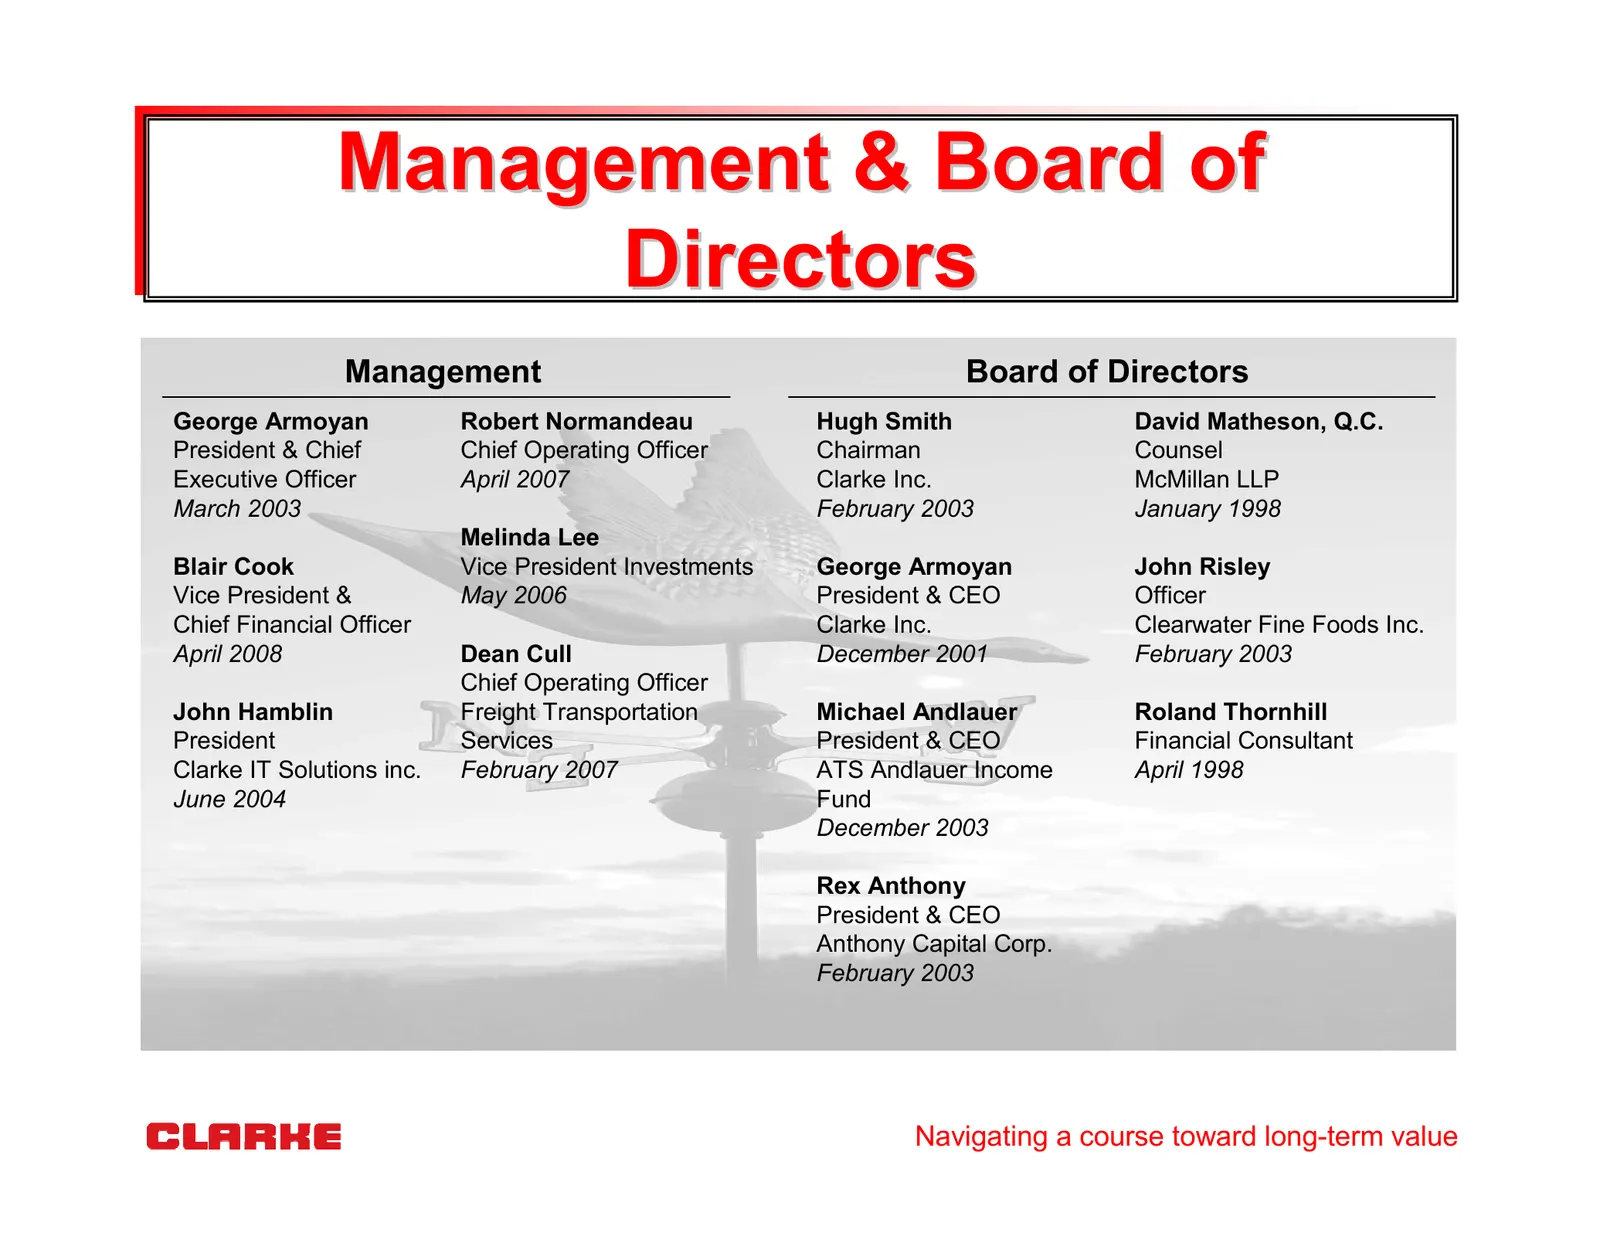
Management & Board of Leadership Team Directors Management Board of Directors George Armoyan Robert Normandeau Hugh Smith David Matheson, Q.C. President & Chief Chief Operating Officer Chairman Counsel Executive Officer April 2007 Clarke Inc. McMillan LLP March 2003 February 2003 January 1998 Melind
Slide 6: Investment Criteria
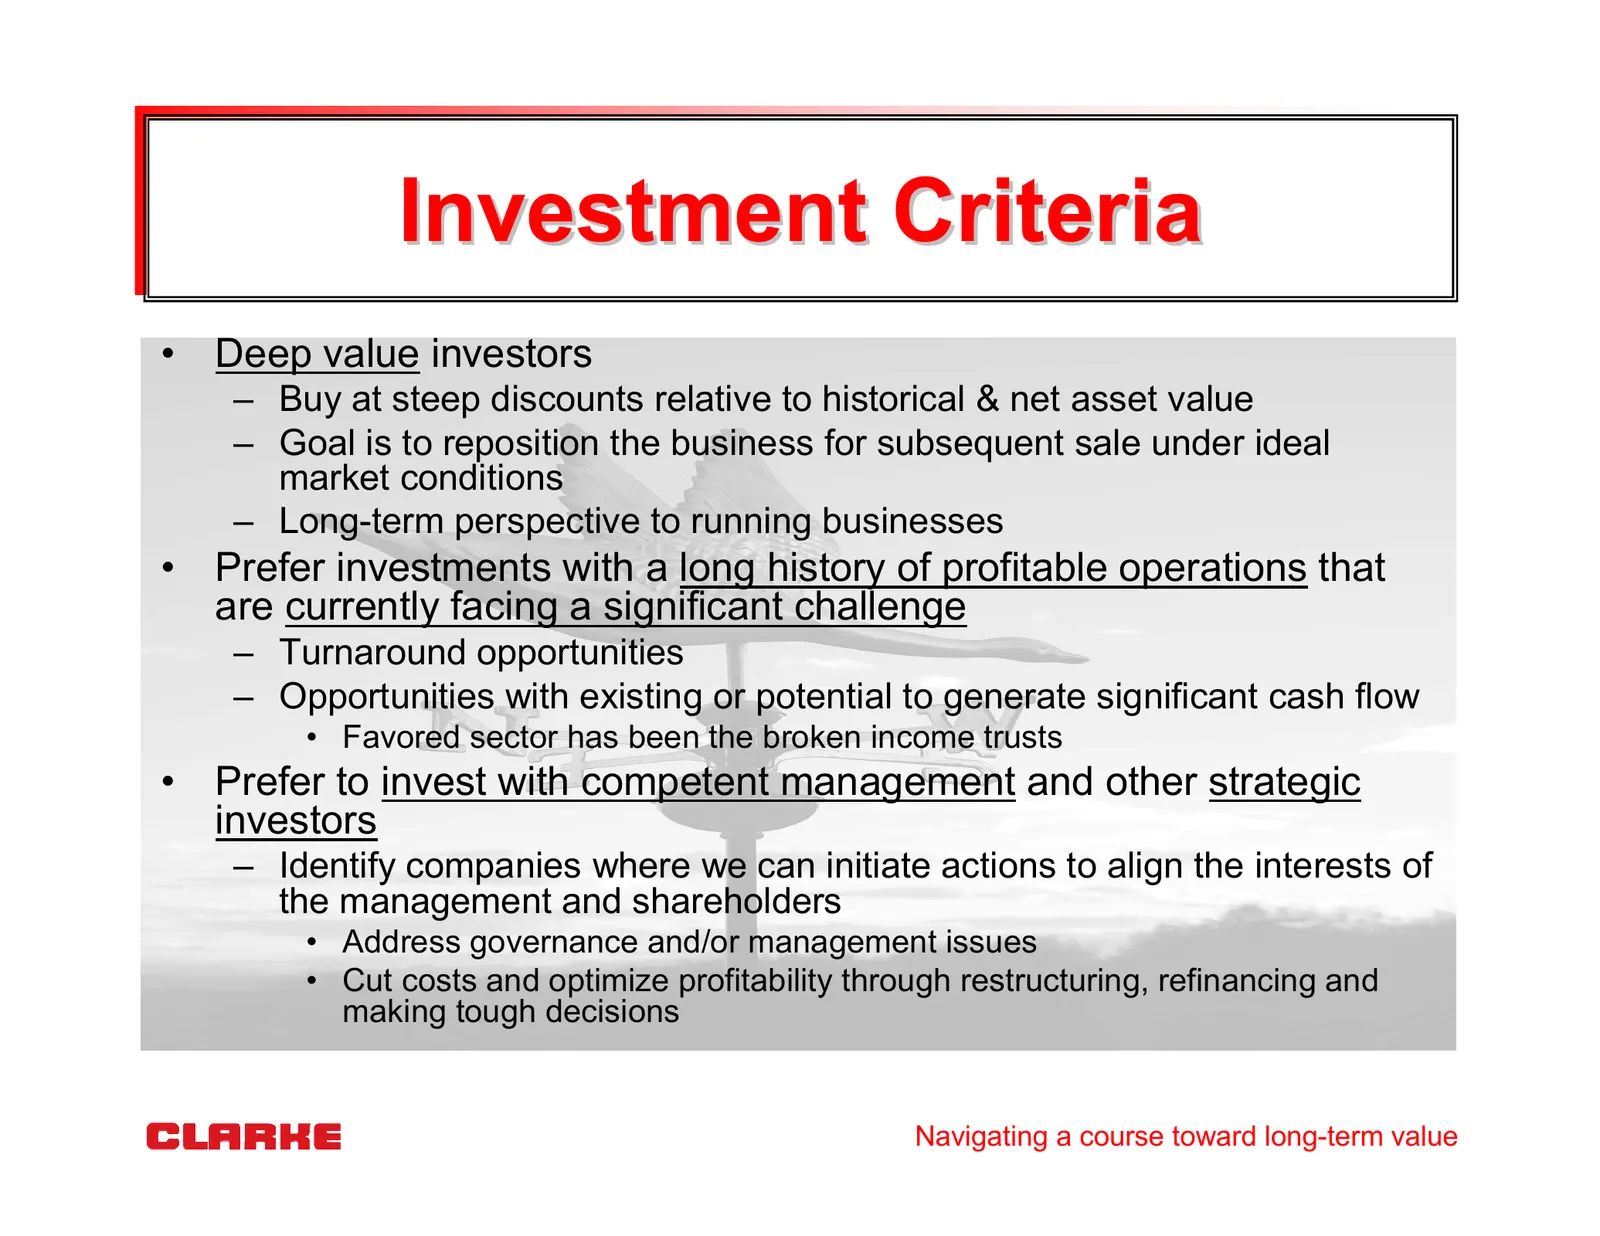
Investment Criteria • Deep value investors – Buy at steep discounts relative to historical & net asset value – Goal is to reposition the business for subsequent sale under ideal market conditions – Long-term perspective to running businesses • Prefer investments with a long history of profitable ope
Slide 7: Two Different Investing Environments
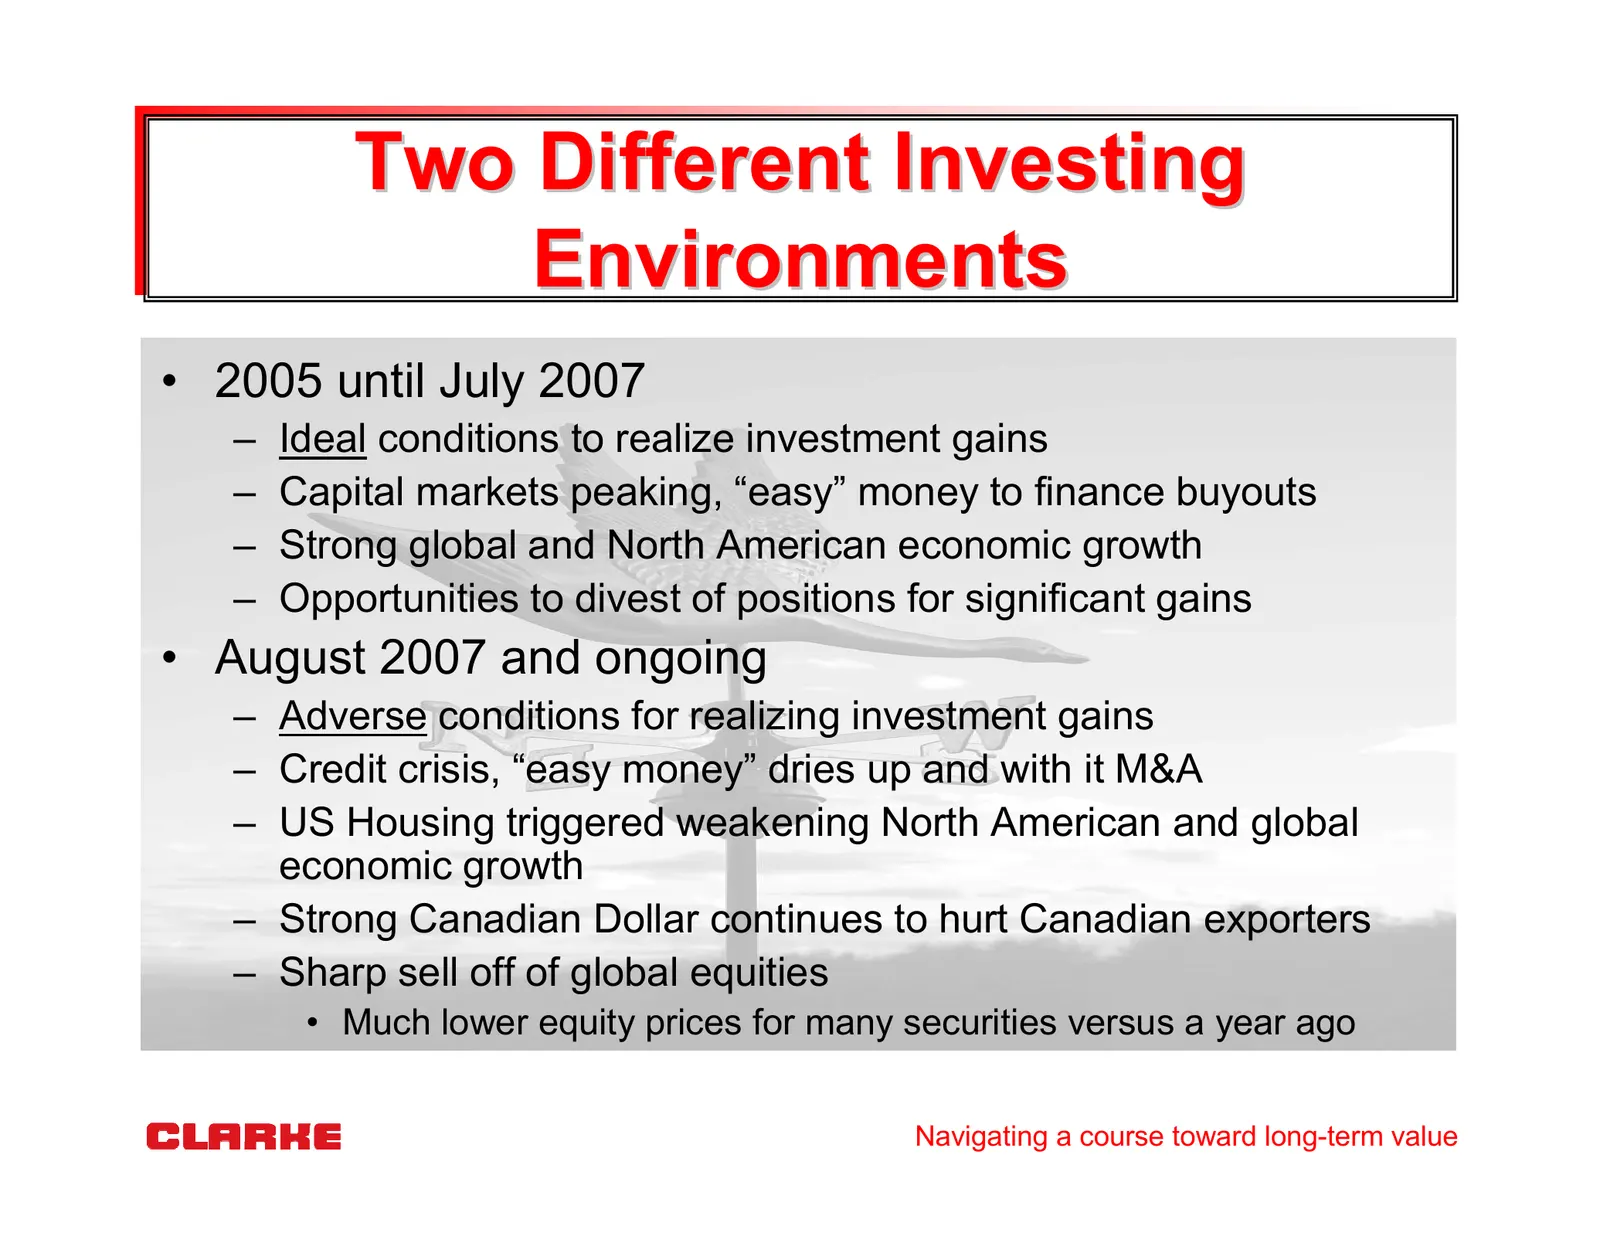
Two Different Investing Environments • 2005 until July 2007 – Ideal conditions to realize investment gains – Capital markets peaking, “easy” money to finance buyouts – Strong global and North American economic growth – Opportunities to divest of positions for significant gains • August 2007 and ongo
Slide 8: Share price performance since IPO
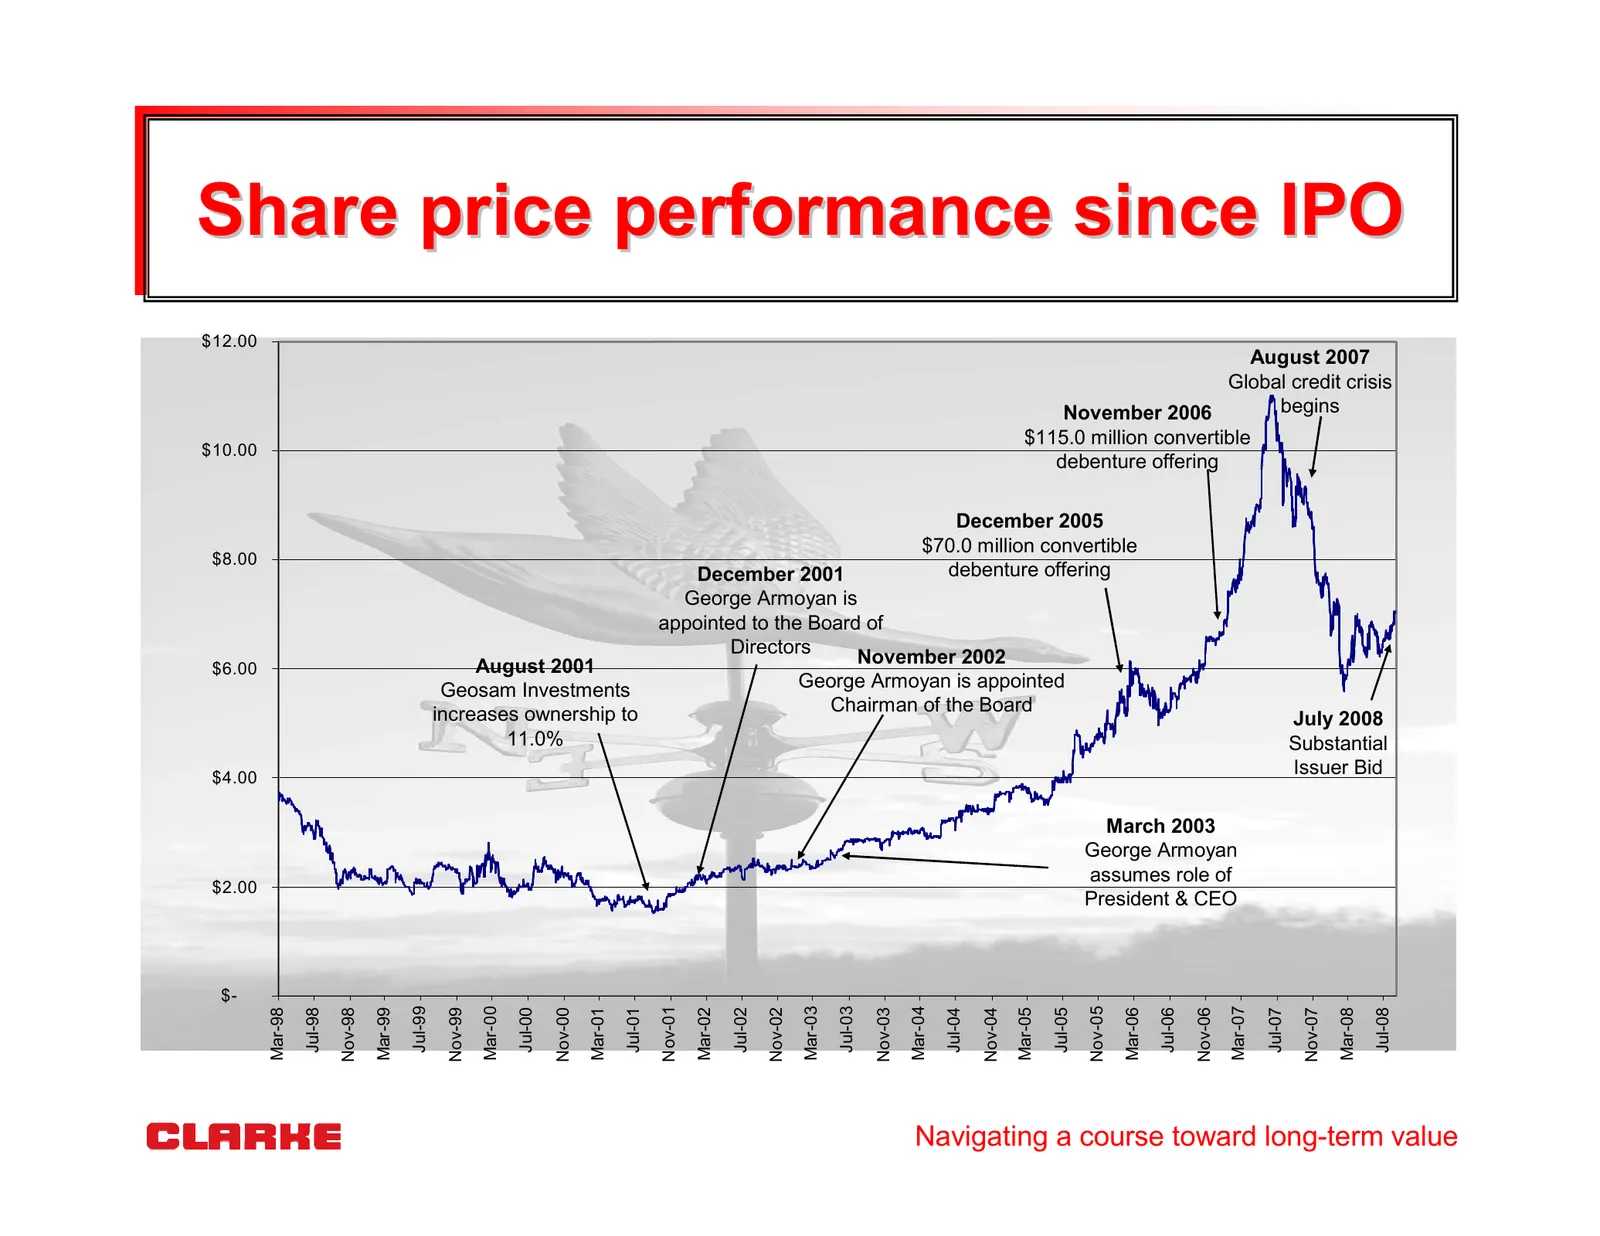
Share price performance since IPO $12.00 August 2007 Global credit crisis November 2006 begins $115.0 million convertible $10.00 debenture offering December 2005 $70.0 million convertible $8.00 December 2001 debenture offering George Armoyan is appointed to the Board of Directors November 2002 $6.00
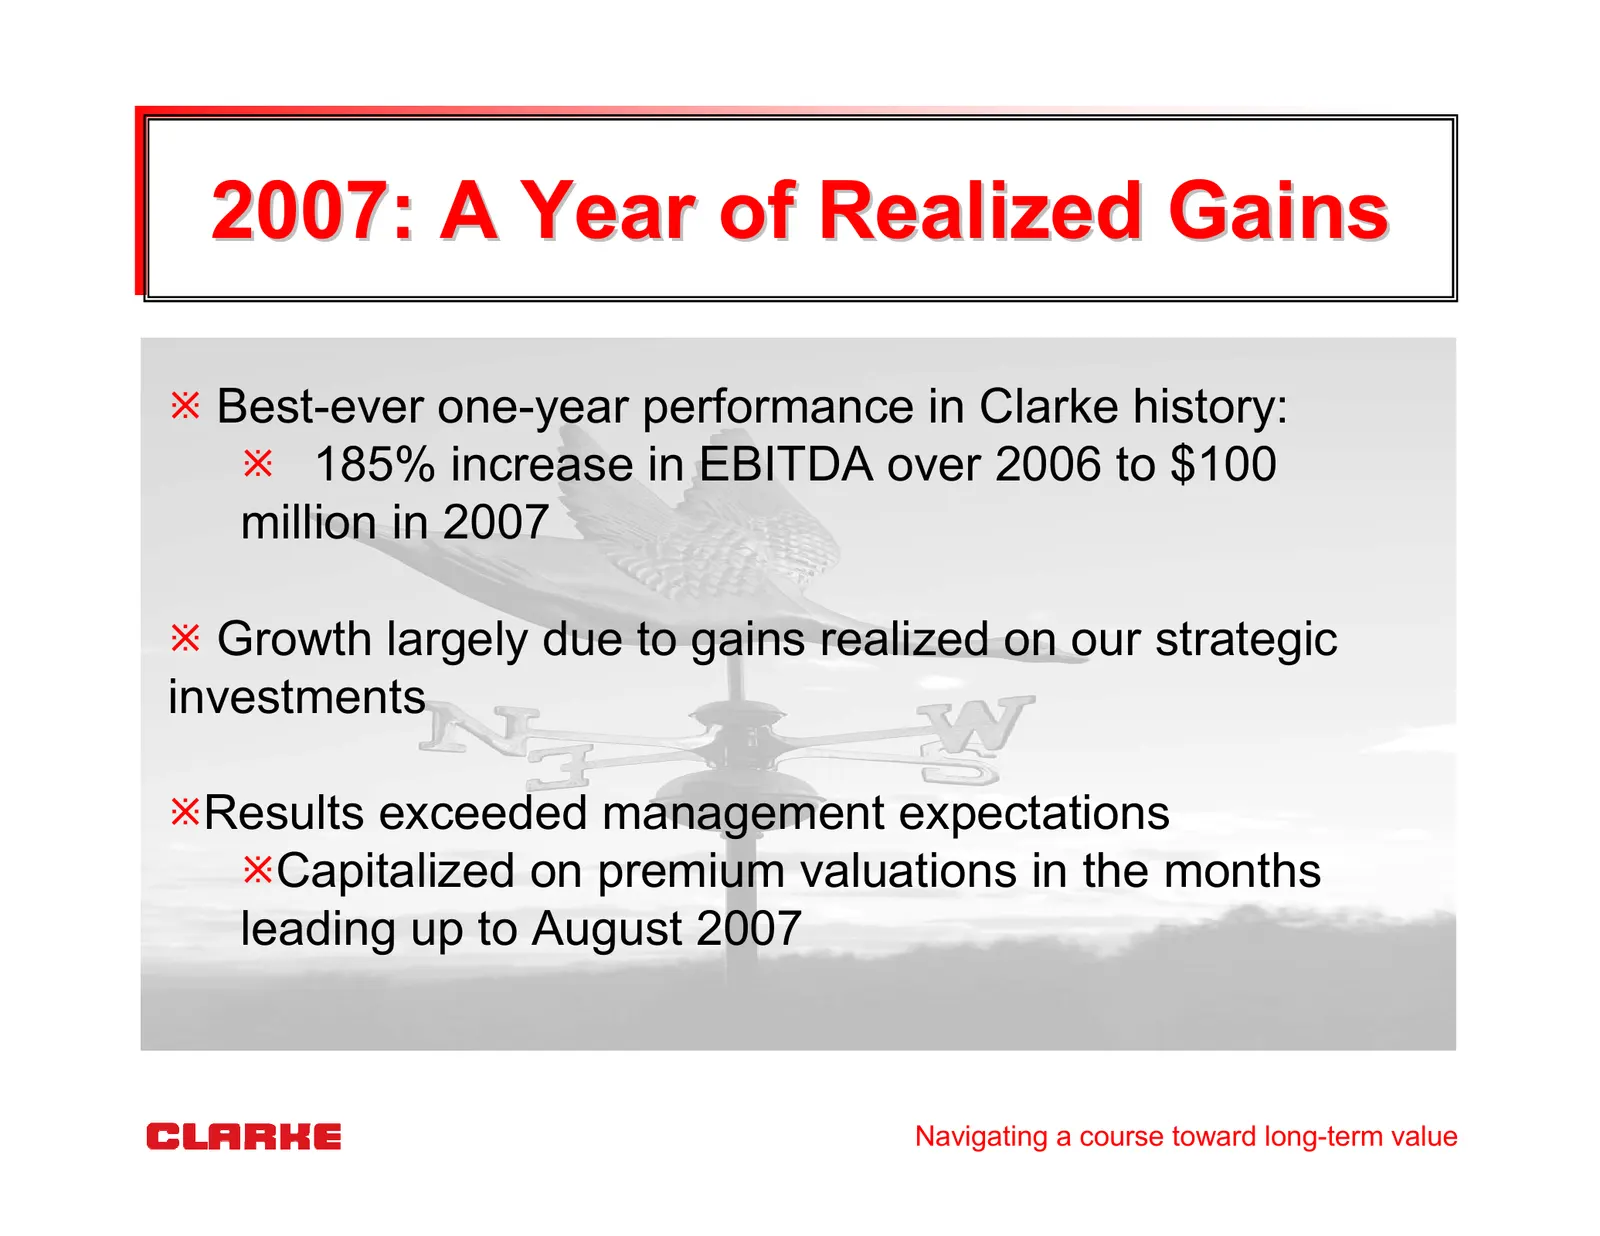
Slide 9: 2007: A Year of Realized Gains
2007: A Year of Realized Gains Best-ever one-year performance in Clarke history: 185% increase in EBITDA over 2006 to $100 million in 2007 Growth largely due to gains realized on our strategic investments Results exceeded management expectations Capitalized on premium valuations in the months leadin
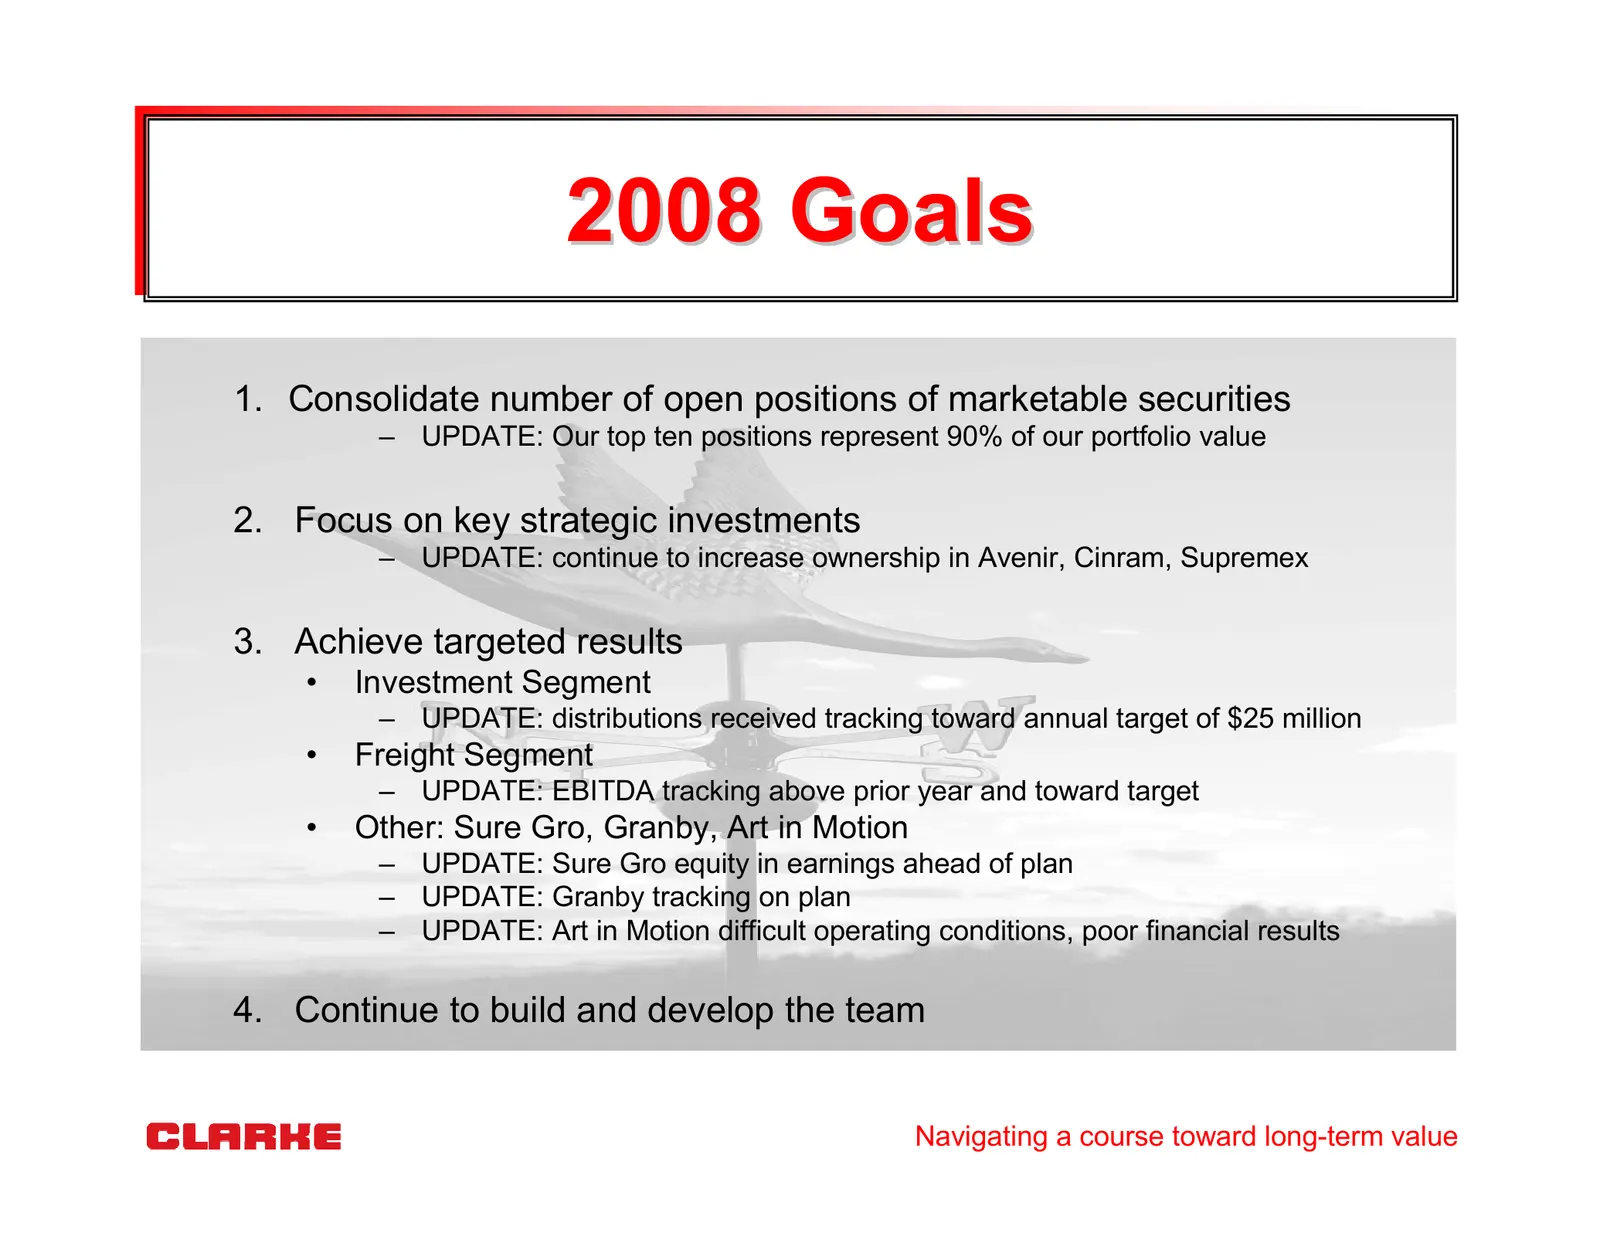
Slide 10: 2008 Goals
2008 Goals 1. Consolidate number of open positions of marketable securities – UPDATE: Our top ten positions represent 90% of our portfolio value 2. Focus on key strategic investments – UPDATE: continue to increase ownership in Avenir, Cinram, Supremex 3. Achieve targeted results • Investment Segment
Slide 11: Major Investment Review
Major Investment Review Navigating a course toward long-term value
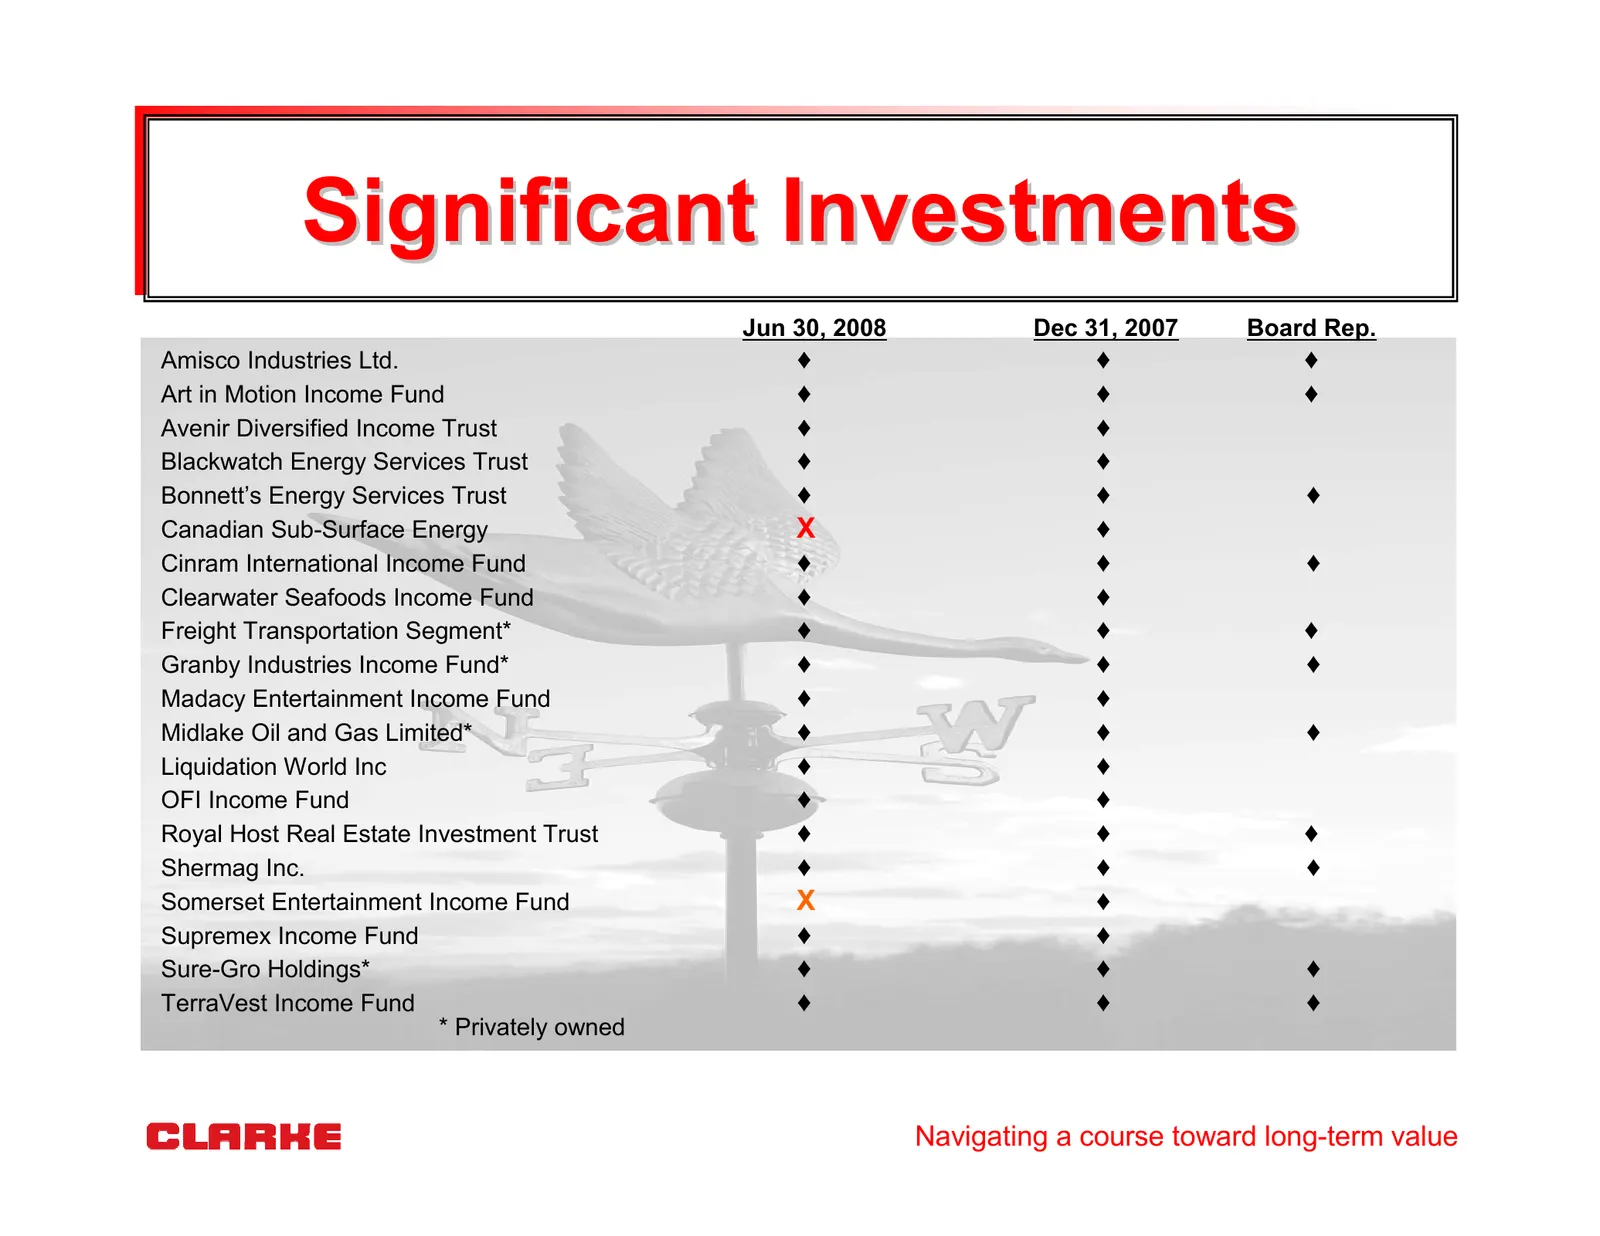
Slide 12: Significant Investments
Significant Investments Jun 30, 2008 Dec 31, 2007 Board Rep. Amisco Industries Ltd. ♦ ♦ ♦ Art in Motion Income Fund ♦ ♦ ♦ Avenir Diversified Income Trust ♦ ♦ Blackwatch Energy Services Trust ♦ ♦ Bonnett’s Energy Services Trust ♦ ♦ ♦ Canadian Sub-Surface Energy X ♦ Cinram International Income Fund ♦
Slide 13: Freight Transportation Segment
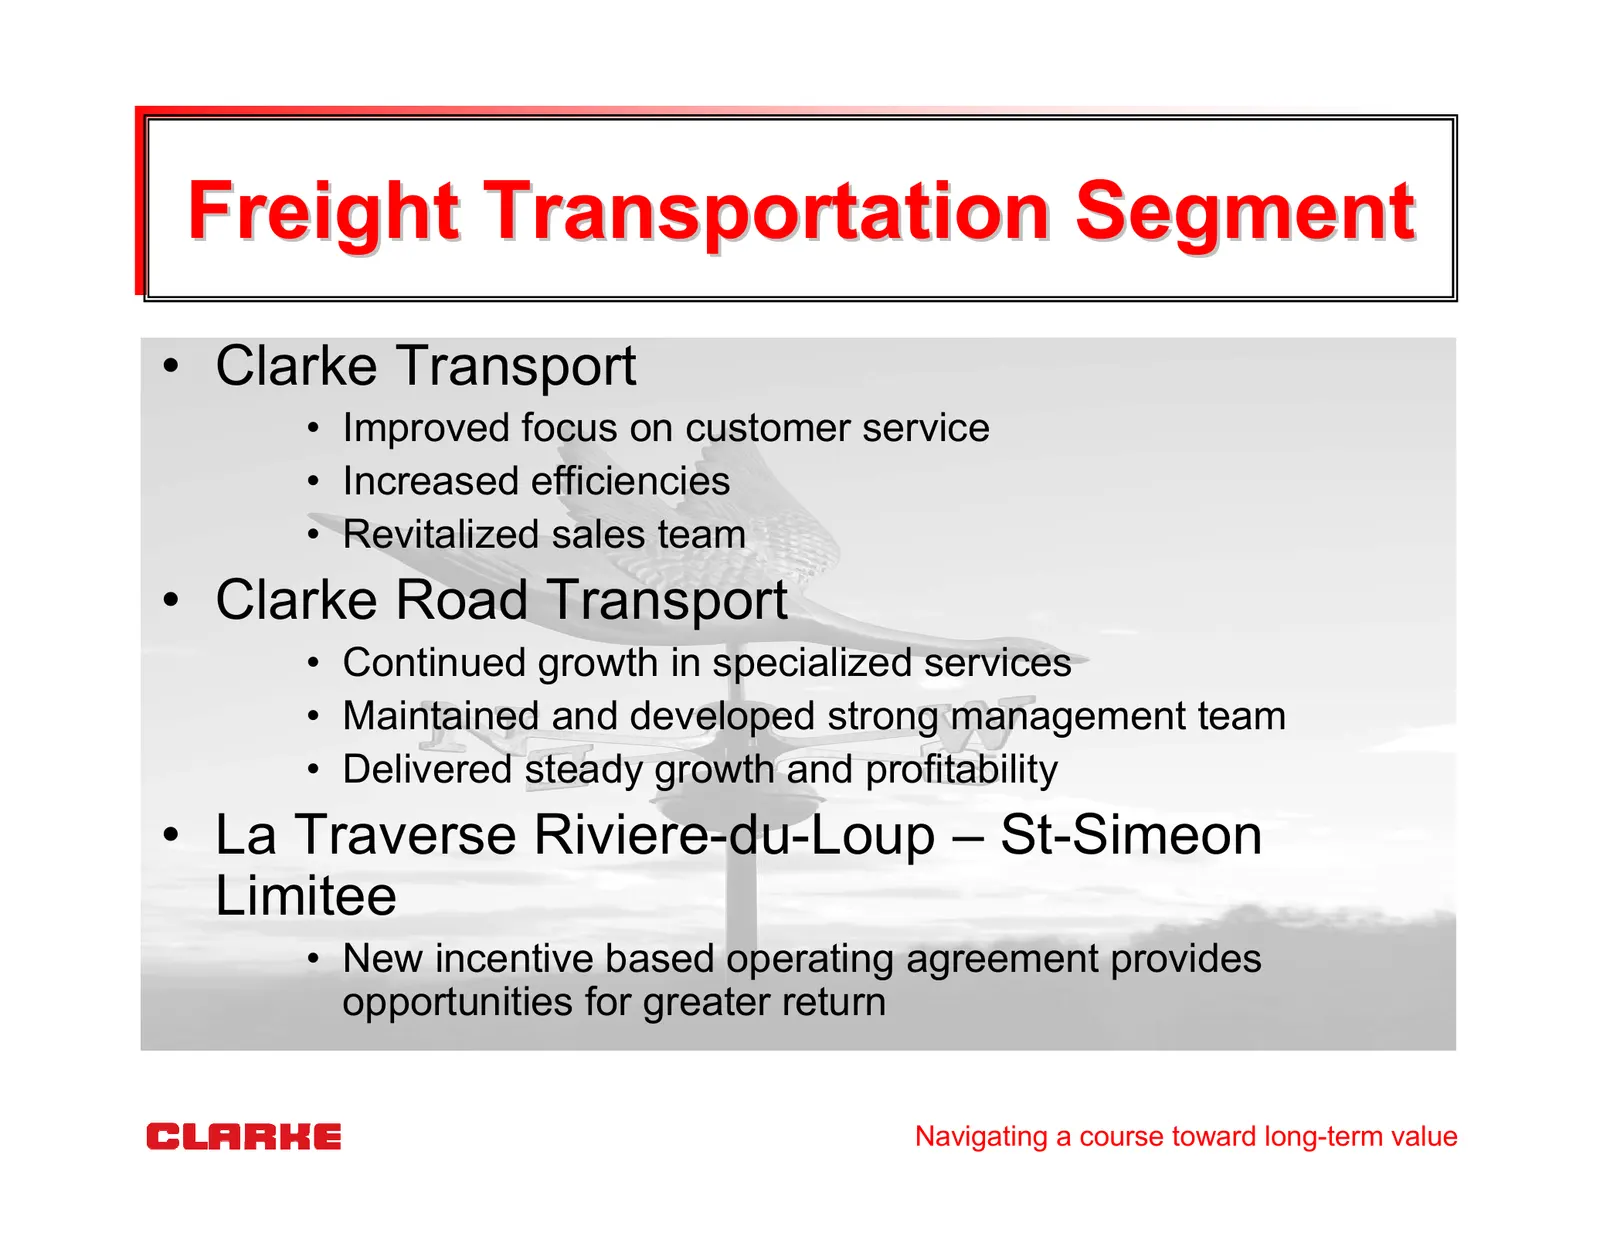
Freight Transportation Segment • Clarke Transport • Improved focus on customer service • Increased efficiencies • Revitalized sales team • Clarke Road Transport • Continued growth in specialized services • Maintained and developed strong management team • Delivered steady growth and profitability •
Slide 14: Freight Transportation
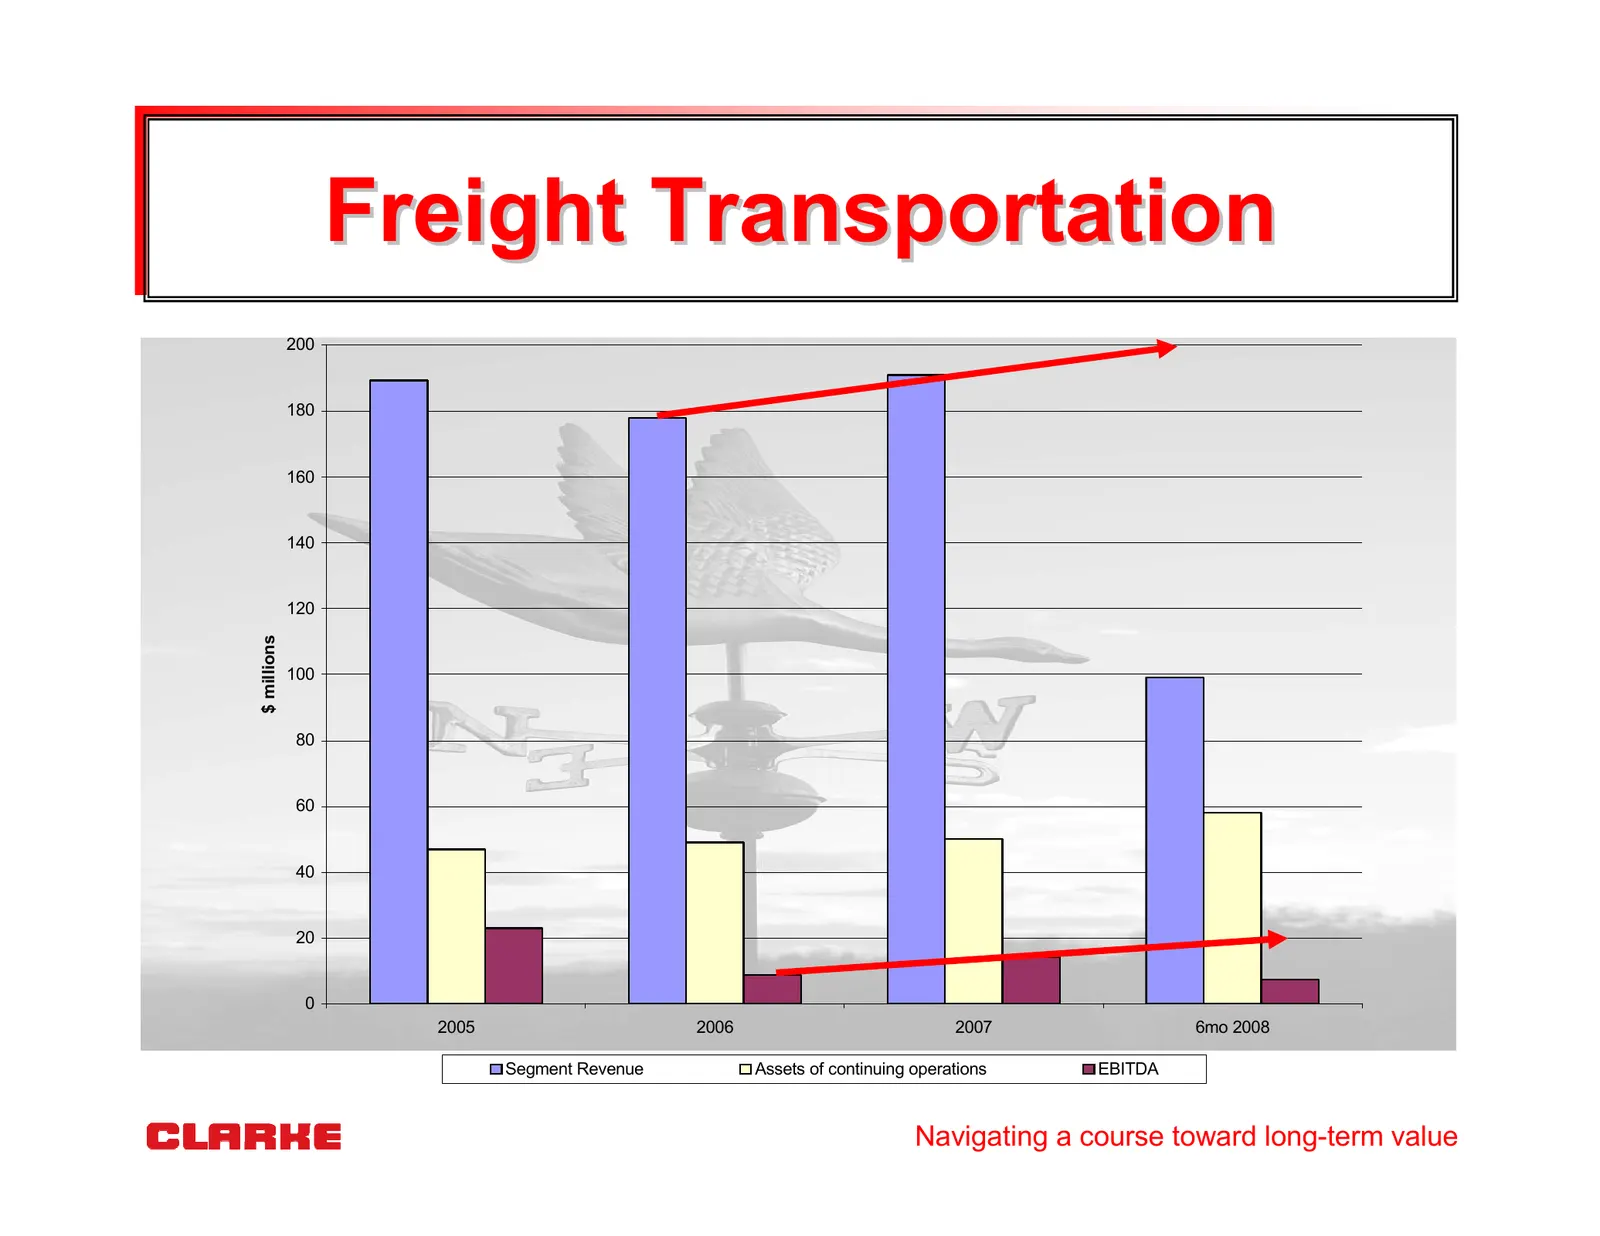
Freight Transportation 200 180 160 140 120 $ millions 100 80 60 40 20 0 2005 2006 2007 6mo 2008 Segment Revenue Assets of continuing operations EBITDA Navigating a course toward long-term value
Slide 15: Royal Host REIT (RYL.UN)
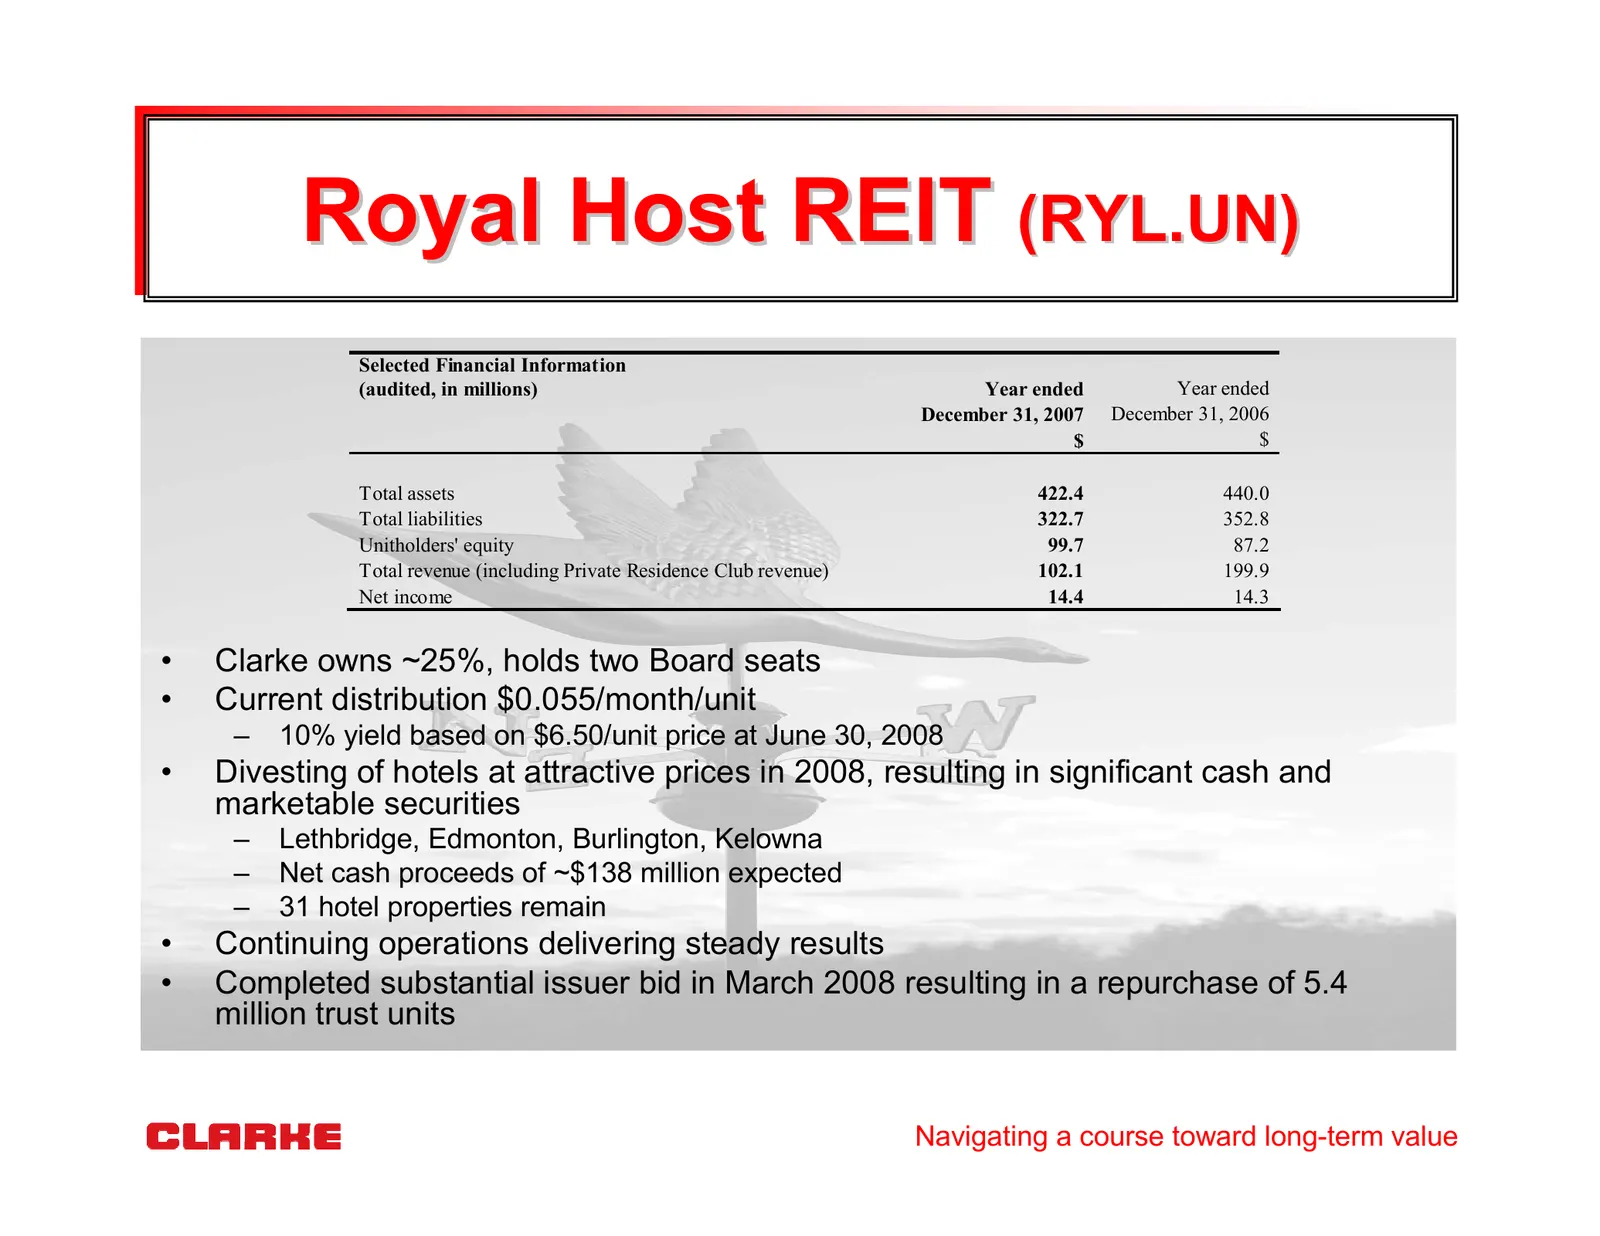
Royal Host REIT (RYL.UN) Selected Financial Information (audited, in millions) Year ended Year ended December 31, 2007 December 31, 2006 $ $ Total assets 422.4 440.0 Total liabilities 322.7 352.8 Unitholders' equity 99.7 87.2 Total revenue (including Private Residence Club revenue) 102.1 199.9 Net i
Slide 16: Supremex Income Fund (SXP.UN)
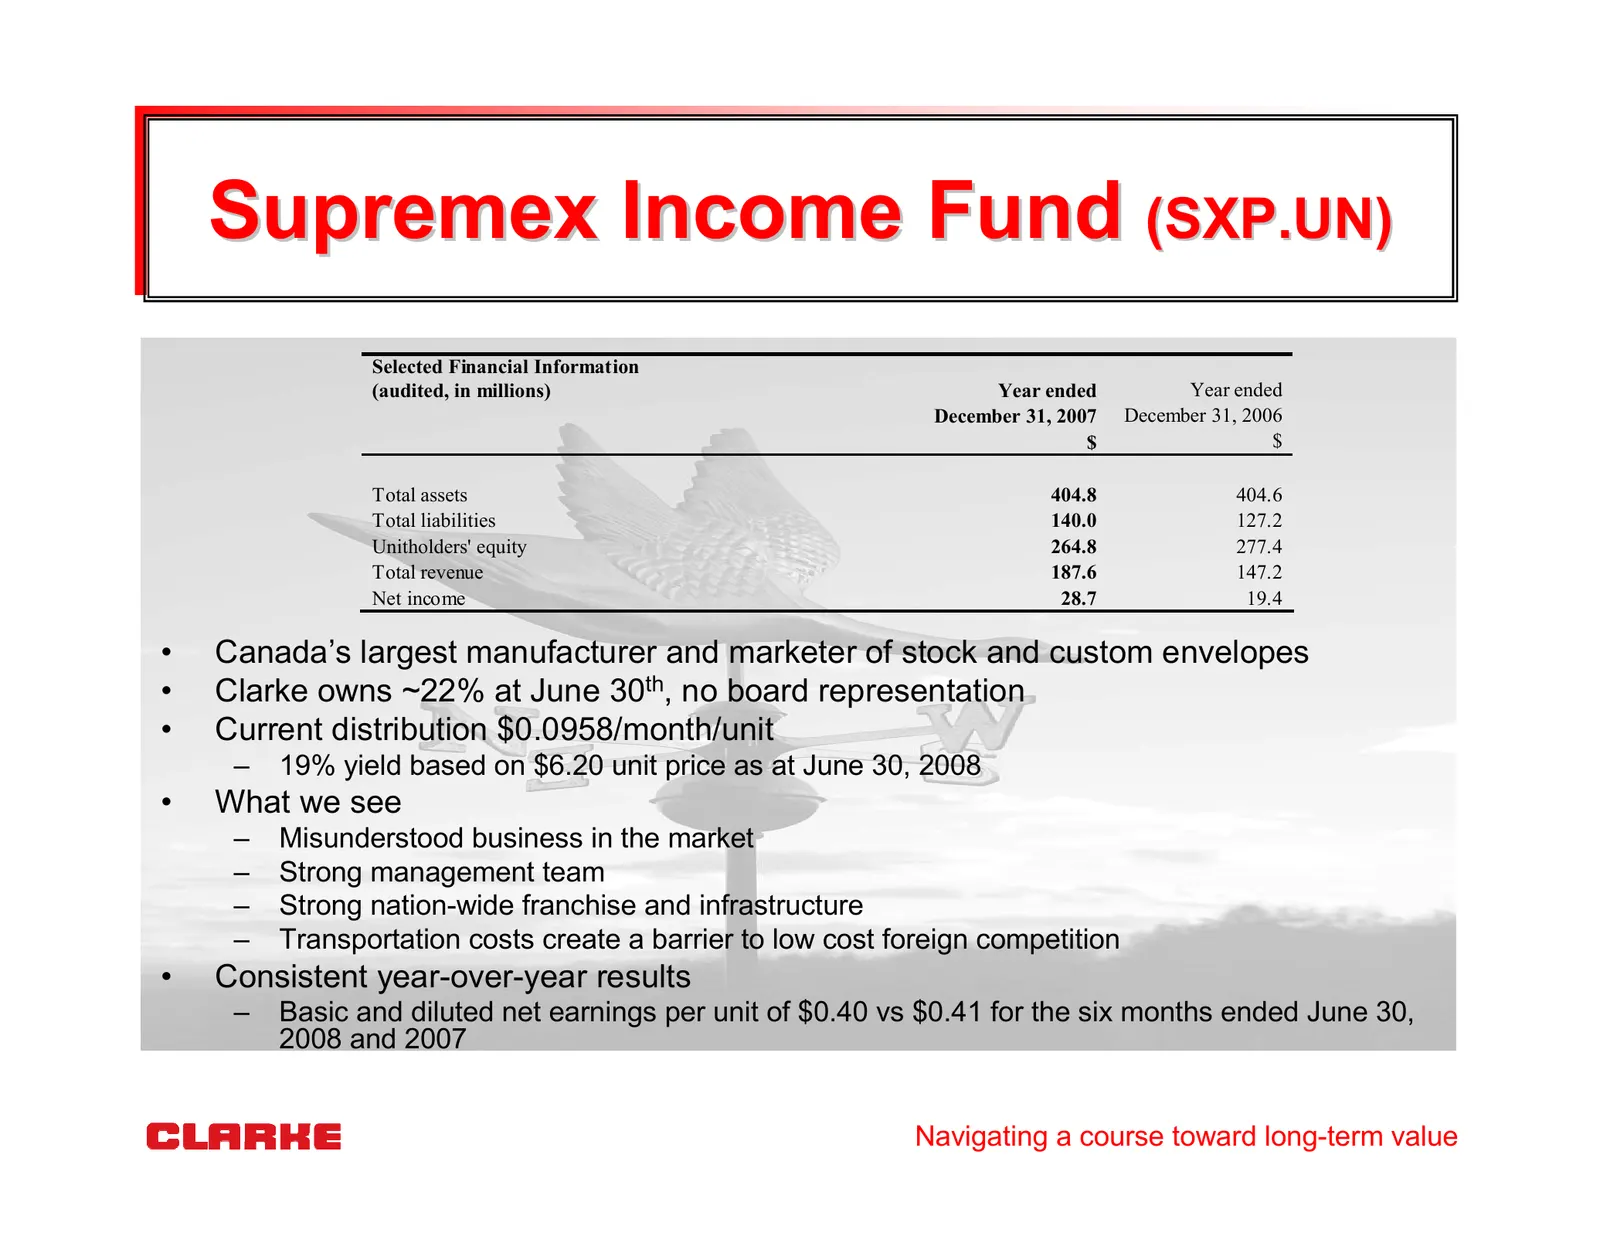
Supremex Income Fund (SXP.UN) Selected Financial Information (audited, in millions) Year ended Year ended December 31, 2007 December 31, 2006 $ $ Total assets 404.8 404.6 Total liabilities 140.0 127.2 Unitholders' equity 264.8 277.4 Total revenue 187.6 147.2 Net income 28.7 19.4 • Canada’s largest m
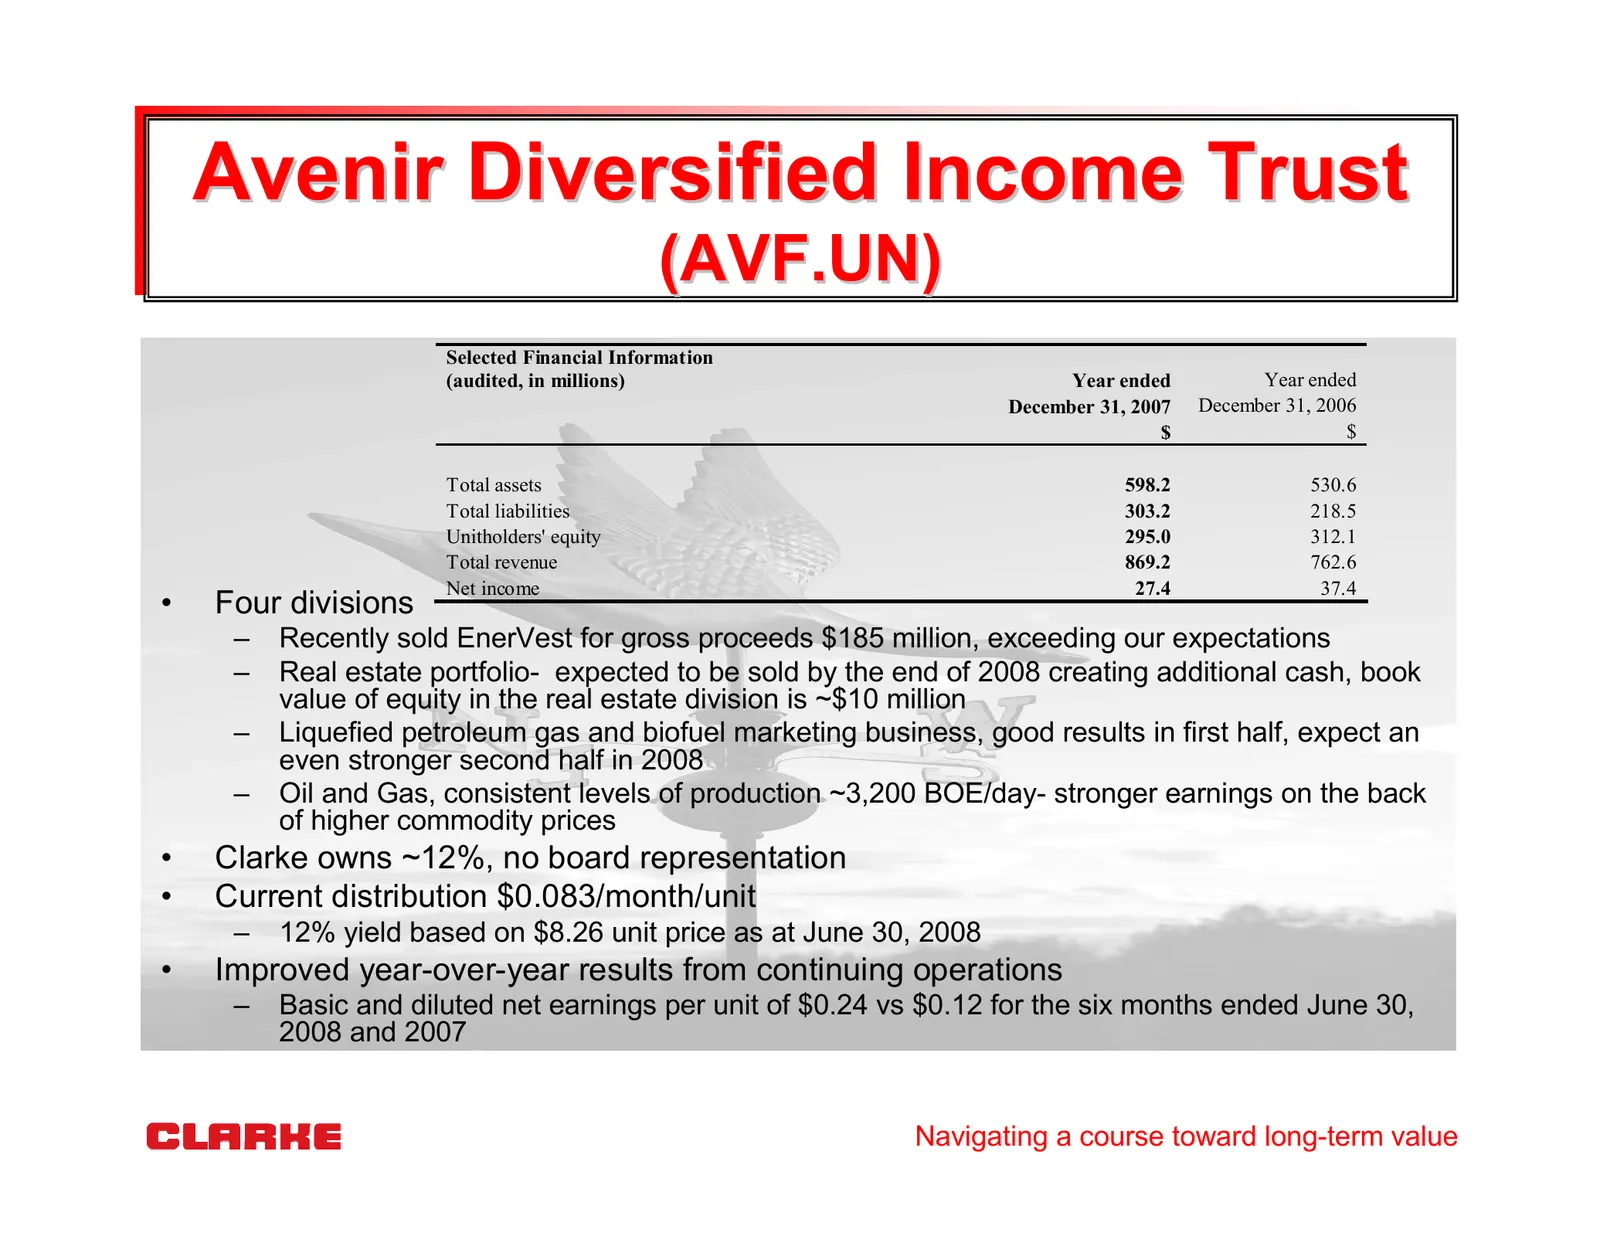
Slide 17: Avenir Diversified Income Trust
Avenir Diversified Income Trust (AVF.UN) Selected Financial Information (audited, in millions) Year ended Year ended December 31, 2007 December 31, 2006 $ $ Total assets 598.2 530.6 Total liabilities 303.2 218.5 Unitholders' equity 295.0 312.1 Total revenue 869.2 762.6 Net income 27.4 37.4 • Four di
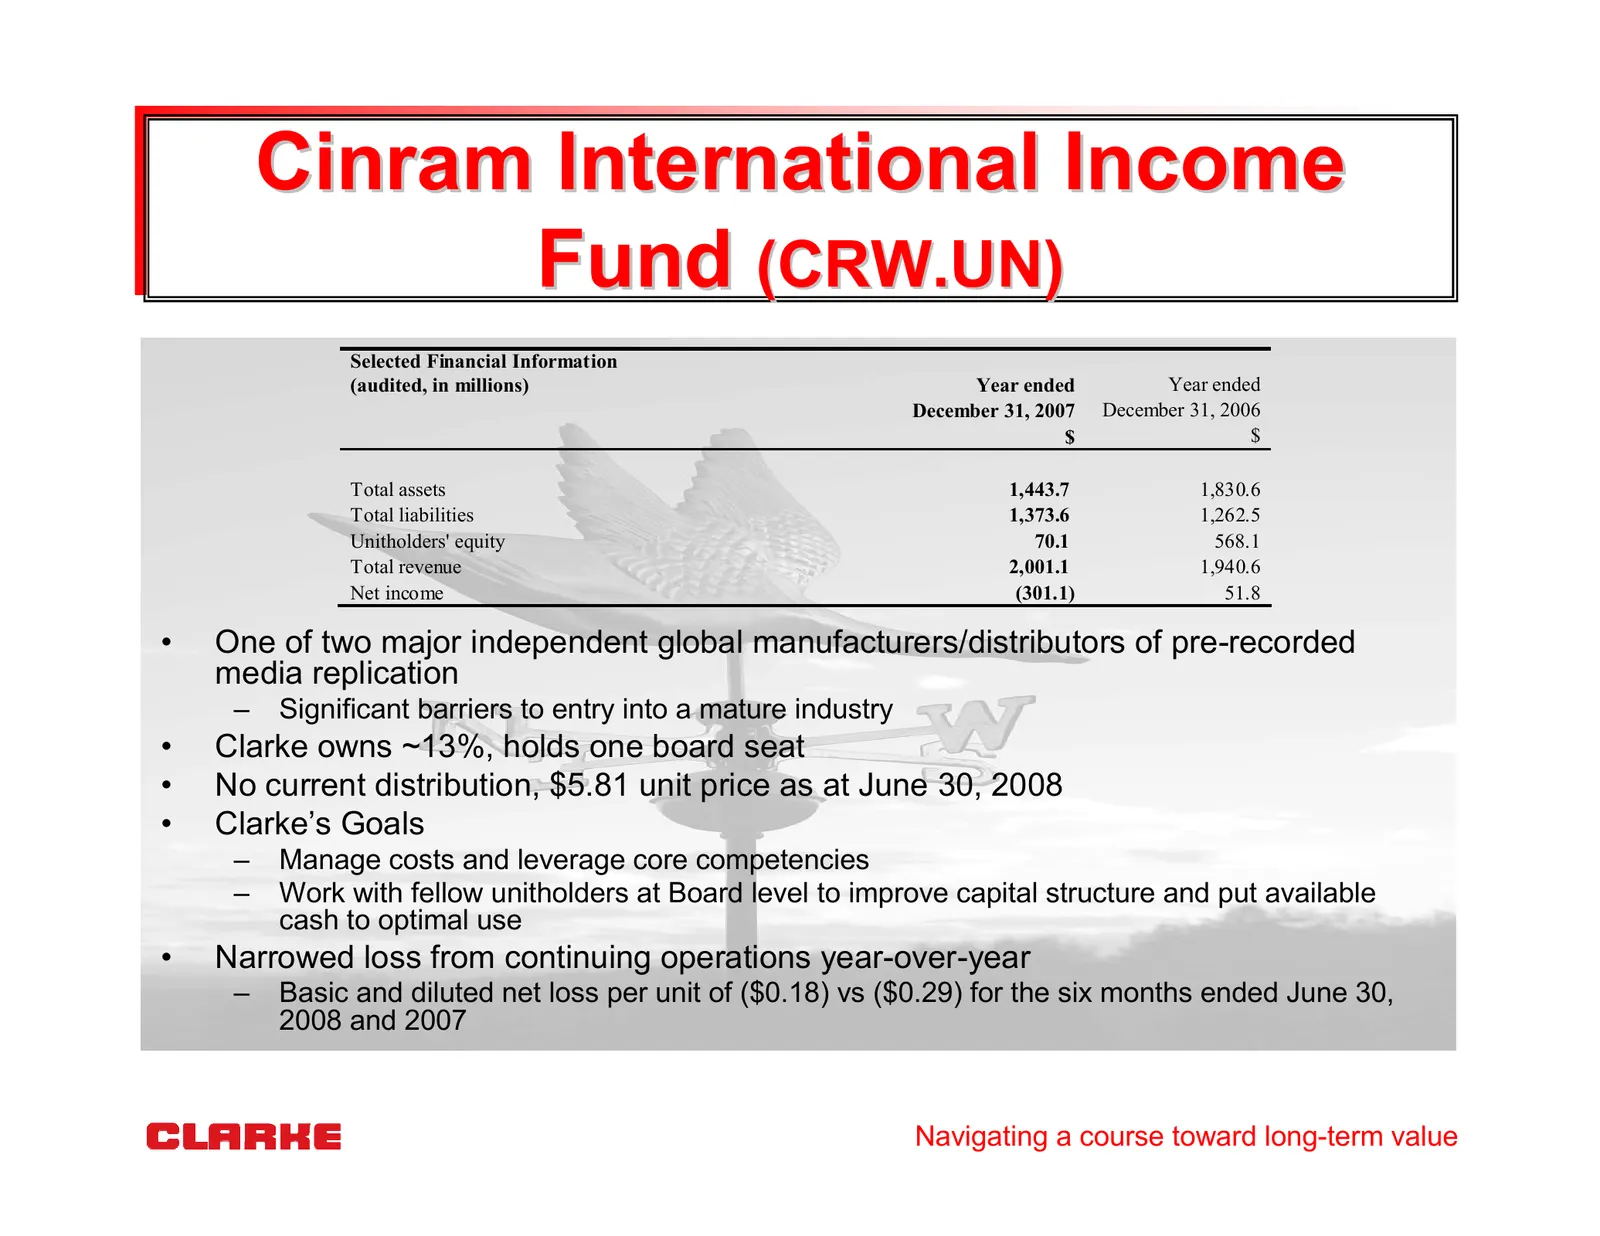
Slide 18: Cinram International Income Fund (CRW.UN)
Cinram International Income Fund (CRW.UN) Selected Financial Information (audited, in millions) Year ended Year ended December 31, 2007 December 31, 2006 $ $ Total assets 1,443.7 1,830.6 Total liabilities 1,373.6 1,262.5 Unitholders' equity 70.1 568.1 Total revenue 2,001.1 1,940.6 Net income (301.1)
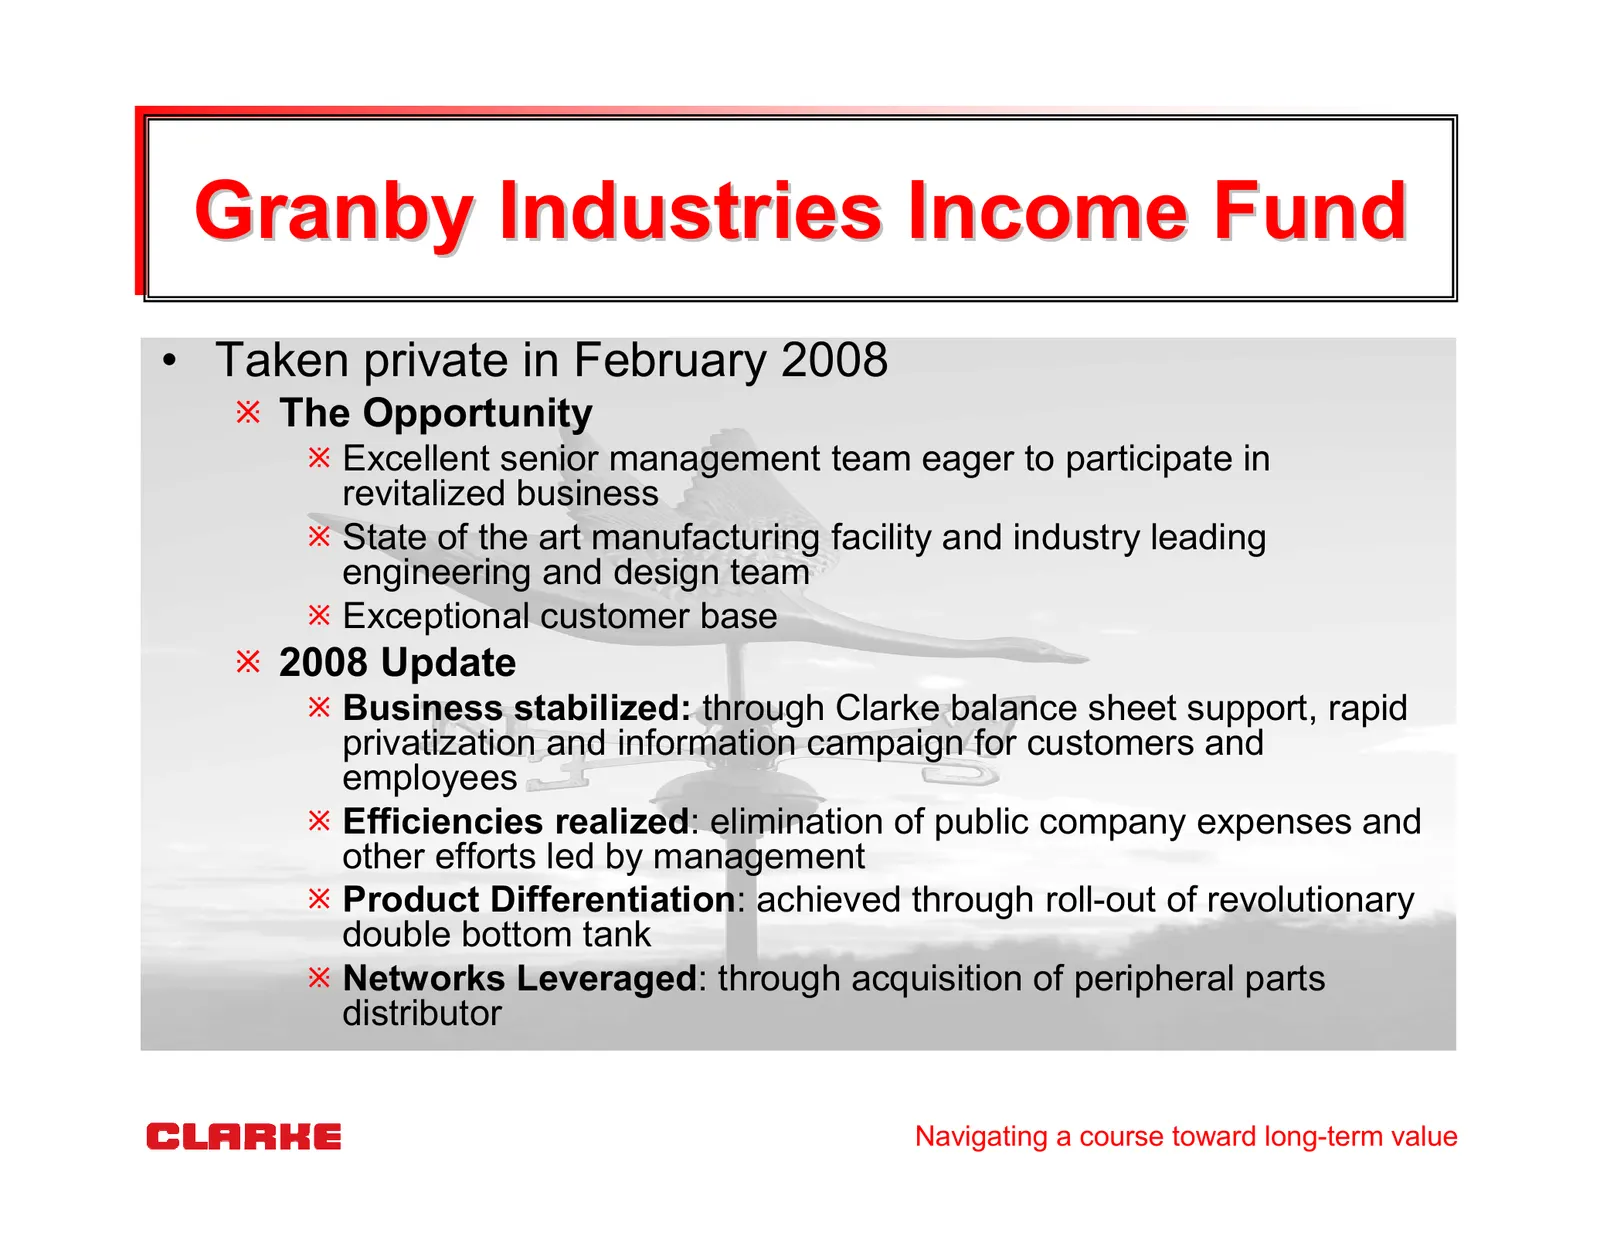
Slide 19: Granby Industries Income Fund
Granby Industries Income Fund • Taken private in February 2008 The Opportunity Excellent senior management team eager to participate in revitalized business State of the art manufacturing facility and industry leading engineering and design team Exceptional customer base 2008 Update Business stabili
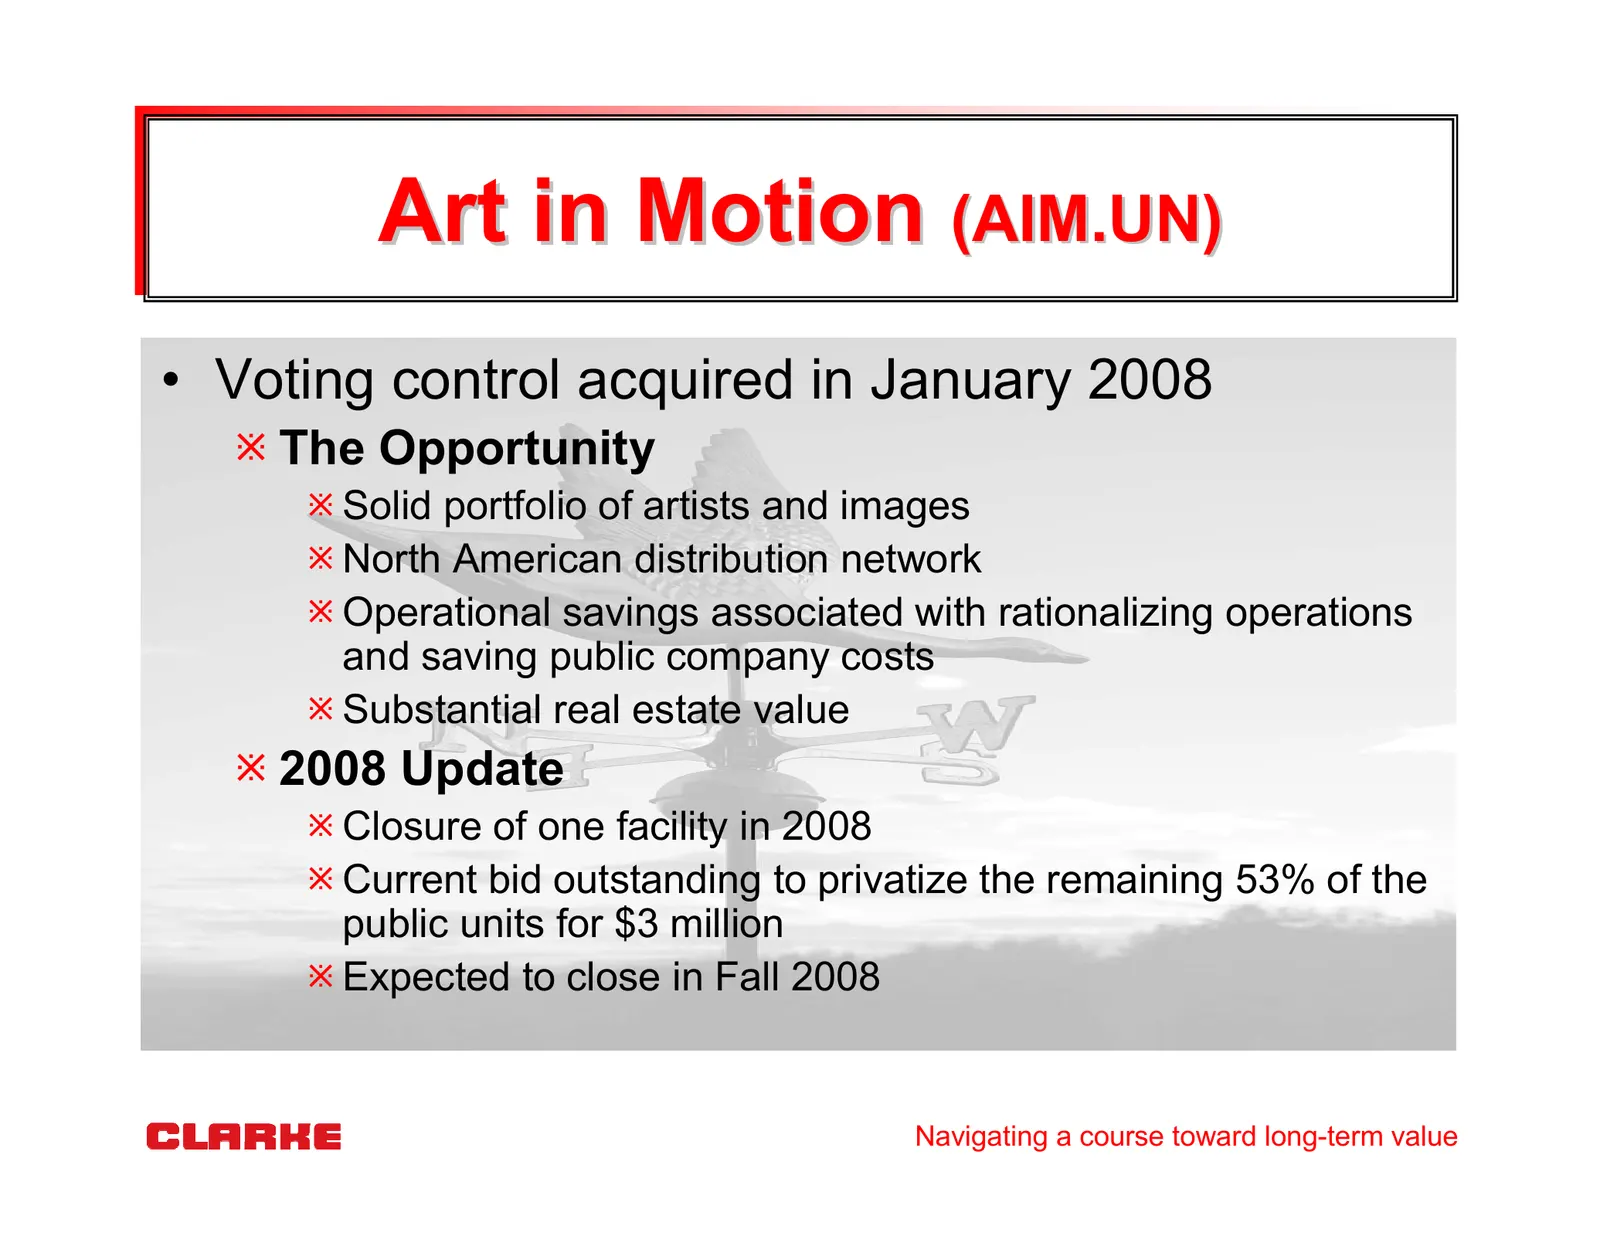
Slide 20: Art in Motion (AIM.UN)
Art in Motion (AIM.UN) • Voting control acquired in January 2008 The Opportunity Solid portfolio of artists and images North American distribution network Operational savings associated with rationalizing operations and saving public company costs Substantial real estate value 2008 Update Closure of
Slide 21: Shermag (SMG)
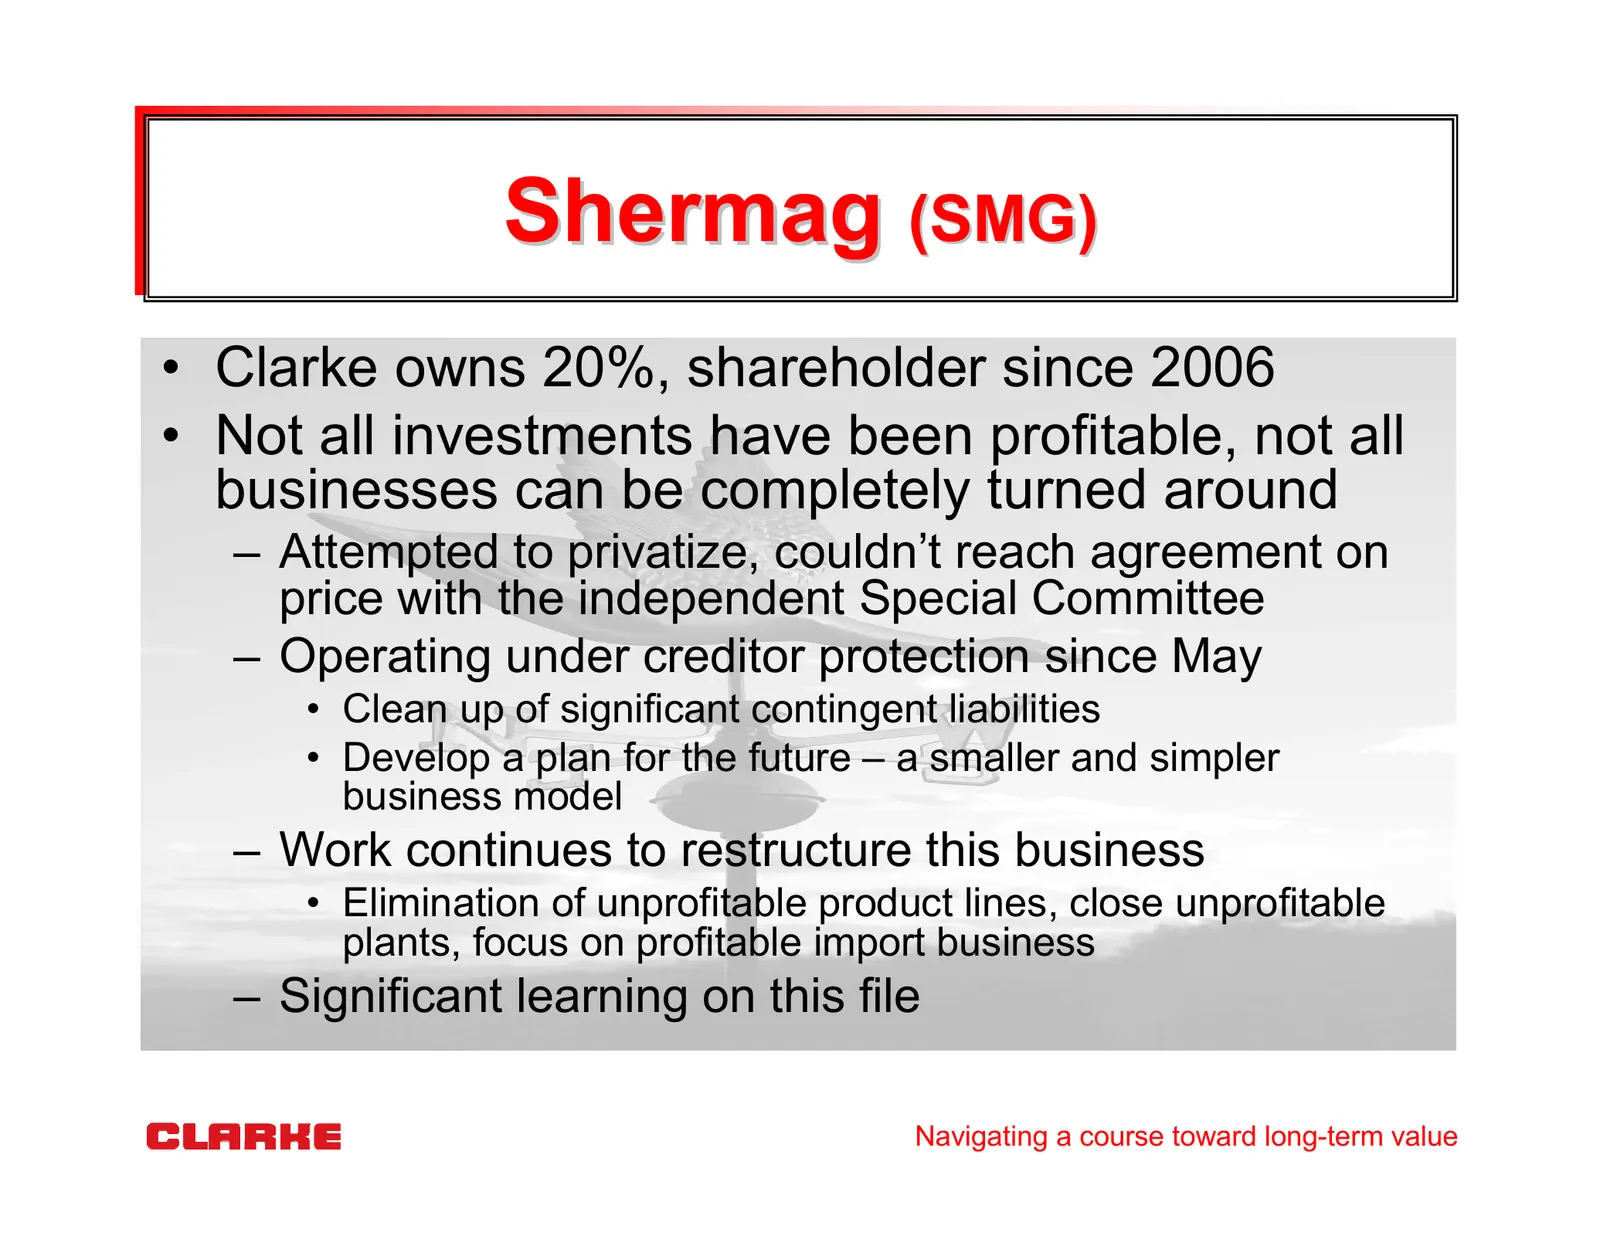
Shermag (SMG) • Clarke owns 20%, shareholder since 2006 • Not all investments have been profitable, not all businesses can be completely turned around – Attempted to privatize, couldn’t reach agreement on price with the independent Special Committee – Operating under creditor protection since May •
Slide 22: 2007 Financial Review
2007 Financial Review Navigating a course toward long-term value
Slide 23: Significant Dispositions - 2007
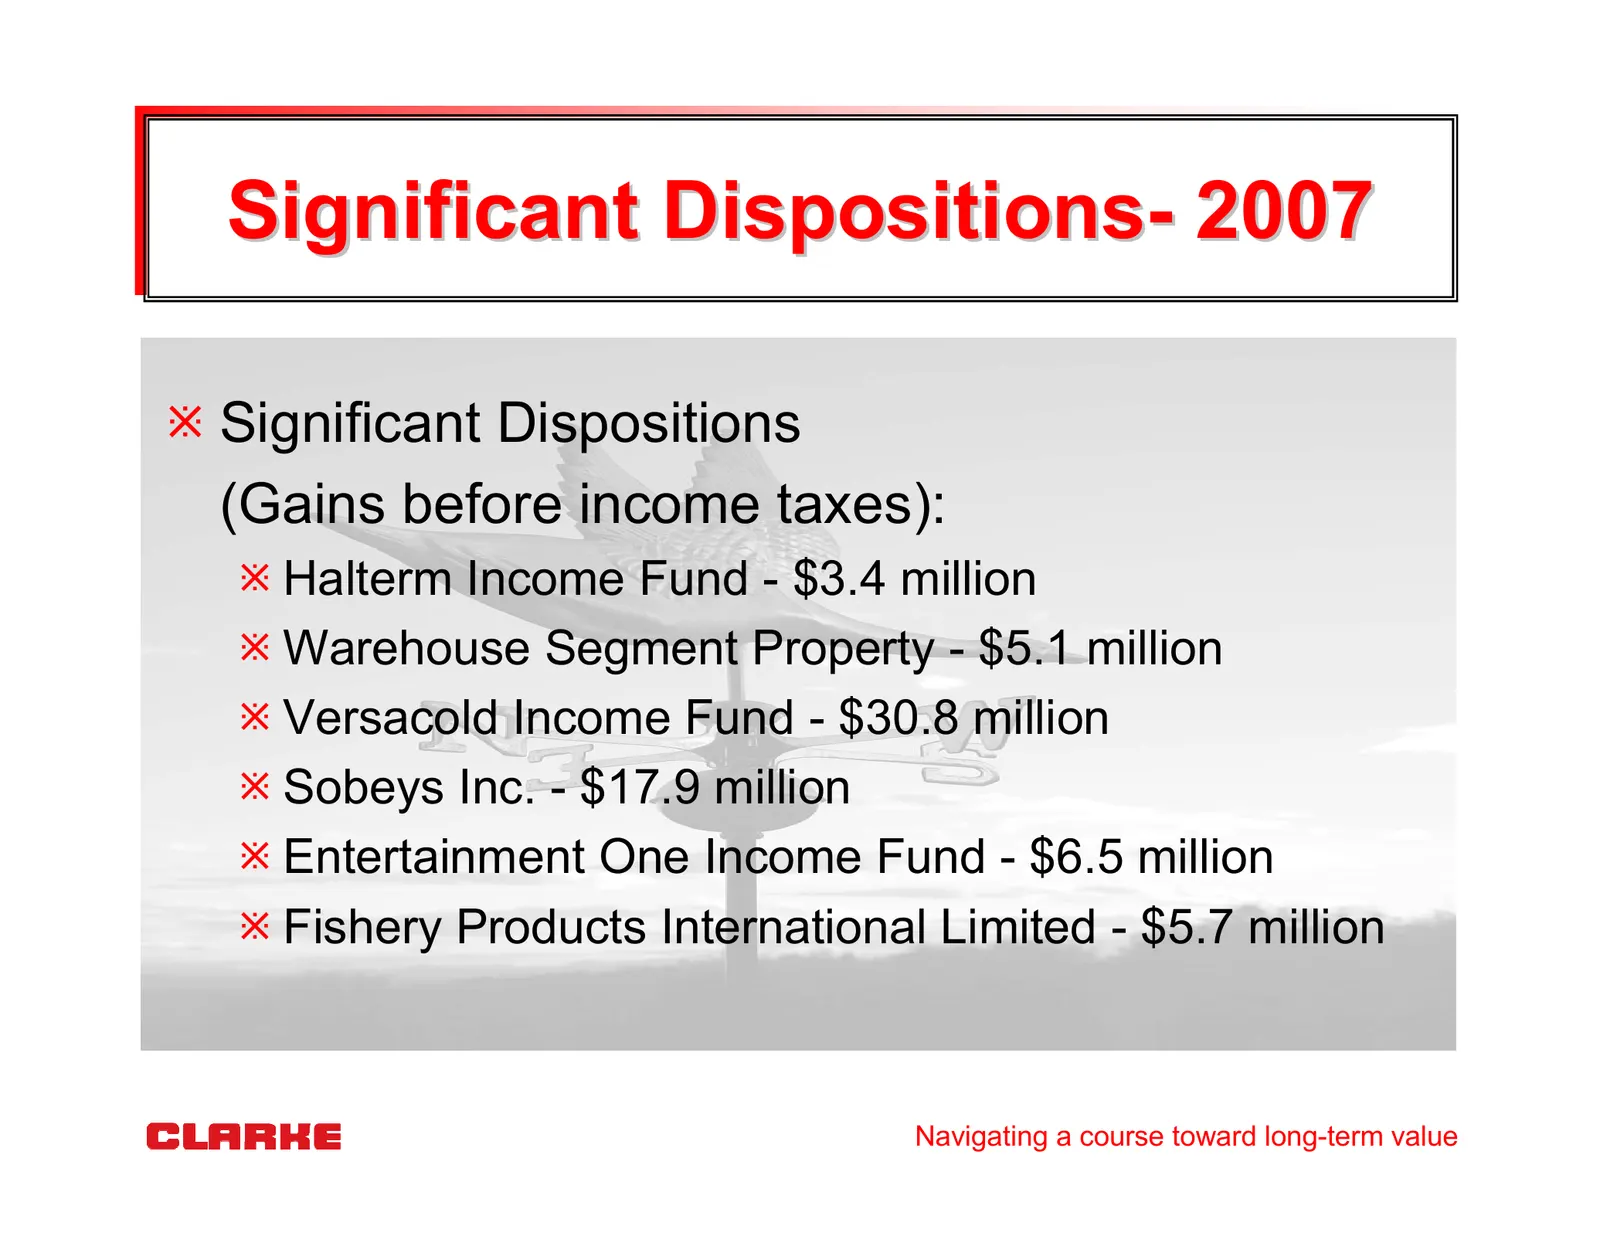
Significant Dispositions- 2007 Significant Dispositions (Gains before income taxes): Halterm Income Fund - $3.4 million Warehouse Segment Property - $5.1 million Versacold Income Fund - $30.8 million Sobeys Inc. - $17.9 million Entertainment One Income Fund - $6.5 million Fishery Products Internatio
Slide 24: Annual Highlights ($ millions)
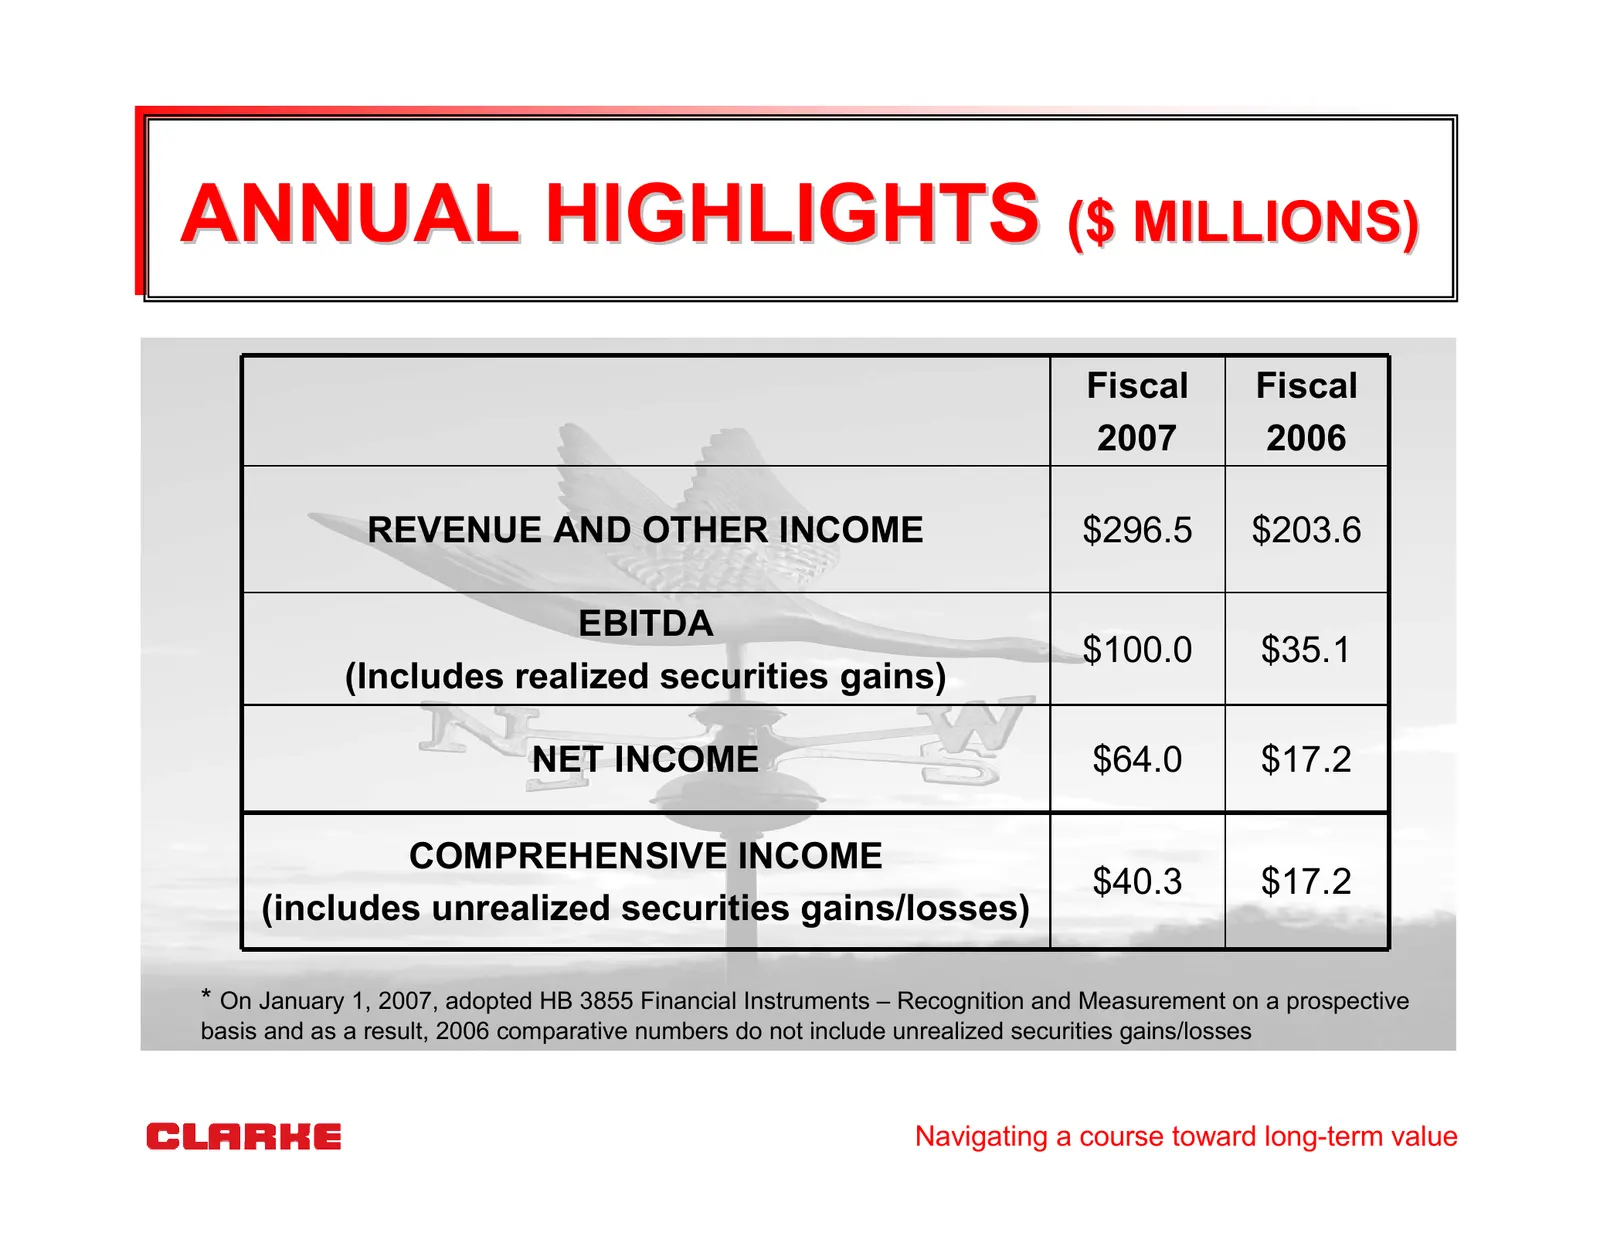
ANNUAL HIGHLIGHTS ($ MILLIONS) Fiscal Fiscal 2007 2006 REVENUE AND OTHER INCOME $296.5 $203.6 EBITDA $100.0 $35.1 (Includes realized securities gains) NET INCOME $64.0 $17.2 COMPREHENSIVE INCOME $40.3 $17.2 (includes unrealized securities gains/losses) * On January 1, 2007, adopted HB 3855 Financial
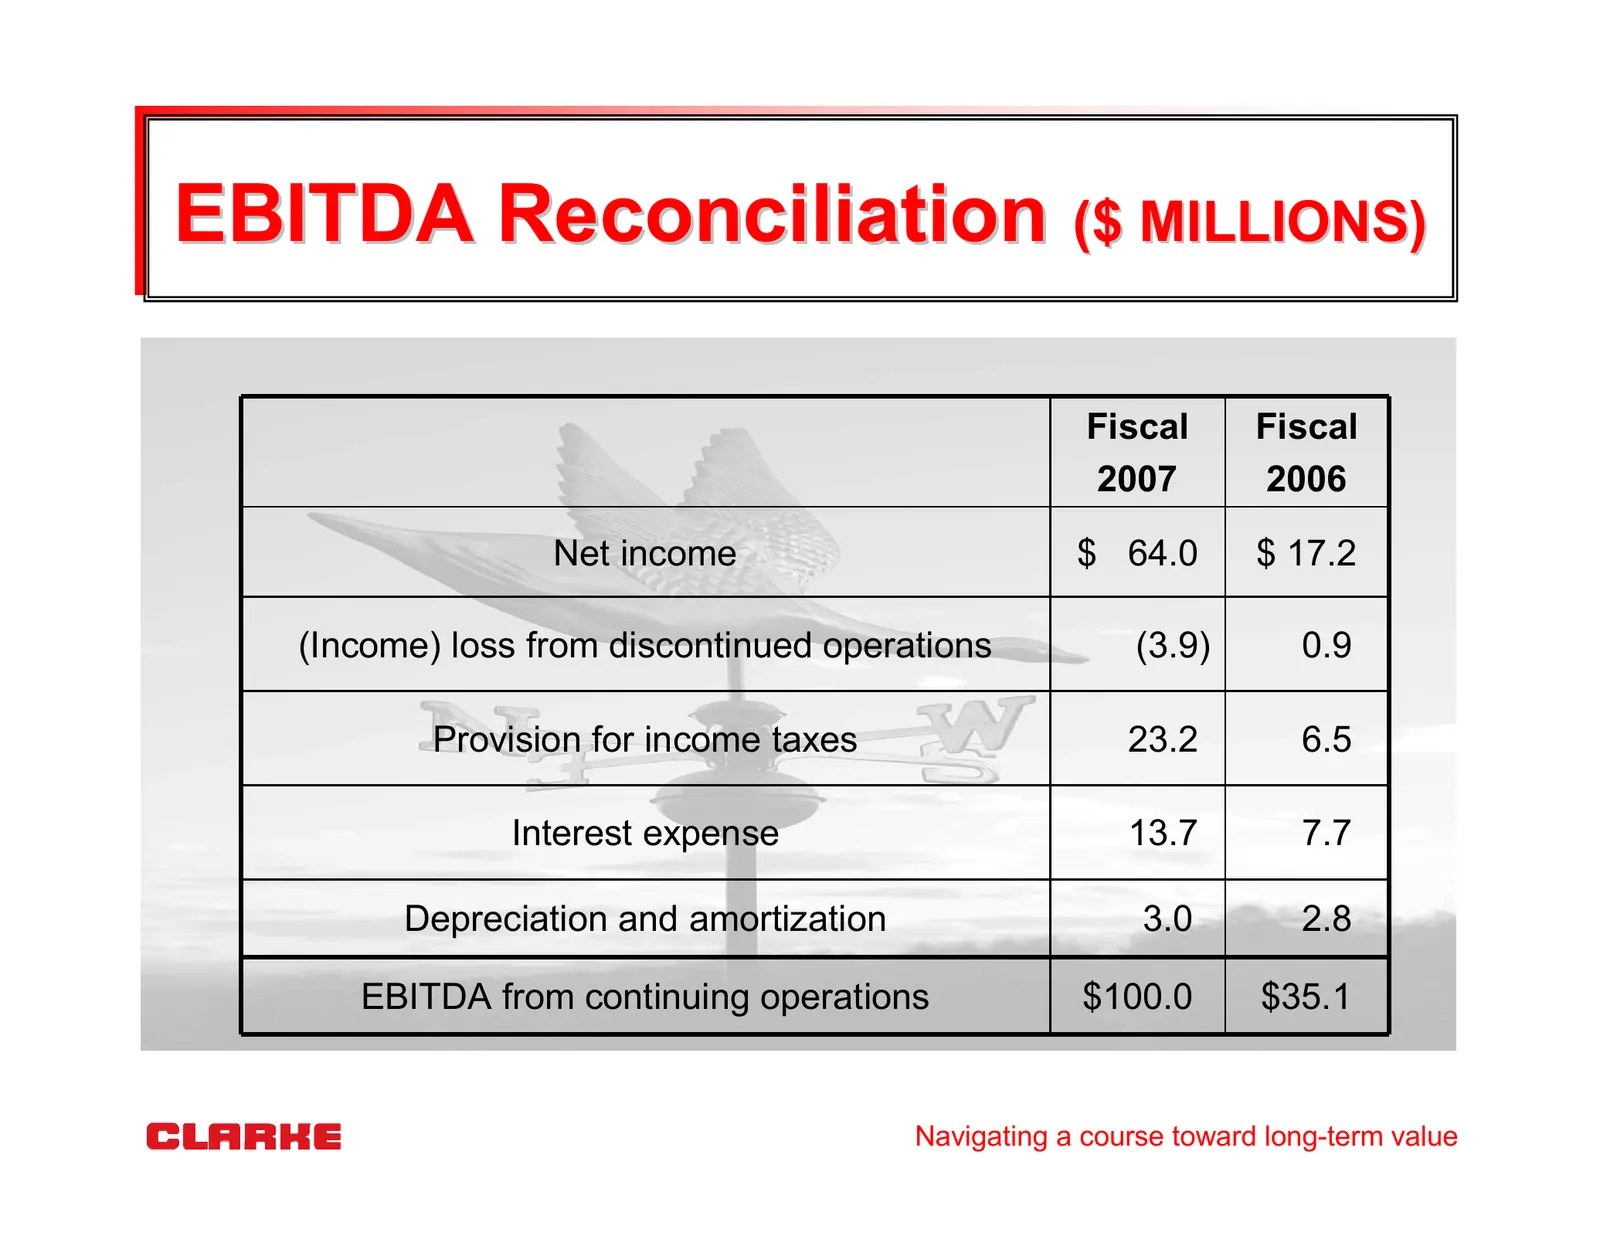
Slide 25: EBITDA Reconciliation ($ millions)
EBITDA Reconciliation ($ MILLIONS) Fiscal Fiscal 2007 2006 Net income $ 64.0 $ 17.2 (Income) loss from discontinued operations (3.9) 0.9 Provision for income taxes 23.2 6.5 Interest expense 13.7 7.7 Depreciation and amortization 3.0 2.8 EBITDA from continuing operations $100.0 $35.1 Navigating a cou
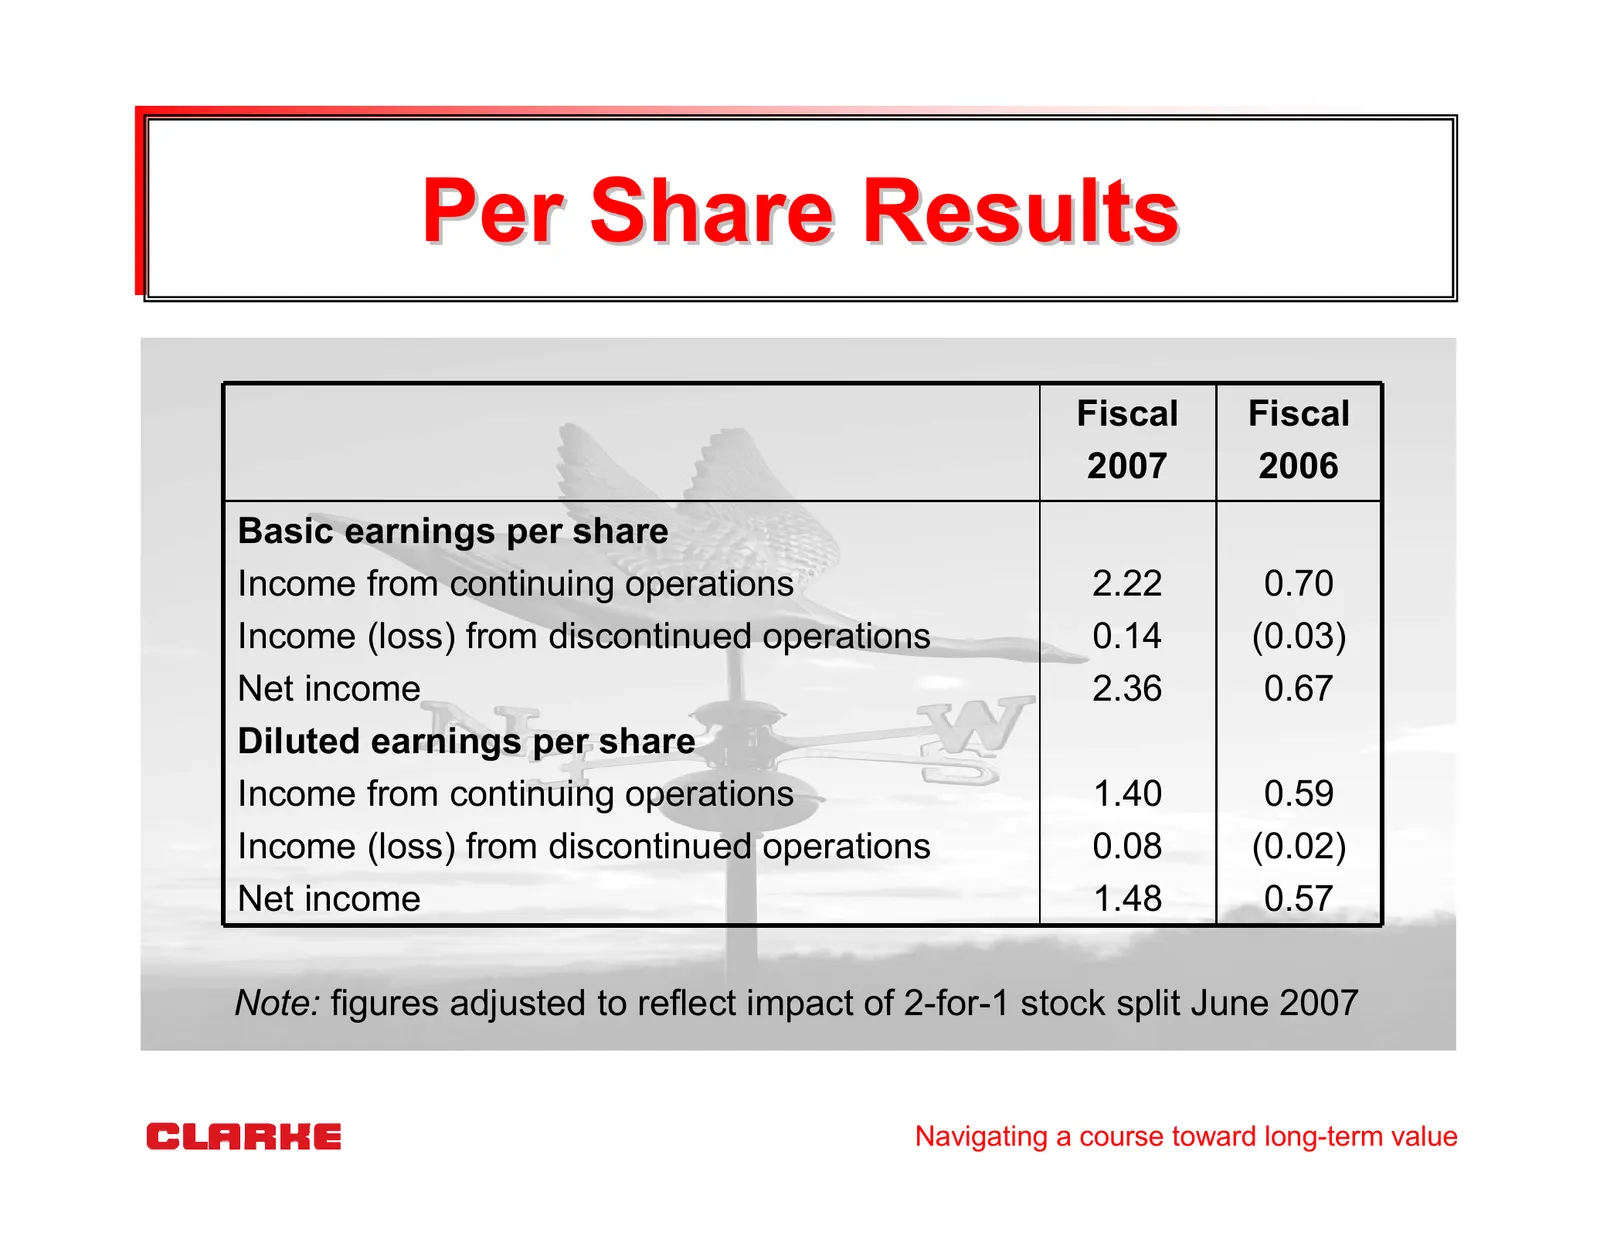
Slide 26: Per Share Results
Per Share Results Fiscal Fiscal 2007 2006 Basic earnings per share Income from continuing operations 2.22 0.70 Income (loss) from discontinued operations 0.14 (0.03) Net income 2.36 0.67 Diluted earnings per share Income from continuing operations 1.40 0.59 Income (loss) from discontinued operations
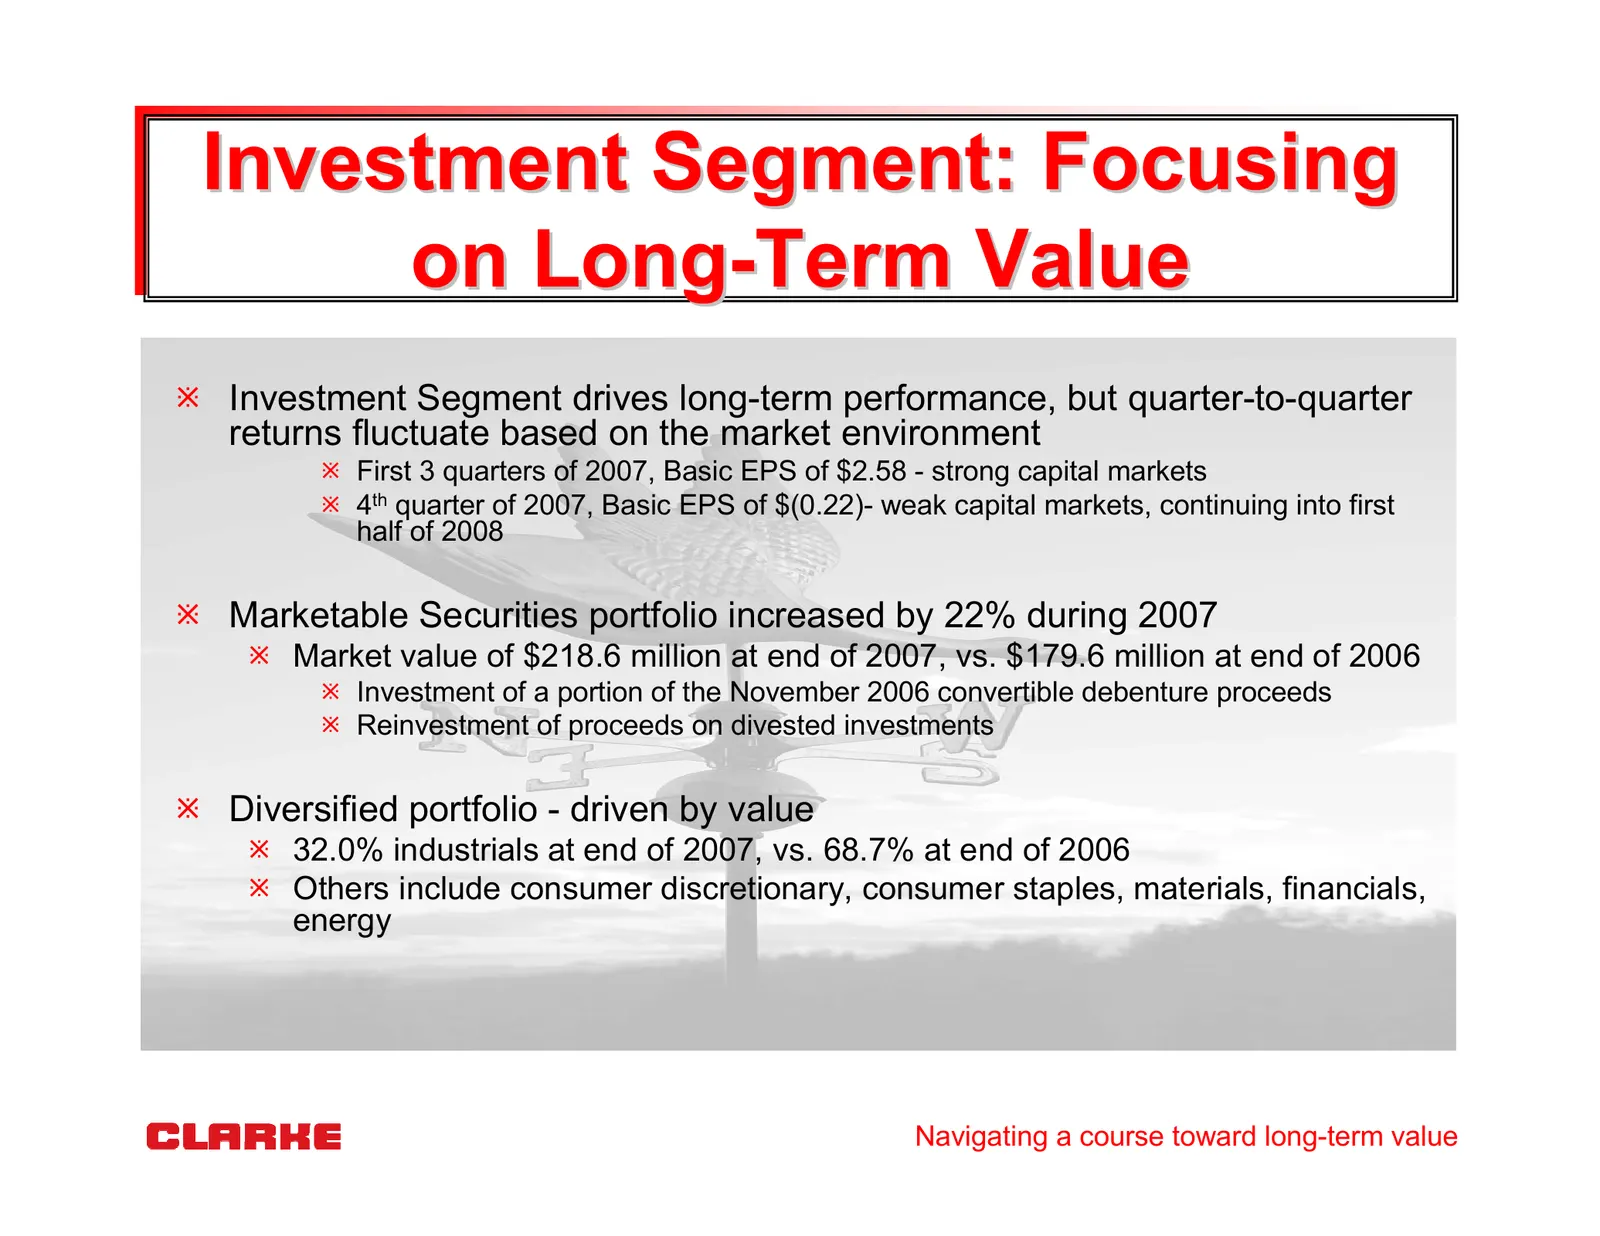
Slide 27: Investment Segment: Focusing on Long-Term Value
Investment Segment: Focusing on Long-Term Value Investment Segment drives long-term performance, but quarter-to-quarter returns fluctuate based on the market environment First 3 quarters of 2007, Basic EPS of $2.58 - strong capital markets 4th quarter of 2007, Basic EPS of $(0.22)- weak capital mark
Slide 28: Review of 1st Half 2008 Results
Review of 1st Half 2008 Results Navigating a course toward long-term value
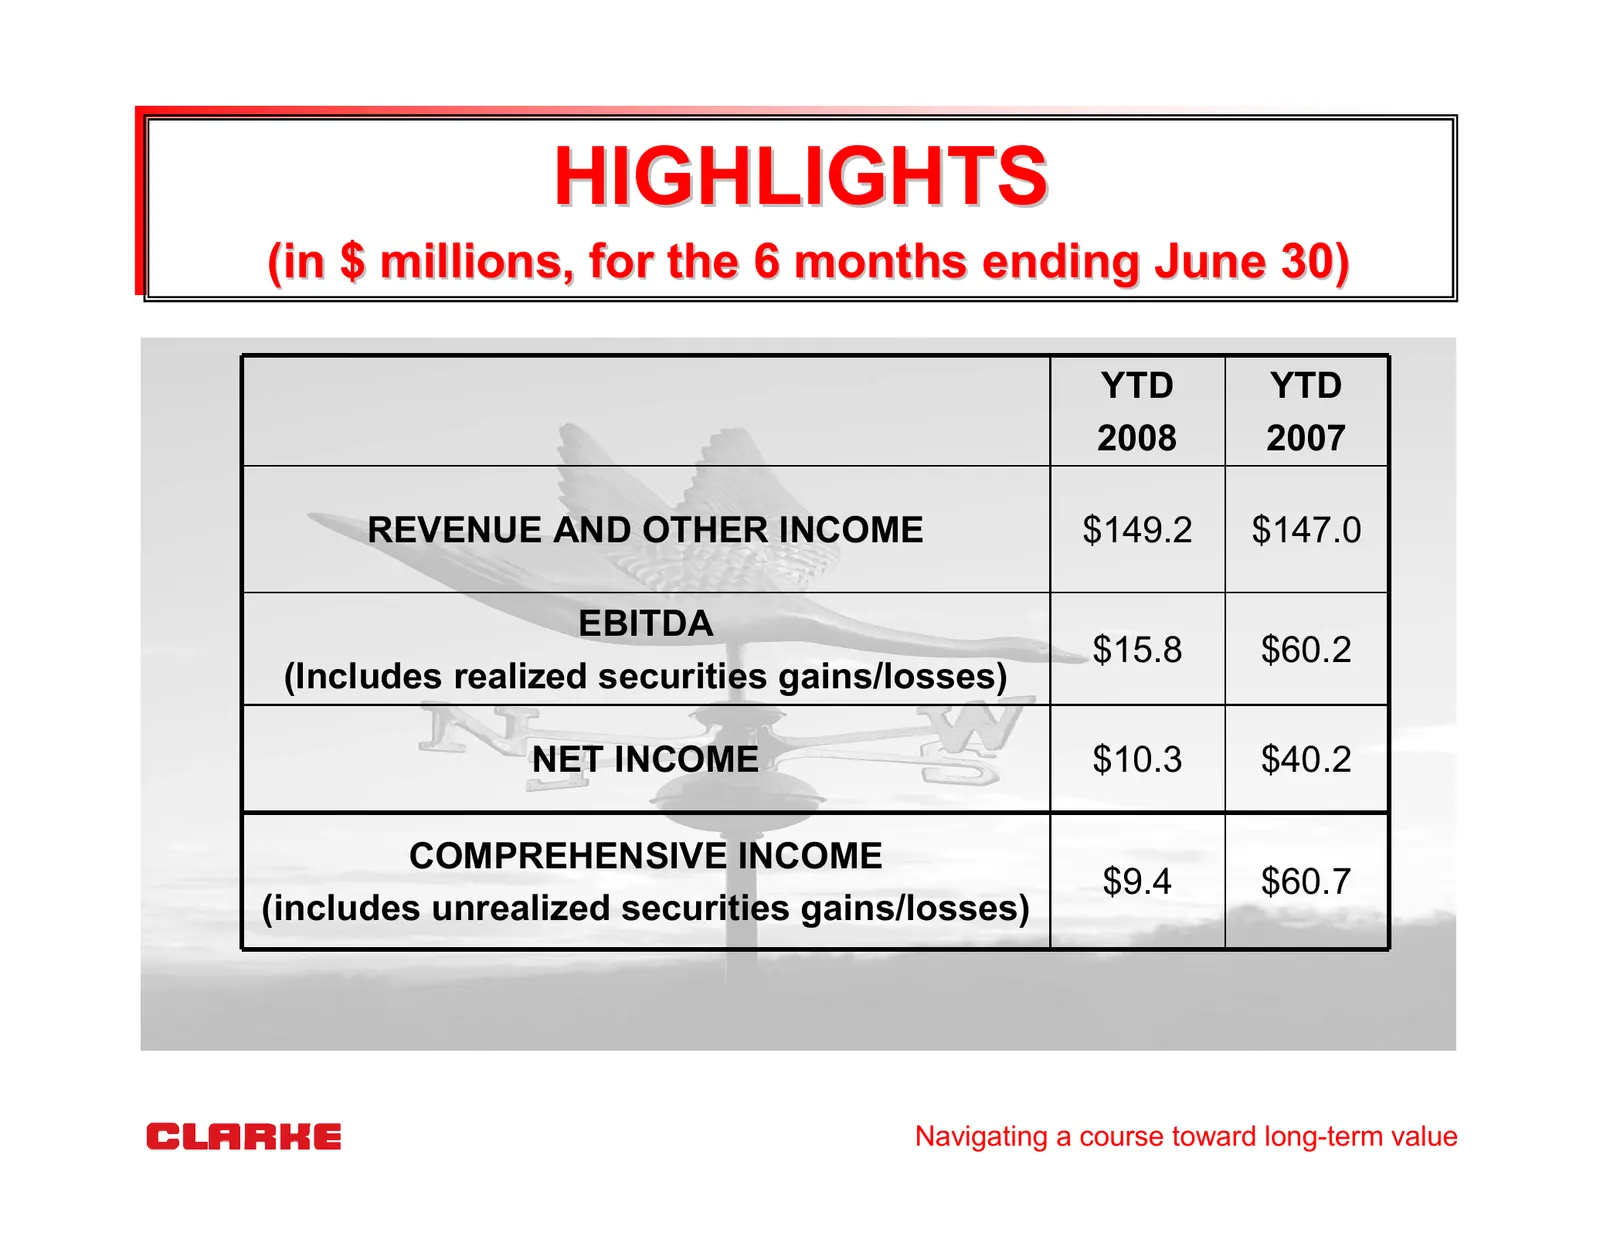
Slide 29: Highlights
HIGHLIGHTS (in $ millions, for the 6 months ending June 30) YTD YTD 2008 2007 REVENUE AND OTHER INCOME $149.2 $147.0 EBITDA $15.8 $60.2 (Includes realized securities gains/losses) NET INCOME $10.3 $40.2 COMPREHENSIVE INCOME $9.4 $60.7 (includes unrealized securities gains/losses) Navigating a course
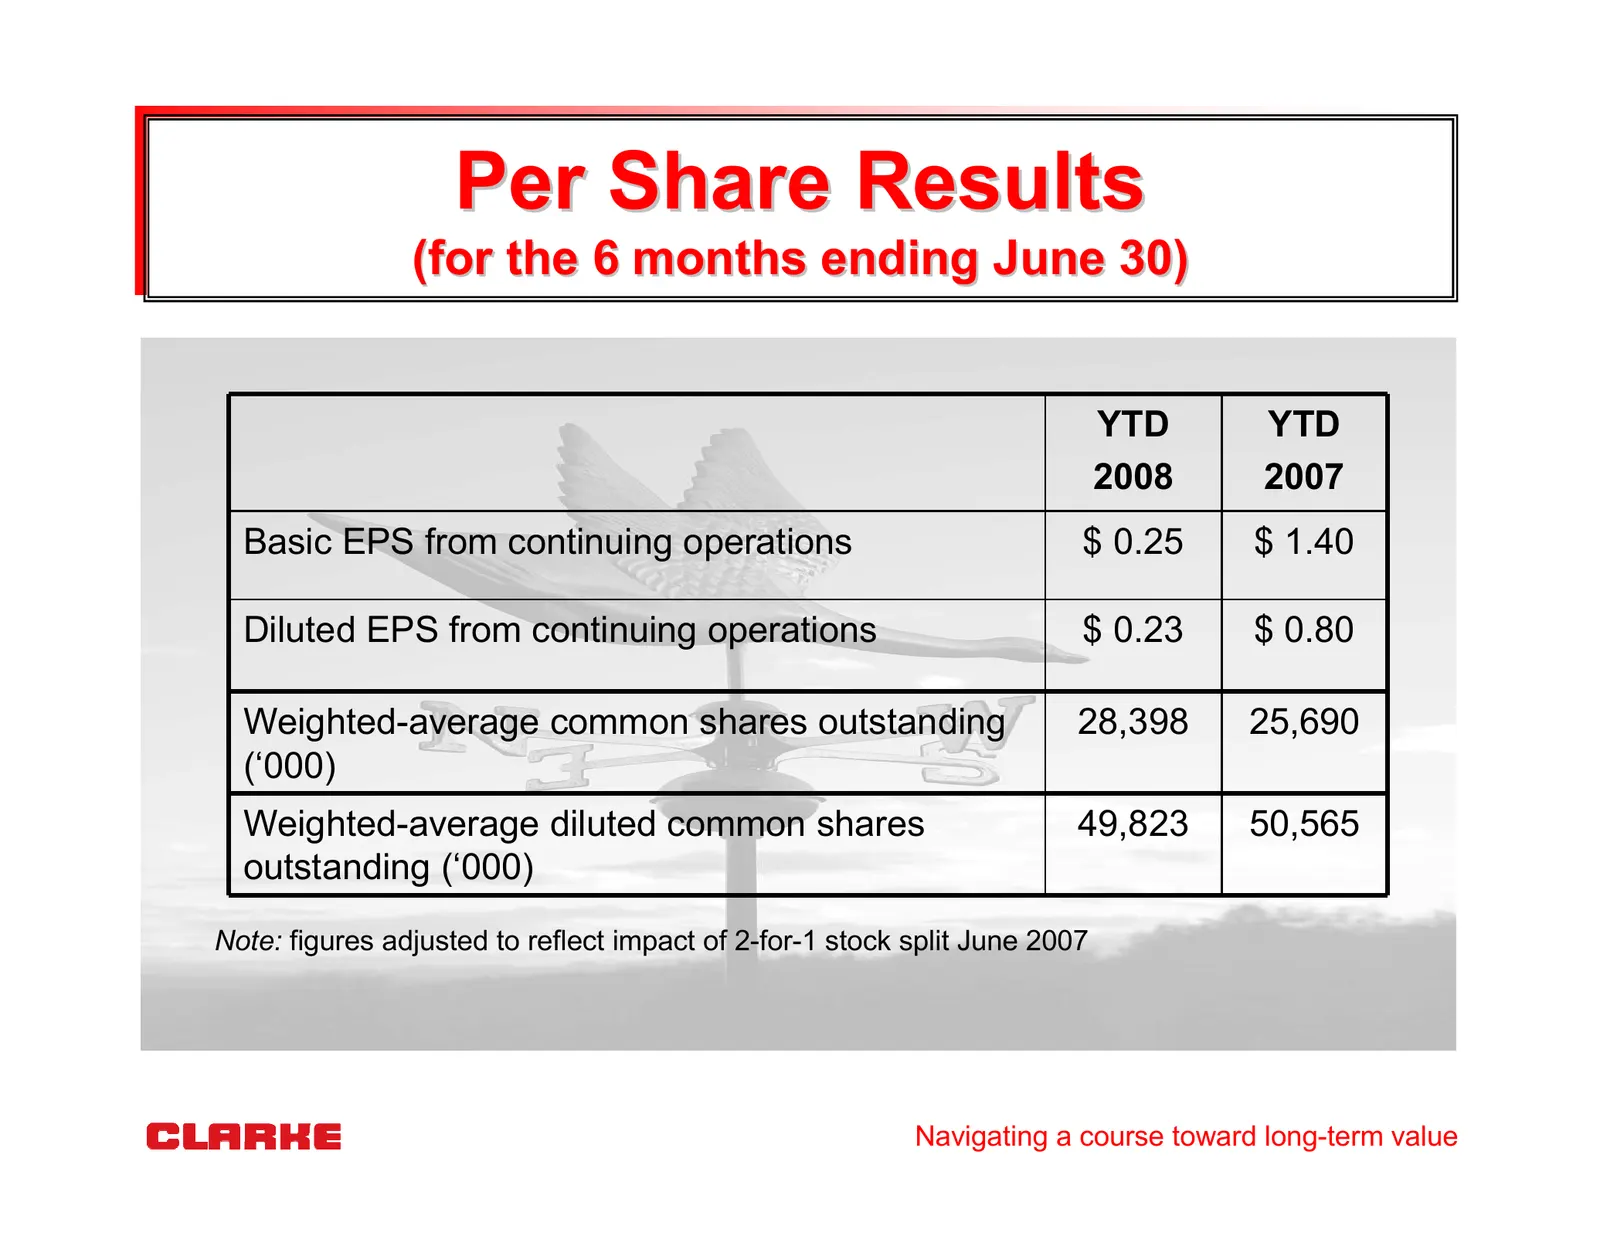
Slide 30: Per Share Results
Per Share Results (for the 6 months ending June 30) YTD YTD 2008 2007 Basic EPS from continuing operations $ 0.25 $ 1.40 Diluted EPS from continuing operations $ 0.23 $ 0.80 Weighted-average common shares outstanding 28,398 25,690 (‘000) Weighted-average diluted common shares 49,823 50,565 outstandi
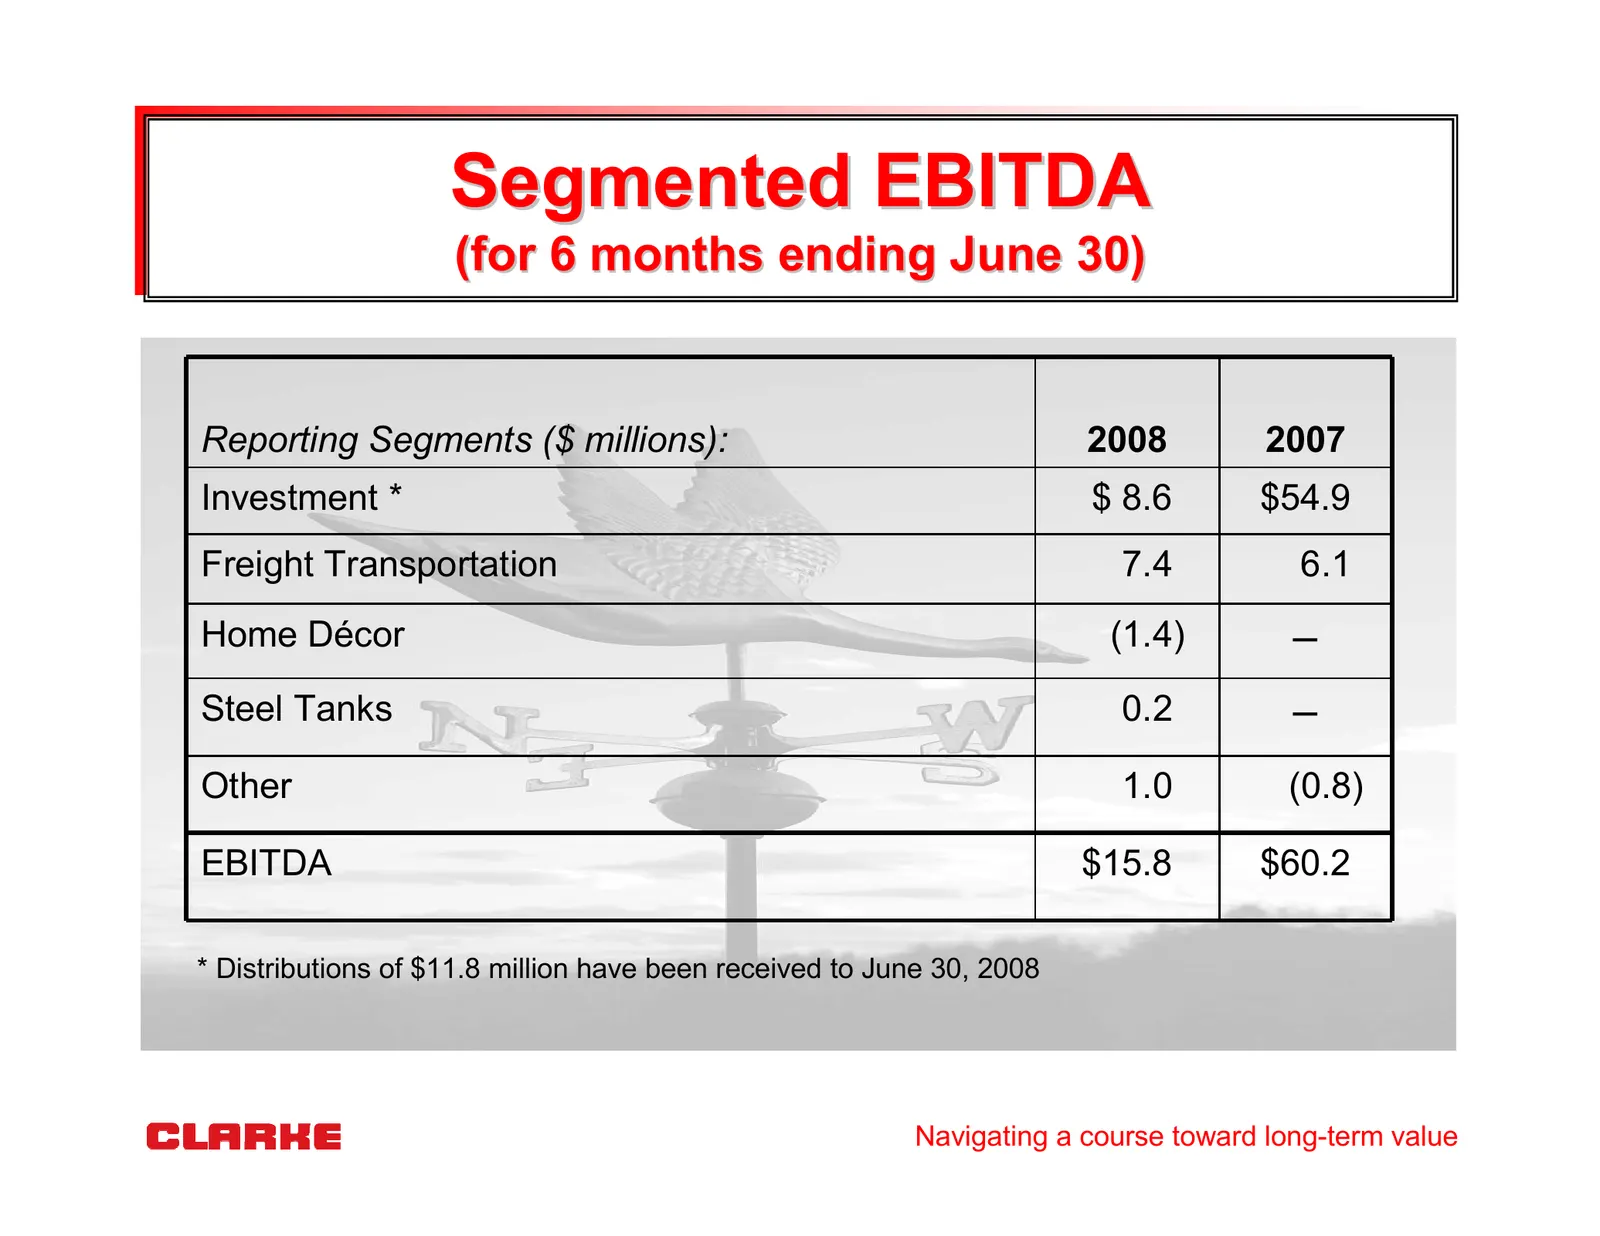
Slide 31: Segmented EBITDA
Segmented EBITDA (for 6 months ending June 30) Reporting Segments ($ millions): 2008 2007 Investment * $ 8.6 $54.9 Freight Transportation 7.4 6.1 Home Décor (1.4) Q Steel Tanks 0.2 Q Other 1.0 (0.8) EBITDA $15.8 $60.2 * Distributions of $11.8 million have been received to June 30, 2008 Navigating a
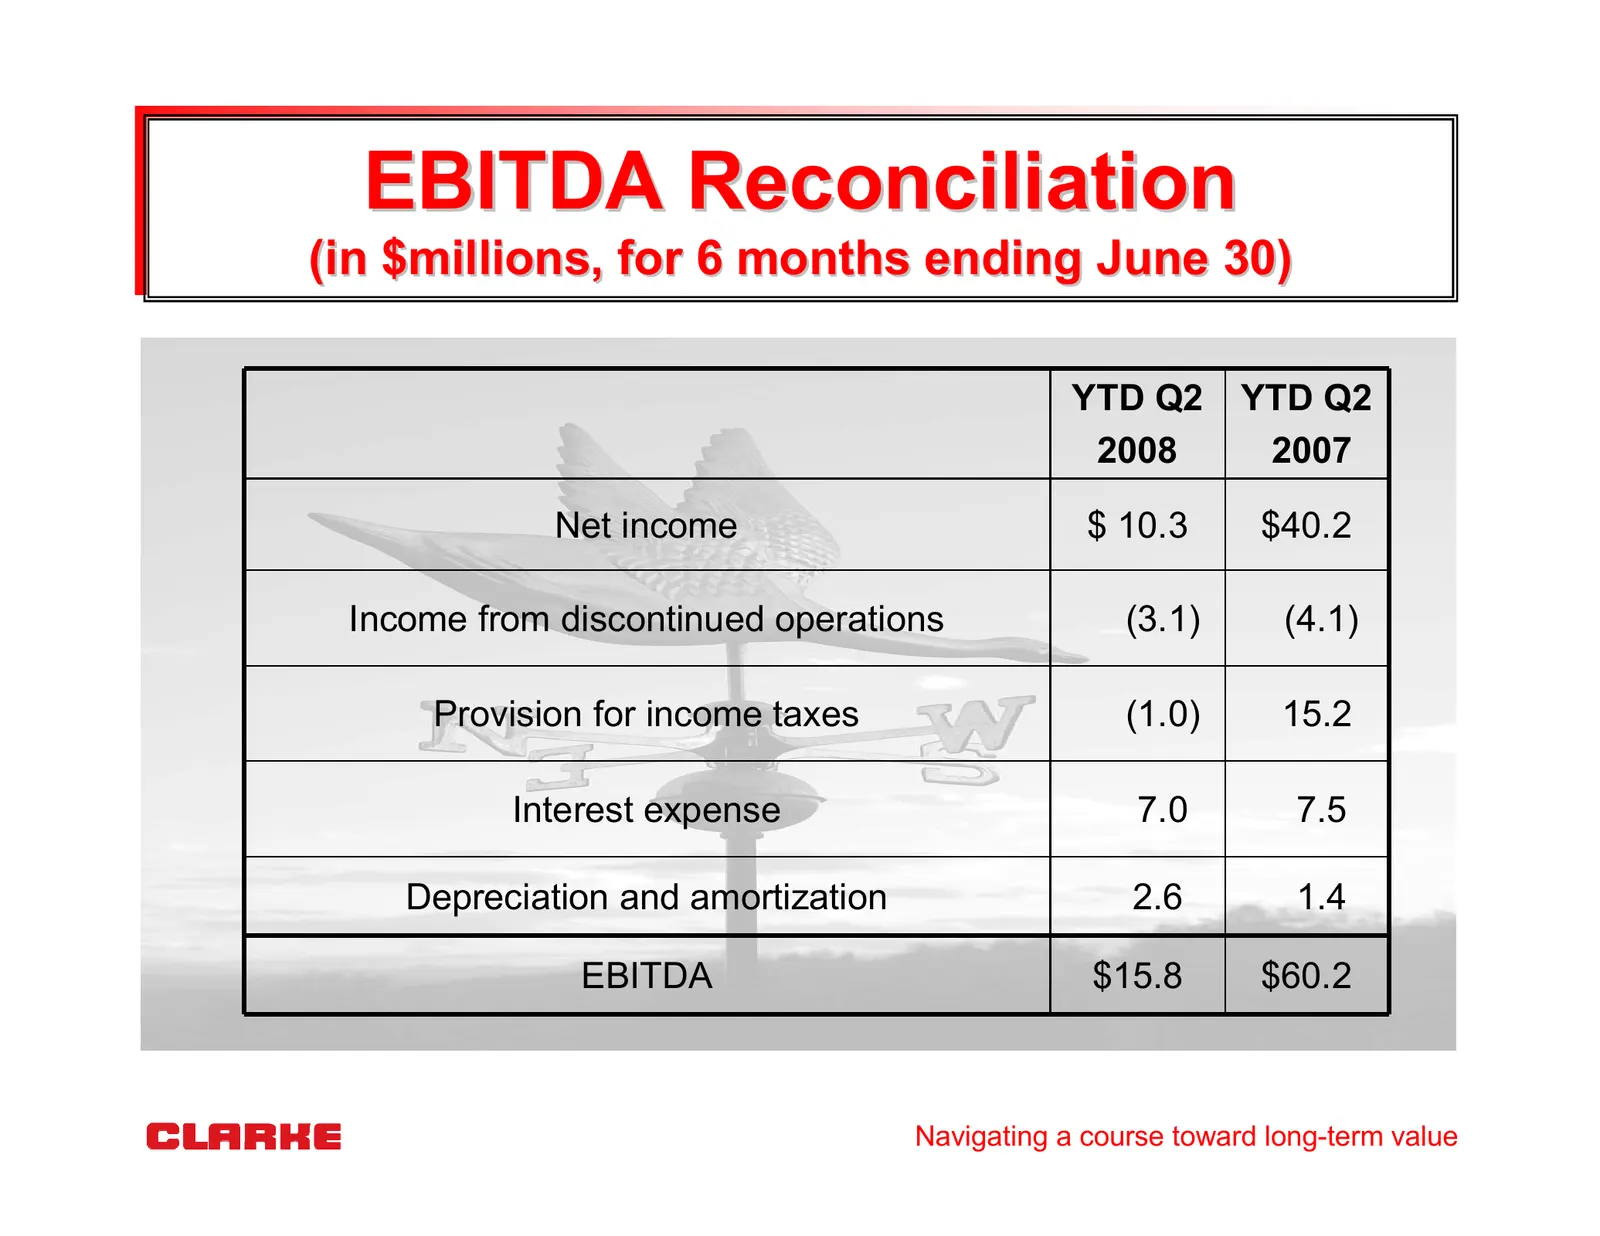
Slide 32: EBITDA Reconciliation
EBITDA Reconciliation (in $millions, for 6 months ending June 30) YTD Q2 YTD Q2 2008 2007 Net income $ 10.3 $40.2 Income from discontinued operations (3.1) (4.1) Provision for income taxes (1.0) 15.2 Interest expense 7.0 7.5 Depreciation and amortization 2.6 1.4 EBITDA $15.8 $60.2 Navigating a cours
Slide 33: Significant Transactions 2008
Significant Transactions 2008 • Art in Motion Income Fund control block – Presently have a bid outstanding to purchase the remaining outstanding publically held units to complete privatization • Sure-Gro Inc. – Pure Energy – Modugno-Hortibec • Granby Industries Income Fund privatization • Substantia
Slide 34: Investing for the Future
Investing for the Future • ~$63 million invested into significant investments in 2008 – Privatizing Art in Motion and Granby – Marketable securities and long term investments at June 30th were $284 million (versus $234 million at December 31, 2007) • ~$22 million spent to August 31st on Clarke share
Slide 35: Outlook
Outlook • Clarke’s evolution continues toward a diversified group of operating entities – Longer term goal is to acquire larger positions in fewer names – Freight Transportation delivering solid and improving results • Expect price volatility in our marketable securities portfolio – Limited opportun
Source: Internet Archive copy of clarkeinc.com
More decks from Clarke Inc.
 Investor Presentation (2021)13 slides · 2021
 Q2 2015 Earnings Presentation21 slides · Aug 26, 2015
 Shareholder Meeting (May 2015)23 slides · May 7, 2015
 Investor Presentation (March 2015)18 slides · Mar 27, 2015
 Investor Presentation (November 2014)19 slides · Nov 11, 2014
 Investor Presentation (May 2014)19 slides · May 2014