Commerce.com, Inc. - Series 1 · NASDAQ:CMRC
Commerce.com, Inc. - Series 1 — Commerce.com — Q3 2026 Earnings Presentation
37 slides from Commerce.com, Inc. - Series 1's earnings presentation, Nov 5, 2026

Slide 1: 3Q 2026 Earnings Presentation
3Q 2026 Earnings Presentation © Commerce. All rights reserved.
Slide 2: Disclaimer
DISCLAIMER This presentation has been prepared by Commerce.com, Inc. (“we,” “us,” “our,” “Commerce,” “Commerce.com” or the “Company”). This presentation may contain forward-looking statements which constitute the views of the Company with respect to future events which can be identified by the use of

Slide 3: Meet Commerce
Meet Commerce © Commerce. All rights reserved.
Slide 4: Our vision and mission
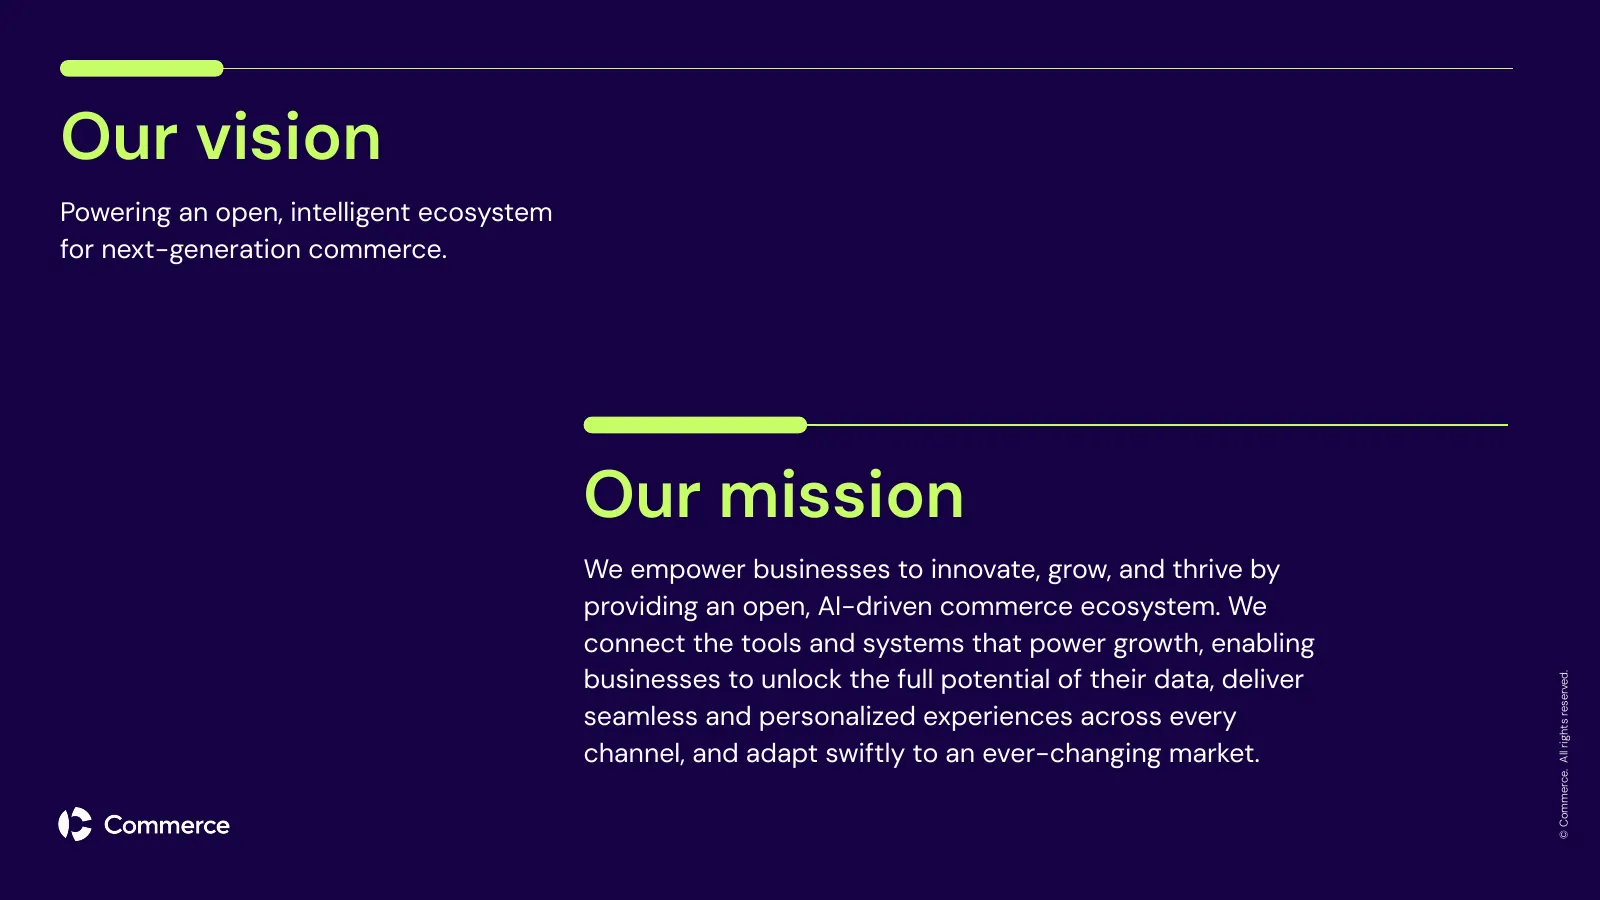
Our vision Powering an open, intelligent ecosystem for next-generation commerce. Our mission We empower businesses to innovate, grow, and thrive by providing an open, AI-driven commerce ecosystem. We connect the tools and systems that power growth, enabling businesses to unlock the full potential of
Slide 5: Solving the commerce problems of today. Powering the agents of tomorrow.
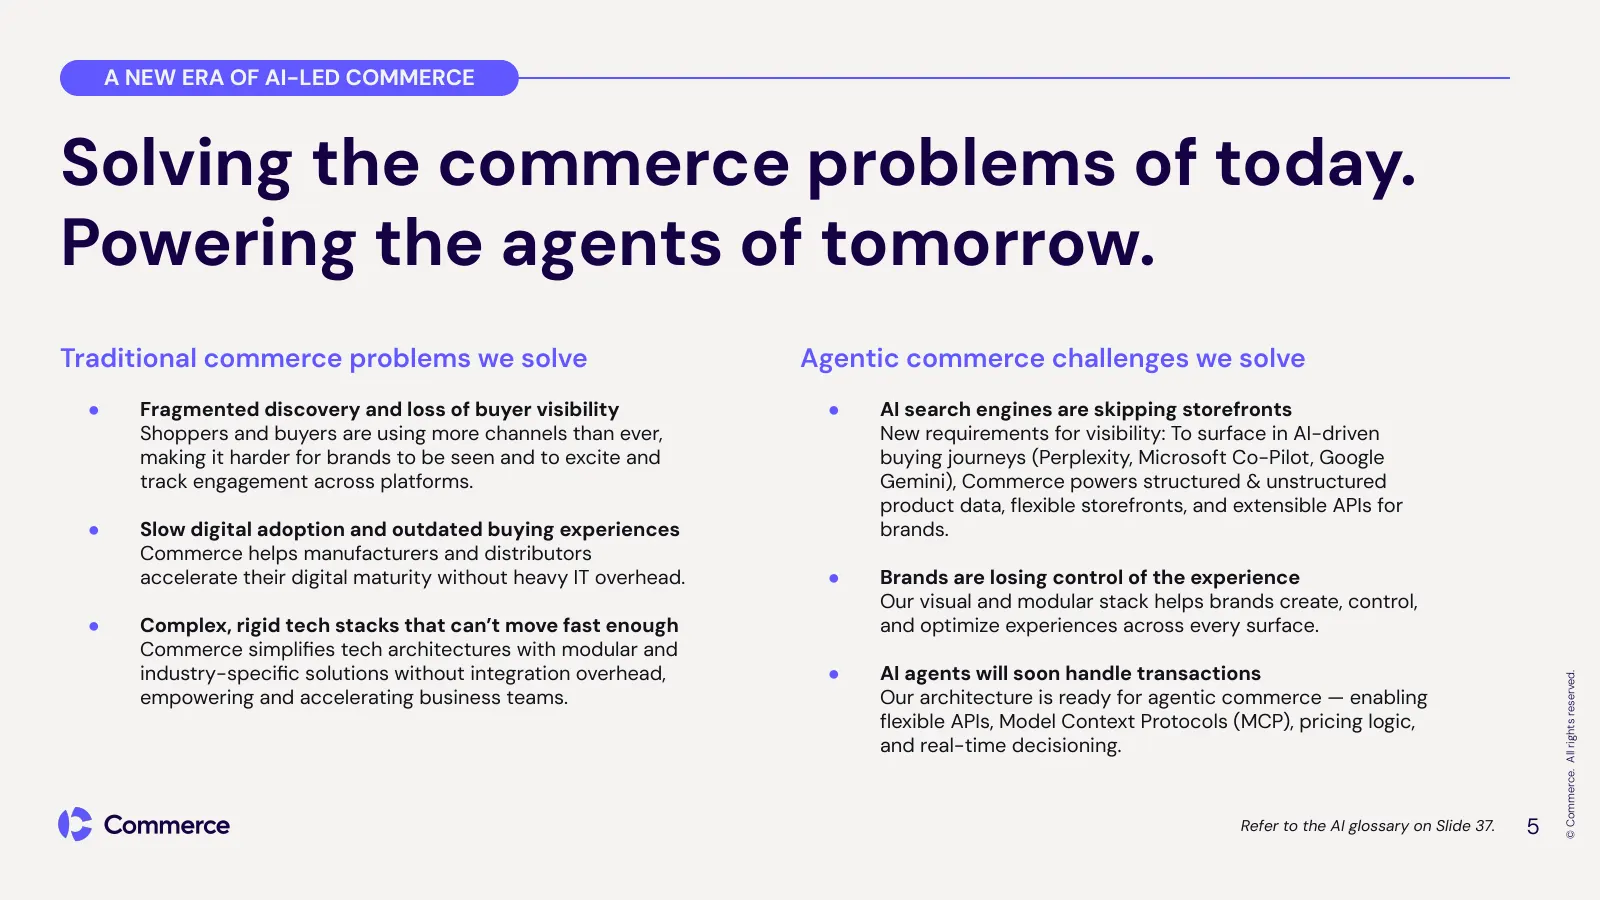
A NEW ERA OF AI-LED COMMERCE Solving the commerce problems of today. Powering the agents of tomorrow. Traditional commerce problems we solve Agentic commerce challenges we solve ● Fragmented discovery and loss of buyer visibility ● AI search engines are skipping storefronts Shoppers and buyers are u
Slide 6: From product data to conversion: An end-to-end AI-optimized commerce stack
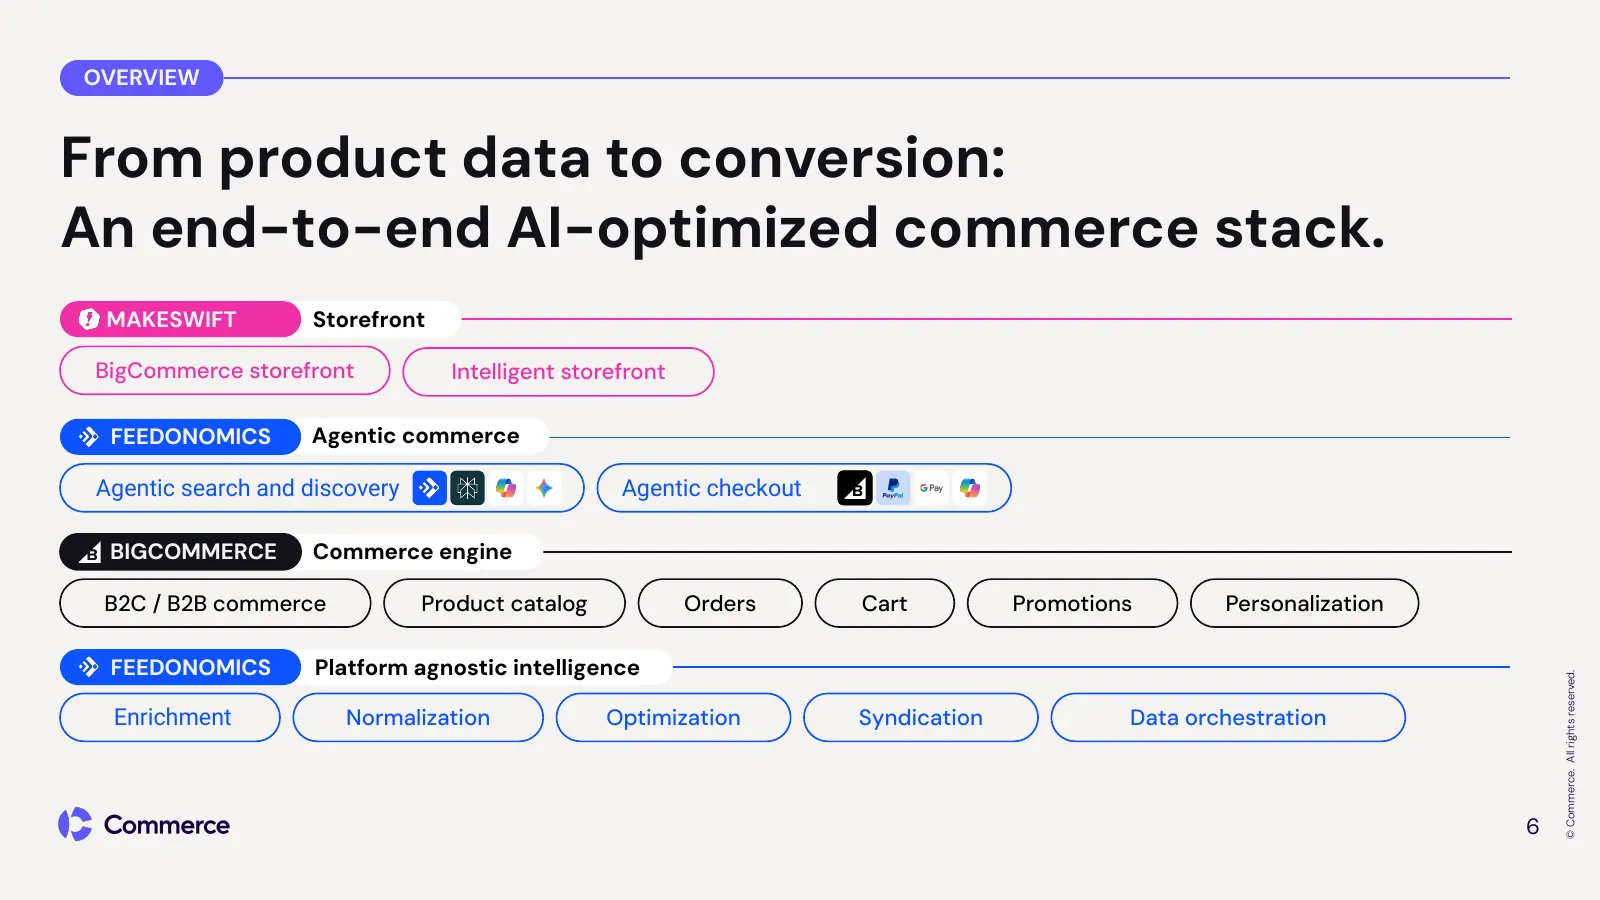
OVERVIEW From product data to conversion: An end-to-end AI-optimized commerce stack. MAKESWIFT Storefront BigCommerce storefront Intelligent storefront FEEDONOMICS Agentic commerce Agentic search and discovery Agentic checkout BIGCOMMERCE Commerce engine B2C / B2B commerce Product catalog Orders Car
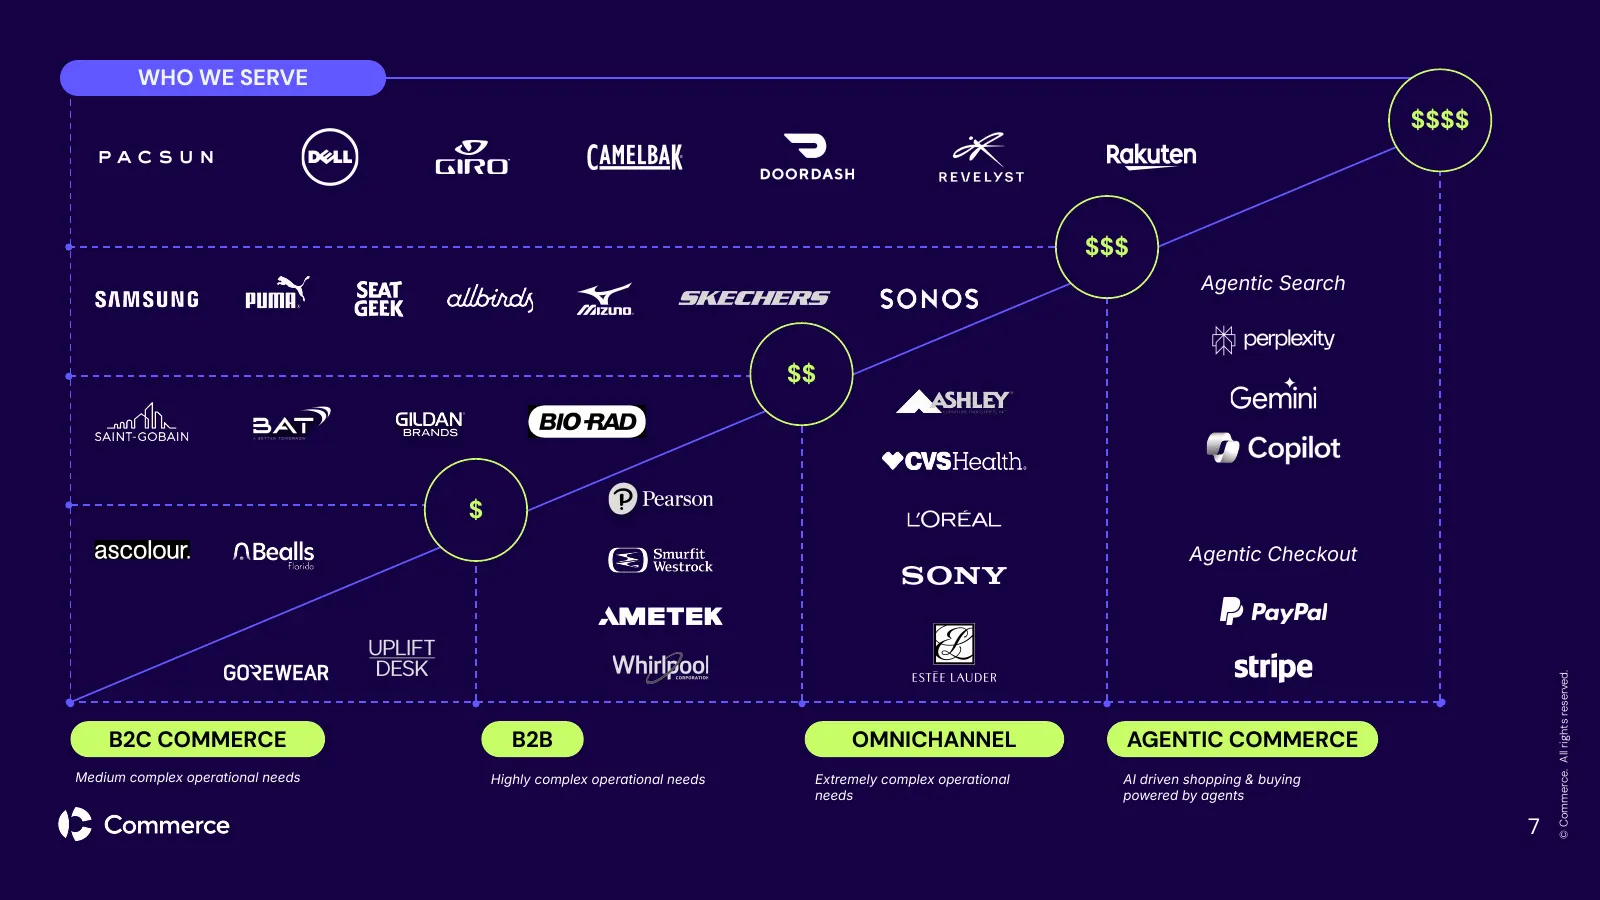
Slide 7: Who we serve
WHO WE SERVE $$$$ $$$ Agentic Search $$ $ Agentic Checkout © Commerce. All rights reserved. B2C COMMERCE B2B OMNICHANNEL AGENTIC COMMERCE Medium complex operational needs Highly complex operational needs Extremely complex operational AI driven shopping & buying needs powered by agents 7
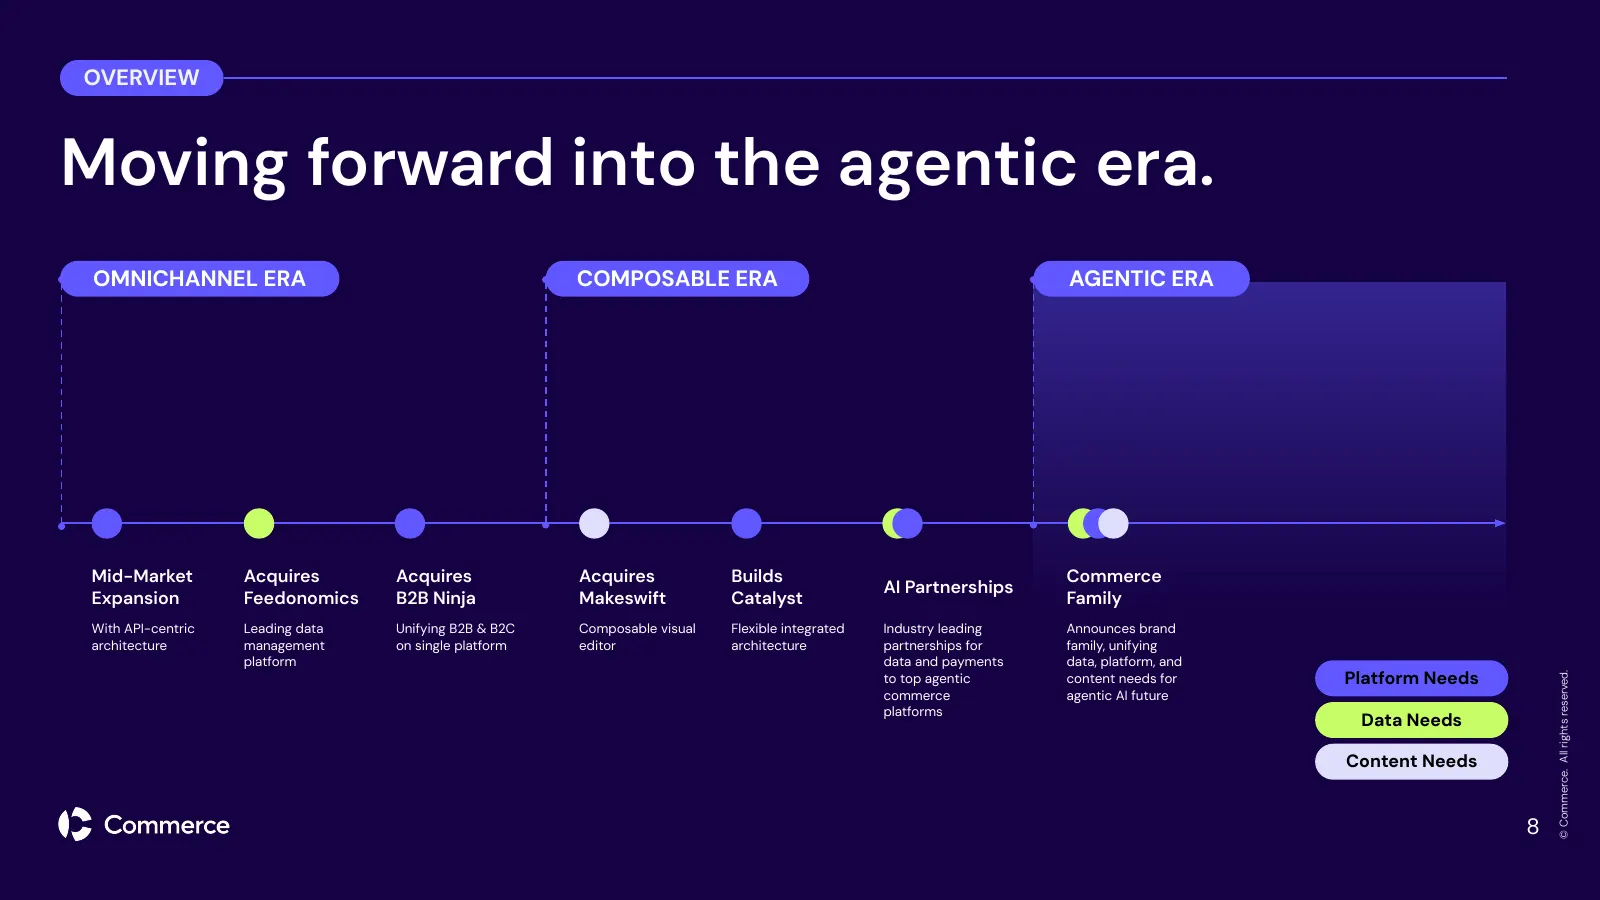
Slide 8: Moving forward into the agentic era
OVERVIEW Moving forward into the agentic era. OMNICHANNEL ERA COMPOSABLE ERA AGENTIC ERA Mid-Market Acquires Acquires Acquires Builds Commerce AI Partnerships Expansion Feedonomics B2B Ninja Makeswift Catalyst Family With API-centric Leading data Unifying B2B & B2C Composable visual Flexible integra
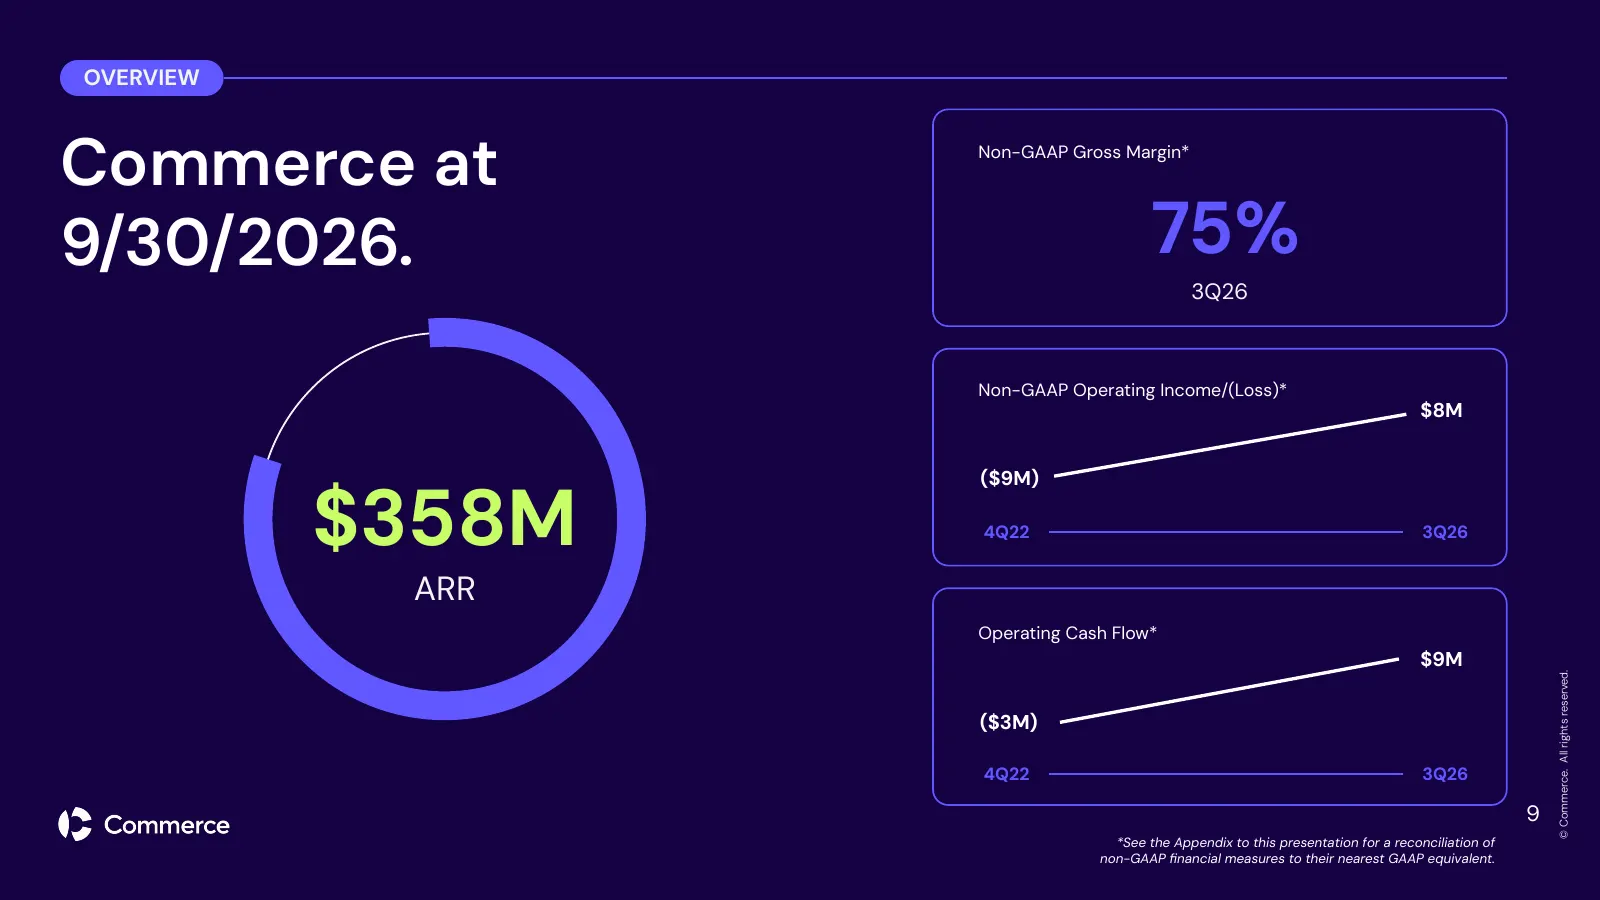
Slide 9: Commerce at $358M ARR
OVERVIEW Commerce at Non-GAAP Gross Margin* 9/30/2026. 75% 3Q26 Non-GAAP Operating Income/(Loss)* $8M ($9M) $358M 4Q22 3Q26 ARR Operating Cash Flow* $9M © Commerce. All rights reserved. ($3M) 4Q22 3Q26 9 *See the Appendix to this presentation for a reconciliation of non-GAAP financial measures to the
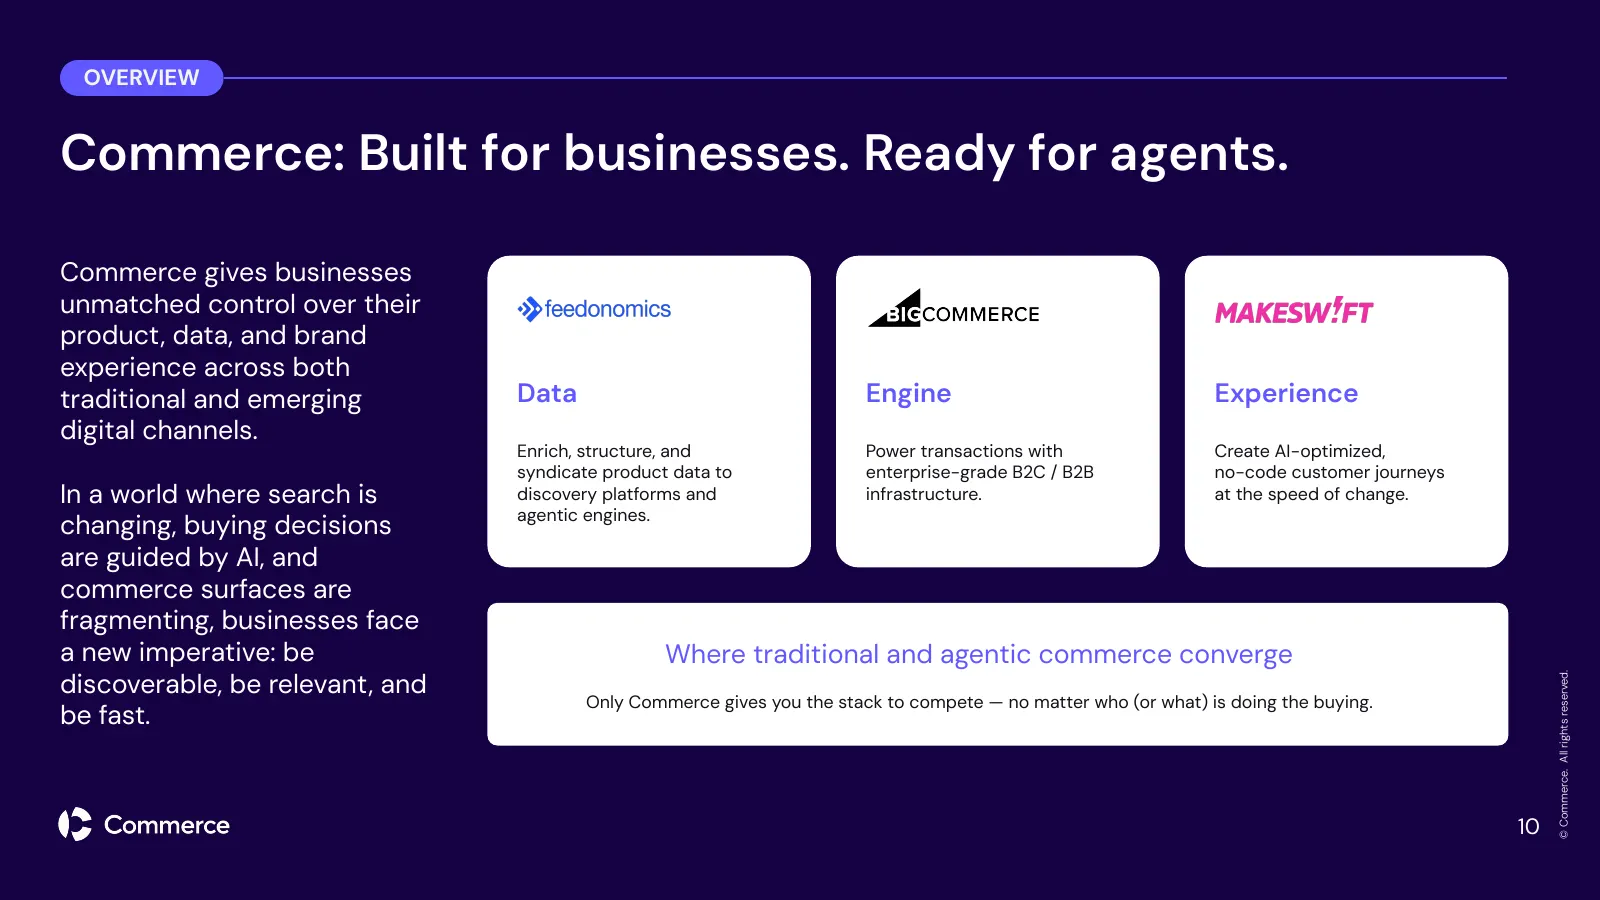
Slide 10: Commerce: Built for businesses. Ready for agents.
OVERVIEW Commerce: Built for businesses. Ready for agents. Commerce gives businesses unmatched control over their product, data, and brand experience across both traditional and emerging Data Engine Experience digital channels. Enrich, structure, and Power transactions with Create AI-optimized, synd
Slide 11: We power growth for leading brands across all industries
We power growth for leading brands across all industries. © Commerce. All rights reserved. 11
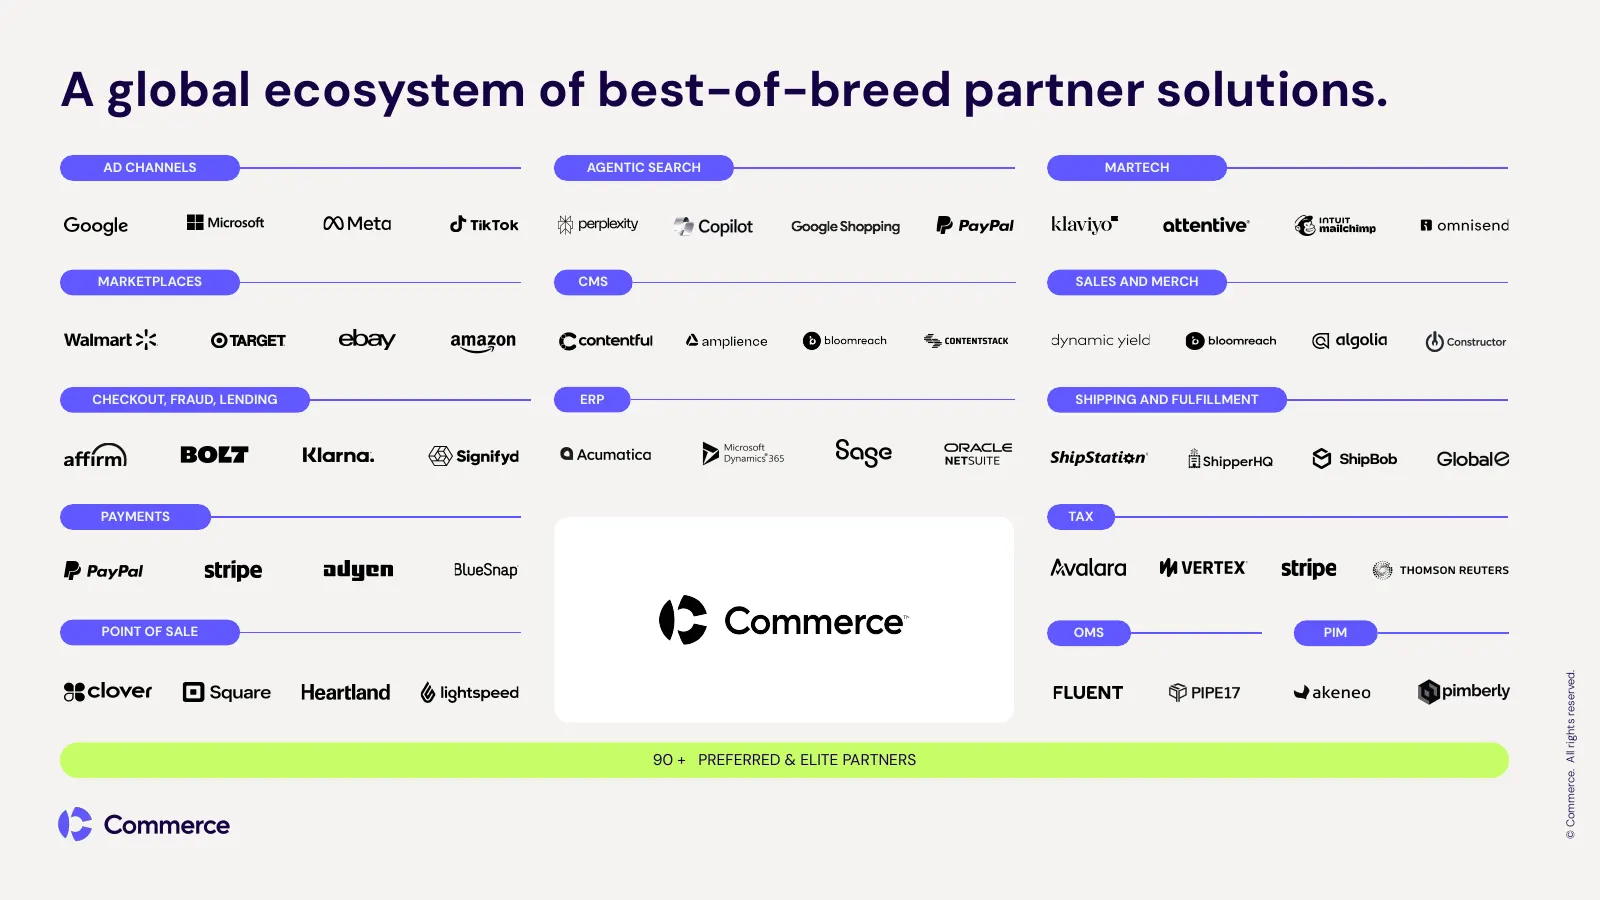
Slide 12: A global ecosystem of best-of-breed partner solutions
A global ecosystem of best-of-breed partner solutions. AD CHANNELS AGENTIC SEARCH MARTECH MARKETPLACES CMS SALES AND MERCH CHECKOUT, FRAUD, LENDING ERP SHIPPING AND FULFILLMENT PAYMENTS TAX POINT OF SALE Item OMS PIM © Commerce. All rights reserved. 90 + PREFERRED & ELITE PARTNERS
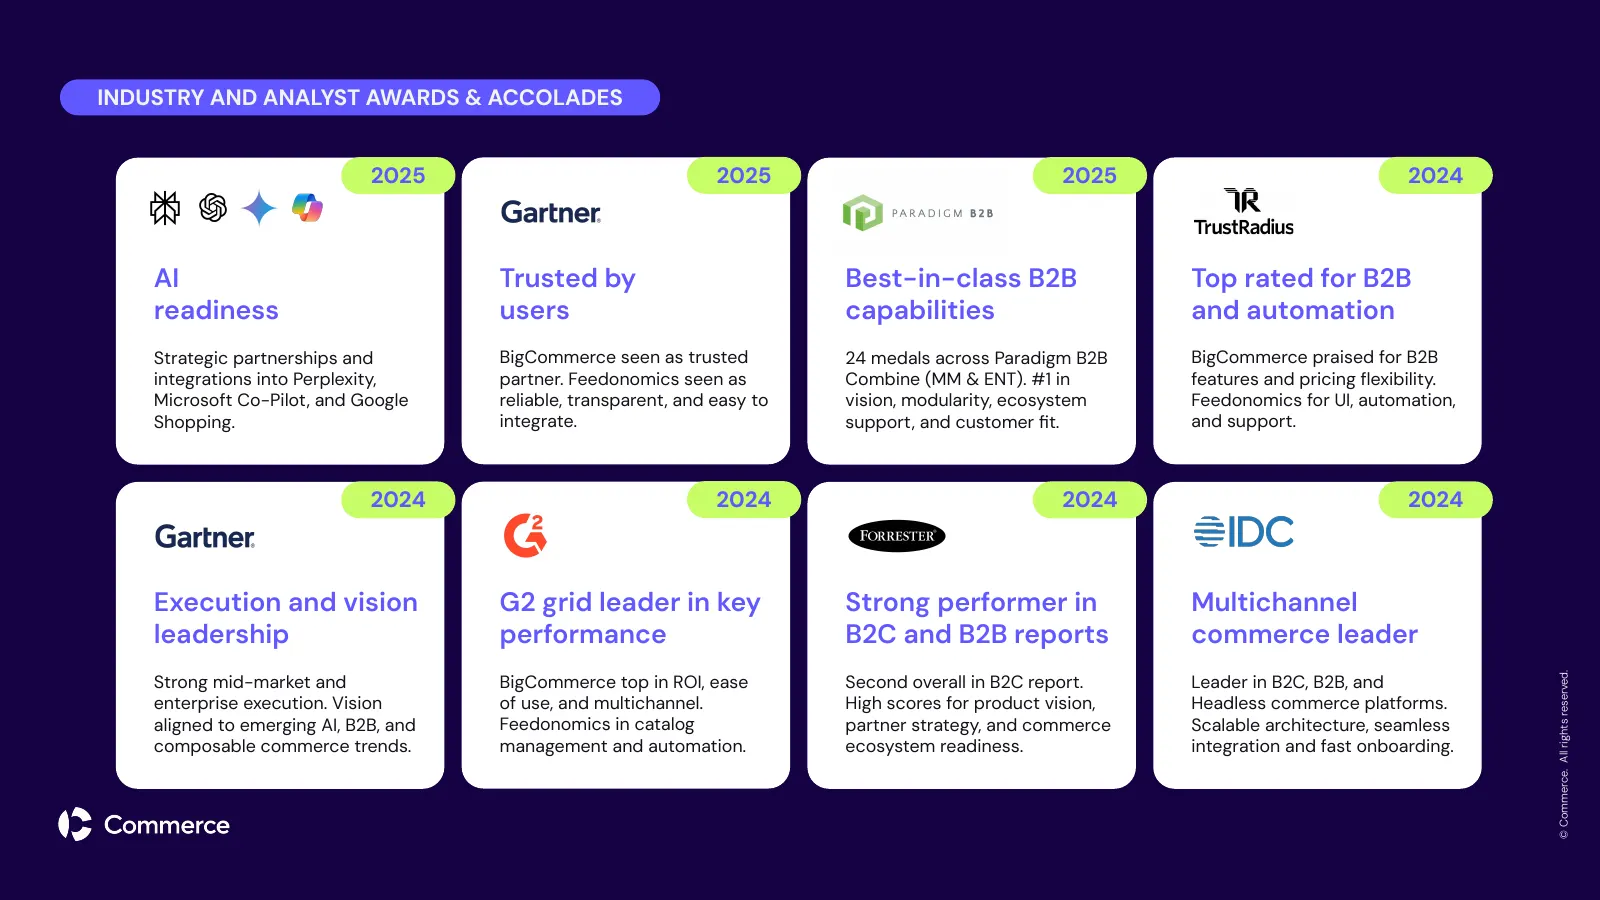
Slide 13: Industry and analyst awards & accolades
INDUSTRY AND ANALYST AWARDS & ACCOLADES 2025 2025 2025 2024 AI Trusted by Best-in-class B2B Top rated for B2B readiness users capabilities and automation Strategic partnerships and BigCommerce seen as trusted 24 medals across Paradigm B2B BigCommerce praised for B2B integrations into Perplexity, par

Slide 14: Why we win.
Why we win. 14 © Commerce. All rights reserved.
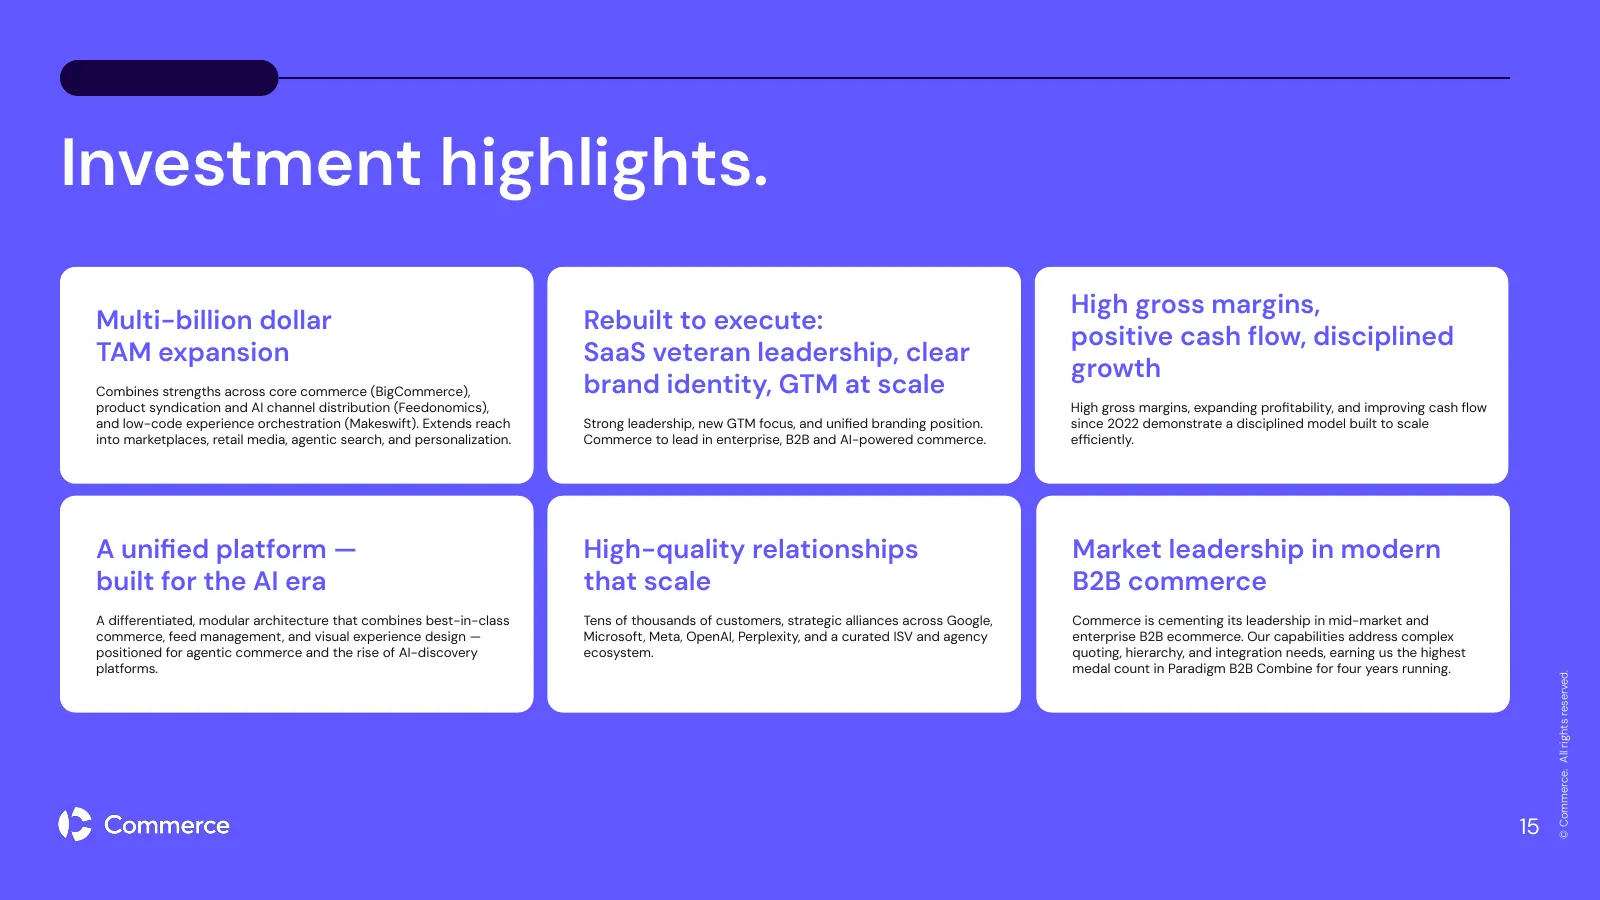
Slide 15: Investment highlights
Investment highlights. High gross margins, Multi-billion dollar Rebuilt to execute: positive cash flow, disciplined TAM expansion SaaS veteran leadership, clear growth Combines strengths across core commerce (BigCommerce), brand identity, GTM at scale product syndication and AI channel distribution (
Slide 16: Why 12,000+ leading B2B brands trust Commerce
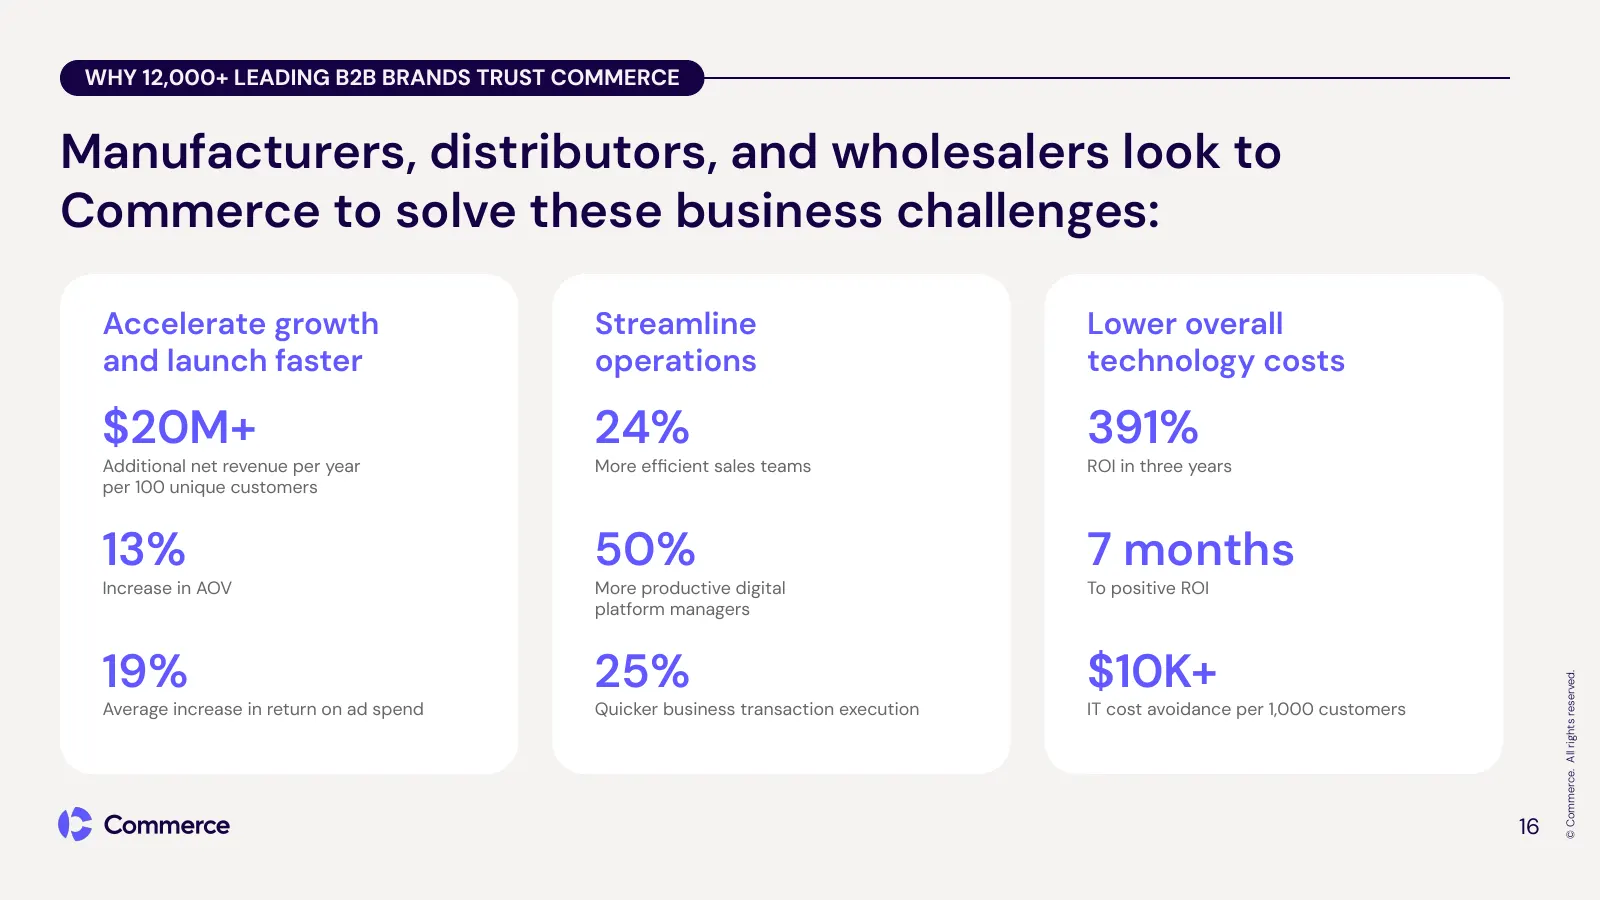
WHY 12,000+ LEADING B2B BRANDS TRUST COMMERCE Manufacturers, distributors, and wholesalers look to Commerce to solve these business challenges: Accelerate growth Streamline Lower overall and launch faster operations technology costs $20M+ 24% 391% Additional net revenue per year More efficient sales
Slide 17: Why B2Bs choose Commerce
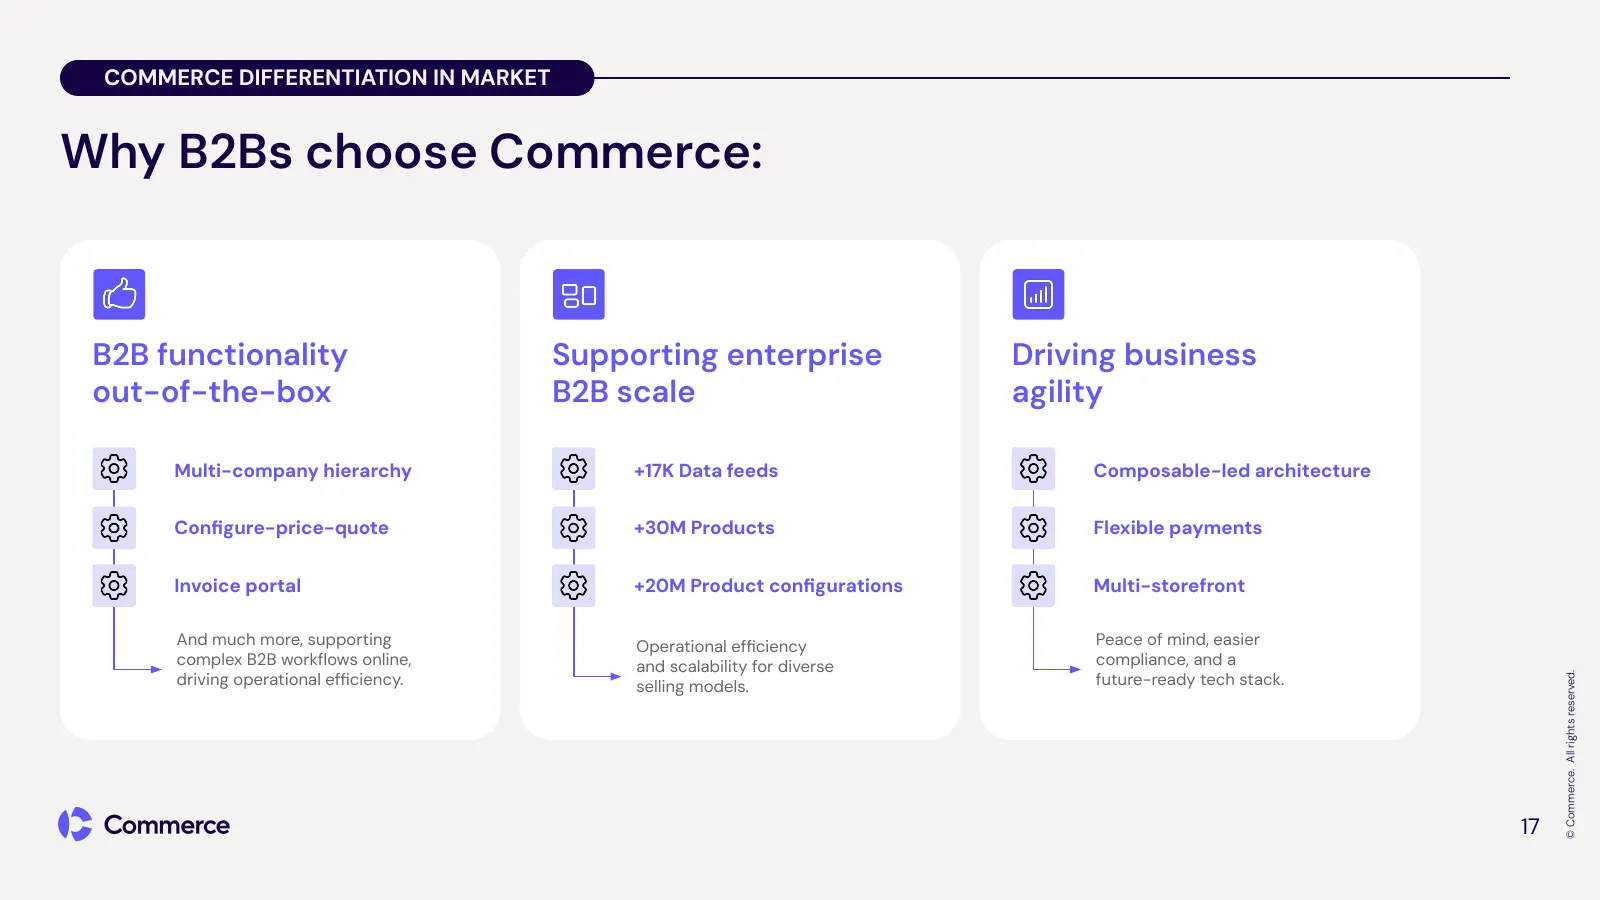
COMMERCE DIFFERENTIATION IN MARKET Why B2Bs choose Commerce: B2B functionality Supporting enterprise Driving business out-of-the-box B2B scale agility Multi-company hierarchy +17K Data feeds Composable-led architecture Configure-price-quote +30M Products Flexible payments Invoice portal +20M Product
Slide 18: Why leading B2C brands trust Commerce
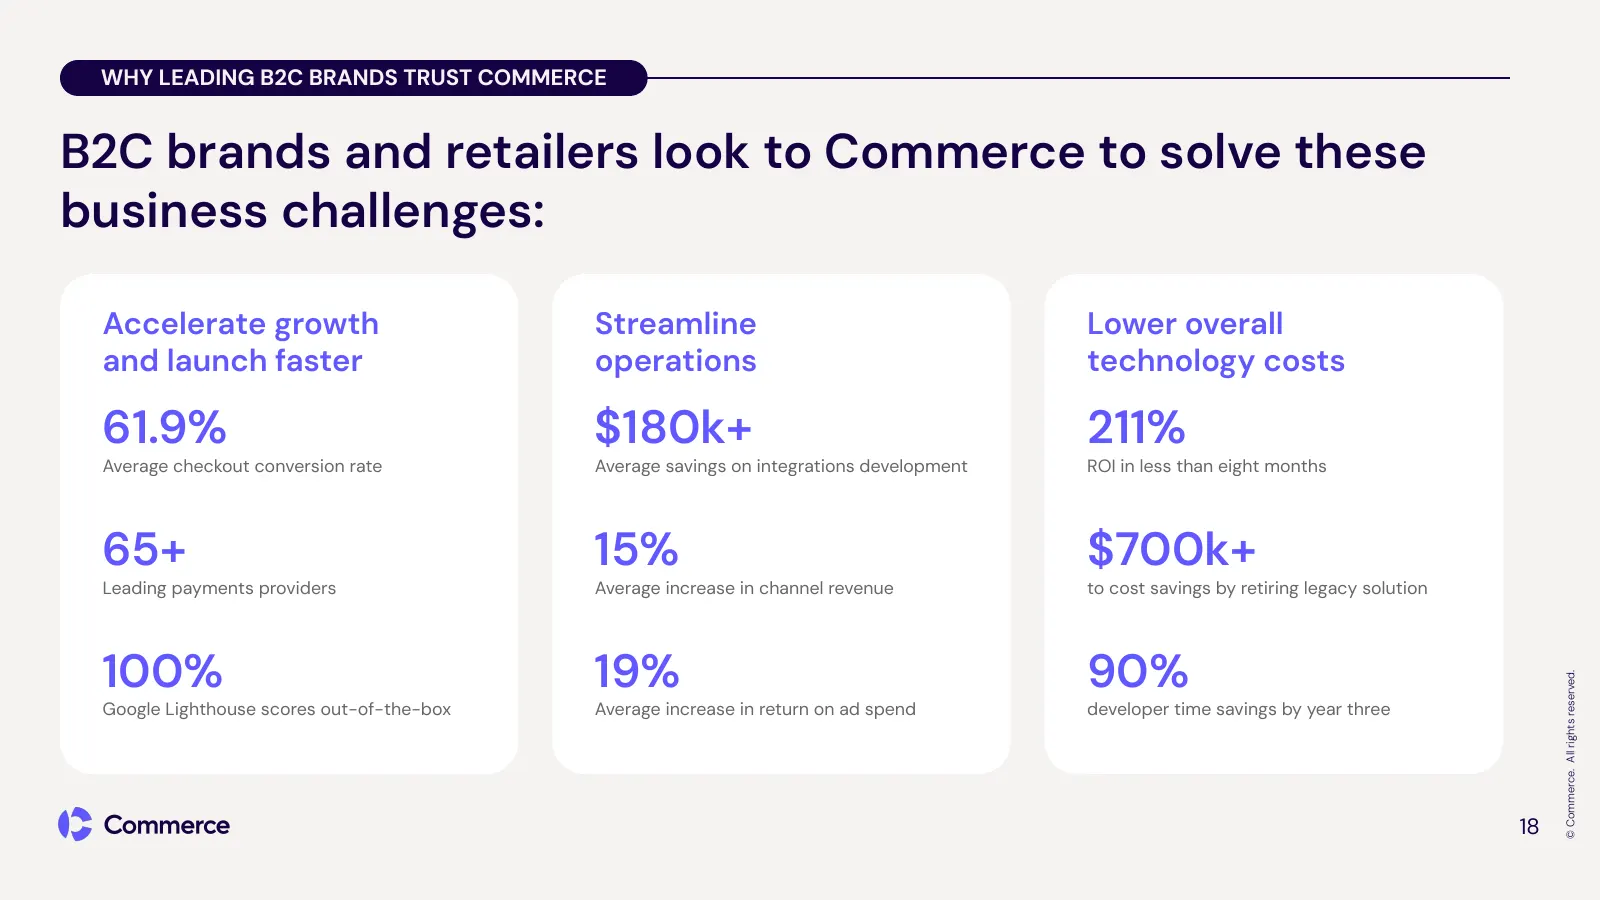
WHY LEADING B2C BRANDS TRUST COMMERCE B2C brands and retailers look to Commerce to solve these business challenges: Accelerate growth Streamline Lower overall and launch faster operations technology costs 61.9% $180k+ 211% Average checkout conversion rate Average savings on integrations development
Slide 19: Why B2Cs choose Commerce
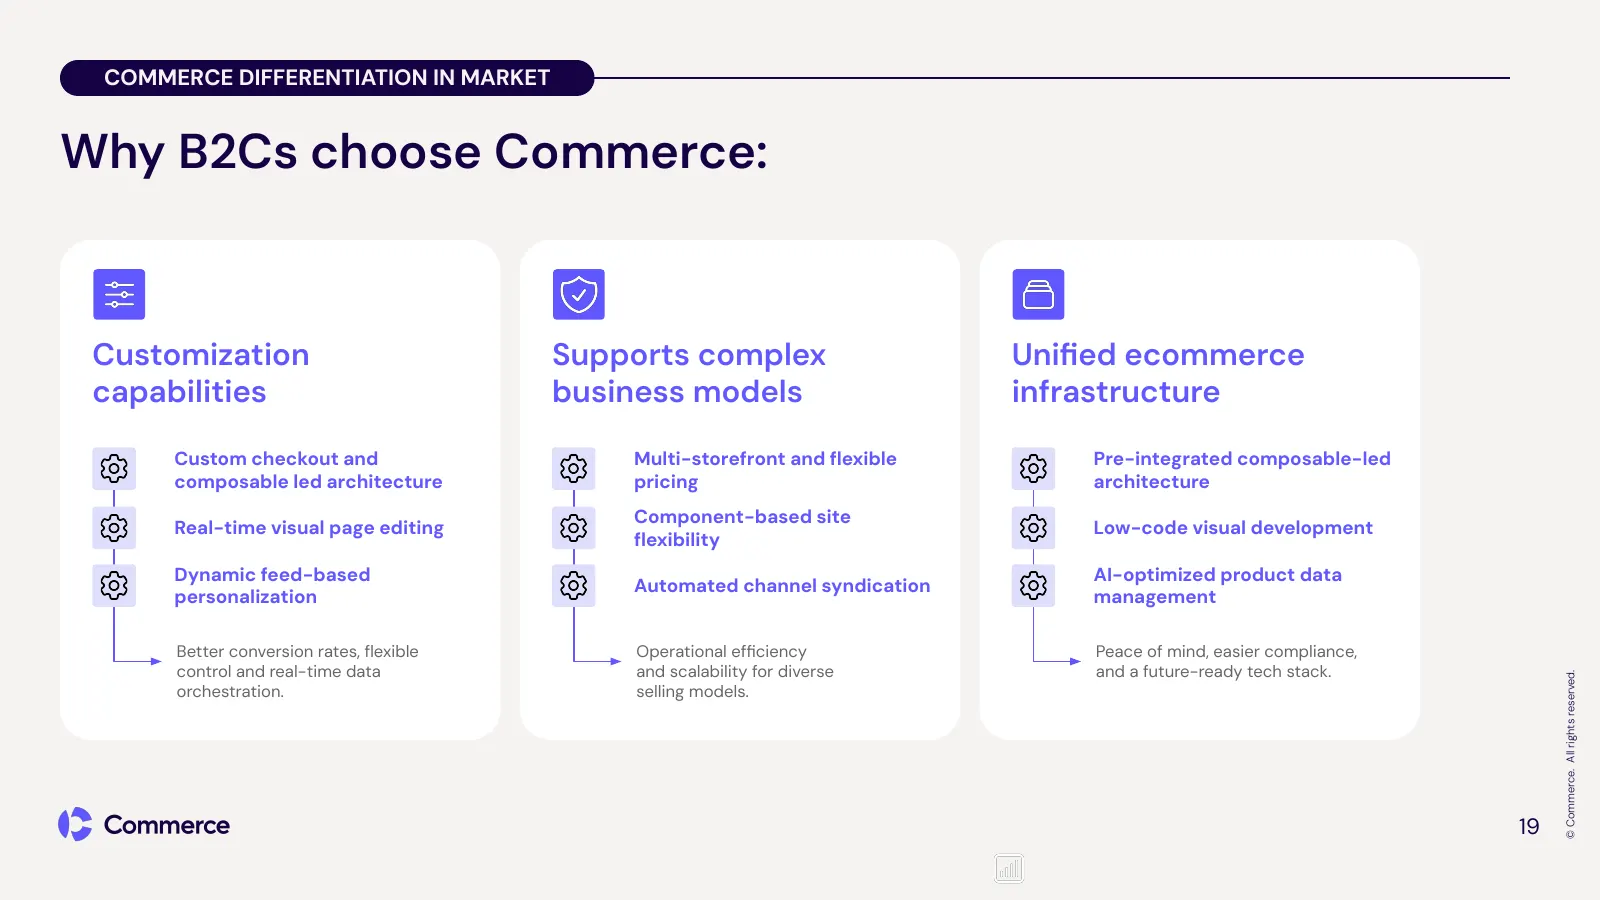
COMMERCE DIFFERENTIATION IN MARKET Why B2Cs choose Commerce: Customization Supports complex Unified ecommerce capabilities business models infrastructure Custom checkout and Multi-storefront and flexible Pre-integrated composable-led composable led architecture pricing architecture Component-based sit
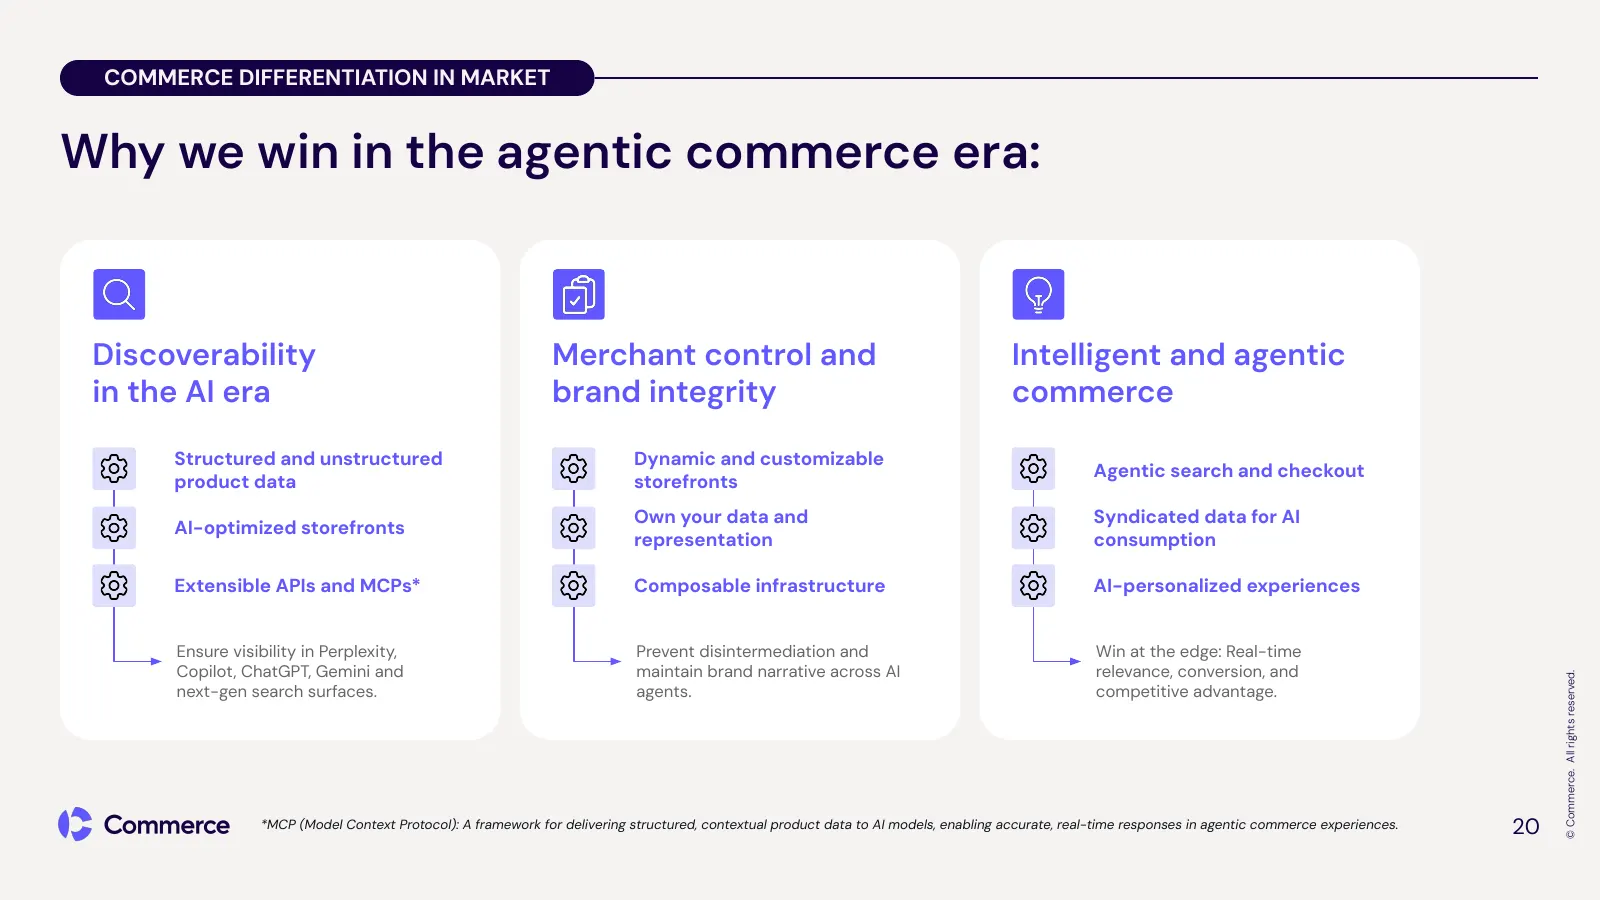
Slide 20: Why we win in the agentic commerce era
COMMERCE DIFFERENTIATION IN MARKET Why we win in the agentic commerce era: Discoverability Merchant control and Intelligent and agentic in the AI era brand integrity commerce Structured and unstructured Dynamic and customizable Agentic search and checkout product data storefronts Own your data and S

Slide 21: Financials
Financials 21 © Commerce. All rights reserved.
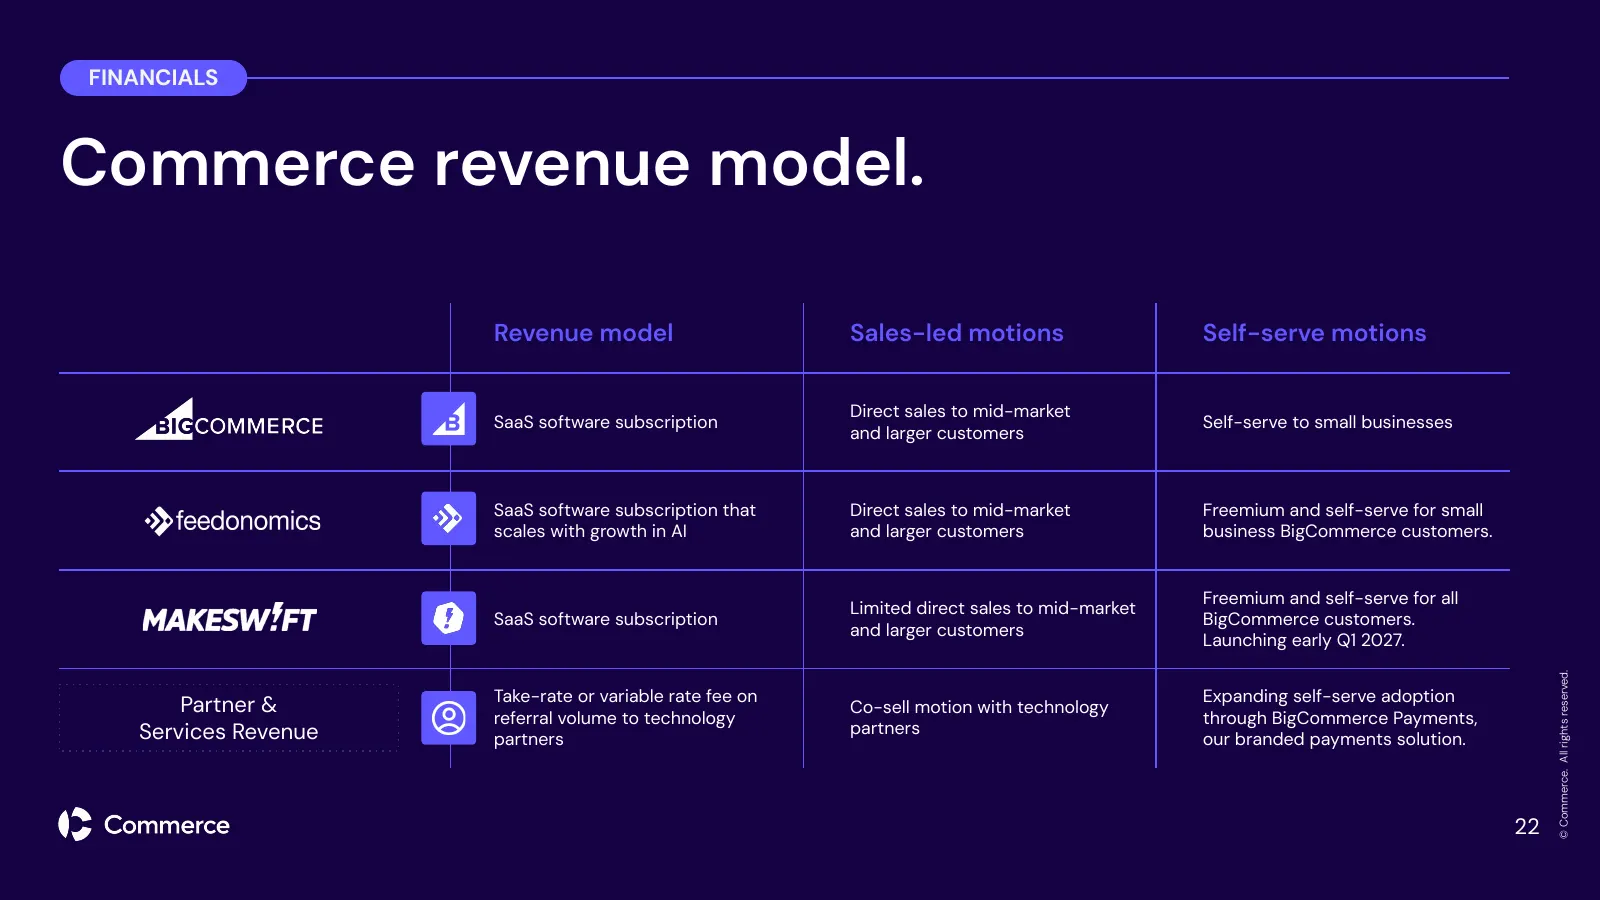
Slide 22: Commerce revenue model
FINANCIALS Commerce revenue model. Revenue model Sales-led motions Self-serve motions Direct sales to mid-market SaaS software subscription Self-serve to small businesses and larger customers SaaS software subscription that Direct sales to mid-market Freemium and self-serve for small scales with gro
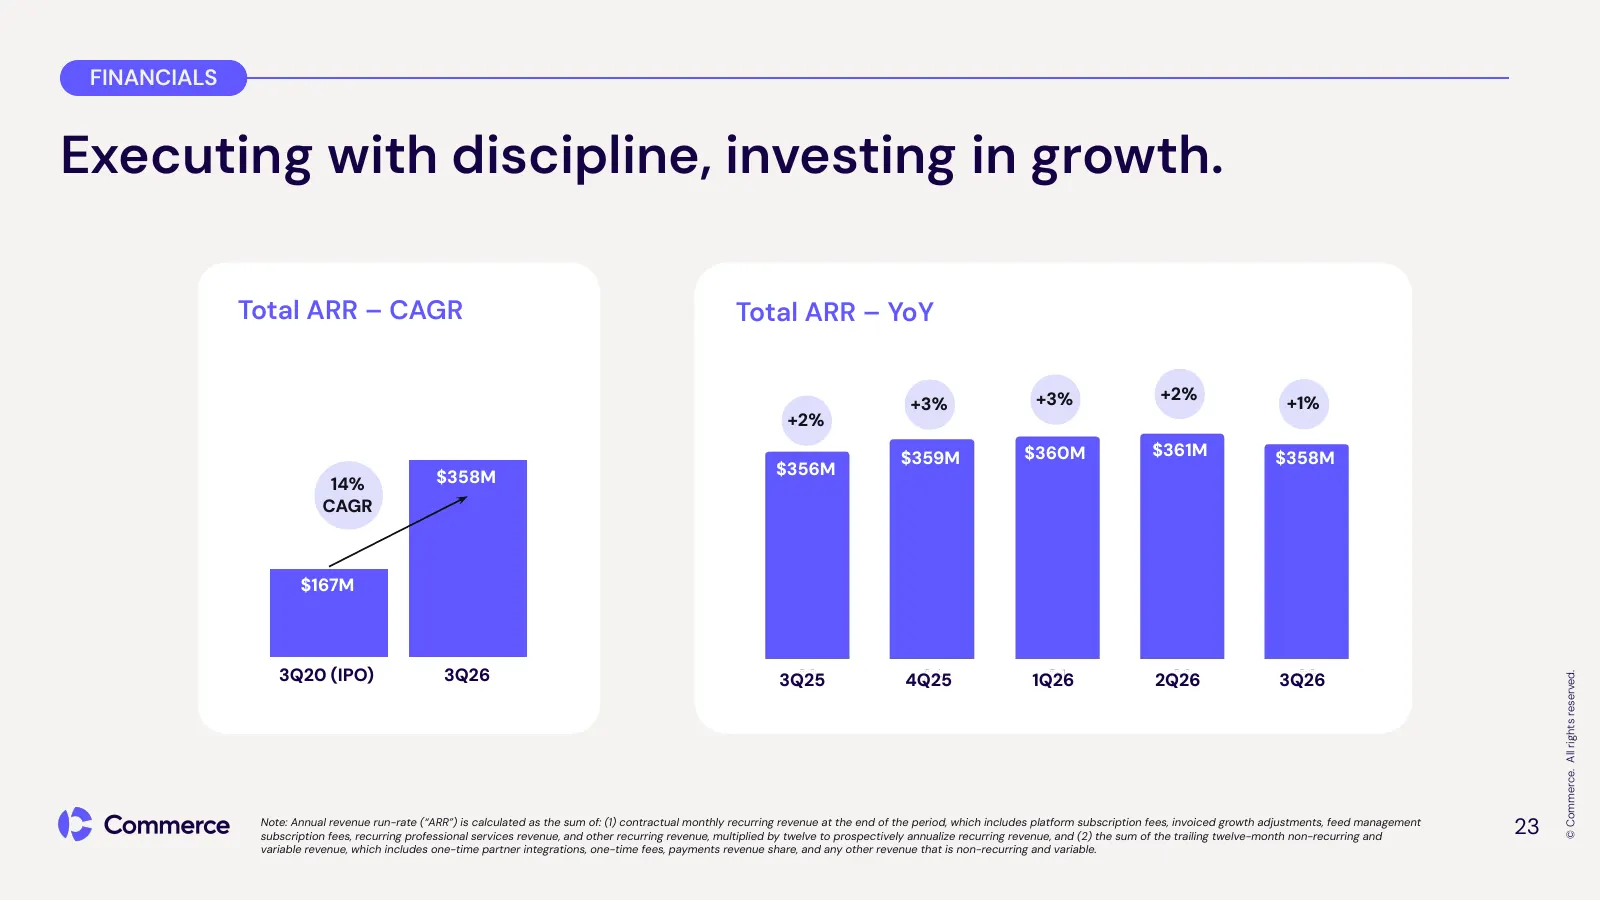
Slide 23: Executing with discipline, investing in growth
FINANCIALS Executing with discipline, investing in growth. Total ARR – CAGR Total ARR – YoY +3% +2% +3% +1% +2% $359M $360M $361M $358M $358M $356M 14% CAGR $167M 3Q20 (IPO) 3Q26 3Q25 4Q25 1Q26 2Q26 3Q26 © Commerce. All rights reserved. Note: Annual revenue run-rate (“ARR”) is calculated as the sum
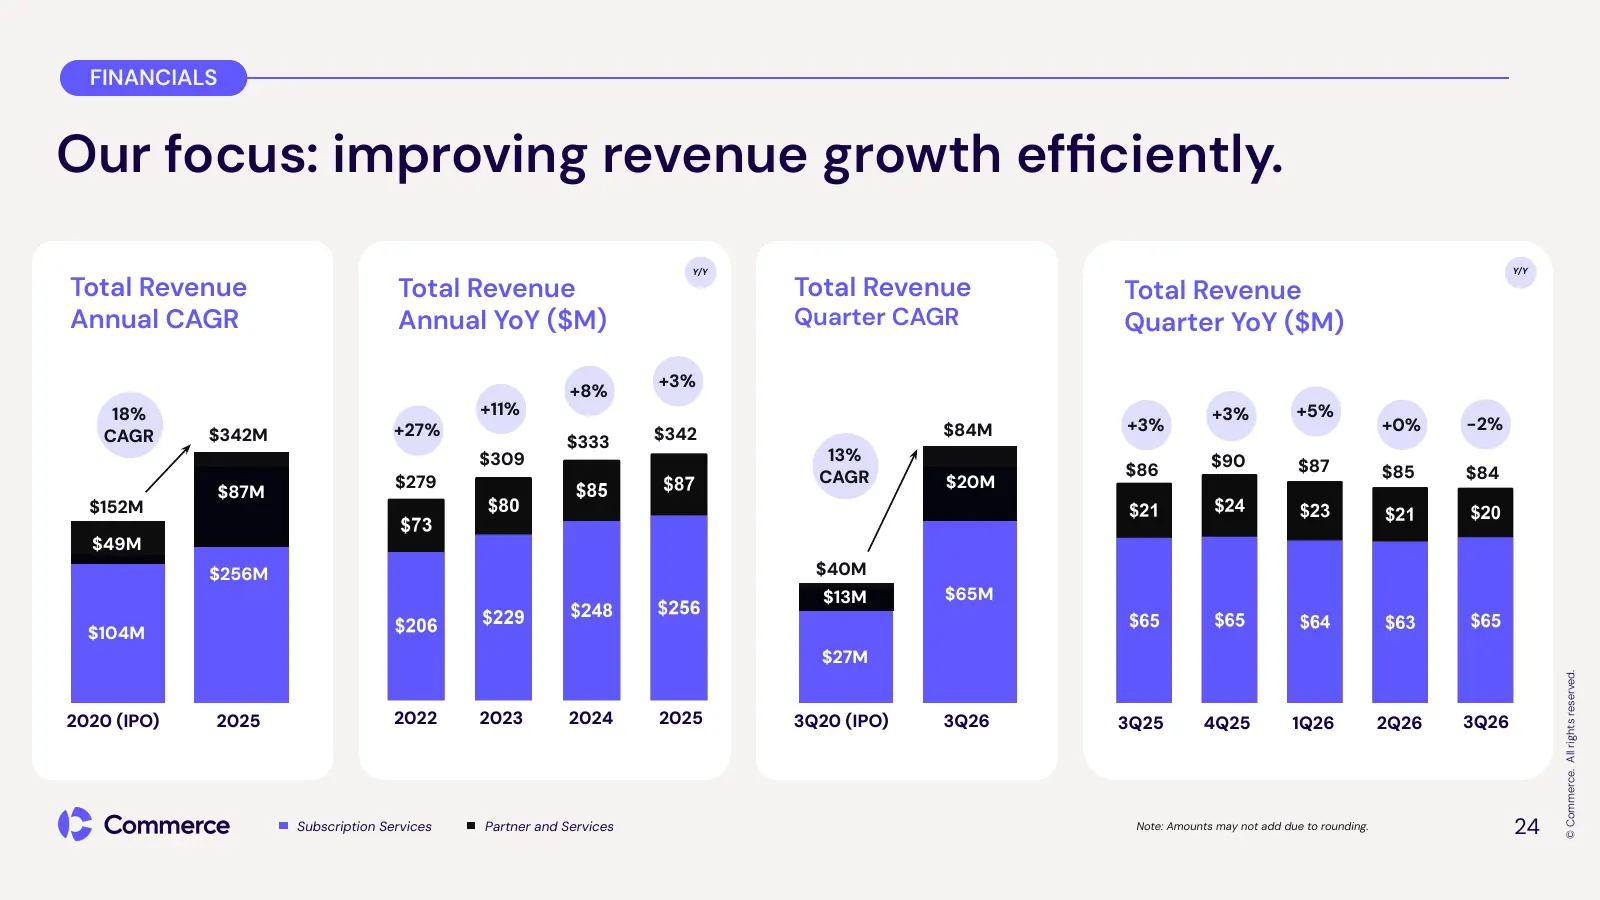
Slide 24: Our focus: improving revenue growth efficiently
FINANCIALS Our focus: improving revenue growth efficiently. Y/Y Y/Y Total Revenue Total Revenue Total Revenue Total Revenue Annual CAGR Annual YoY ($M) Quarter CAGR Quarter YoY ($M) +3% +8% 18% +11% +3% +5% +27% $84M +3% +0% -2% CAGR $342M $333 $342 $309 13% $90 $86 $87 $85 $84 $279 CAGR $20M $87M $1
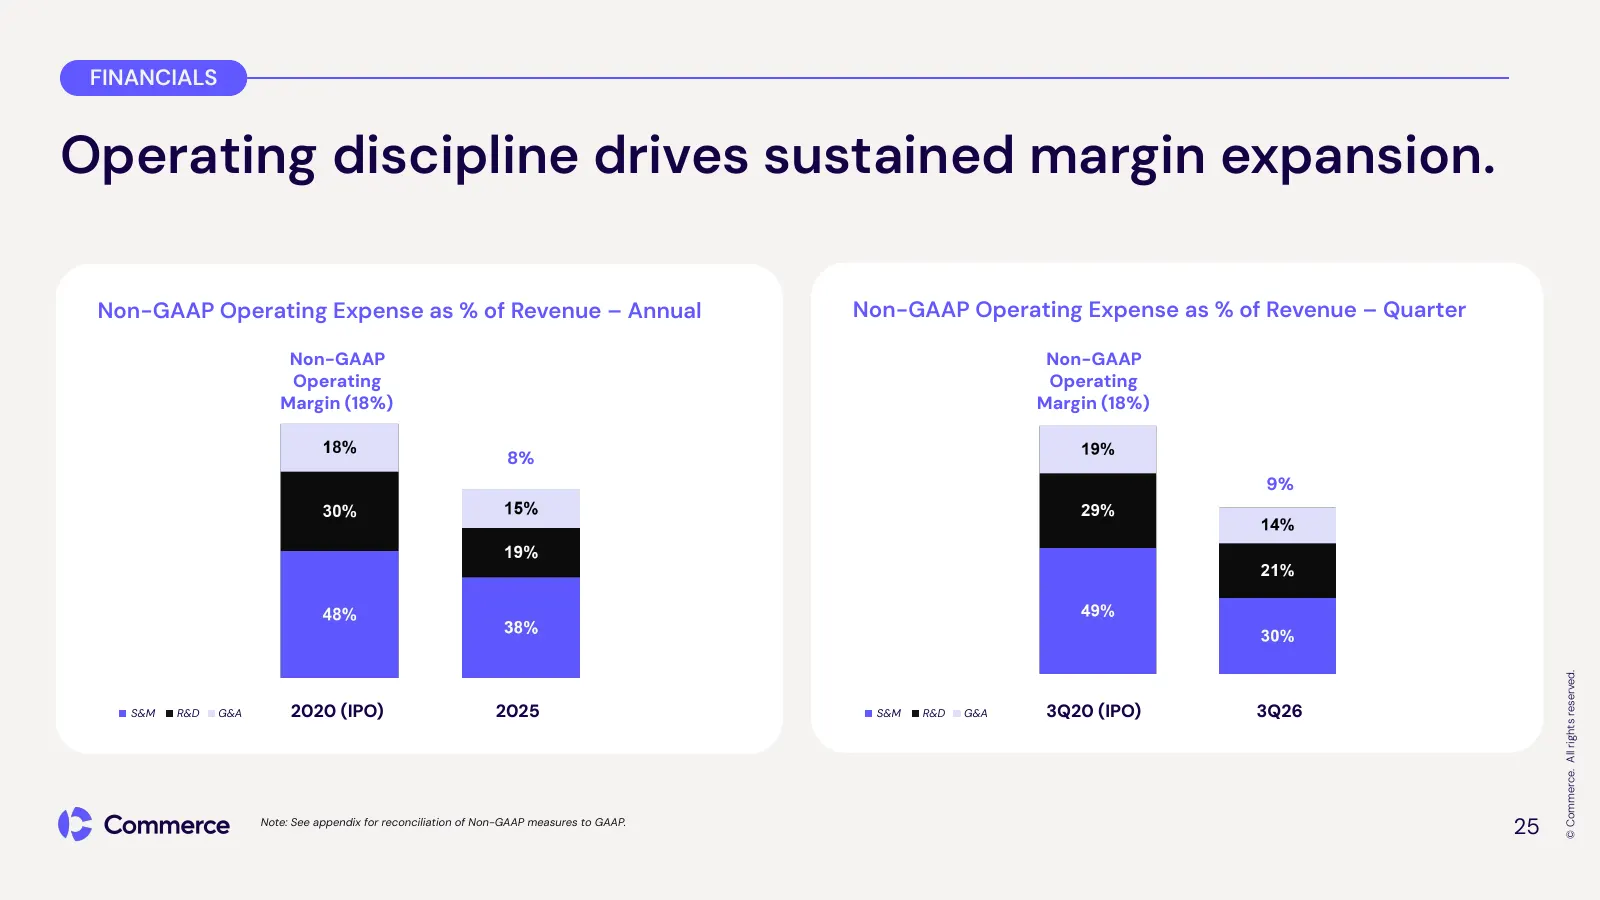
Slide 25: Operating discipline drives sustained margin expansion
FINANCIALS Operating discipline drives sustained margin expansion. Non-GAAP Operating Expense as % of Revenue – Annual Non-GAAP Operating Expense as % of Revenue – Quarter Non-GAAP Non-GAAP Operating Operating Margin (18%) Margin (18%) 8% 9% © Commerce. All rights reserved. S&M R&D G&A 2020 (IPO) 20
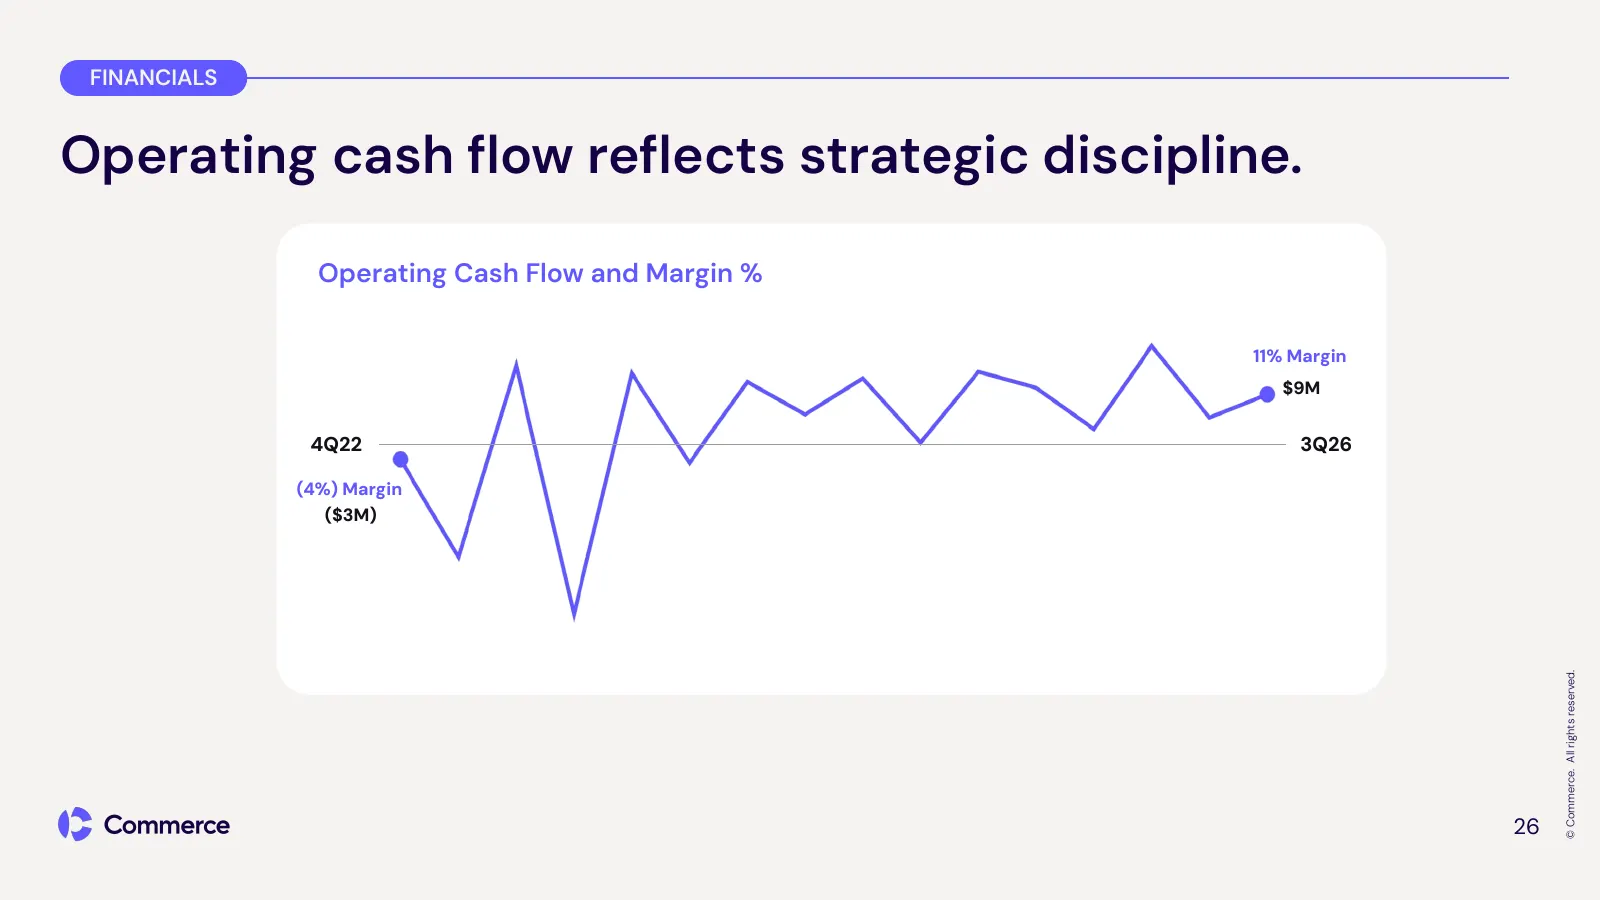
Slide 26: Operating cash flow reflects strategic discipline
FINANCIALS Operating cash flow reflects strategic discipline. Operating Cash Flow and Margin % 11% Margin $9M 4Q22 3Q26 (4%) Margin ($3M) © Commerce. All rights reserved. 26
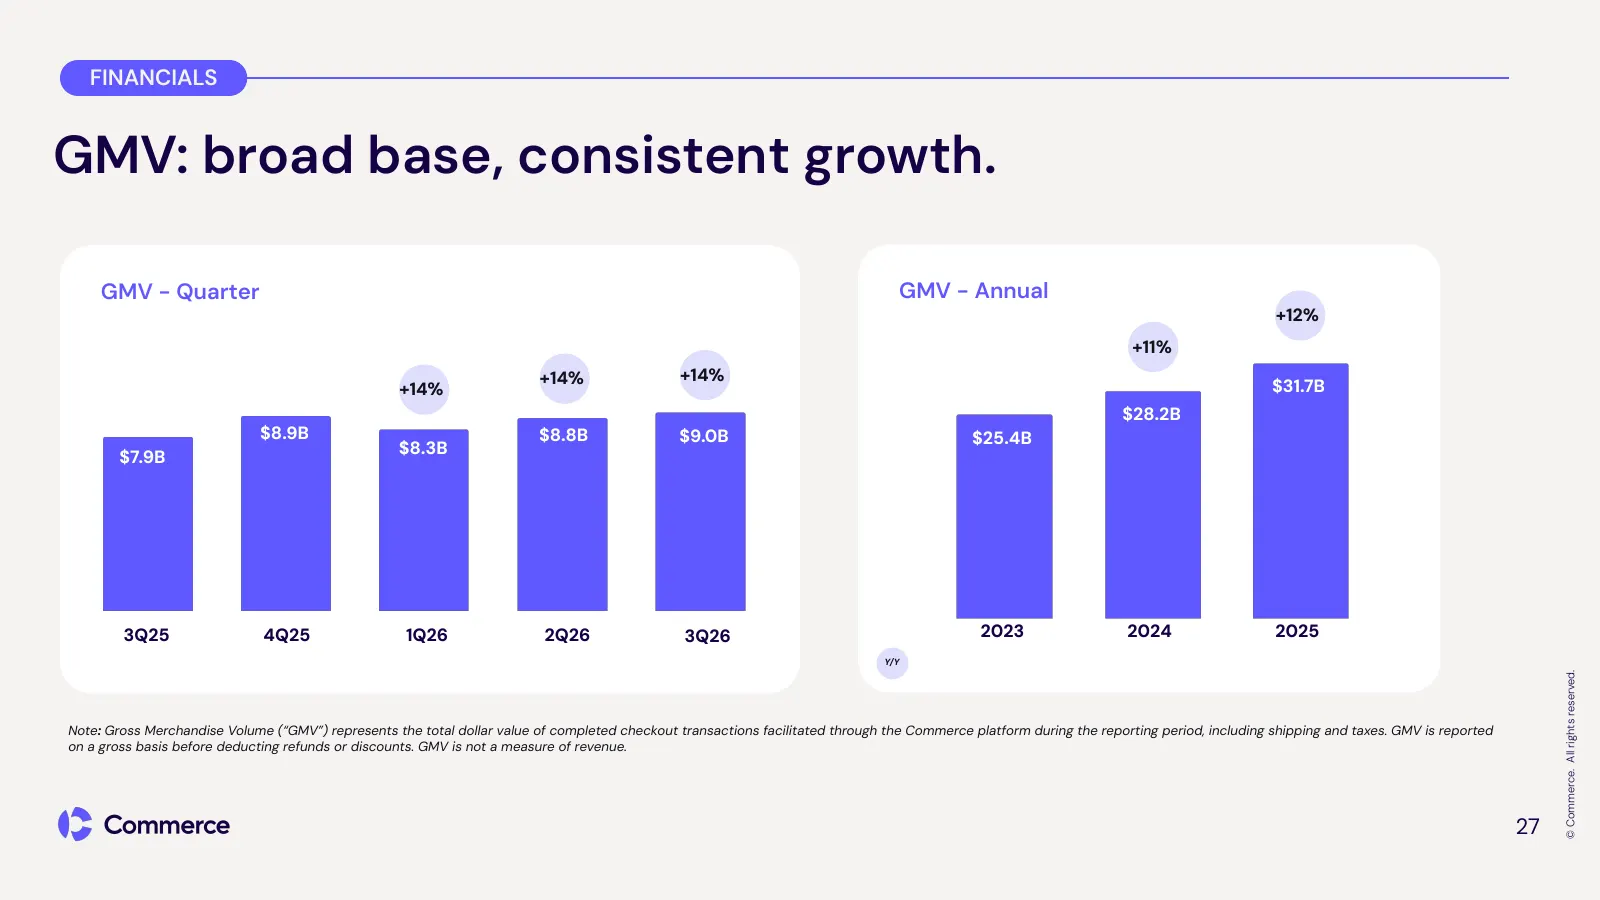
Slide 27: GMV: broad base, consistent growth
FINANCIALS GMV: broad base, consistent growth. GMV - Quarter GMV - Annual +12% +11% +14% +14% +14% $31.7B $28.2B $8.9B $8.8B $9.0B $25.4B $8.3B $7.9B 3Q25 4Q25 1Q26 2Q26 3Q26 2023 2024 2025 Y/Y © Commerce. All rights reserved. Note: Gross Merchandise Volume (“GMV”) represents the total dollar value
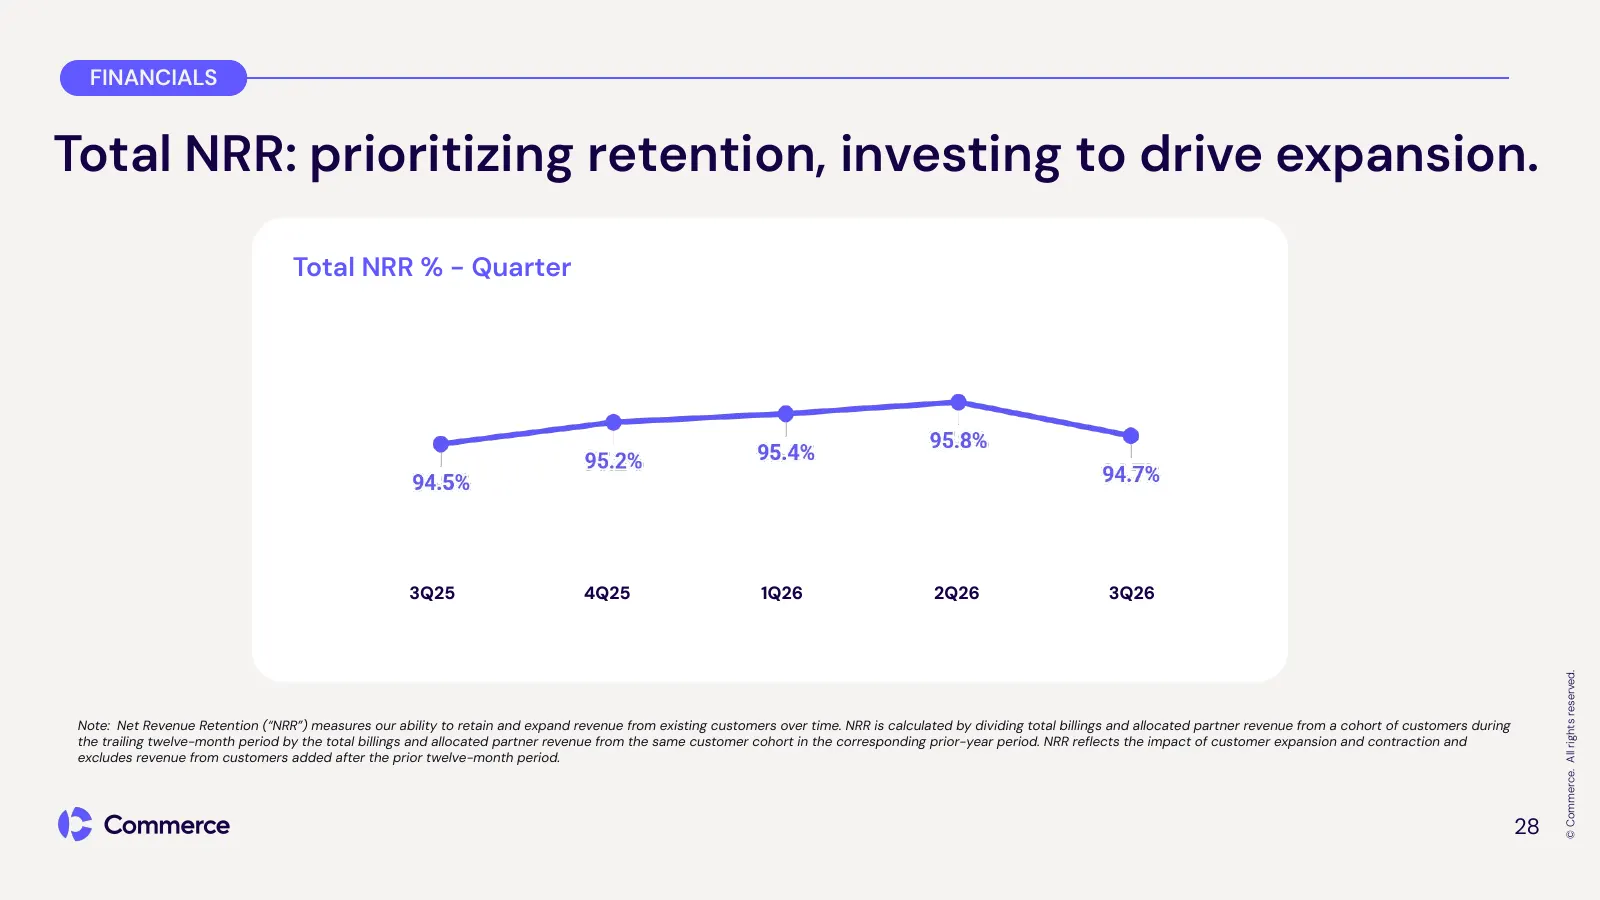
Slide 28: Total NRR: prioritizing retention, investing to drive expansion
FINANCIALS Total NRR: prioritizing retention, investing to drive expansion. Total NRR % - Quarter 3Q25 4Q25 1Q26 2Q26 3Q26 © Commerce. All rights reserved. Note: Net Revenue Retention (“NRR”) measures our ability to retain and expand revenue from existing customers over time. NRR is calculated by di
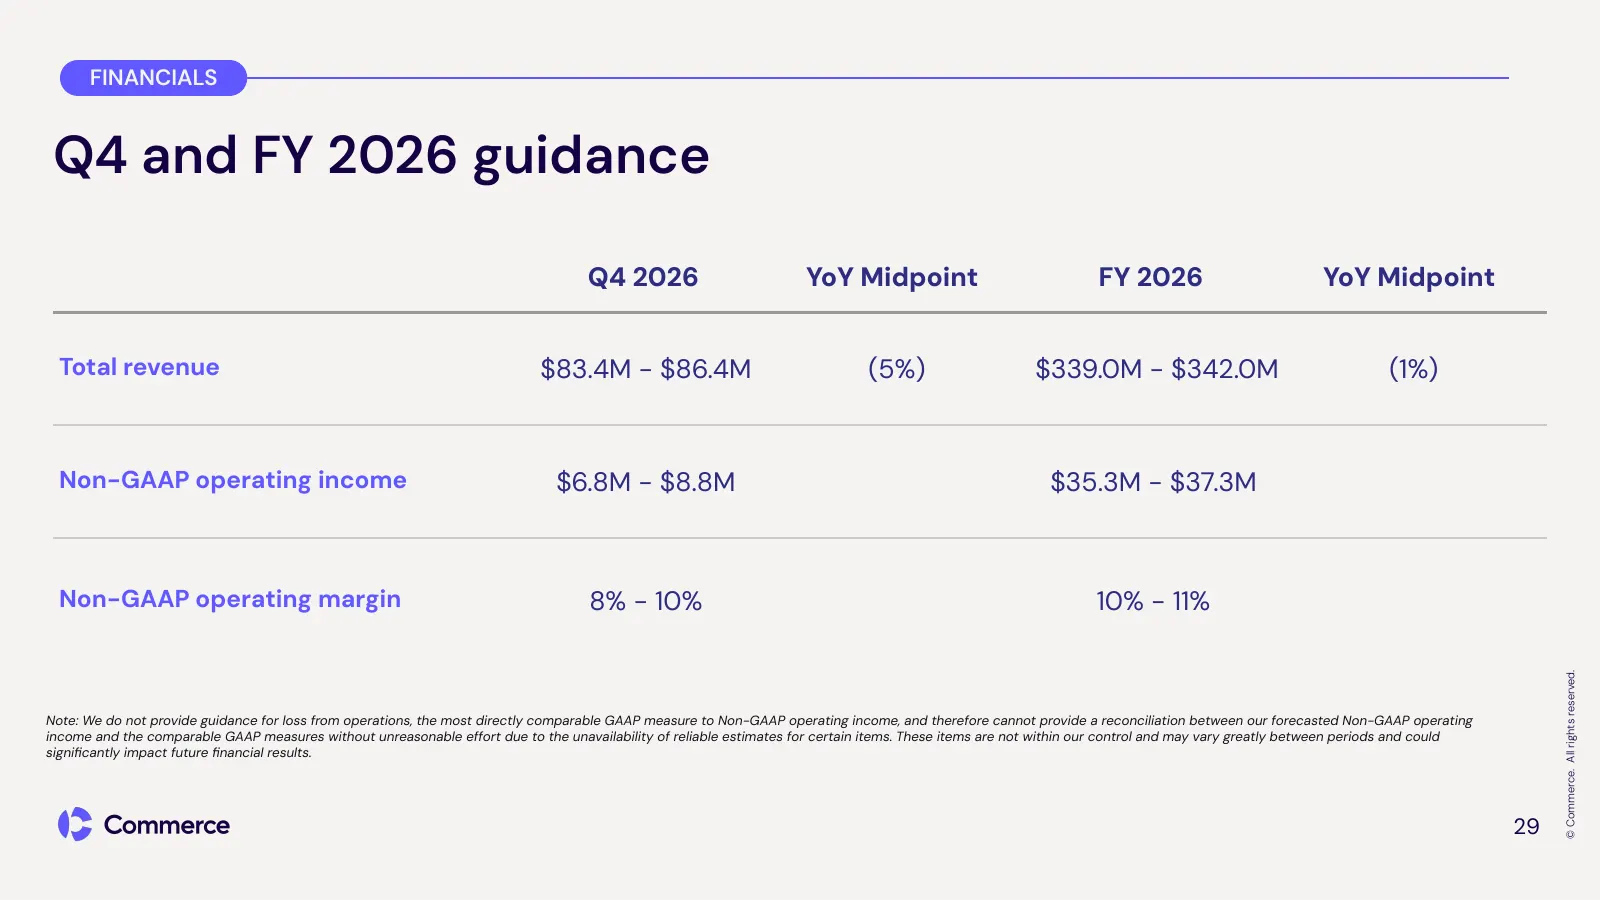
Slide 29: Q4 and FY 2026 guidance
FINANCIALS Q4 and FY 2026 guidance Q4 2026 YoY Midpoint FY 2026 YoY Midpoint Total revenue $83.4M - $86.4M (5%) $339.0M - $342.0M (1%) Non-GAAP operating income $6.8M - $8.8M $35.3M - $37.3M Non-GAAP operating margin 8% - 10% 10% - 11% © Commerce. All rights reserved. Note: We do not provide guidanc

Slide 30: Appendix
Appendix 30 © Commerce. All rights reserved.
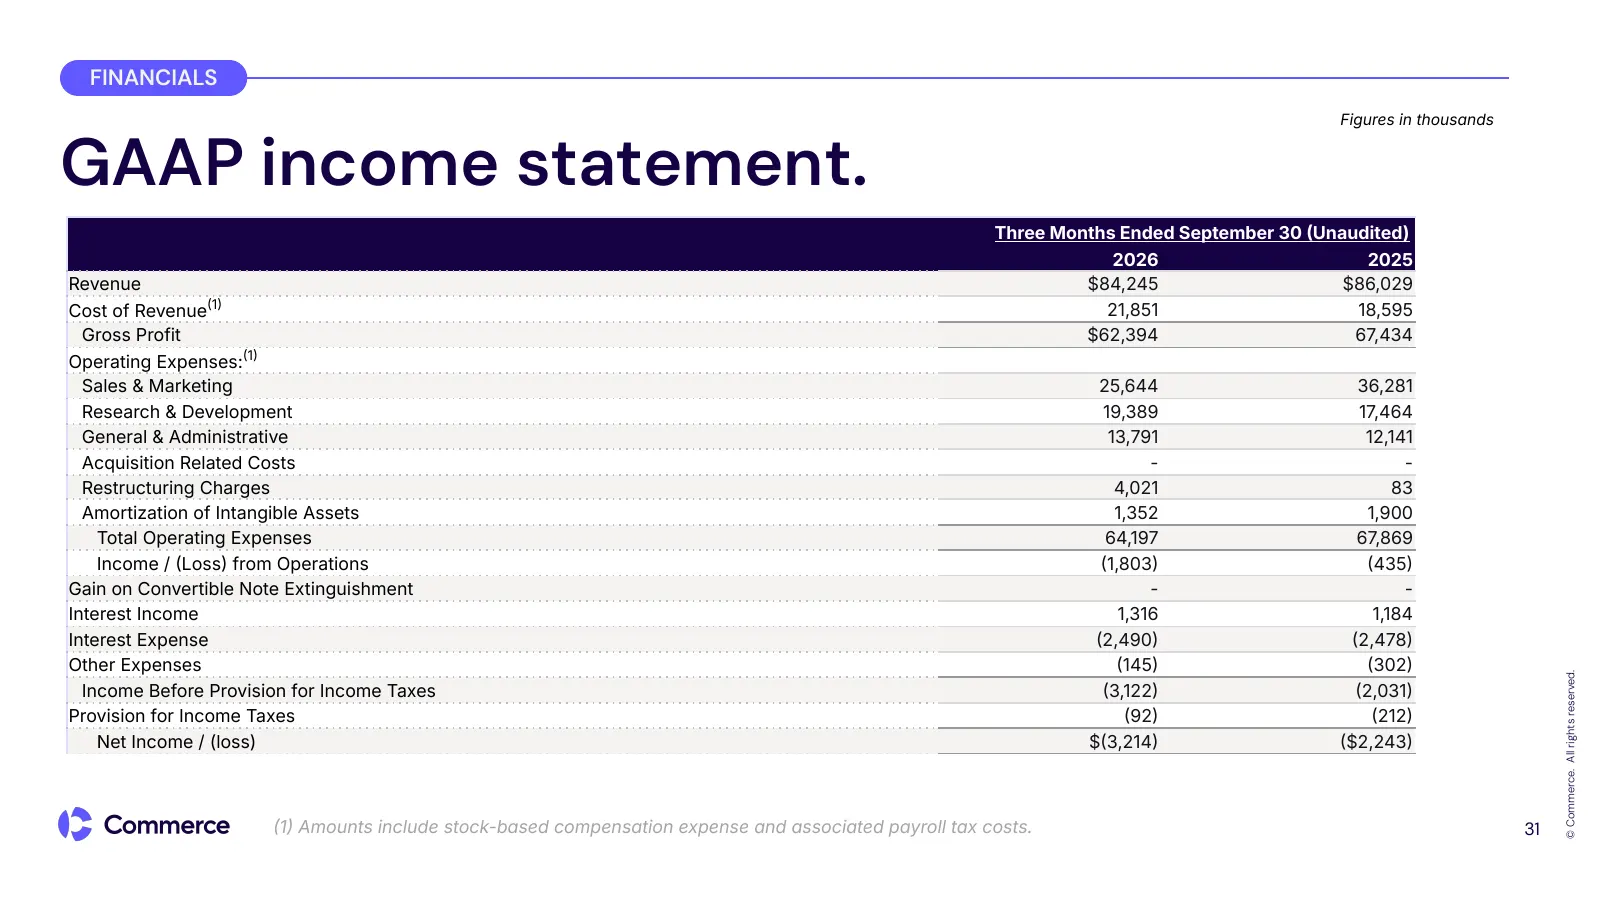
Slide 31: GAAP income statement
FINANCIALS Figures in thousands GAAP income statement. Three Months Ended September 30 Unaudited) 2026 2025 Revenue $84,245 $86,029 Cost of Revenue1 21,851 18,595 Gross Profit $62,394 67,434 Operating Expenses:1 Sales & Marketing 25,644 36,281 Research & Development 19,389 17,464 General & Admi
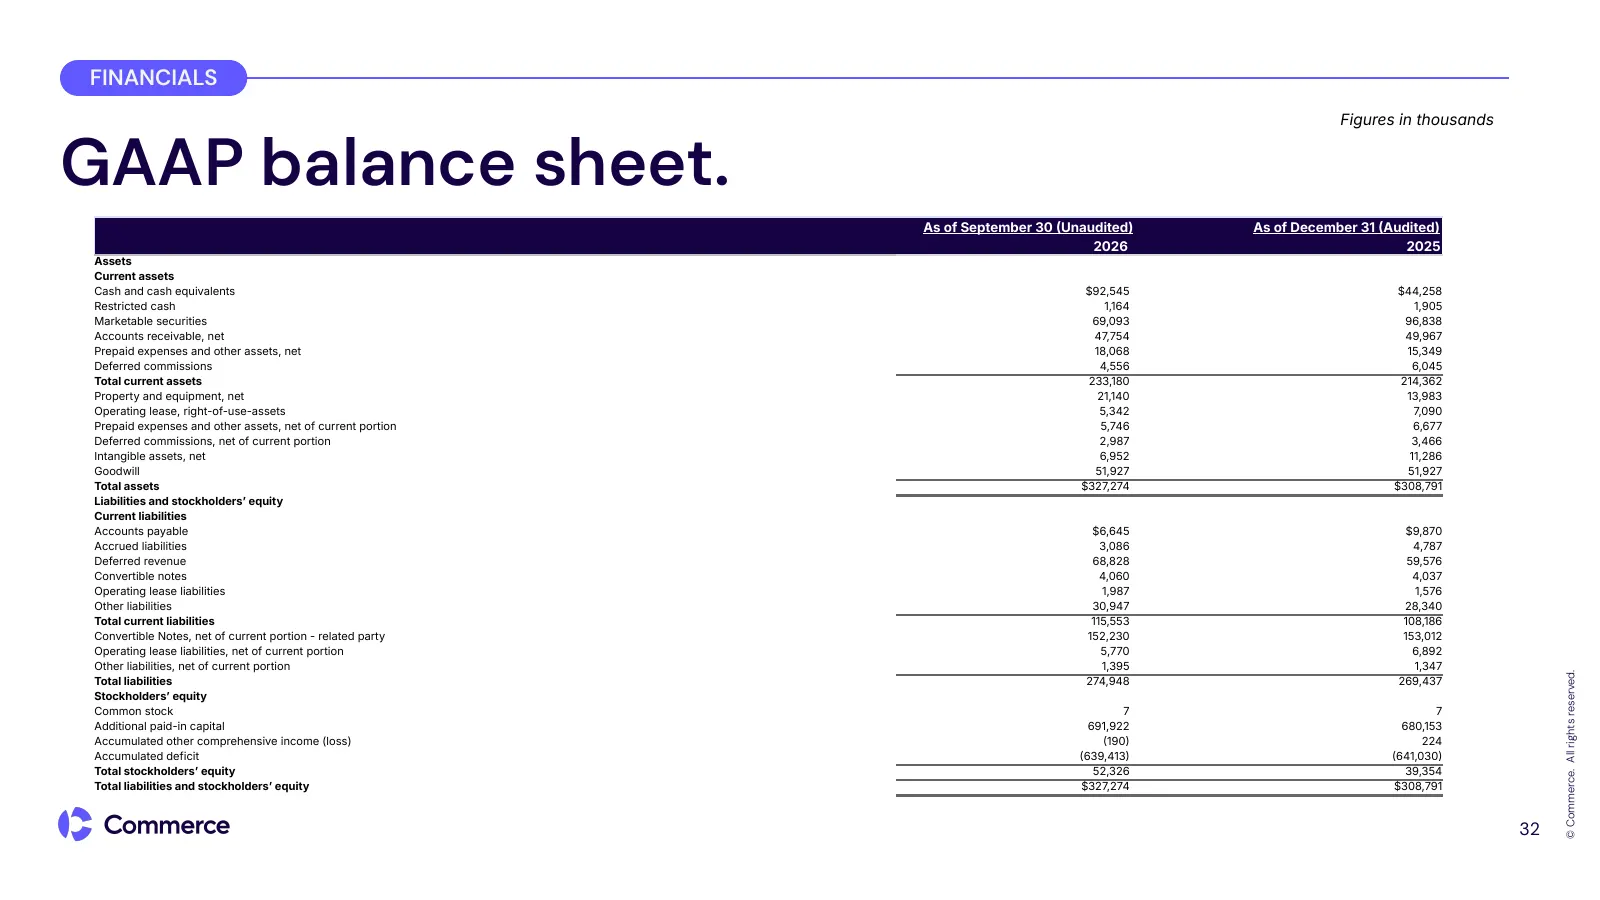
Slide 32: GAAP balance sheet
FINANCIALS Figures in thousands GAAP balance sheet. As of September 30 Unaudited) As of December 31 Audited) 2026 2025 Assets Current assets Cash and cash equivalents $92,545 $44,258 Restricted cash 1,164 1,905 Marketable securities 69,093 96,838 Accounts receivable, net 47,754 49,967 Prepaid expe
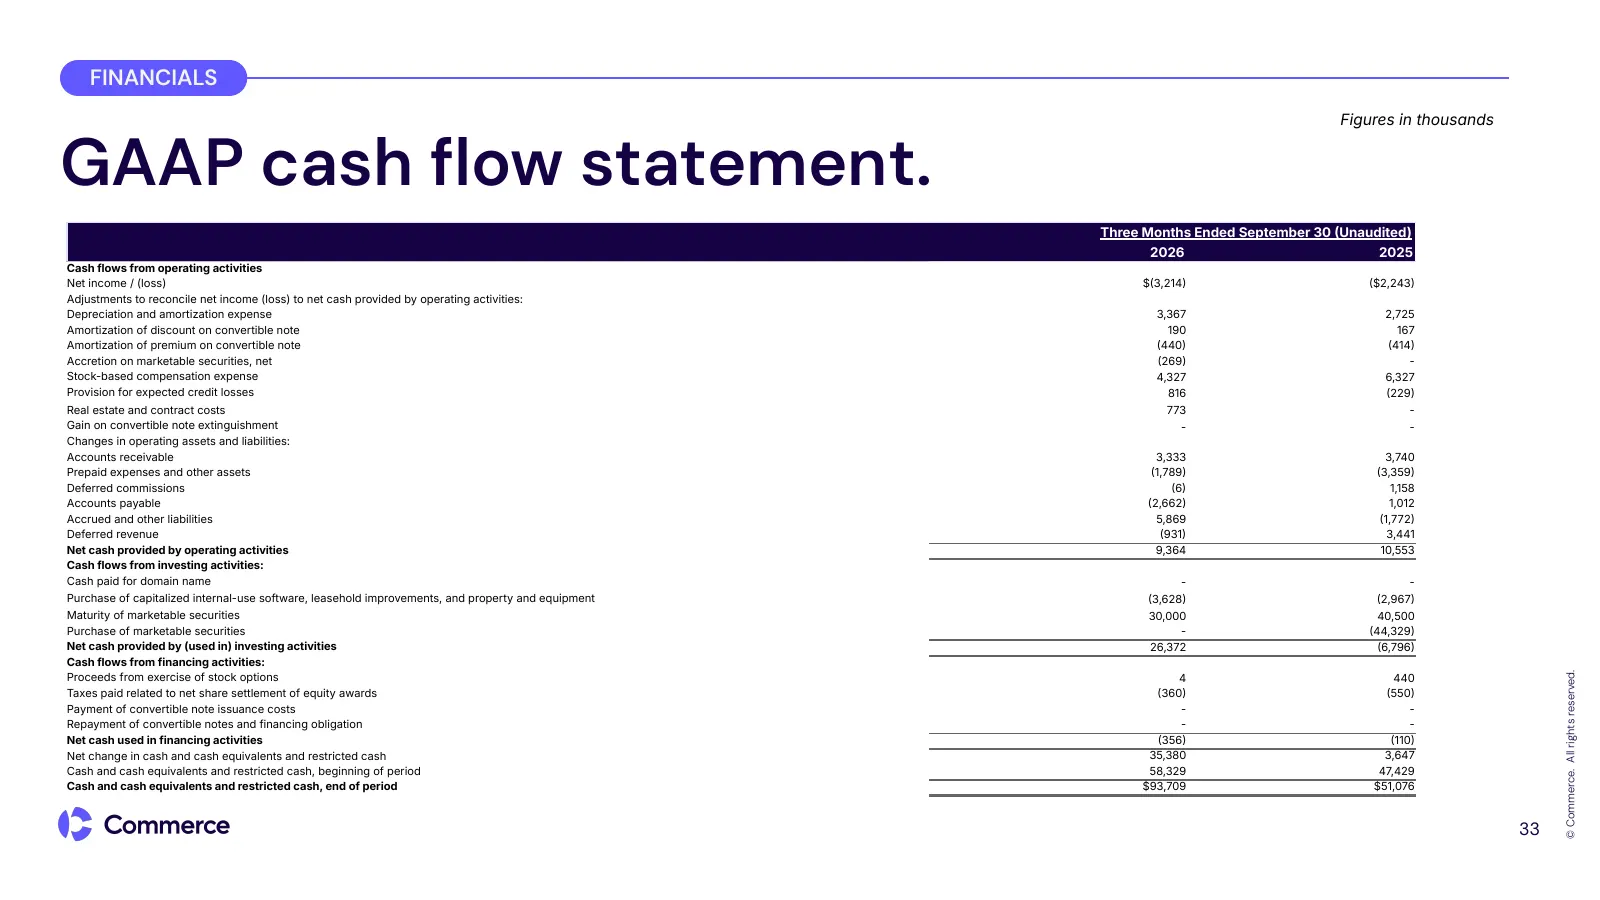
Slide 33: GAAP cash flow statement
FINANCIALS Figures in thousands GAAP cash flow statement. Three Months Ended September 30 Unaudited) 2026 2025 Cash flows from operating activities Net income / (loss) $3,214 $2,243 Adjustments to reconcile net income (loss) to net cash provided by operating activities: Depreciation and amortiza
Slide 34: Non-GAAP reconciliation
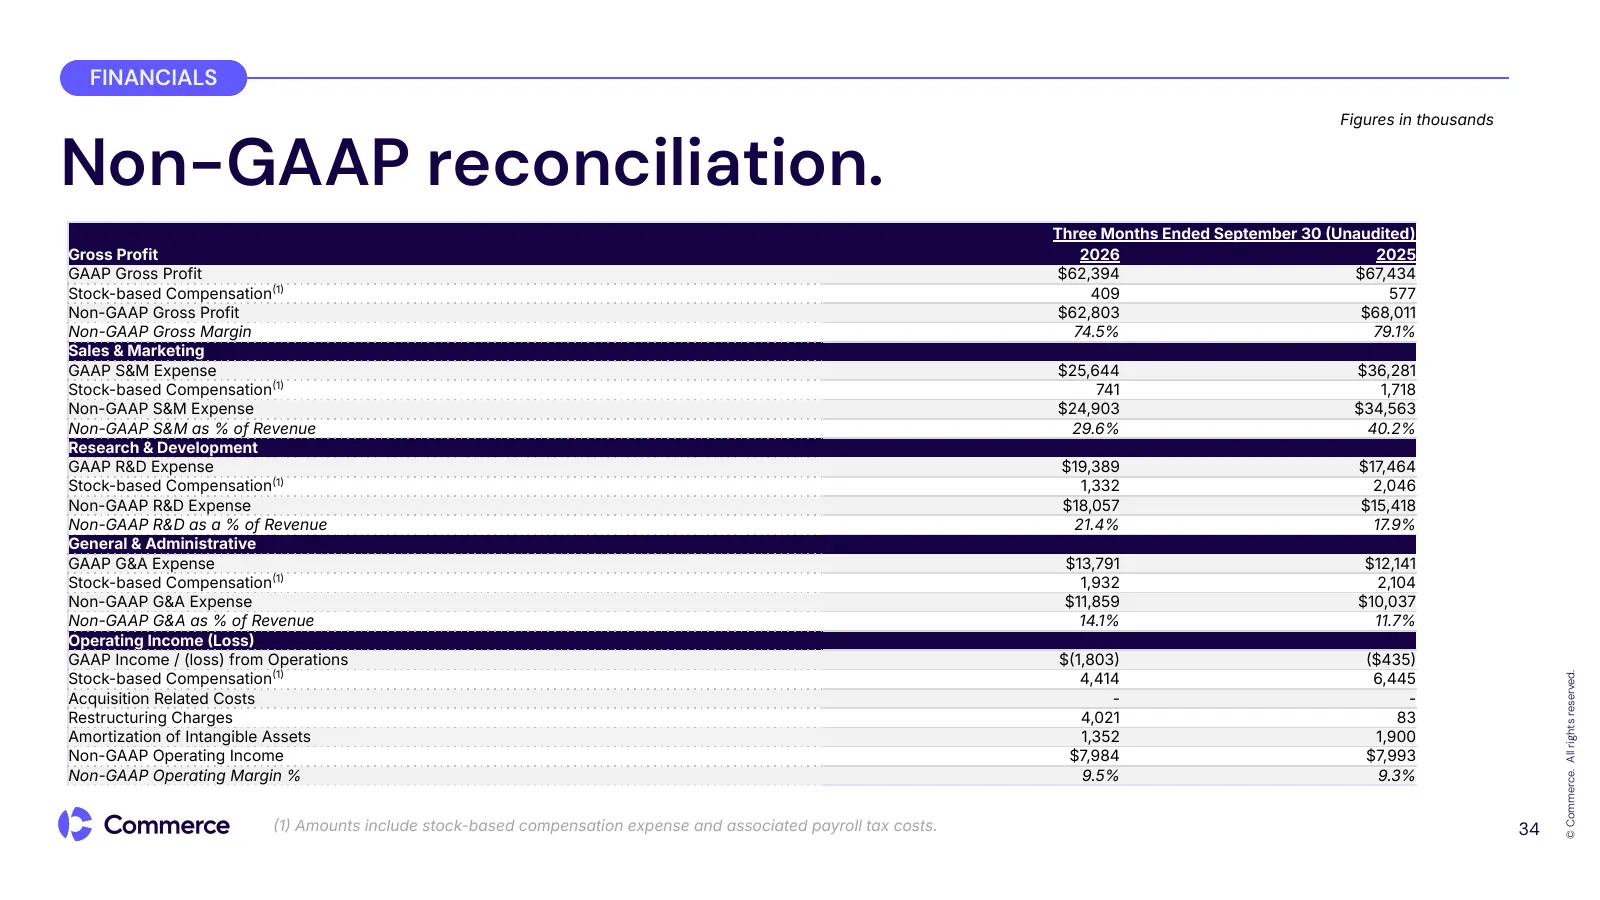
FINANCIALS Figures in thousands Non-GAAP reconciliation. Three Months Ended September 30 Unaudited) Gross Profit 2026 2025 GAAP Gross Profit $62,394 $67,434 Stock-based Compensation1 409 577 Non-GAAP Gross Profit $62,803 $68,011 Non-GAAP Gross Margin 74.5% 79.1% Sales & Marketing GAAP S&M Expense
Slide 35: Adjusted EBITDA reconciliation
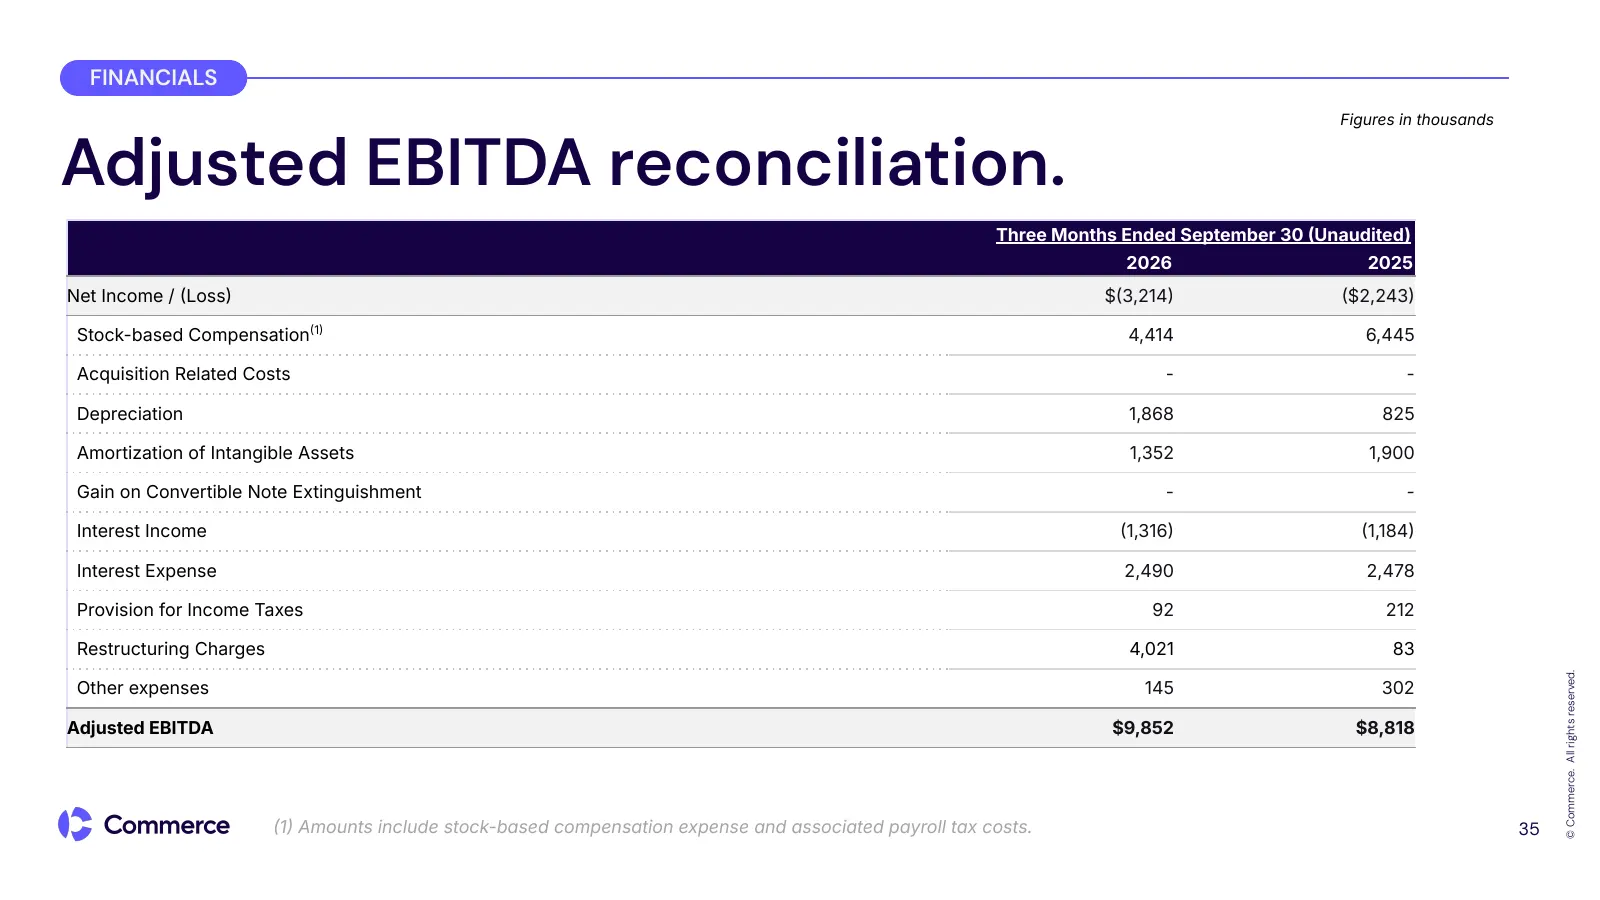
FINANCIALS Figures in thousands Adjusted EBITDA reconciliation. Three Months Ended September 30 Unaudited) 2026 2025 Net Income / Loss $3,214 $2,243 1 Stock-based Compensation 4,414 6,445 Acquisition Related Costs - - Depreciation 1,868 825 Amortization of Intangible Assets 1,352 1,900 Gain
Slide 36: Non-GAAP net income reconciliation
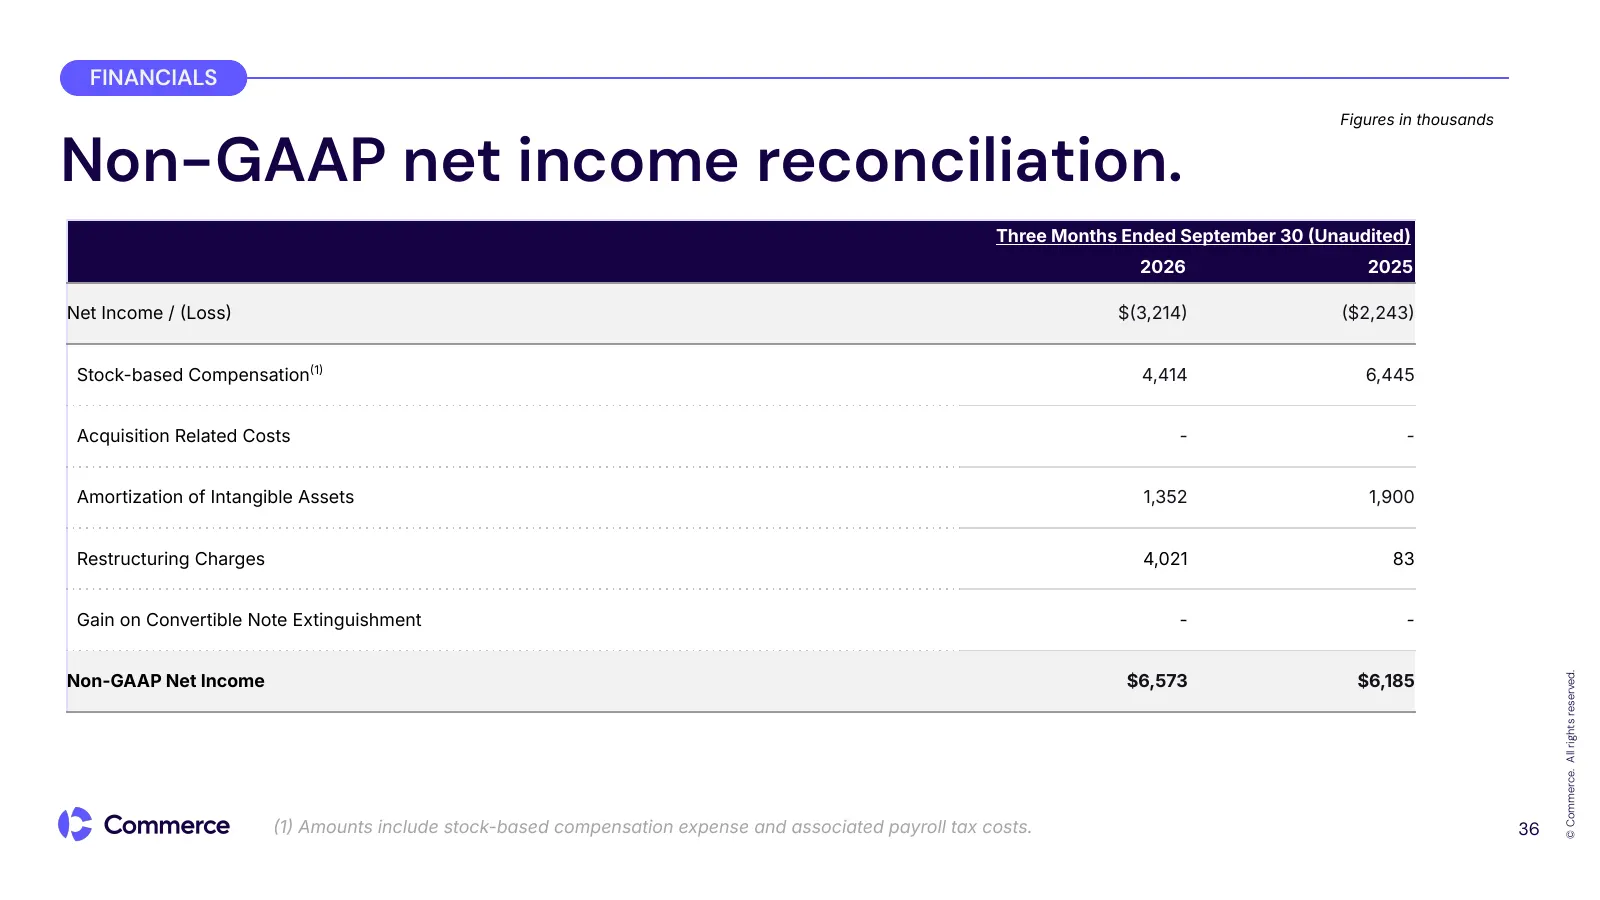
FINANCIALS Figures in thousands Non-GAAP net income reconciliation. Three Months Ended September 30 Unaudited) 2026 2025 Net Income / Loss $3,214 $2,243 Stock-based Compensation1 4,414 6,445 Acquisition Related Costs - - Amortization of Intangible Assets 1,352 1,900 Restructuring Charges 4,
Slide 37: AI glossary
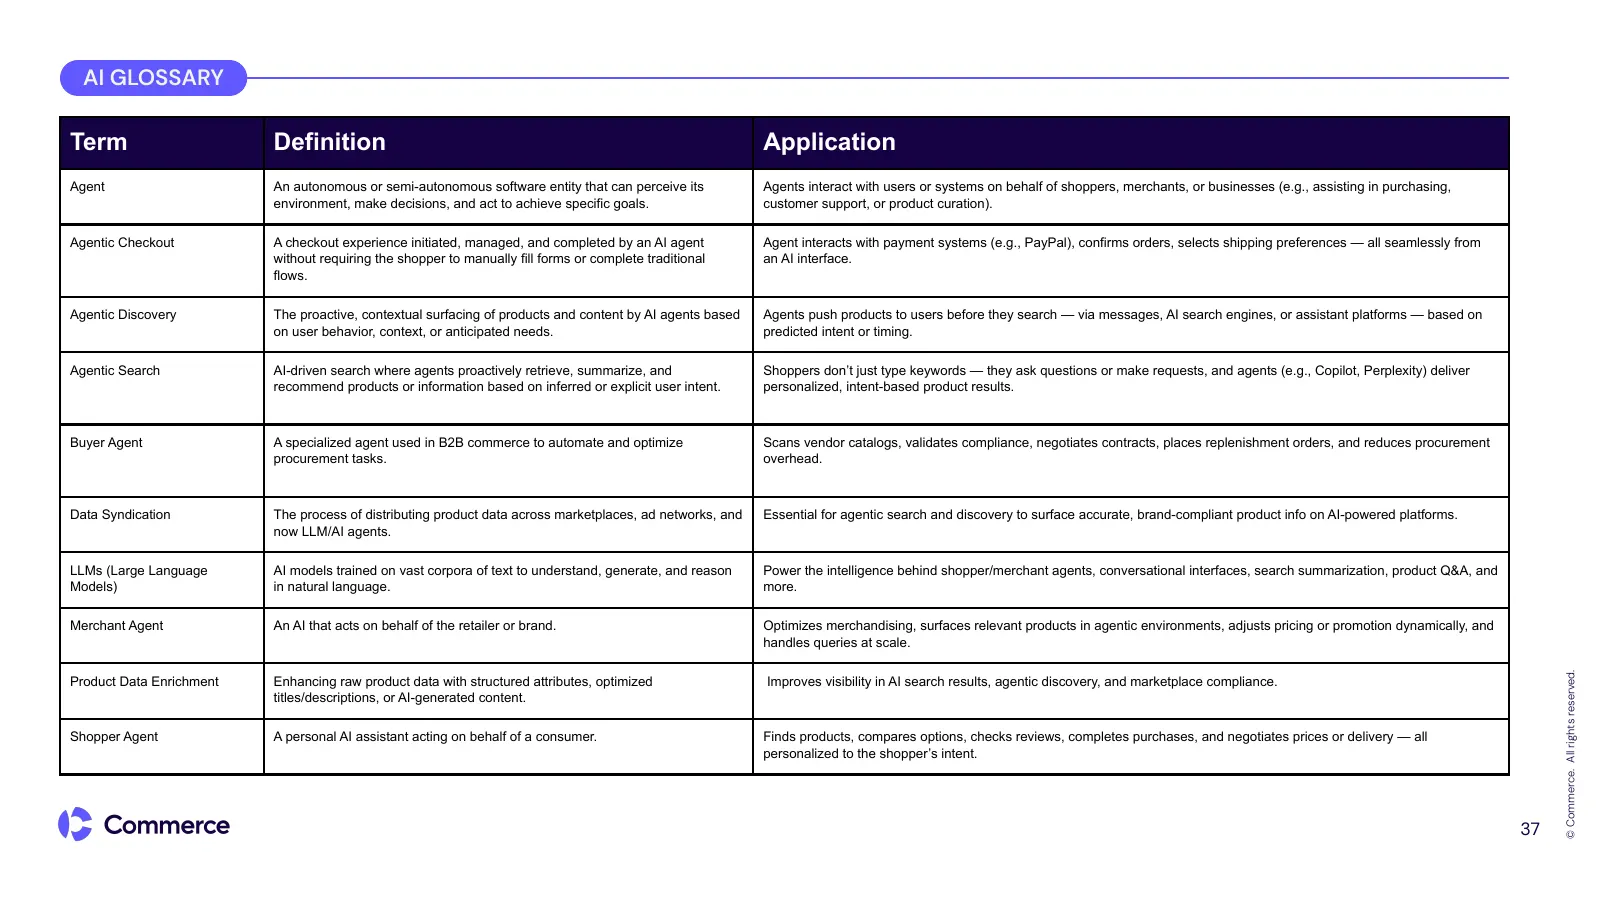
AI GLOSSARY Term Definition Application Agent An autonomous or semi-autonomous software entity that can perceive its Agents interact with users or systems on behalf of shoppers, merchants, or businesses (e.g., assisting in purchasing, environment, make decisions, and act to achieve specific goals. c
Source: 6ix earnings call
More decks from Commerce.com, Inc. - Series 1
 Q2 2026 Earnings Presentation37 slides · Aug 6, 2026
 Q1 2026 Earnings Presentation37 slides · May 7, 2026
 Q4 2025 Earnings Presentation40 slides · Feb 12, 2026
 Q2 2025 Earnings Presentation36 slides · Jul 31, 2025
 Q1 2025 Earnings Presentation36 slides · May 8, 2025
 Q4 2024 Earnings Presentation36 slides · Feb 20, 2025