TPG Inc. · NASDAQ:TPG
TPG — FY2001 Earnings Presentation
44 slides from TPG's earnings presentation, Feb 21, 2002

Slide 1

Slide 2: Press Presentation 21 February 2002
Press Presentation 21 February 2002

Slide 3: Financial Review / Business Review
Finacial Review f © Businéss Review ~ amp Ate

Slide 4: Business Review
Business Review
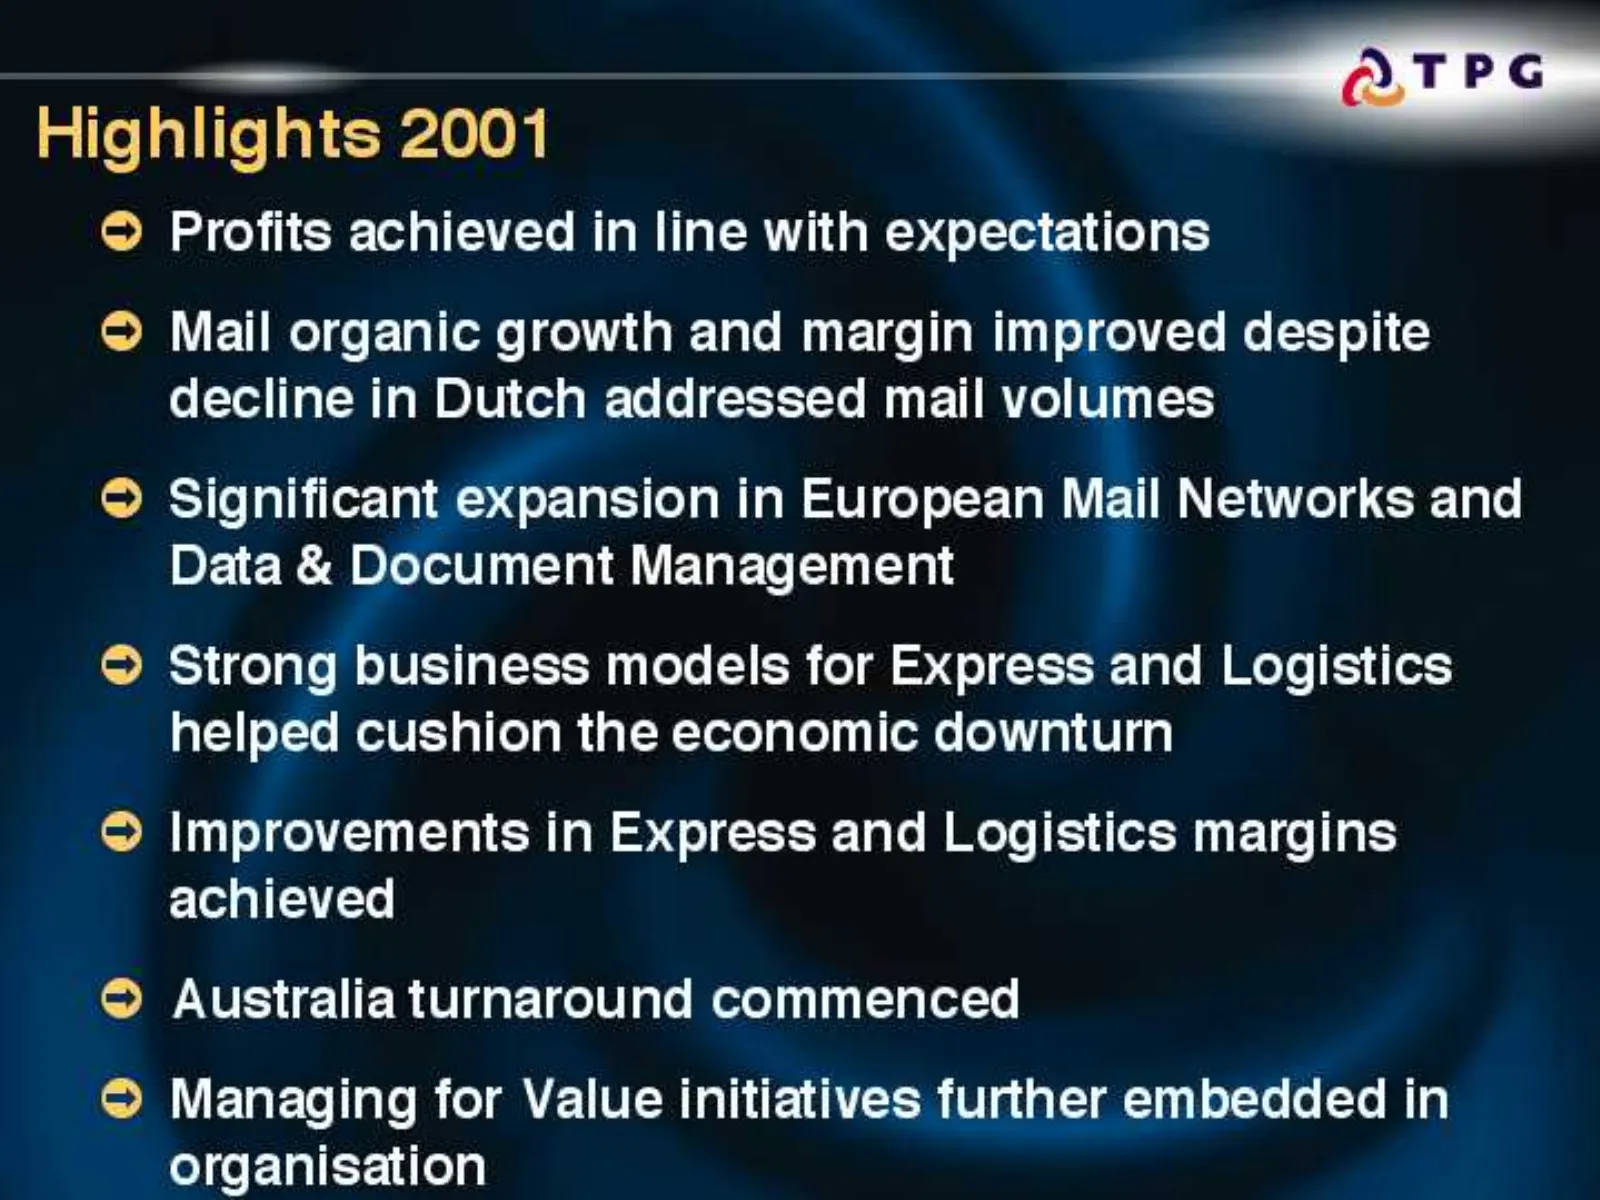
Slide 5: Highlights 2001
Highlights 2001 a © Profits achieved in line with expectations © Mail organic growth and margin improved despite decline in Dutch addressed mail volumes © Significant expansion in European Mail Networks and Data & Document Management : © Strong business models for Express and Logistics helped cushio
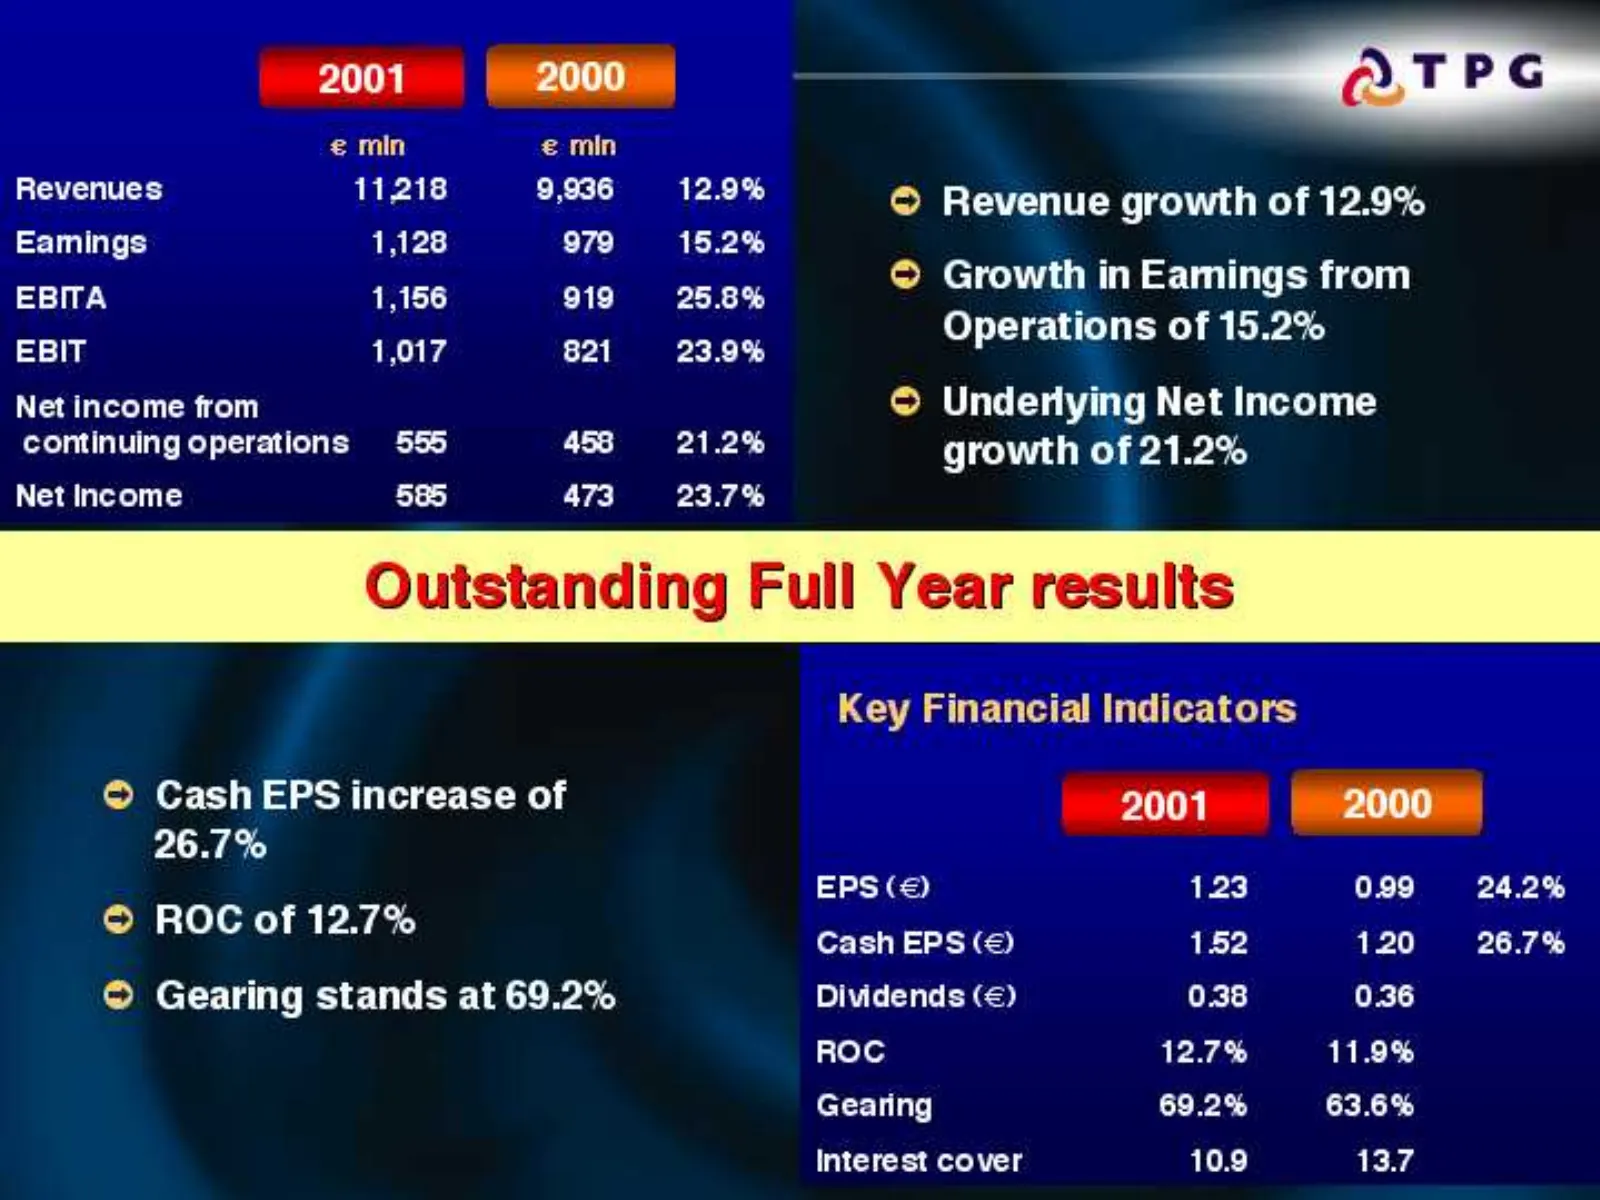
Slide 6: Group results 2001 vs 2000
001 2000 oe € min € min Revenues 11218 9,936 12.9% © Revenue growth of 12.9% Eamings 1,128 979 15.2% ' ; ERITA 1,156 gy osne © Growth in Eamings from EBIT 1,017 821 23.9% Operamees OF 152% Net income from © Underlying Net Income continuing operations 555 458 21.2% growth of 21.2% Net Income 585 473
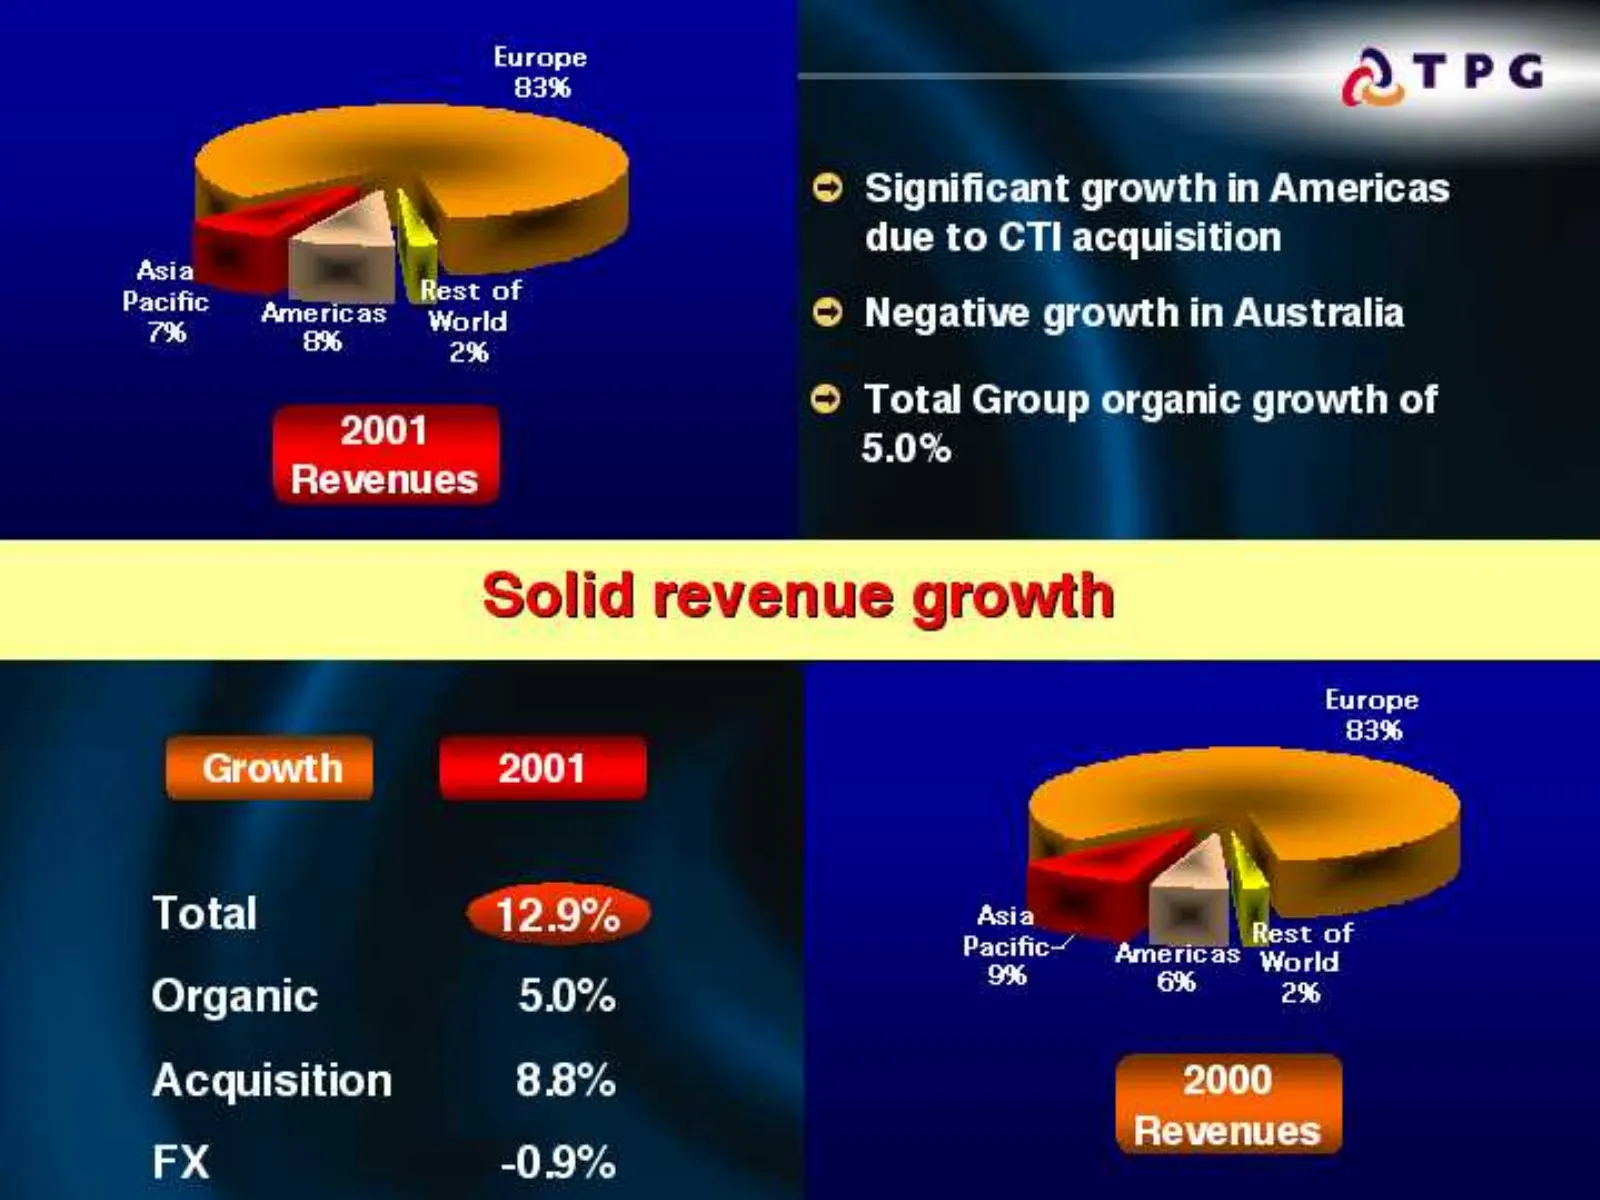
Slide 7: Revenue growth by region
Europe 83% © Significant growth in Americas due to CTI acquisition Asia = Pacific Americas oid © Negative growth in Australia © Total Group organic growth of 5.0% Europe 83% Growth = 2001 Total “129% Asian | lest of Pacific Americas World Organic 5.0% i 2% Acquisition 88% FX -0.9%
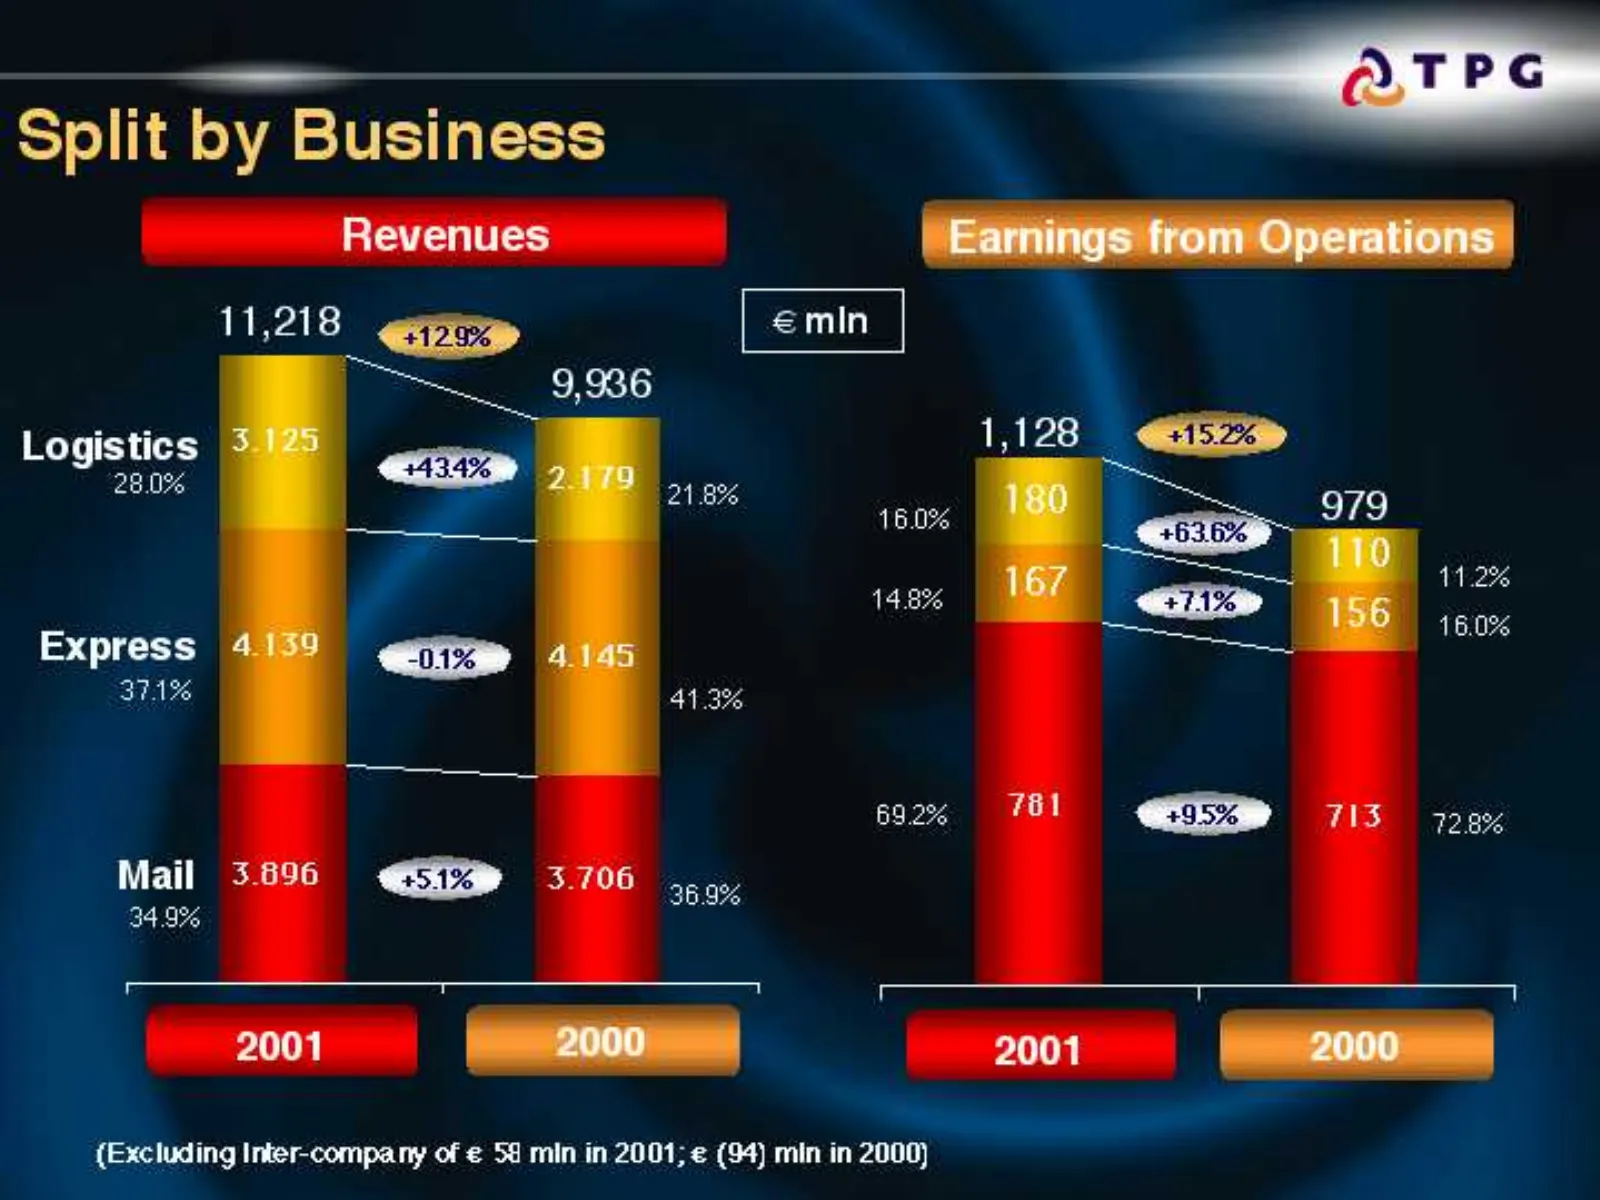
Slide 8: Split by Business
ell Split by Business Revenues 11,218 128% €min Logistics 28.0% Voge. Express sect 371% 41.3% 2001 2001 uding Inter-compa ny of € 58 min in 2001; € (94) min in 2000)

Slide 9: Mail
Slide 10: Mail Highlights 2001
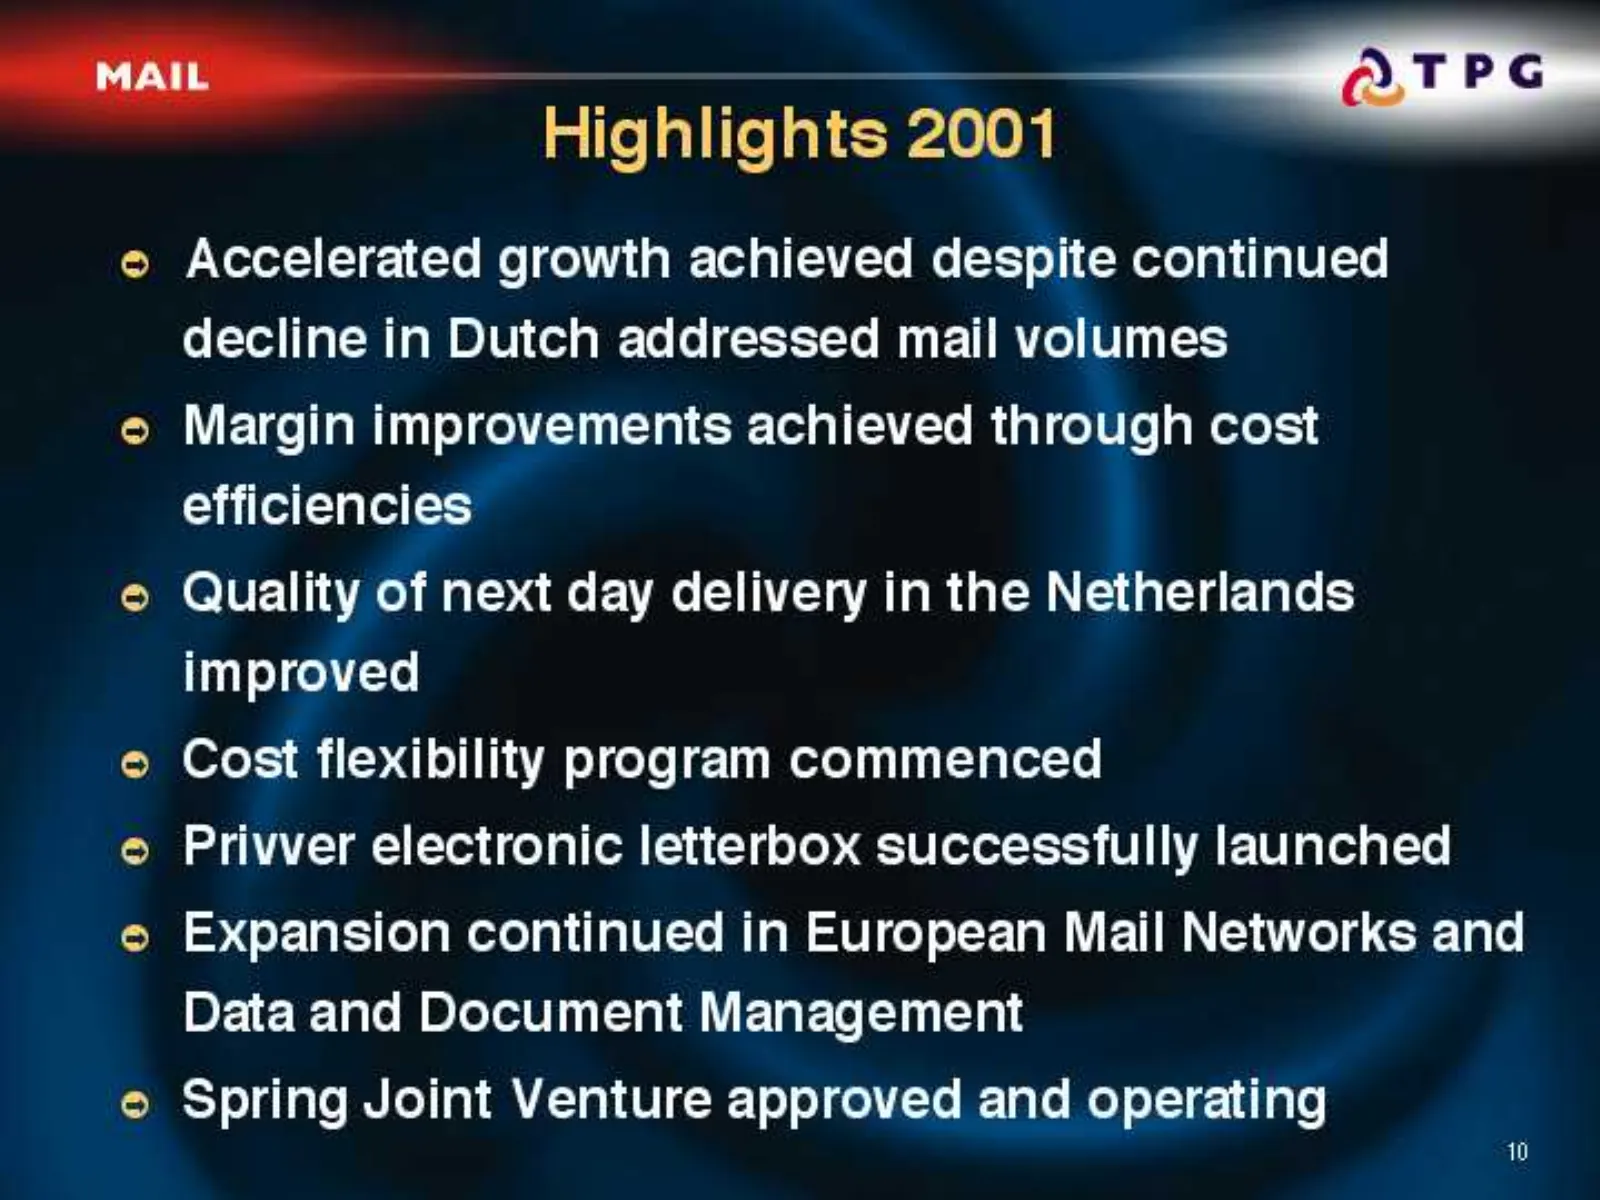
—— Highlights 2001 Le © Accelerated growth achieved despite continued decline in Dutch addressed mail volumes © Margin improvements achieved through cost efficiencies — . © Quality of next day delivery in the Netherlands improved © Cost flexibility program commenced © Privver electronic letterbox su
Slide 11: Mail results
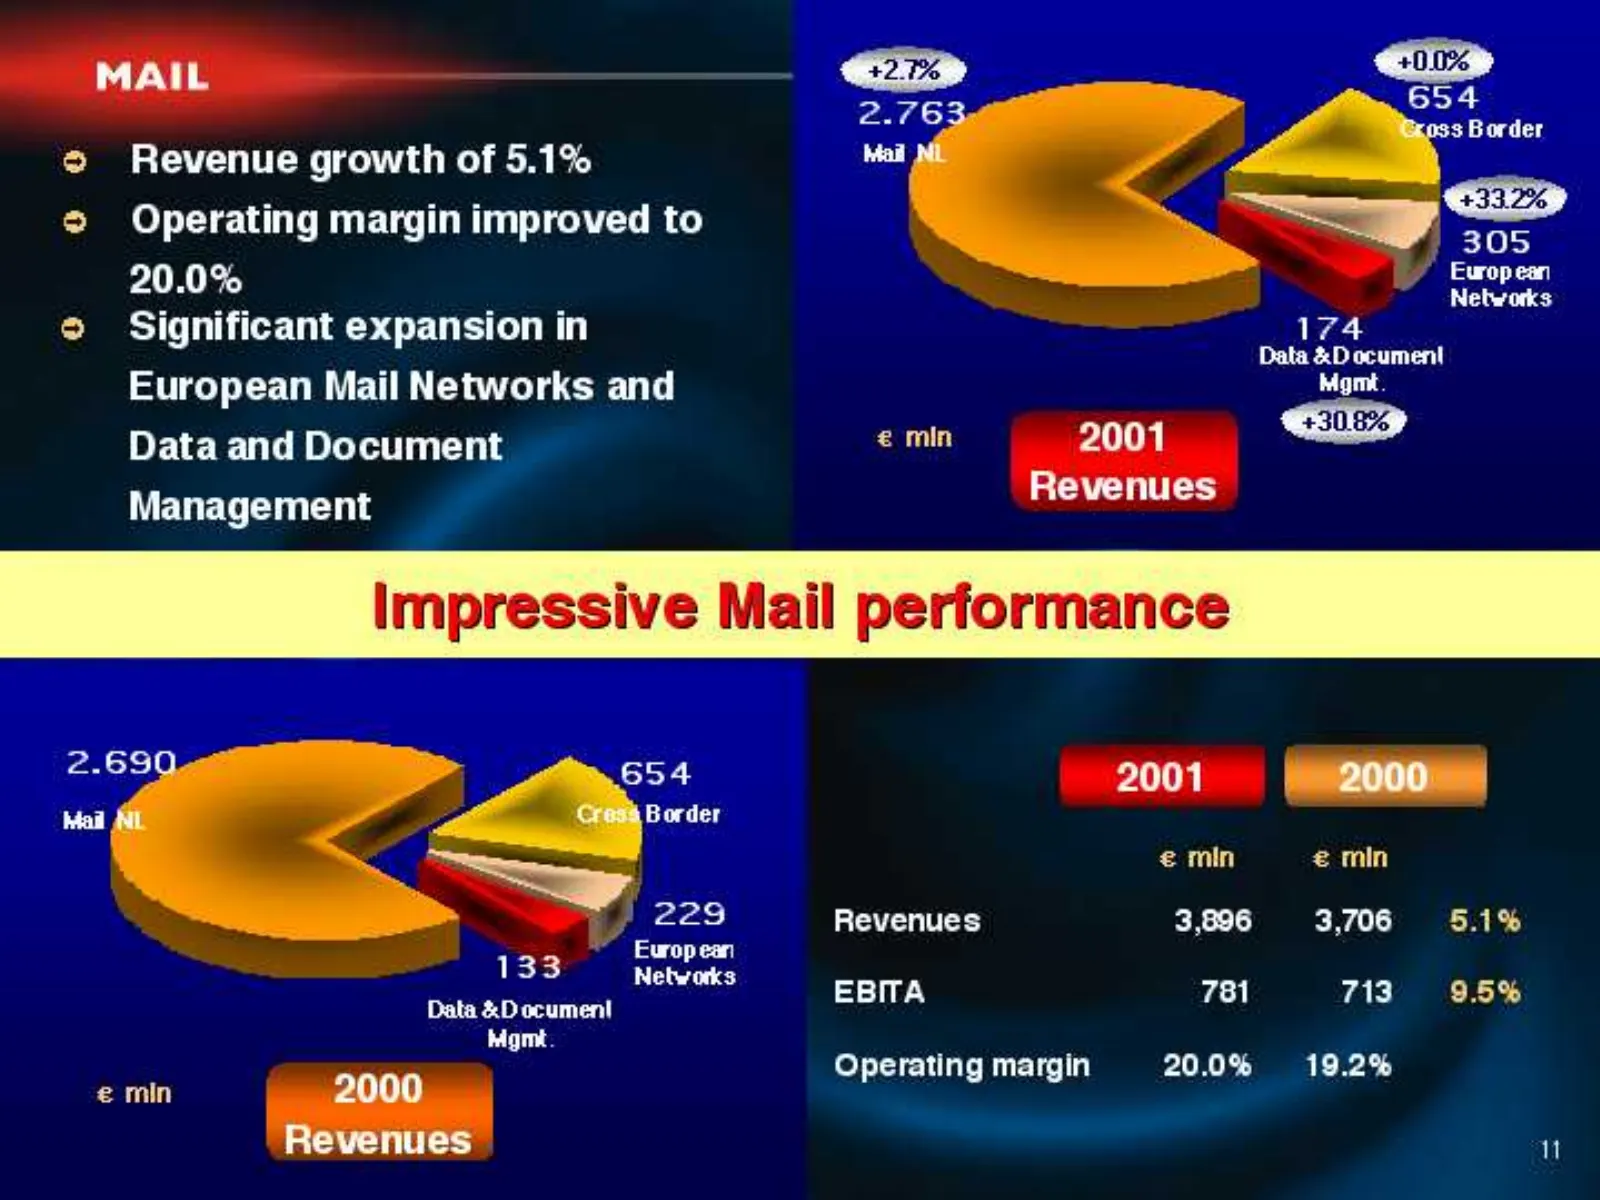
MAIL > 2.76 3 3 Border © Revenue growth of 5.1% — © Operating margin improved to gy > 20.0% i Pappa © Significant expansion in 174 European Mail Networks and ee Data and Document € min 2001 Management Revenues Impressive Mail performance 2001 + 2000) gy € min € min aa) Revenues 3,896 3,706 5.1% ae o
Slide 12: Mail organic revenue growth
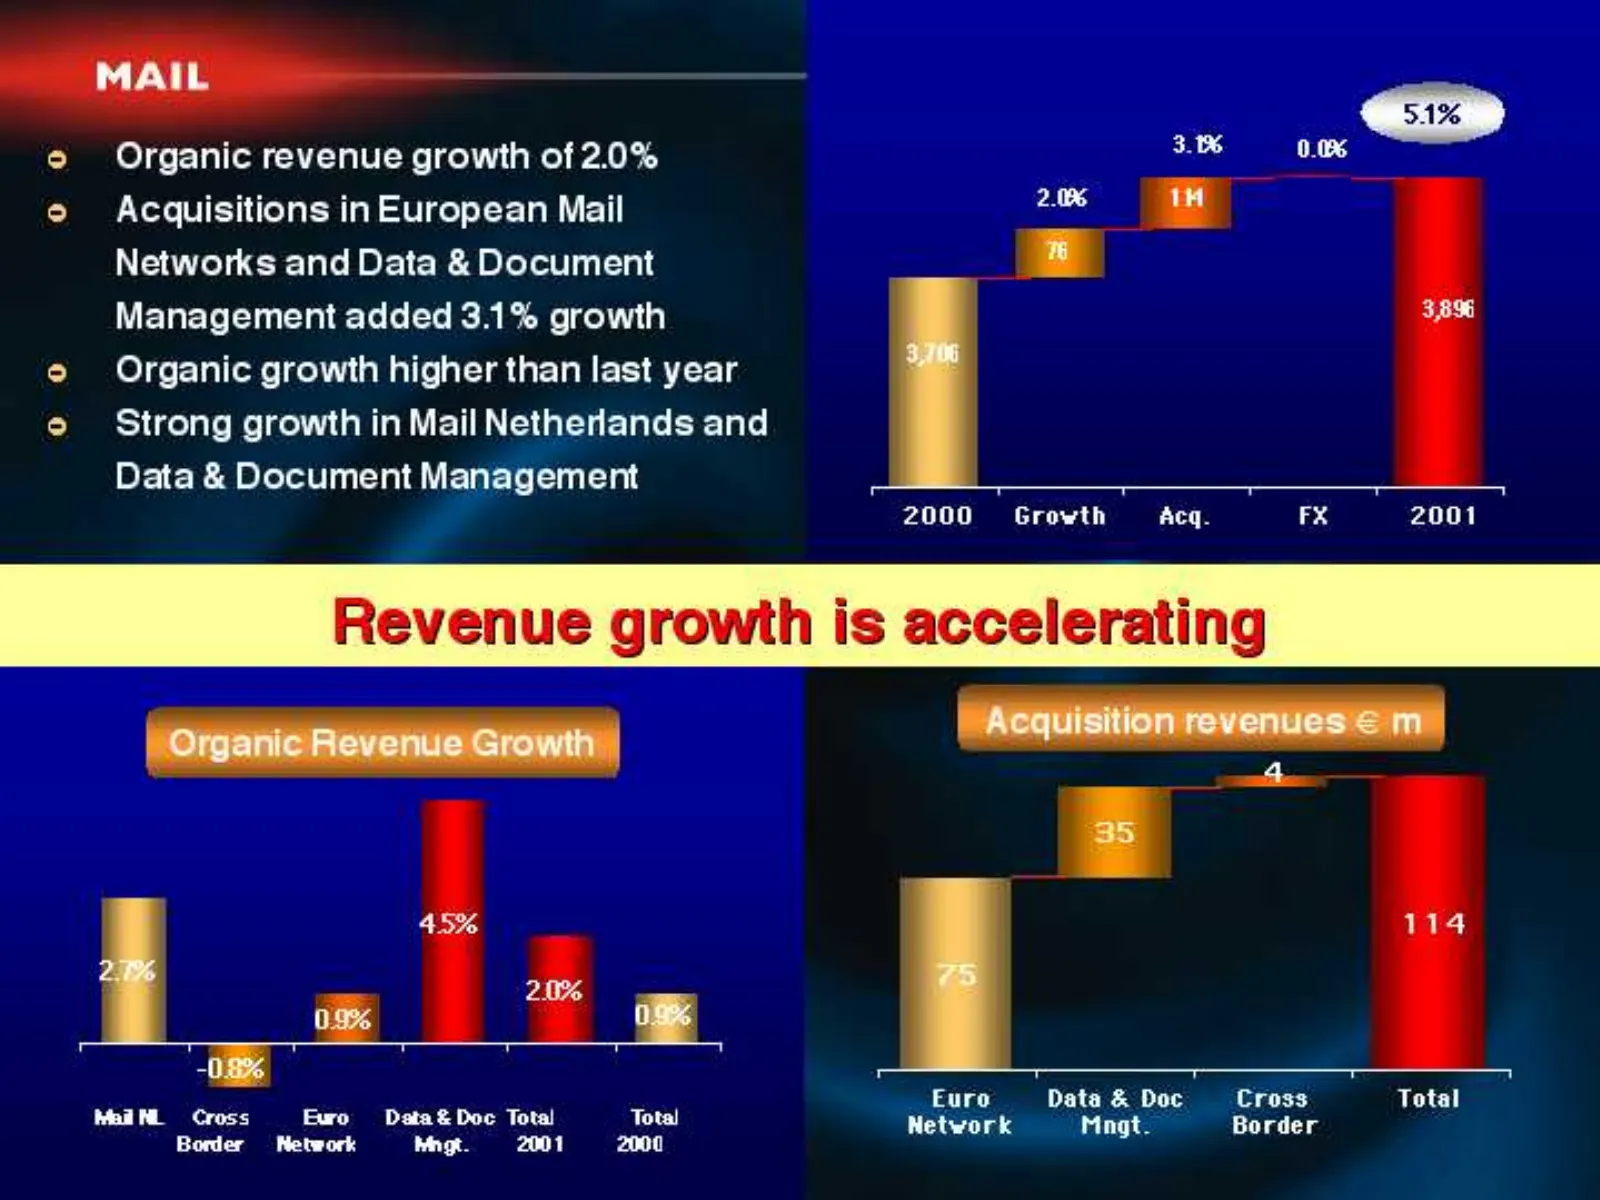
MAIL Organic revenue growth of 2.0% Acquisitions in European Mail — Networks and Data & Document iw Management added 3.1% growth 32% e Organic growth higher than last year © Strong growth in Mail Netherlands and Data & Document Management : = : : 5: 2000 Growth Acq. FX 2001 Revenue growth is acceler
Slide 13: Addressed mail volume growth (NL)
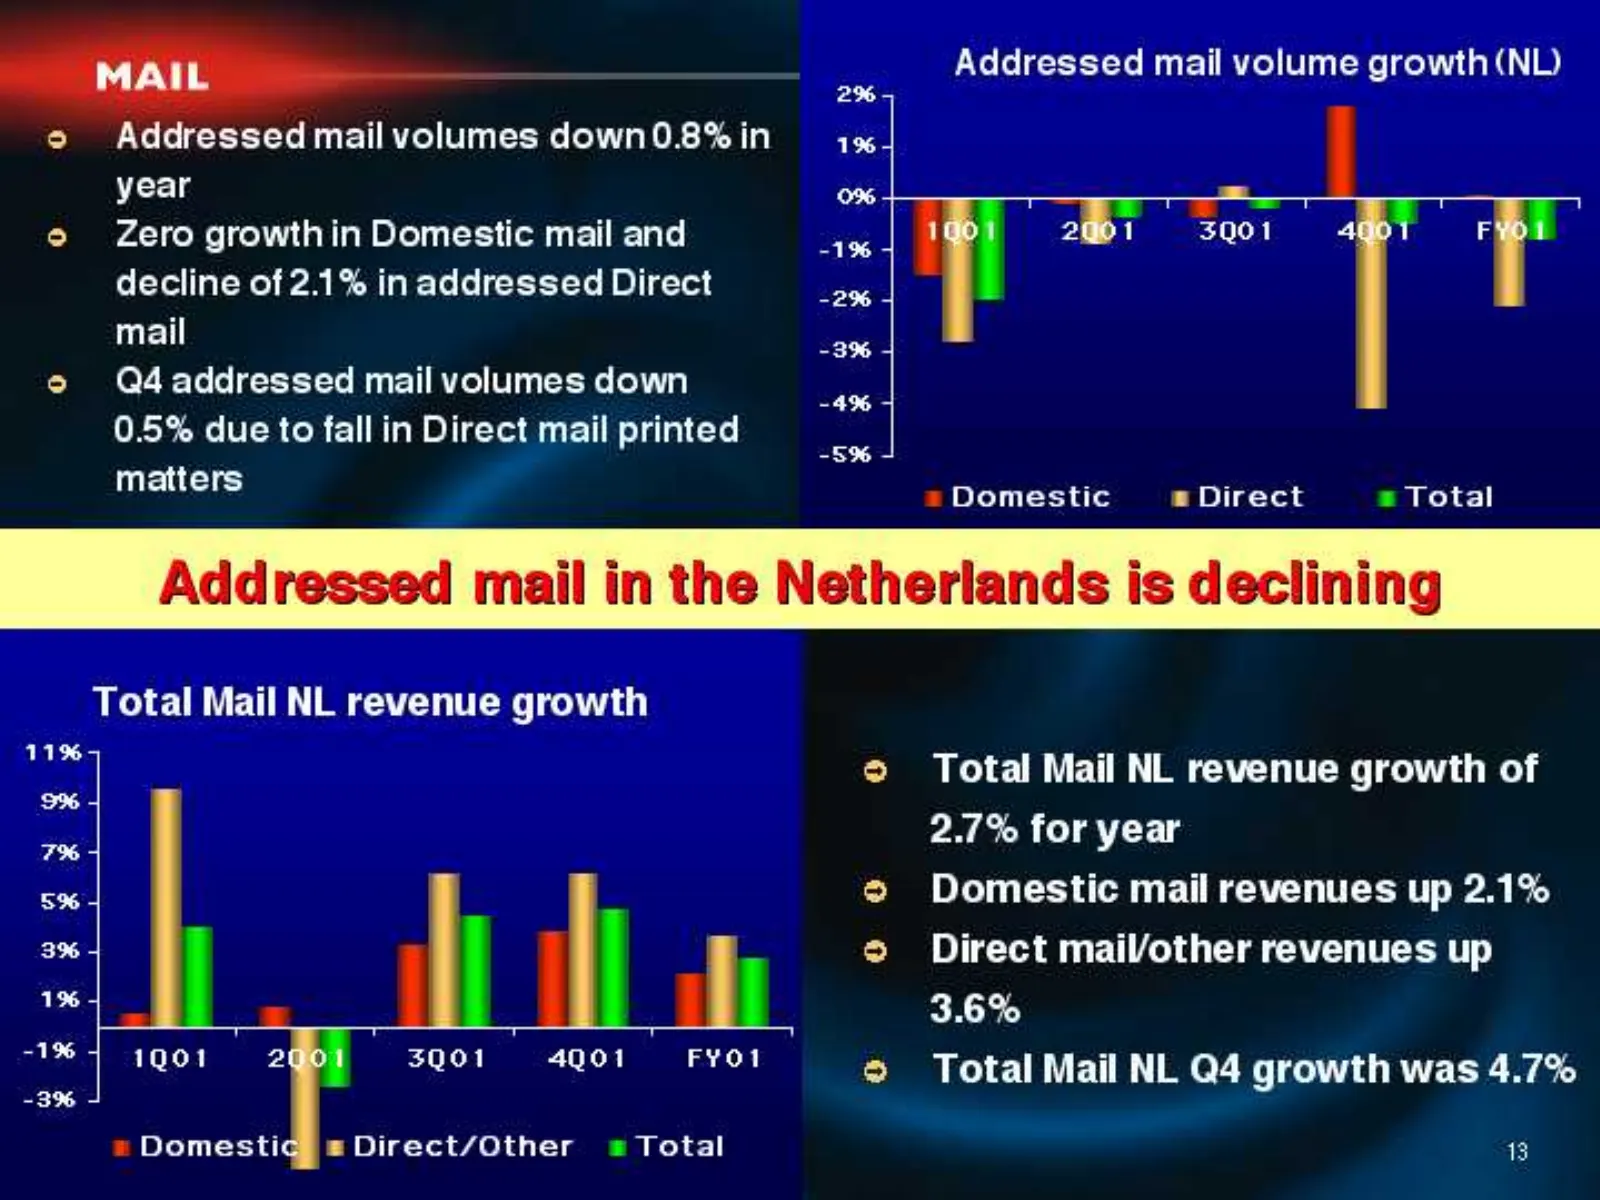
a Addressed mail volume growth (NL) 2% 5 ) essed mail volumes down0.8% in 1% year 0% J eo e@ Zero growthin Domestic mail and cae 2@1 3901 F decline of 2.1% in addressed Direct eg r mail Sse eo Q4addressed mail volumes down 0.5% due to fall in Direct mail printed matters = Domestic # Direct = Total T
Slide 14: Mail margin Q4 and full year
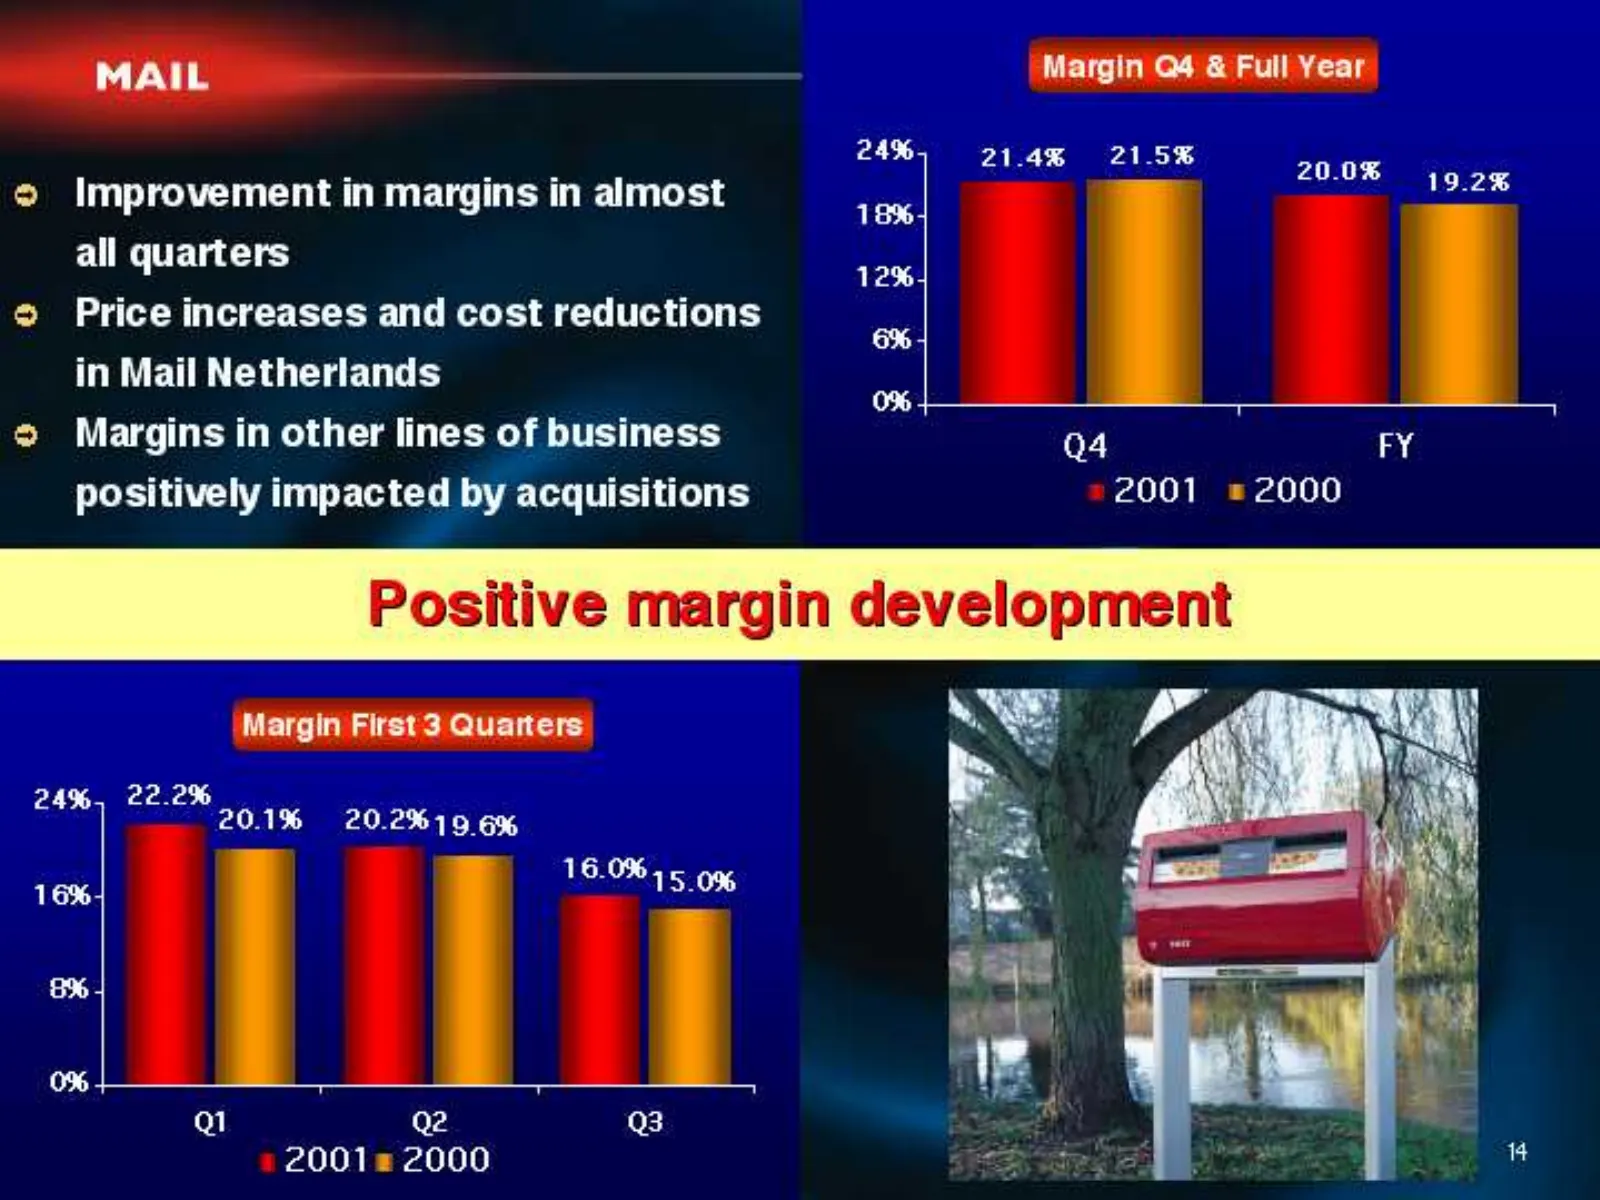
MAIL Margin Q4 & Full Year 24% 21.4% 21.5% ake © Improvement in margins in almost em 18% all quarters oa © Price increases and cost reductions eh in Mail Netherlands © Margins in other lines of business positively impacted by acquisitions 2001 = 2000 Positive margin development 0% + Margin First 3 Q
Slide 15: Cost flexibility program implementation
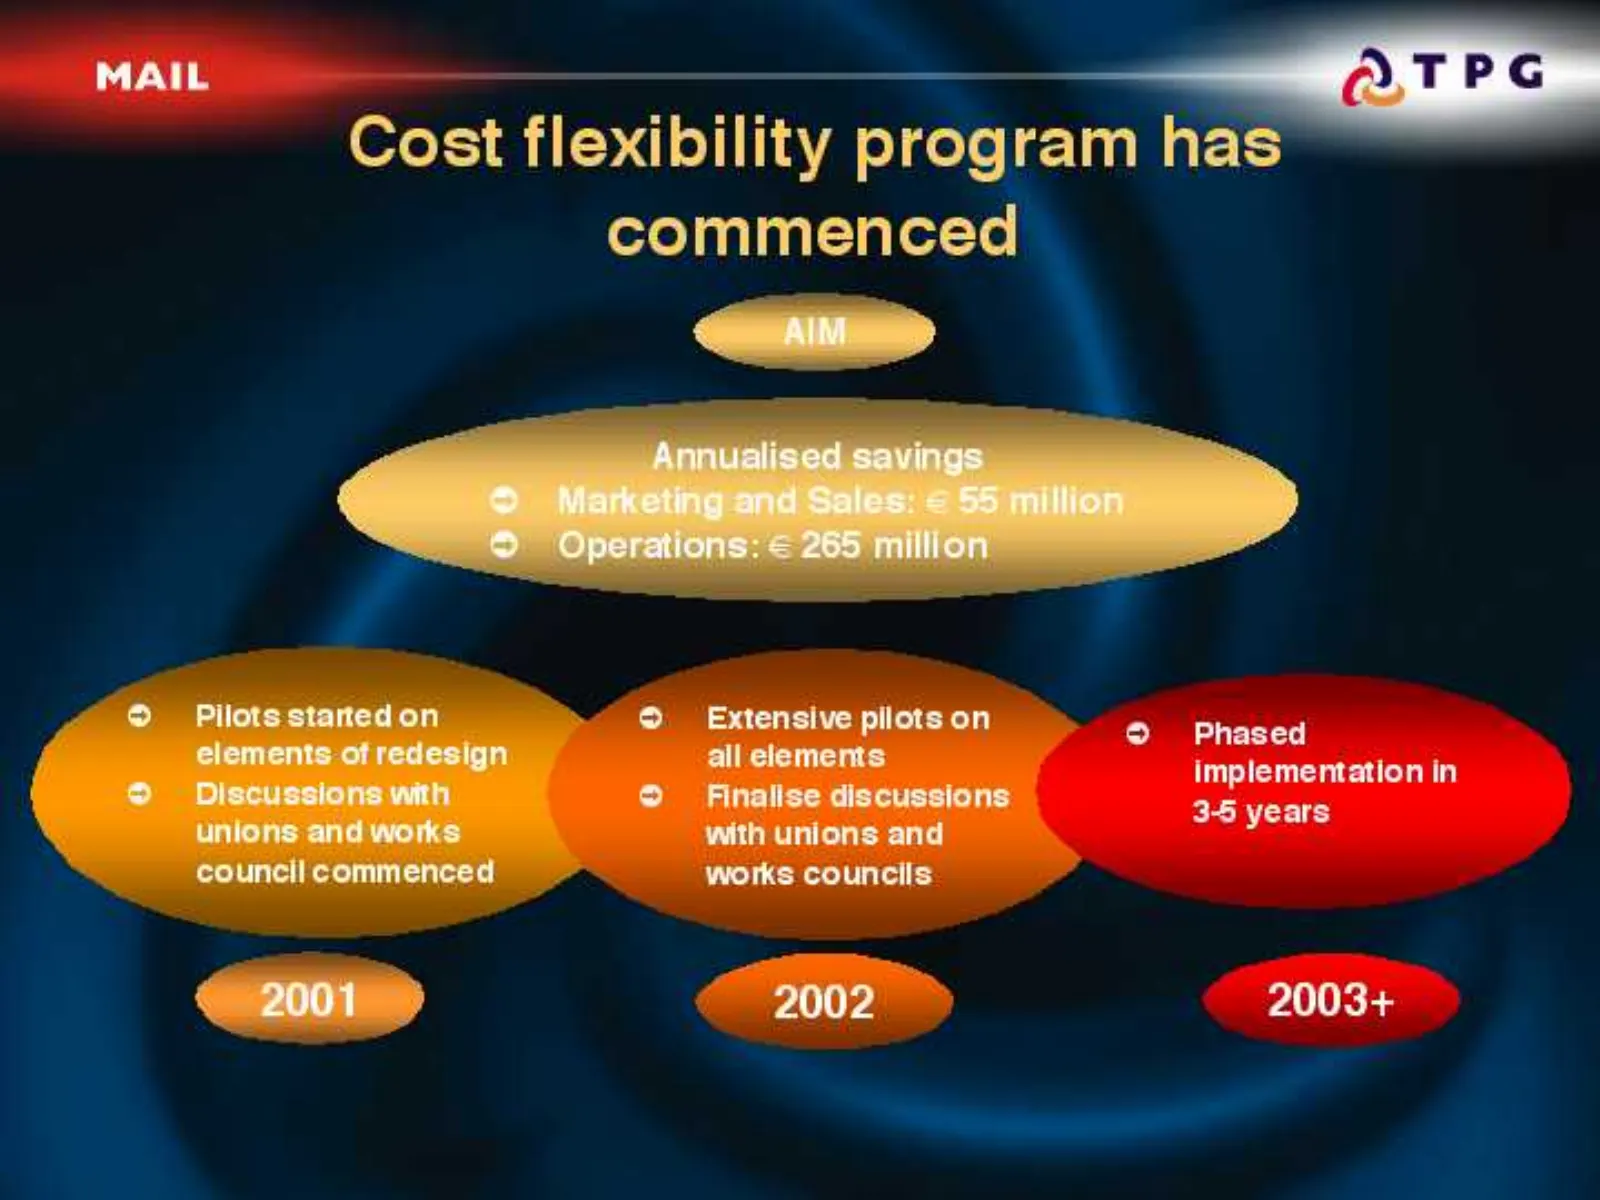
© Extensivepliotson » 65 phased i oe , implementation in 34 years
Slide 16: European mail networks are expanding
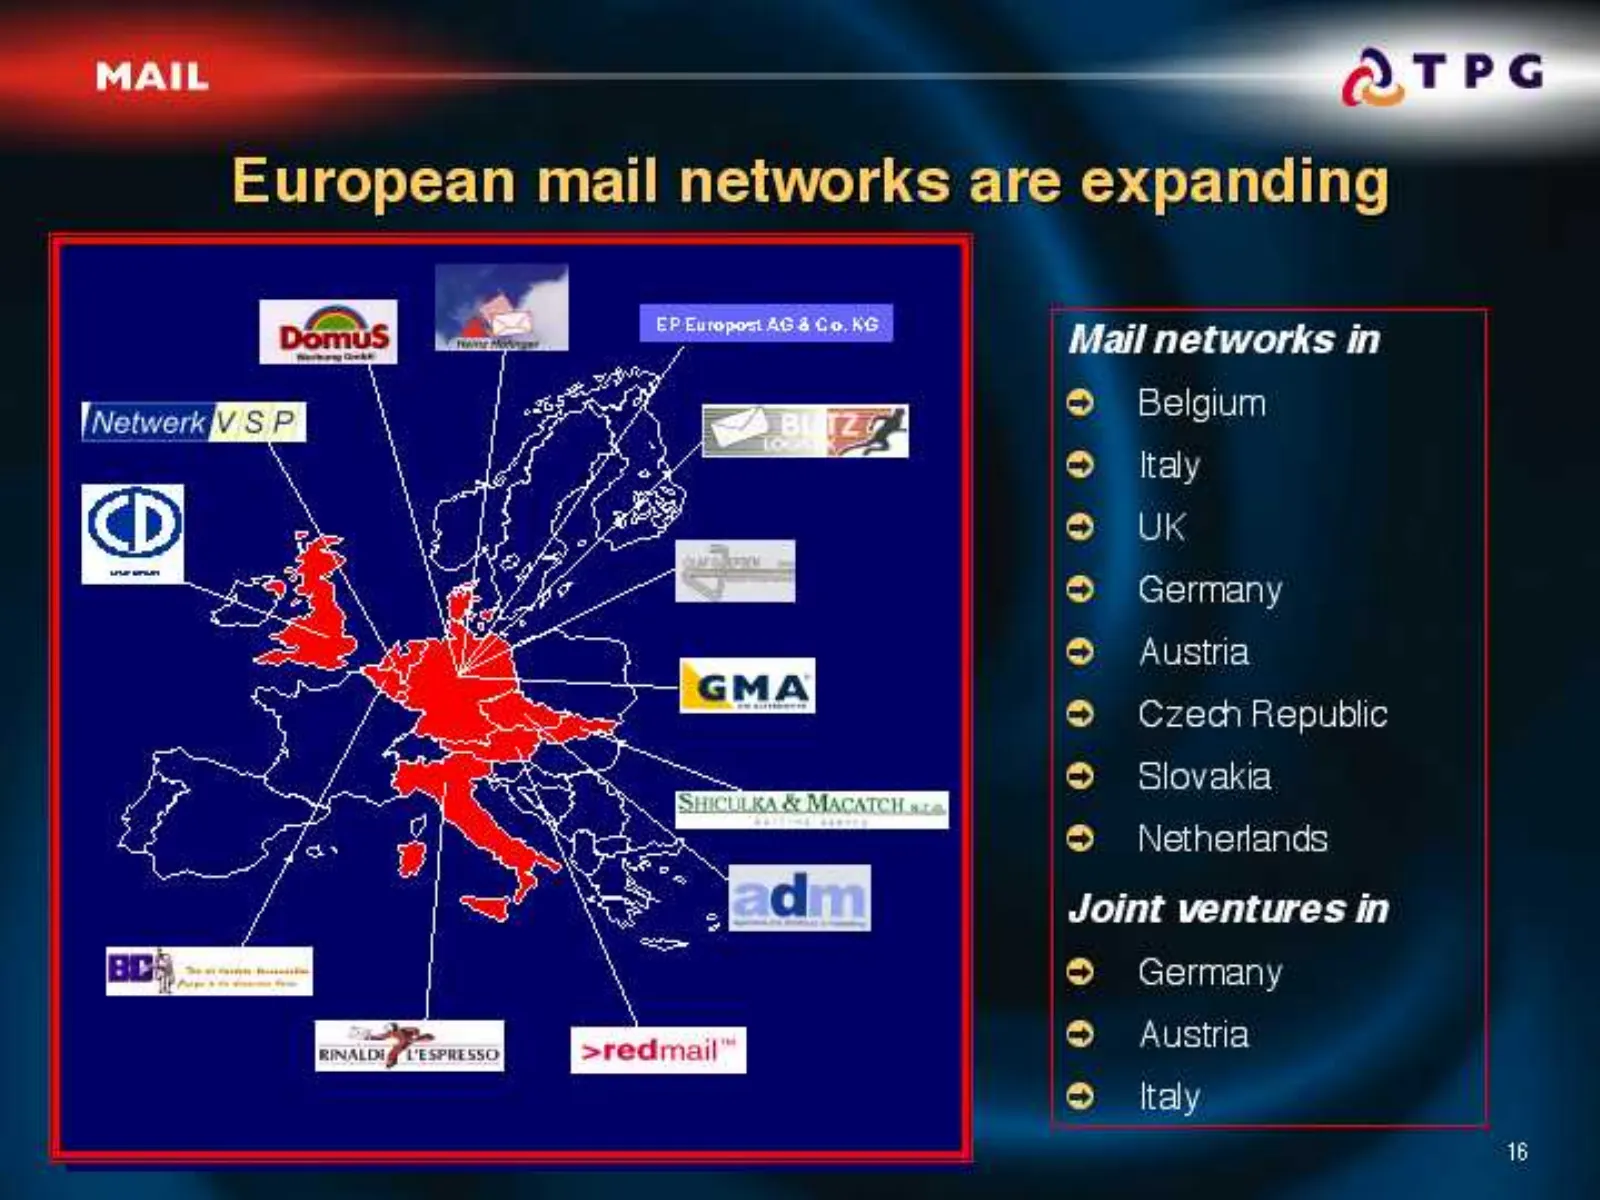
European mail networks are expanding ail networks in ! Belgium Italy UK Germany Austria Czech Republic Slovakia Netherlands ©2e0e80e08e000 Joint ventures in © Germany © Austria 16
Slide 17: Mail
MAIL
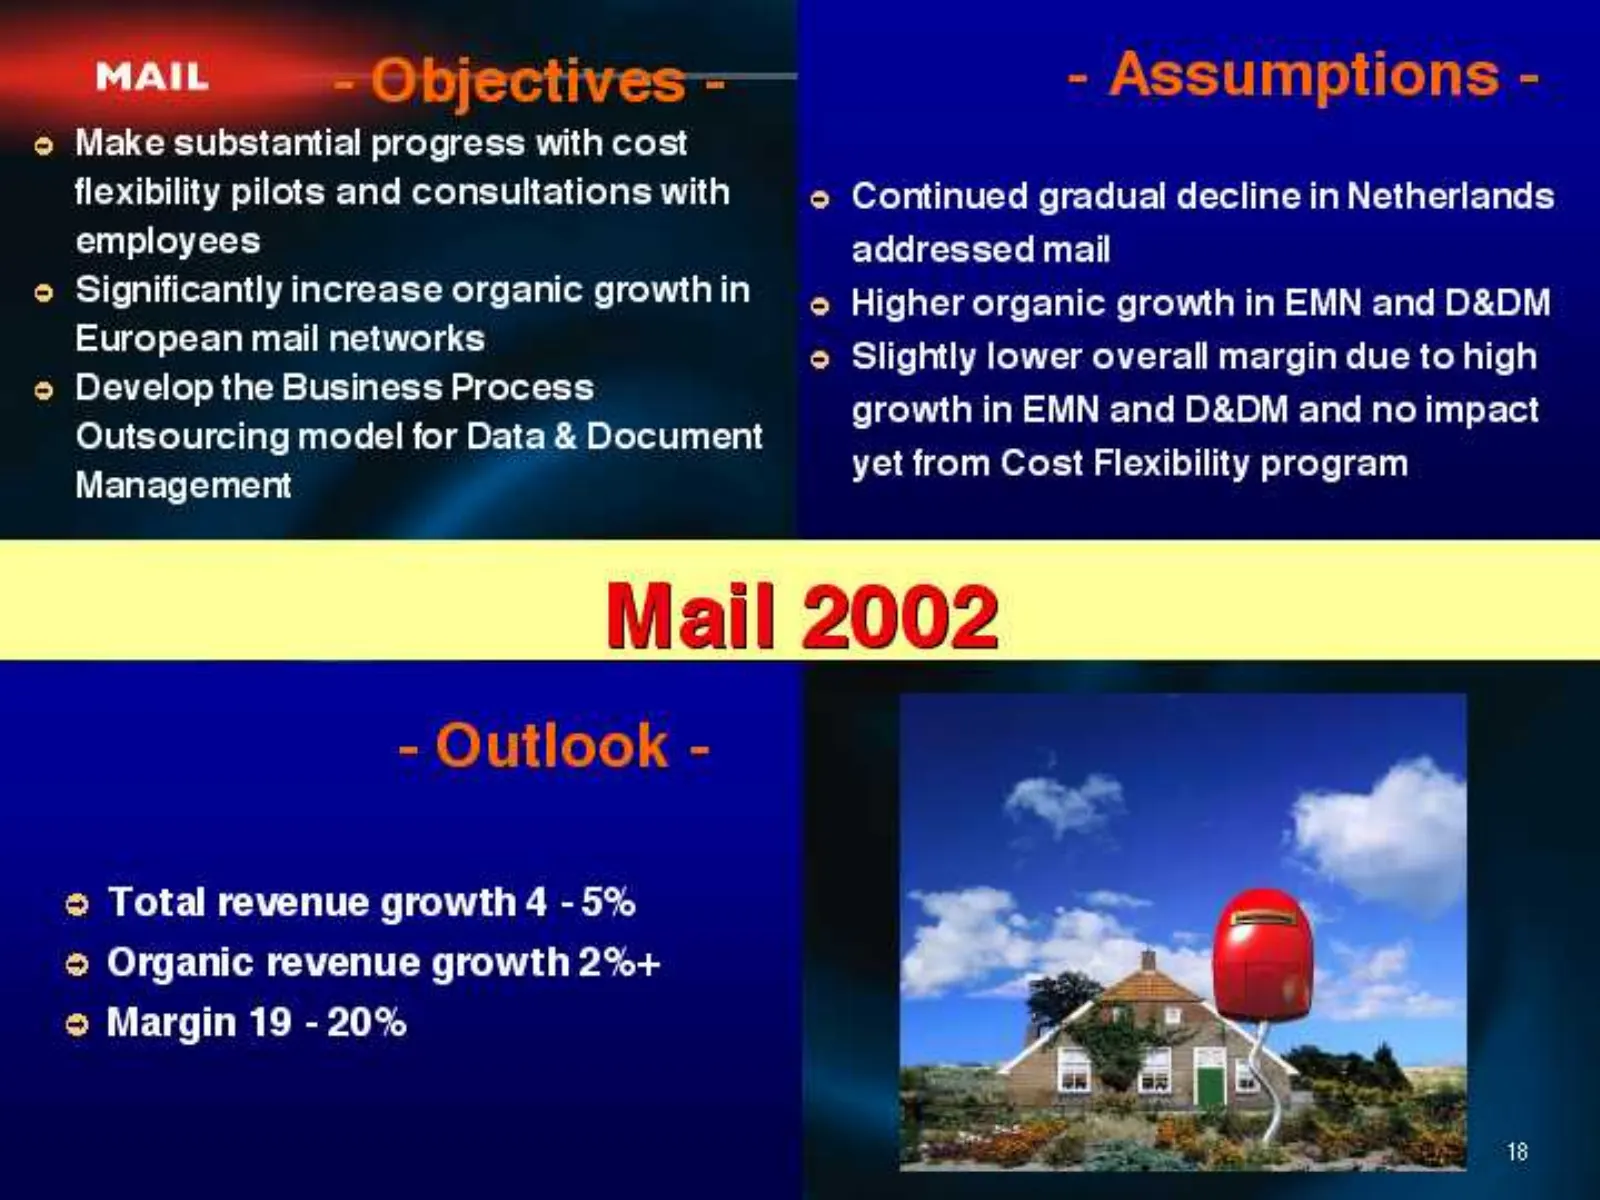
Slide 18: Mail objectives, assumptions and outlook
jectives = - Assumptions - e Make substantial progress with cost flexibility pilots and consultations with = > Continued gradual decline in Netherlands employees addressed mail e Significantly increase organic growthin §. Higher organic growth in EMN and D&DM European mail networks © Slightly lower

Slide 19: Express
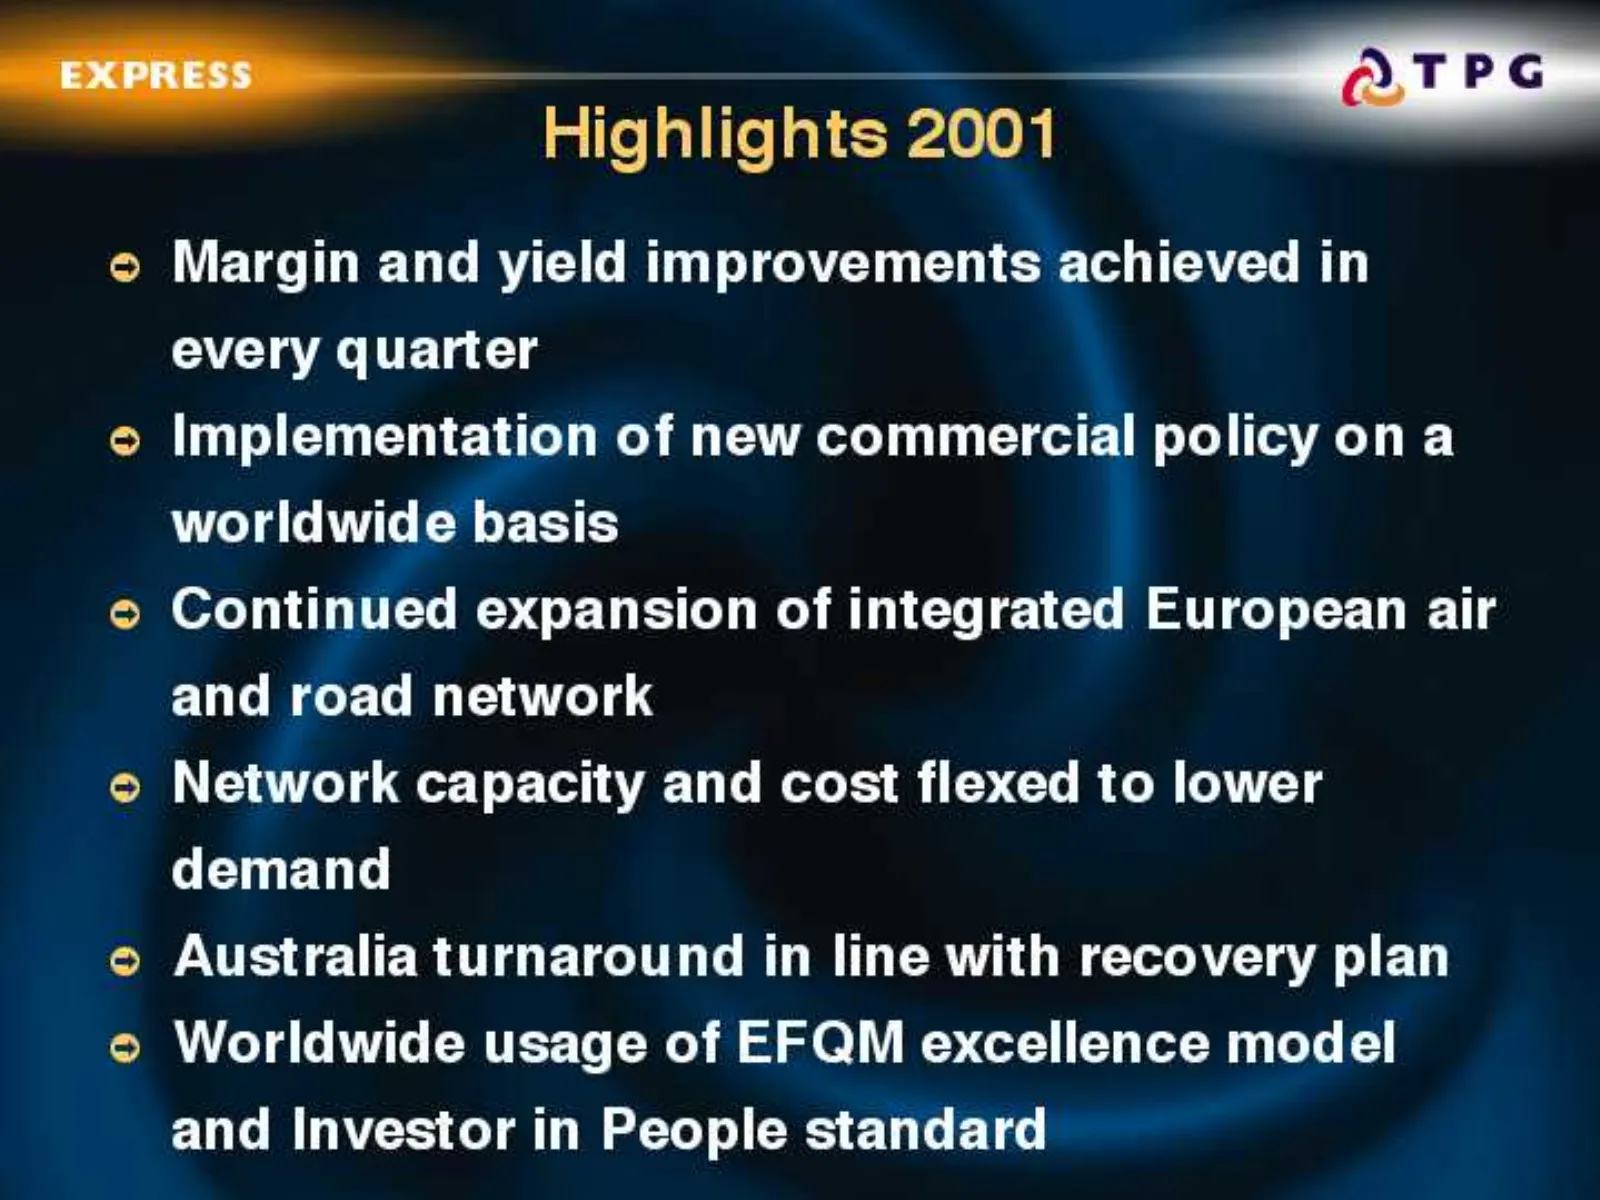
Slide 20: Express Highlights 2001
© Margin and yield improvements achieved in every quarter © Implementation of new commercial policy on a worldwide basis © Continued expansion of integrated European air and road network © Network capacity and cost flexed to lower demand © Australia turnaround in line with recovery plan © Worldwide
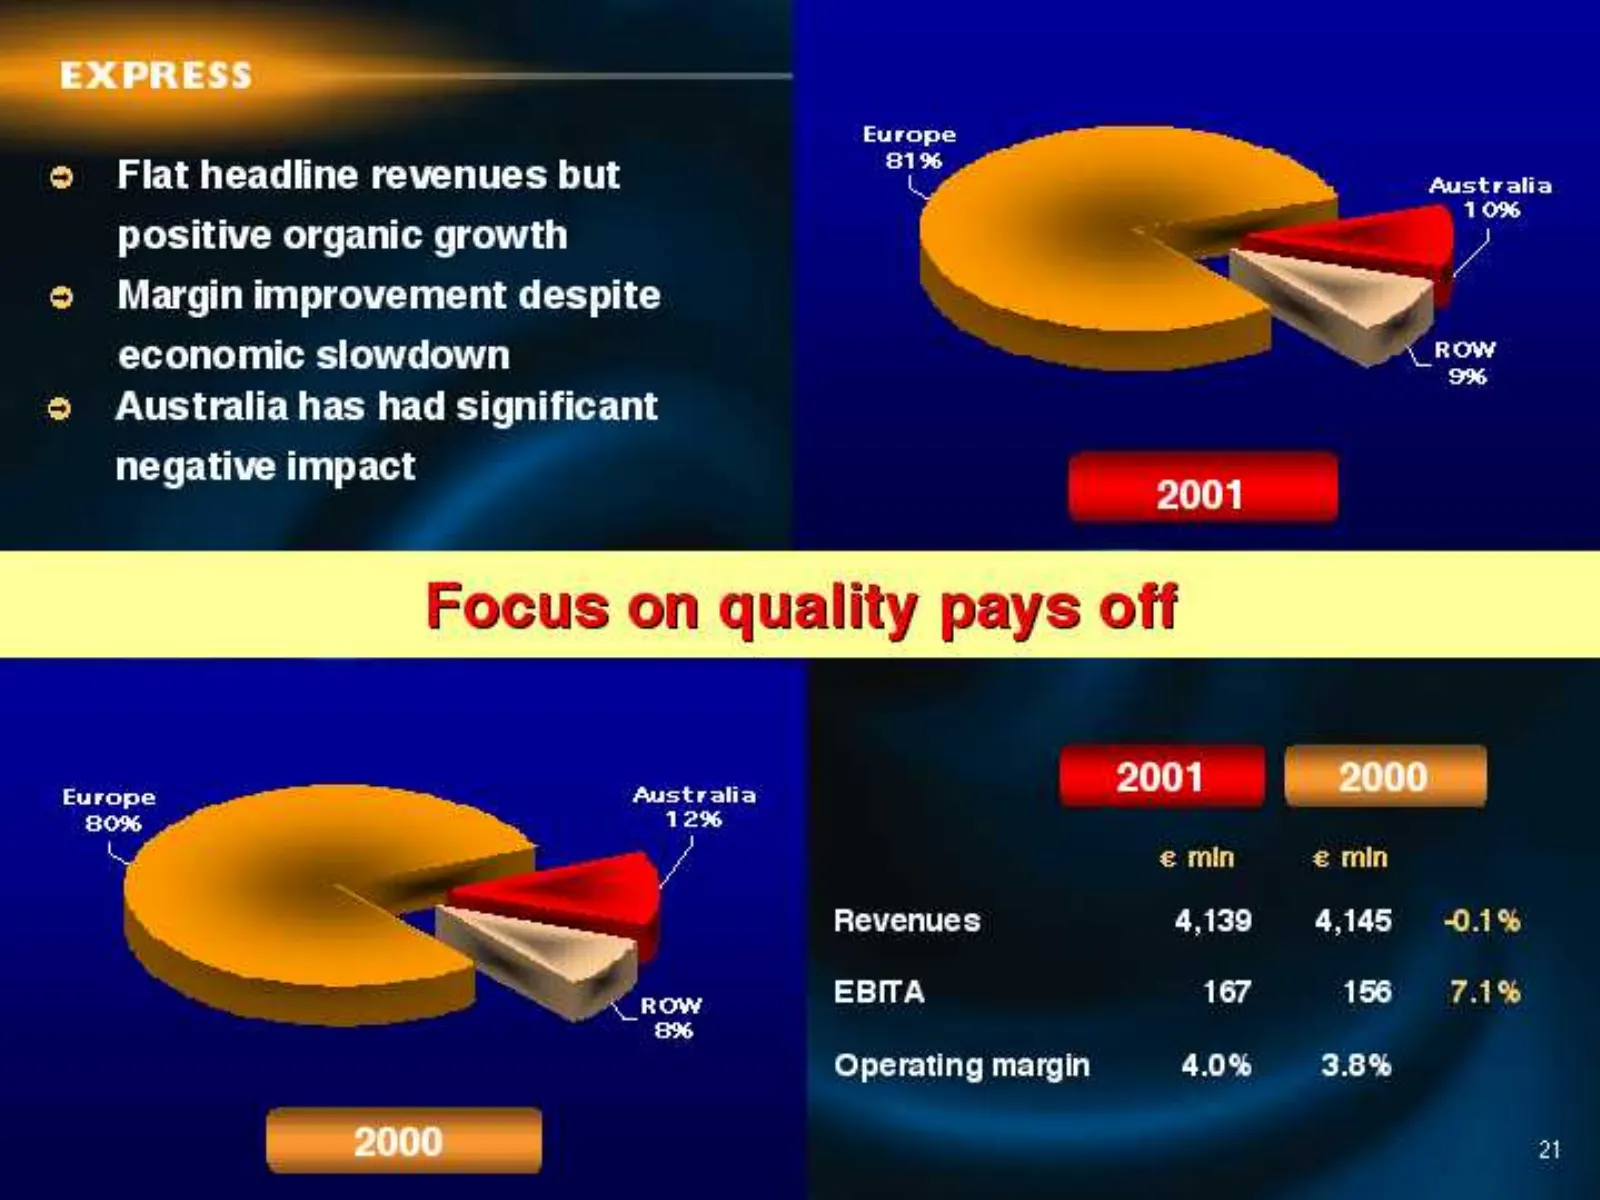
Slide 21: Express results
© Flat headline revenues but positive organic growth © Margin improvement despite > py economic slowdown —\_ROW Europe 81% Australia 10% 996 © Australia has had significant negative impact 2001 Focus on quality pays off Australia 2001 2000 12% 2 € min € min Revenues 4,139 4145 0.1% oe now EBITA 167
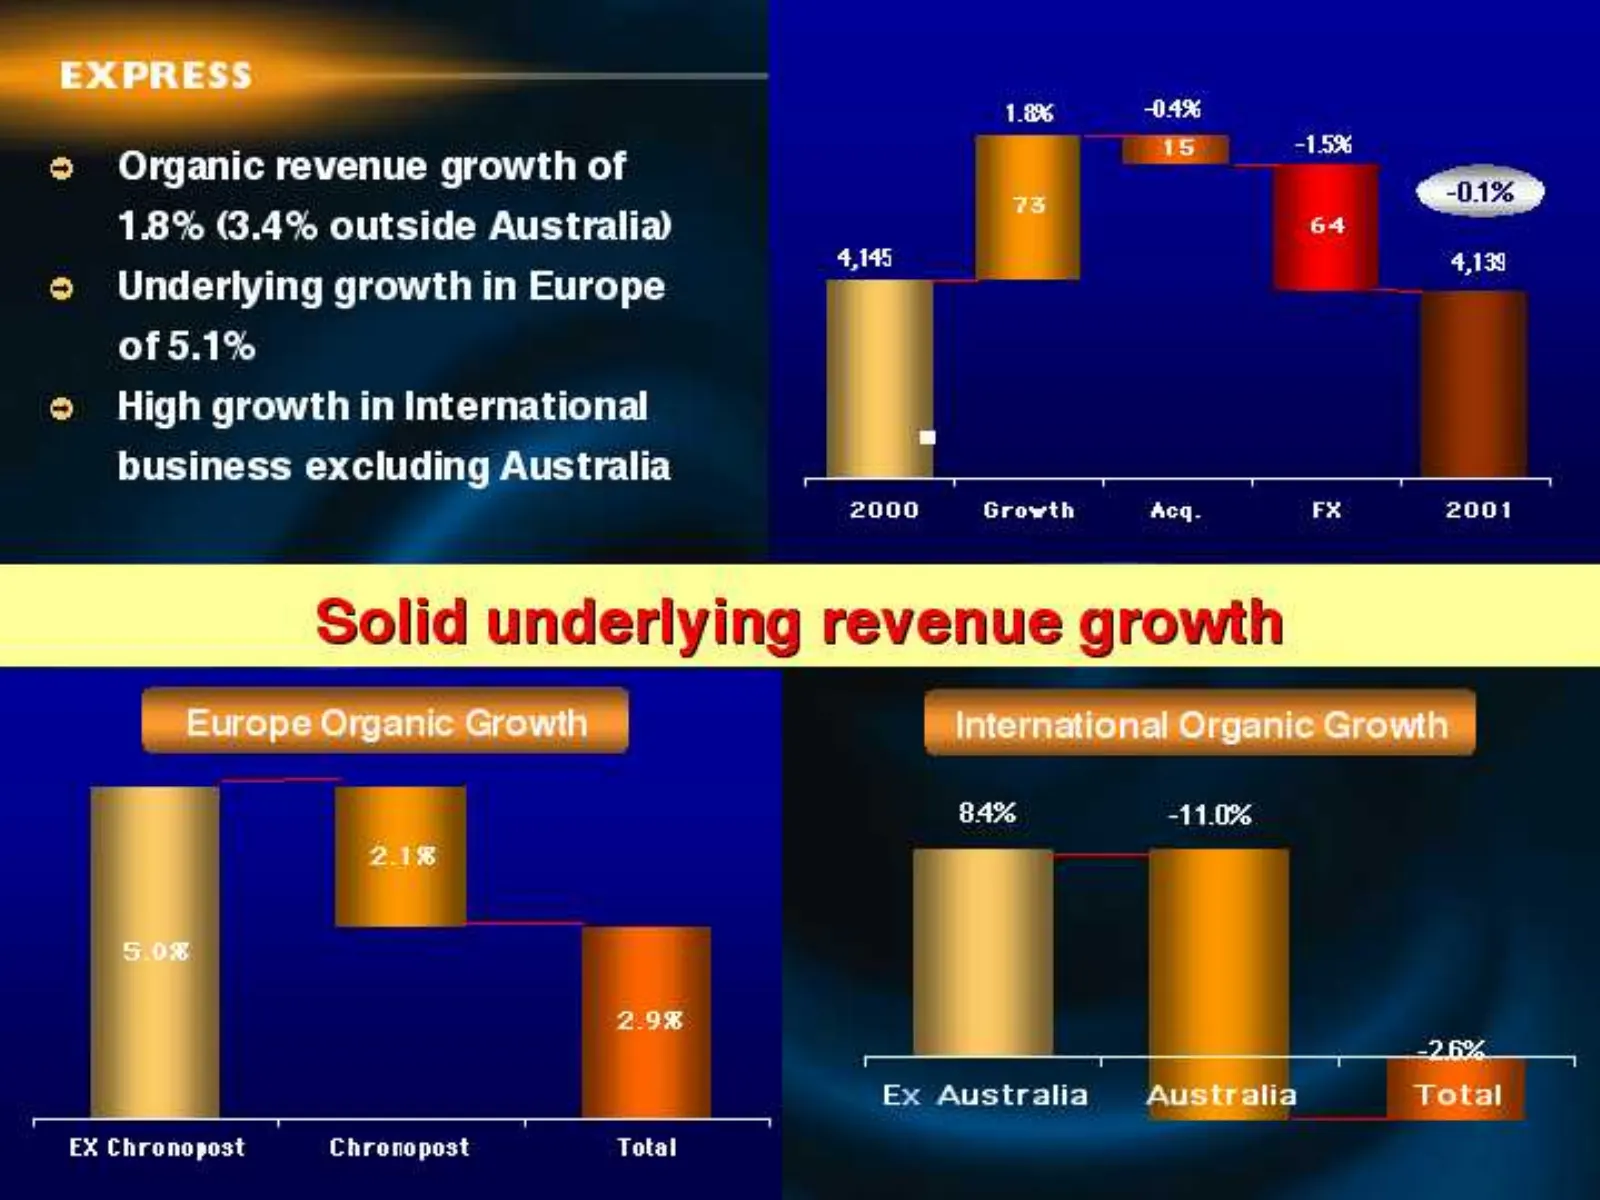
Slide 22: Express organic revenue growth
E XPRES: 1.8% AX © Organic revenue growth of > <i> 1.8% (3.4% outside Australia) as 64 = © Underlying growth in Europe - of 5.1% © High growth in International business excluding Australia : : : 2000 Growth Acq. FX 2001 Solid underlying revenue growth 4 84% -11.0% 2.9% —5 =2 f%. 1 Ex Australia lia T
Slide 23: Express Q4 and full year margin
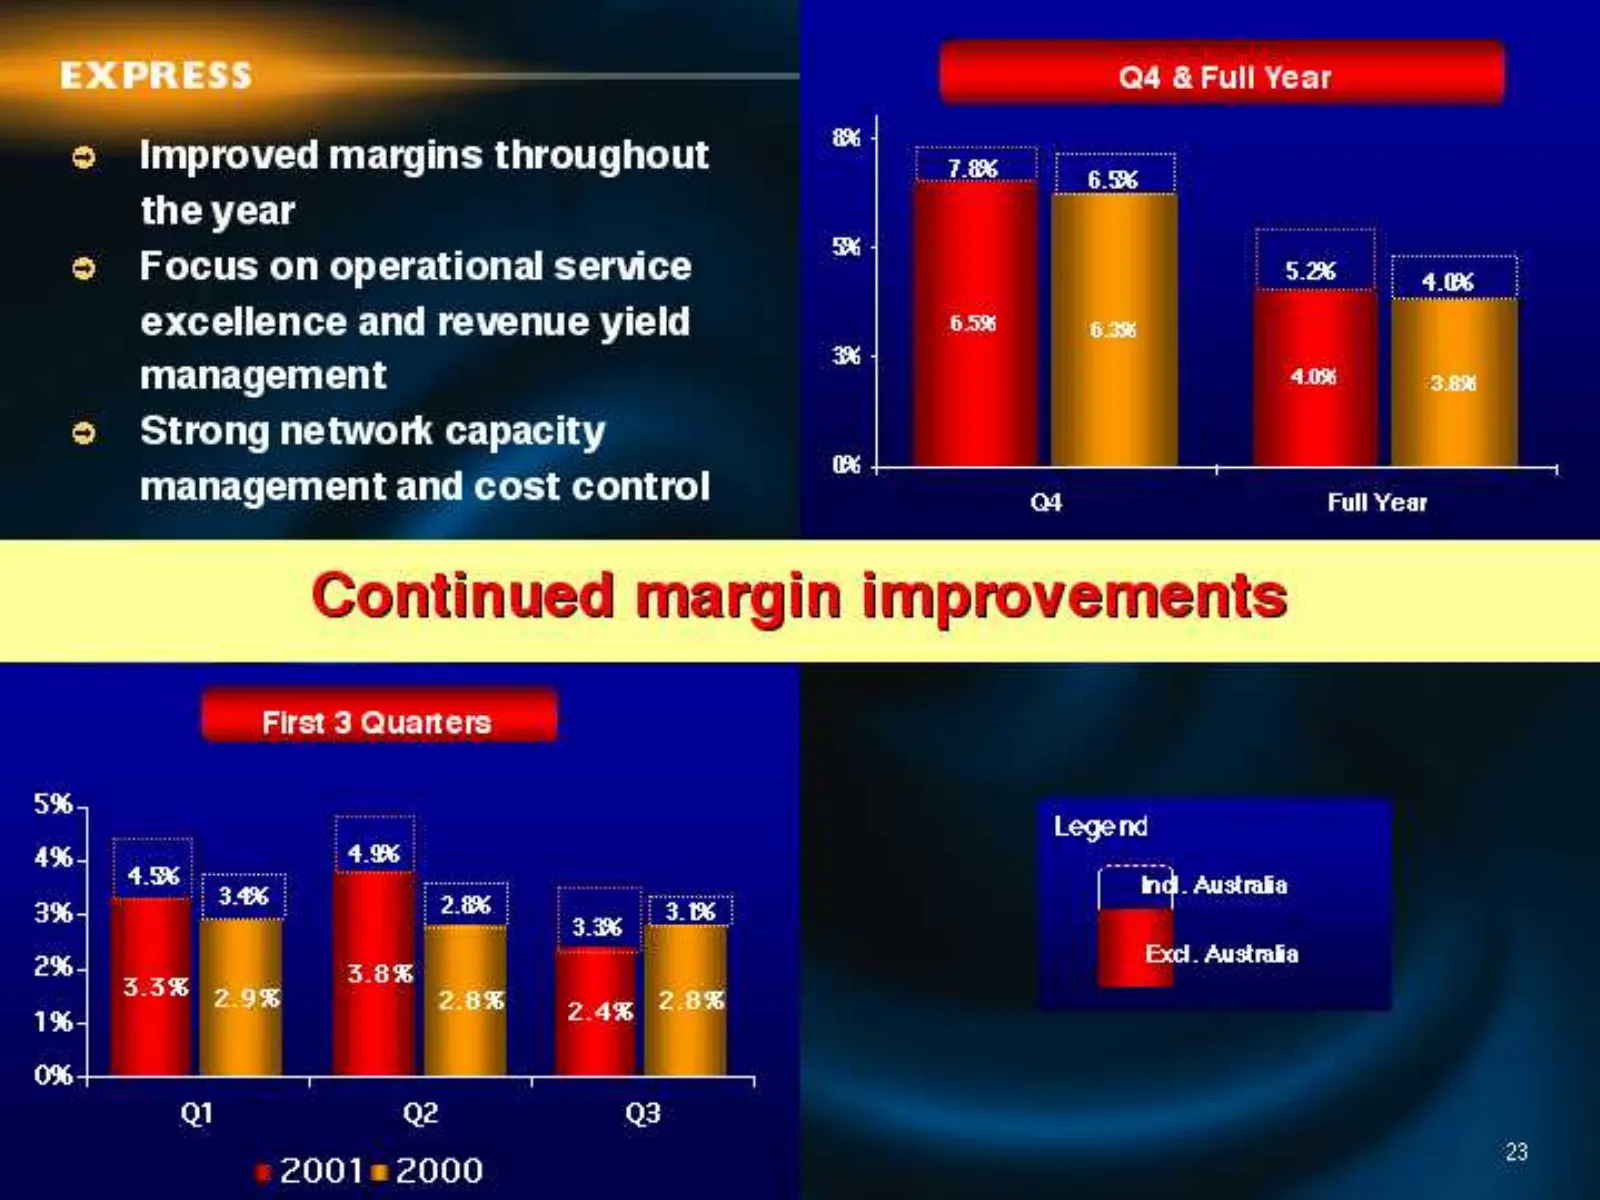
EXPRESS Q4 & Full Year © Improved margins throughout oe the year © Focus on operational service 5.2% excellence and revenue yield 6.5% management 40% 2 Strong network capacity management and cost control as Qt Full Year Continued margin improvements First 3 Quarters 5% Legend 4% Pf | oe 4B oe : [ in
Slide 24: Australia turnaround commenced
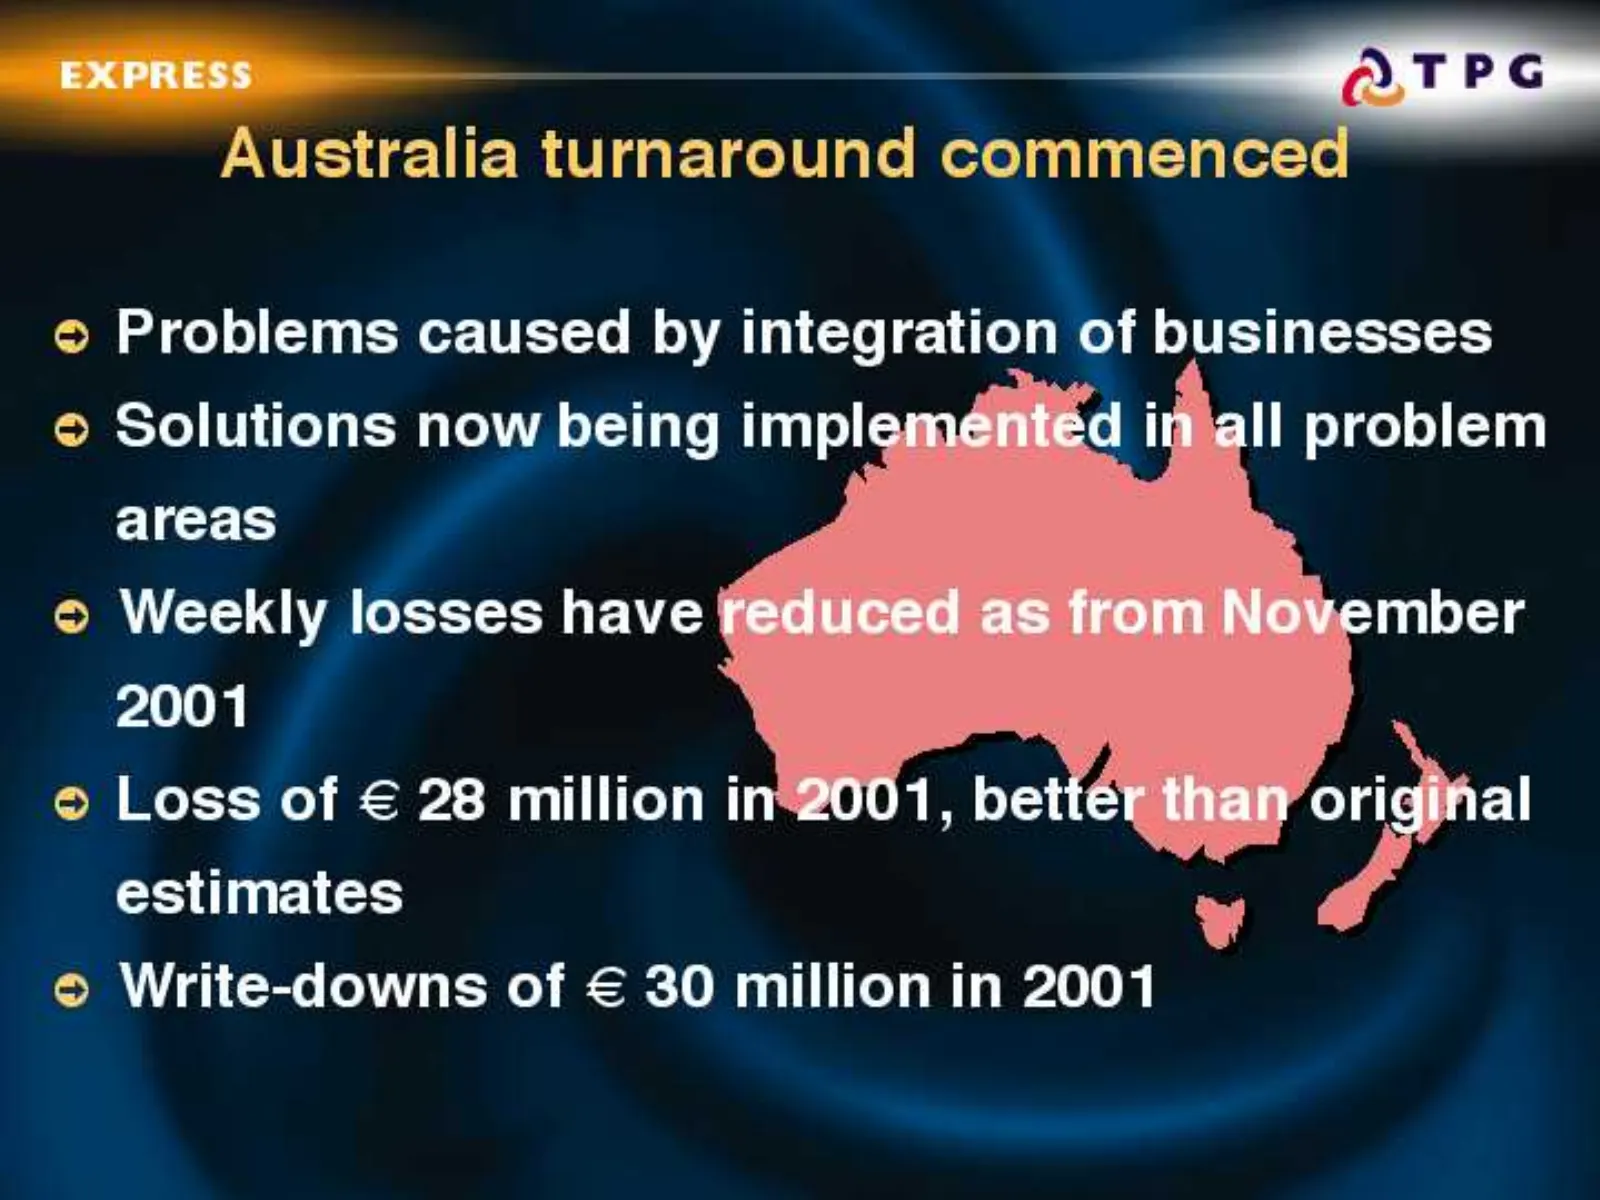
—,. turnaround comme © Problems caused by integration of businesses © Solutions now being impl imall problem areas f © Week sses have ly 2001 © Loss of € 28 million i estimates a © Write-downs of € 30 million in 2001 ——
Slide 25: New commercial policy and right first time processes
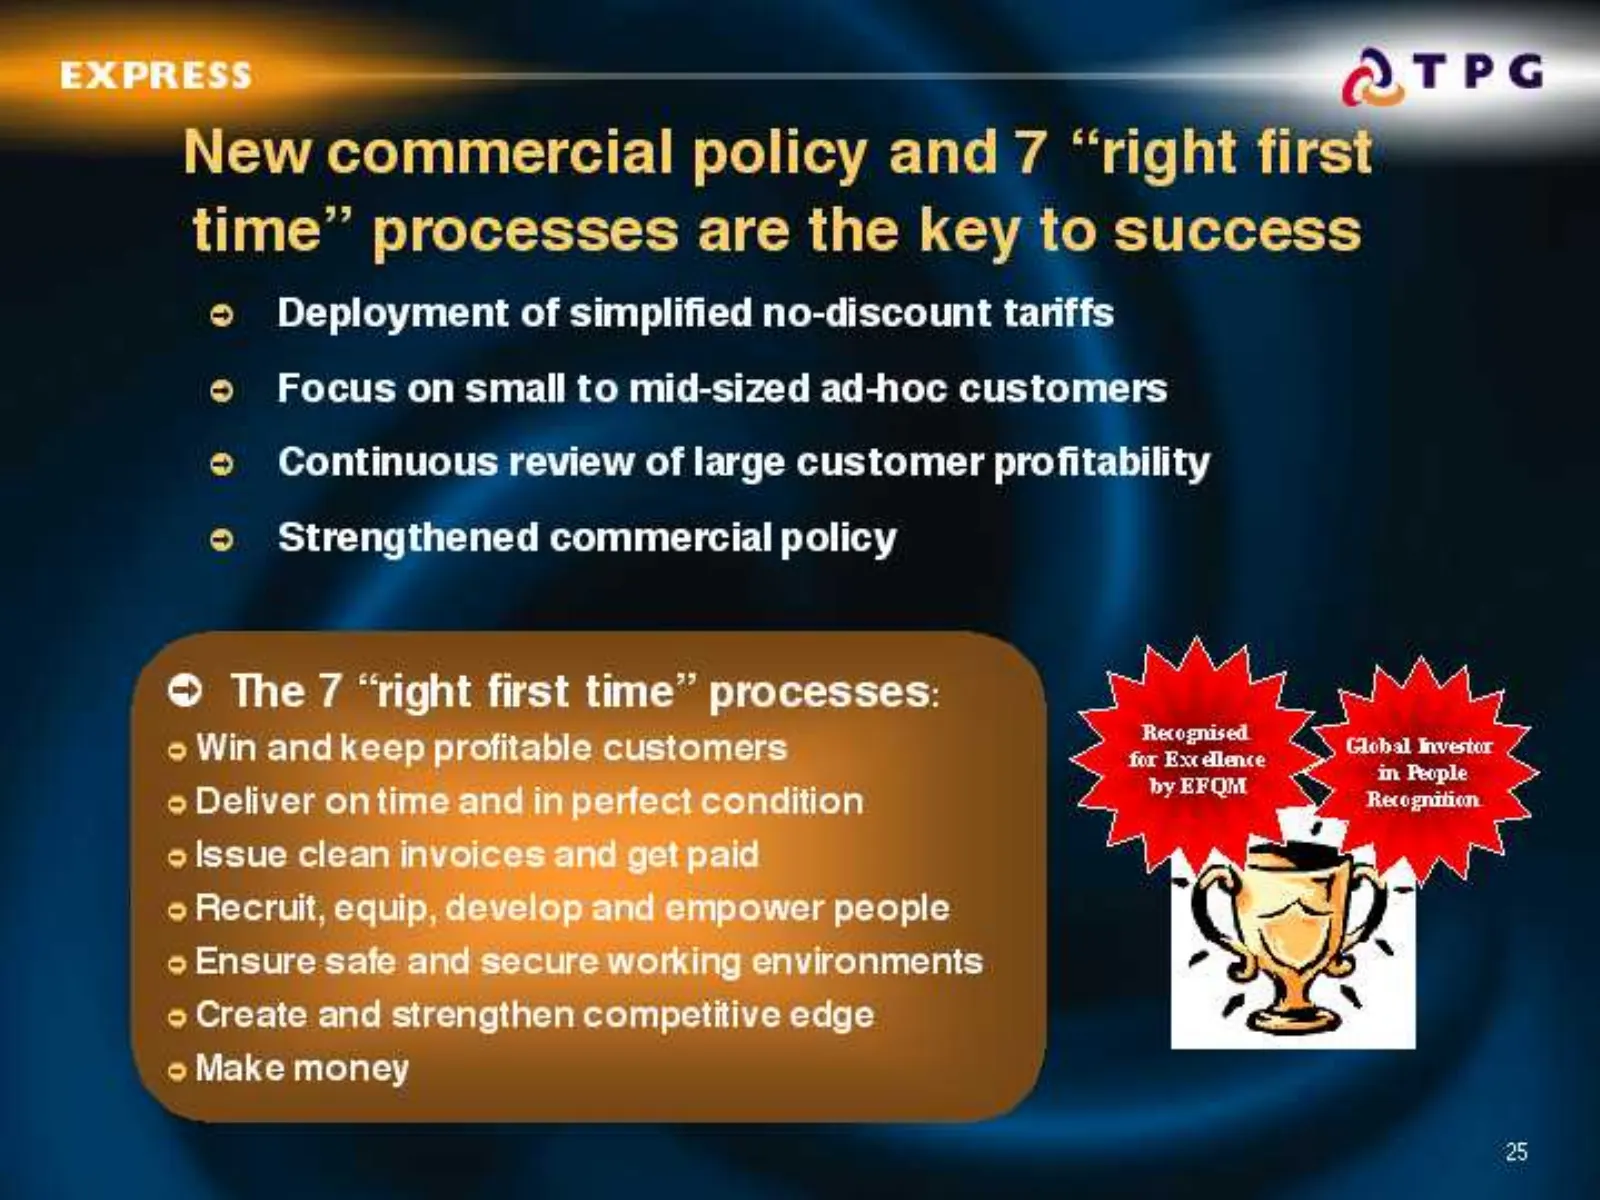
New commercial policy and 7 “right a: ul time” processes are the key to success © Deployment of simplified no-discount tariffs © Focus on small to mid-sized ad-hoc customers © Continuous review of large customer profitability © Strengthened commercial policy © The 7 “right first time” processes:
Slide 26: Express objectives, assumptions and outlook
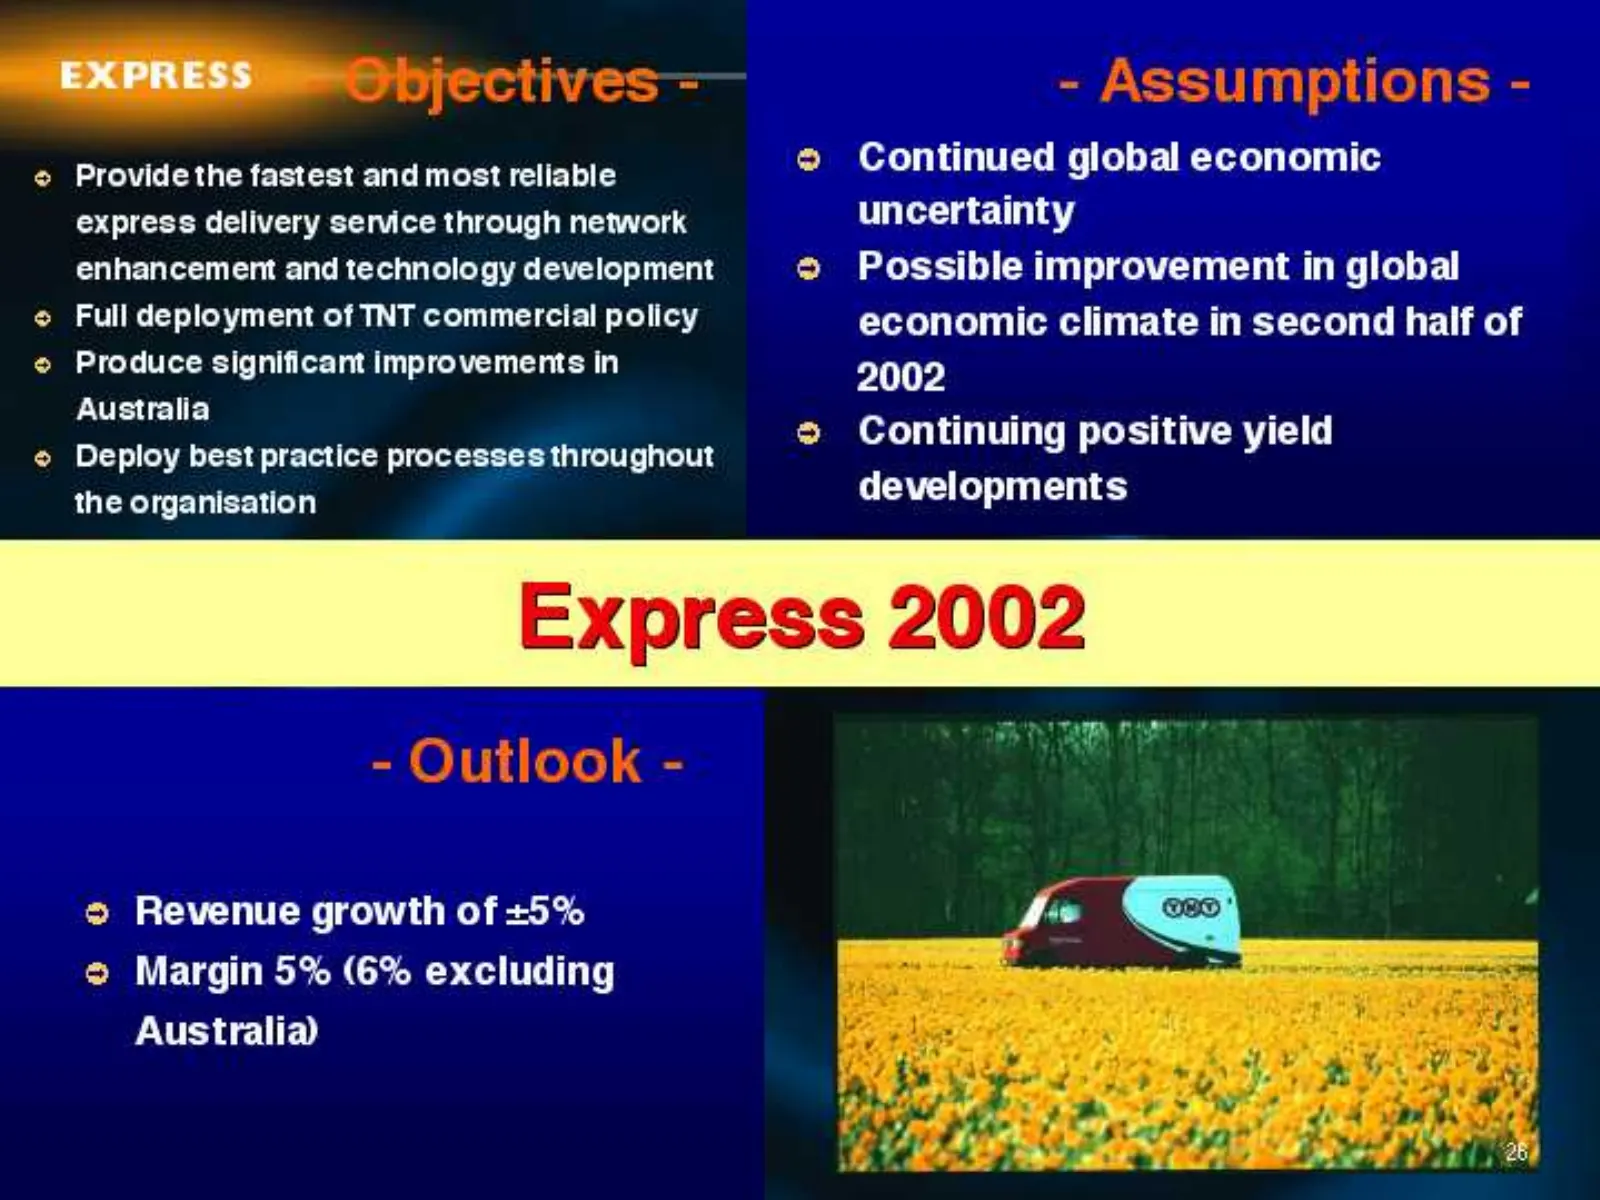
a ive sATIArmc Ls aS = & . onal ] elia_ PwWICCLIVES AsSSUulivpioiis © Provide the fastest and most reliable 2 Continued global economic express delivery service through network uncertainty enhancement and technology development © Possible improvement in global © Full deployment of TNT commercial pol

Slide 27: Logistics
Slide 28: Logistics Highlights 2001
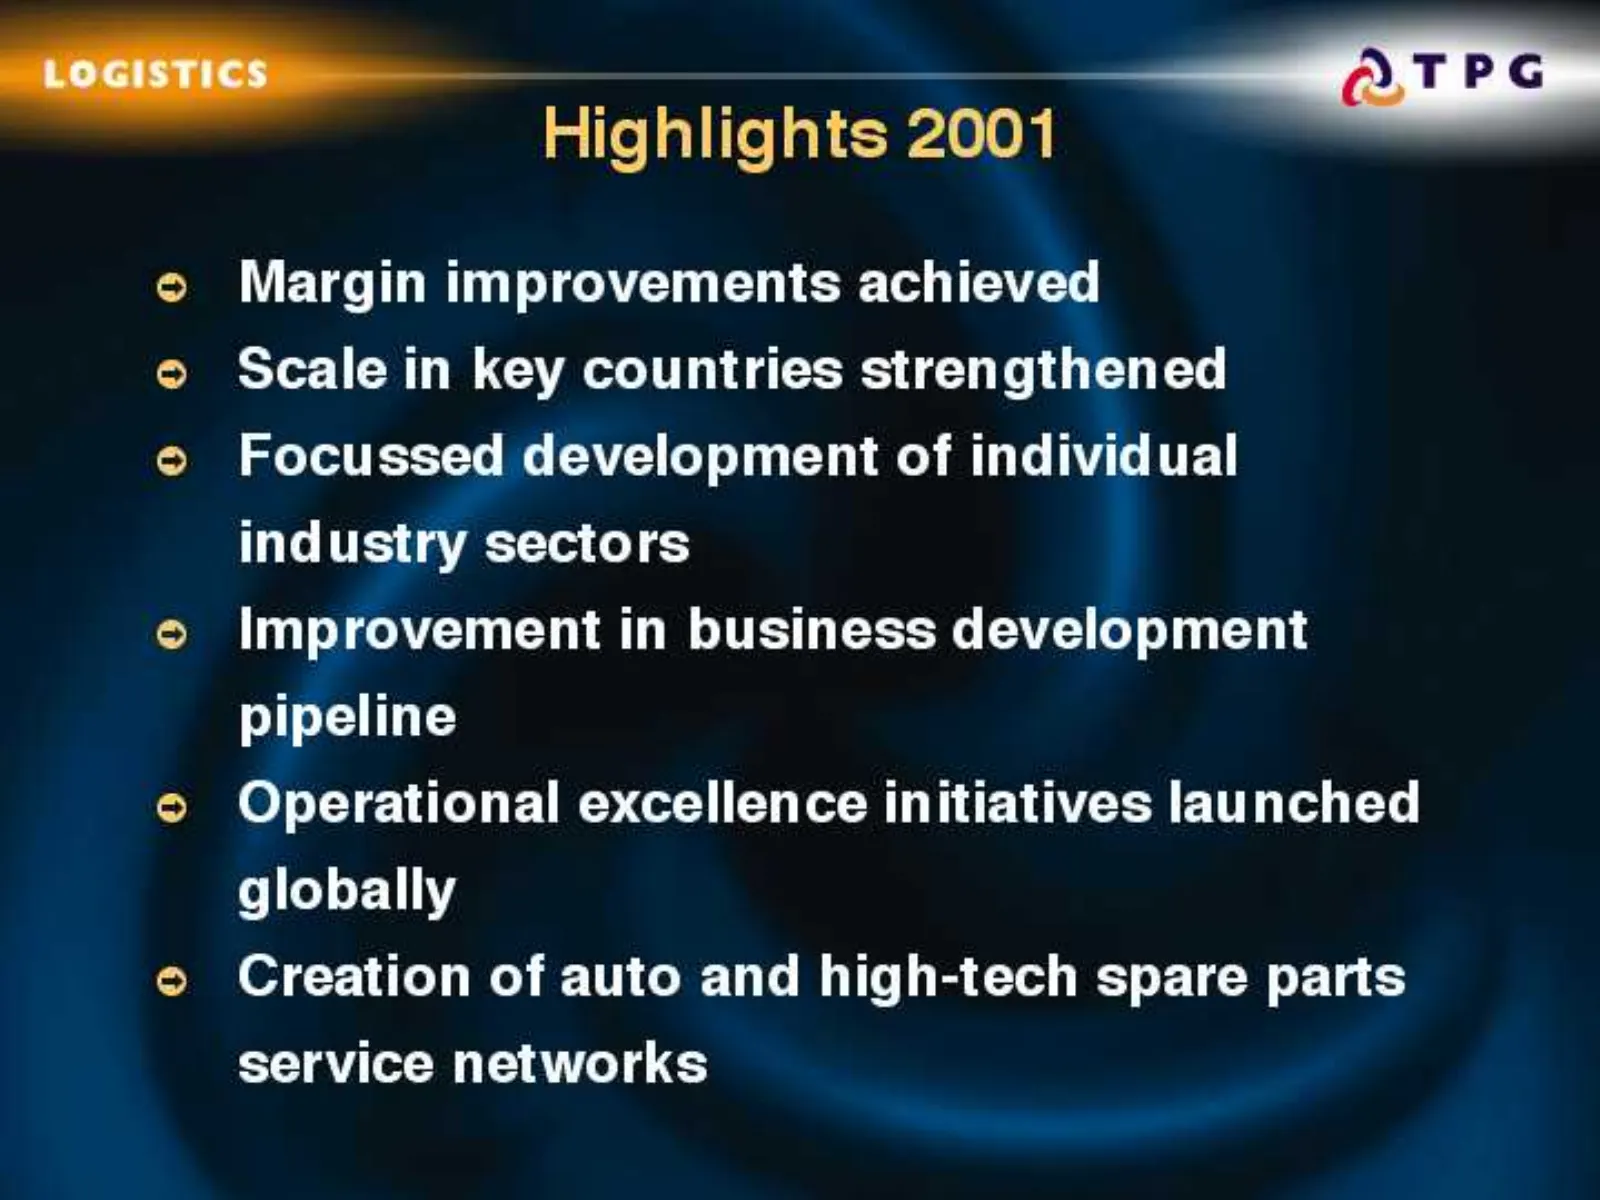
© Margin improvements achieved © Scale in key countries strengthened Focussed development of individual industry sectors Improvement in business development pipeline Operational excellence initiatives launched globally Creation of auto and high-tech spare parts service networks
Slide 29: Logistics results
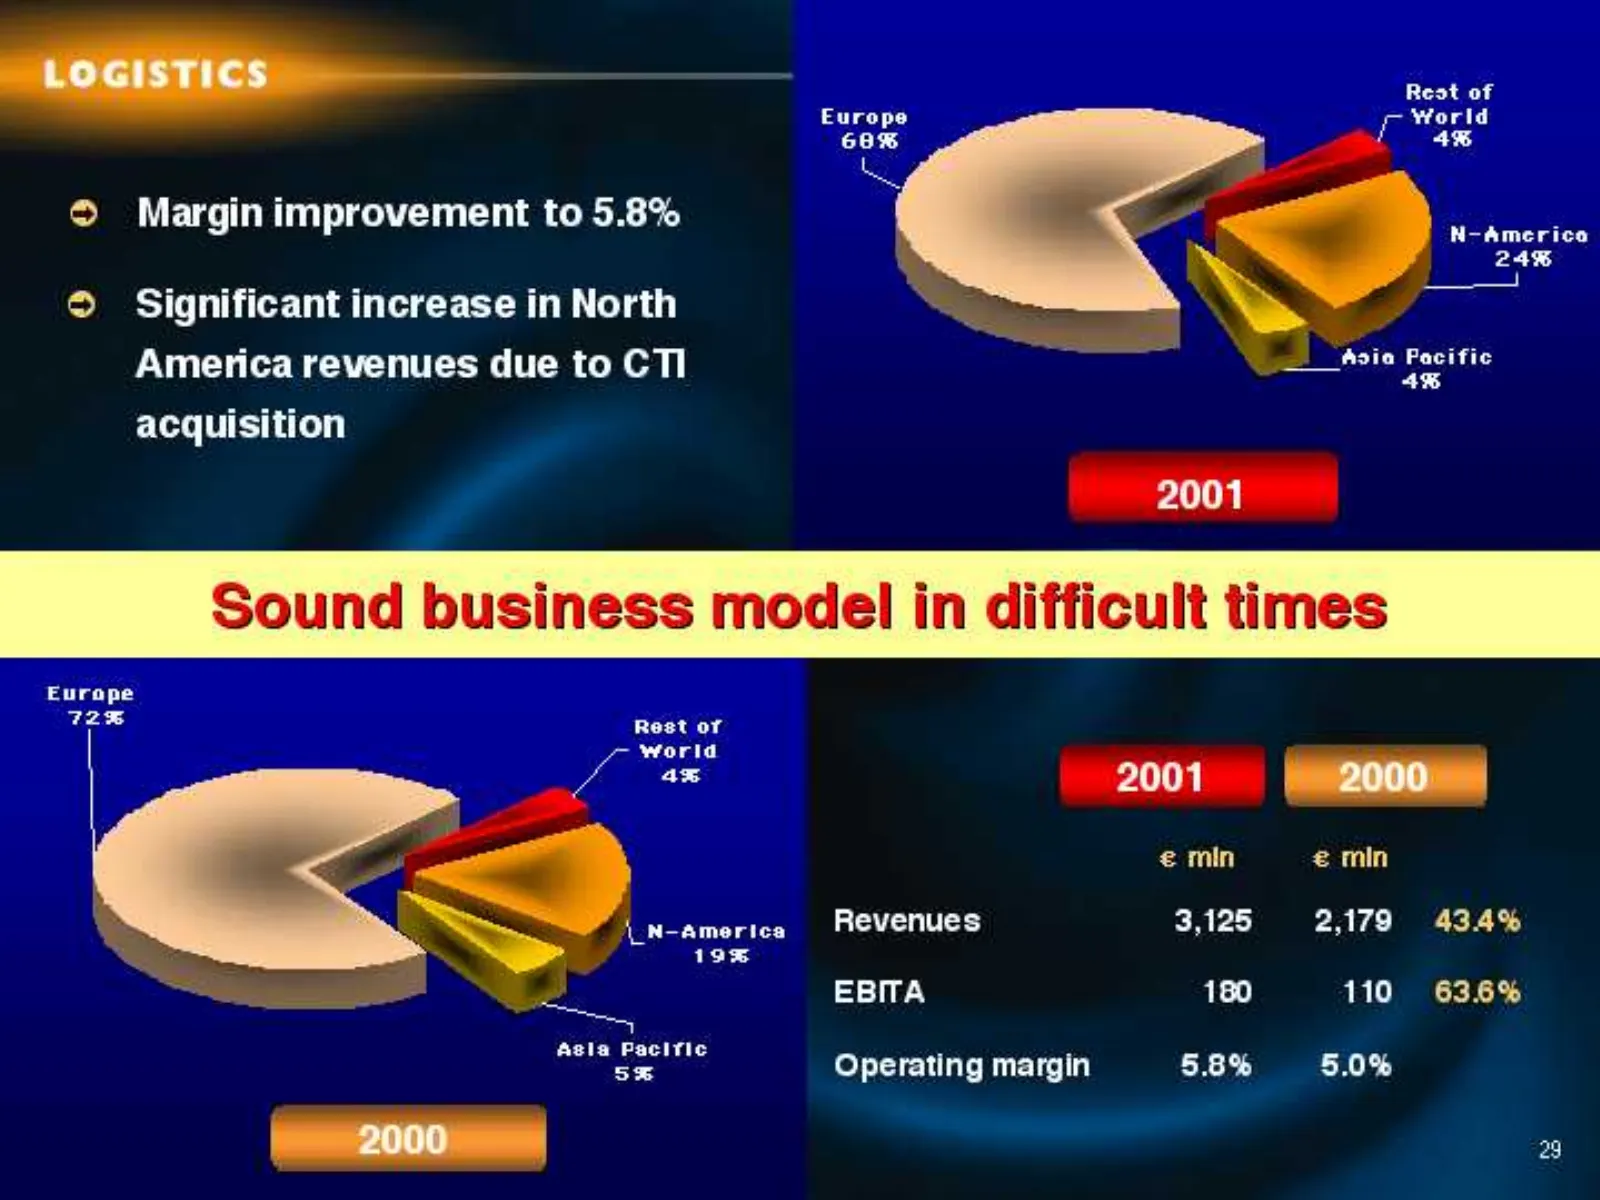
-Locistics— Rest of Yforld i 4% ; N-Americoa bs 24% fL.. | Asia Pacific © Margin improvement to 5.8% © Significant increase in North America revenues due to CTl 7 ie acquisition 2001 Sound business model in difficult times Europe 725 Rest of World - oo ae 2001 <j € min e min — N-america Revenues 3,1
Slide 30: Logistics organic revenue growth
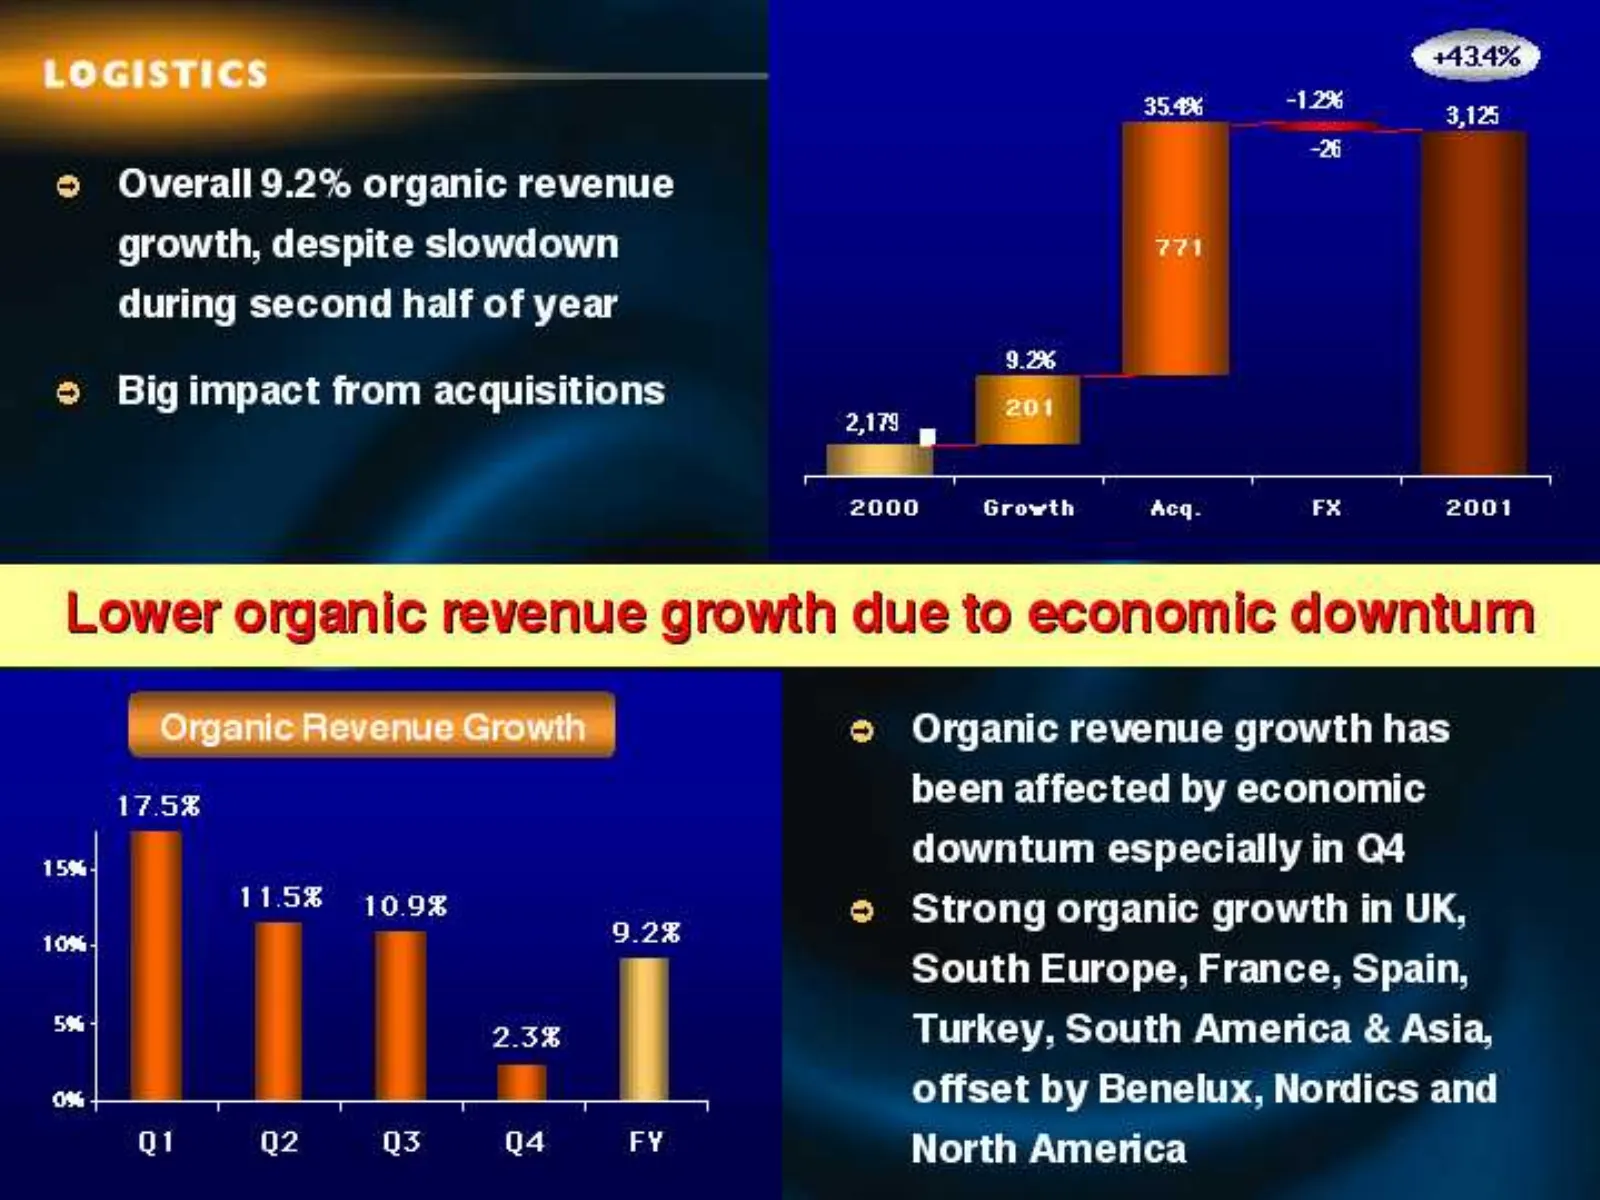
<a TT -26 © Overall 9.2% organic revenue growth, despite slowdown during second half of year 9.2% © Big impact from acquisitions ig impact fr quisition > os 2000 Growth Acq. FX 2001 growth due to economic downturm — _ Organic Revenue Growth — ® Organic revenue growth has 17.5% been affected by econo
Slide 31: Logistics Q4 and full year margin
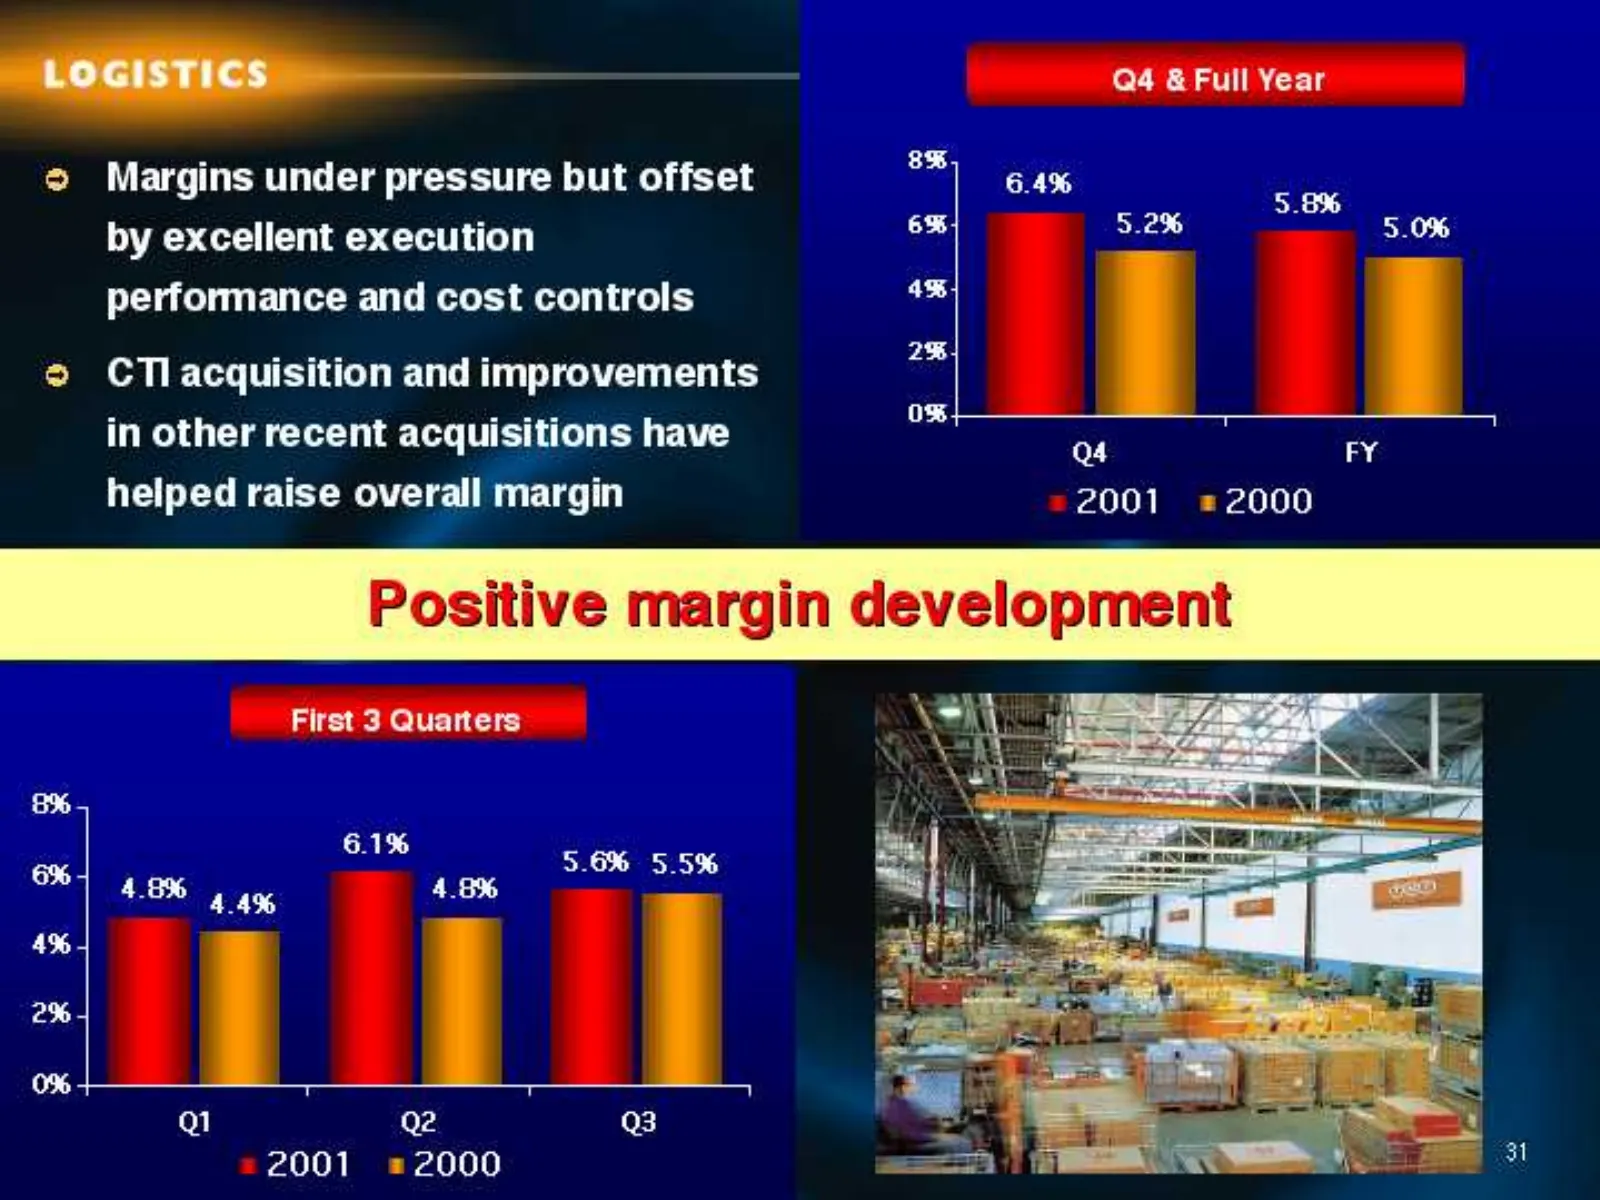
“MOGISTICS— Q4 & Full Year © Margins under pressure but offset 6.4% ae by excellent execution om See 5.0% performance and cost controls as © CTl acquisition and improvements an in other recent acquisitions have om 4 EY helped raise overall margin 2001 =2000 Positive margin development First 3 Quarte
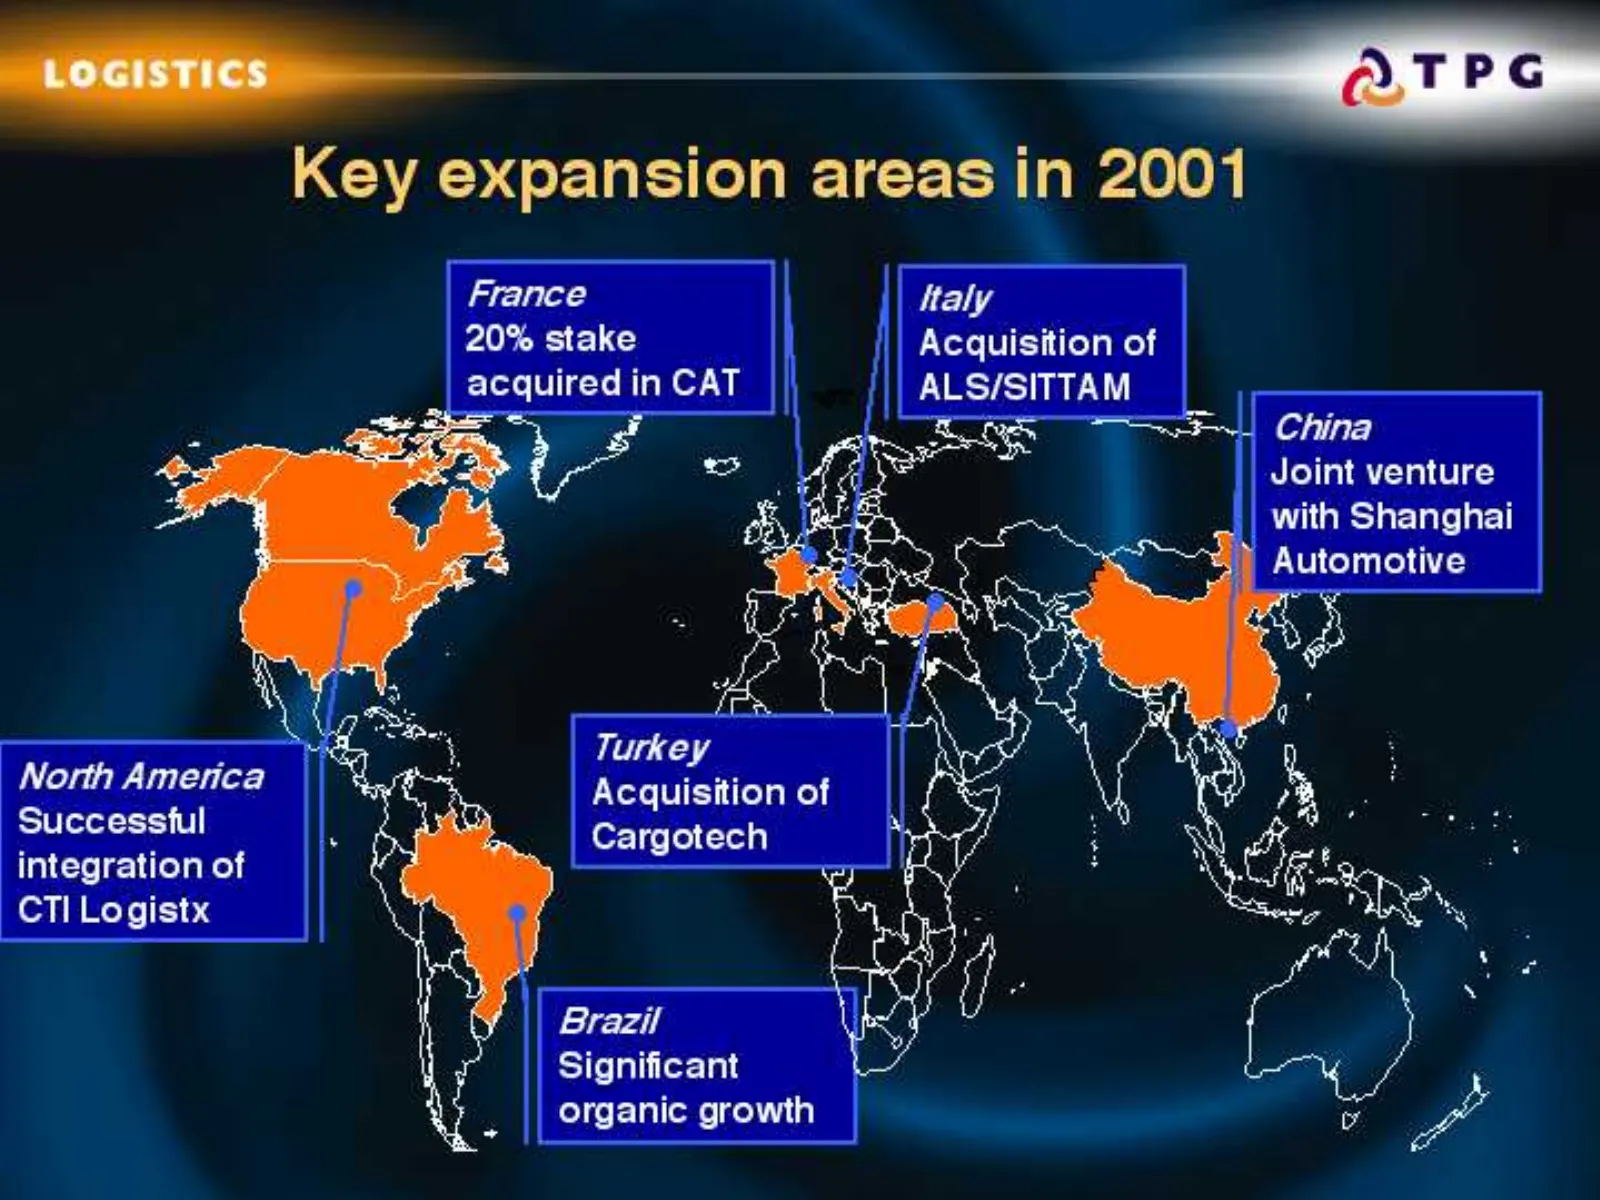
Slide 32: Key expansion areas in 2001
Key expansion areas in 2001 France ttaly 20% stake Acquisition of acquired in CAT ALS/SITTAM E ee RAS China 3 od i Joint venture Z +| with Shanghai ) Automotive - ae : Tl, Turkey North America Acquisition of Successful I Cargotech : i pe integration of ii $ Nal fe : CTI Logistx 3 “Ses - Brazil Signi
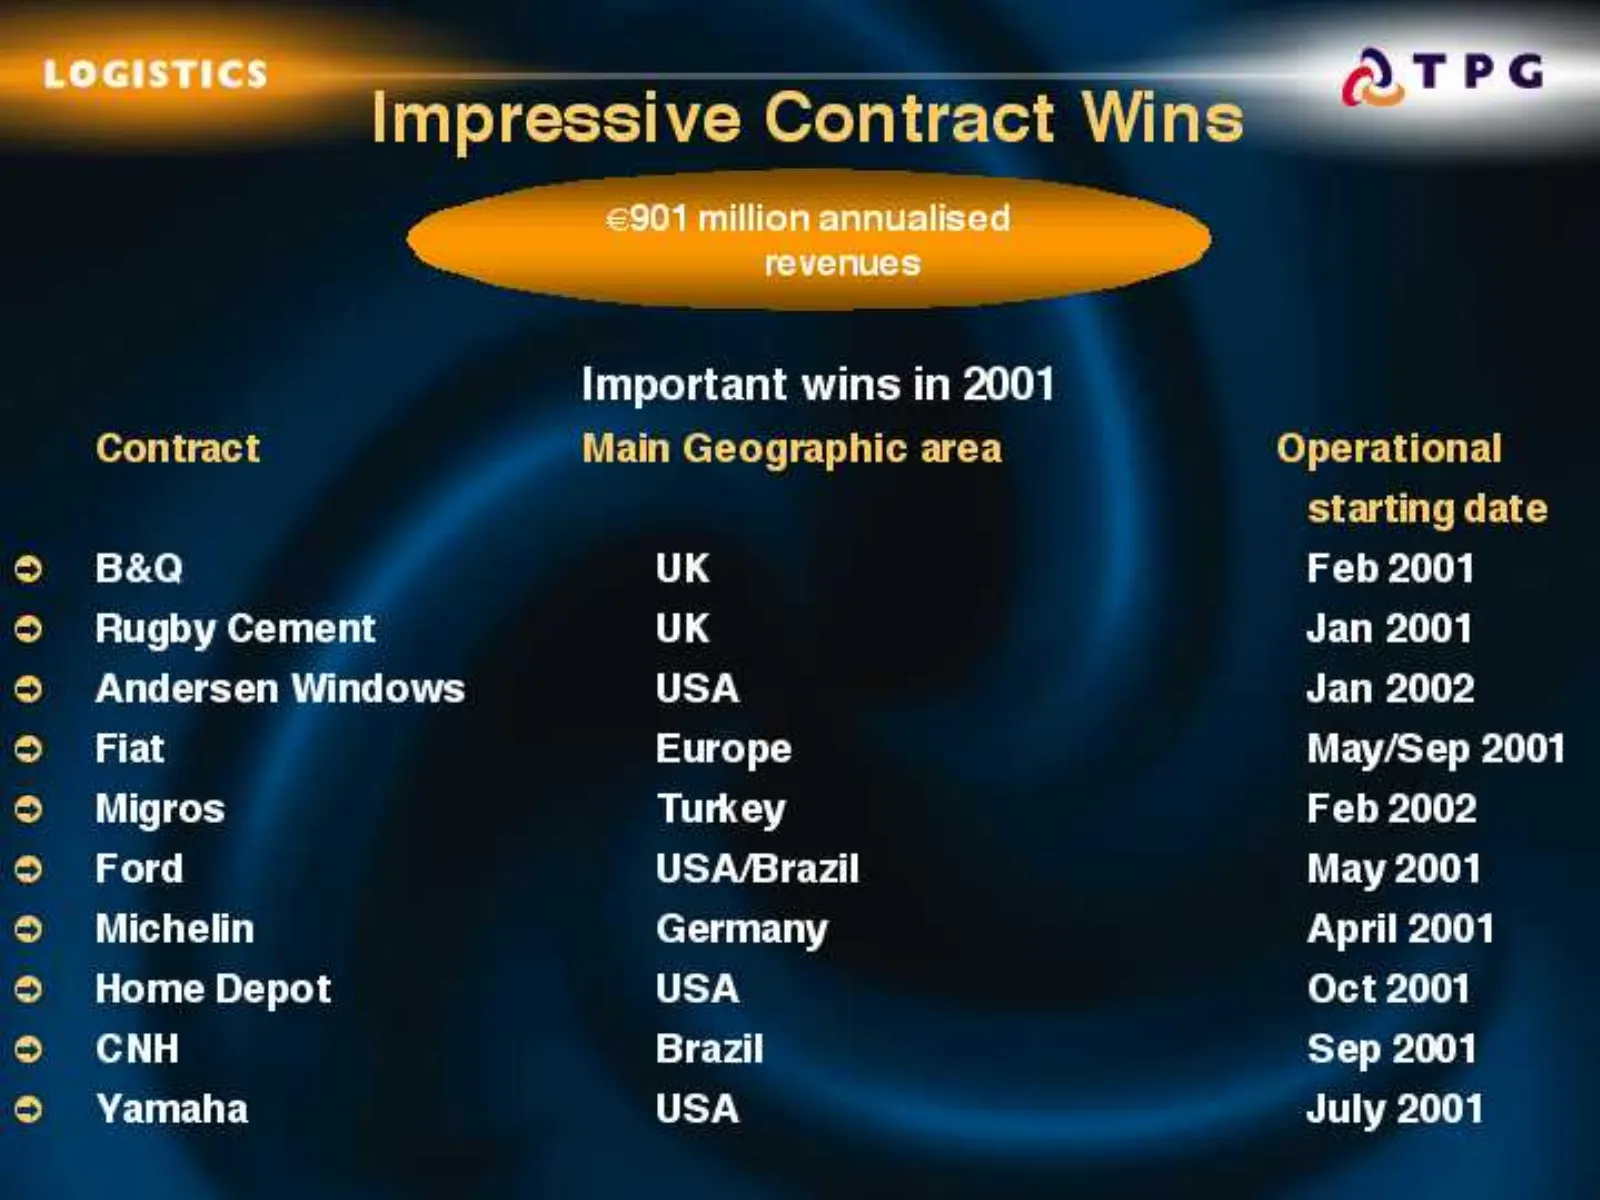
Slide 33: Important contract wins in 2001
Rr crcscive Contract Wine Important wins in 2001 Contract ‘Main Geographic area Operational starting date © B&Q UK Feb 2001 © Rugby Cemen UK Jan 2001 © Andersen Windows USA Jan 2002 © Fiat Europe May/Sep 2001 © Migros Turkey Feb 2002 © Ford USA/Brazil May 2001 © Michelin Germany April 2001 ‘© Home D
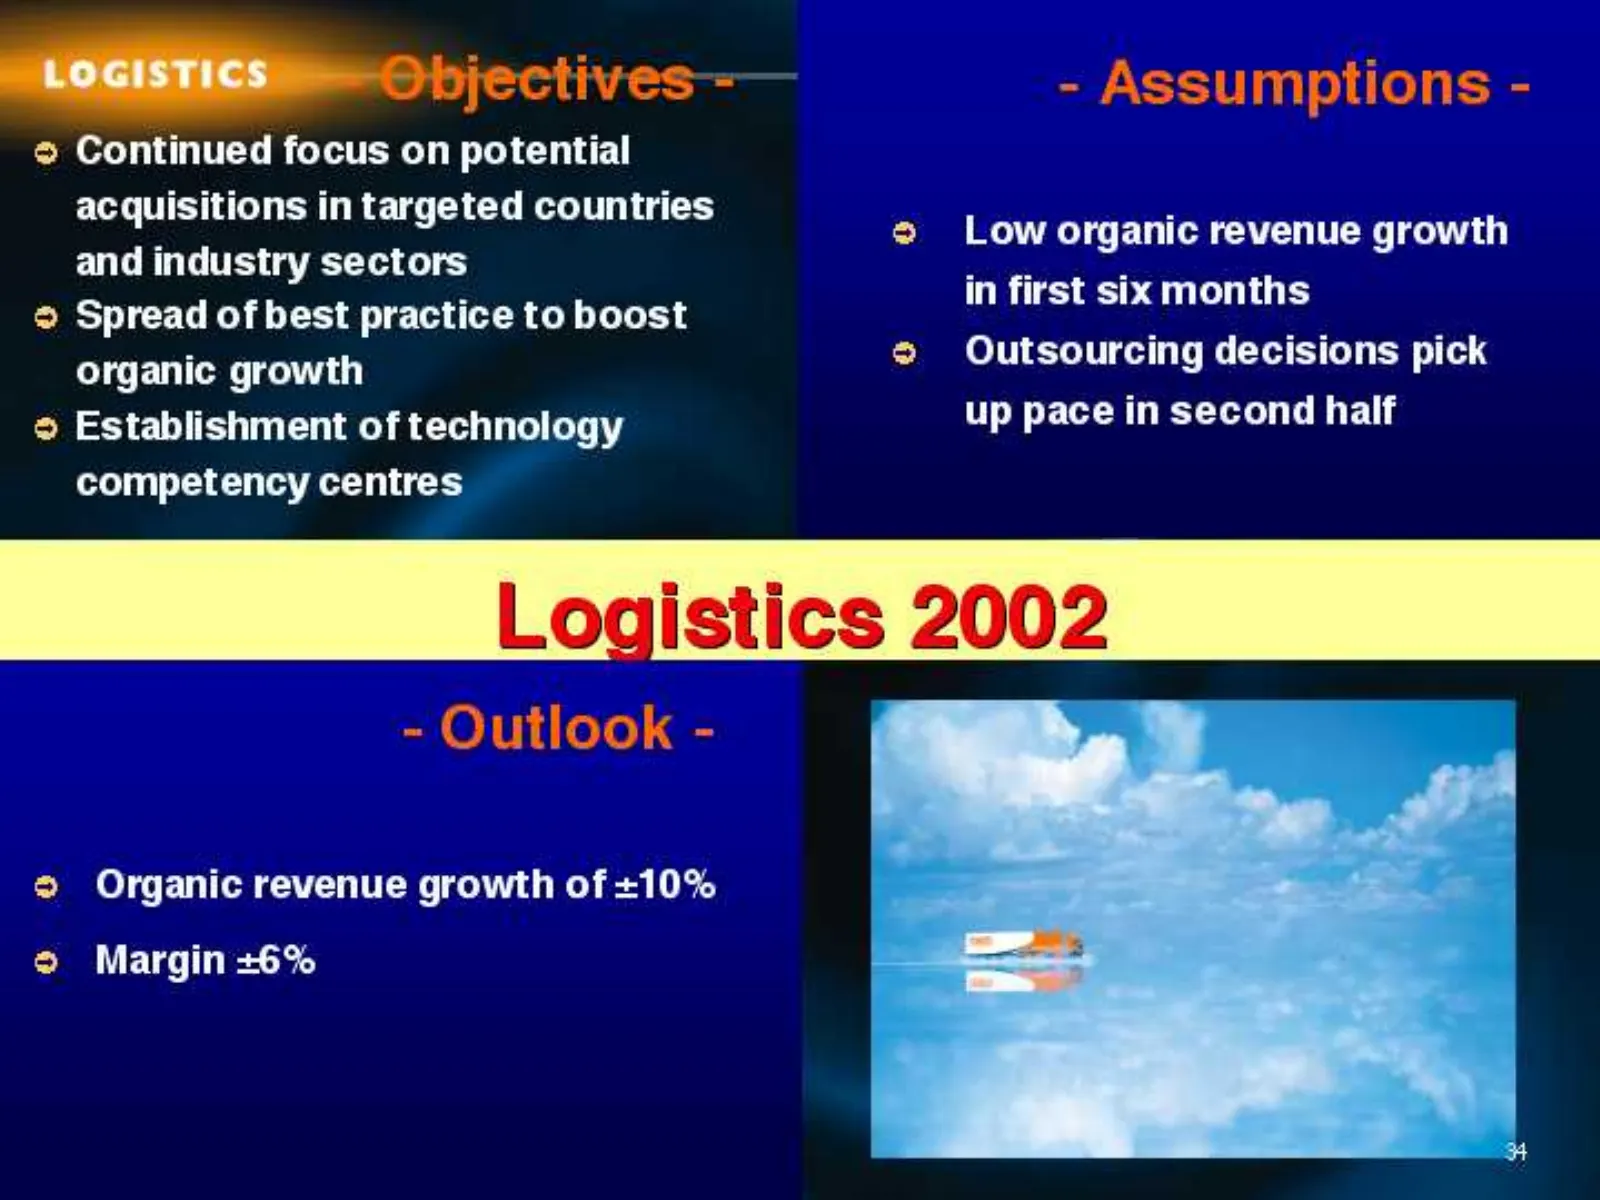
Slide 34: Logistics objectives, assumptions and outlook
ives - Assumptions - © Continued focus on potential acquisitions in targeted countries and industry sectors © Spread of best practice to boost organic growth © Establishment of technology up pace in second half © Low organic revenue growth in first six months ® Outsourcing decisions pick competency
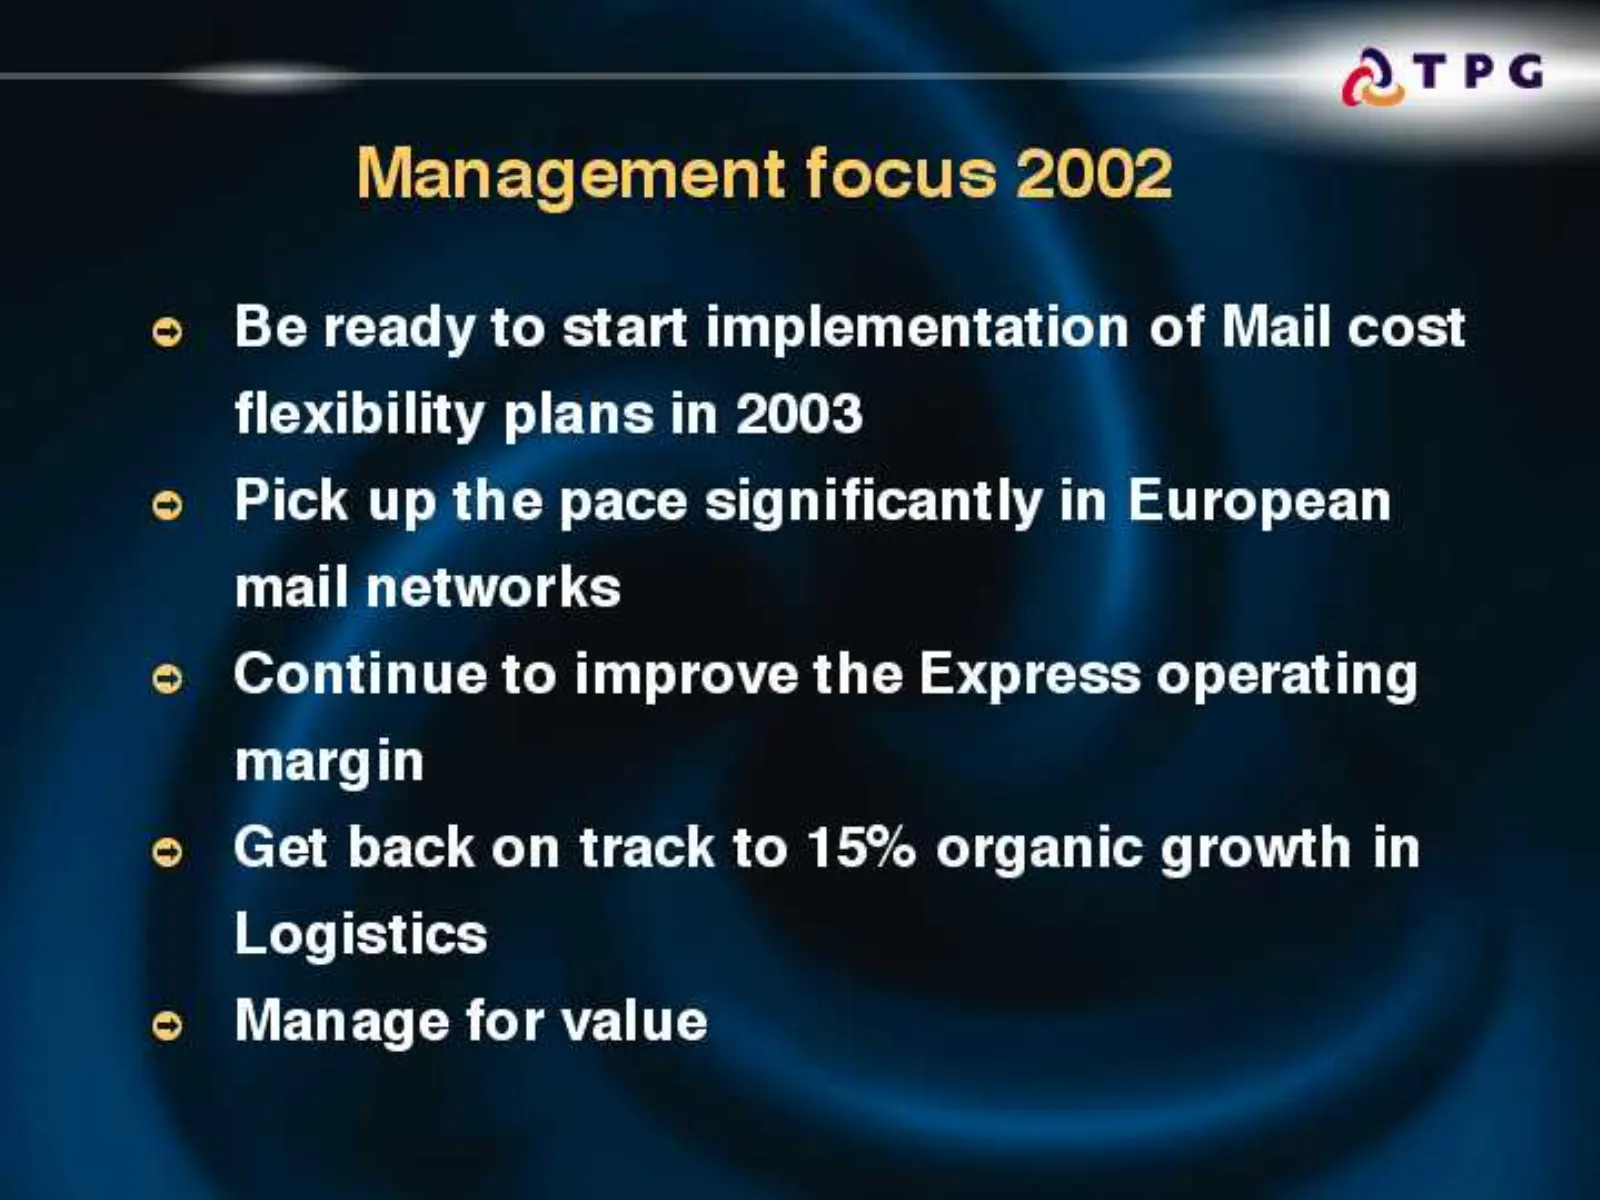
Slide 35: Management focus 2002
— i Management focus 2002 Be ready to start implementation of Mail cost flexibility plans in 2003 Pick up the pace significantly european mail networks Continue to improve the Express operating margin Get back on track to 15% organic growth in Logistics Manage for value

Slide 36: Financial Review
—— Financial Review
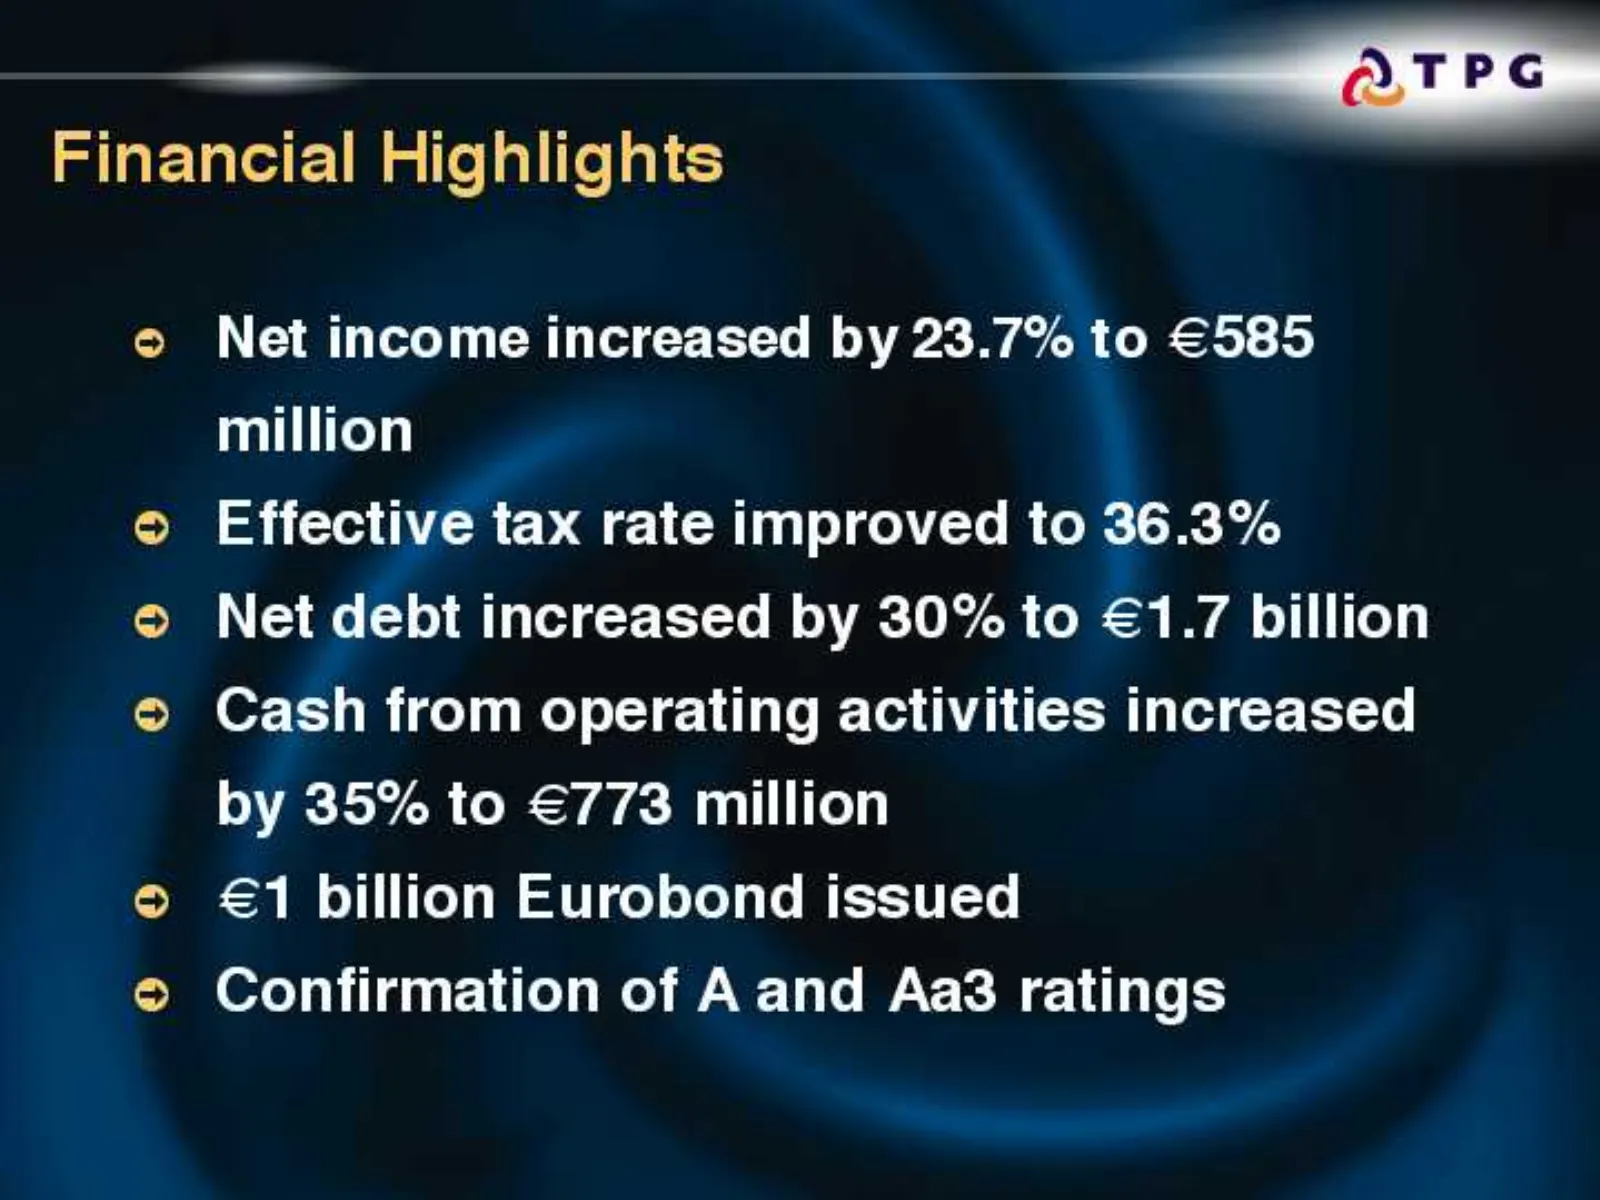
Slide 37: Financial Highlights
ie © Net income increased by 23.7% to €585 million Financial Highlights © Effective tax rate improved to 36. 3% © Net debt increased by 30% to e1 .7 billion © Cash from operating activities increased by 35% to €773 million © €1 billion Eurobond issued © Confirmation of A and Aa3 ratings
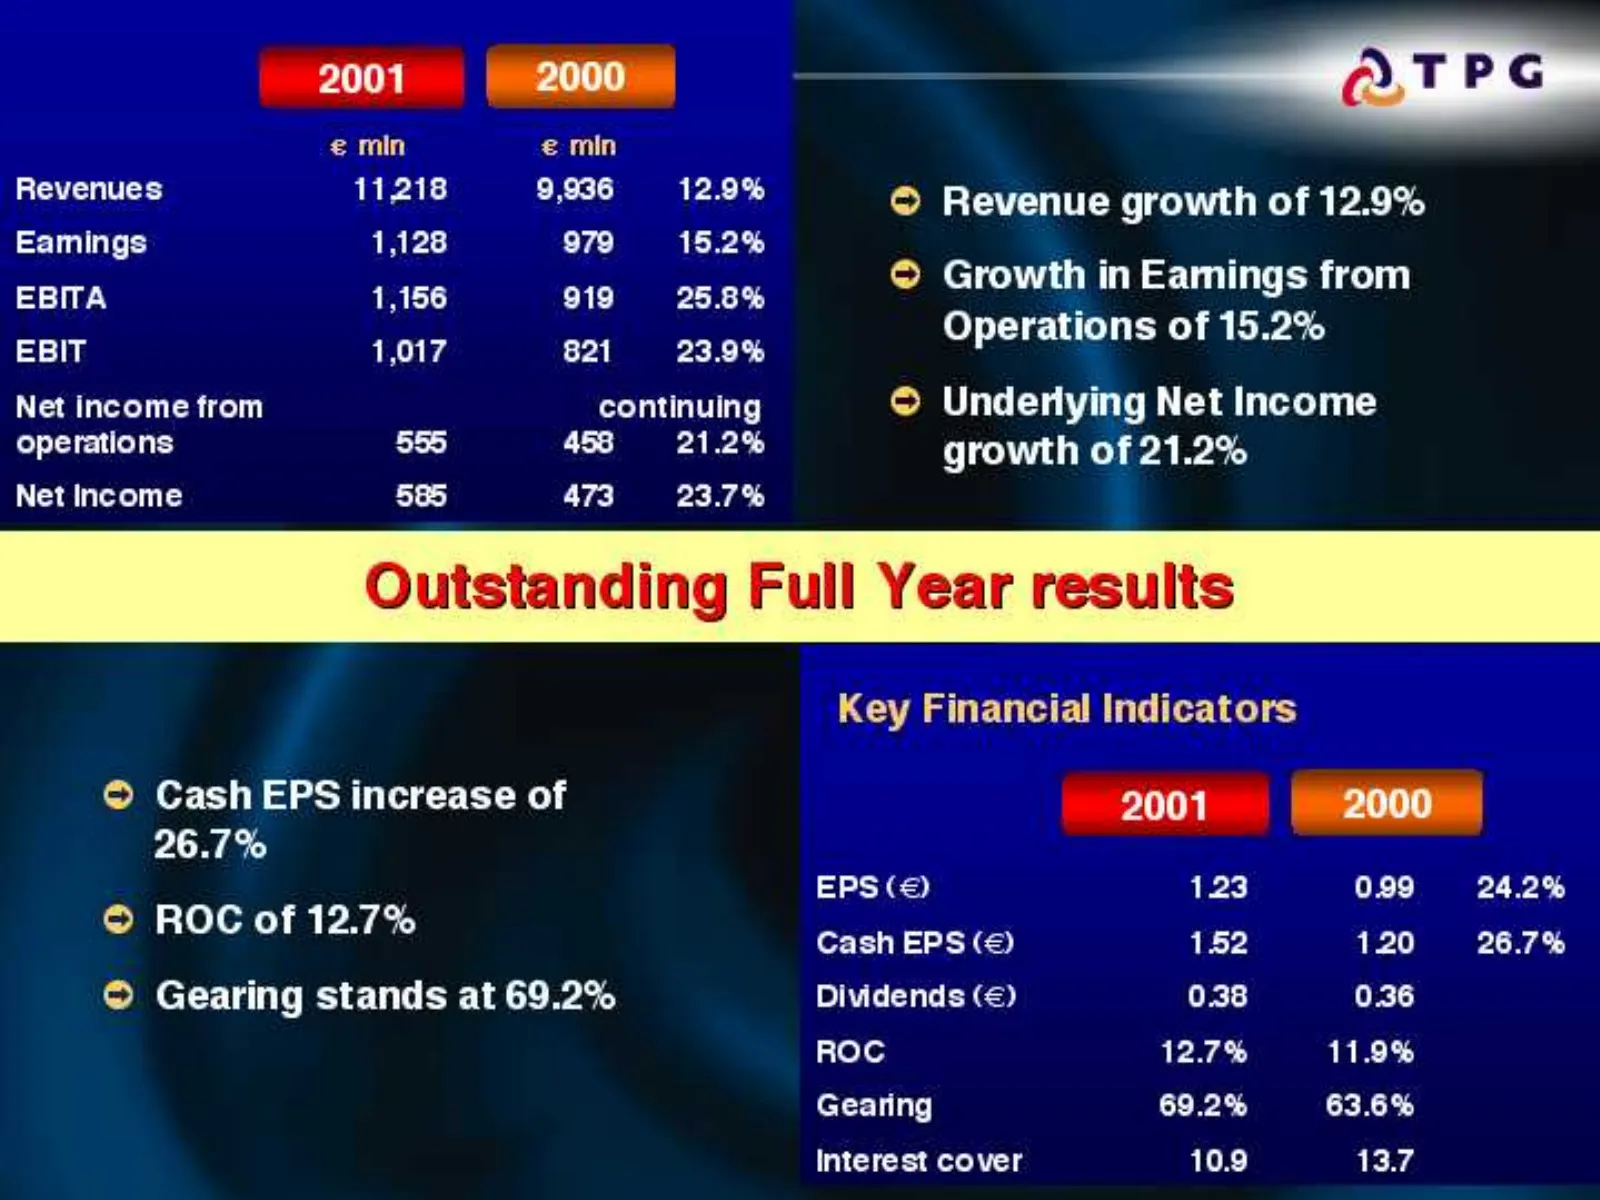
Slide 38: Group results and key financial indicators
001 2000 oe € min € min Revenues 11218 9,936 12.9% © Revenue growth of 12.9% Eamings 1,128 979 15.2% ' ; ERITA 1,156 gy osne © Growth in Eamings from EBIT 1,017 821 23.9% Operations of 15.2% Net income from continuing © Undenying Net Income operations 555 458 21.2% growth of 21.2% Net Income 585 473
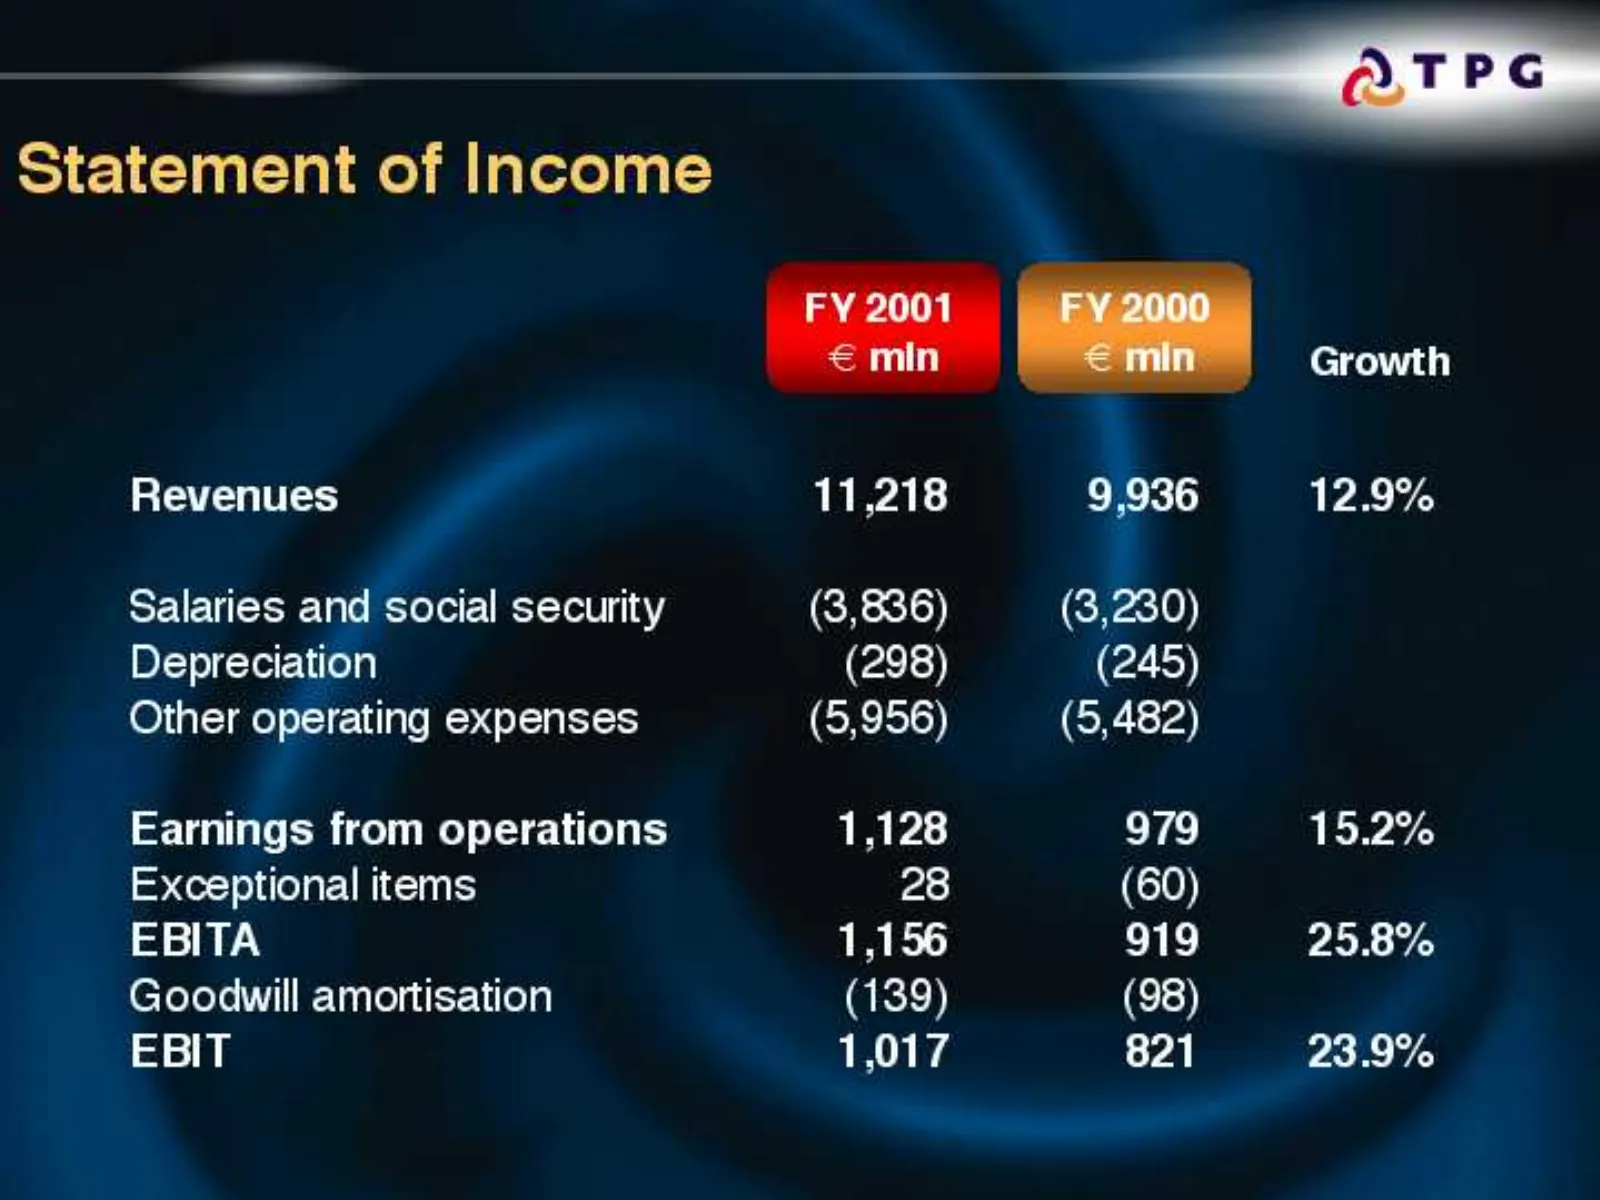
Slide 39: Statement of Income
Statement of Income Revenues Salaries and ‘social security : (3,230) Depreciation (298) (245) Other operating expenses (5,956) (5,482) Earnings from operations 1,128 979 15.2% Exceptional items 28 (60) EBITA 1,156 919 25.8% Goodwill amortisation (139) (98) EBIT 1,017 821 23.9%
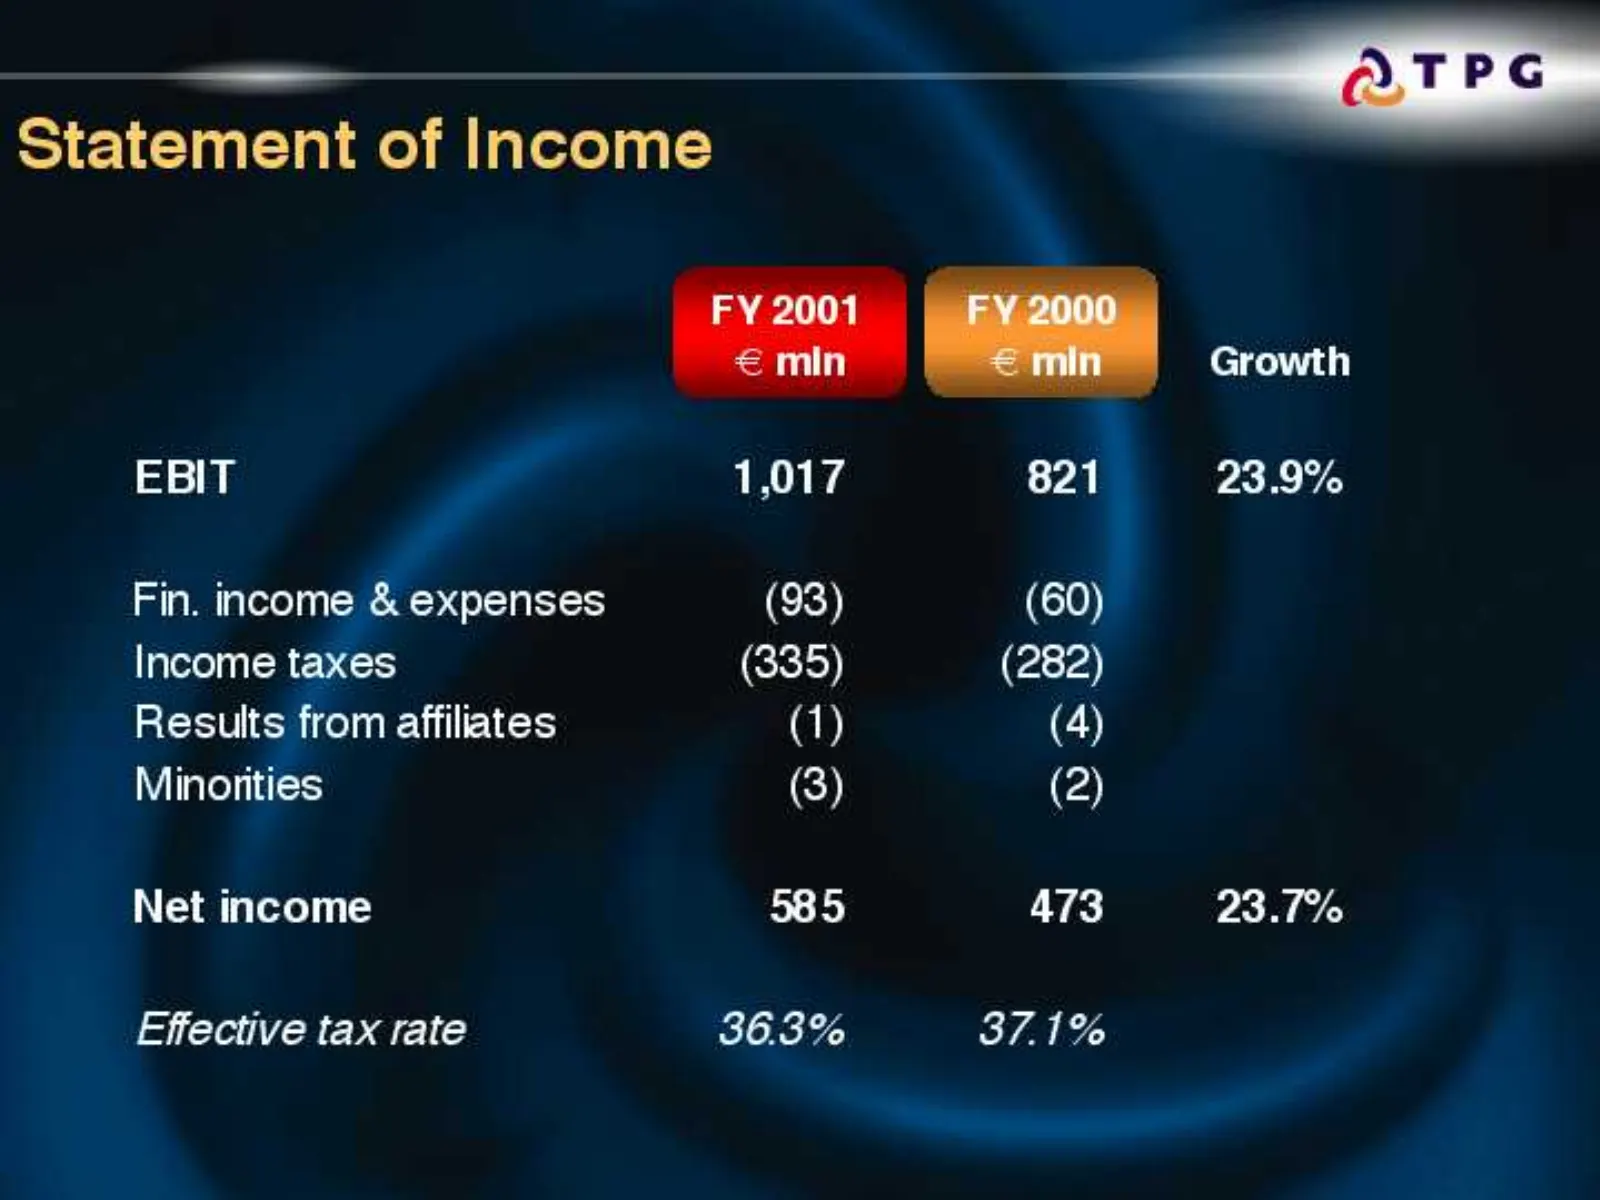
Slide 40: Statement of Income
Statement of Income EBIT Fin. income & expenses Income taxes pesuts rom affiliates Minorities Net income 585 473 23.7% Effective tax rate 36.3% 37.1%
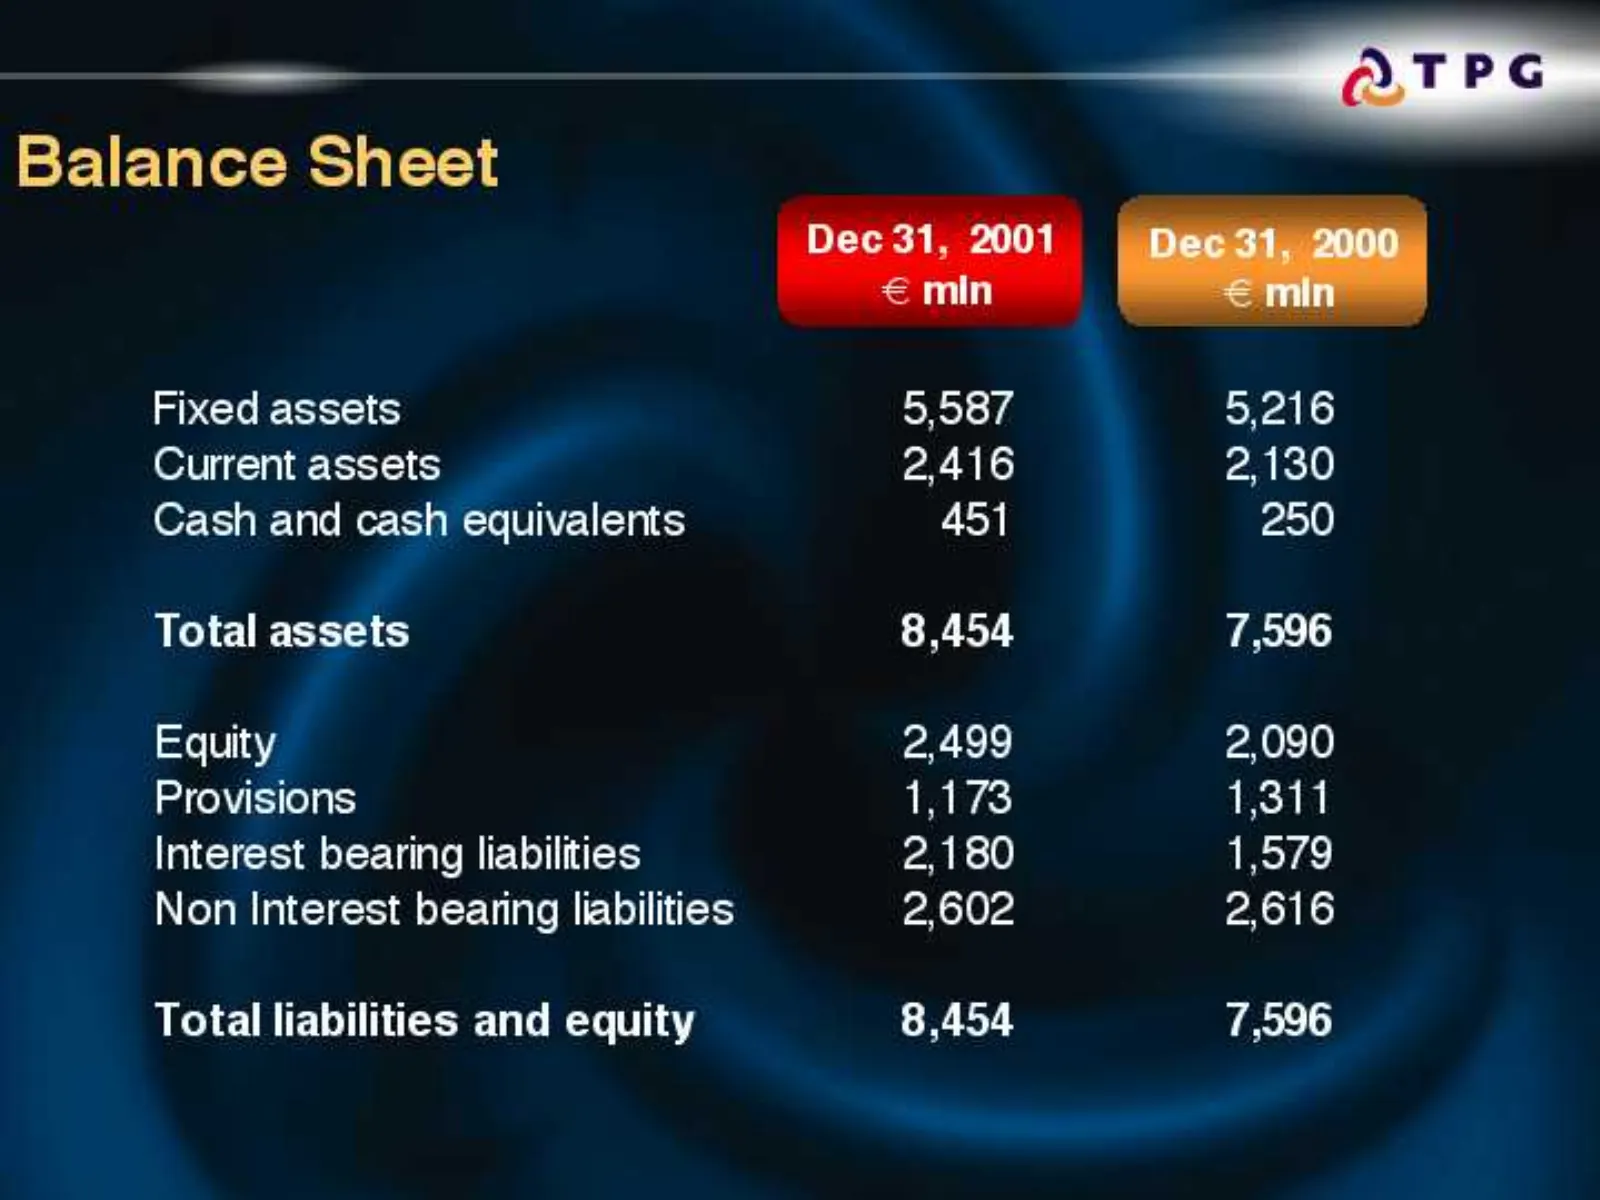
Slide 41: Balance Sheet
Balance Sheet Fixed assets Current assets Cash and cash equivalents Total assets 8,454 7,596 Fi 2,499 2,090 Provisions 1,173 1,311 Interest bearing liabilities 2,180 1,579 Non Interest bearing liabilities 2,602 2,616 Total liabilities and equity 8,454 7,596
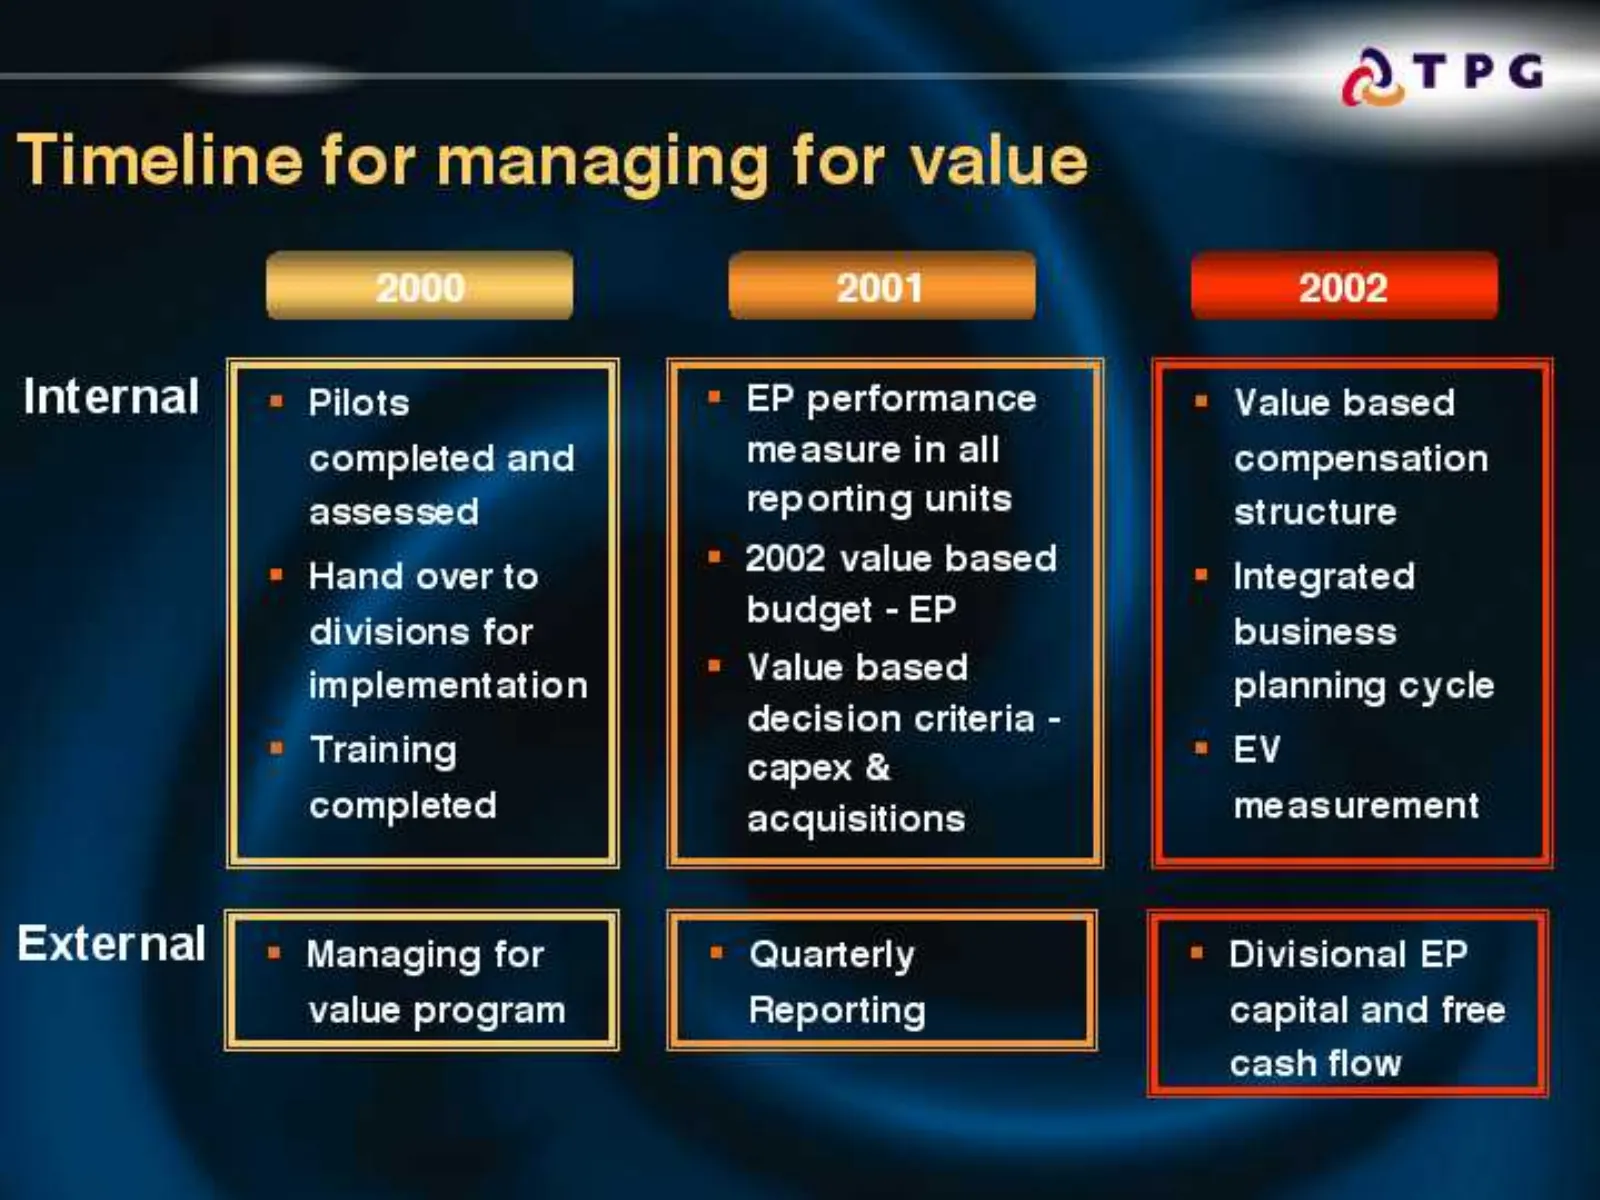
Slide 42: Timeline for managing for value
ee Timeline for managing for value Internal " [= EP performance | performance = Value based measure in all compensation reporting units = 2002 value based budget - EP structure = Integrated div sions for business decision criteria - capex & * EV completed acquisitions measurement External | = managi
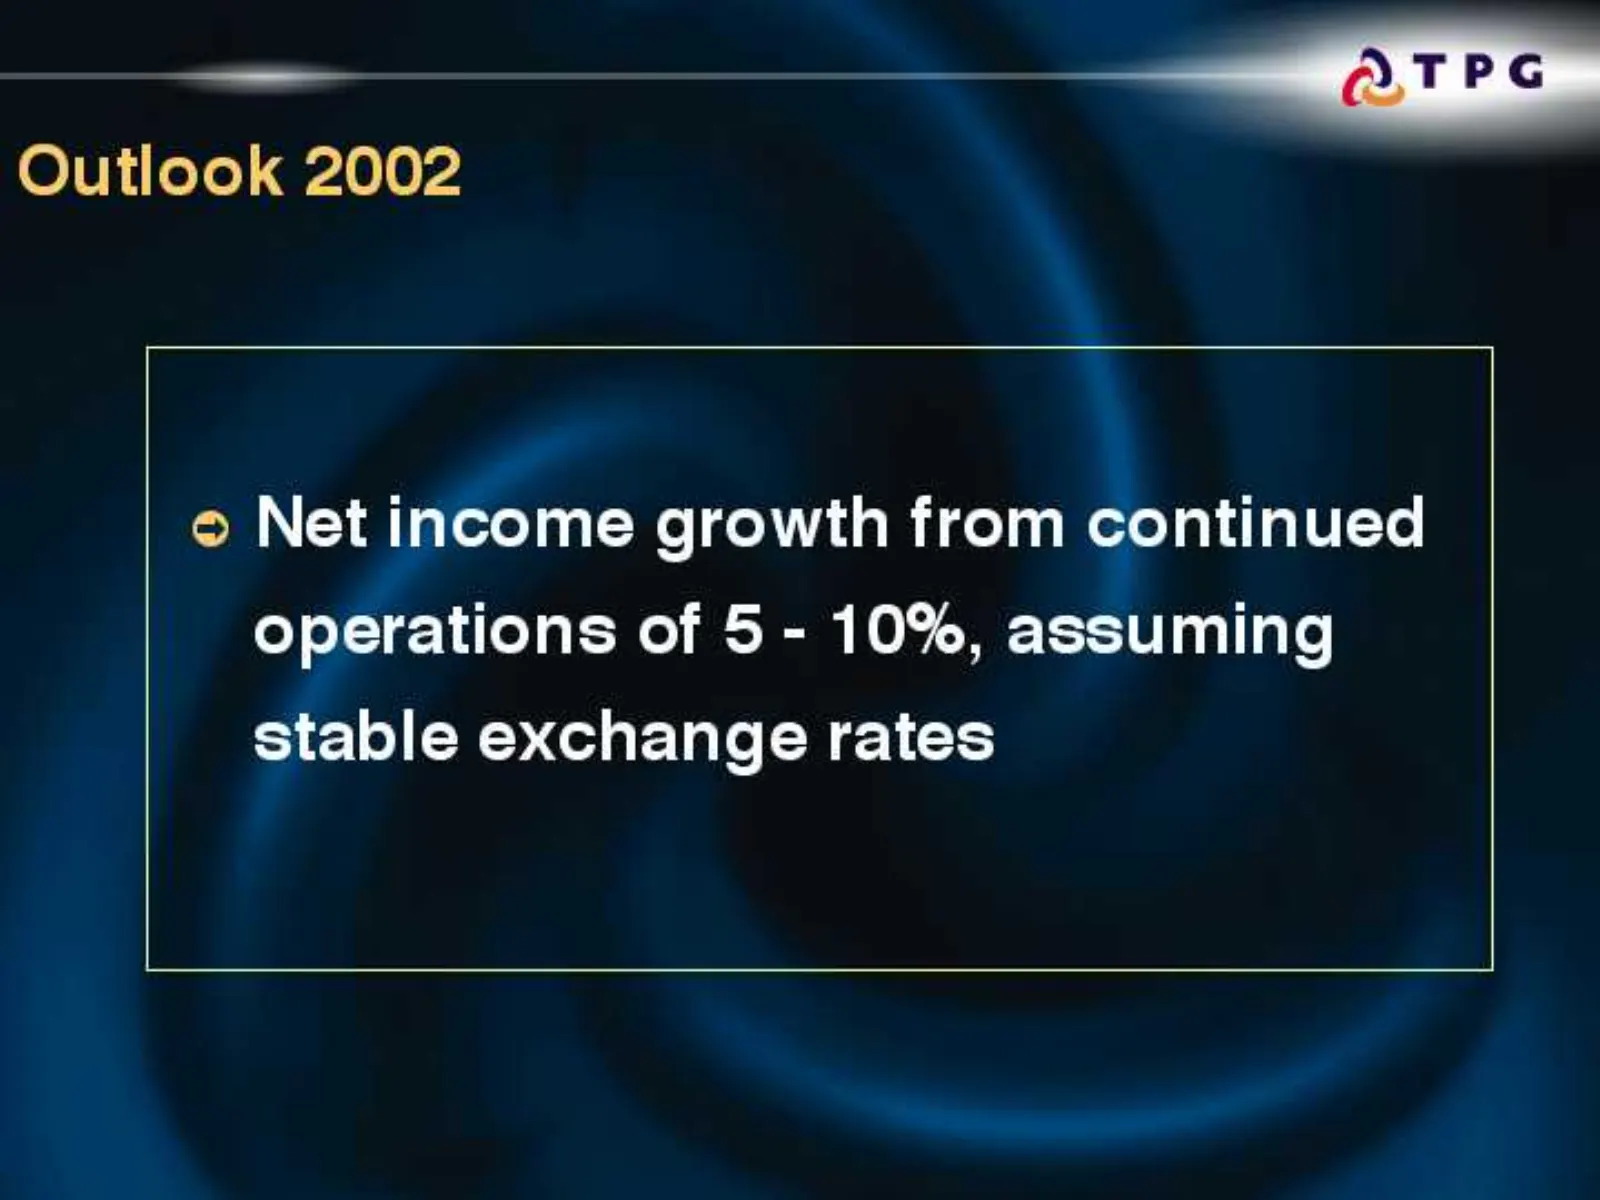
Slide 43: Outlook 2002
Outlook 2002 : © Net income growth from continued operations of 5- 10%, assuming stable exchange rates

Slide 44
Source: Internet Archive copy of tpg.com
More decks from TPG Inc.
 Q2 2026 Earnings Presentation44 slides · Aug 4, 2026
 Q1 2026 Earnings Presentation44 slides · May 1, 2026
 Q4 2025 Earnings Presentation45 slides · Feb 5, 2026
 Merger or Acquisition (January 2026)14 slides · Jan 6, 2026
 Q2 2025 Earnings Presentation44 slides · Aug 6, 2025
 Q1 2025 Earnings Presentation44 slides · May 7, 2025