Lonestar Resources US — CEO Energy-Power Conference (September 2021)
32 slides from Lonestar Resources US's conference presentation, Sep 10, 2021

Slide 1: CEO Energy-Power Conference
Darrin Henke President and Chief Executive Officer September 10, 2021 CEO Energy-Power Conference CEO Energy-Power Conference
Slide 2: Important Disclosures
IMPORTANT DISCLOSURES Additional Information and Where To Find It In connection with the proposed merger (the “Proposed Merger”) between Penn Virginia Corporation (together with all predecessors and subsidiaries, “Penn Virginia,” “PVAC,” “we,” “us,” “our” or the “Company”) and Lonestar Resources US
Slide 3: Forward-Looking and Cautionary Statements
Forward-Looking and Cautionary Statements Forward-Looking and Cautionary Statements This presentation contains certain "forward-looking" statements within the meaning of Section 27A of the Securities Act of 1933, as amended, and Section 21E of the Securities Exchange Act of 1934, as amended. Stateme
Slide 4: PVAC Investment Thesis
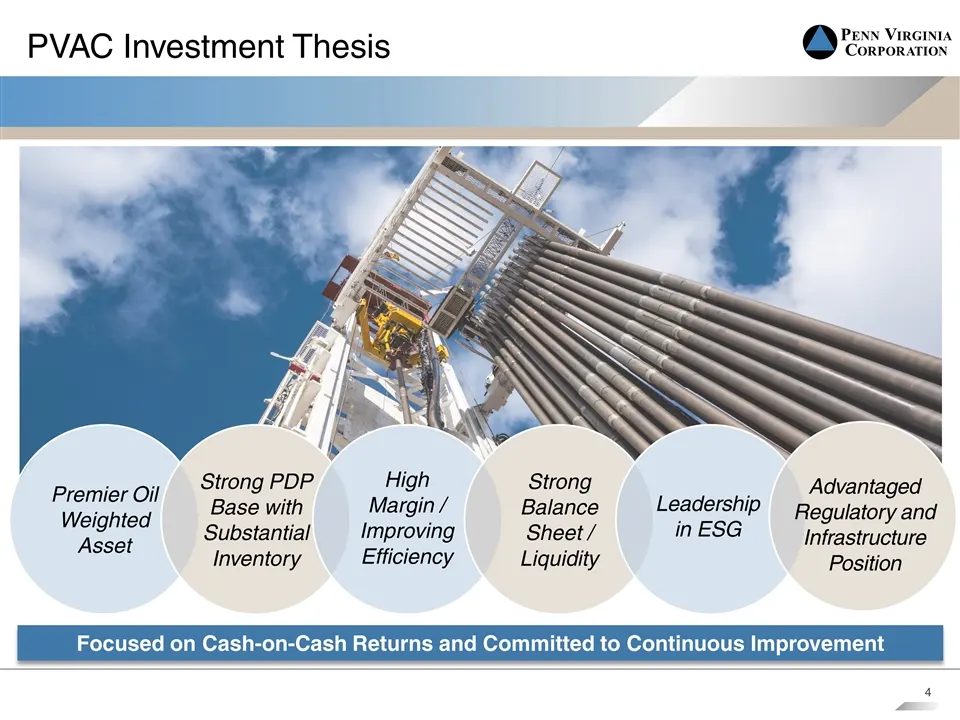
Premier Oil Weighted Asset Strong PDP Base with Substantial Inventory Strong Balance Sheet / Liquidity PVAC Investment Thesis Focused on Cash-on-Cash Returns and Committed to Continuous Improvement High Margin / Improving Efficiency Advantaged Regulatory and Infrastructure Position Leadership in ESG
Slide 5: PVAC Company Overview
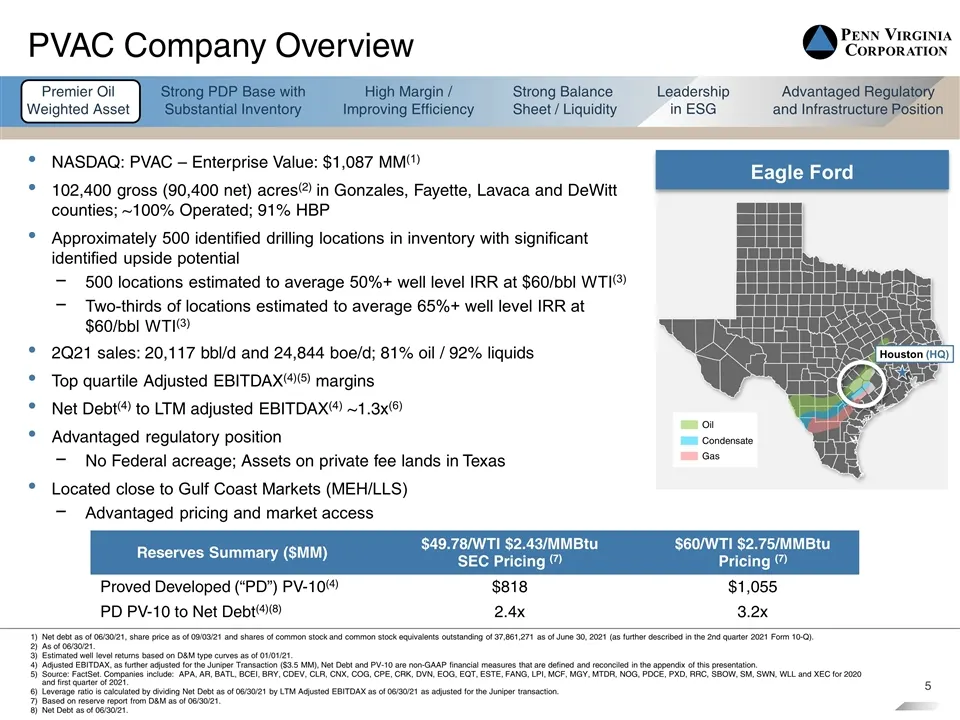
PVAC Company Overview NASDAQ: PVAC – Enterprise Value: $1,087 MM(1) 102,400 gross (90,400 net) acres(2) in Gonzales, Fayette, Lavaca and DeWitt counties; ~100% Operated; 91% HBP Approximately 500 identified drilling locations in inventory with significant identified upside potential 500 locations es
Slide 6: 2021 Year-to-date Accomplishments
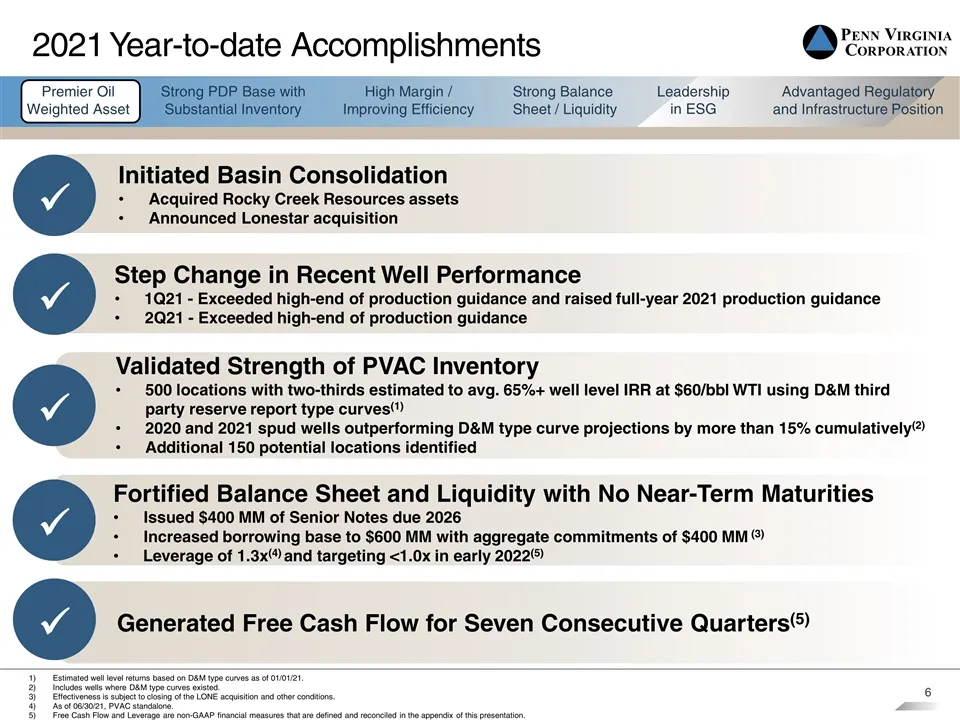
2021 Year-to-date Accomplishments Validated Strength of PVAC Inventory 500 locations with two-thirds estimated to avg. 65%+ well level IRR at $60/bbl WTI using D&M third party reserve report type curves(1) 2020 and 2021 spud wells outperforming D&M type curve projections by more than 15% cumulativel
Slide 7: Lonestar Acquisition Overview
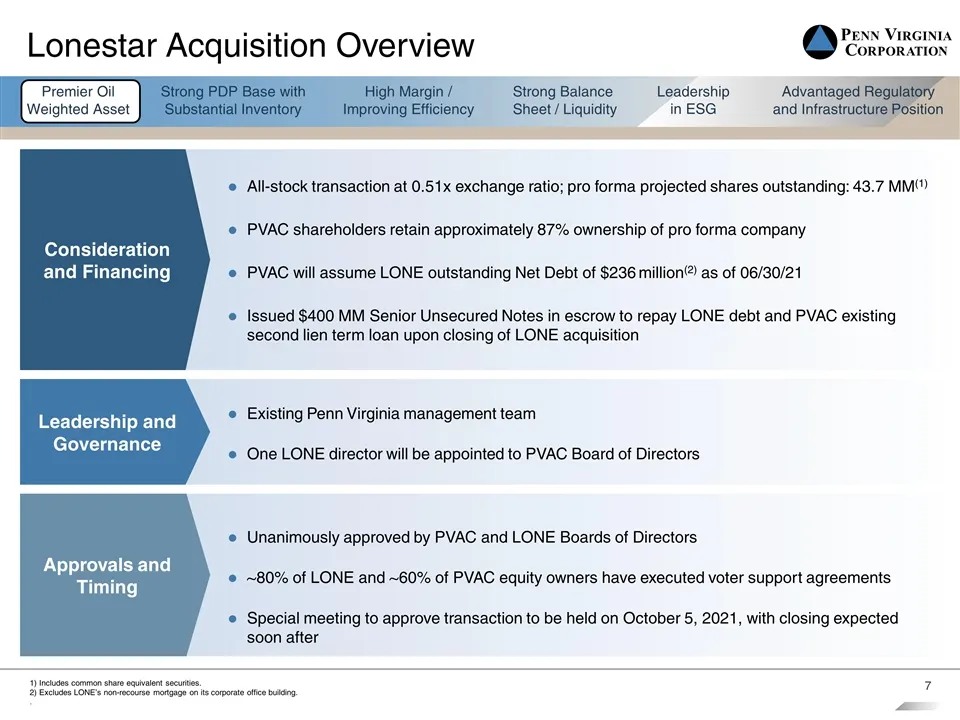
Lonestar Acquisition Overview Leadership and Governance Existing Penn Virginia management team One LONE director will be appointed to PVAC Board of Directors Approvals and Timing Unanimously approved by PVAC and LONE Boards of Directors ~80% of LONE and ~60% of PVAC equity owners have executed voter
Slide 8: Strategic Fit and Additional Scale
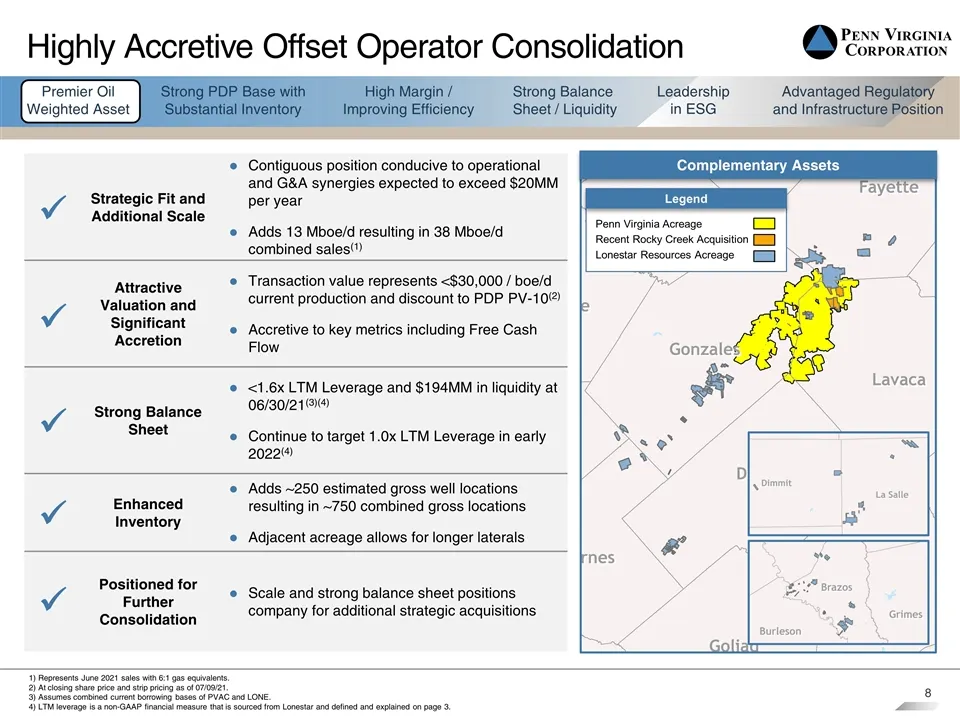
Strategic Fit and Additional Scale Contiguous position conducive to operational and G&A synergies expected to exceed $20MM per year Adds 13 Mboe/d resulting in 38 Mboe/d combined sales(1) Attractive Valuation and Significant Accretion Transaction value represents <$30,000 / boe/d current production
Slide 9: Lonestar Assets
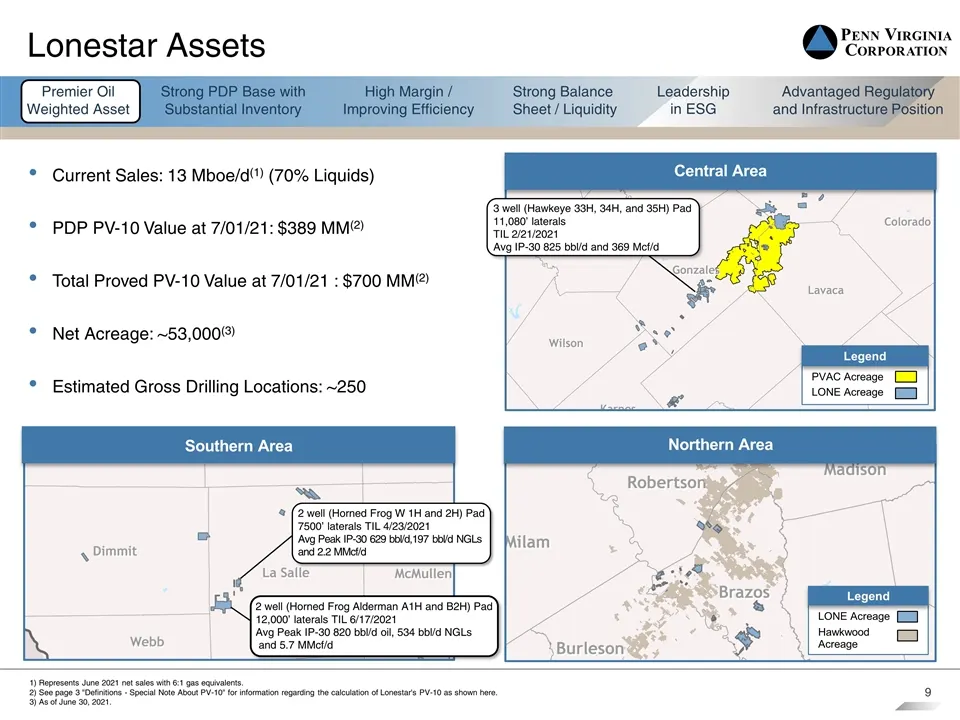
Lonestar Assets Current Sales: 13 Mboe/d(1) (70% Liquids) PDP PV-10 Value at 7/01/21: $389 MM(2) Total Proved PV-10 Value at 7/01/21 : $700 MM(2) Net Acreage: ~53,000(3) Estimated Gross Drilling Locations: ~250 1) Represents June 2021 net sales with 6:1 gas equivalents. 2) See page 3 "Definitions -
Slide 10: Complementary Scale and Strong Financial Metrics
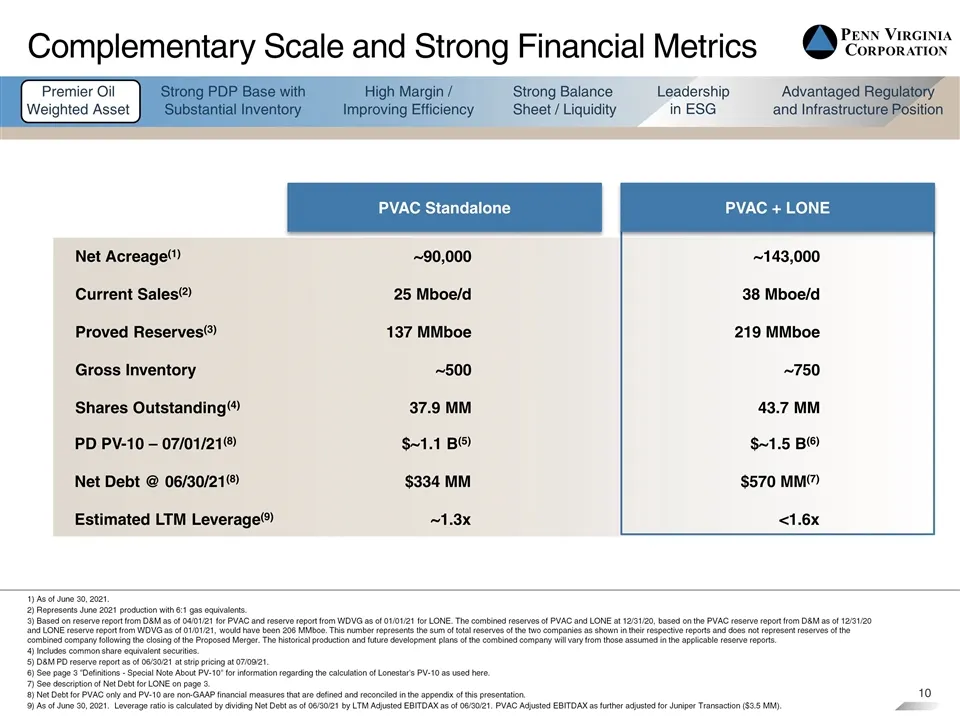
Net Acreage(1) Current Sales(2) Proved Reserves(3) Gross Inventory Shares Outstanding(4) PD PV-10 – 07/01/21(8) Net Debt @ 06/30/21(8) Estimated LTM Leverage(9) PVAC + LONE PVAC Standalone ~90,000 25 Mboe/d 137 MMboe ~500 37.9 MM $~1.1 B(5) $334 MM ~1.3x ~143,000 38 Mboe/d 219 MMboe ~750 43.7 MM $~1
Slide 11: Anticipated Synergies – Significant Value Creation
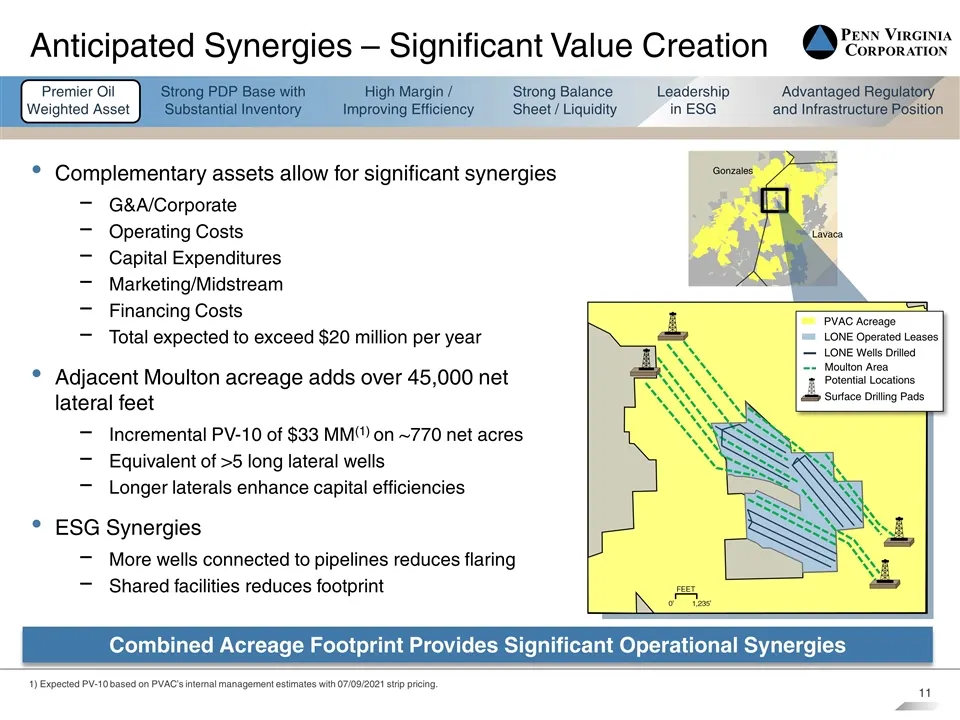
Lavaca Gonzales Anticipated Synergies – Significant Value Creation Combined Acreage Footprint Provides Significant Operational Synergies PVAC Acreage Moulton Area Potential Locations LONE Operated Leases Surface Drilling Pads LONE Wells Drilled 1) Expected PV-10 based on PVAC’s internal management e
Slide 12: Strong PDP Base with Substantial Inventory
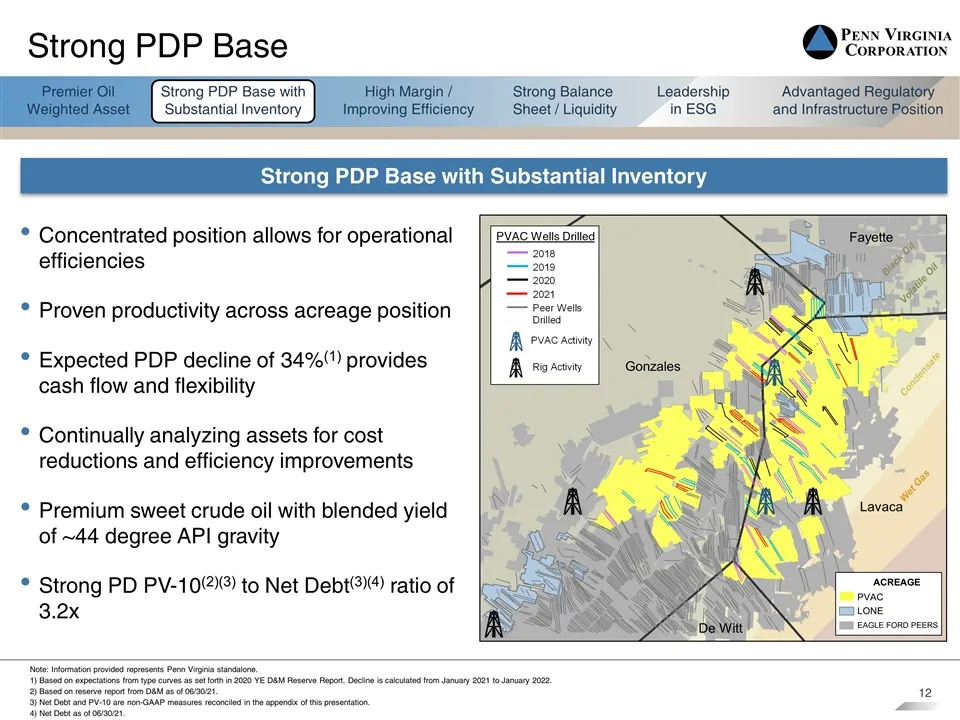
Gonzales Lavaca Fayette De Witt Strong PDP Base Strong PDP Base with Substantial Inventory Concentrated position allows for operational efficiencies Proven productivity across acreage position Expected PDP decline of 34%(1) provides cash flow and flexibility Continually analyzing assets for cost red
Slide 13: Exceptional PVAC Well Results and Deep Inventory
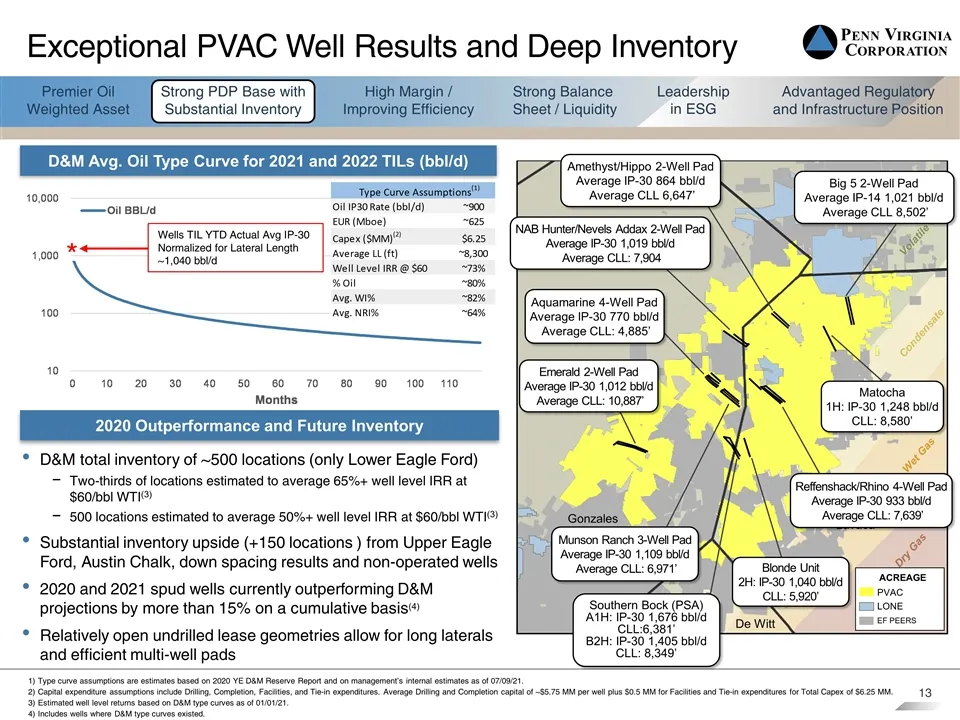
Exceptional PVAC Well Results and Deep Inventory Type curve assumptions are estimates based on 2020 YE D&M Reserve Report and on management’s internal estimates as of 07/09/21. Capital expenditure assumptions include Drilling, Completion, Facilities, and Tie-in expenditures. Average Drilling and Com
Slide 14: Northeast Acreage Provides Significant Inventory
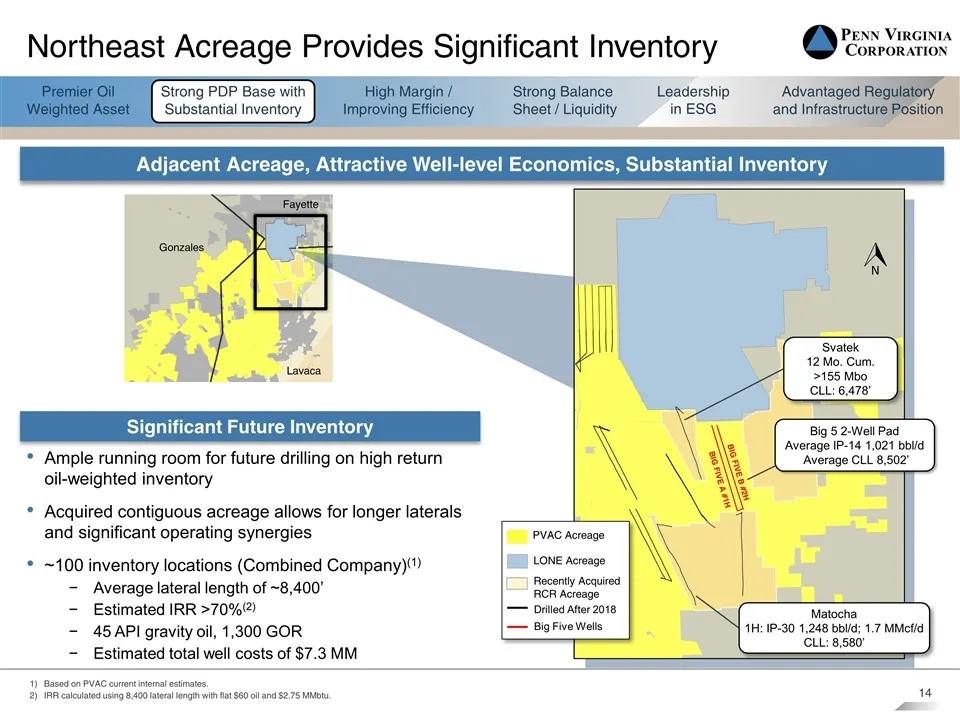
Gonzales Lavaca Fayette Northeast Acreage Provides Significant Inventory Based on PVAC current internal estimates. IRR calculated using 8,400 lateral length with flat $60 oil and $2.75 MMbtu. Ample running room for future drilling on high return oil-weighted inventory Acquired contiguous acreage all
Slide 15: Southwest Acreage Provides Significant Opportunity
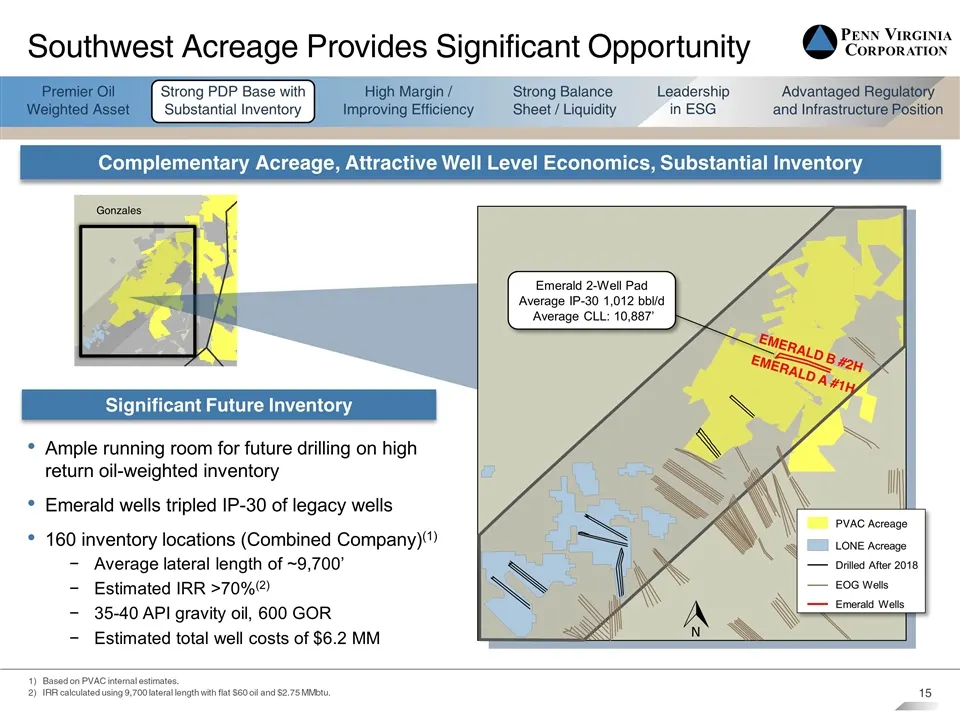
Gonzales Gonzales EMERALD B #2H EMERALD A #1H Emerald 2-Well Pad Average IP-30 1,012 bbl/d Average CLL: 10,887’ LONE Acreage Drilled After 2018 EOG Wells Emerald Wells PVAC Acreage Southwest Acreage Provides Significant Opportunity Ample running room for future drilling on high return oil-weighted i
Slide 16: Successful Infill and Downspacing
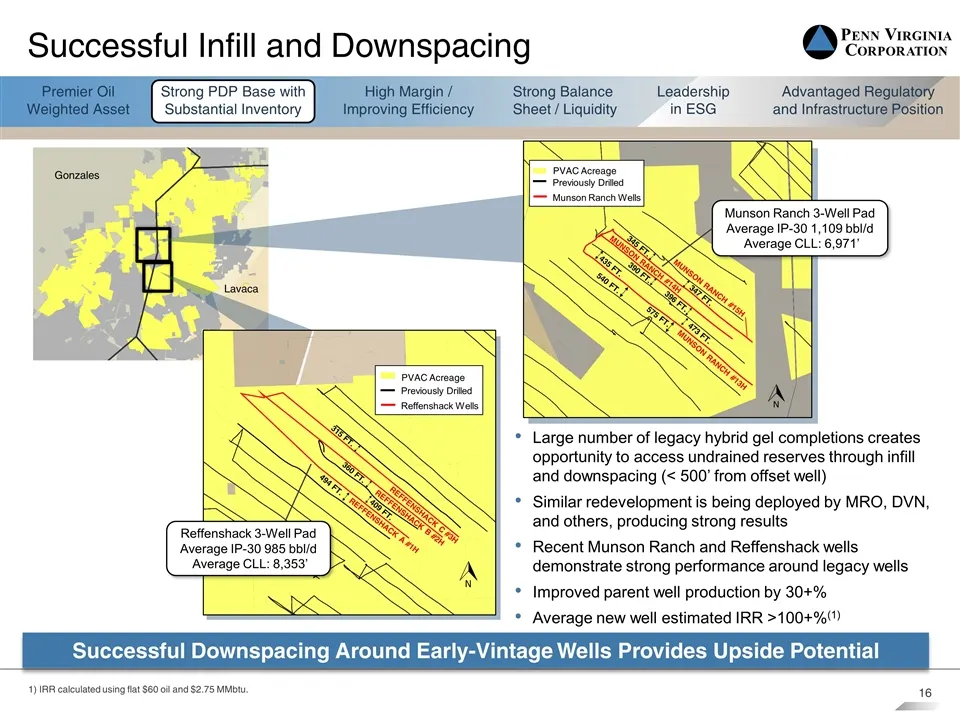
Gonzales Lavaca Successful Infill and Downspacing 1) IRR calculated using flat $60 oil and $2.75 MMbtu. Successful Downspacing Around Early-Vintage Wells Provides Upside Potential Large number of legacy hybrid gel completions creates opportunity to access undrained reserves through infill and downsp
Slide 17: Continuously Improving Drilling Efficiencies
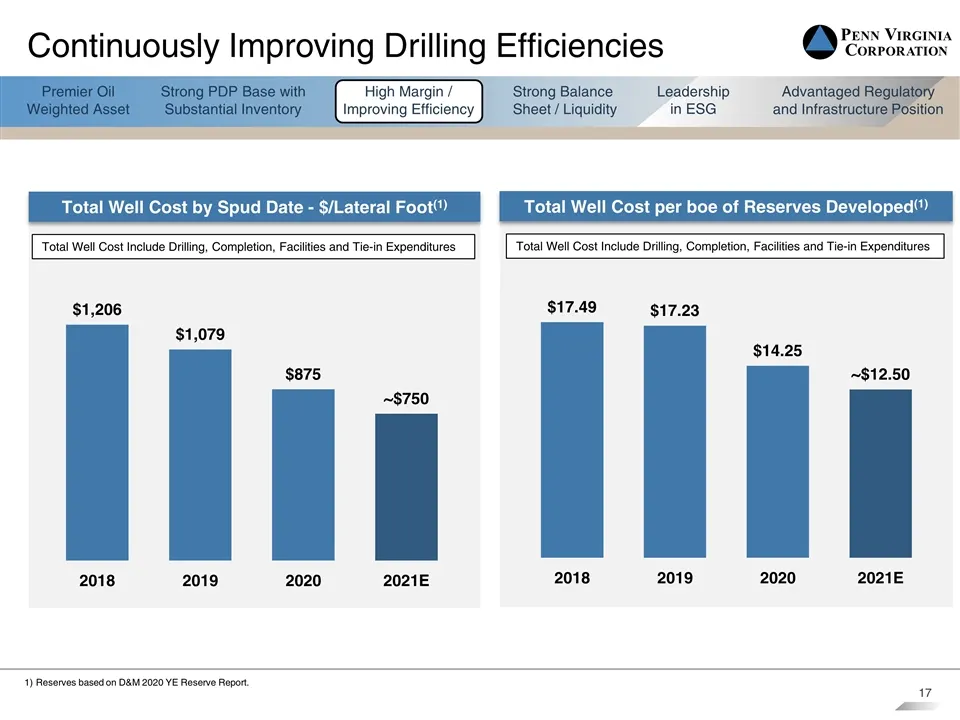
Continuously Improving Drilling Efficiencies Reserves based on D&M 2020 YE Reserve Report. Total Well Cost by Spud Date - $/Lateral Foot(1) Total Well Cost Include Drilling, Completion, Facilities and Tie-in Expenditures Total Well Cost per boe of Reserves Developed(1) Total Well Cost Include Drilli
Slide 18: Committed to Strong Balance Sheet
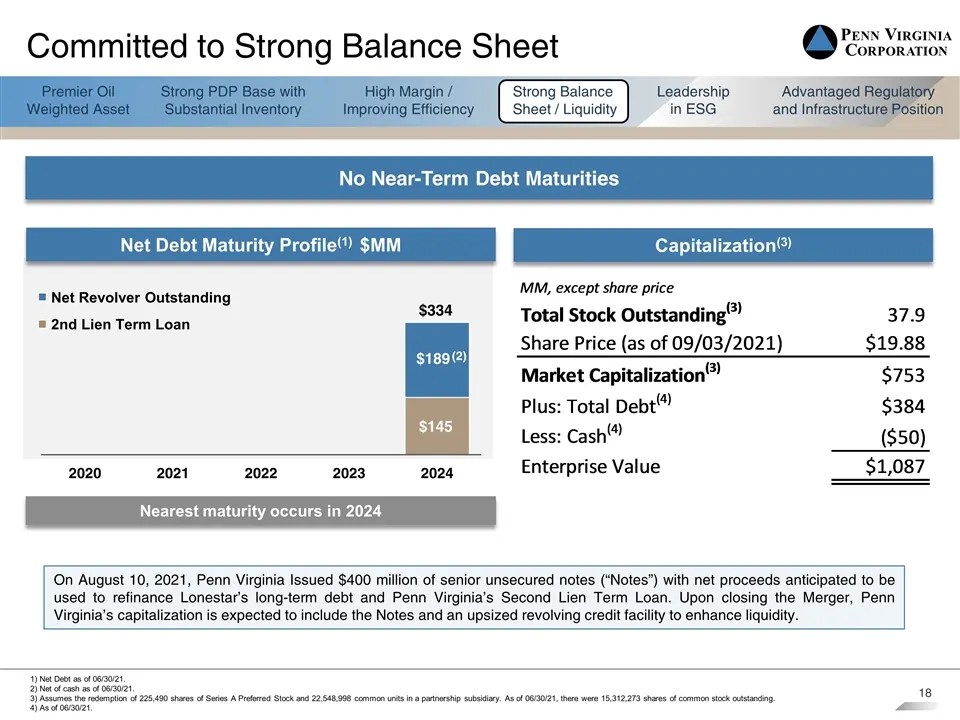
Committed to Strong Balance Sheet Net Debt Maturity Profile(1) $MM Capitalization(3) Nearest maturity occurs in 2024 1) Net Debt as of 06/30/21. 2) Net of cash as of 06/30/21. 3) Assumes the redemption of 225,490 shares of Series A Preferred Stock and 22,548,998 common units in a partnership subsidi
Slide 19: Committed to Protecting the Environment
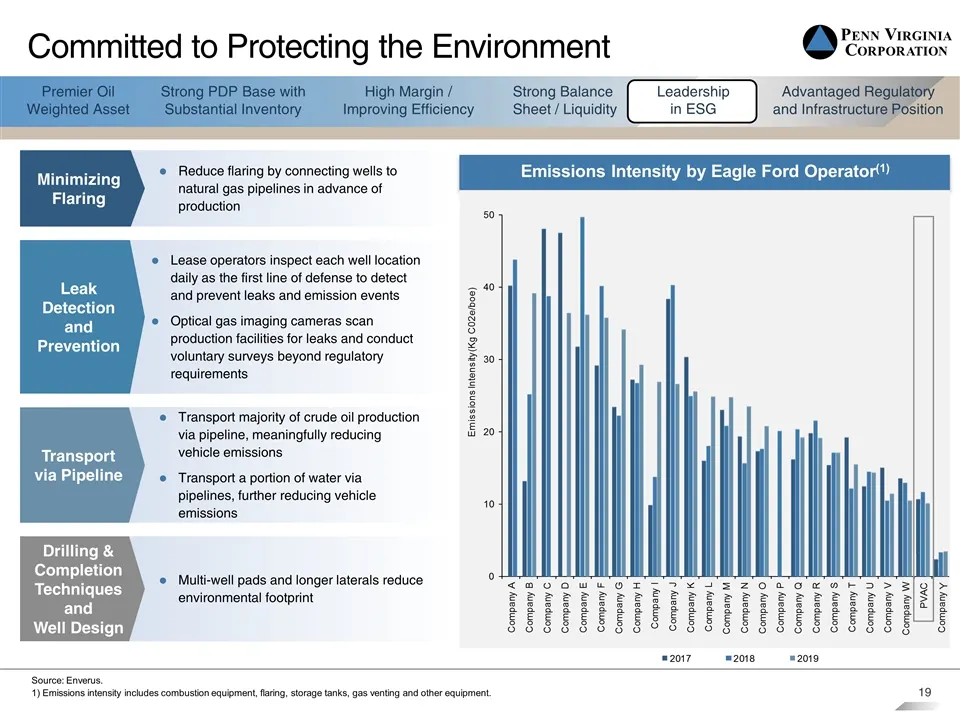
Emissions Intensity by Eagle Ford Operator(1) Committed to Protecting the Environment Y Source: Enverus. 1) Emissions intensity includes combustion equipment, flaring, storage tanks, gas venting and other equipment. Reduce flaring by connecting wells to natural gas pipelines in advance of production
Slide 20: Substantial Infrastructure – Advantaged Pricing
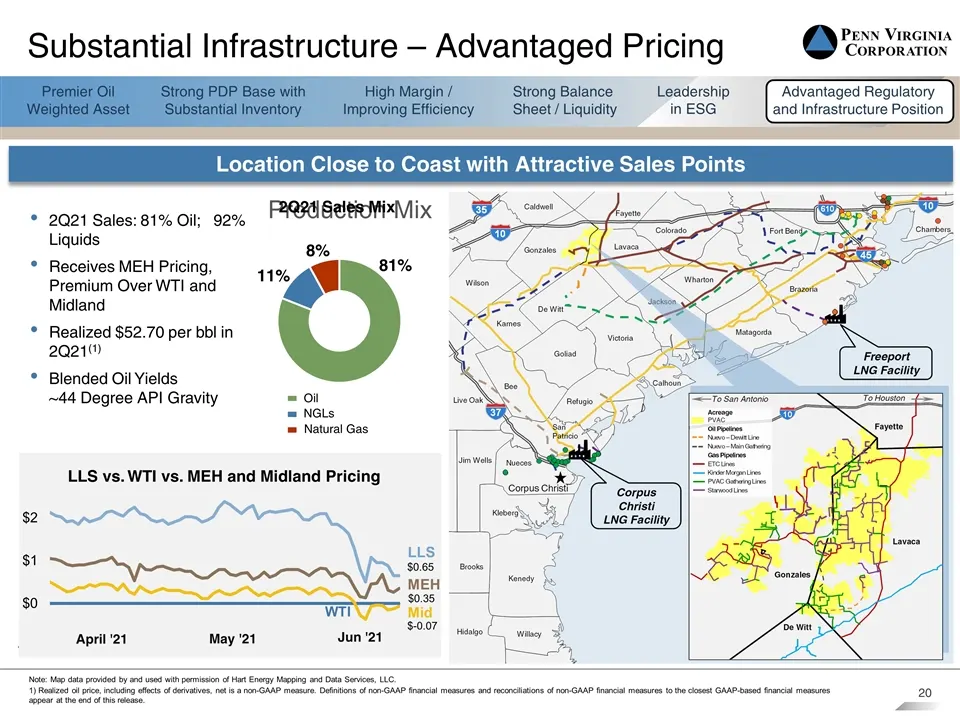
Substantial Infrastructure – Advantaged Pricing Location Close to Coast with Attractive Sales Points 2Q21 Sales: 81% Oil; 92% Liquids Receives MEH Pricing, Premium Over WTI and Midland Realized $52.70 per bbl in 2Q21(1) Blended Oil Yields ~44 Degree API Gravity 2Q21 Sales Mix Natural Gas NGLs Oil No
Slide 21: Advantaged Regulatory Position
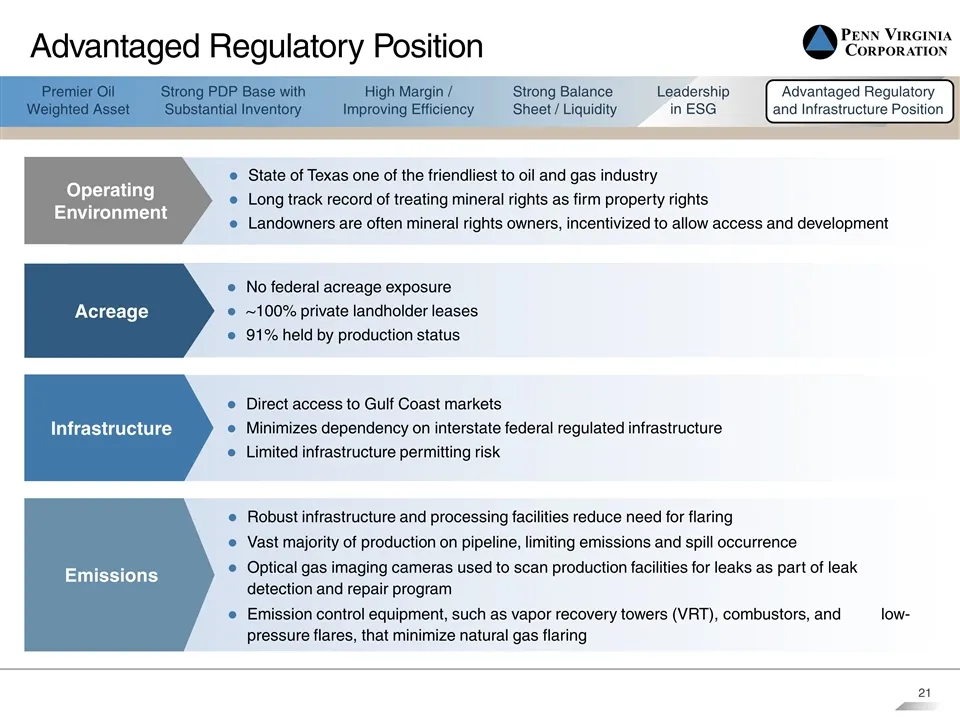
Advantaged Regulatory Position Emissions Robust infrastructure and processing facilities reduce need for flaring Vast majority of production on pipeline, limiting emissions and spill occurrence Optical gas imaging cameras used to scan production facilities for leaks as part of leak detection and rep
Slide 22: Further Consolidation Potential
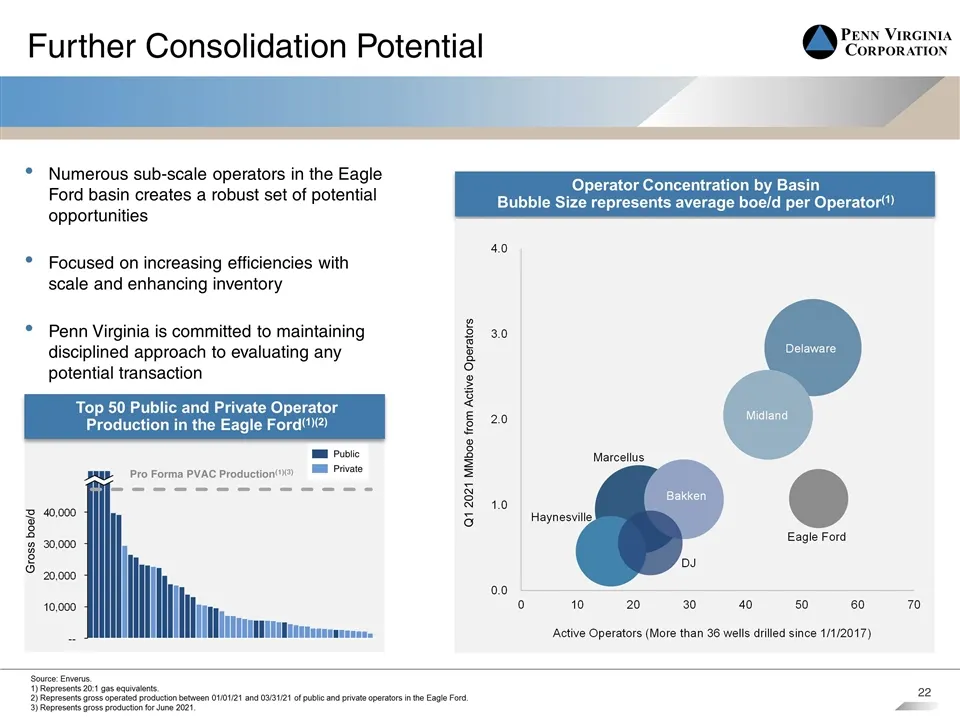
Further Consolidation Potential Numerous sub-scale operators in the Eagle Ford basin creates a robust set of potential opportunities Focused on increasing efficiencies with scale and enhancing inventory Penn Virginia is committed to maintaining disciplined approach to evaluating any potential transa
Slide 23: PVAC Investment Thesis
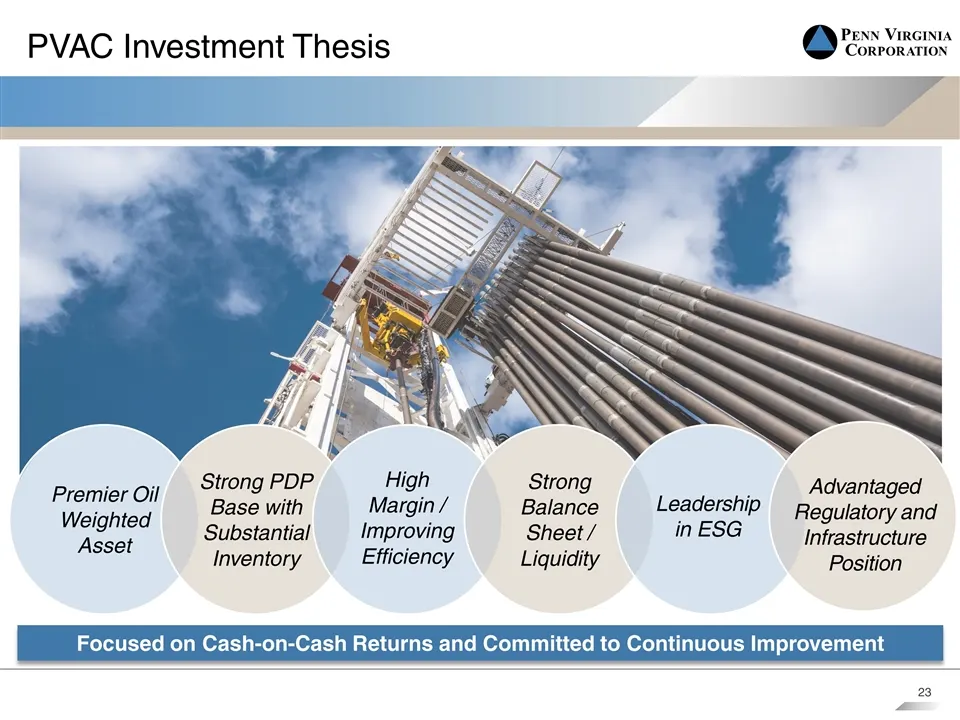
Premier Oil Weighted Asset Strong PDP Base with Substantial Inventory Strong Balance Sheet / Liquidity PVAC Investment Thesis Focused on Cash-on-Cash Returns and Committed to Continuous Improvement High Margin / Improving Efficiency Advantaged Regulatory and Infrastructure Position Leadership in ESG
Slide 24: Appendix
PENN VIRGINIA CORPORATION Appendix
Slide 25: 3Q21 Guidance
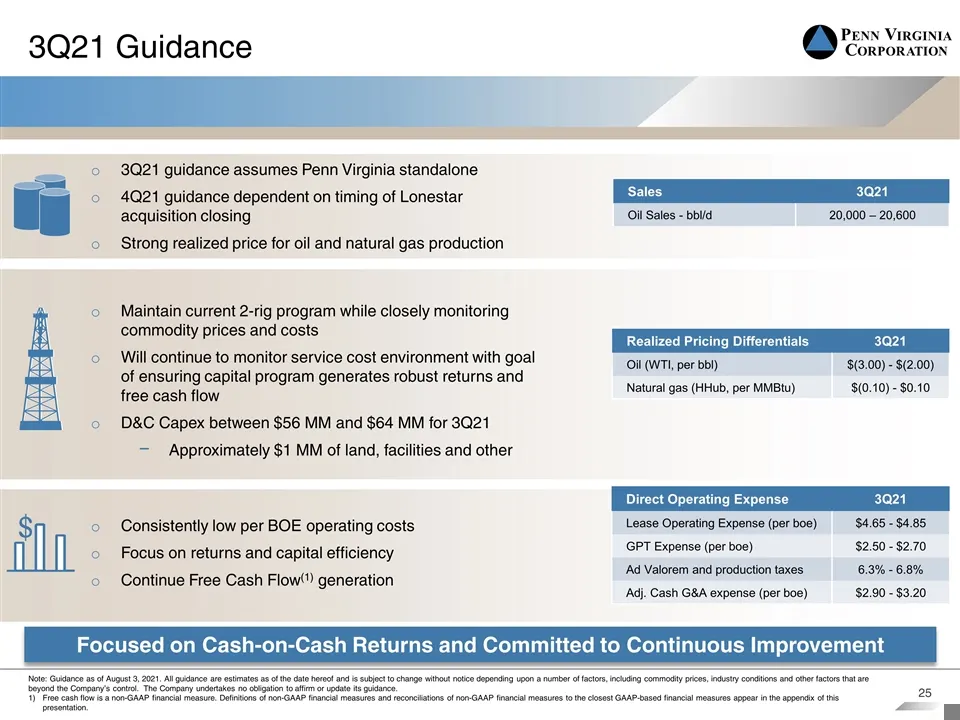
3Q21 Guidance Focused on Cash-on-Cash Returns and Committed to Continuous Improvement Note: Guidance as of August 3, 2021. All guidance are estimates as of the date hereof and is subject to change without notice depending upon a number of factors, including commodity prices, industry conditions and
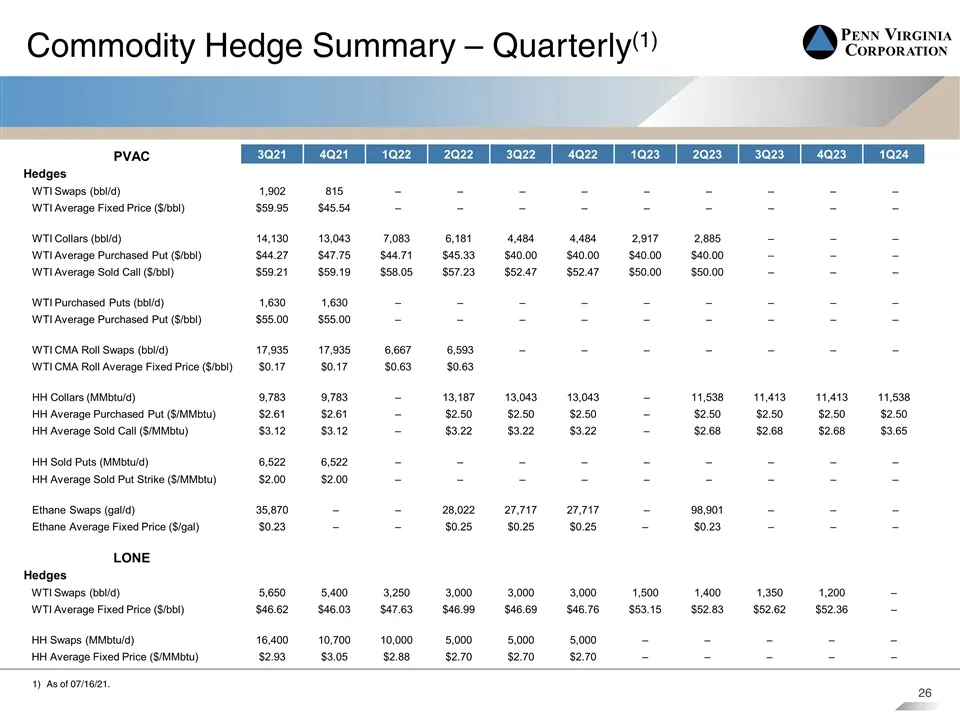
Slide 26: PVAC Commodity Hedge Summary
PVAC 3Q21 4Q21 1Q22 2Q22 3Q22 4Q22 1Q23 2Q23 3Q23 4Q23 1Q24 Hedges WTI Swaps (bbl/d) 1,902 815 – – – – – – – – – WTI Average Fixed Price ($/bbl) $59.95 $45.54 – – – – – – – – – WTI Collars (bbl/d) 14,130 13,043 7,083 6,181 4,484 4,484 2,917 2,885 – – – WTI Average Purchased Put ($/bbl) $44.27 $47.75
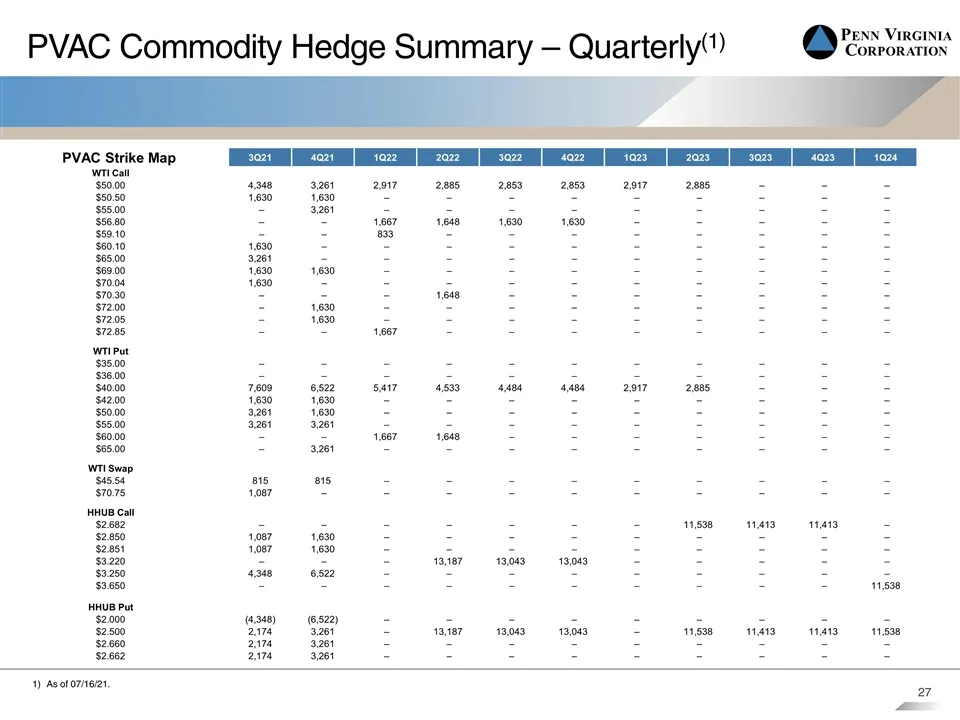
Slide 27: PVAC Commodity Hedge Summary – Quarterly
PVAC Commodity Hedge Summary – Quarterly(1) As of 07/16/21. PVAC Strike Map 3Q21 4Q21 1Q22 2Q22 3Q22 4Q22 1Q23 2Q23 3Q23 4Q23 1Q24 WTI Call $50.00 4,348 3,261 2,917 2,885 2,853 2,853 2,917 2,885 – – – $50.50 1,630 1,630 – – – – – – – – – $55.00 – 3,261 – – – – – – – – – $56.80 – – 1,667 1,648 1,630
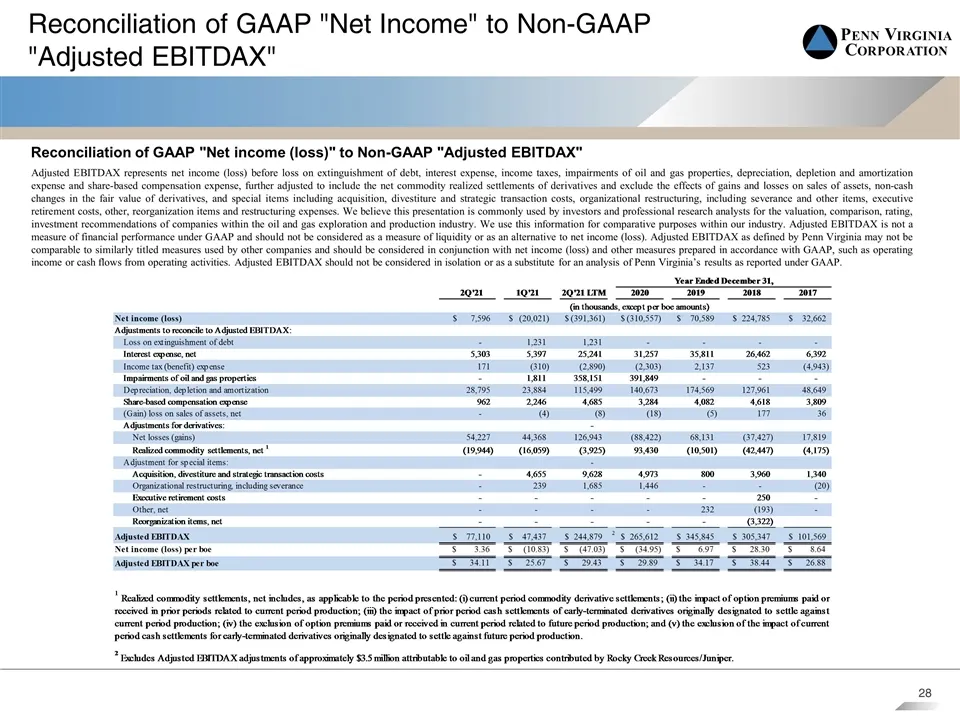
Slide 28: Reconciliation of GAAP Net Income to Non-GAAP Adjusted EBITDAX
Reconciliation of GAAP "Net Income" to Non-GAAP "Adjusted EBITDAX" Reconciliation of GAAP "Net income (loss)" to Non-GAAP "Adjusted EBITDAX" Adjusted EBITDAX represents net income (loss) before loss on extinguishment of debt, interest expense, income taxes, impairments of oil and gas properties, dep
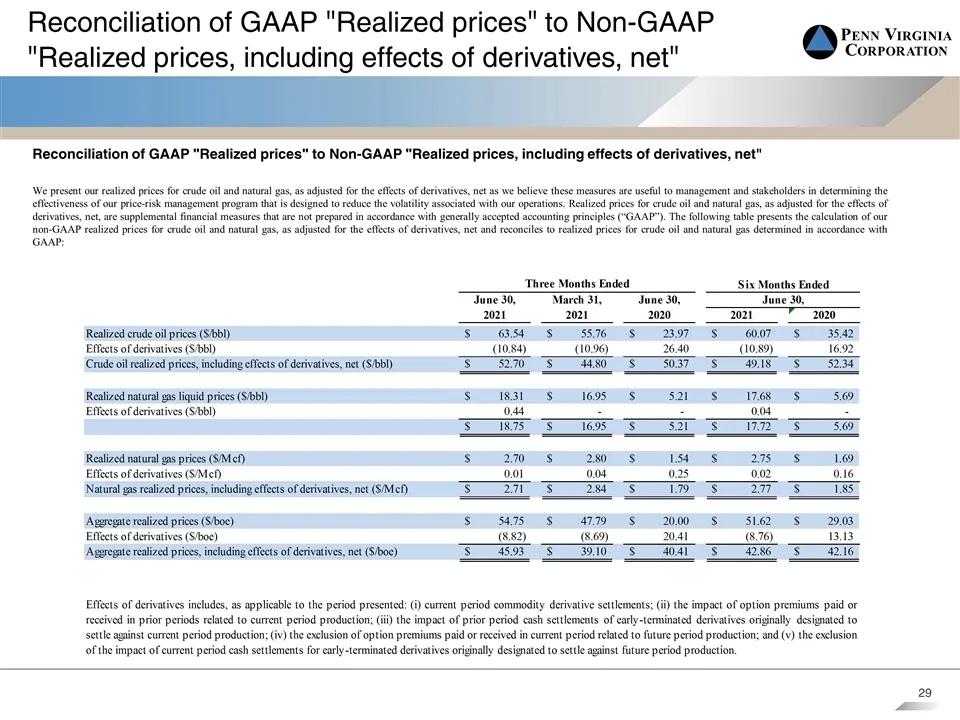
Slide 29: Reconciliation of GAAP Realized Prices to Non-GAAP
Reconciliation of GAAP "Realized prices" to Non-GAAP "Realized prices, including effects of derivatives, net" Reconciliation of GAAP "Realized prices" to Non-GAAP "Realized prices, including effects of derivatives, net" We present our realized prices for crude oil and natural gas, as adjusted for th
Slide 30: Definition of Net Debt
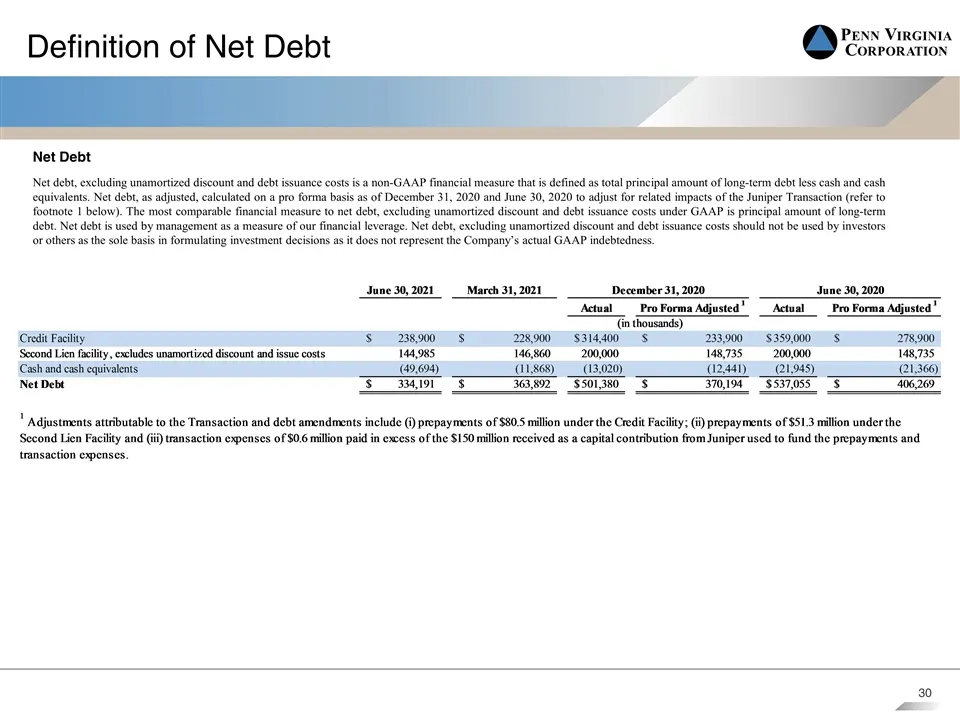
Definition of Net Debt Net Debt Net debt, excluding unamortized discount and debt issuance costs is a non-GAAP financial measure that is defined as total principal amount of long-term debt less cash and cash equivalents. Net debt, as adjusted, calculated on a pro forma basis as of December 31, 2020
Slide 31: Non-GAAP Reconciliation – PV-10
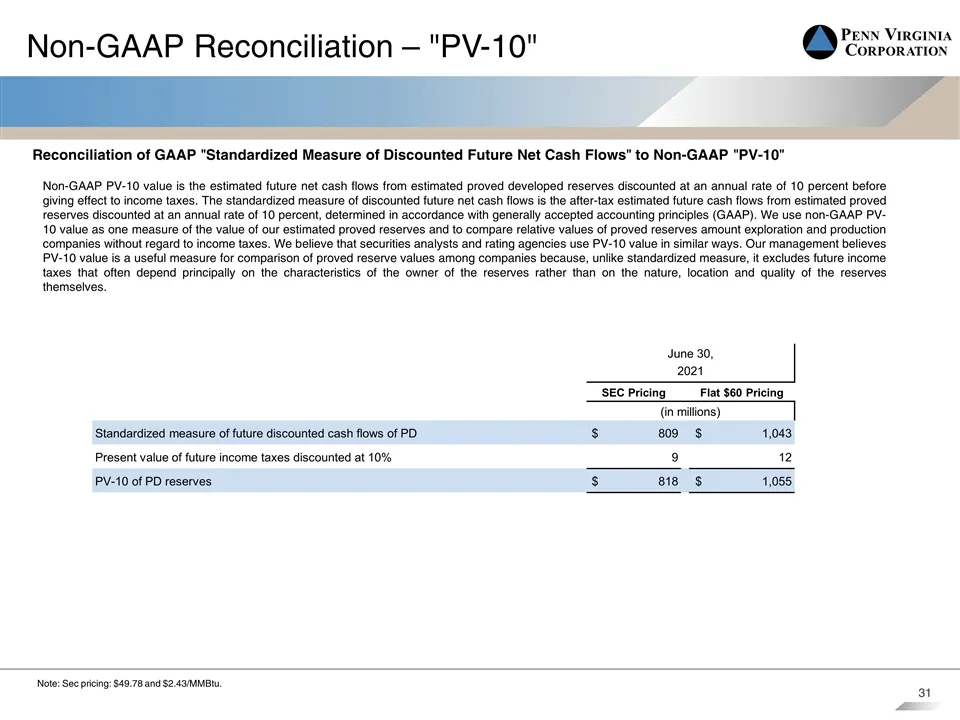
Non-GAAP Reconciliation – "PV-10" Reconciliation of GAAP "Standardized Measure of Discounted Future Net Cash Flows" to Non-GAAP "PV-10" Non-GAAP PV-10 value is the estimated future net cash flows from estimated proved developed reserves discounted at an annual rate of 10 percent before giving effect
Slide 32: Reconciliation of PV-10 and Adjusted PV-10 – Proved Developed Reserves
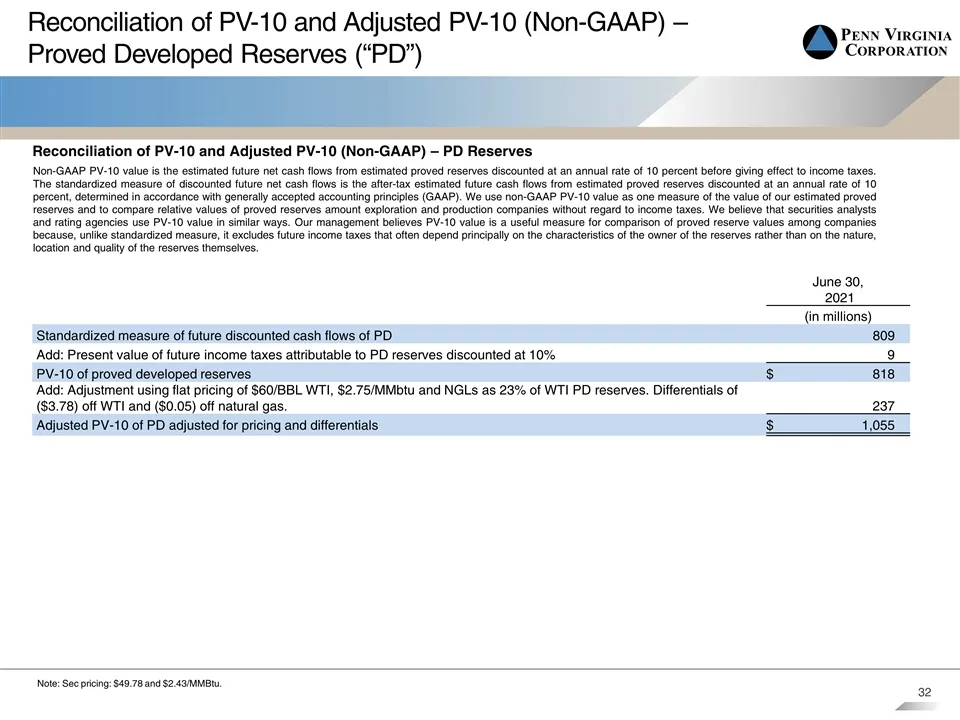
Reconciliation of PV-10 and Adjusted PV-10 (Non-GAAP) – Proved Developed Reserves (“PD”) June 30, 2021 (in millions) Standardized measure of future discounted cash flows of PD 809 Add: Present value of future income taxes attributable to PD reserves discounted at 10% 9 PV-10 of proved developed rese
Source: SEC EDGAR · 425 filed Sep 10, 2021
More decks from Lonestar Resources US Inc
 Merger or Acquisition (August 2021)31 slides · Aug 16, 2021
 Merger or Acquisition (July 2021)21 slides · Jul 13, 2021
 Merger or Acquisition (July 2021)17 slides · Jul 13, 2021
 Q1 2021 Earnings Presentation21 slides · May 12, 2021
 Investor Presentation (September 2020)5 slides · Sep 15, 2020
 Investor Presentation (February 2020)24 slides · Feb 12, 2020