Capita plc · LSE:CPI
Capita — H1 2008 Earnings Presentation
53 slides from Capita's earnings presentation, 2008
Slide 1: Results for the 6 months to 30 June 2008
Results for the 6 months to 30 June 2008
Slide 2: Agenda
Agenda Introduction: Paul Pindar, Chief Executive Financial results: Gordon Hurst, Group Finance Director Fuelling growth: Paul Pindar, Chief Executive Operational performance: Simon Pilling, Joint Chief Operating Officer Prospects: Paul Pindar, Chief Executive
Slide 3: Highlights
Highlights Excellent organic growth Strong sustainable margins Consistent, strong operating cash flow Sales wins at £813m in first 7 months Buoyant, growing bid pipeline Highly active market place “A consistent strategy, consistently applied”
Slide 4: Financial results
Financial results Gordon Hurst Group Finance Director
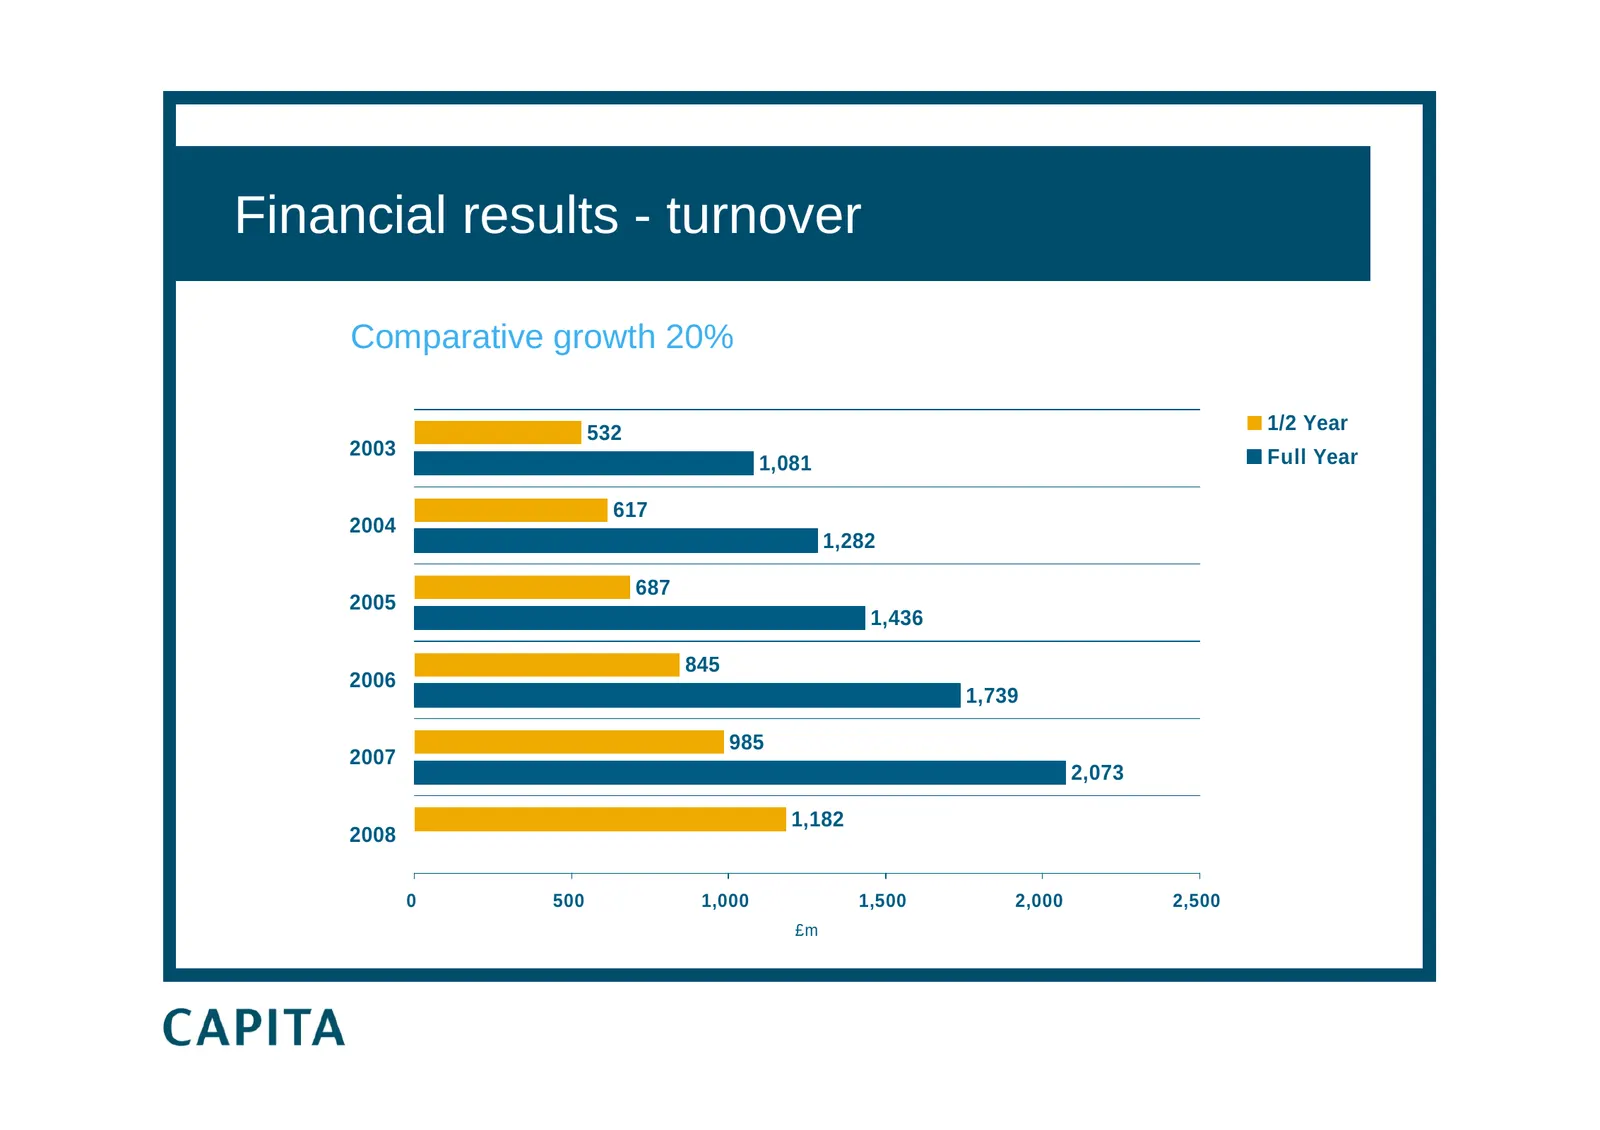
Slide 5: Financial results - turnover
Financial results - turnover Comparative growth 20% 532 1/2 Year 2003 Full Year 1,081 617 2004 1,282 687 2005 1,436 845 2006 1,739 985 2007 2,073 1,182 2008 0 500 1,000 1,500 2,000 2,500 £m
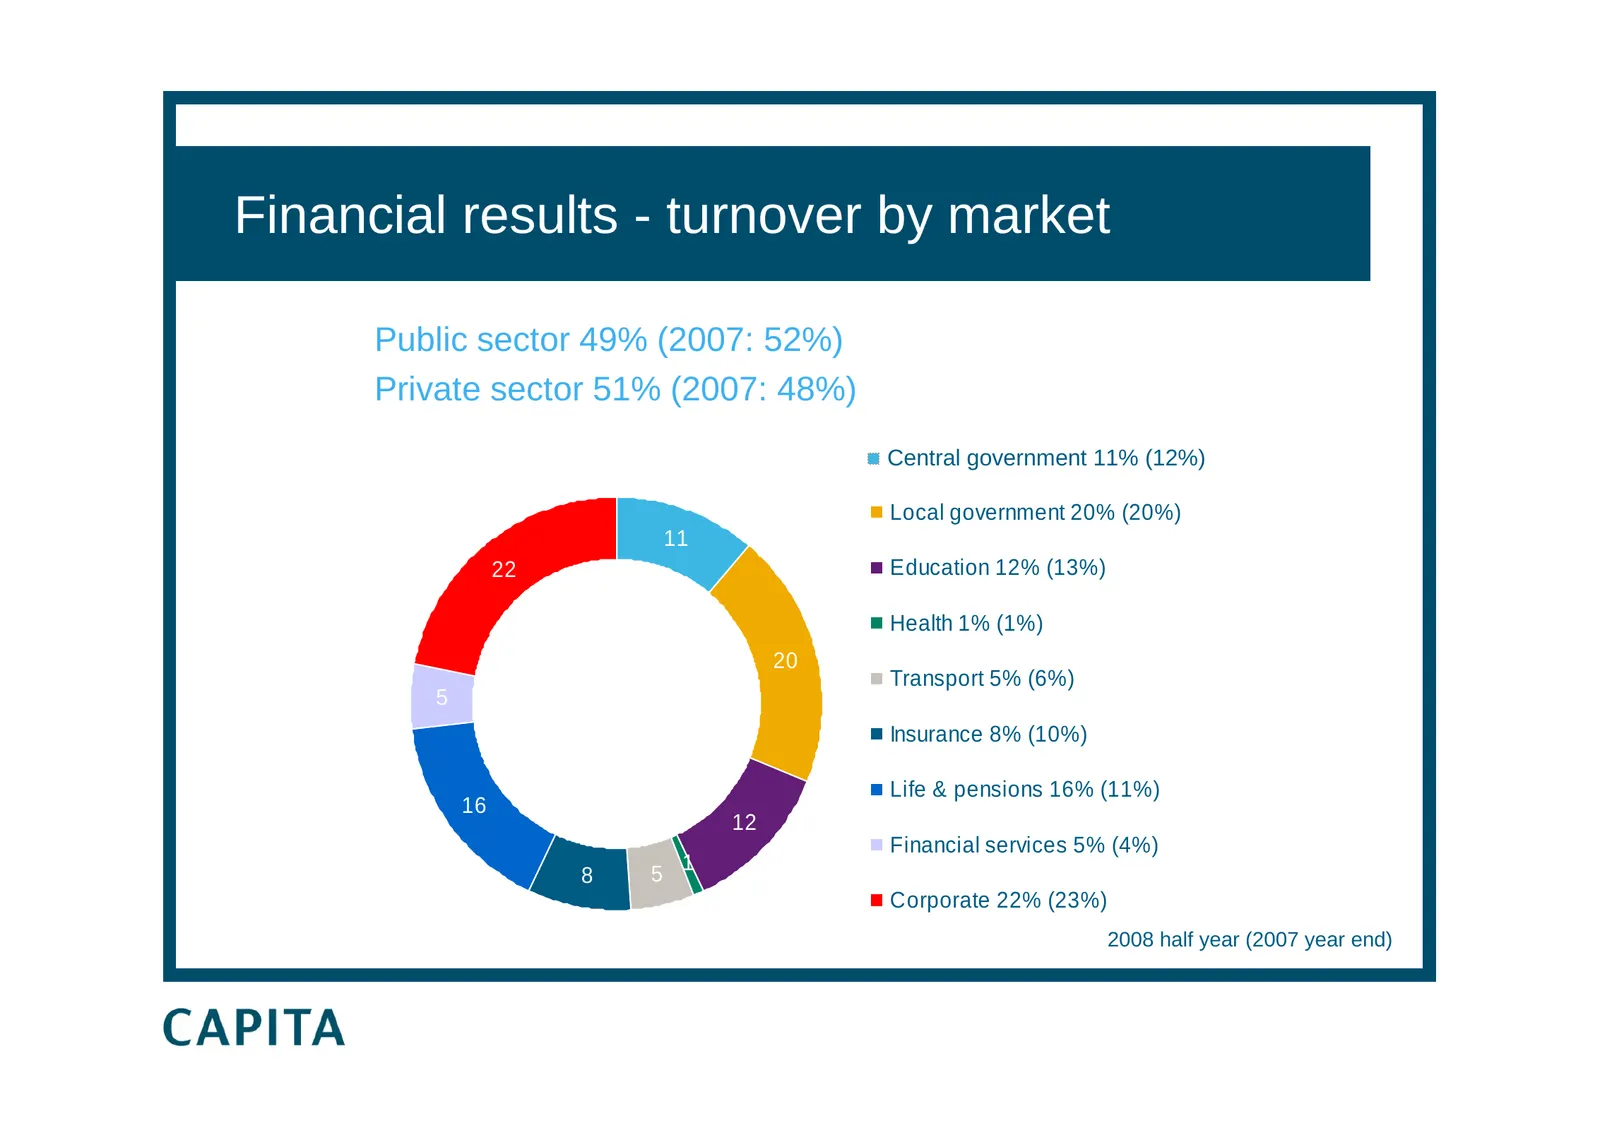
Slide 6: Financial results - turnover by market
Financial results - turnover by market Public sector 49% (2007: 52%) Private sector 51% (2007: 48%) Central government 11% (12%) Local government 20% (20%) 11 22 Education 12% (13%) Health 1% (1%) 20 Transport 5% (6%) 5 Insurance 8% (10%) Life & pensions 16% (11%) 16 12 Financial services 5% (4%) 1
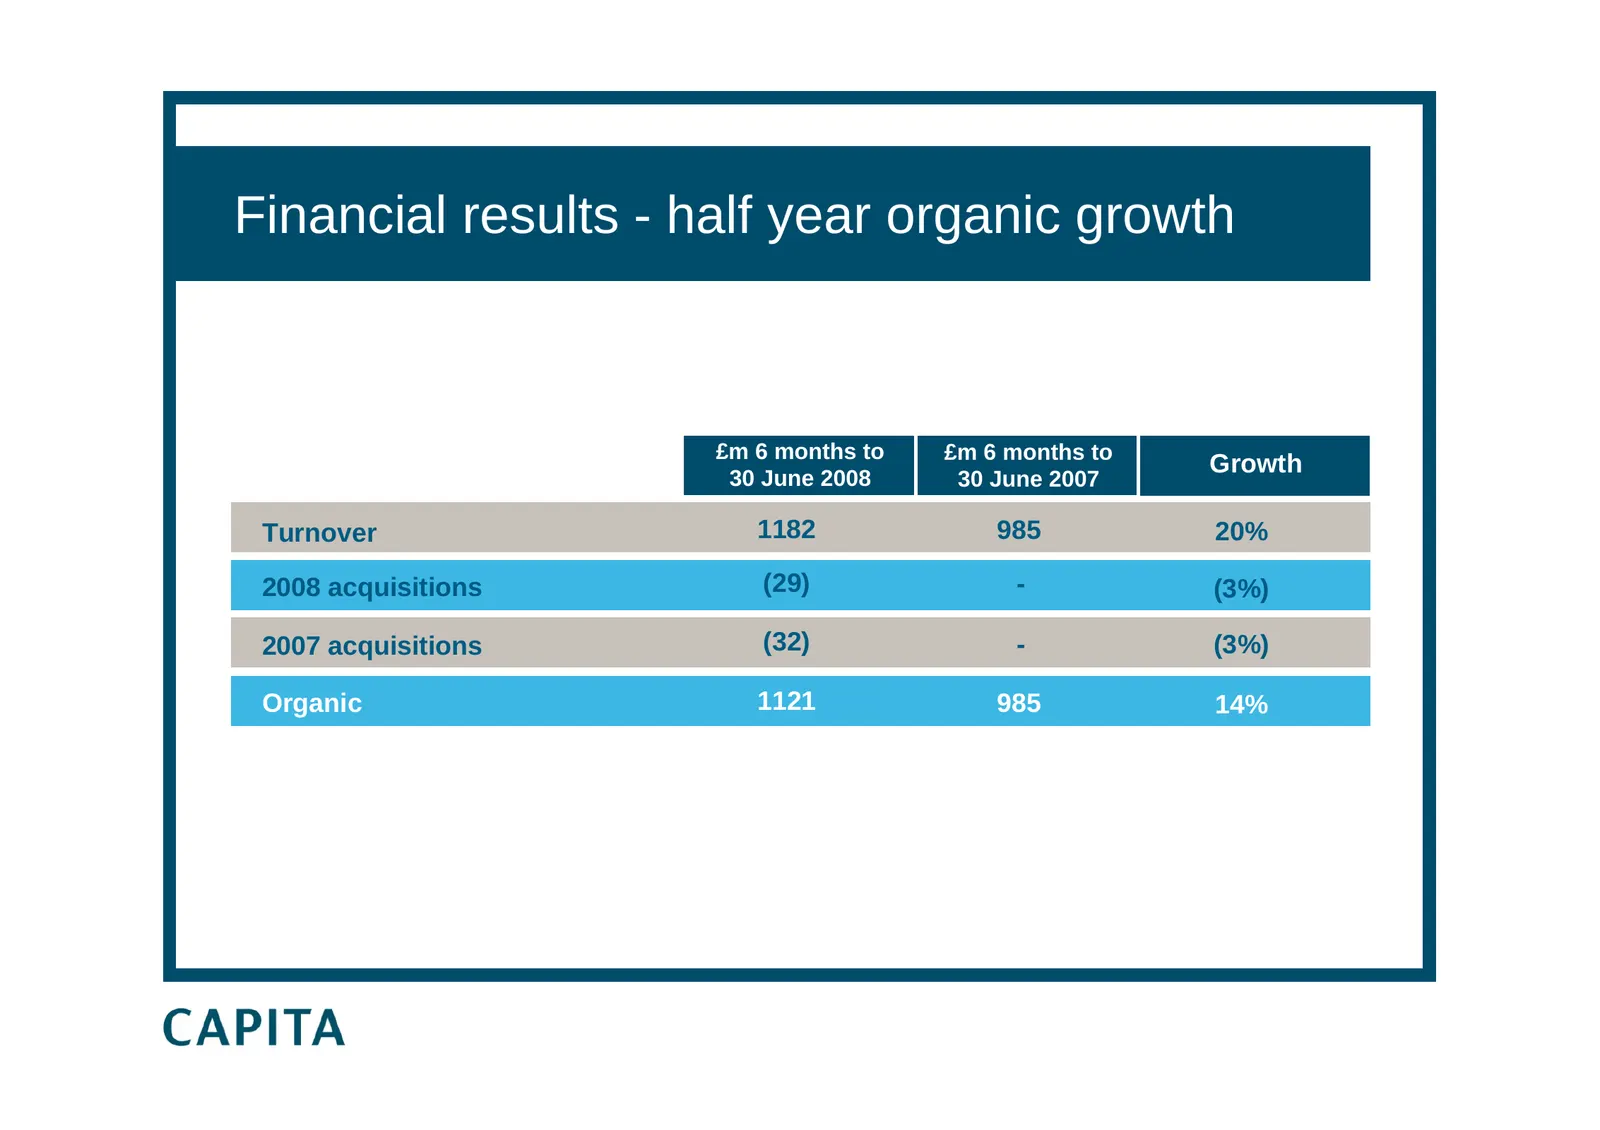
Slide 7: Financial results - half year organic growth
Financial results - half year organic growth £m 6 months to £m 6 months to £m 20082008 £mJune 2007 Growth £m 2008 30 June 30 2007 Growth Turnover 1182 985 20% 2008 acquisitions (29) - (3%) 2007 acquisitions (32) 2001 (36) - 2003 2004 (3%) Organic 1121 985 14%
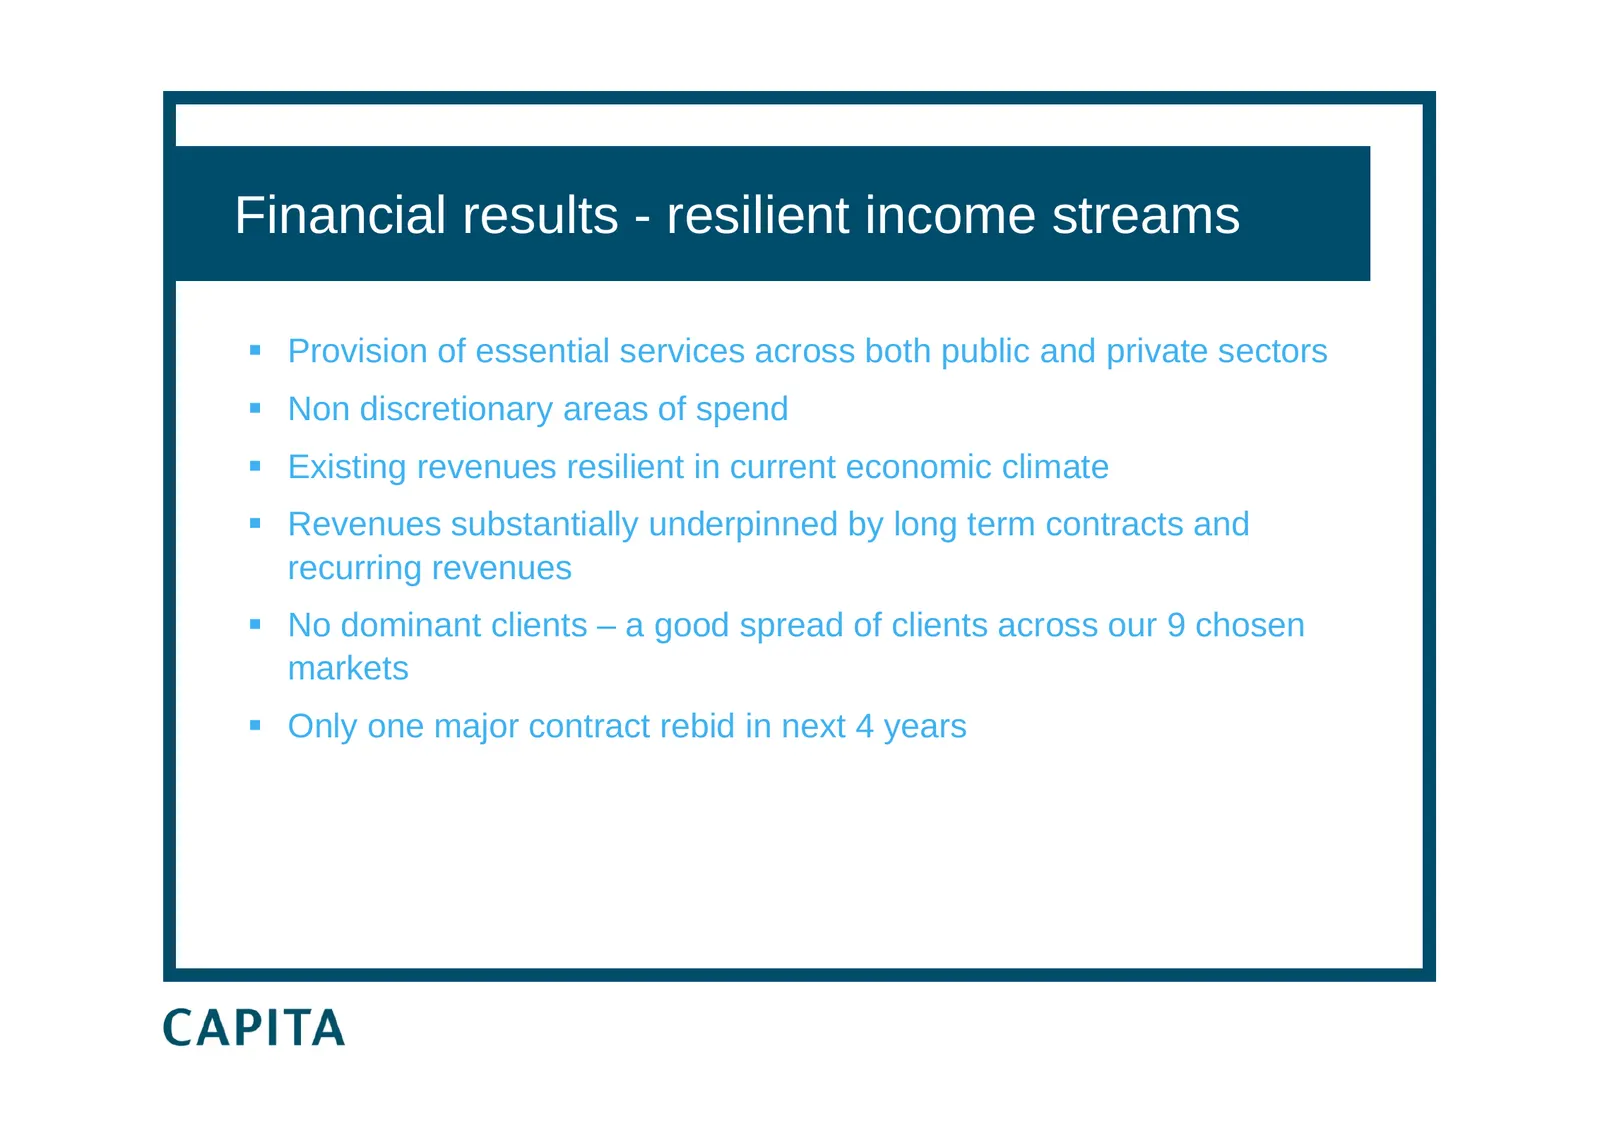
Slide 8: Financial results - resilient income streams
Financial results - resilient income streams Provision of essential services across both public and private sectors Non discretionary areas of spend Existing revenues resilient in current economic climate Revenues substantially underpinned by long term contracts and recurring revenues No d
Slide 9: Financial results - profit before tax and amortisation
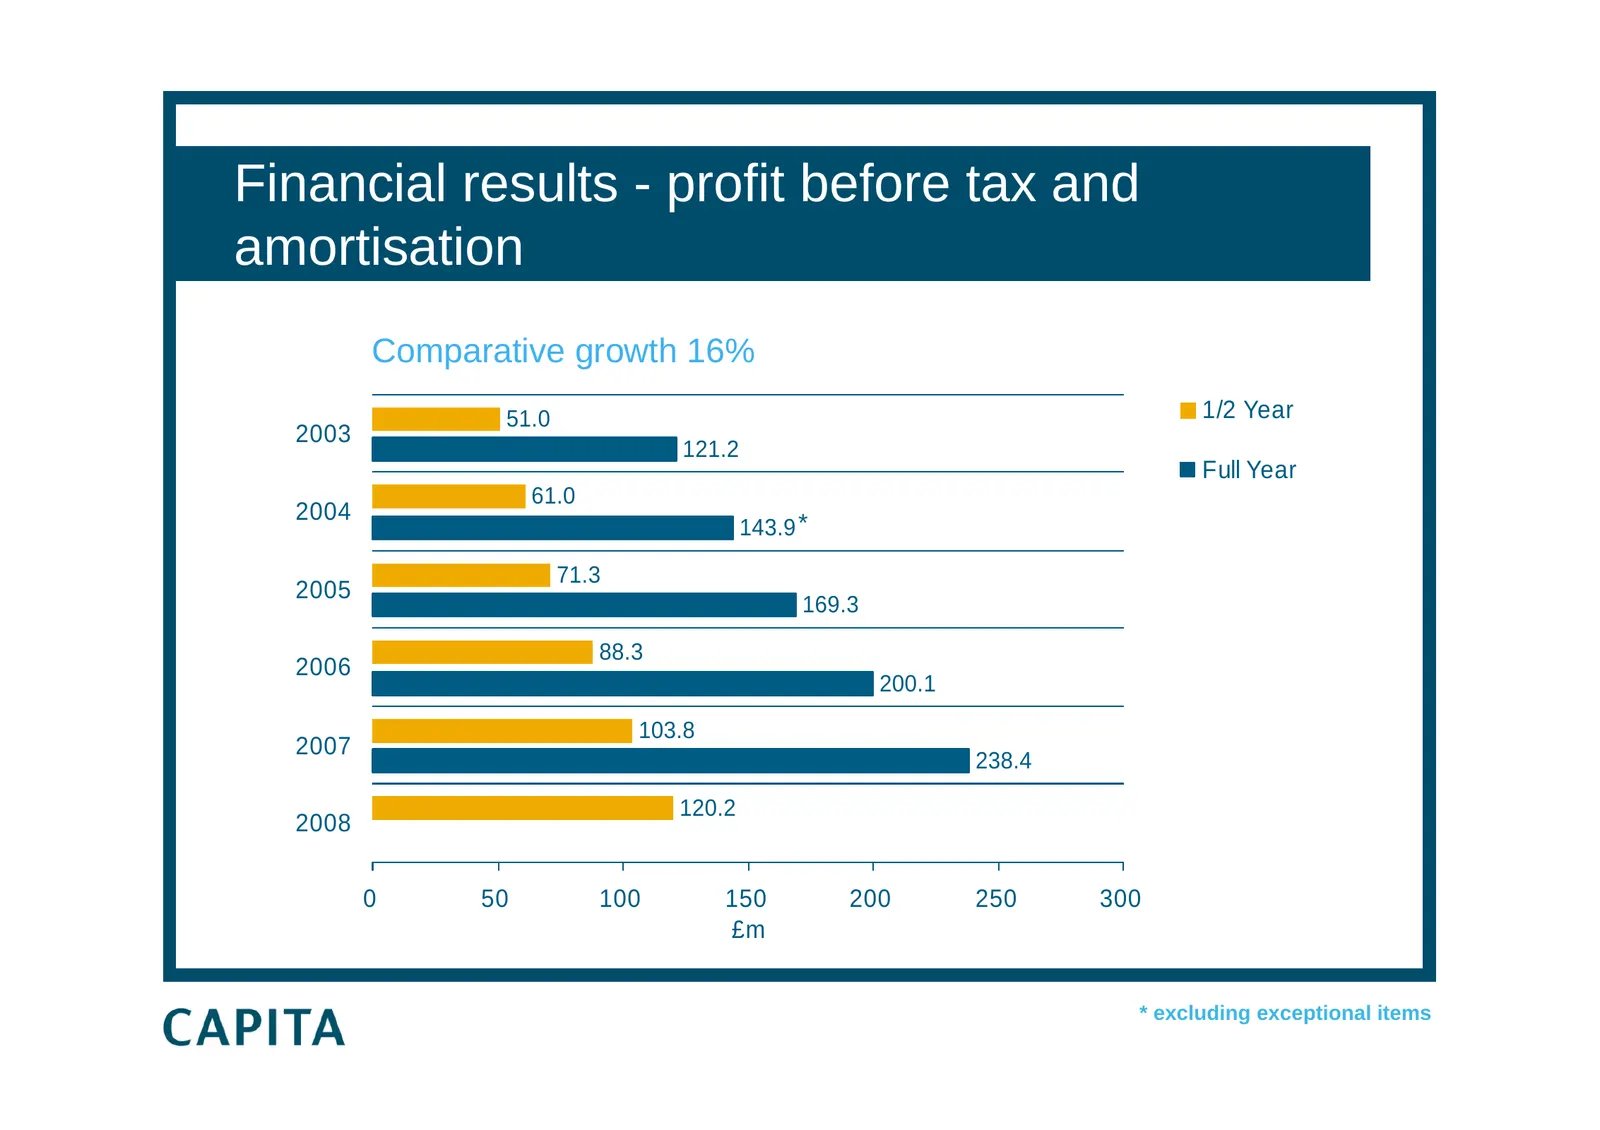
Financial results - profit before tax and amortisation Comparative growth 16% 51.0 1/2 Year 2003 121.2 Full Year 61.0 2004 143.9 * 71.3 2005 169.3 88.3 2006 200.1 103.8 2007 238.4 120.2 2008 0 50 100 150 200 250 300 £m * excluding exceptional items
Slide 10: Financial results - operating profit before amortisation
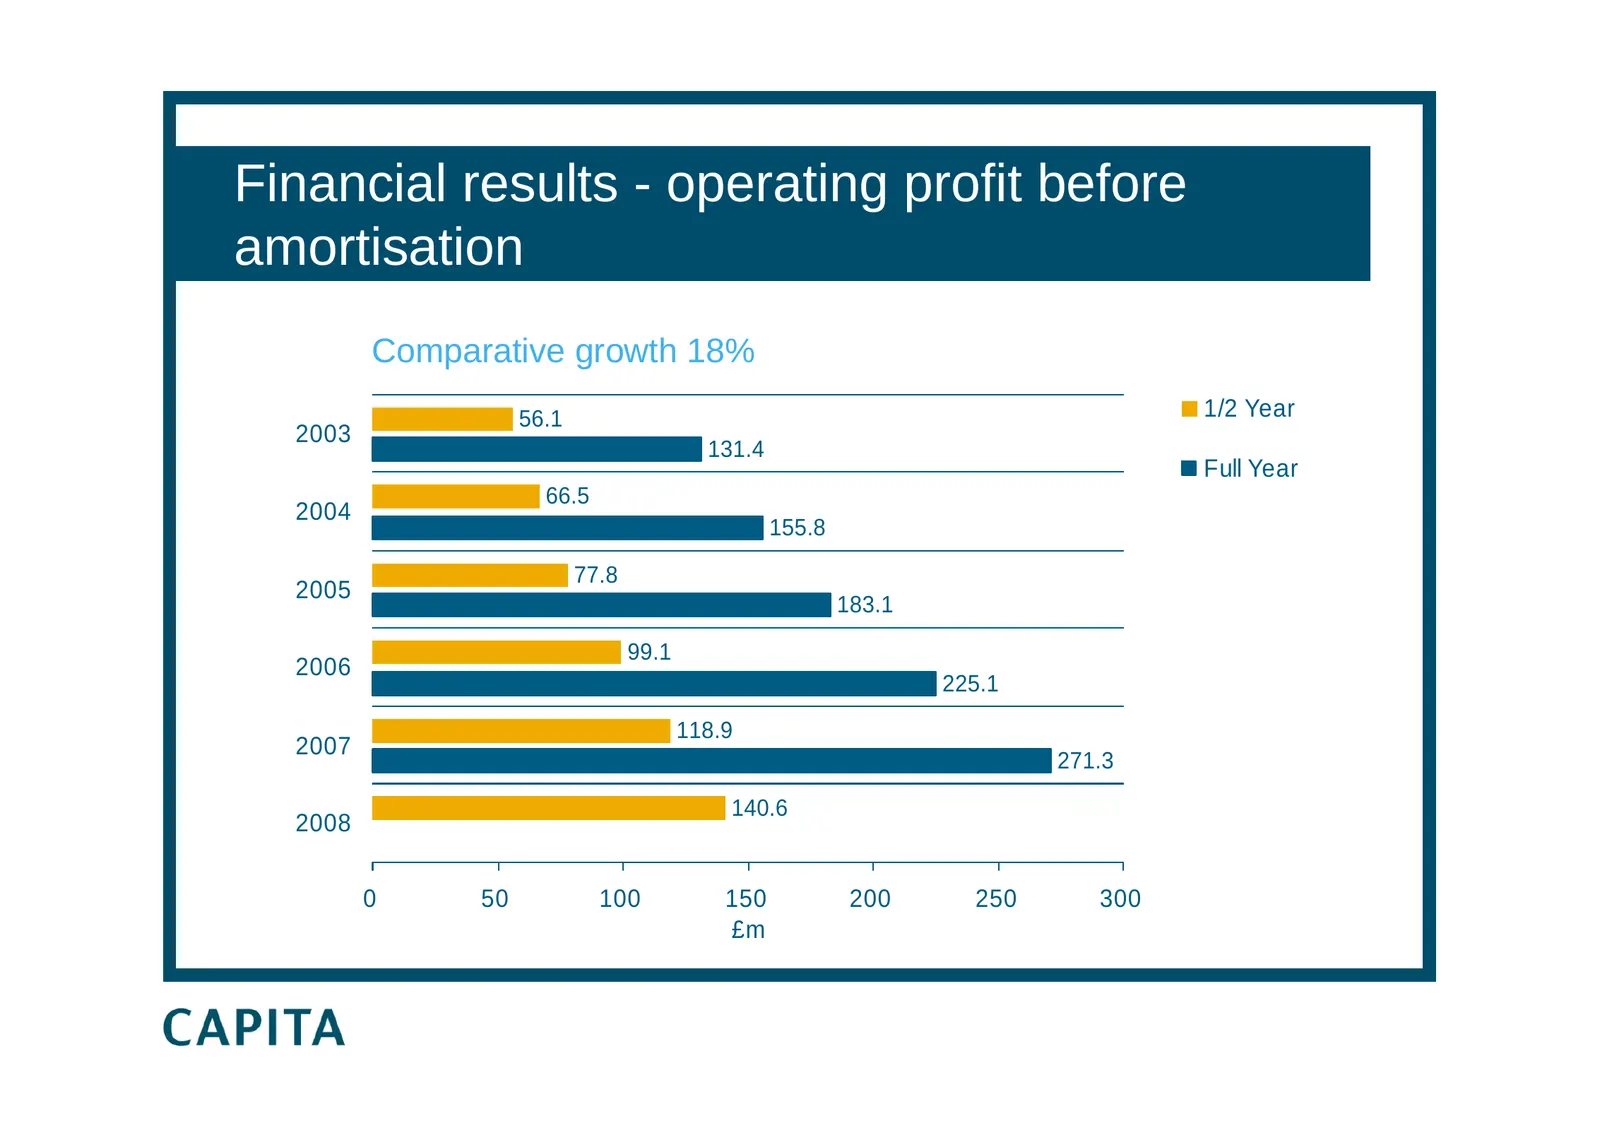
Financial results - operating profit before amortisation Comparative growth 18% 56.1 1/2 Year 2003 131.4 Full Year 66.5 2004 155.8 77.8 2005 183.1 99.1 2006 225.1 118.9 2007 271.3 140.6 2008 0 50 100 150 200 250 300 £m
Slide 11: Financial results - half year operating margin after share based payment
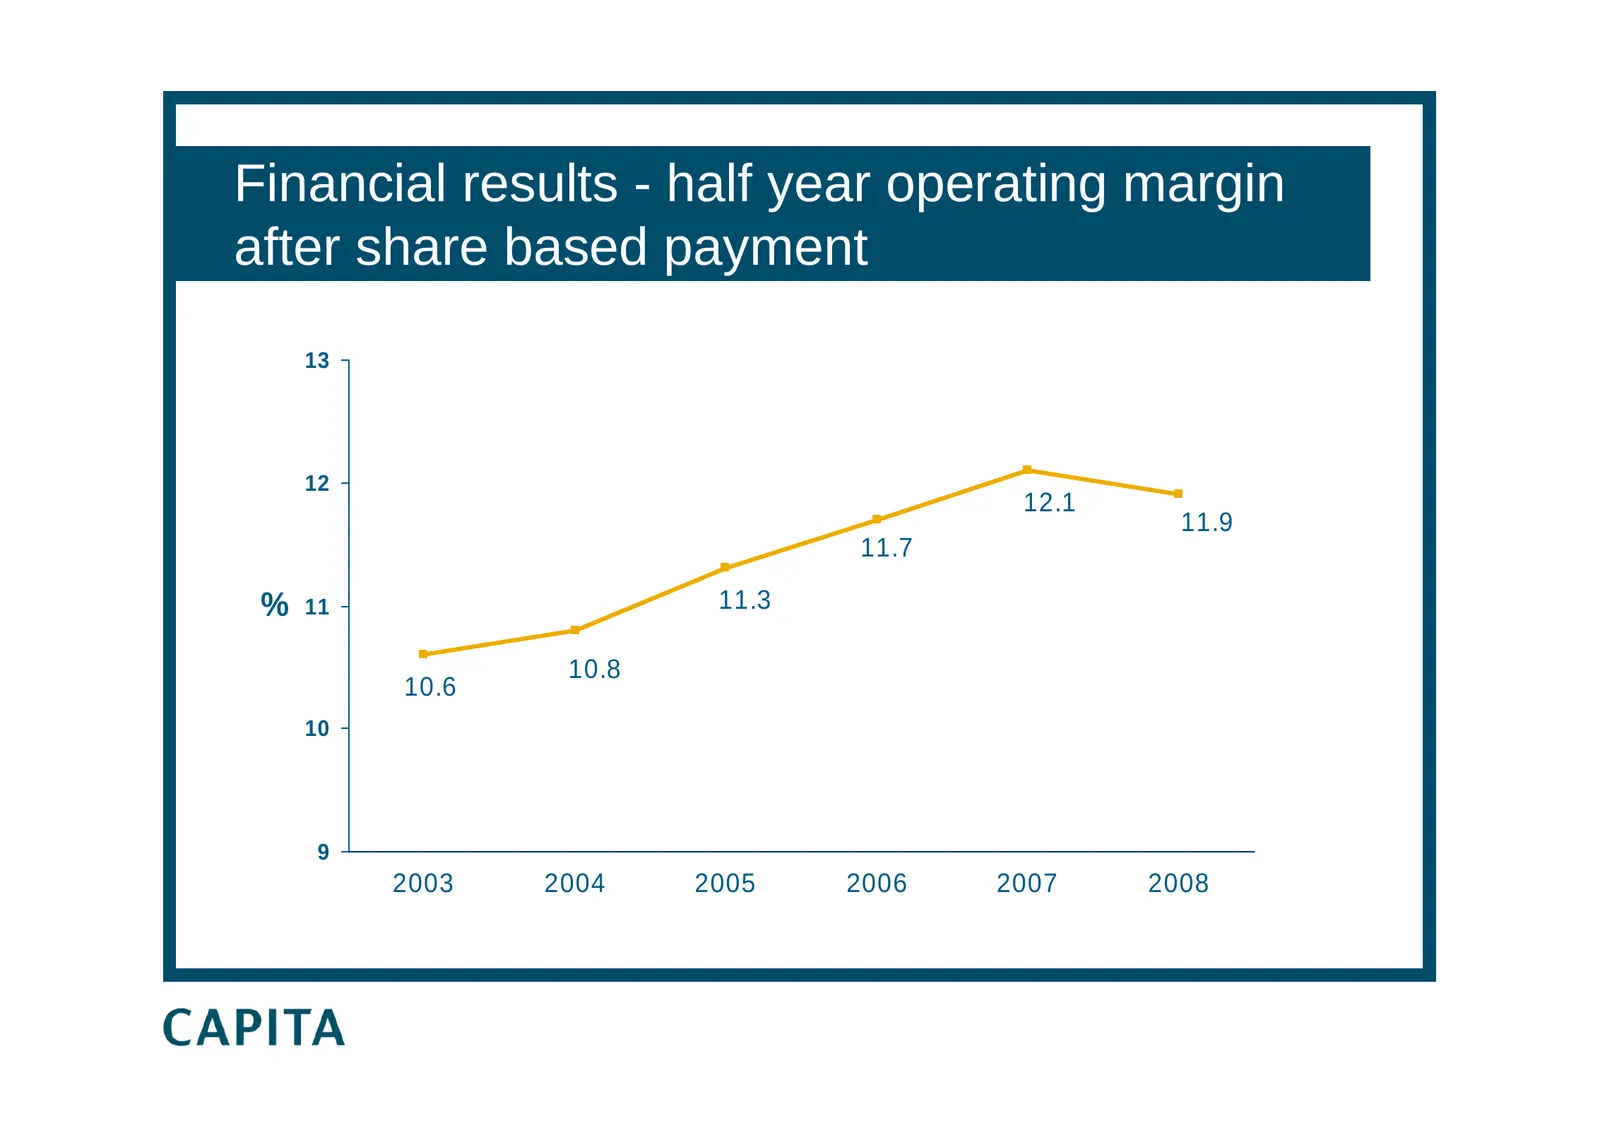
Financial results - half year operating margin after share based payment 13 12 12.1 11.9 11.7 % 11 11.3 10.8 10.6 10 9 2003 2004 2005 2006 2007 2008
Slide 12: Financial results - sustaining our margins
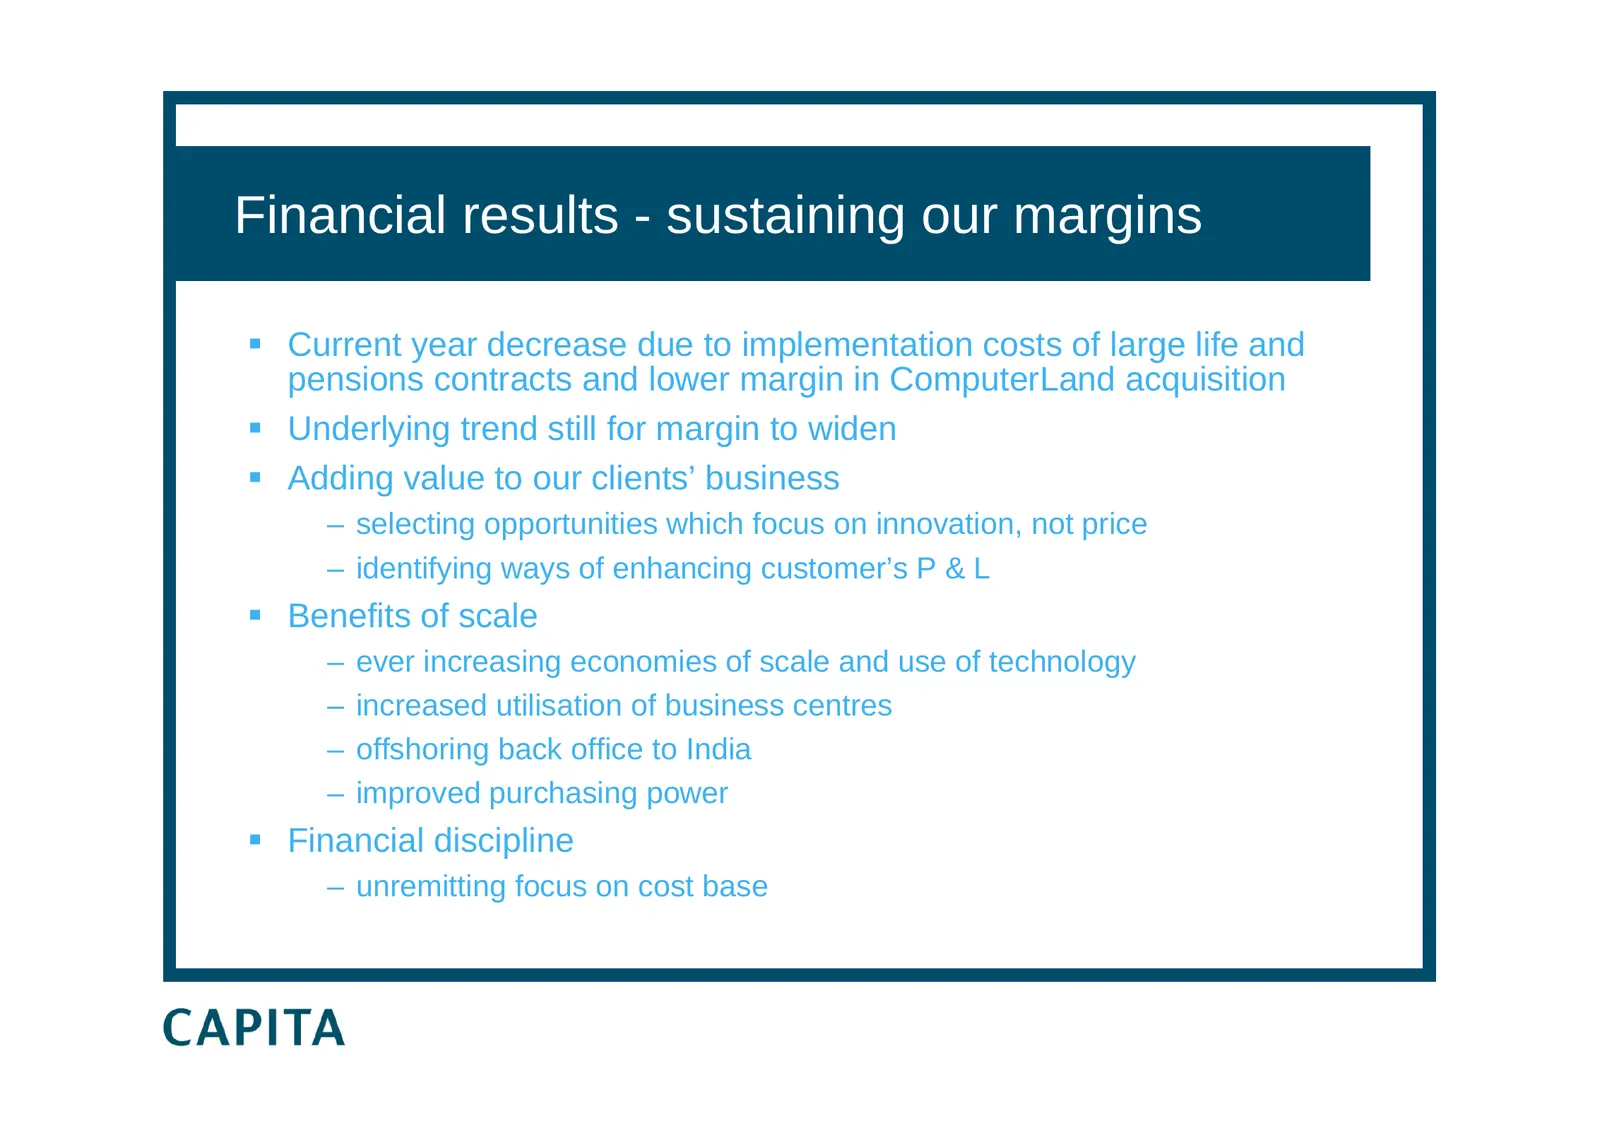
Financial results - sustaining our margins Current year decrease due to implementation costs of large life and pensions contracts and lower margin in ComputerLand acquisition Underlying trend still for margin to widen Adding value to our clients’ business – selecting opportunities which focus
Slide 13: Financial results - earnings per share before amortisation
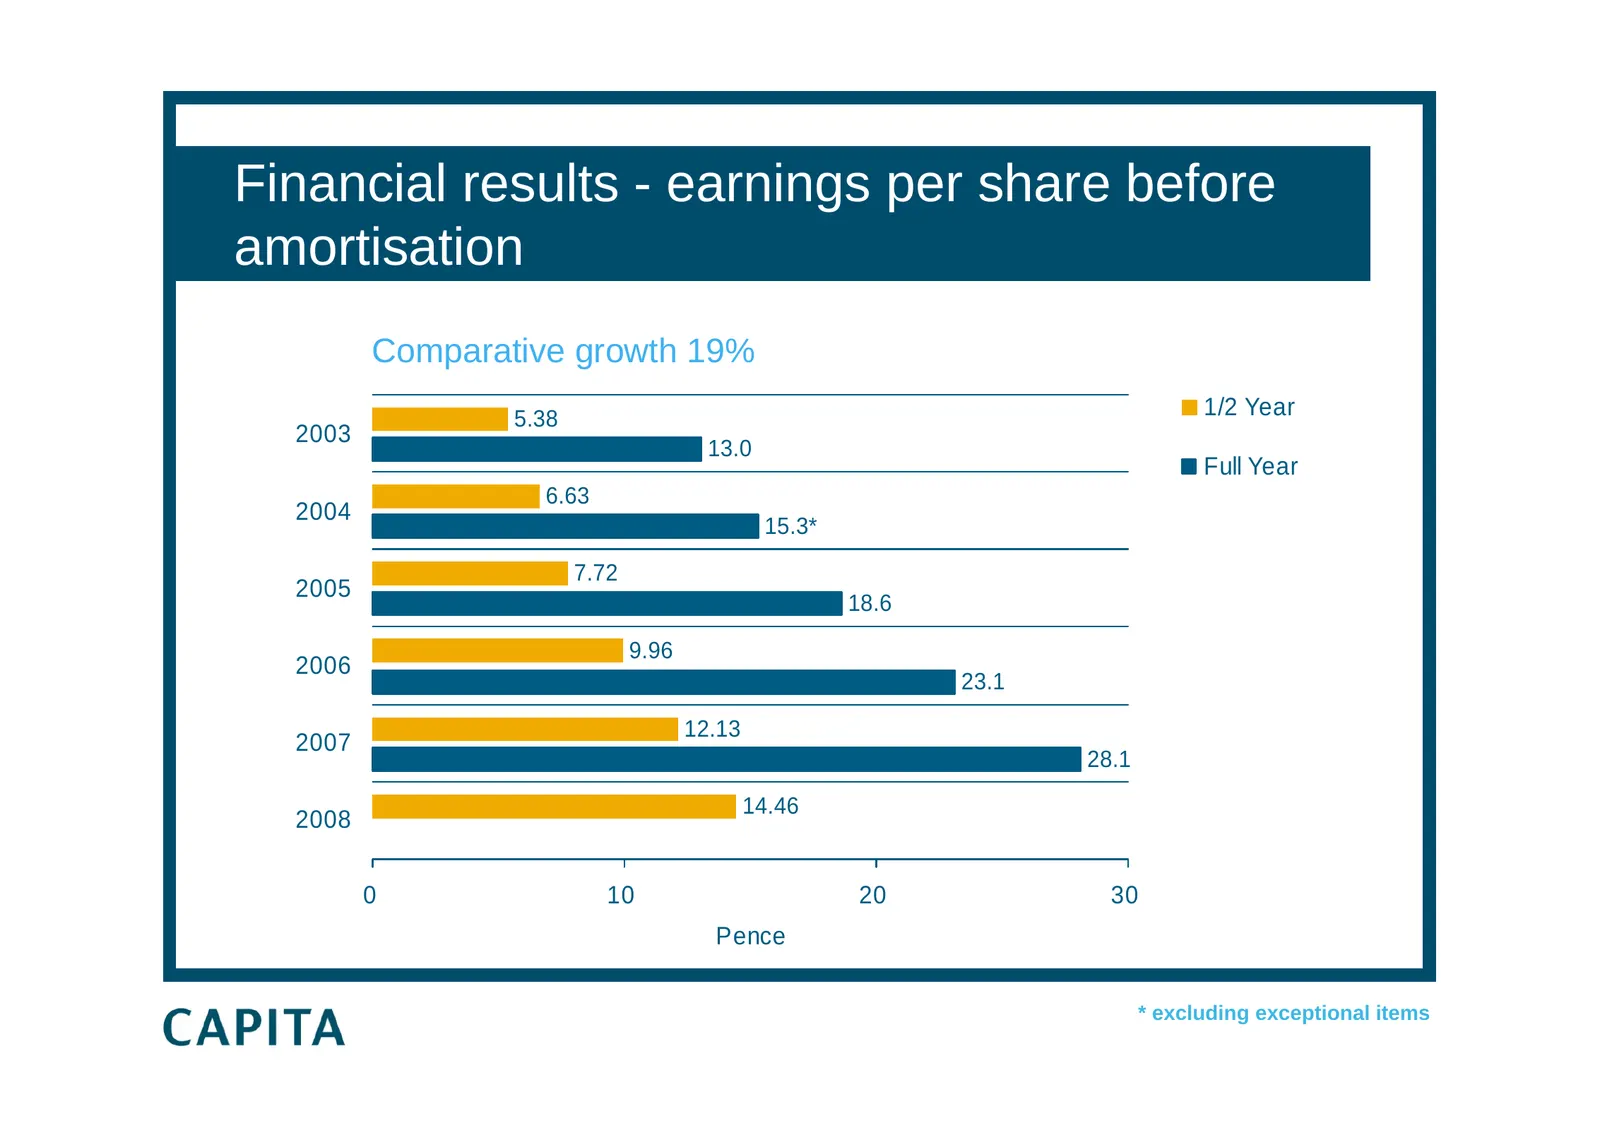
Financial results - earnings per share before amortisation Comparative growth 19% 5.38 1/2 Year 2003 13.0 Full Year 6.63 2004 15.3* 7.72 2005 18.6 9.96 2006 23.1 12.13 2007 28.1 14.46 2008 0 10 20 30 Pence * excluding exceptional items
Slide 14: Financial results - dividends
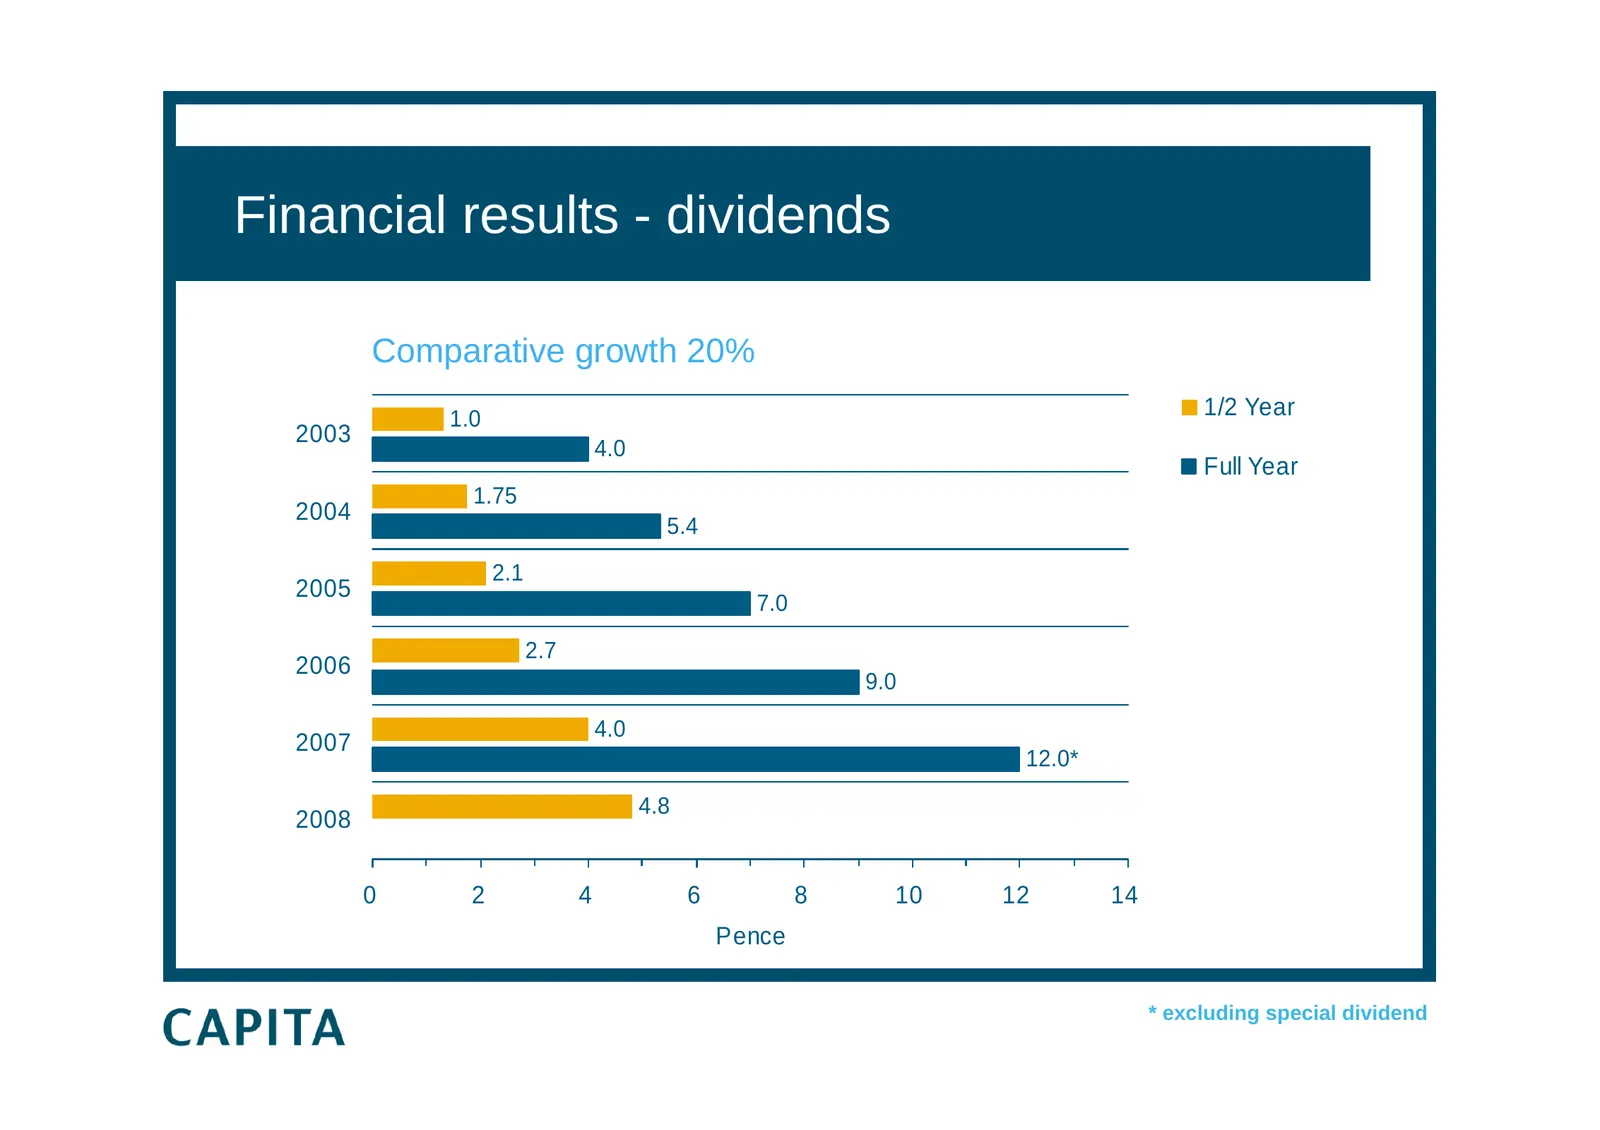
Financial results - dividends Comparative growth 20% 1.0 1/2 Year 2003 4.0 Full Year 1.75 2004 5.4 2.1 2005 7.0 2.7 2006 9.0 4.0 2007 12.0* 4.8 2008 0 2 4 6 8 10 12 14 Pence * excluding special dividend
Slide 15: Financial results - cash flow statement
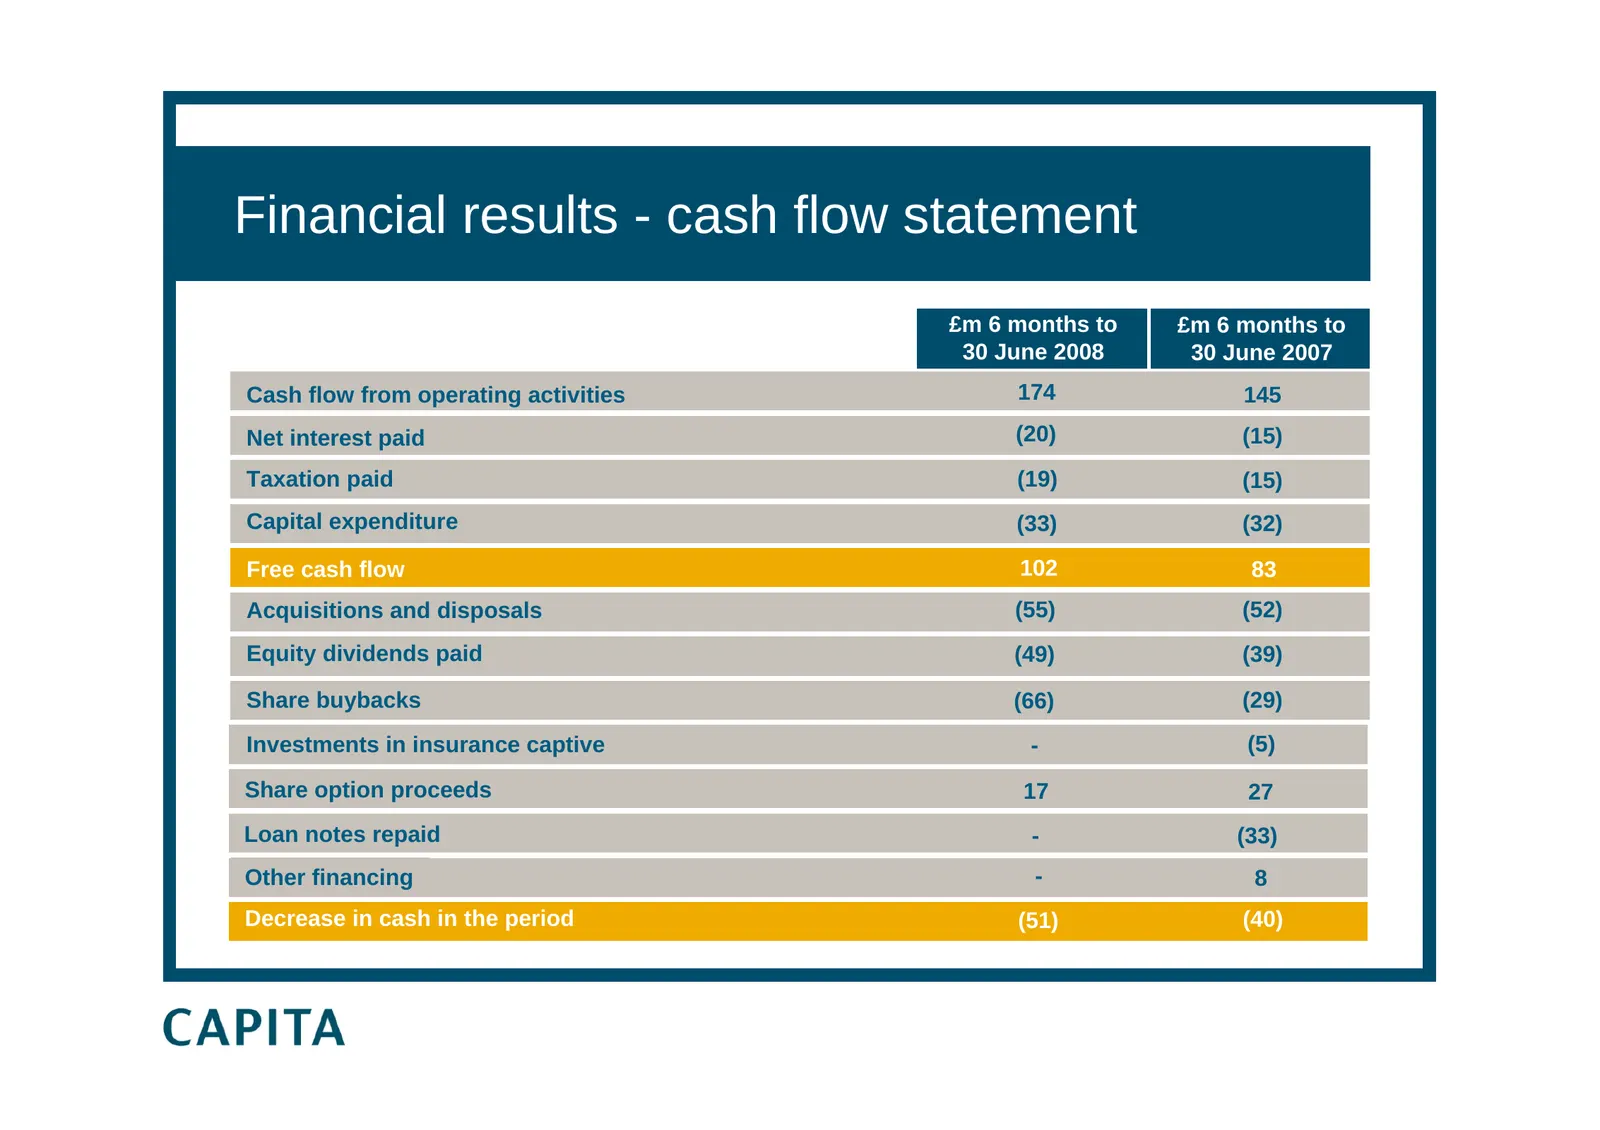
Financial results - cash flow statement £m 6 months to £m 6 months to 30 June 2008 30 June 2007 Cash flow from operating activities 174 145 Net interest paid (20) (15) Taxation paid (19) (15) Capital expenditure (33) (32) Free cash flow 102 83 Acquisitions and disposals (55) (52) Equity dividends pa
Slide 16: Financial results - cash flow from operating activities
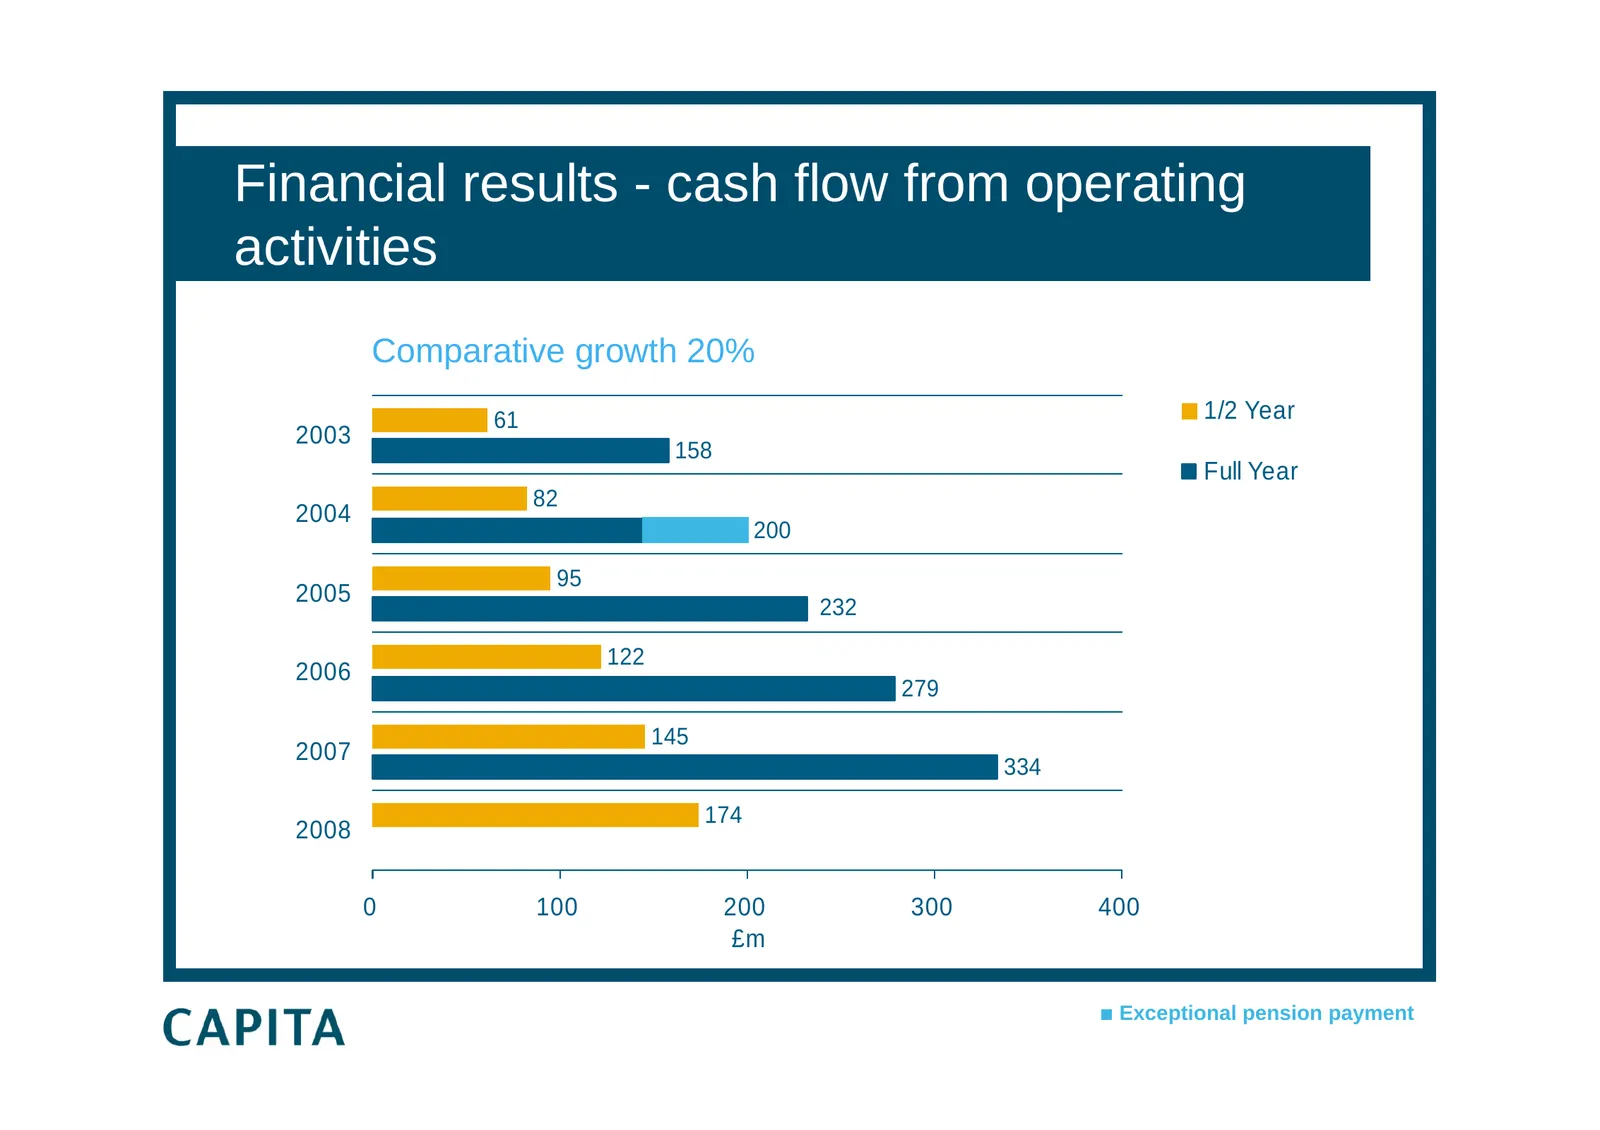
Financial results - cash flow from operating activities Comparative growth 20% 61 1/2 Year 2003 158 Full Year 82 2004 200 95 2005 232 122 2006 279 145 2007 334 174 2008 0 100 200 300 400 £m Exceptional pension payment
Slide 17: Financial results - free cash flow
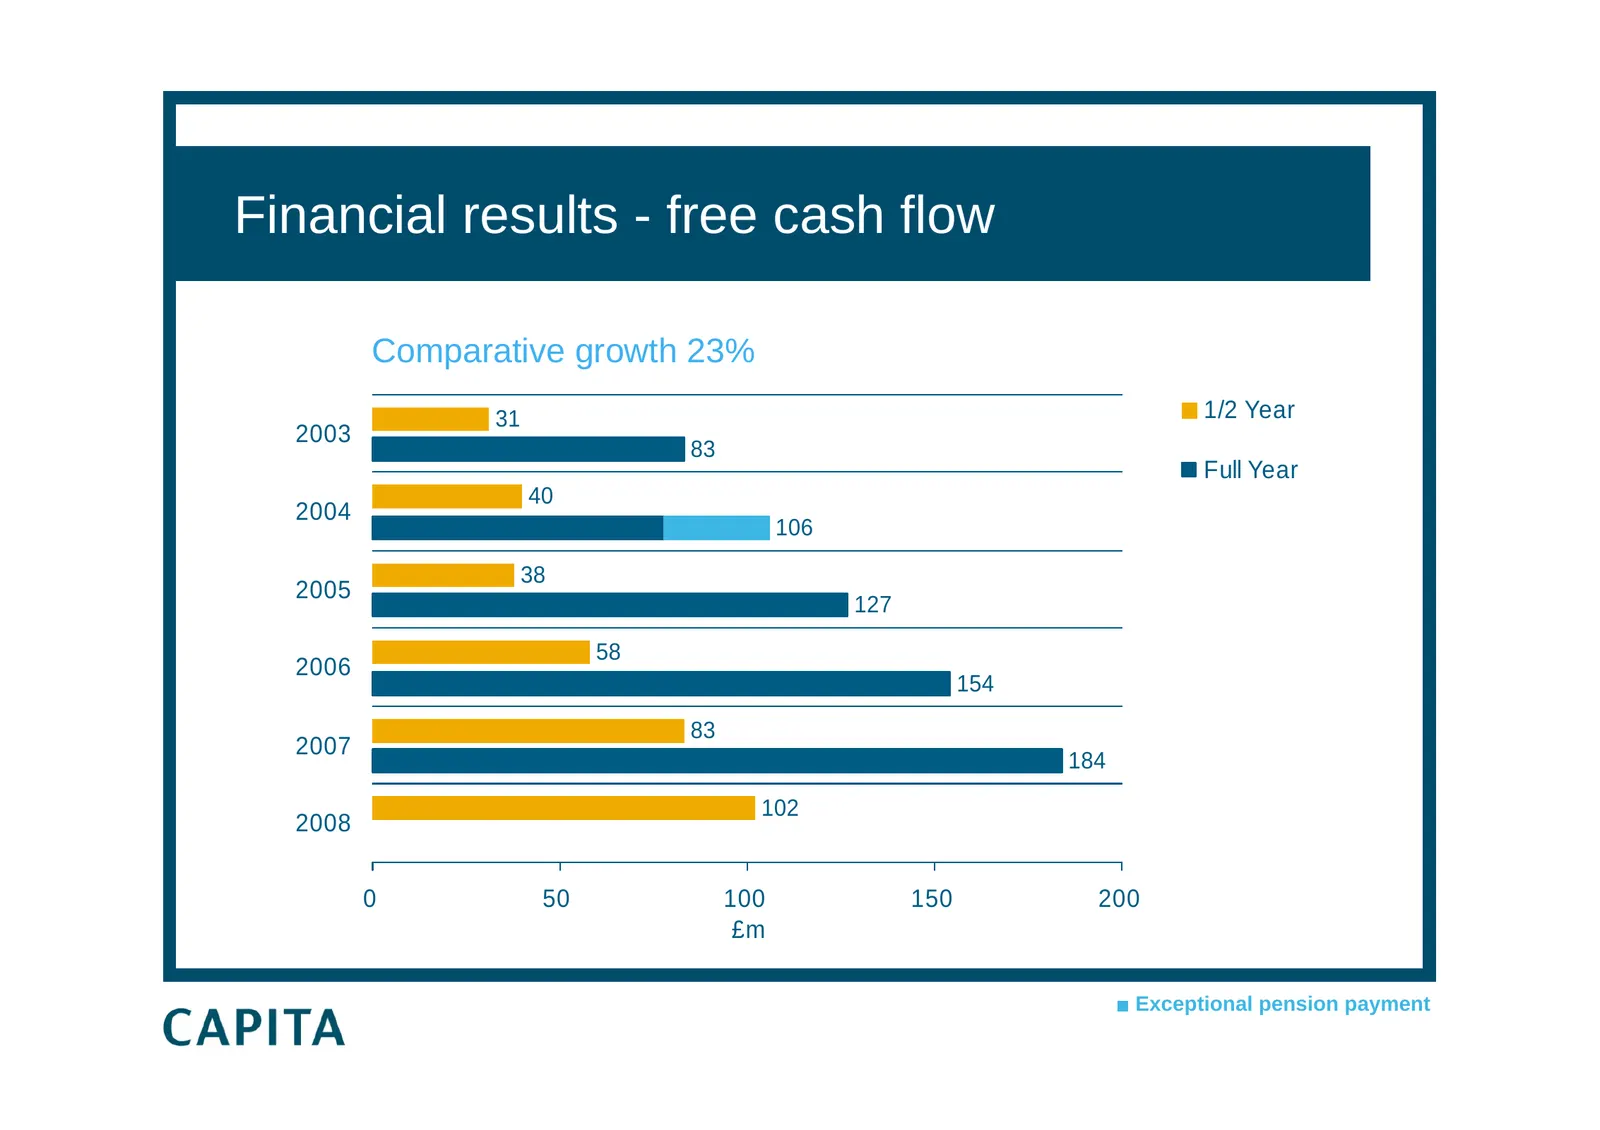
Financial results - free cash flow Comparative growth 23% 31 1/2 Year 2003 83 Full Year 40 2004 106 38 2005 127 58 2006 154 83 2007 184 102 2008 0 50 100 150 200 £m Exceptional pension payment
Slide 18: Financial results - half year capex as % of turnover
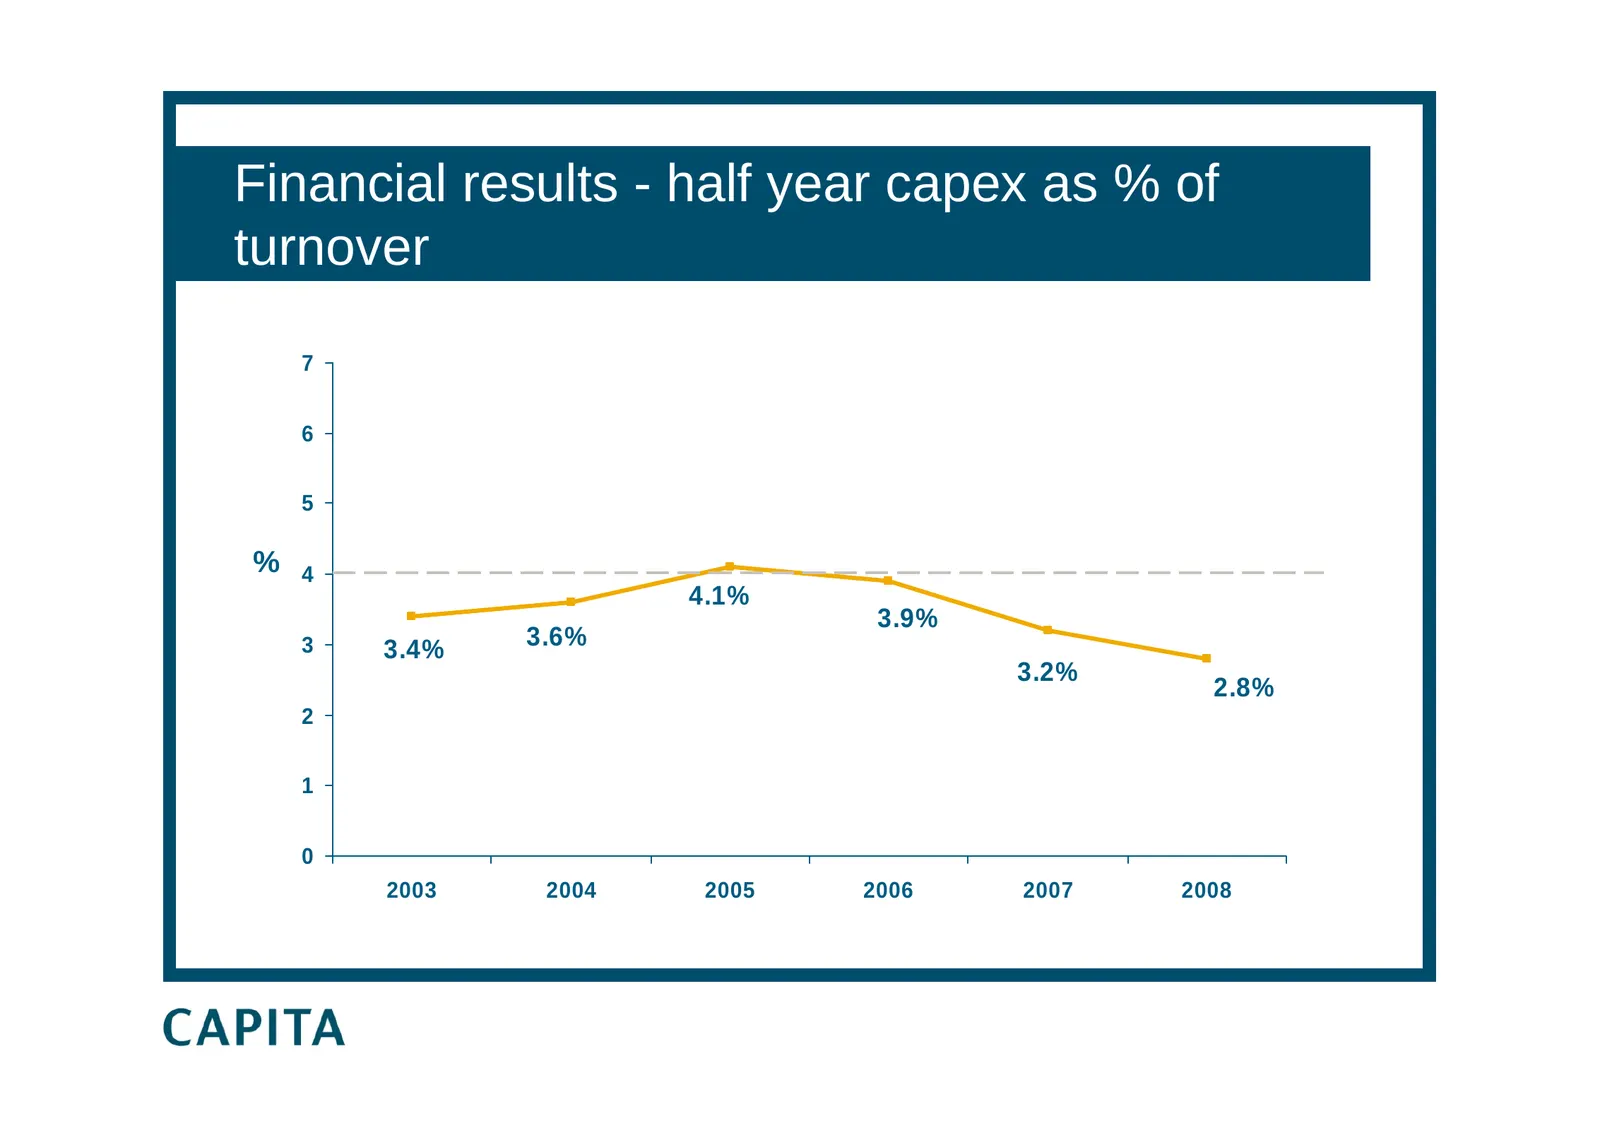
Financial results - half year capex as % of turnover 7 6 5 % 4 4.1% 3.9% 3 3.4% 3.6% 3.2% 2.8% 2 1 0 2003 2004 2005 2006 2007 2008
Slide 19: % net return on capital
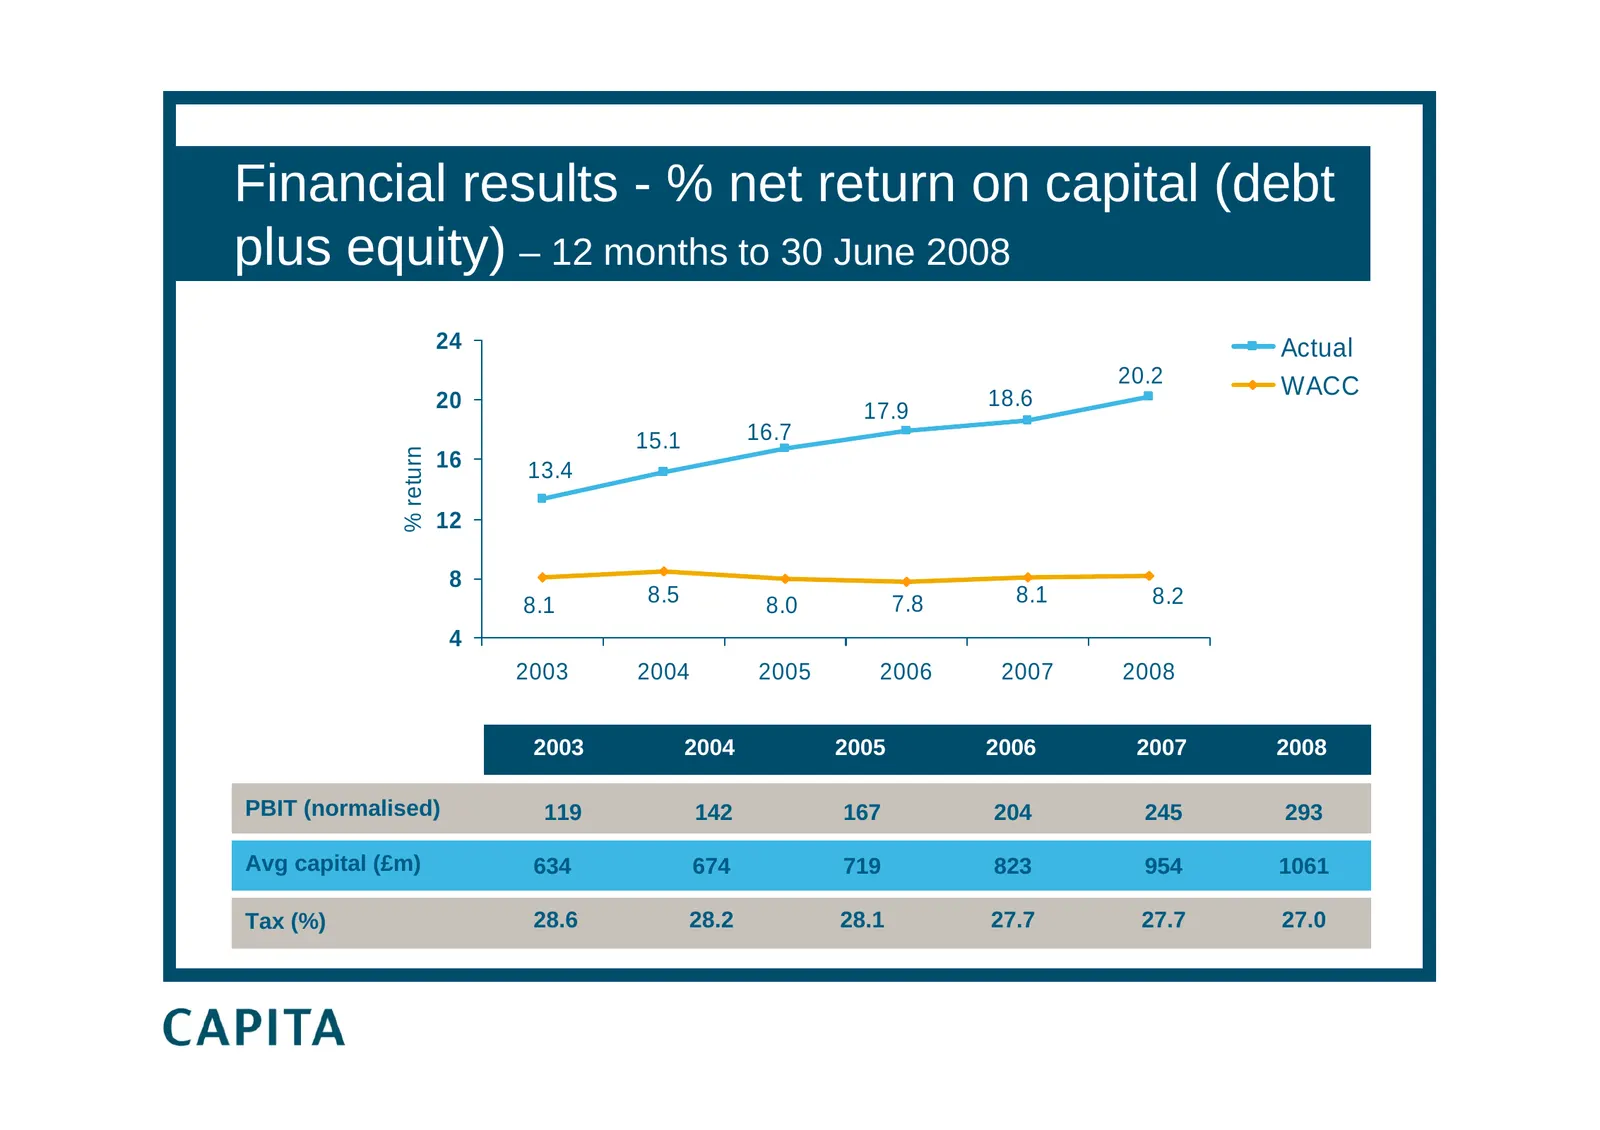
Financial results - % net return on capital (debt plus equity) – 12 months to 30 June 2008 24 Actual 20.2 WACC 20 18.6 17.9 15.1 16.7 % return 16 13.4 12 8 8.1 8.5 8.0 7.8 8.1 8.2 4 2003 2004 2005 2006 2007 2008 2003 2004 2005 2006 2007 2008 PBIT (normalised) 119 142 167 204 245 293 Avg capital (£m)
Slide 20: % free cash flow return on capital
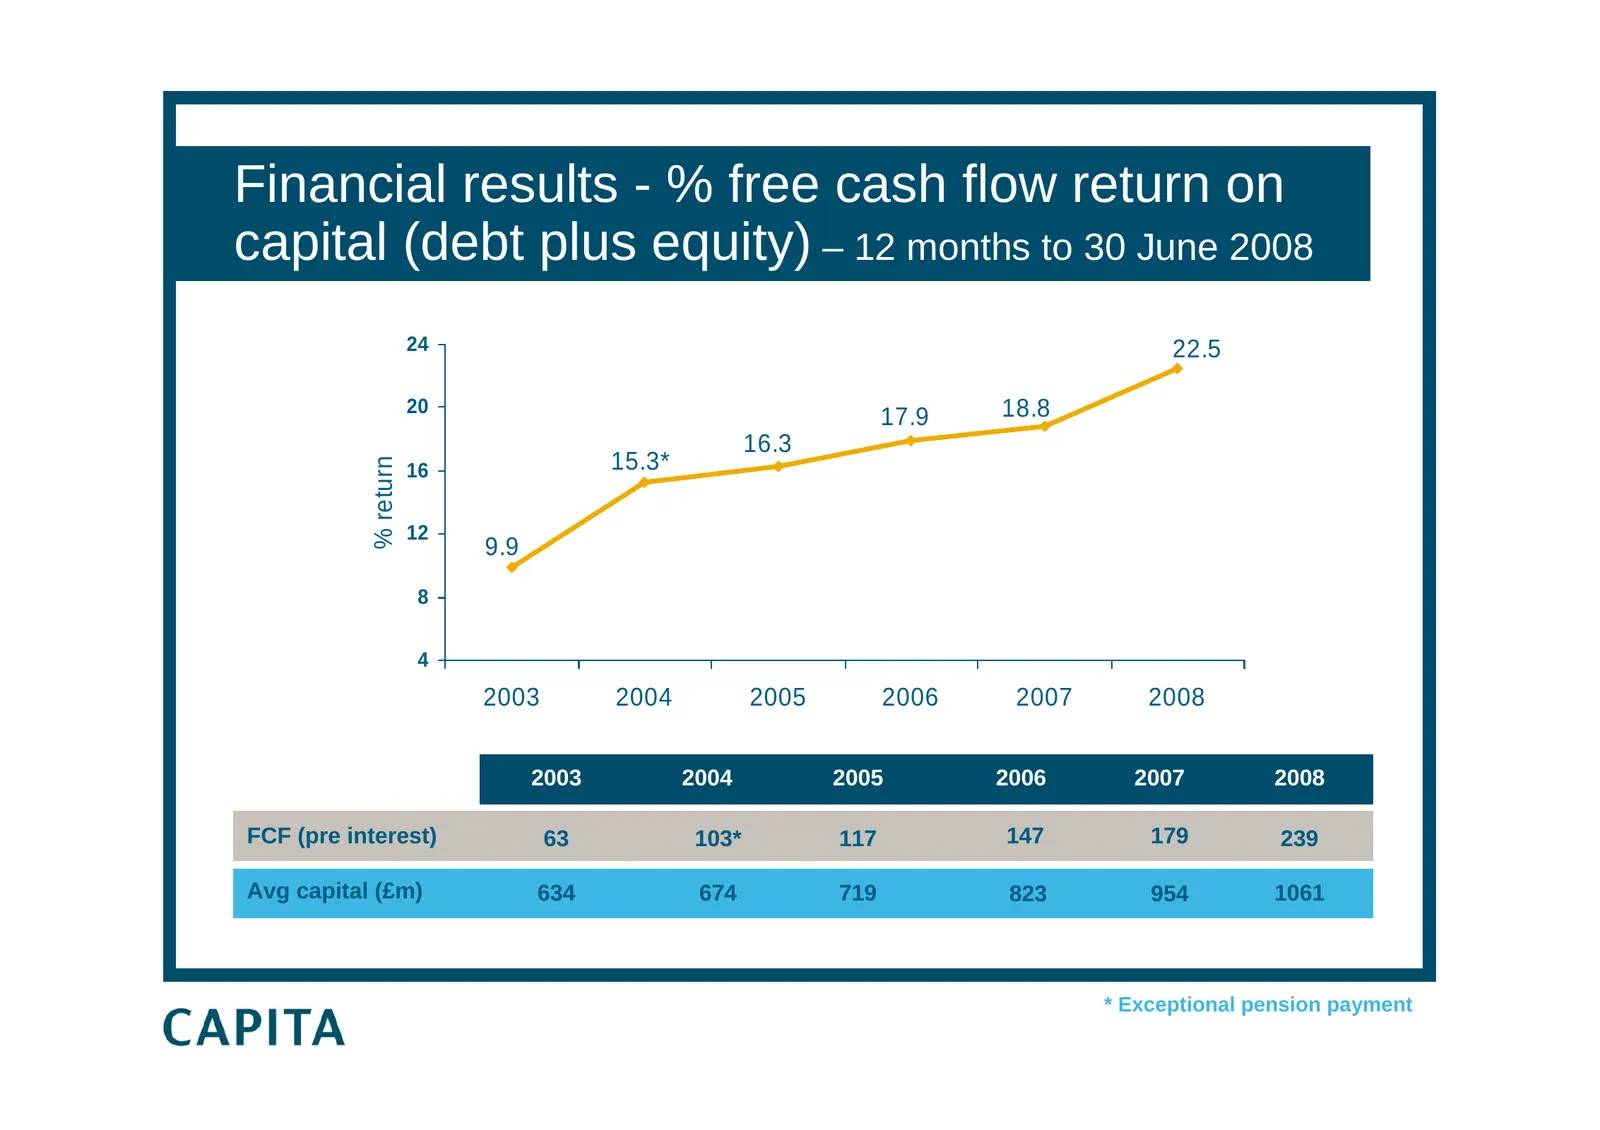
Financial results - % free cash flow return on capital (debt plus equity) – 12 months to 30 June 2008 24 22.5 20 18.8 17.9 16.3 15.3* % return 16 12 9.9 8 4 2003 2004 2005 2006 2007 2008 2003 2004 2005 2006 2007 2008 FCF (pre interest) 63 103* 117 147 179 239 Avg capital (£m) 634 674 719 823 954 106
Slide 21: Financial results - balance sheet gearing
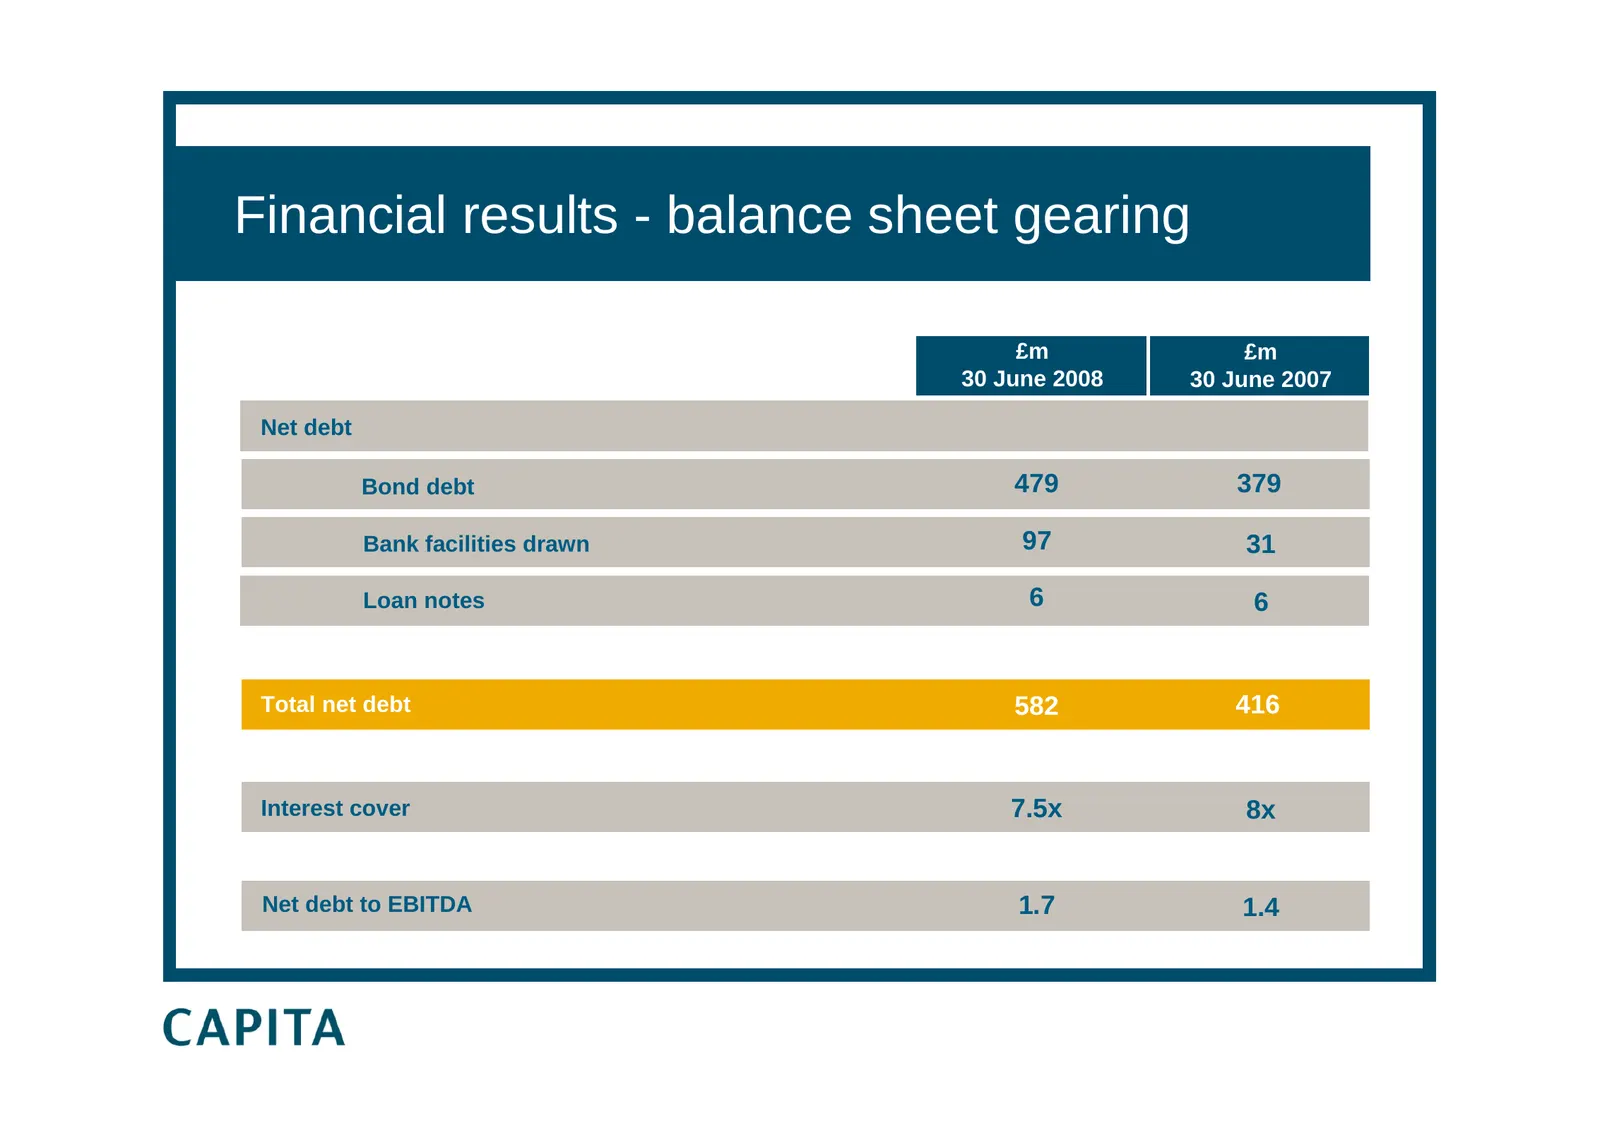
Financial results - balance sheet gearing £m £m £m 20082008 30 June 3030 June £m 2007 2007 June (£m) 2007 Net debt Bond debt 479 379 Bank facilities drawn 97 31 Loan notes 6 6 Total net debt 582 416 Interest cover 7.5x 8x Net debt to EBITDA 1.7 1.4
Slide 22: Financial results - share buybacks
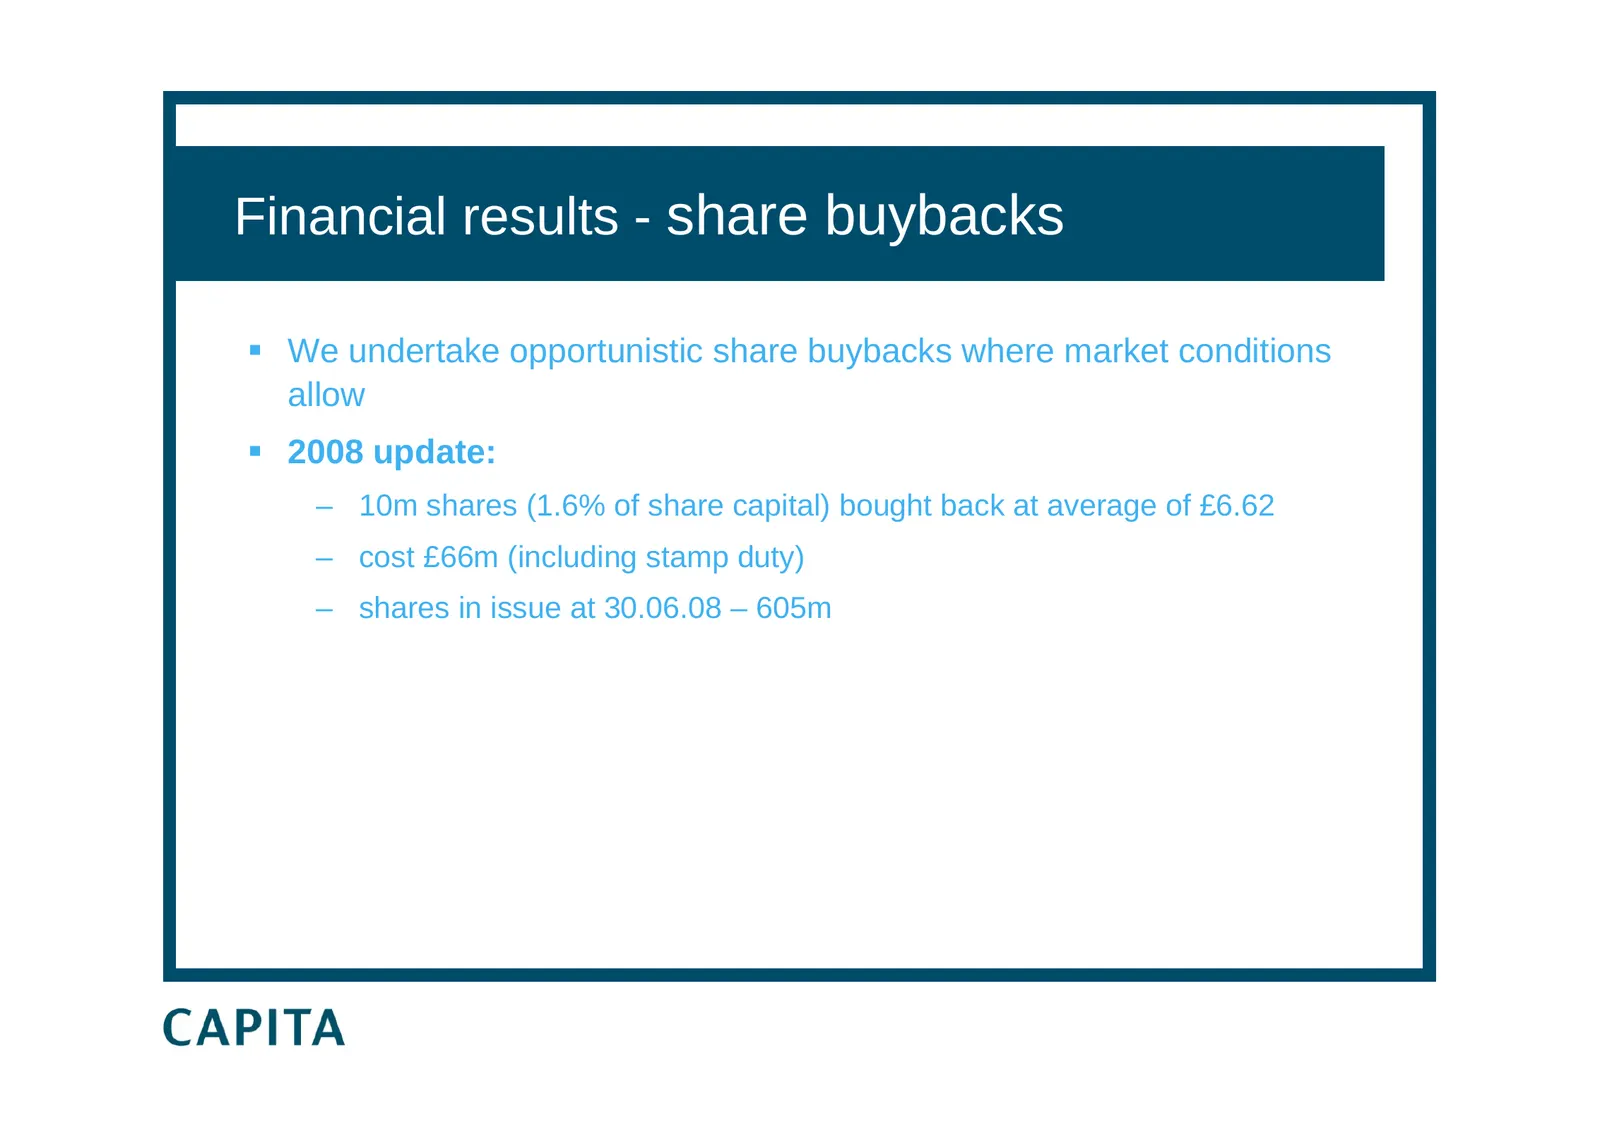
Financial results - share buybacks We undertake opportunistic share buybacks where market conditions allow 2008 update: – 10m shares (1.6% of share capital) bought back at average of £6.62 – cost £66m (including stamp duty) – shares in issue at 30.06.08 – 605m
Slide 23: Fuelling growth through contract wins and acquisitions
Fuelling growth through contract wins and acquisitions Paul Pindar Chief Executive
Slide 24: Fuelling growth - contracts secured in first 6 months of 2008
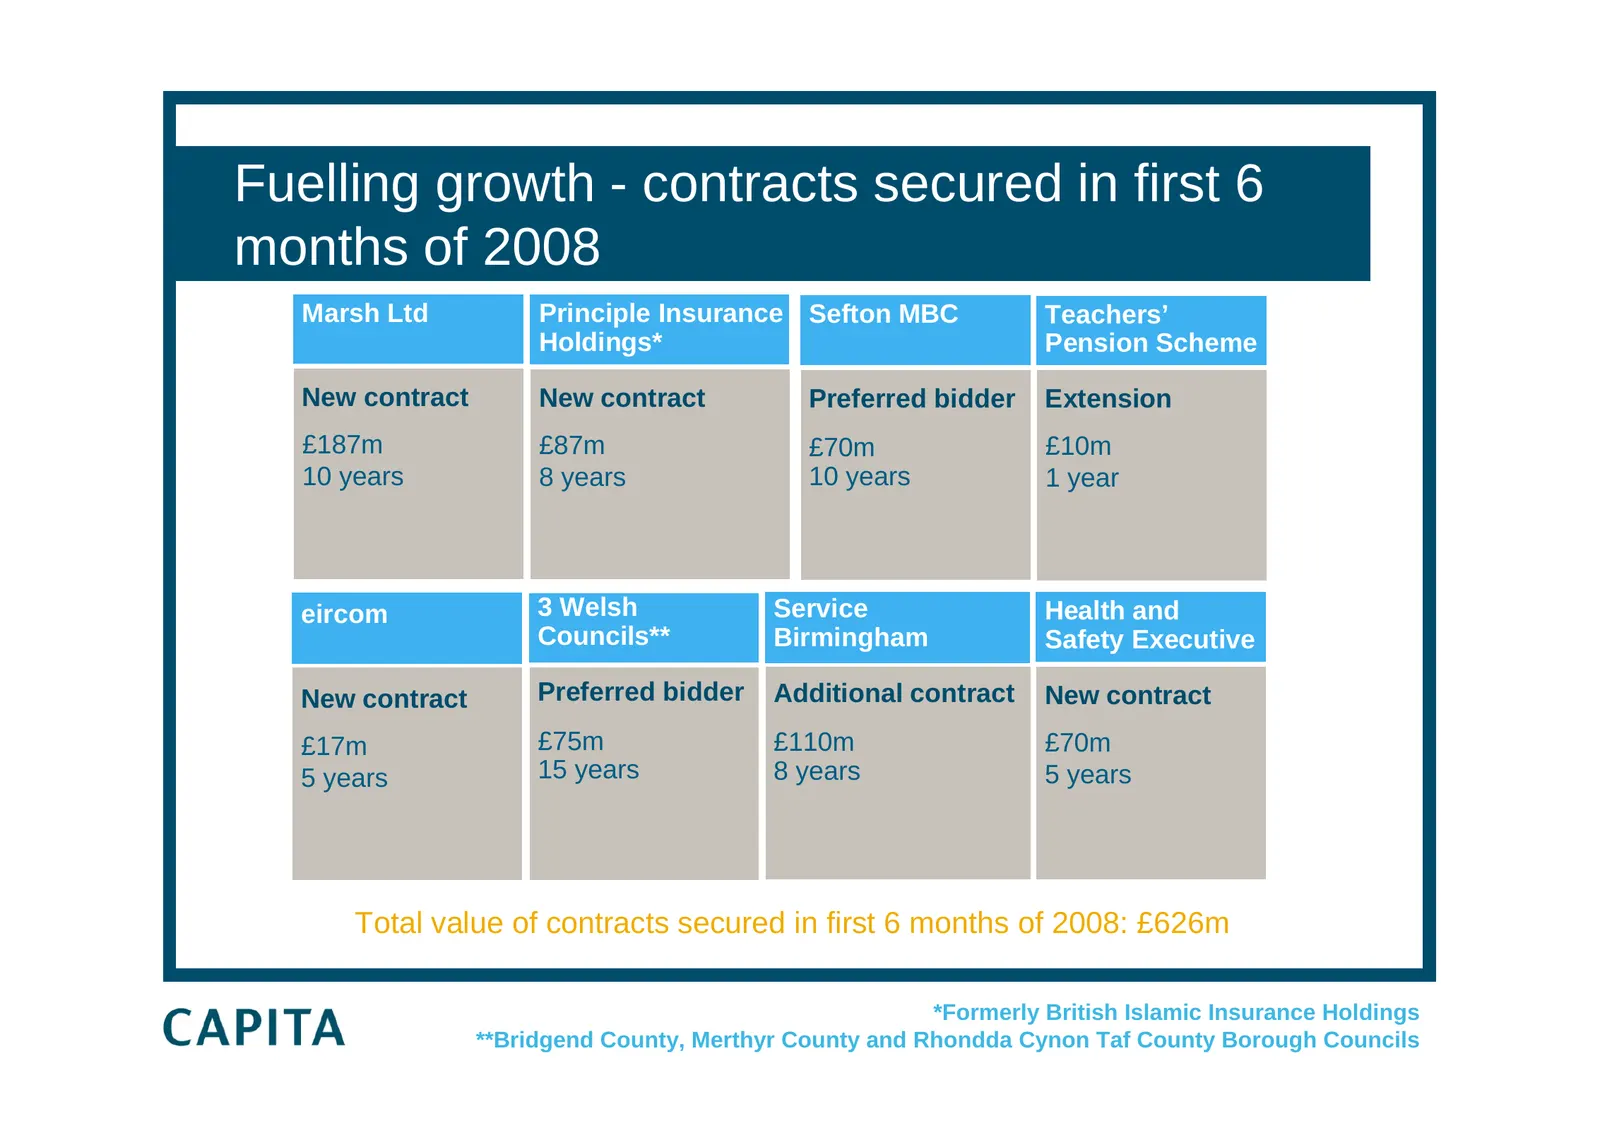
Fuelling growth - contracts secured in first 6 months of 2008 Marsh Ltd Principle Insurance Sefton MBC Teachers’ Holdings* Pension Scheme New contract New contract Preferred bidder Extension £187m £87m £70m £10m 10 years 8 years 10 years 1 year eircom 3 Welsh Service Health and Councils** Birmingham
Slide 25: Fuelling growth - contracts secured in July
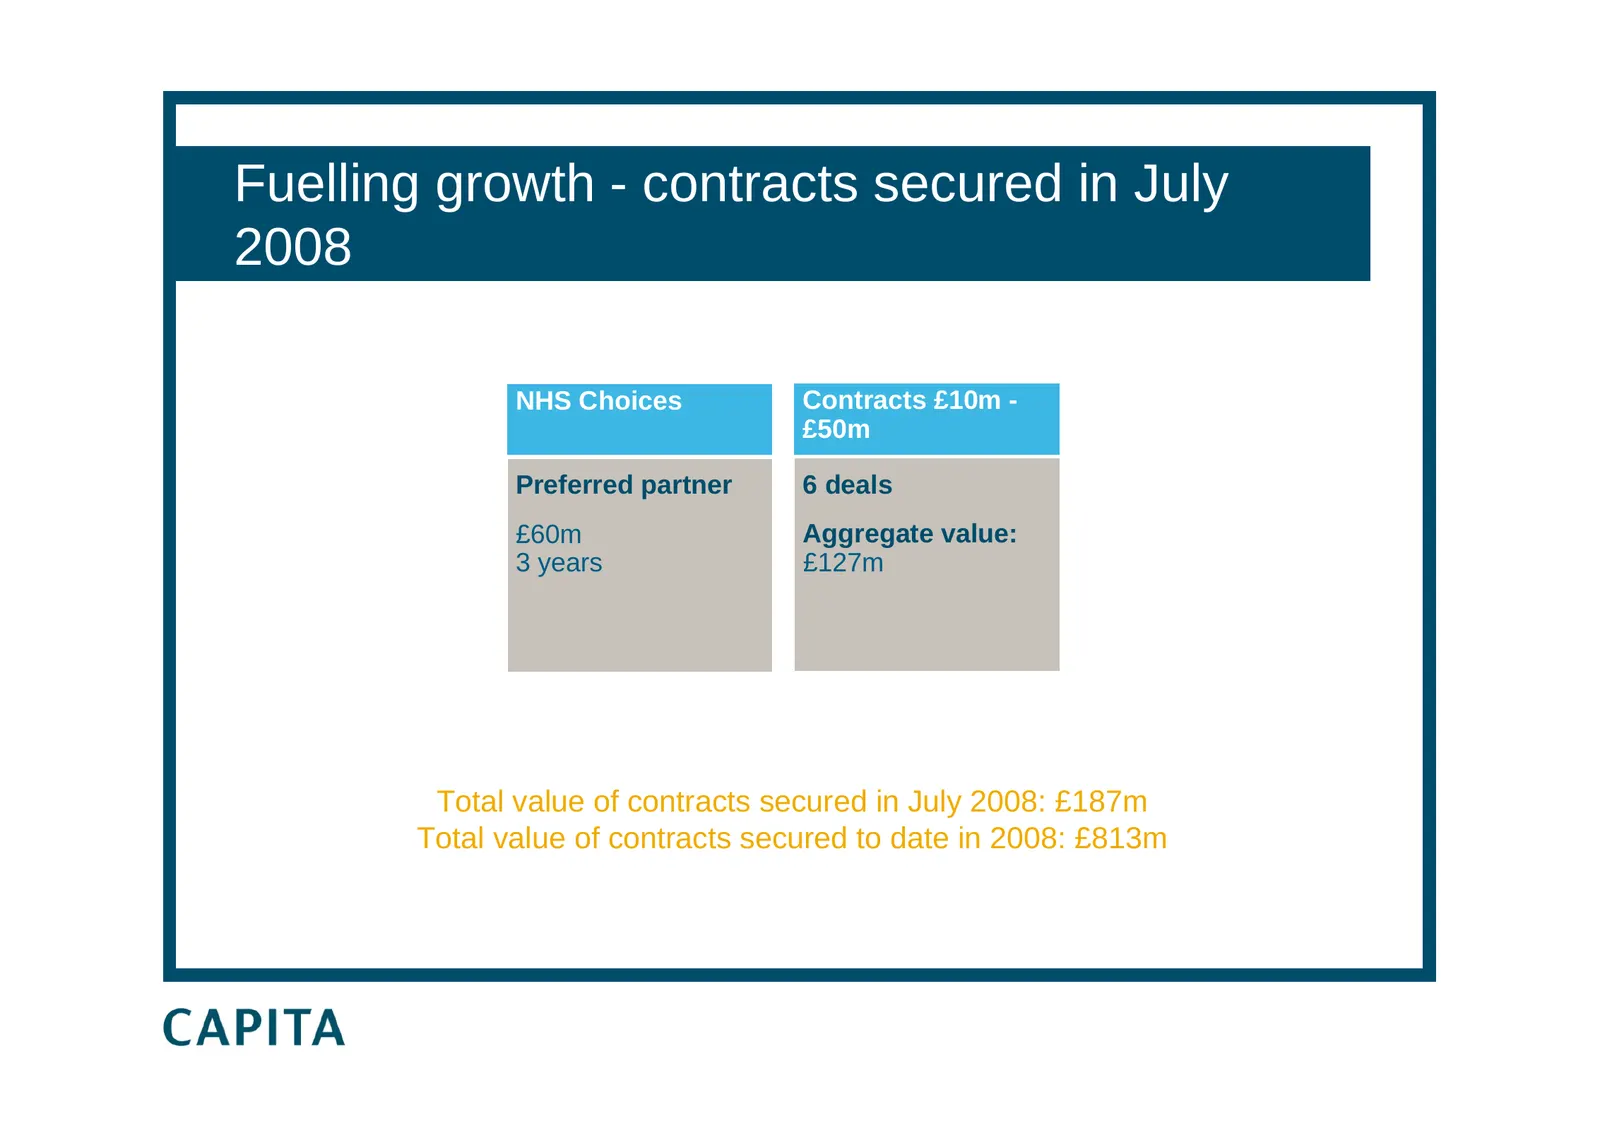
Fuelling growth - contracts secured in July 2008 NHS Choices Contracts £10m - £50m Preferred partner 6 deals £60m Aggregate value: 3 years £127m Total value of contracts secured in July 2008: £187m Total value of contracts secured to date in 2008: £813m
Slide 26: Fuelling growth - rebid of existing major contracts
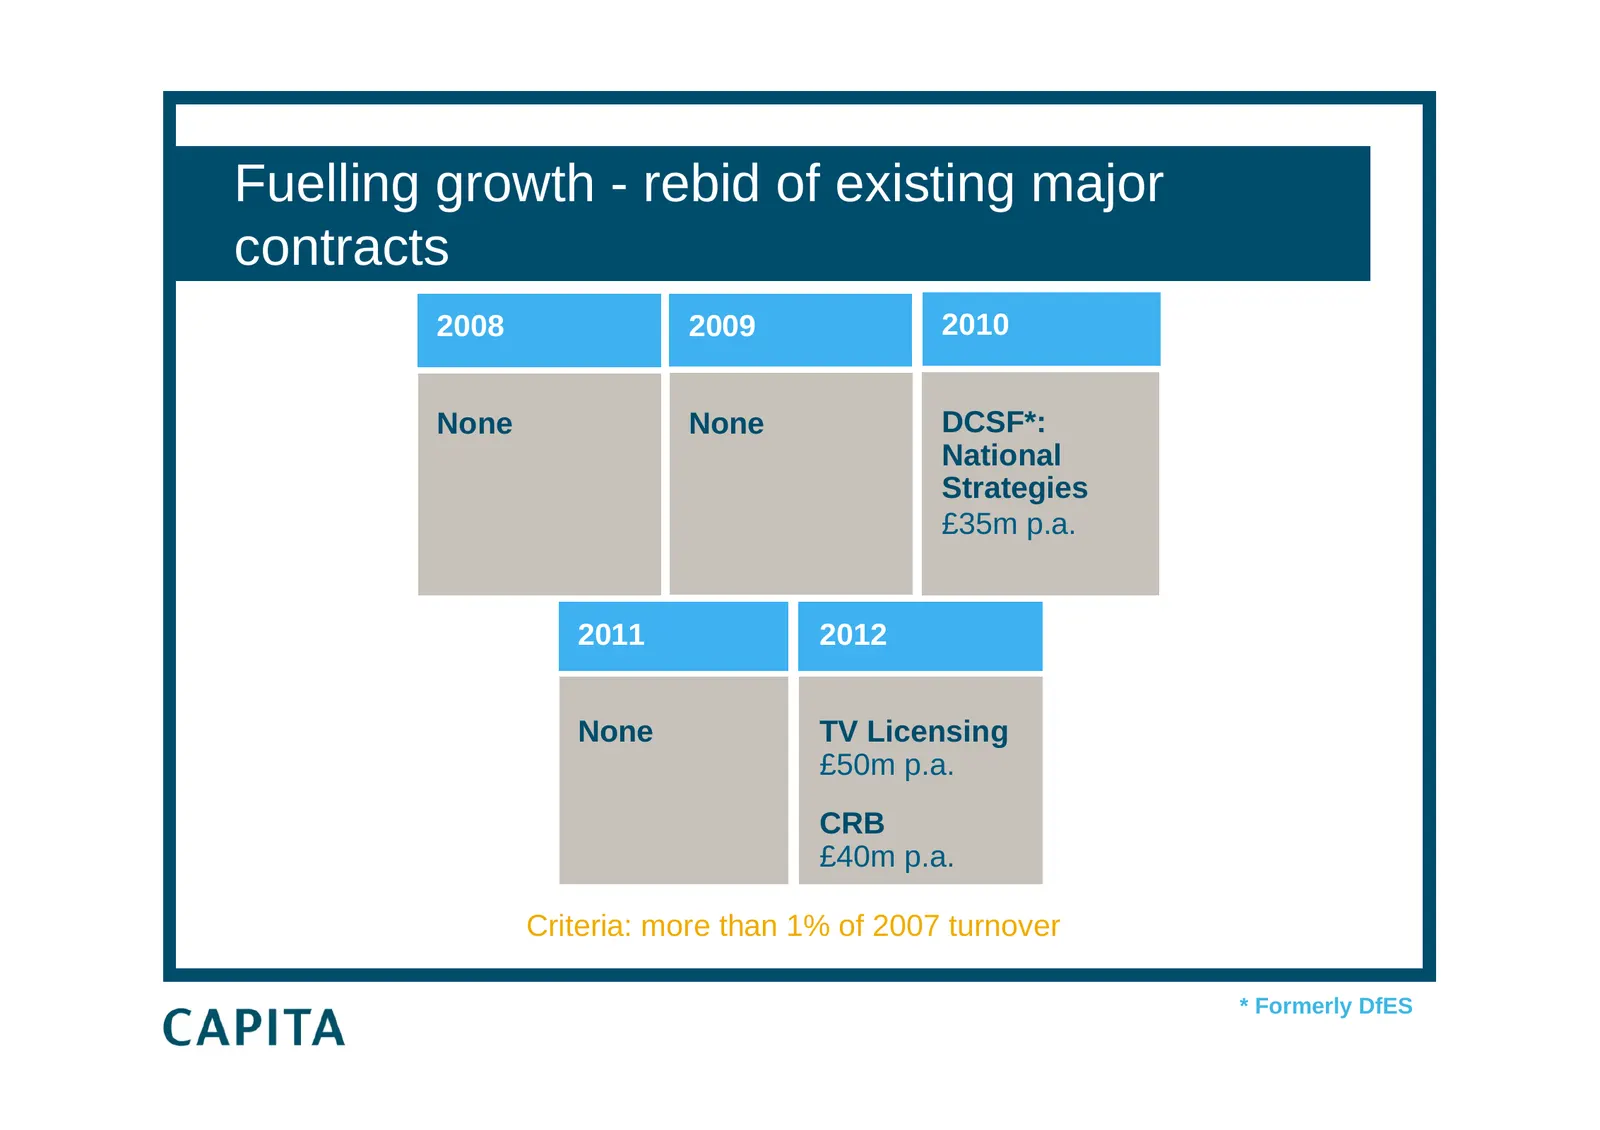
Fuelling growth - rebid of existing major contracts 2008 2009 2010 None None DCSF*: National Strategies £35m p.a. 2011 2012 None TV Licensing £50m p.a. CRB £40m p.a. Criteria: more than 1% of 2007 turnover * Formerly DfES
Slide 27: Fuelling growth - bid activity
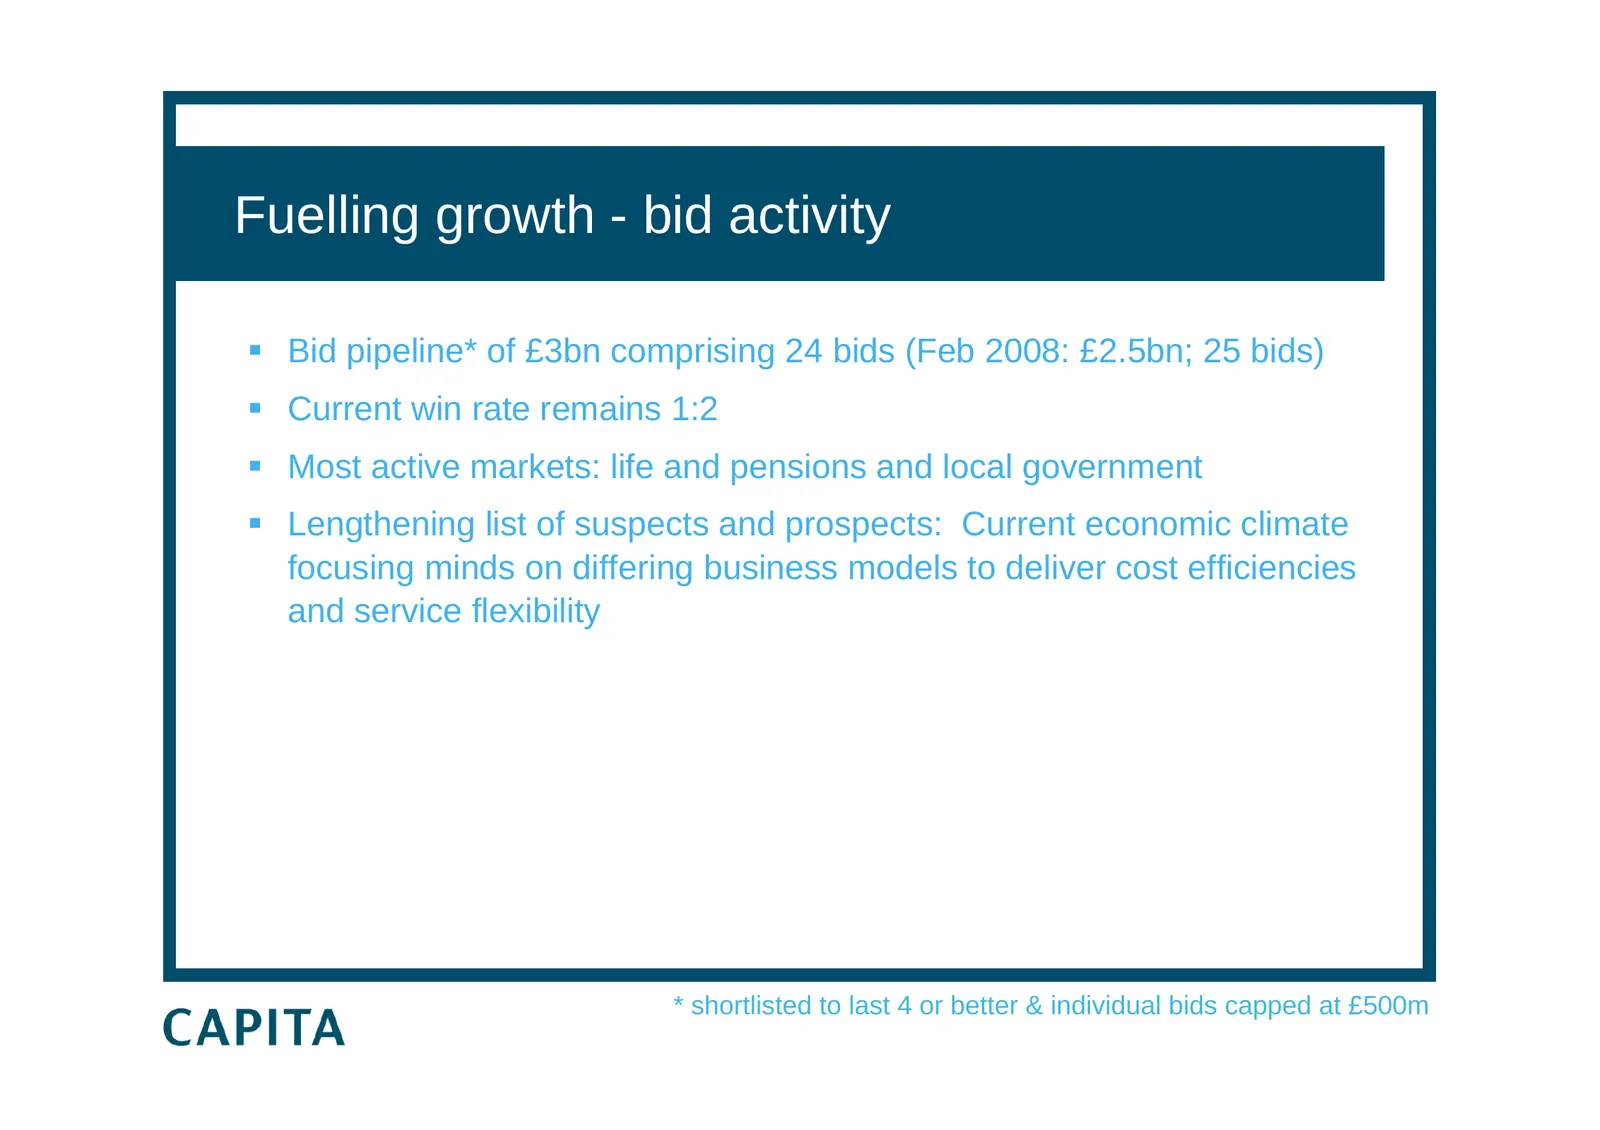
Fuelling growth - bid activity Bid pipeline* of £3bn comprising 24 bids (Feb 2008: £2.5bn; 25 bids) Current win rate remains 1:2 Most active markets: life and pensions and local government Lengthening list of suspects and prospects: Current economic climate focusing minds on differing busine
Slide 28: Fuelling growth - Sefton Metropolitan Borough Council
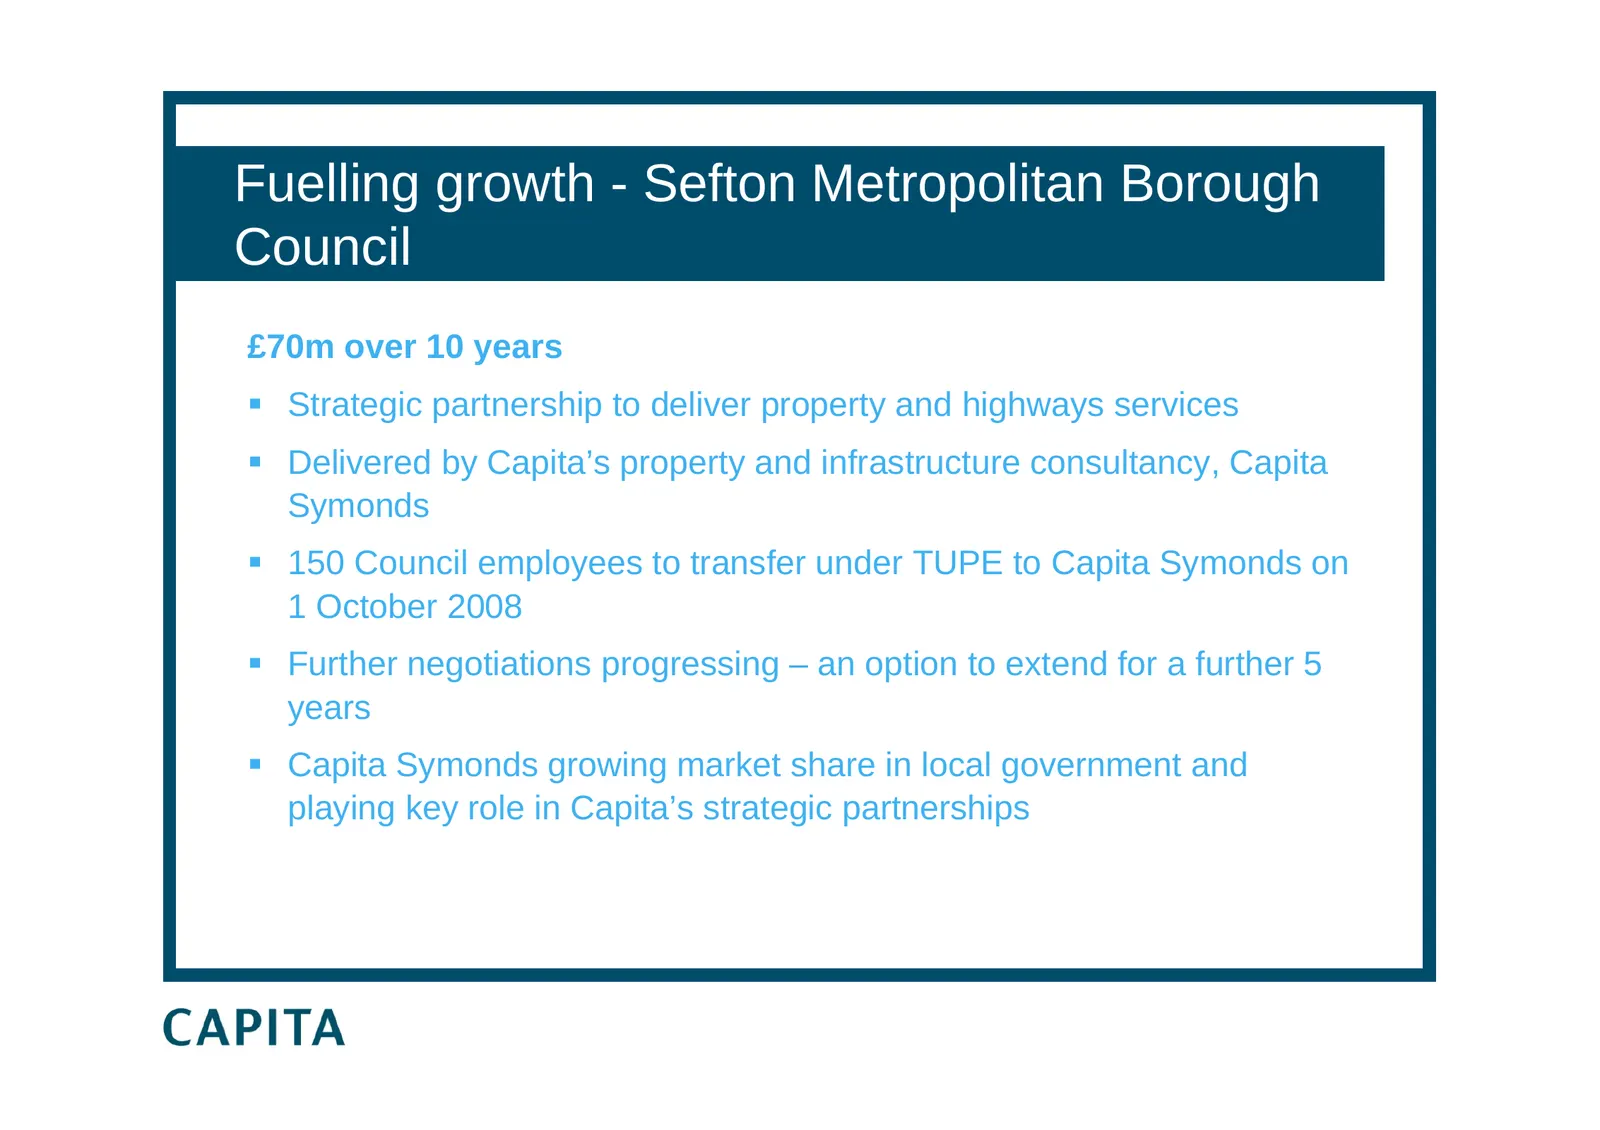
Fuelling growth - Sefton Metropolitan Borough Council £70m over 10 years Strategic partnership to deliver property and highways services Delivered by Capita’s property and infrastructure consultancy, Capita Symonds 150 Council employees to transfer under TUPE to Capita Symonds on 1 October 200
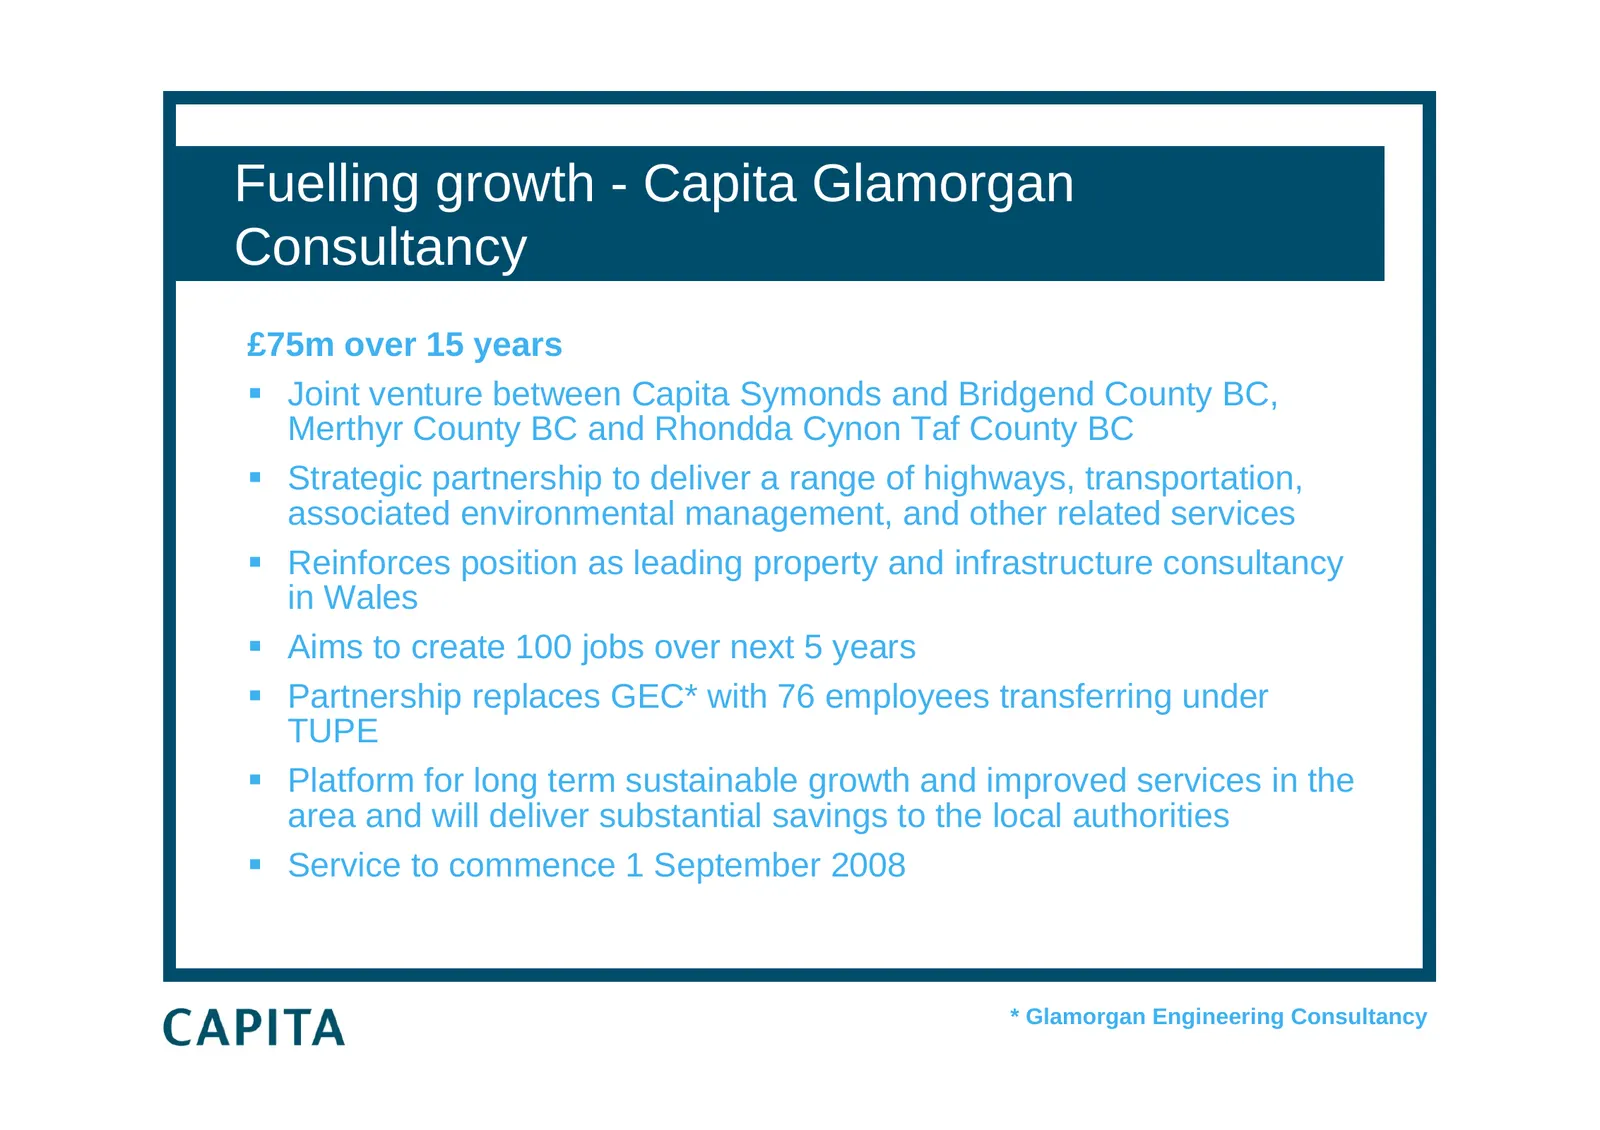
Slide 29: Fuelling growth - Capita Glamorgan Consultancy
Fuelling growth - Capita Glamorgan Consultancy £75m over 15 years Joint venture between Capita Symonds and Bridgend County BC, Merthyr County BC and Rhondda Cynon Taf County BC Strategic partnership to deliver a range of highways, transportation, associated environmental management, and other re
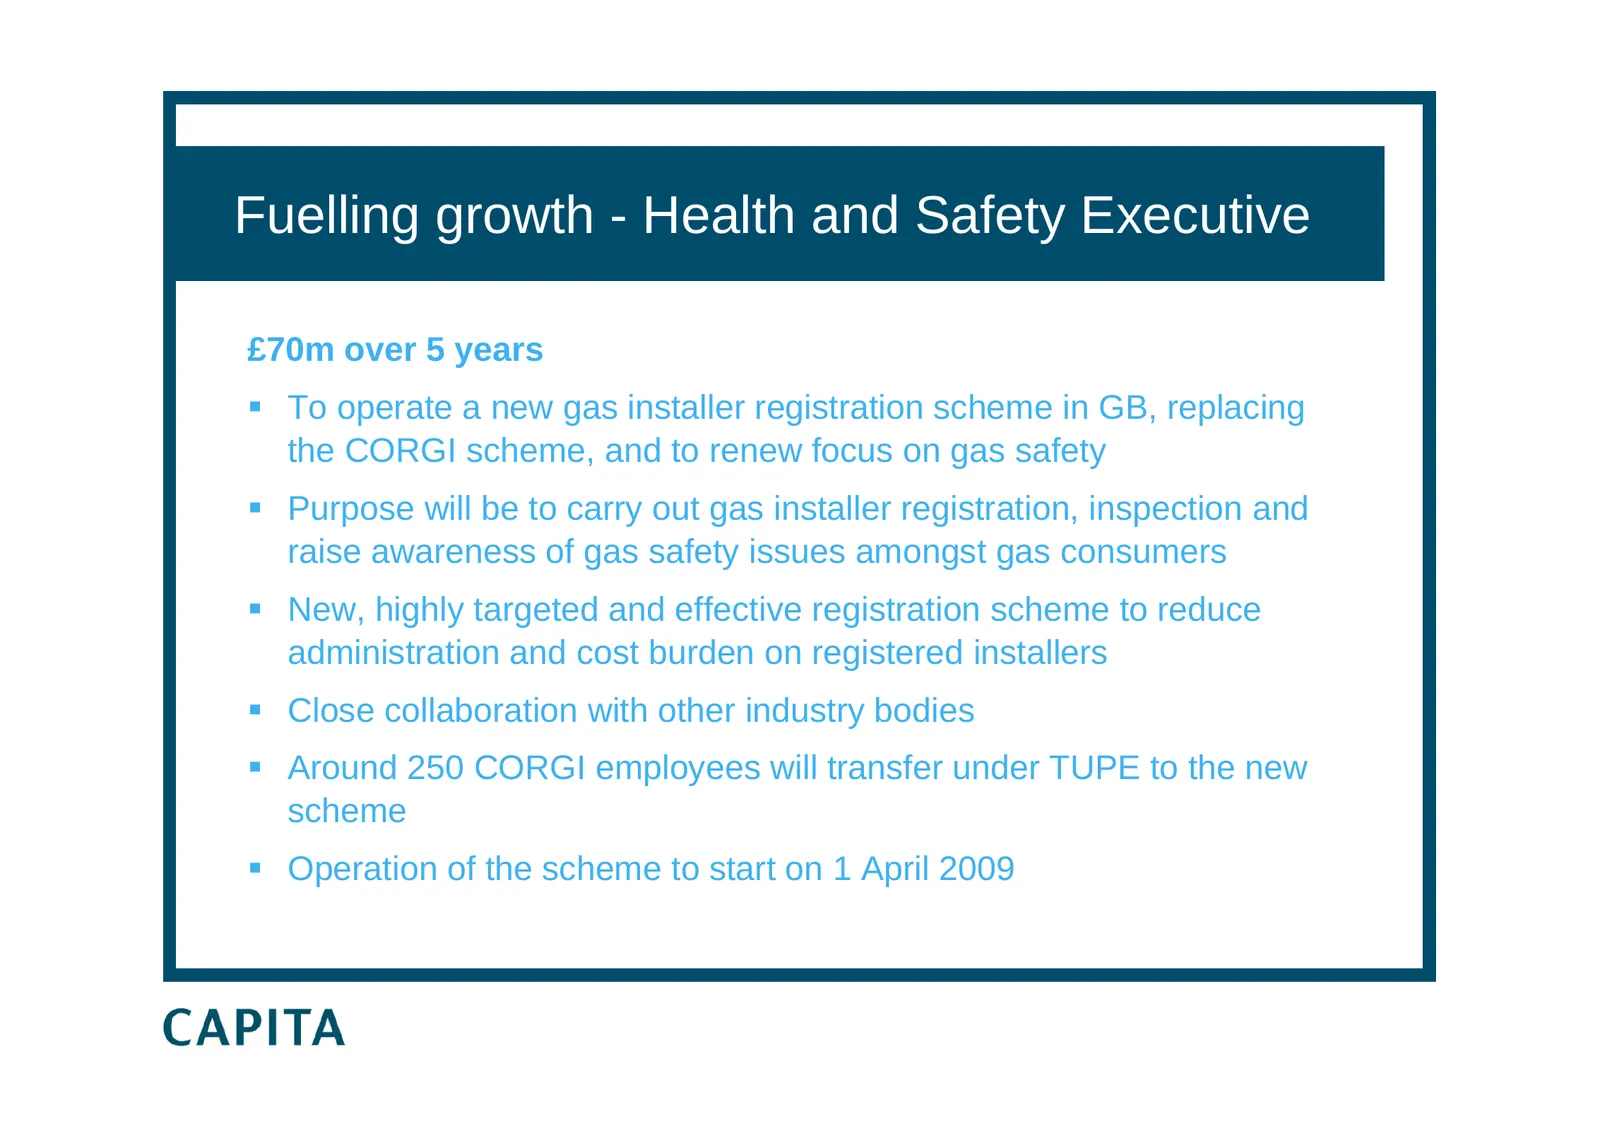
Slide 30: Fuelling growth - Health and Safety Executive
Fuelling growth - Health and Safety Executive £70m over 5 years To operate a new gas installer registration scheme in GB, replacing the CORGI scheme, and to renew focus on gas safety Purpose will be to carry out gas installer registration, inspection and raise awareness of gas safety issues amon
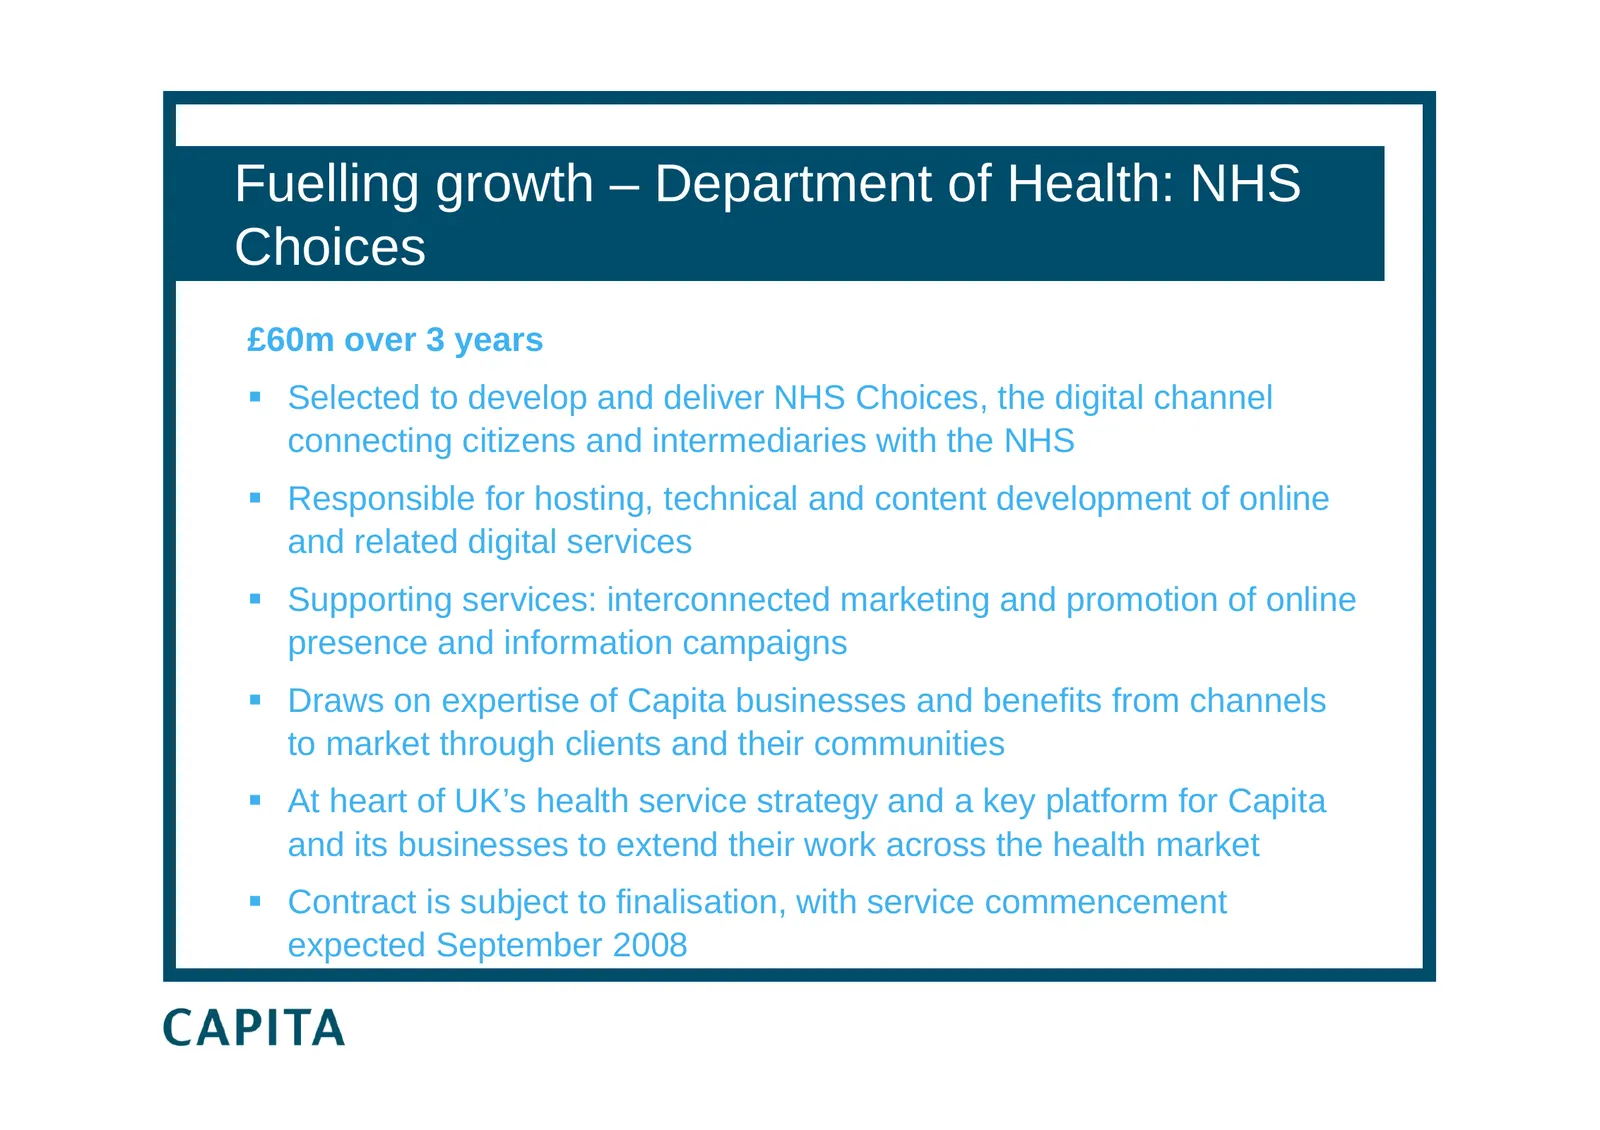
Slide 31: Fuelling growth - Department of Health: NHS Choices
Fuelling growth – Department of Health: NHS Choices £60m over 3 years Selected to develop and deliver NHS Choices, the digital channel connecting citizens and intermediaries with the NHS Responsible for hosting, technical and content development of online and related digital services Supportin
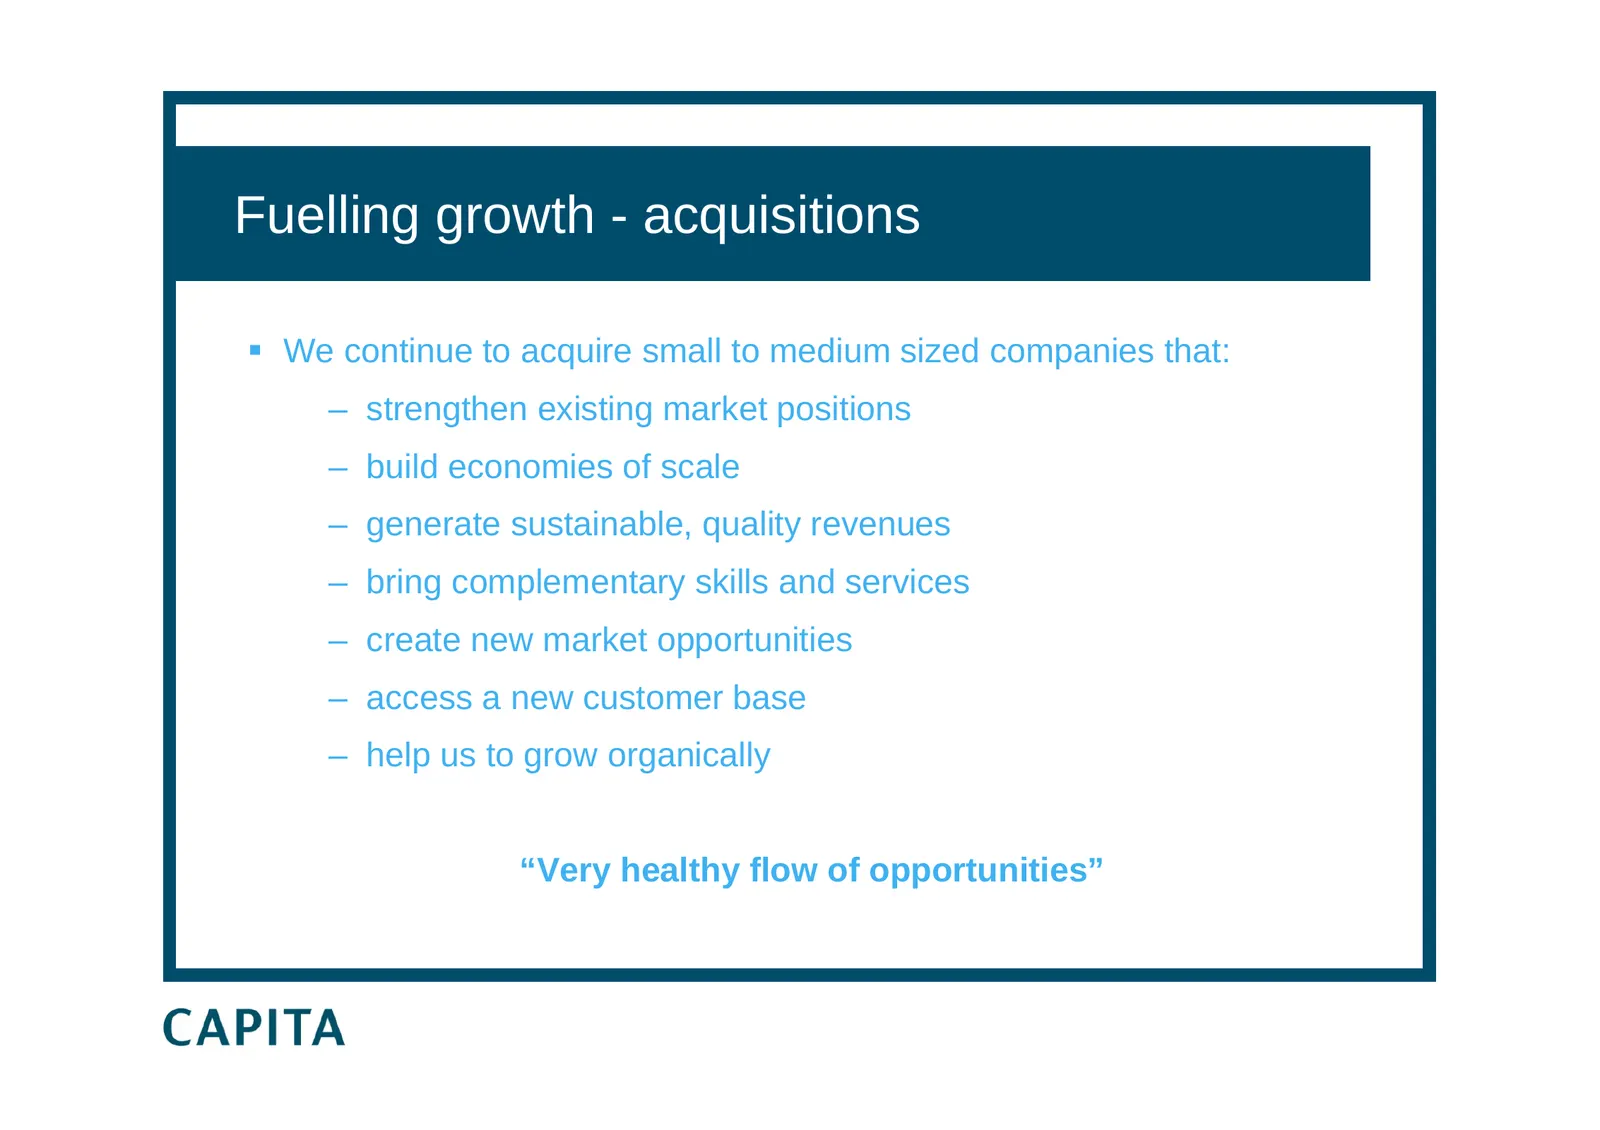
Slide 32: Fuelling growth - acquisitions
Fuelling growth - acquisitions We continue to acquire small to medium sized companies that: – strengthen existing market positions – build economies of scale – generate sustainable, quality revenues – bring complementary skills and services – create new market opportunities – access a new customer
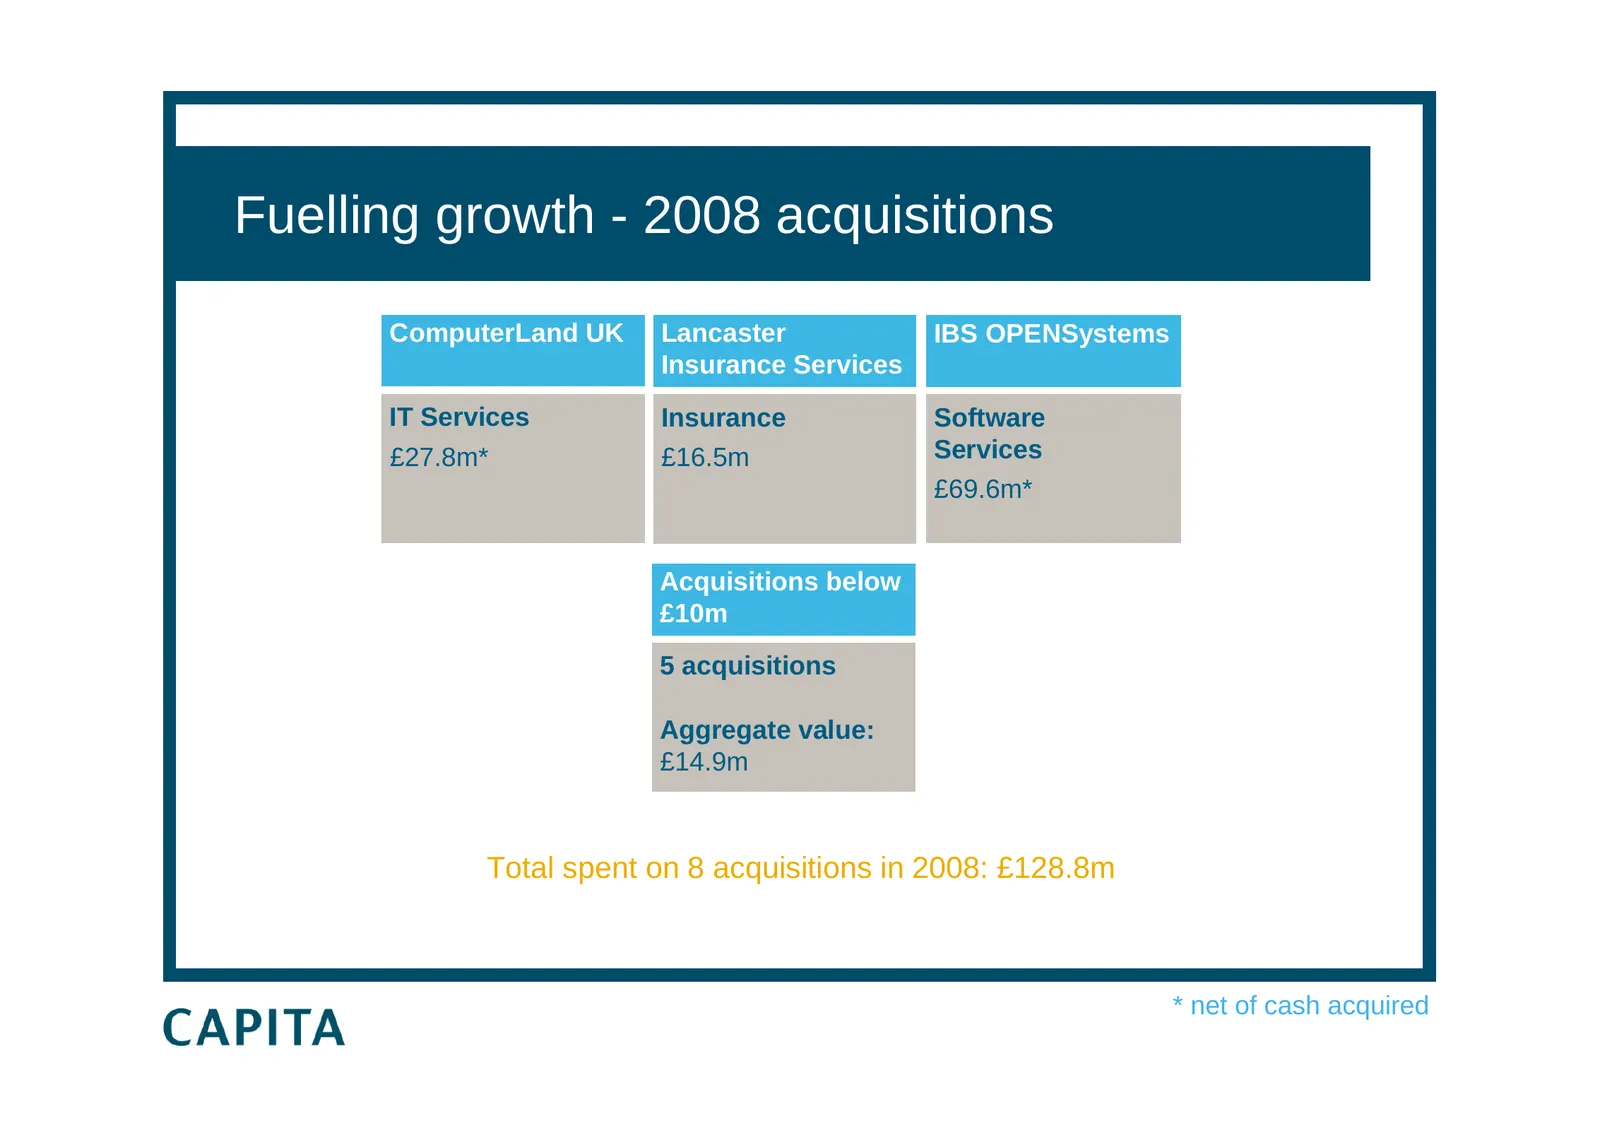
Slide 33: Fuelling growth - 2008 acquisitions
Fuelling growth - 2008 acquisitions ComputerLand UK Lancaster IBS OPENSystems Insurance Services IT Services Insurance Software £27.8m* £16.5m Services £69.6m* Acquisitions below £10m 5 acquisitions Aggregate value: £14.9m Total spent on 8 acquisitions in 2008: £128.8m * net of cash acquired
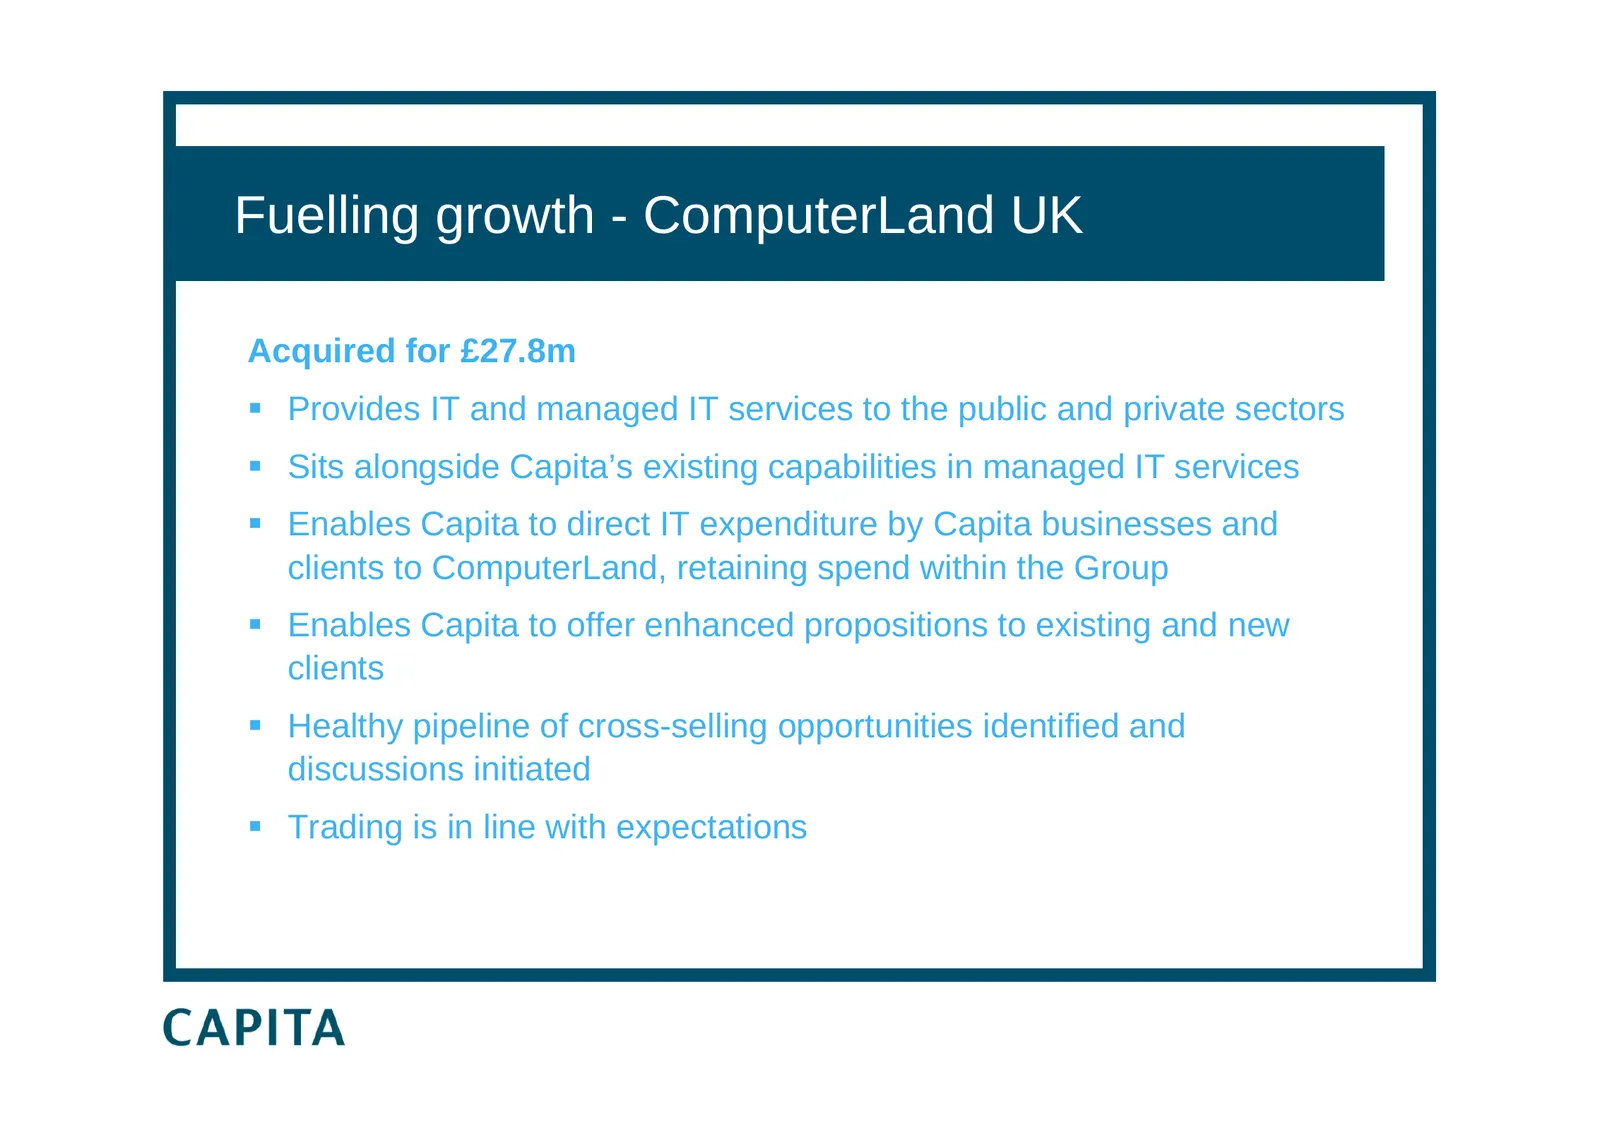
Slide 34: Fuelling growth - ComputerLand UK
Fuelling growth - ComputerLand UK Acquired for £27.8m Provides IT and managed IT services to the public and private sectors Sits alongside Capita’s existing capabilities in managed IT services Enables Capita to direct IT expenditure by Capita businesses and clients to ComputerLand, retaining s
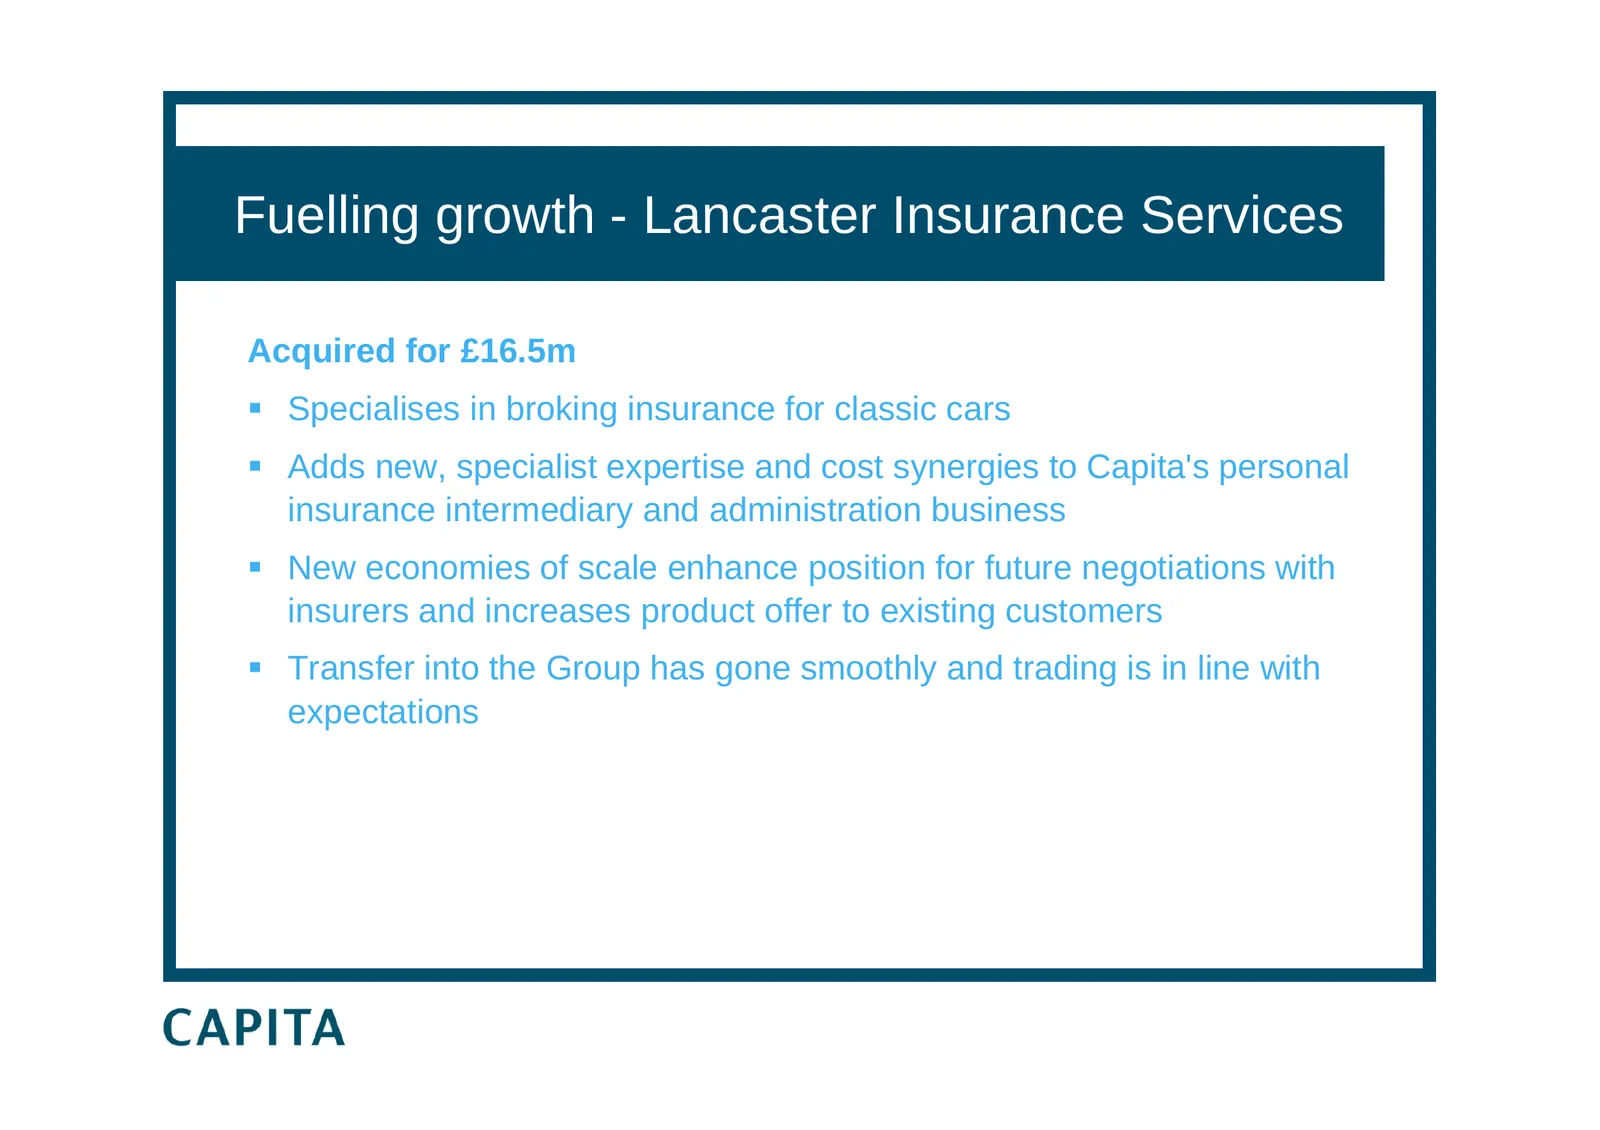
Slide 35: Fuelling growth - Lancaster Insurance Services
Fuelling growth - Lancaster Insurance Services Acquired for £16.5m Specialises in broking insurance for classic cars Adds new, specialist expertise and cost synergies to Capita's personal insurance intermediary and administration business New economies of scale enhance position for future nego
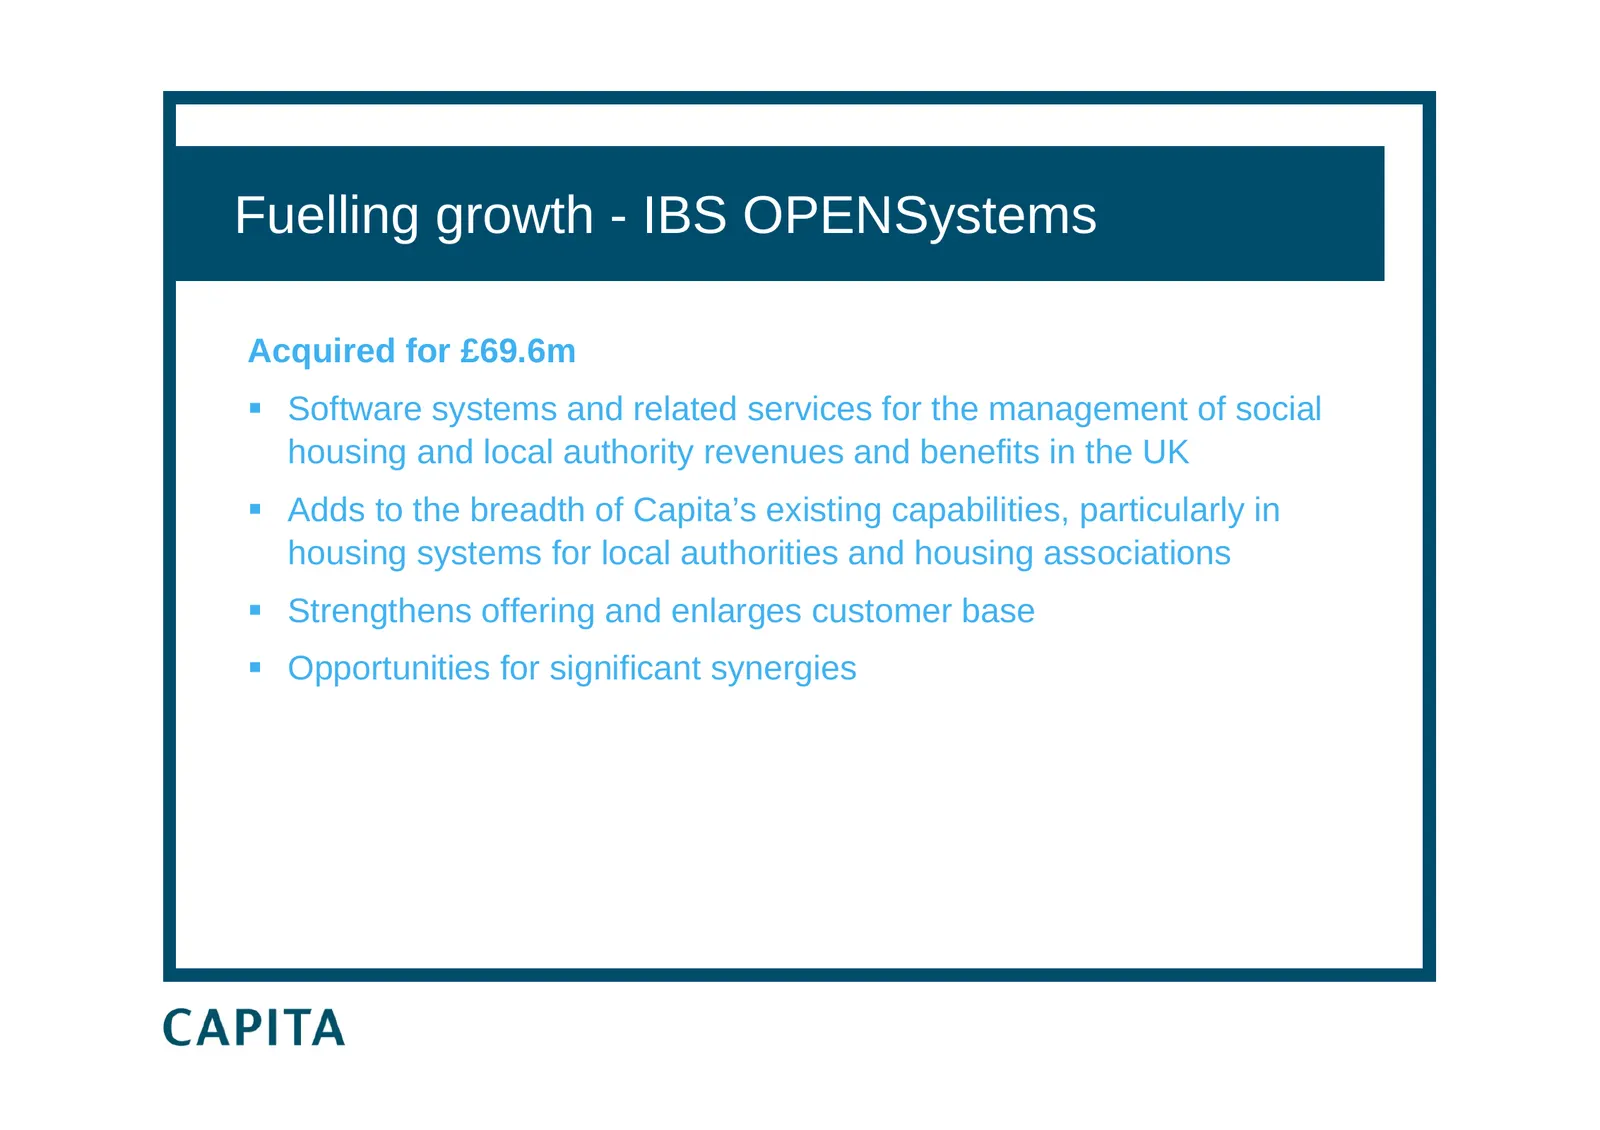
Slide 36: Fuelling growth - IBS OPENSystems
Fuelling growth - IBS OPENSystems Acquired for £69.6m Software systems and related services for the management of social housing and local authority revenues and benefits in the UK Adds to the breadth of Capita’s existing capabilities, particularly in housing systems for local authorities and ho
Slide 37: Maintaining operational performance
Maintaining operational performance Simon Pilling Joint Chief Operating Officer
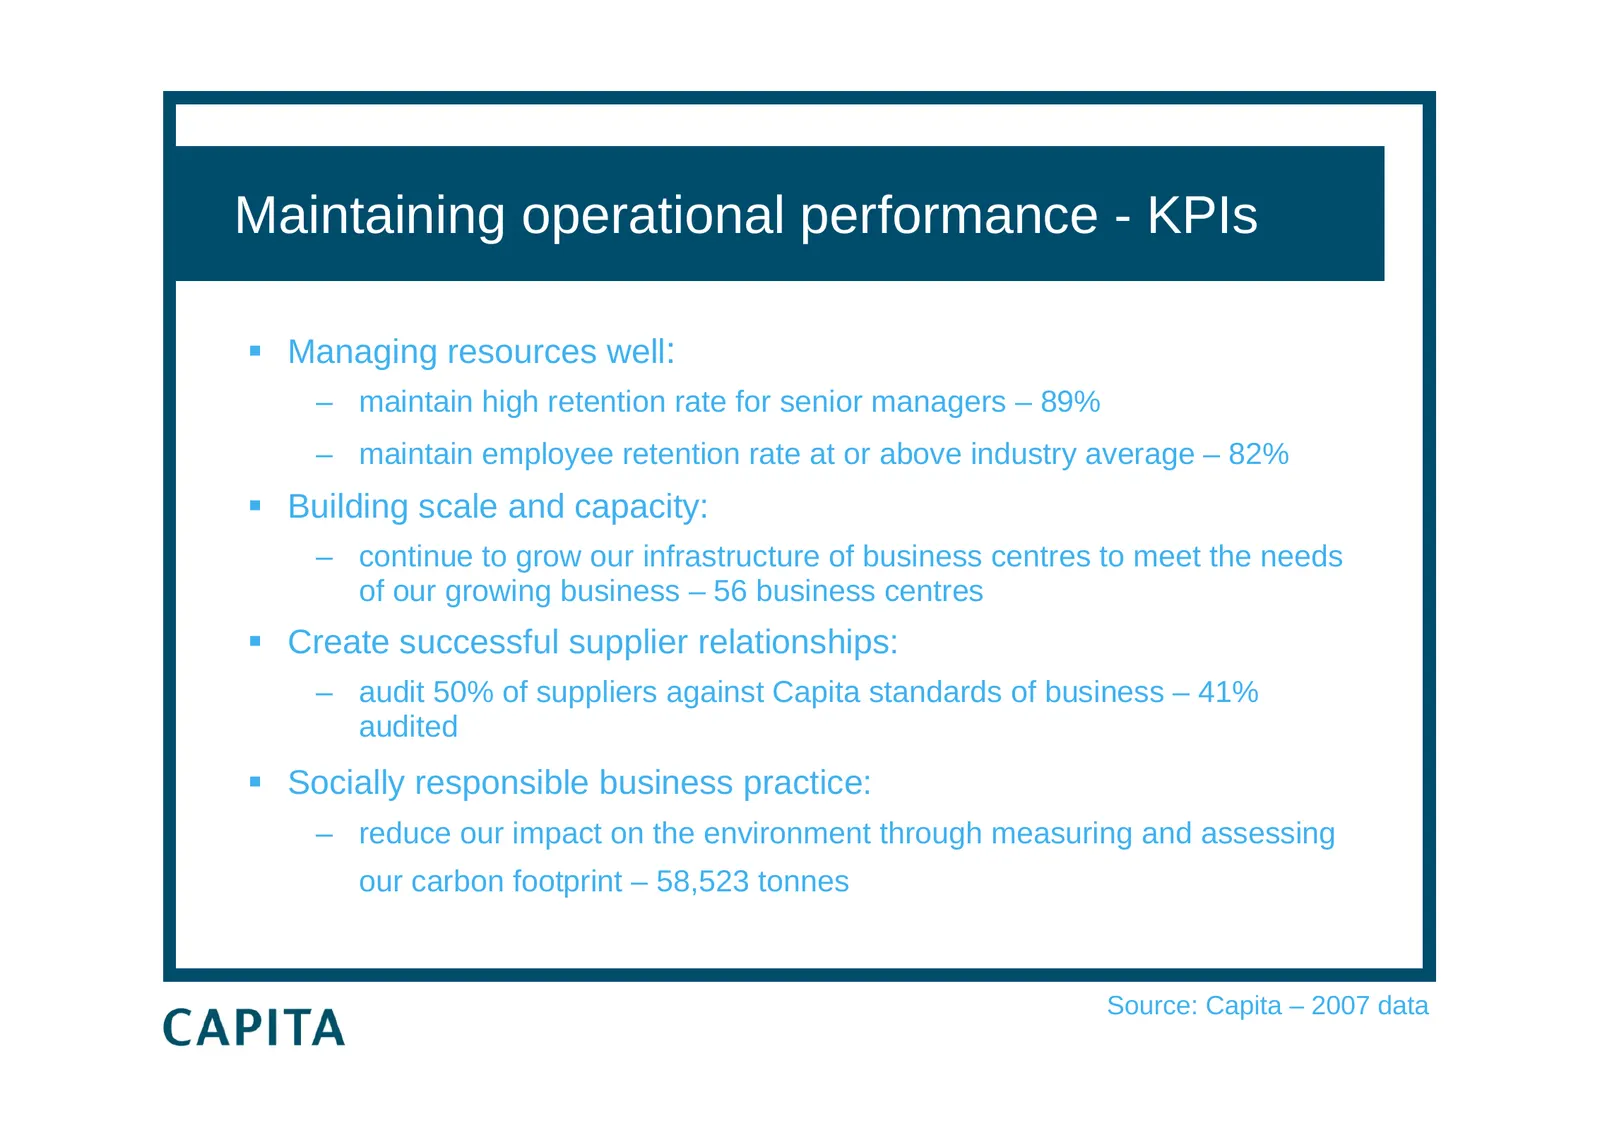
Slide 38: Maintaining operational performance - KPIs
Maintaining operational performance - KPIs Managing resources well: – maintain high retention rate for senior managers – 89% – maintain employee retention rate at or above industry average – 82% Building scale and capacity: – continue to grow our infrastructure of business centres to meet the ne
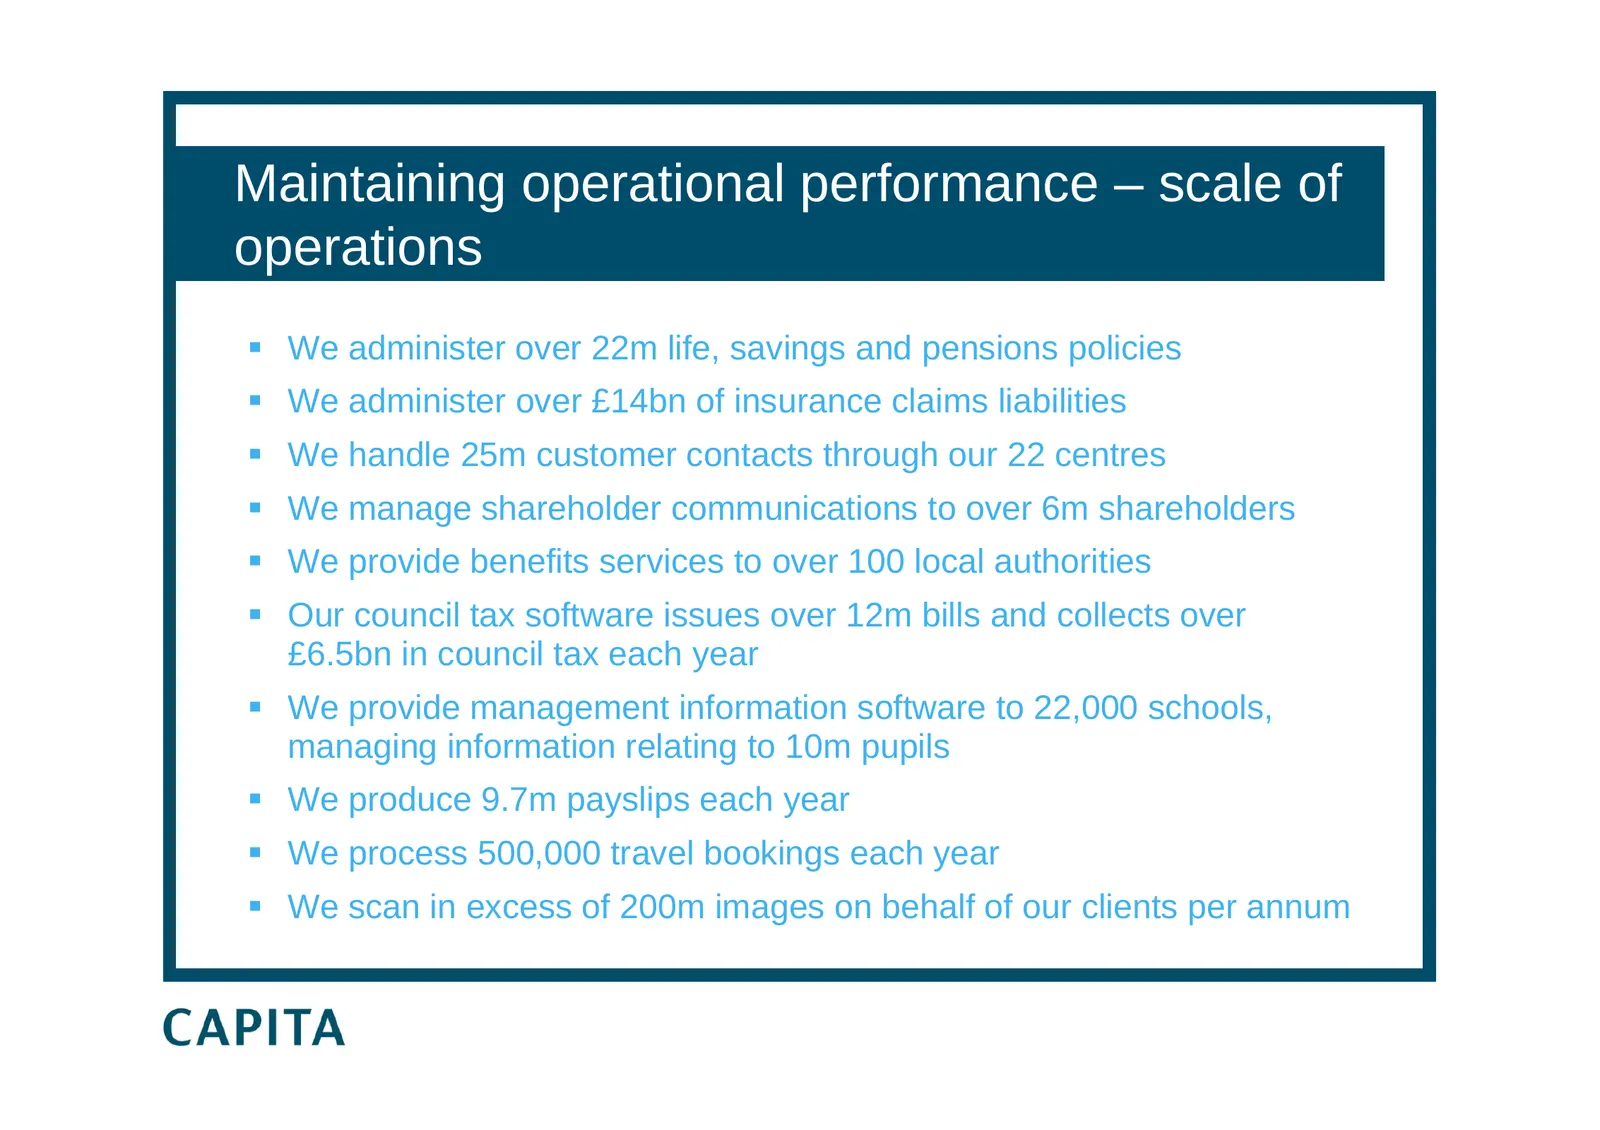
Slide 39: Maintaining operational performance – scale of operations
Maintaining operational performance – scale of operations We administer over 22m life, savings and pensions policies We administer over £14bn of insurance claims liabilities We handle 25m customer contacts through our 22 centres We manage shareholder communications to over 6m shareholders
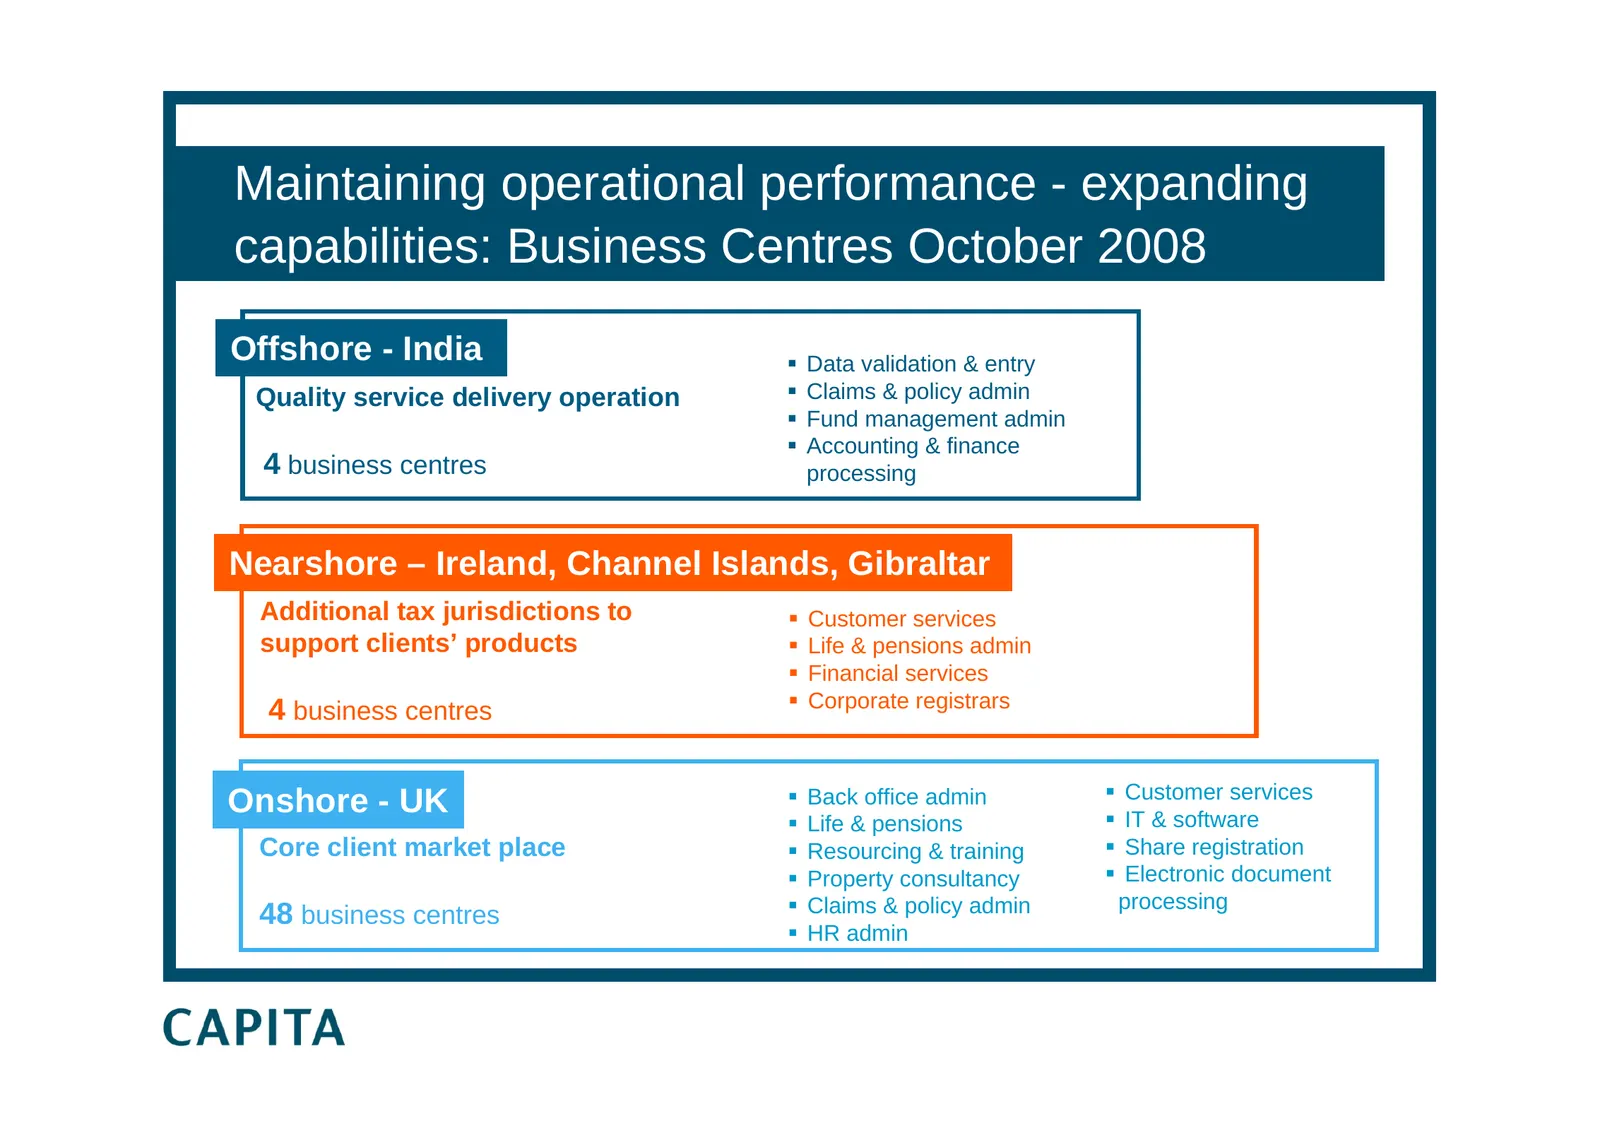
Slide 40: Expanding capabilities: Business Centres October 2008
Maintaining operational performance - expanding capabilities: Business Centres October 2008 Offshore - India Data validation & entry Quality service delivery operation Claims & policy admin Fund management admin Accounting & finance 4 business centres processing Nearshore – Ireland, Channel
Slide 41: Expanding capabilities: Capita India
Maintaining operational performance - expanding capabilities: Capita India Quality service delivery operation: – supports Group businesses and clients – valued processes across BPO and KPO – highly productive, quality operation Aim to become leading business process operator for UK market in Ind
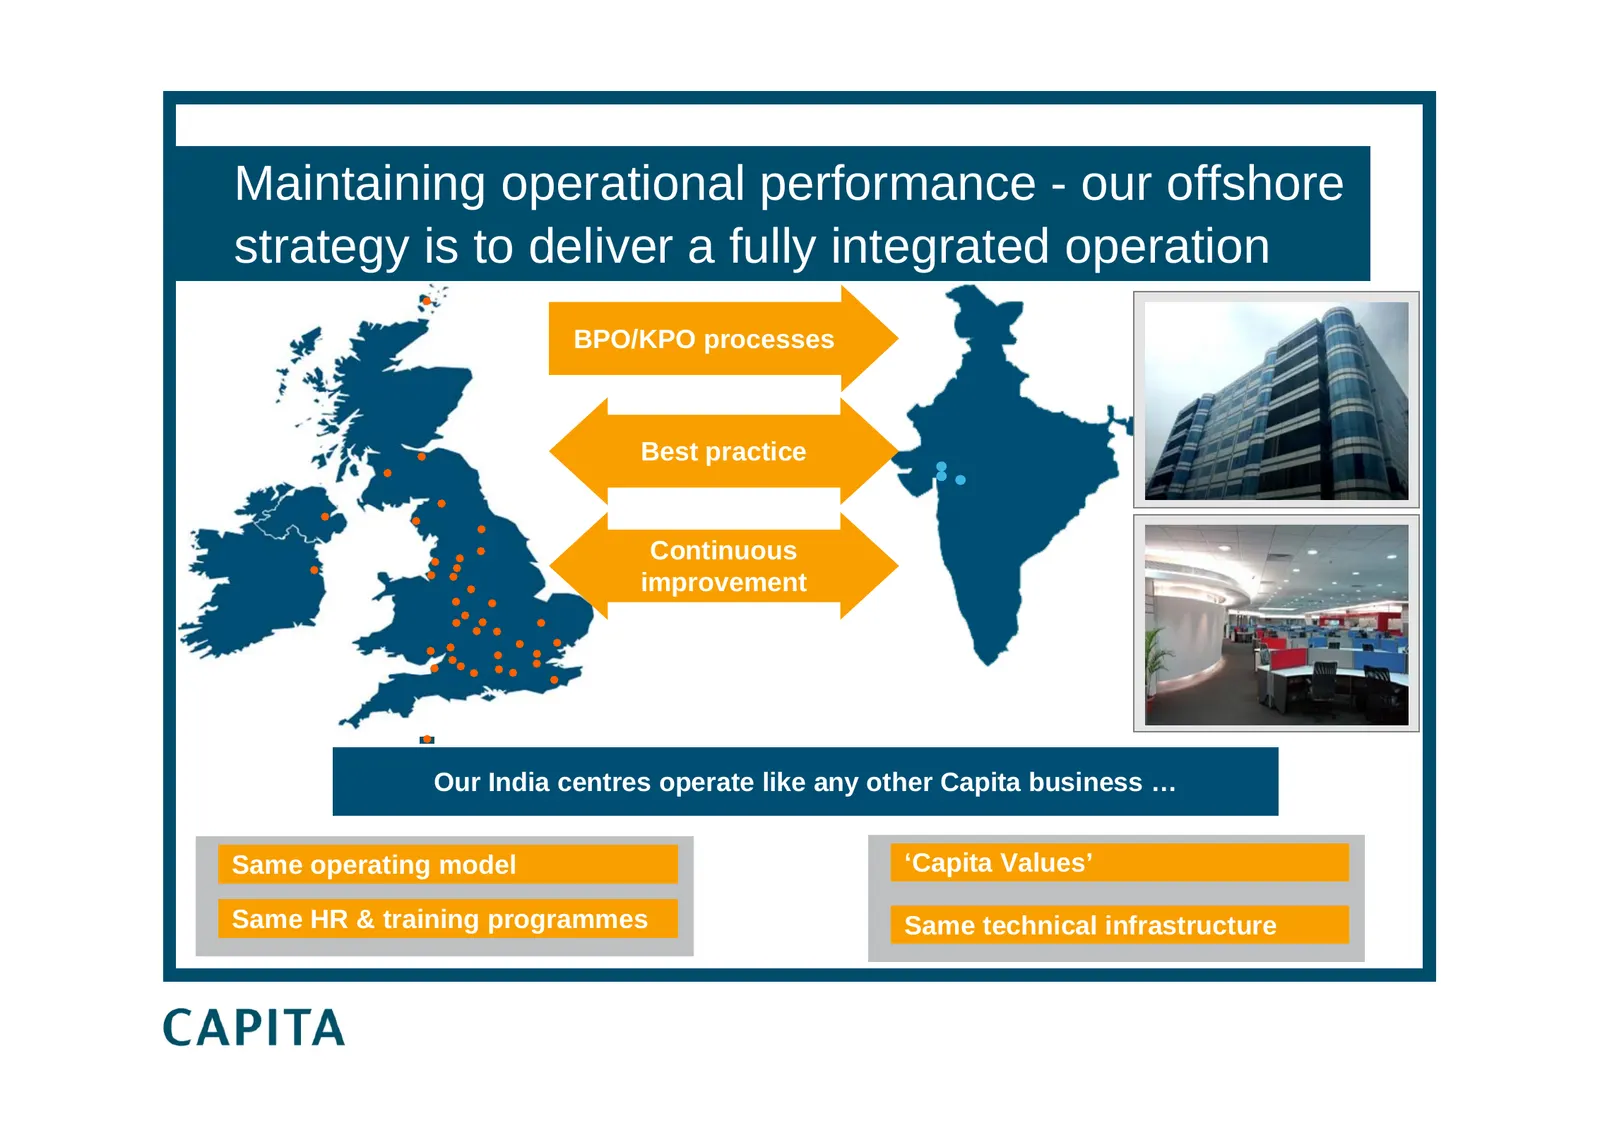
Slide 42: Our offshore strategy is to deliver a fully integrated operation
Maintaining operational performance - our offshore strategy is to deliver a fully integrated operation BPO/KPO processes Best practice Continuous improvement Our India centres operate like any other Capita business … Same operating model ‘Capita Values’ Same HR & training programmes Same technical i
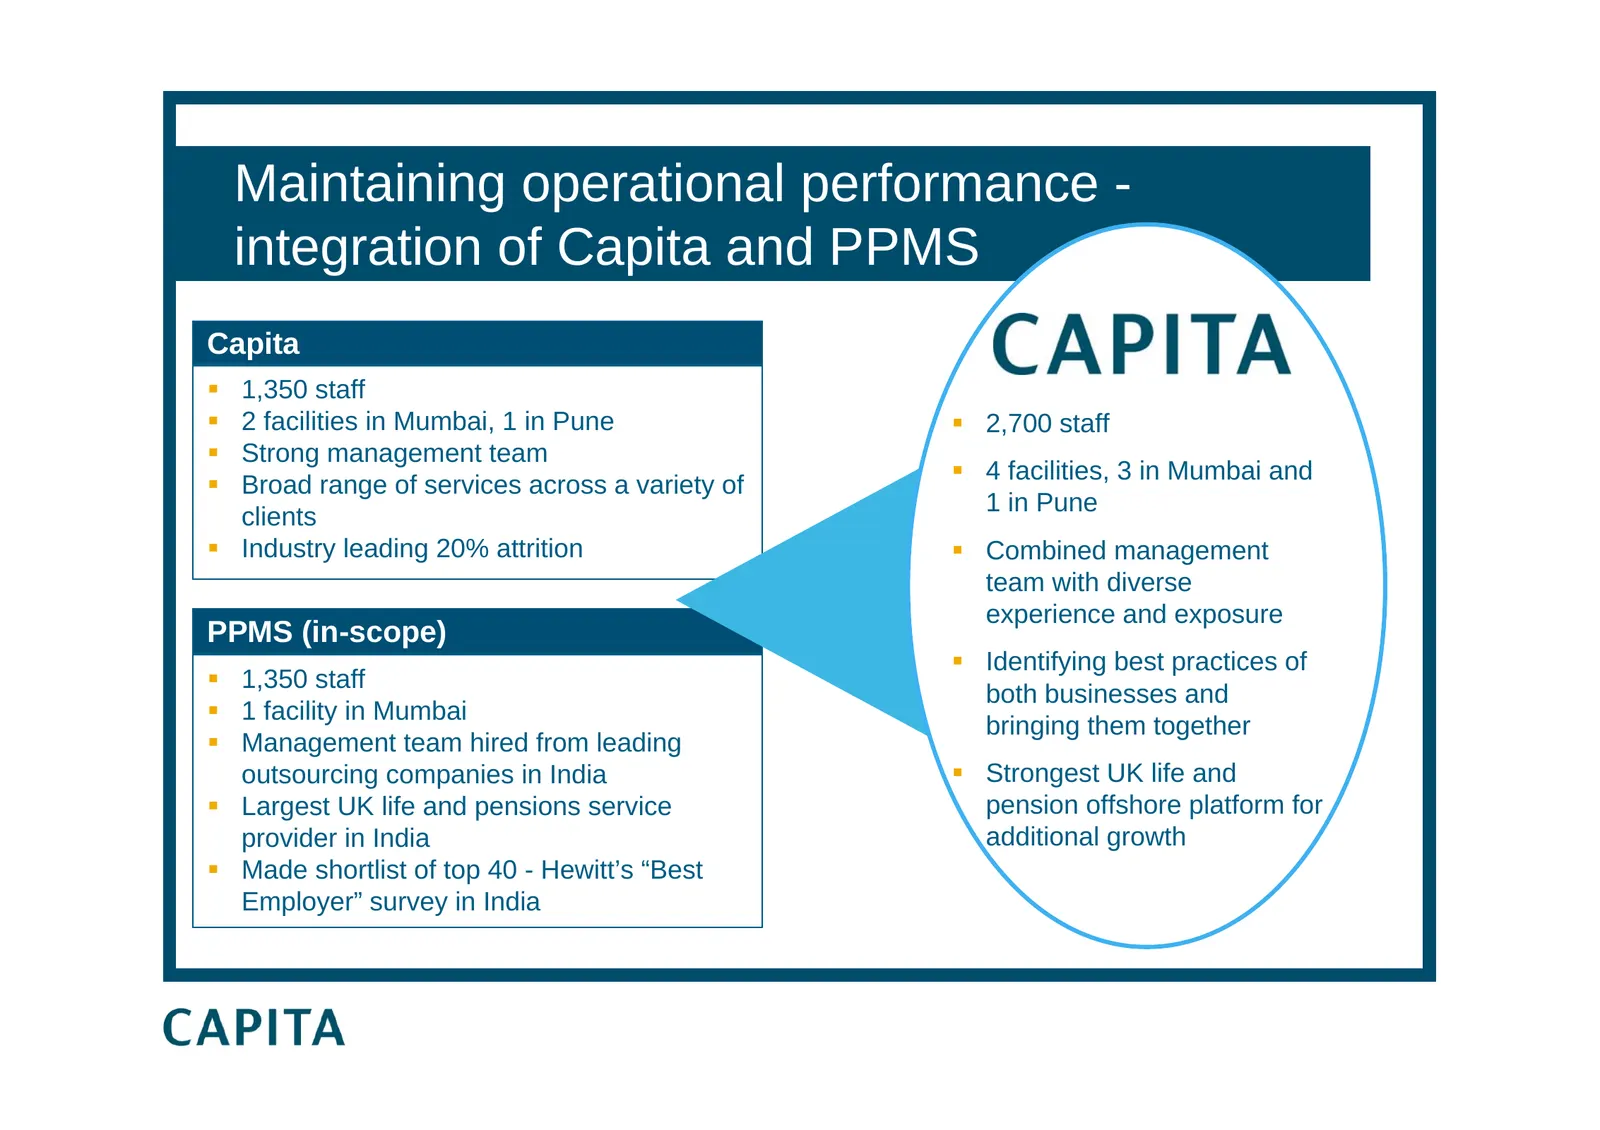
Slide 43: Integration of Capita and PPMS
Maintaining operational performance - integration of Capita and PPMS Capita 1,350 staff 2 facilities in Mumbai, 1 in Pune 2,700 staff Strong management team 4 facilities, 3 in Mumbai and Broad range of services across a variety of 1 in Pune clients Industry leading 20% attrition Comb
Slide 44: Strong operational track record
Maintaining operational performance - strong operational track record Busy period of major contract starts, transferred services including large element of offshoring Smoothly transitioned 5,800 people over last 10 months Tried and tested transition process but resource hungry Invested in ma
Slide 45: Contract example: TV Licensing
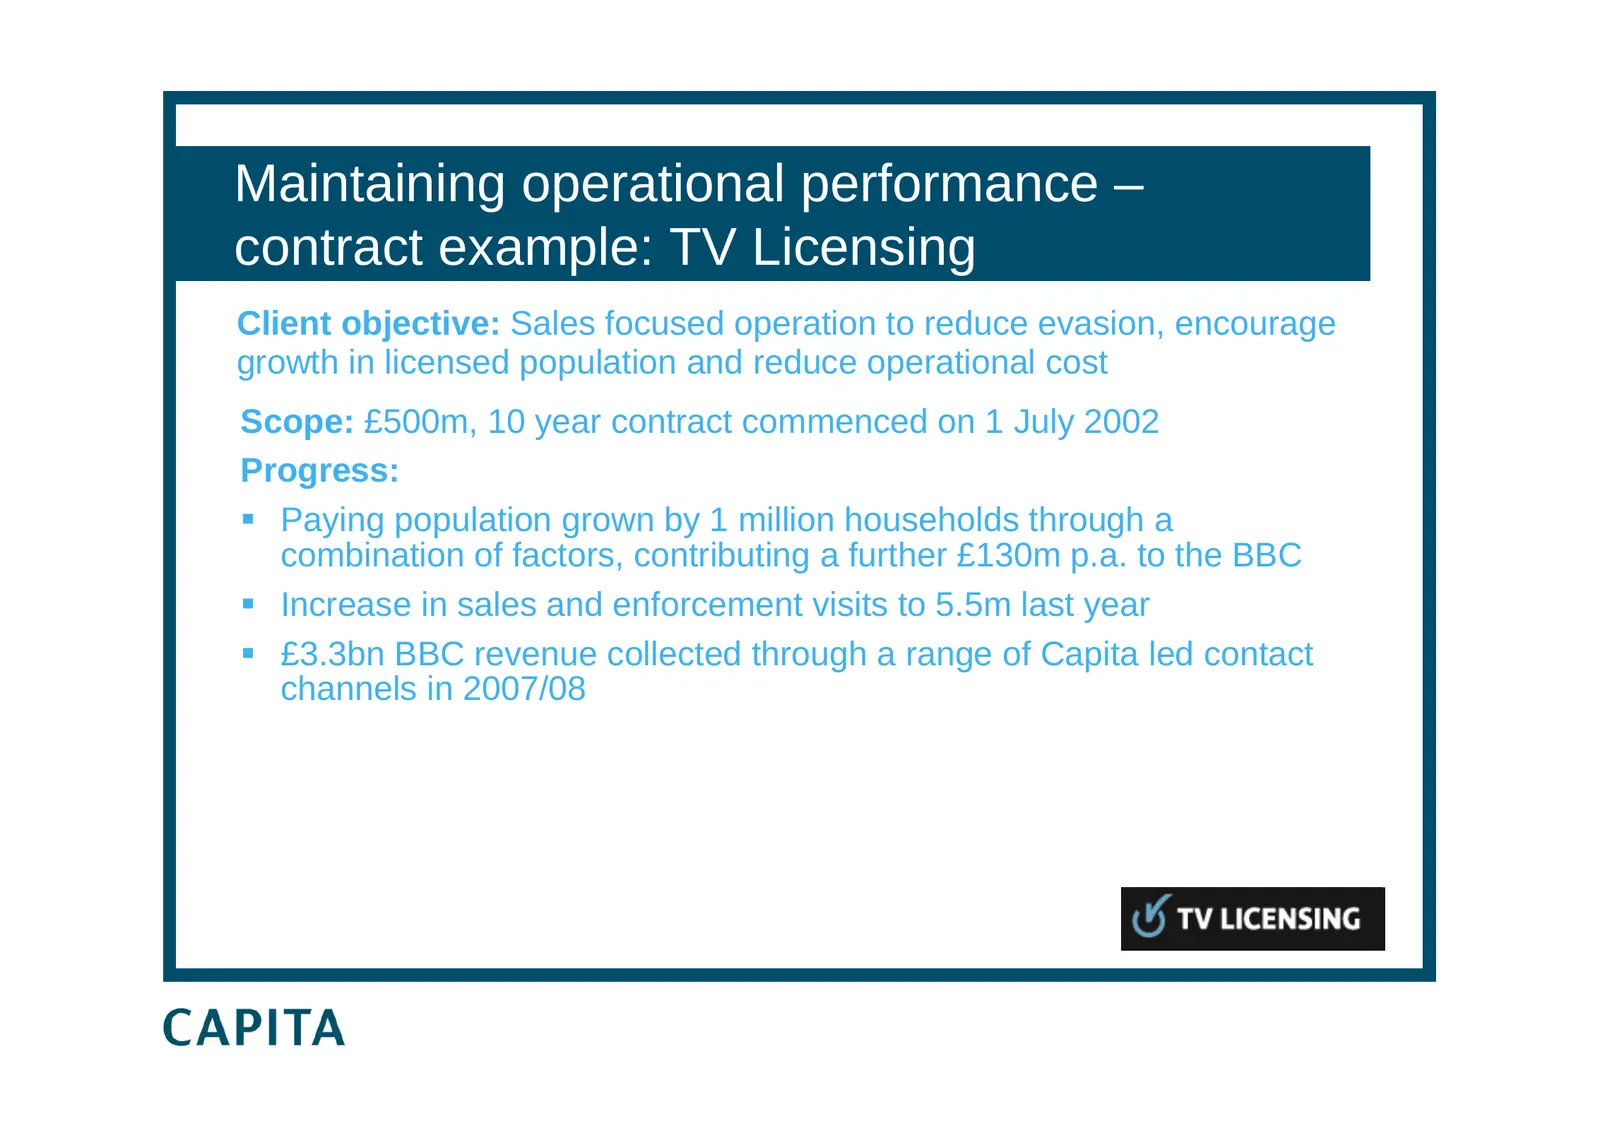
Maintaining operational performance – contract example: TV Licensing Client objective: Sales focused operation to reduce evasion, encourage growth in licensed population and reduce operational cost Scope: £500m, 10 year contract commenced on 1 July 2002 Progress: Paying population grown by 1 milli
Slide 46: Contract example: TV Licensing
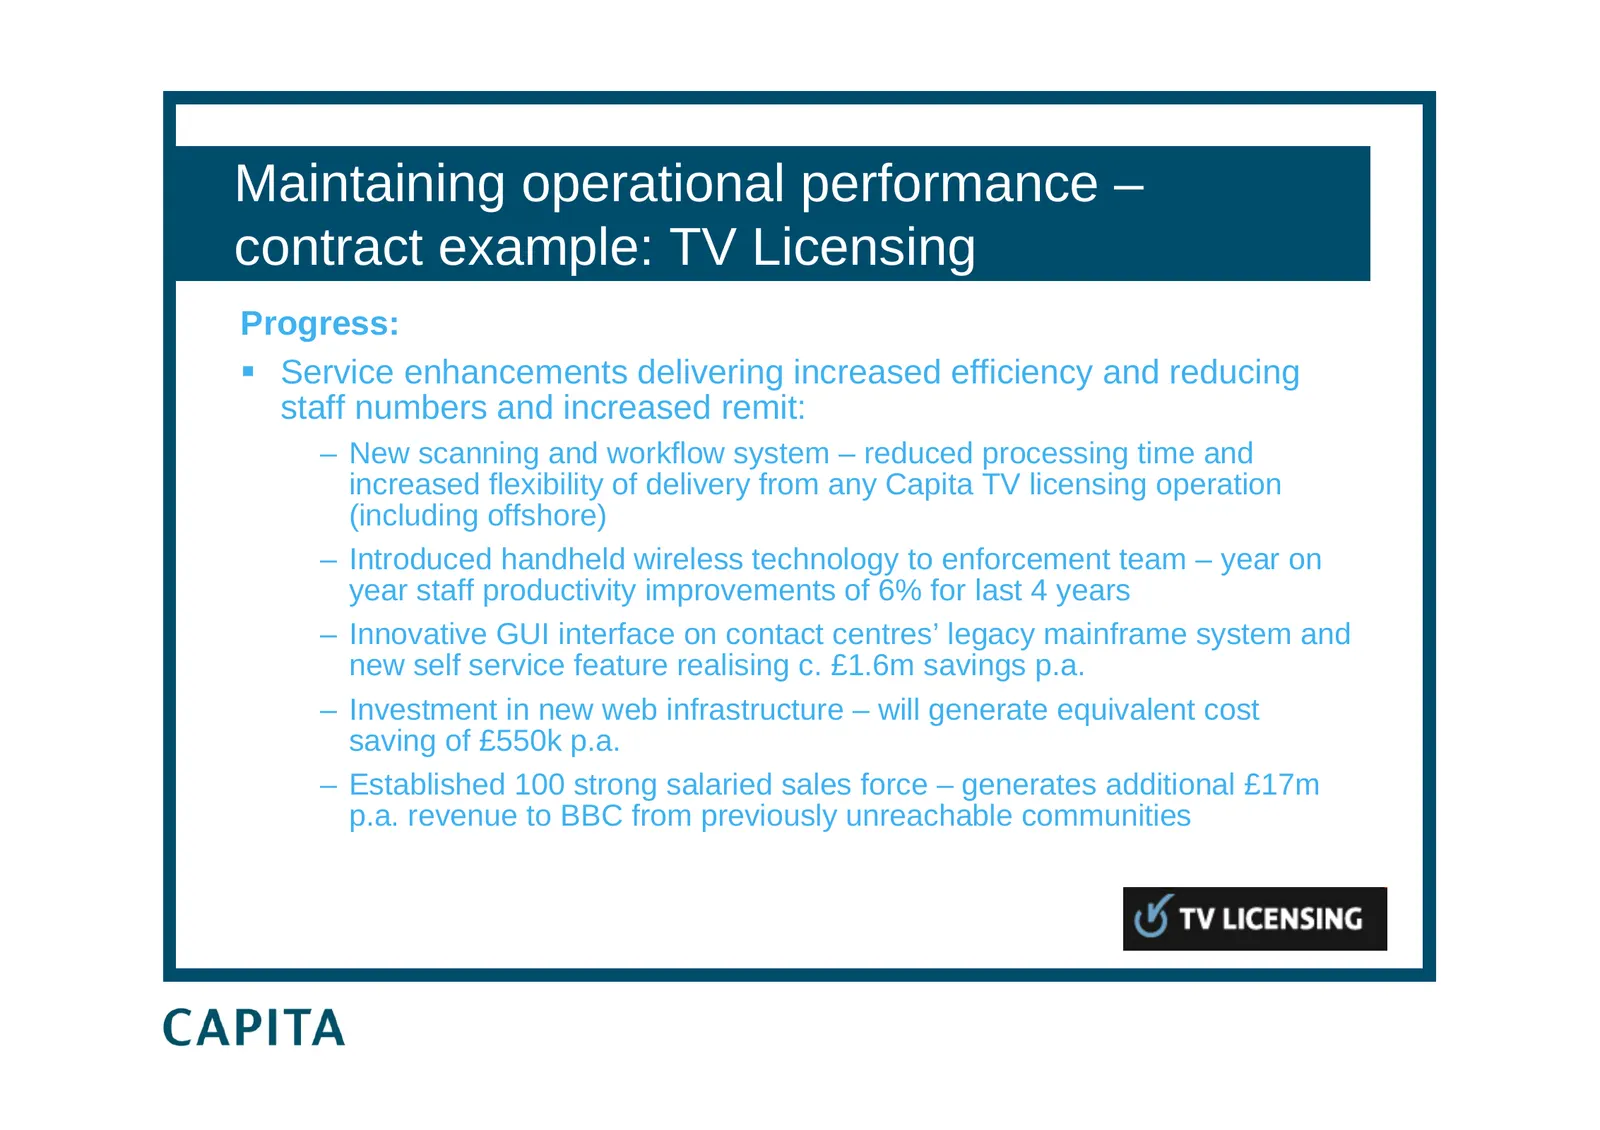
Maintaining operational performance – contract example: TV Licensing Progress: Service enhancements delivering increased efficiency and reducing staff numbers and increased remit: – New scanning and workflow system – reduced processing time and increased flexibility of delivery from any Capita TV
Slide 47: Contract example: Southampton City Council
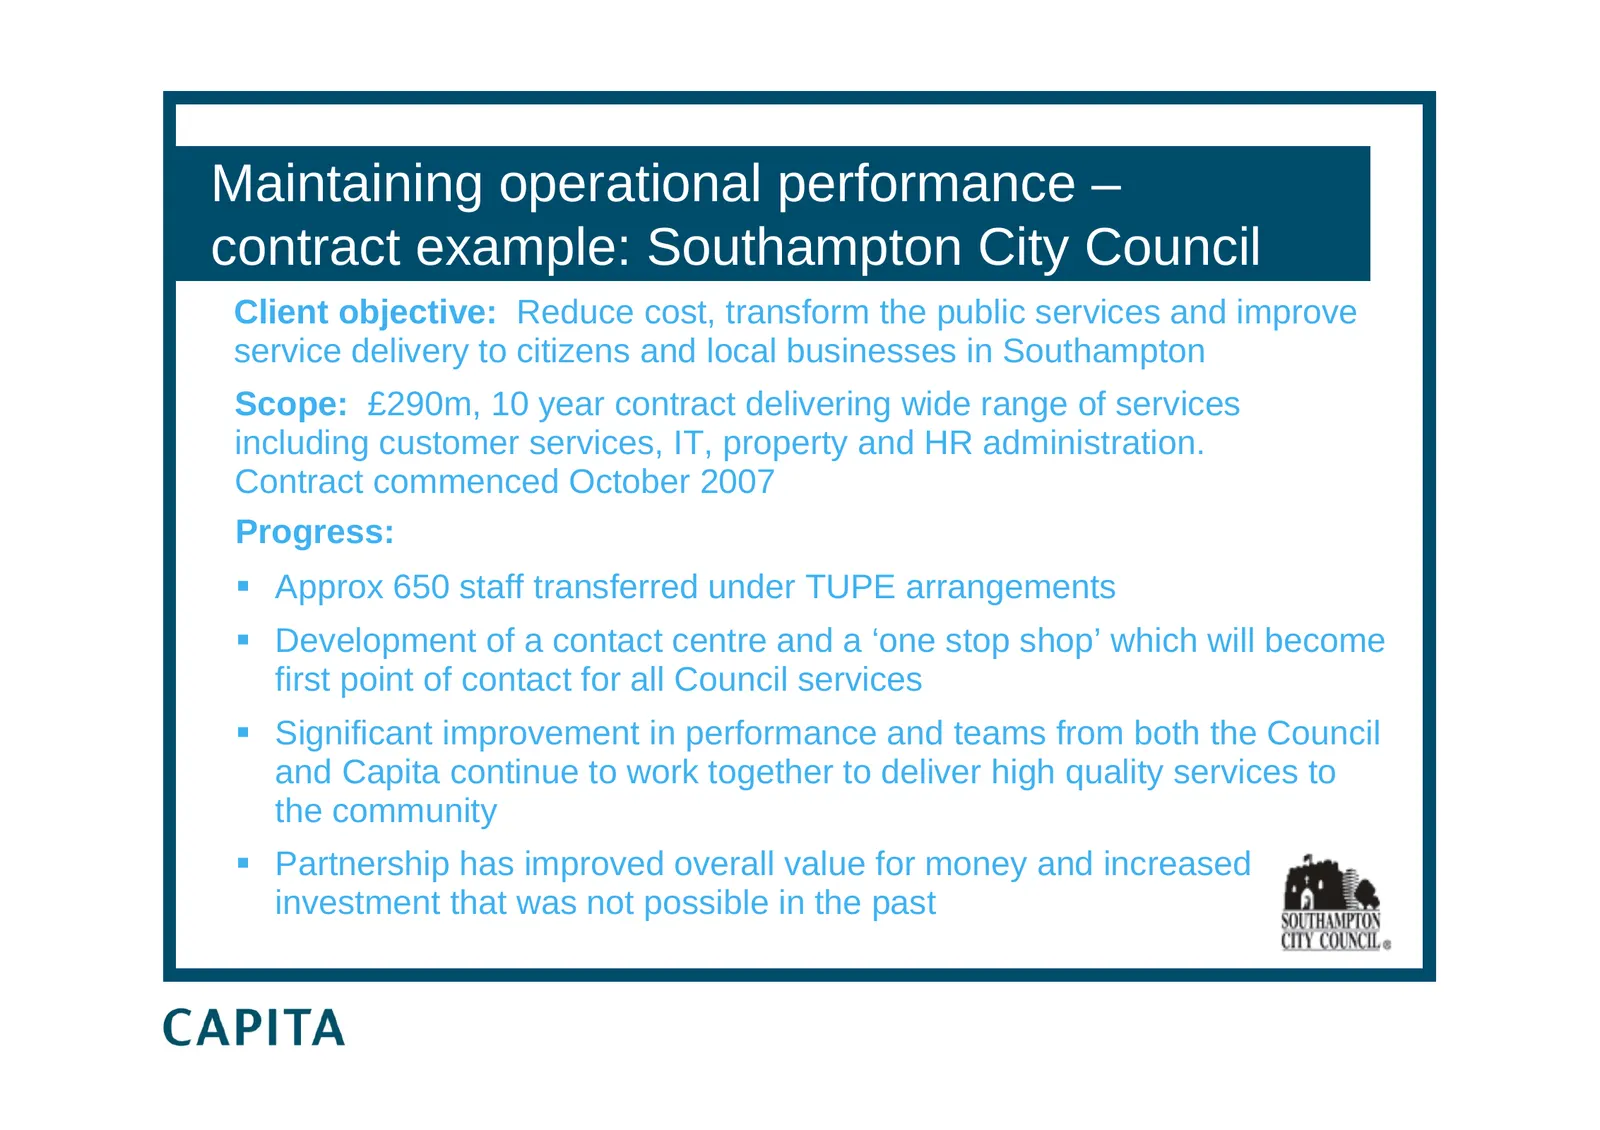
Maintaining operational performance – contract example: Southampton City Council Client objective: Reduce cost, transform the public services and improve service delivery to citizens and local businesses in Southampton Scope: £290m, 10 year contract delivering wide range of services including custom
Slide 48: Contract example: Co-operative Insurance
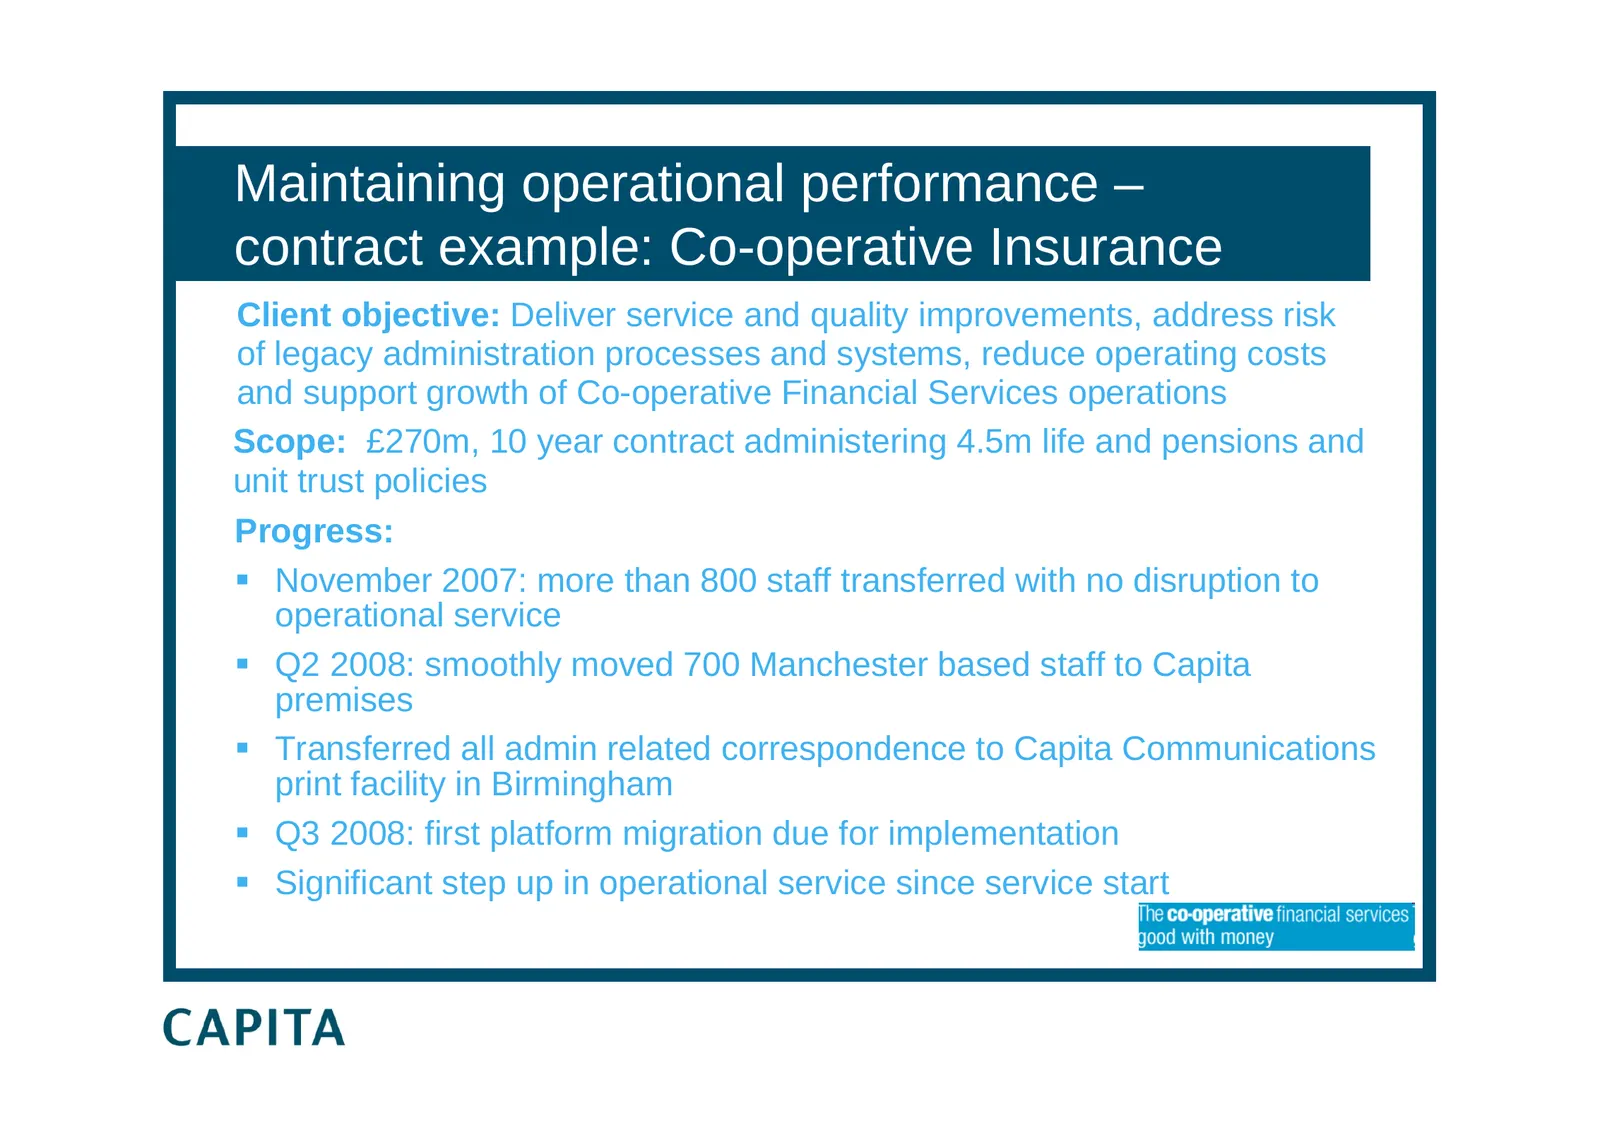
Maintaining operational performance – contract example: Co-operative Insurance Client objective: Deliver service and quality improvements, address risk of legacy administration processes and systems, reduce operating costs and support growth of Co-operative Financial Services operations Scope: £270m
Slide 49: Optimising resources and infrastructure
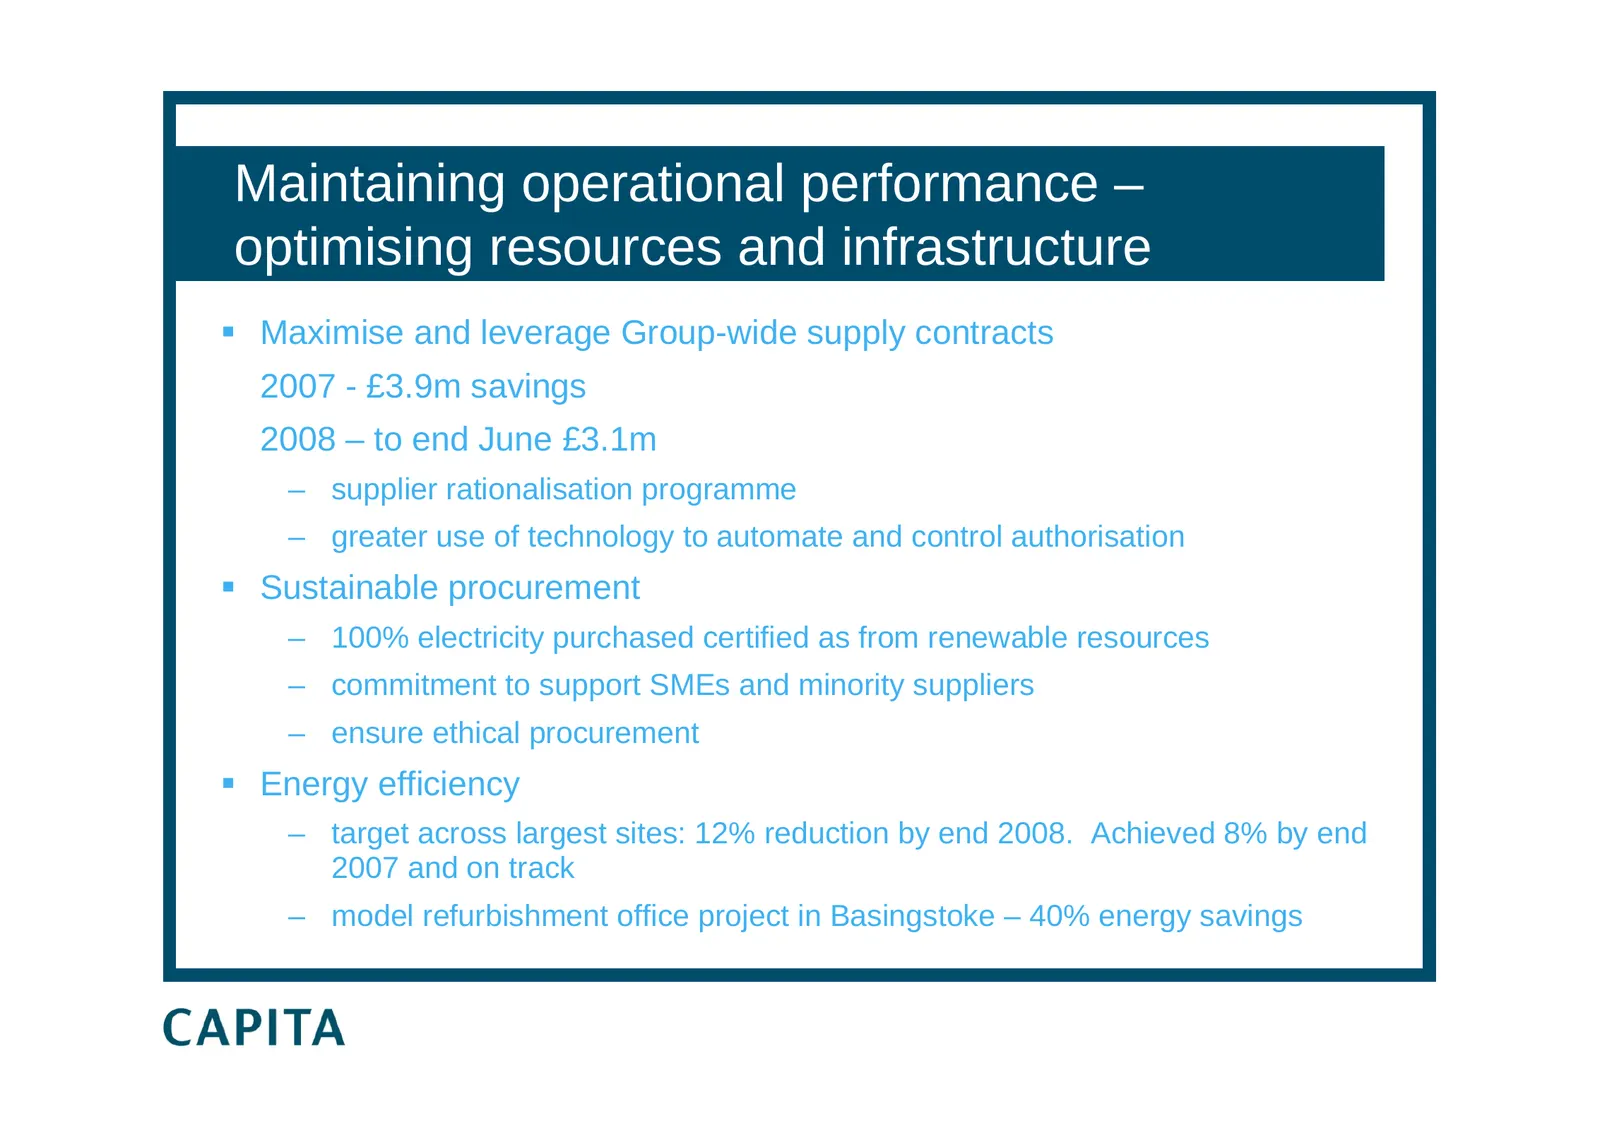
Maintaining operational performance – optimising resources and infrastructure Maximise and leverage Group-wide supply contracts 2007 - £3.9m savings 2008 – to end June £3.1m – supplier rationalisation programme – greater use of technology to automate and control authorisation Sustainable procure
Slide 50: What our clients say
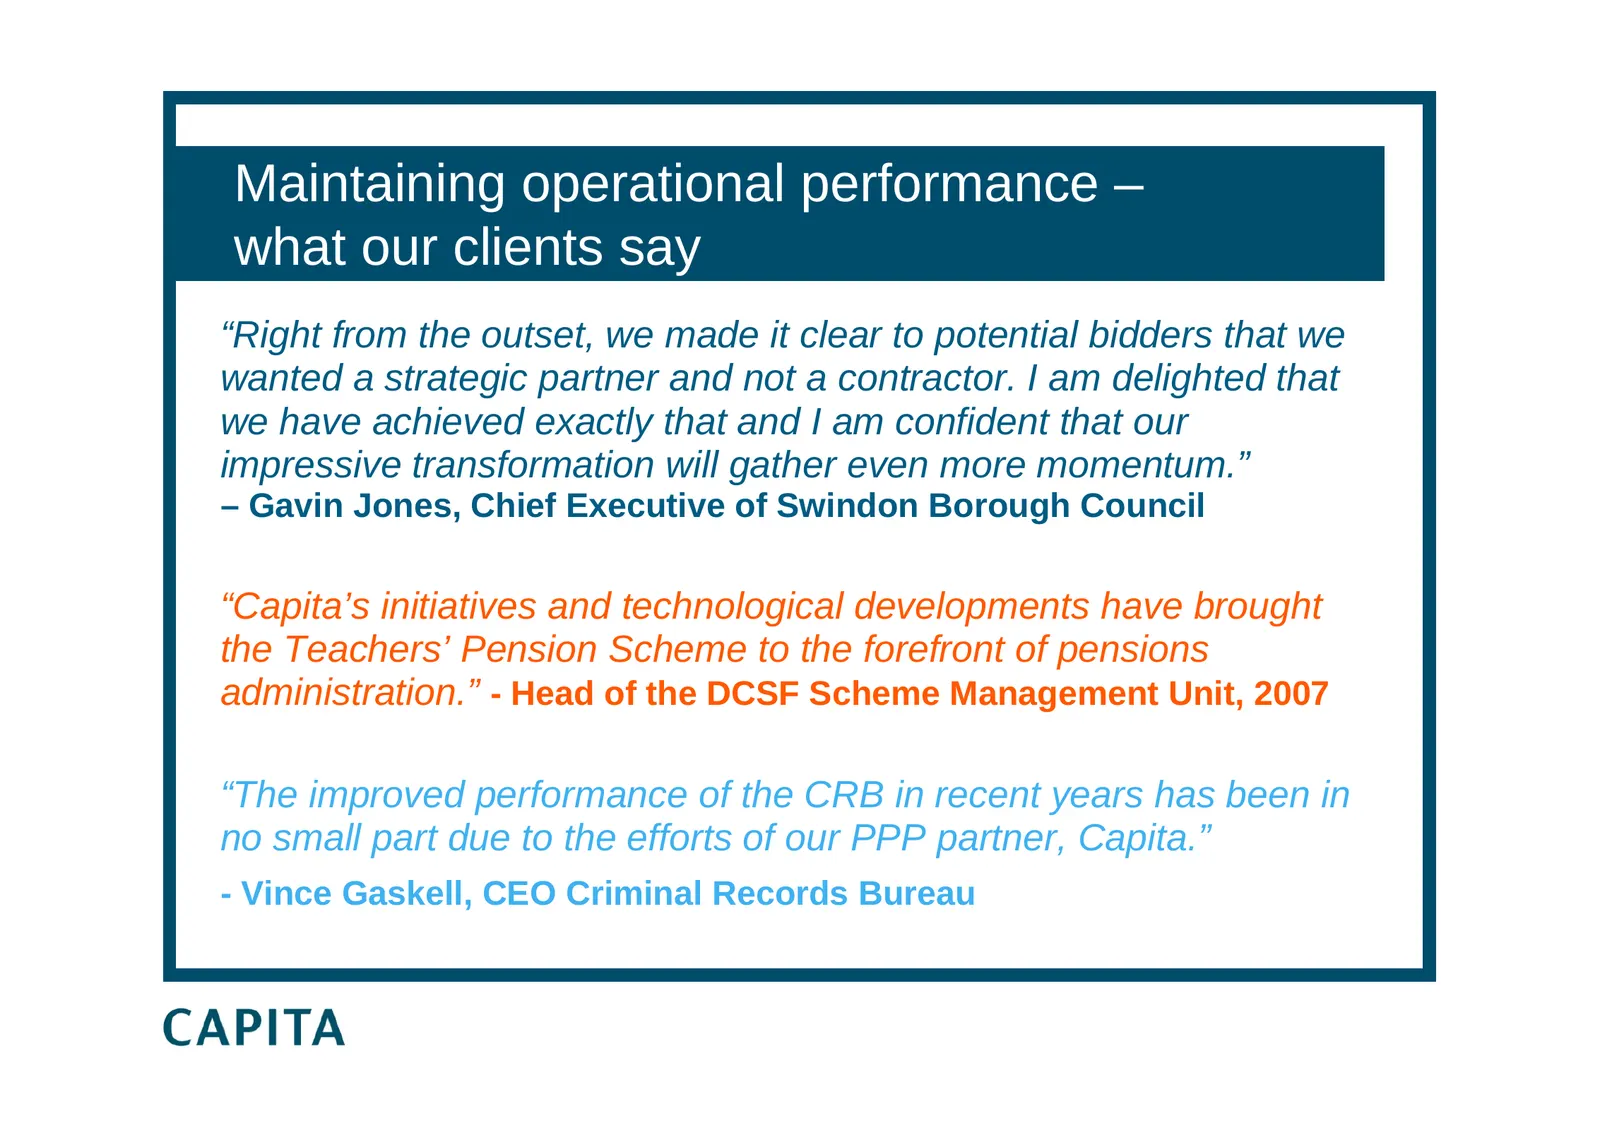
Maintaining operational performance – what our clients say “Right from the outset, we made it clear to potential bidders that we wanted a strategic partner and not a contractor. I am delighted that we have achieved exactly that and I am confident that our impressive transformation will gather even m
Slide 51: Prospects
Prospects Paul Pindar Chief Executive
Slide 52: Prospects
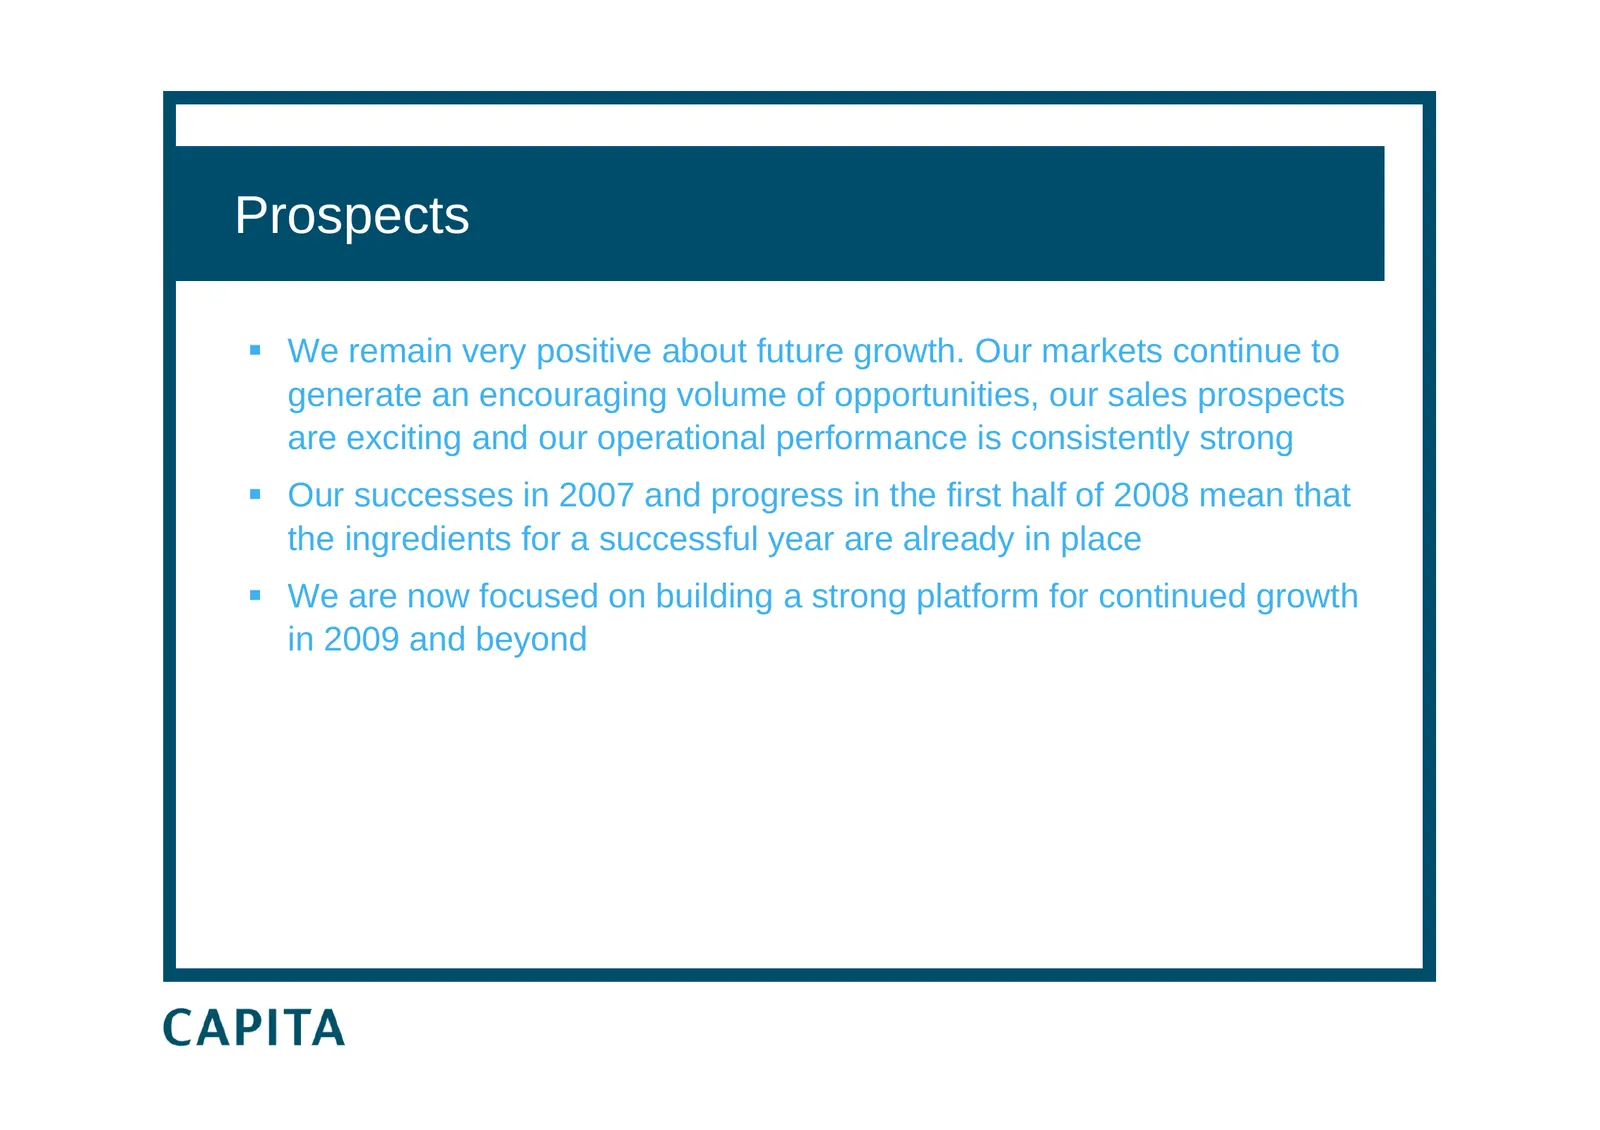
Prospects We remain very positive about future growth. Our markets continue to generate an encouraging volume of opportunities, our sales prospects are exciting and our operational performance is consistently strong Our successes in 2007 and progress in the first half of 2008 mean that the ingre
Slide 53: Results for the 6 months to 30 June 2008
Results for the 6 months to 30 June 2008
Source: Internet Archive copy of investors.capita.com
More decks from Capita plc
 H1 2026 Earnings Presentation44 slides · Aug 4, 2026
 FY2025 Earnings Presentation46 slides · March 2026
 Merger or Acquisition (March 2026)10 slides · March 2026
 H1 2025 Earnings Presentation51 slides · August 2025
 FY2024 Earnings Presentation44 slides · March 2025
 H1 2024 Earnings Presentation33 slides · Aug 1, 2024