Blue Bird Corporation · NASDAQ:BLBD
Blue Bird — Investor Presentation (February 2025)
36 slides from Blue Bird's investor presentation, February 2025
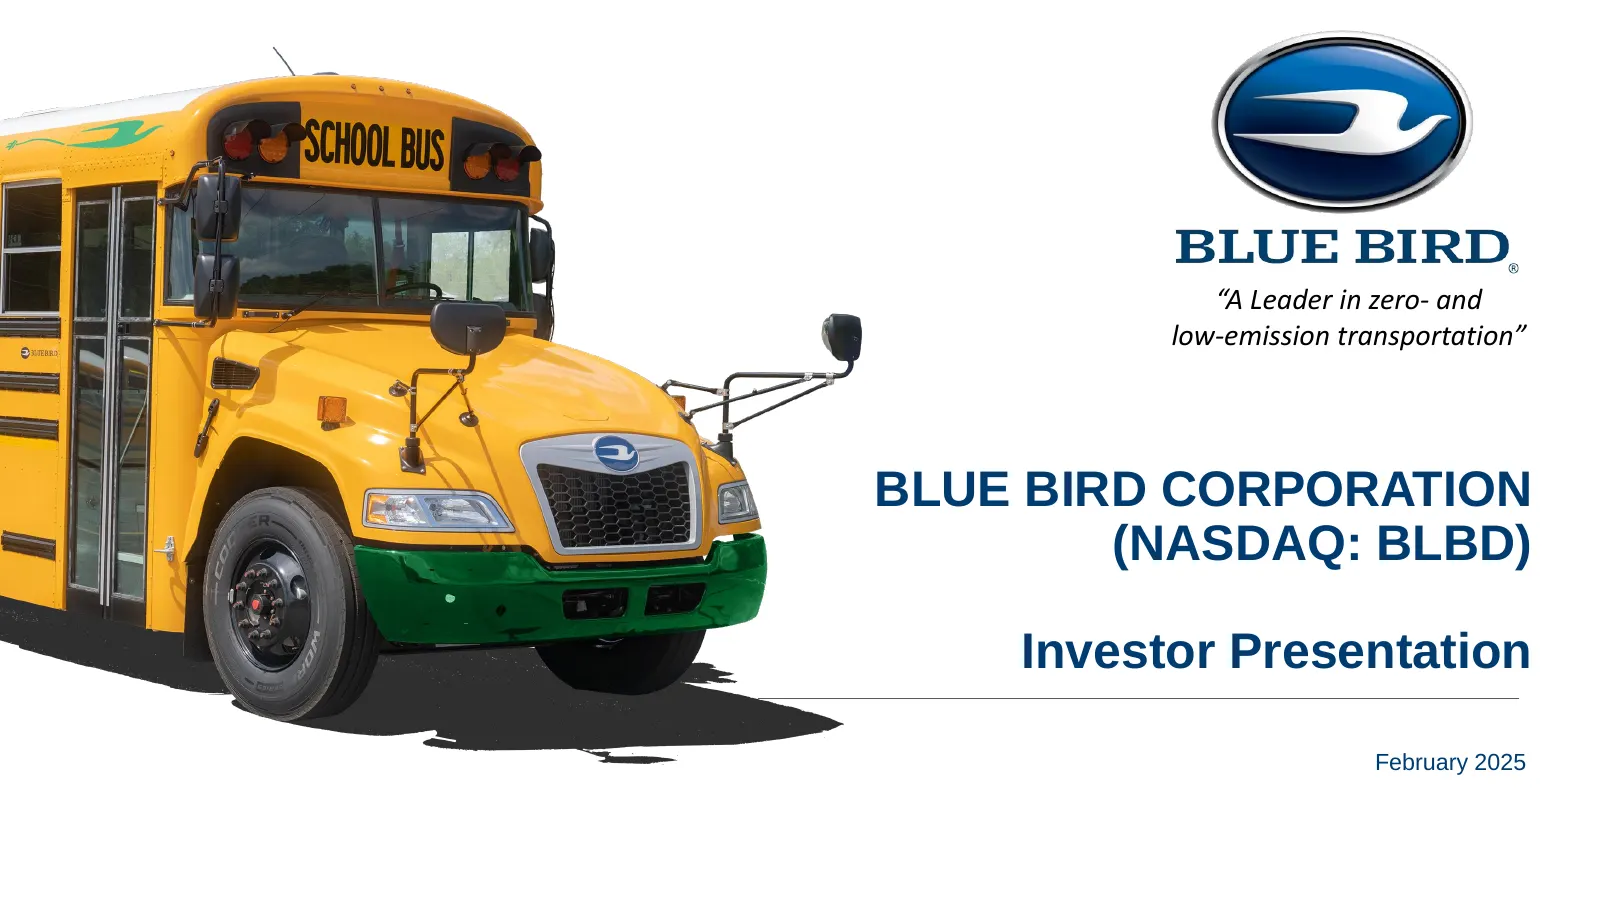
Slide 1: Blue Bird Corporation Investor Presentation February 2025
“A Leader in zero- and low-emission transportation” BLUE BIRD CORPORATION (NASDAQ: BLBD) Investor Presentation February 2025
Slide 2: Important Disclaimers: Forward Looking Statements
Important Disclaimers Forward Looking Statements This presentation includes forward-looking statements within the meaning of the “safe harbor” provisions of the Private Securities Litigation Reform Act of 1995. These forward-looking statements relate to expectations for future financial performance,
Slide 3: Important Disclaimers: Non-GAAP Financial Measures
Important Disclaimers Non-GAAP Financial Measures This presentation may include the following non-GAAP financial measures: “Adjusted EBITDA,” "Adjusted EBITDA Margin," “Adjusted Net Income,” “Adjusted Diluted Earnings per Share,” “Free Cash Flow” and “Adjusted Free Cash Flow.” Adjusted EBITDA is def
Slide 4: Agenda
Agenda Investment Highlights School Bus Industry Overview Company & Product Highlights FY2025 Objectives Growth Runway 4
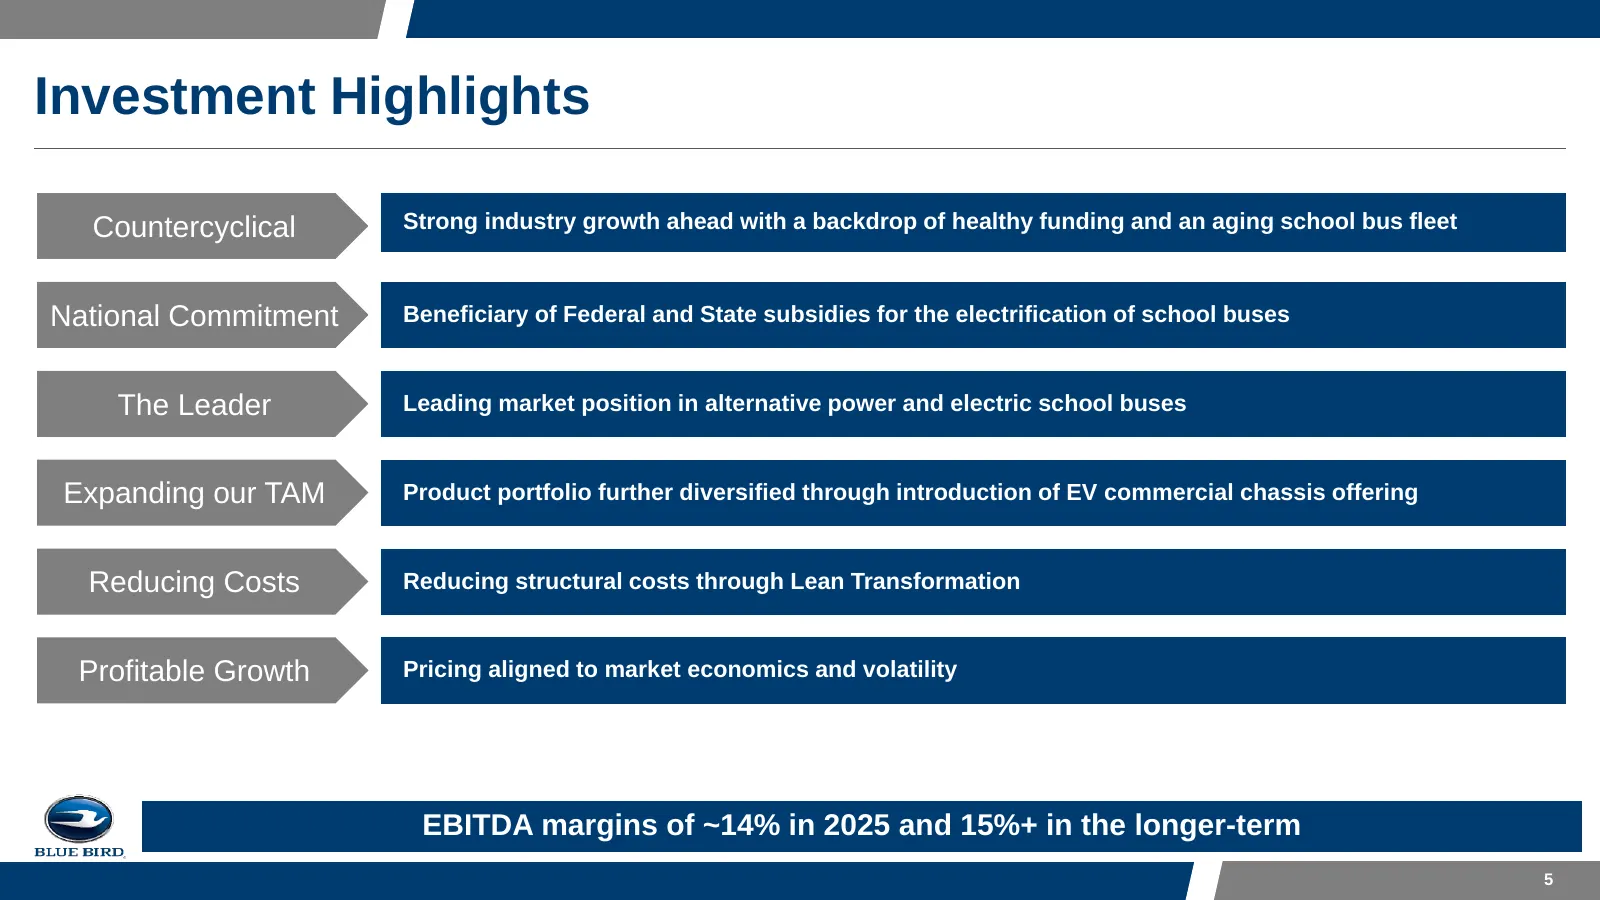
Slide 5: Investment Highlights
Investment Highlights Countercyclical Strong industry growth ahead with a backdrop of healthy funding and an aging school bus fleet National Commitment Beneficiary of Federal and State subsidies for the electrification of school buses The Leader Leading market position in alternative power and elect
Slide 6: School Bus Industry Overview
School Bus Industry Overview 6
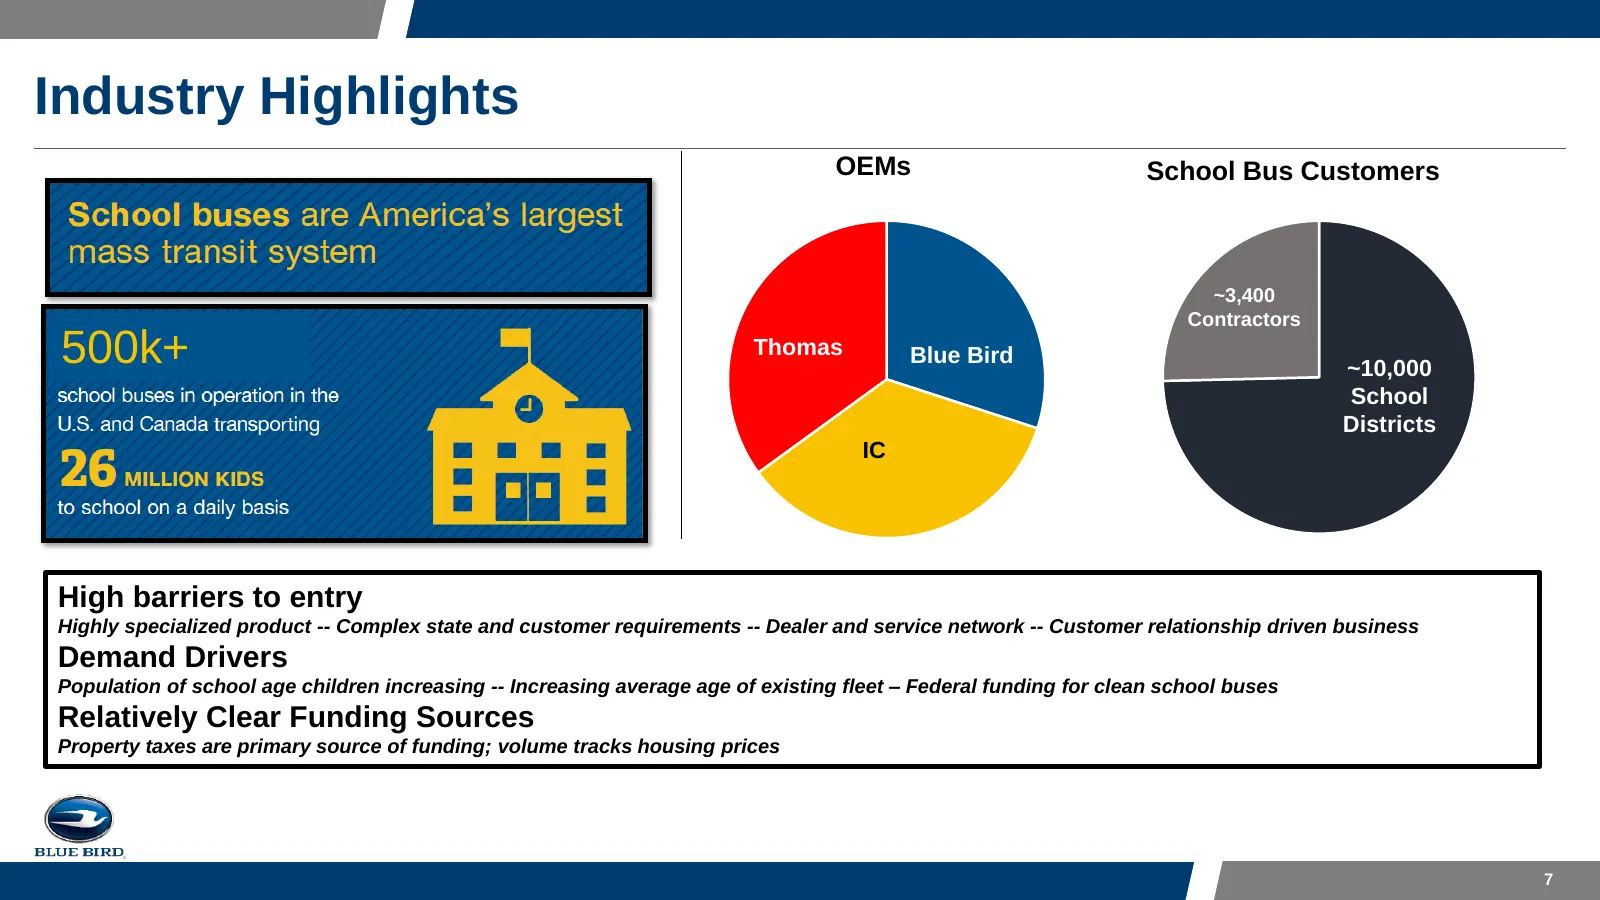
Slide 7: Industry Highlights
Industry Highlights OEMs School Bus Customers ~3,400 Contractors 500k+ Thomas Blue Bird ~10,000 School Districts IC High barriers to entry Highly specialized product -- Complex state and customer requirements -- Dealer and service network -- Customer relationship driven business Demand Drivers Popul
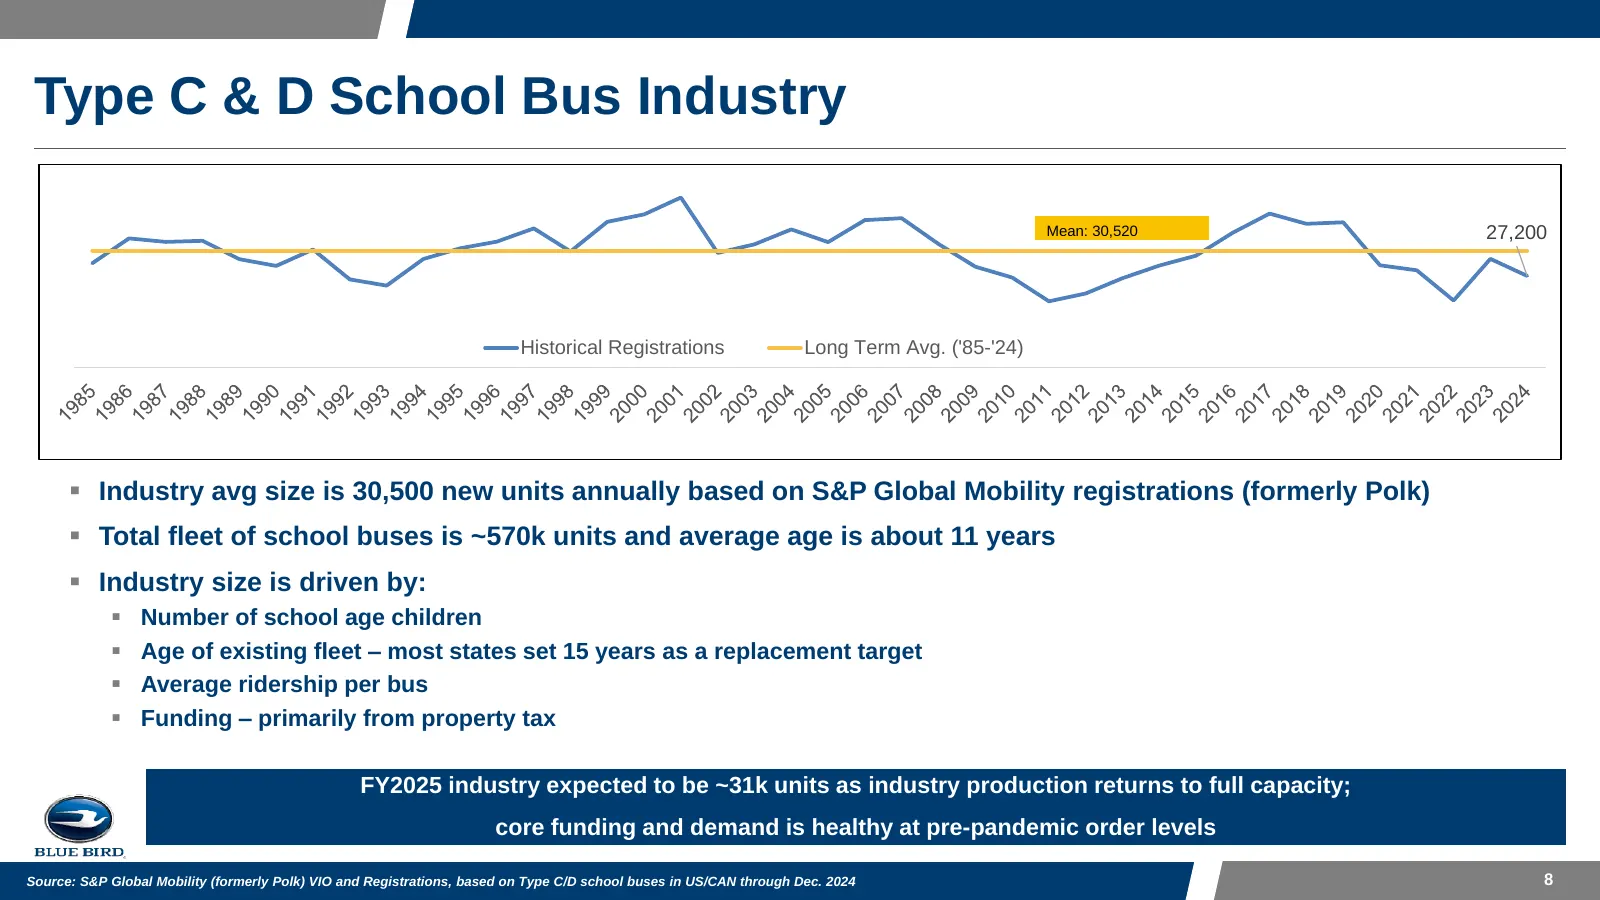
Slide 8: Type C & D School Bus Industry
Type C & D School Bus Industry Mean: 30,520 27,200 Historical Registrations Long Term Avg. ('85-'24) ▪ Industry avg size is 30,500 new units annually based on S&P Global Mobility registrations (formerly Polk) ▪ Total fleet of school buses is ~570k units and average age is about 11 years ▪ Industry s
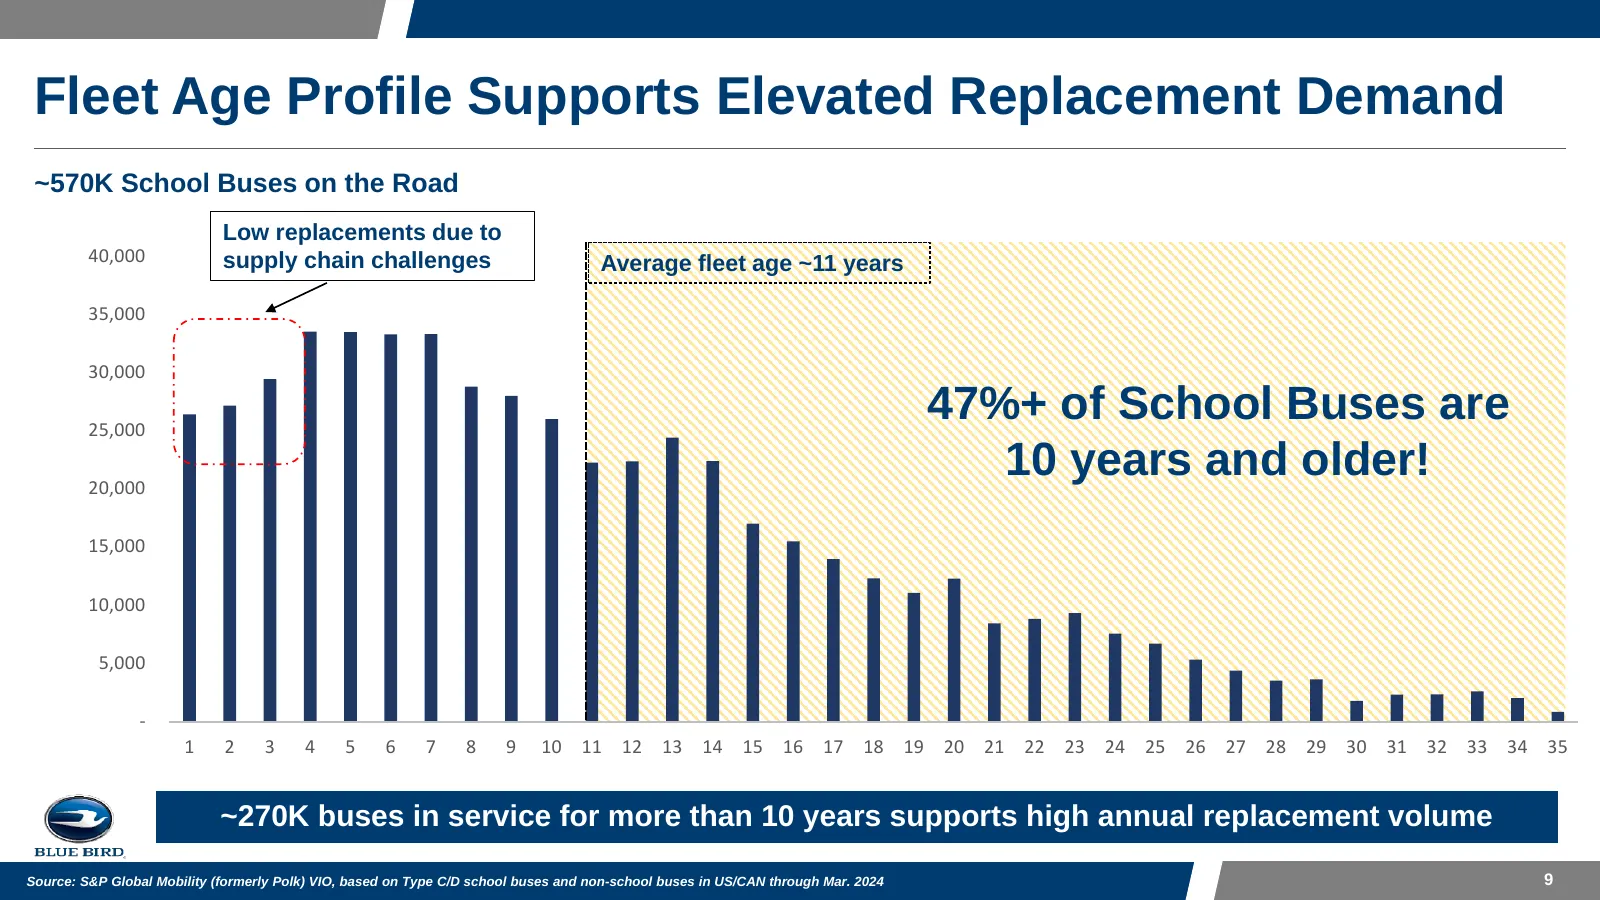
Slide 9: Fleet Age Profile Supports Elevated Replacement Demand
Fleet Age Profile Supports Elevated Replacement Demand ~570K School Buses on the Road Low replacements due to 40,000 supply chain challenges Average fleet age ~11 years 35,000 30,000 25,000 47%+ of School Buses are 20,000 10 years and older! 15,000 10,000 5,000 - 1 2 3 4 5 6 7 8 9 10 11 12 13 14 15
Slide 10: Company & Product Highlights
Company & Product Highlights 10
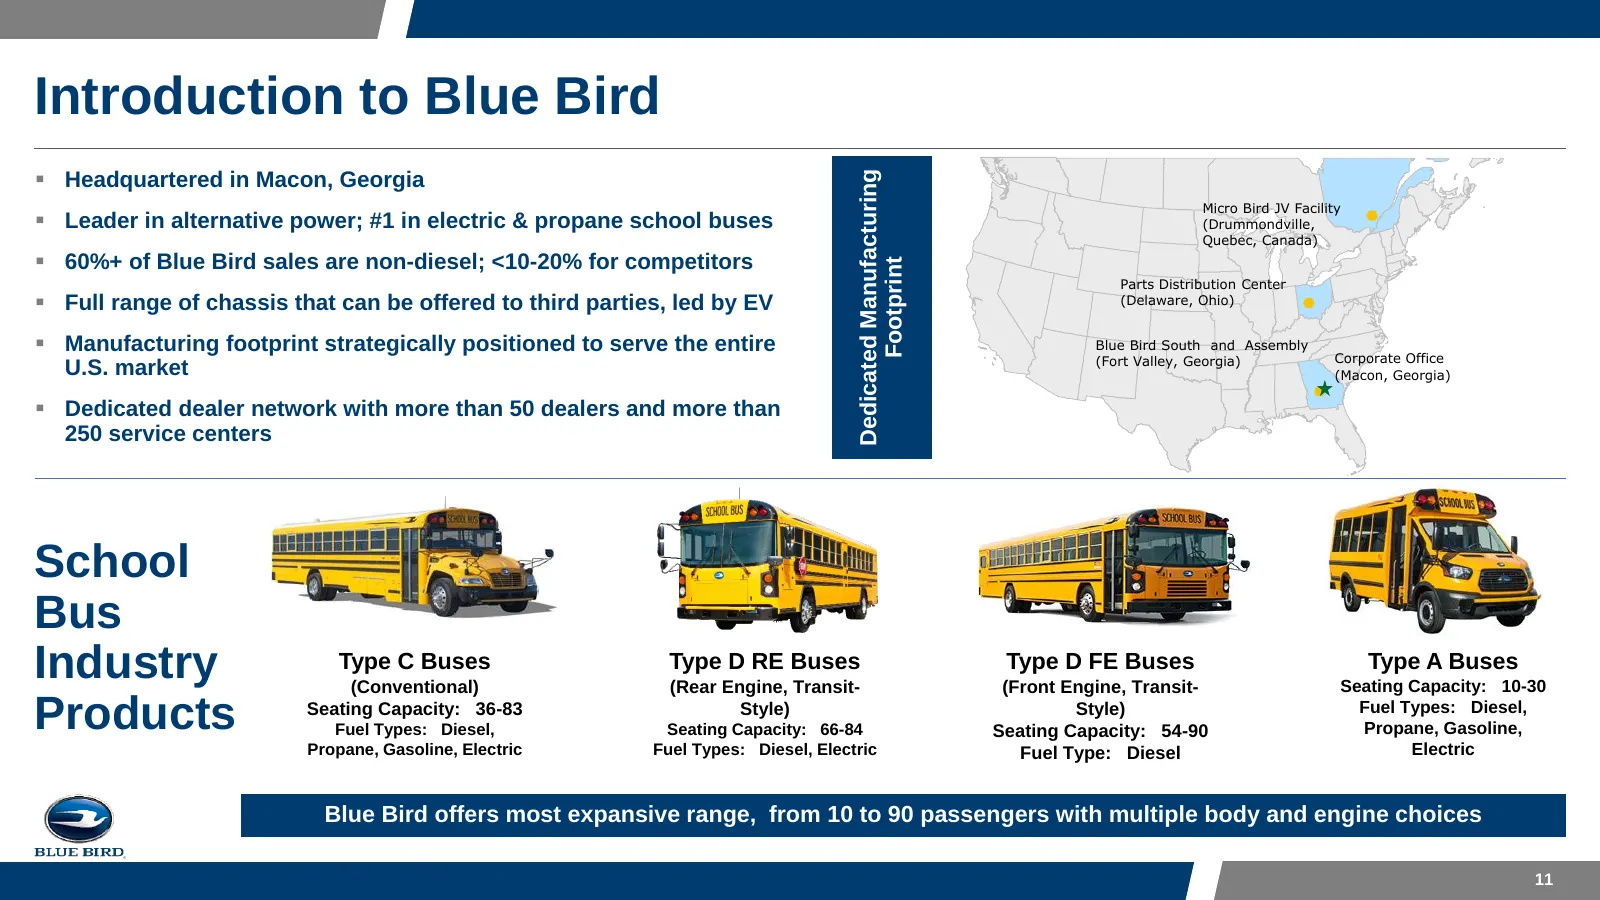
Slide 11: Introduction to Blue Bird
Introduction to Blue Bird ▪ Headquartered in Macon, Georgia Dedicated Manufacturing Micro Bird JV Facility ▪ Leader in alternative power; #1 in electric & propane school buses (Drummondville, Quebec, Canada) ▪ 60%+ of Blue Bird sales are non-diesel; <10-20% for competitors Footprint Parts Distributi
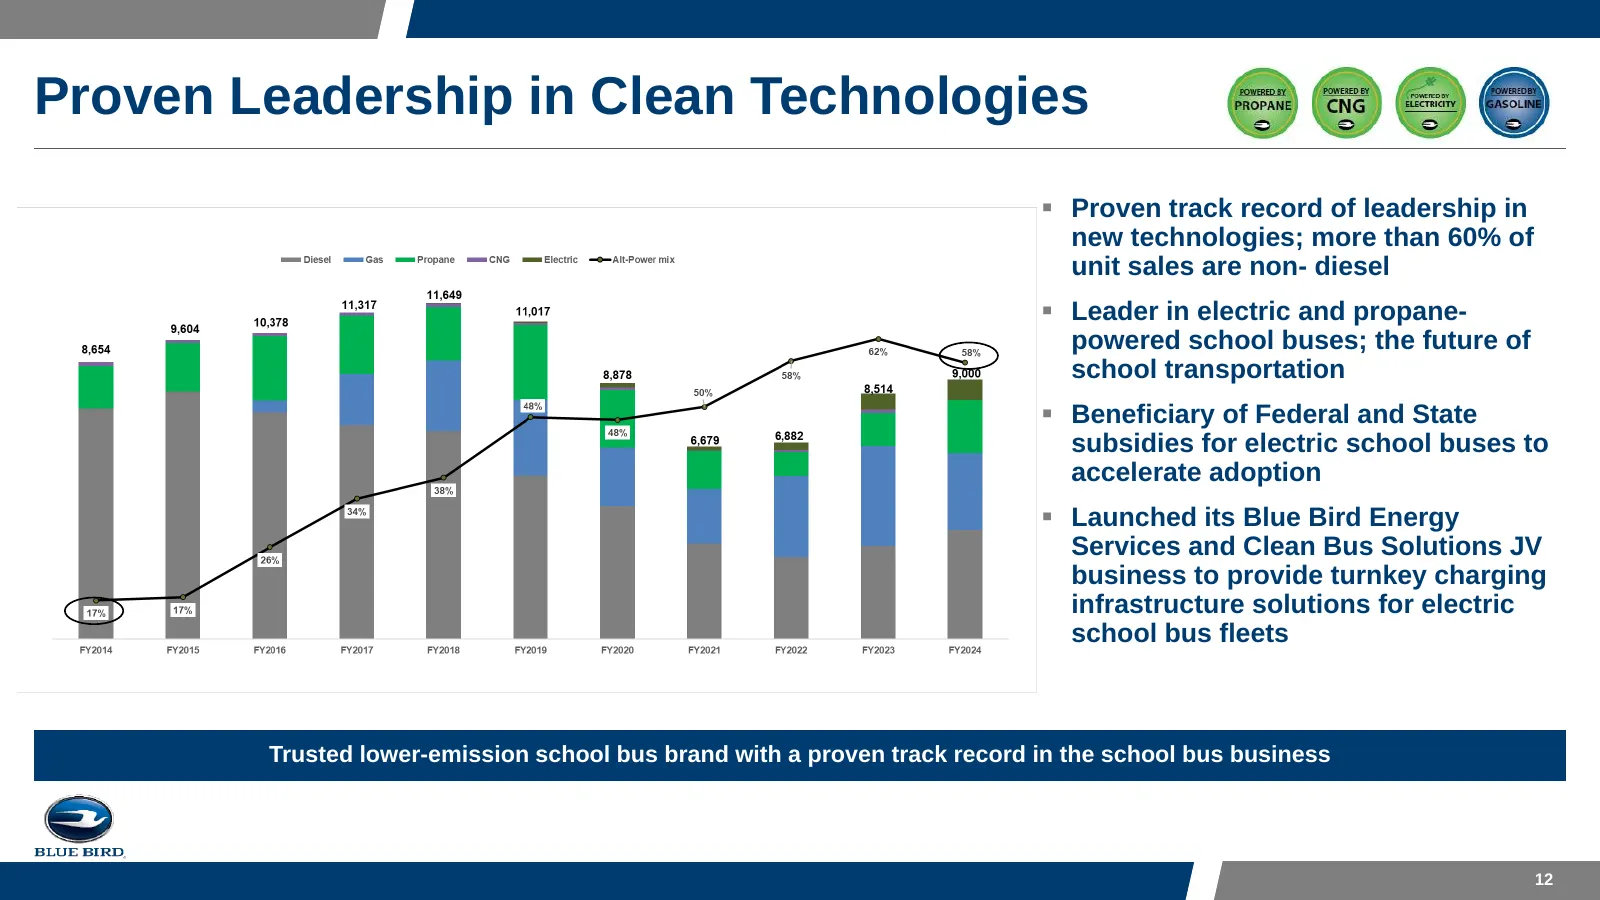
Slide 12: Proven Leadership in Clean Technologies
Proven Leadership in Clean Technologies ▪ Proven track record of leadership in new technologies; more than 60% of unit sales are non- diesel ▪ Leader in electric and propane- powered school buses; the future of school transportation ▪ Beneficiary of Federal and State subsidies for electric school bu
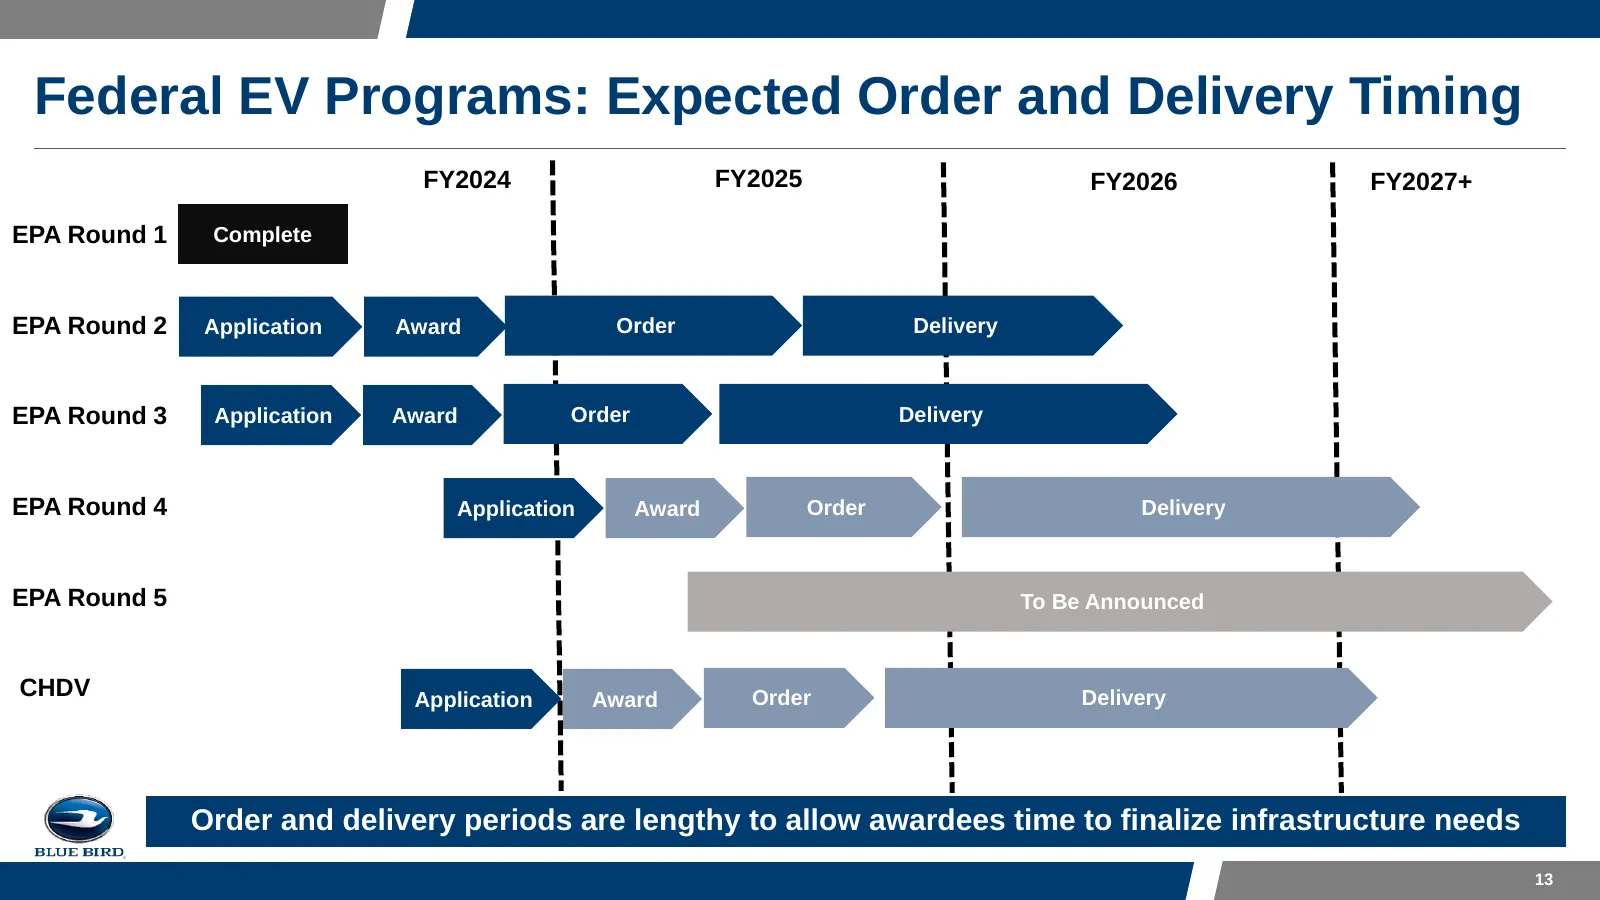
Slide 13: Federal EV Programs: Expected Order and Delivery Timing
Federal EV Programs: Expected Order and Delivery Timing FY2024 FY2025 FY2026 FY2027+ EPA Round 1 Complete EPA Round 2 Application Award Order Delivery EPA Round 3 Application Award Order Delivery EPA Round 4 Application Award Order Delivery EPA Round 5 To Be Announced CHDV Application Award Order De
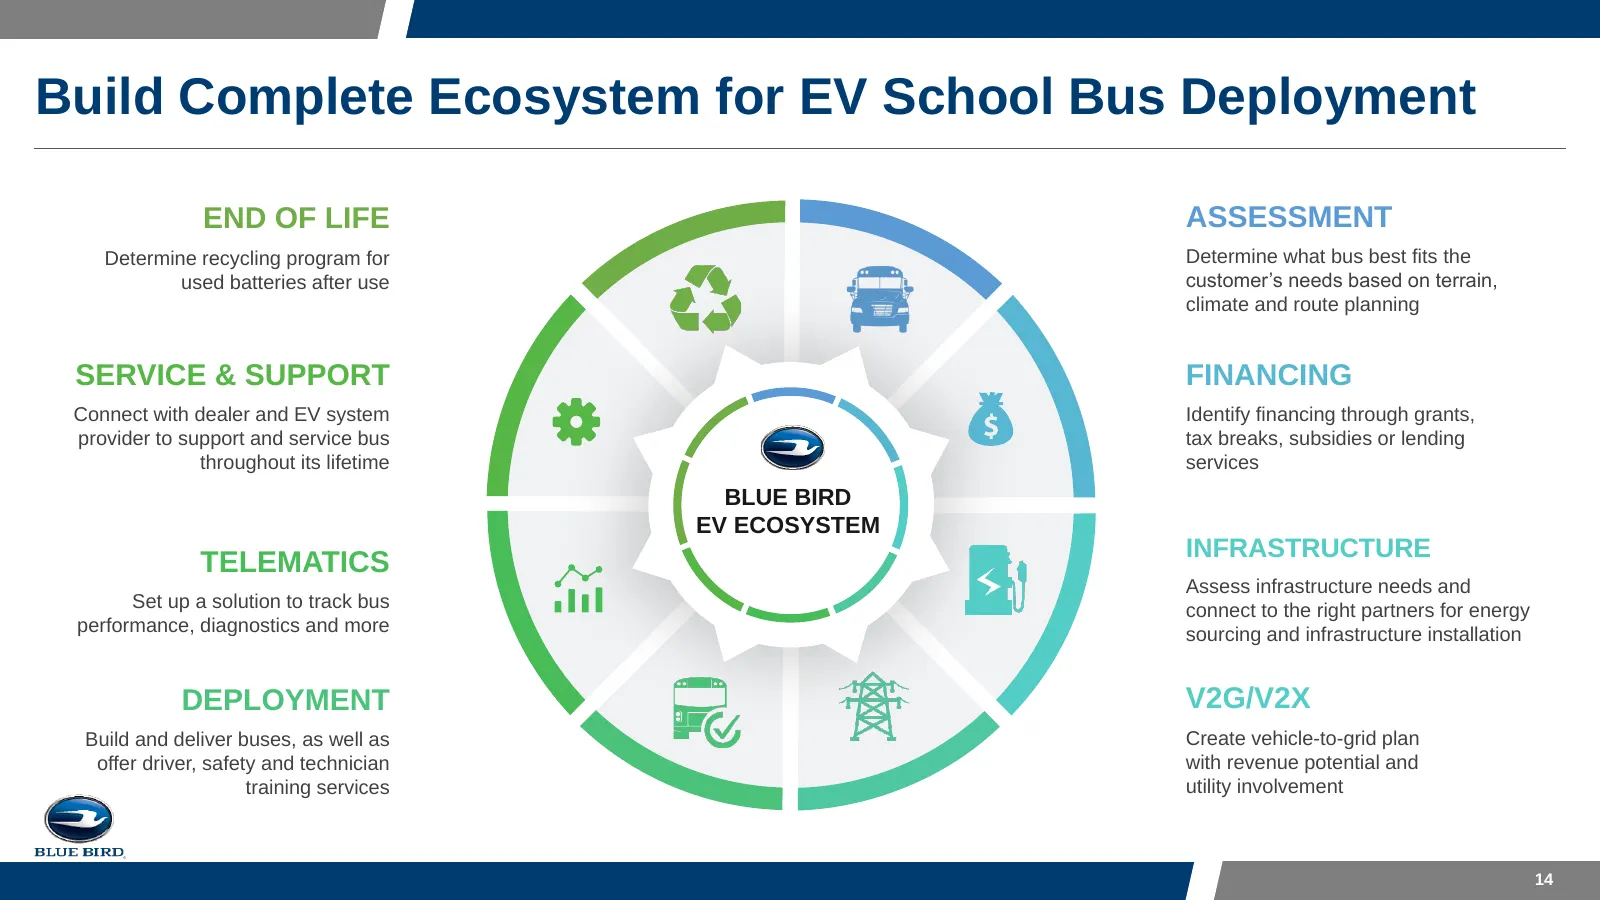
Slide 14: Build Complete Ecosystem for EV School Bus Deployment
Build Complete Ecosystem for EV School Bus Deployment END OF LIFE ASSESSMENT Determine recycling program for Determine what bus best fits the used batteries after use customer’s needs based on terrain, climate and route planning SERVICE & SUPPORT FINANCING Connect with dealer and EV system Identify
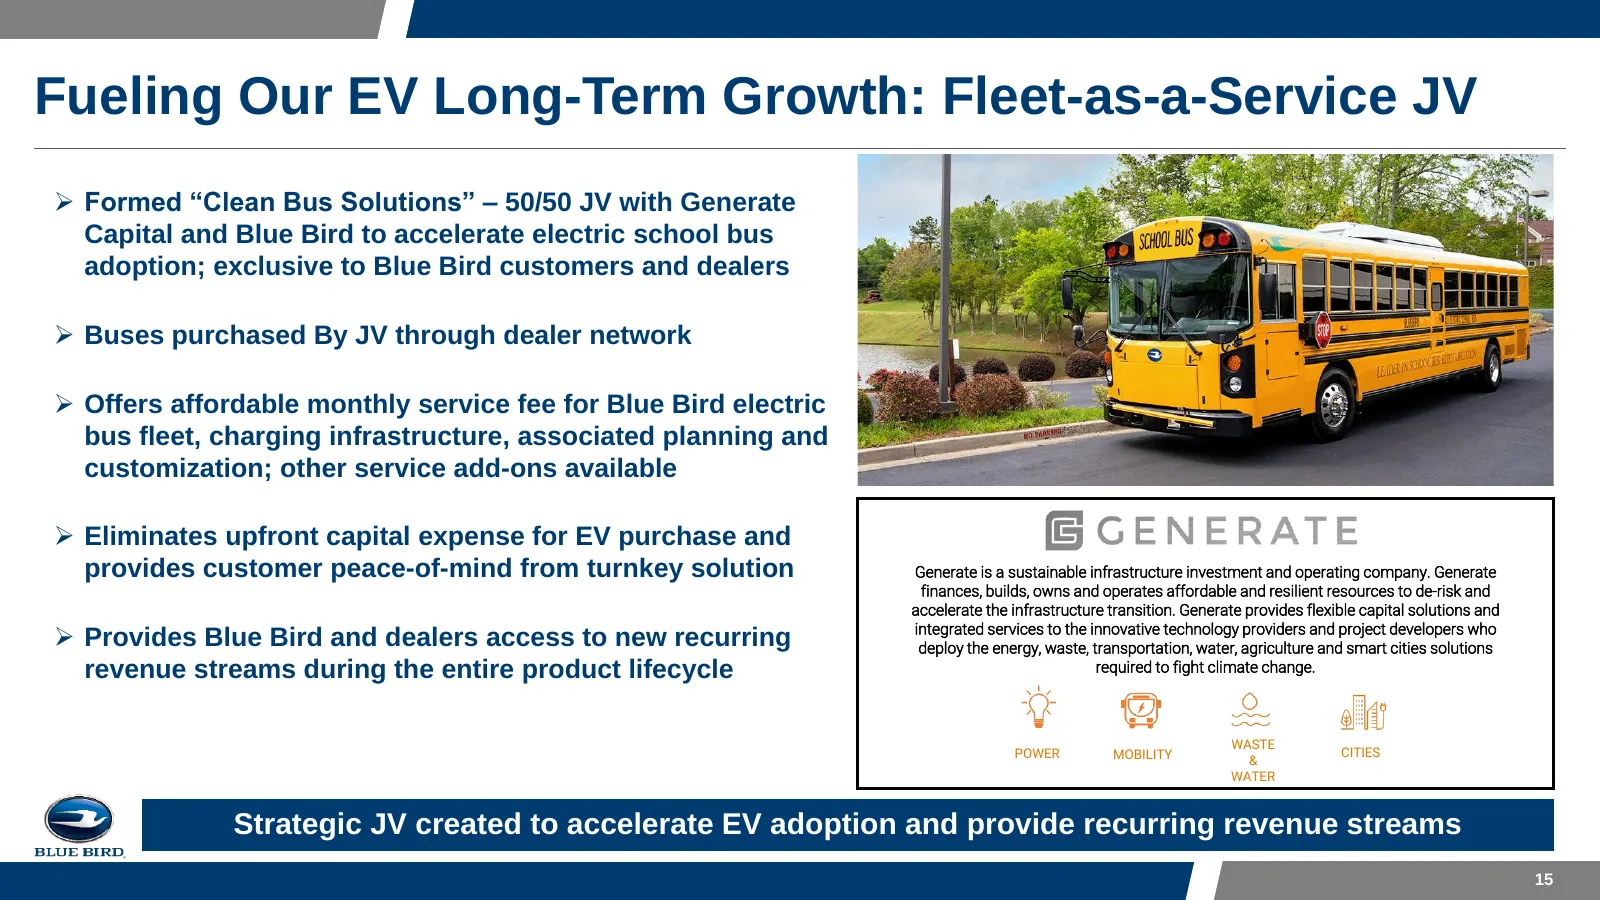
Slide 15: Fueling Our EV Long-Term Growth: Fleet-as-a-Service JV
Fueling Our EV Long-Term Growth: Fleet-as-a-Service JV ➢ Formed “Clean Bus Solutions” – 50/50 JV with Generate Capital and Blue Bird to accelerate electric school bus adoption; exclusive to Blue Bird customers and dealers ➢ Buses purchased By JV through dealer network ➢ Offers affordable monthly ser
Slide 16: FY2025 Objectives
FY2025 Objectives 16
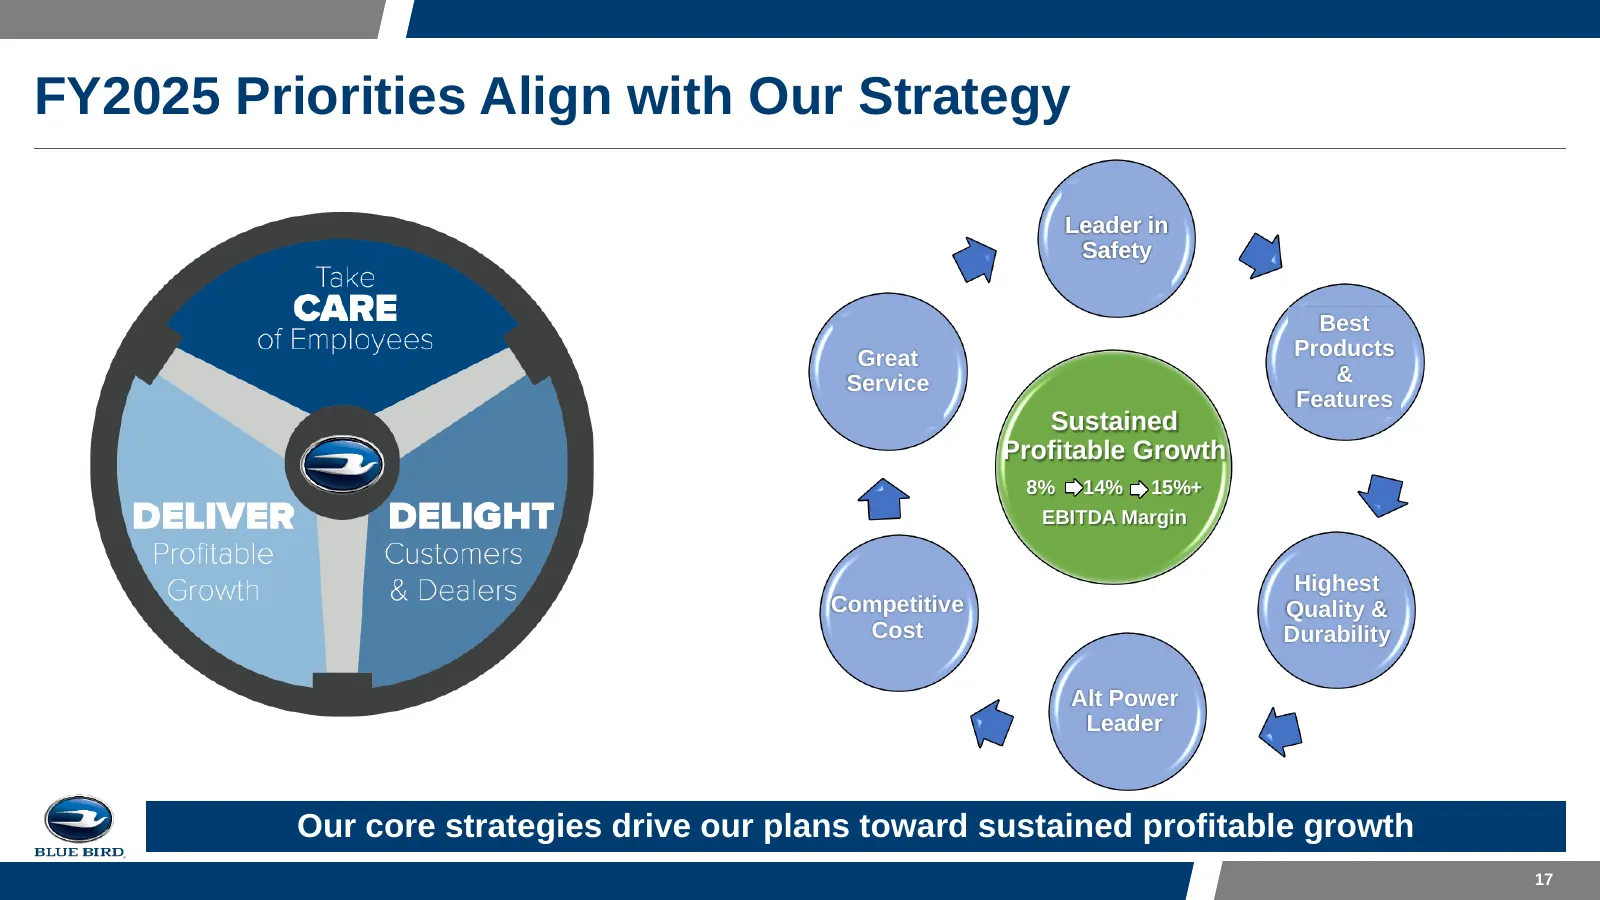
Slide 17: FY2025 Priorities Align with Our Strategy
FY2025 Priorities Align with Our Strategy Leader in Safety Best Great Products Service & Features Sustained Profitable Growth 8% 14% 15%+ EBITDA Margin Highest Competitive Quality & Cost Durability Alt Power Leader Our core strategies drive our plans toward sustained profitable growth 17
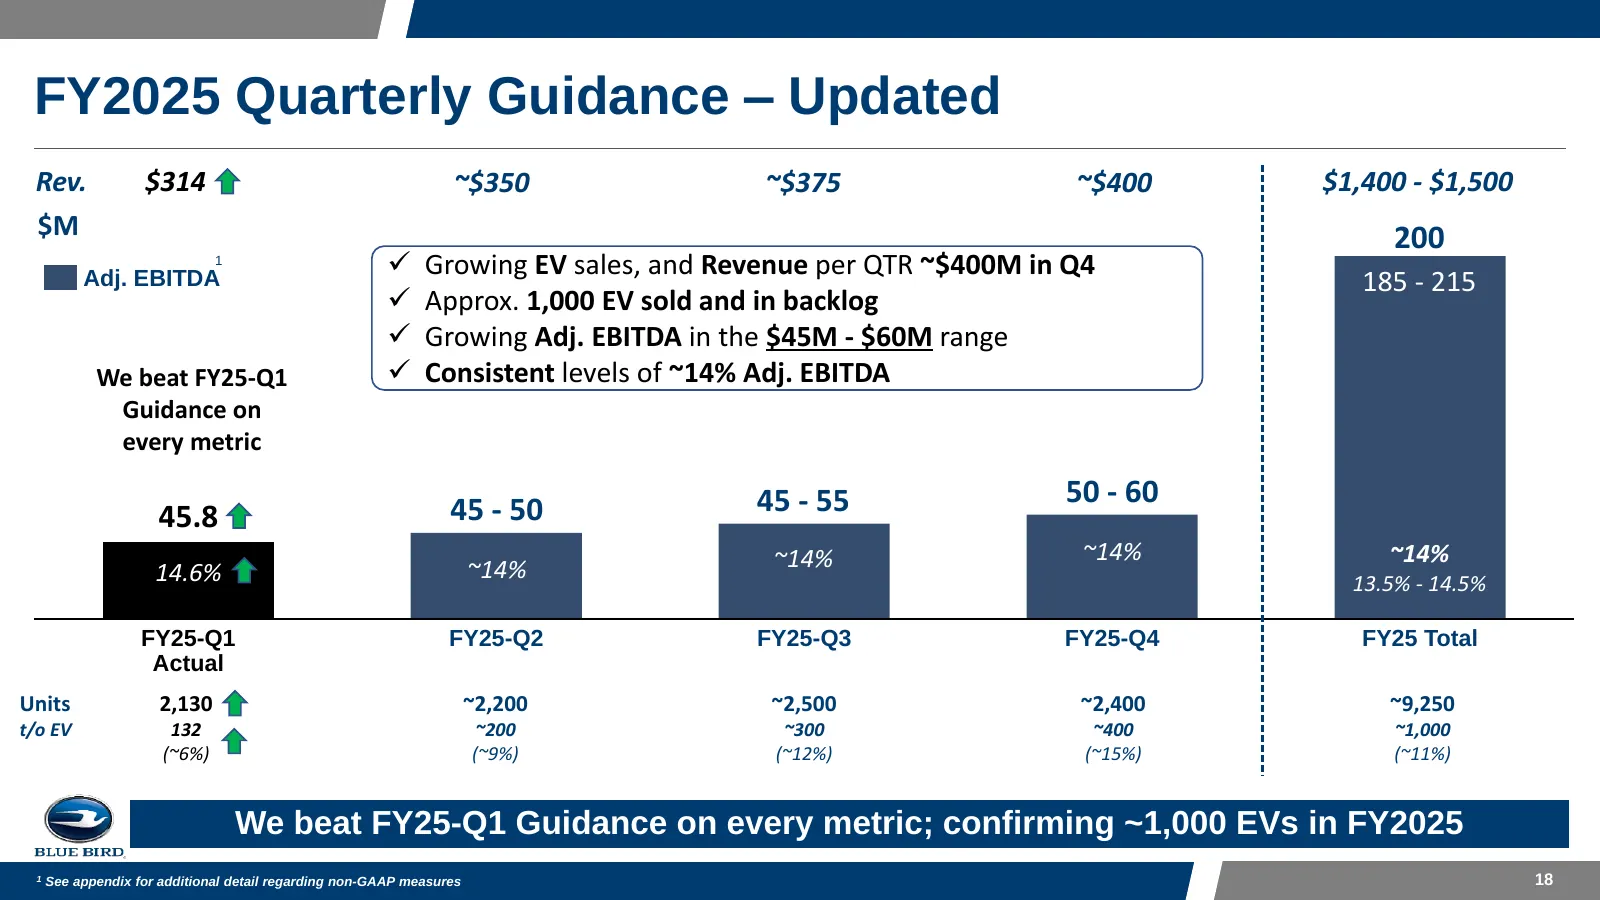
Slide 18: FY2025 Quarterly Guidance – Updated
FY2025 Quarterly Guidance – Updated Rev. $314 ~$350 ~$375 ~$400 $1,400 - $1,500 $M 200 1 ✓ Growing EV sales, and Revenue per QTR ~$400M in Q4 Adj. EBITDA 185 - 215 ✓ Approx. 1,000 EV sold and in backlog ✓ Growing Adj. EBITDA in the $45M - $60M range We beat FY25-Q1 ✓ Consistent levels of ~14% Adj. E
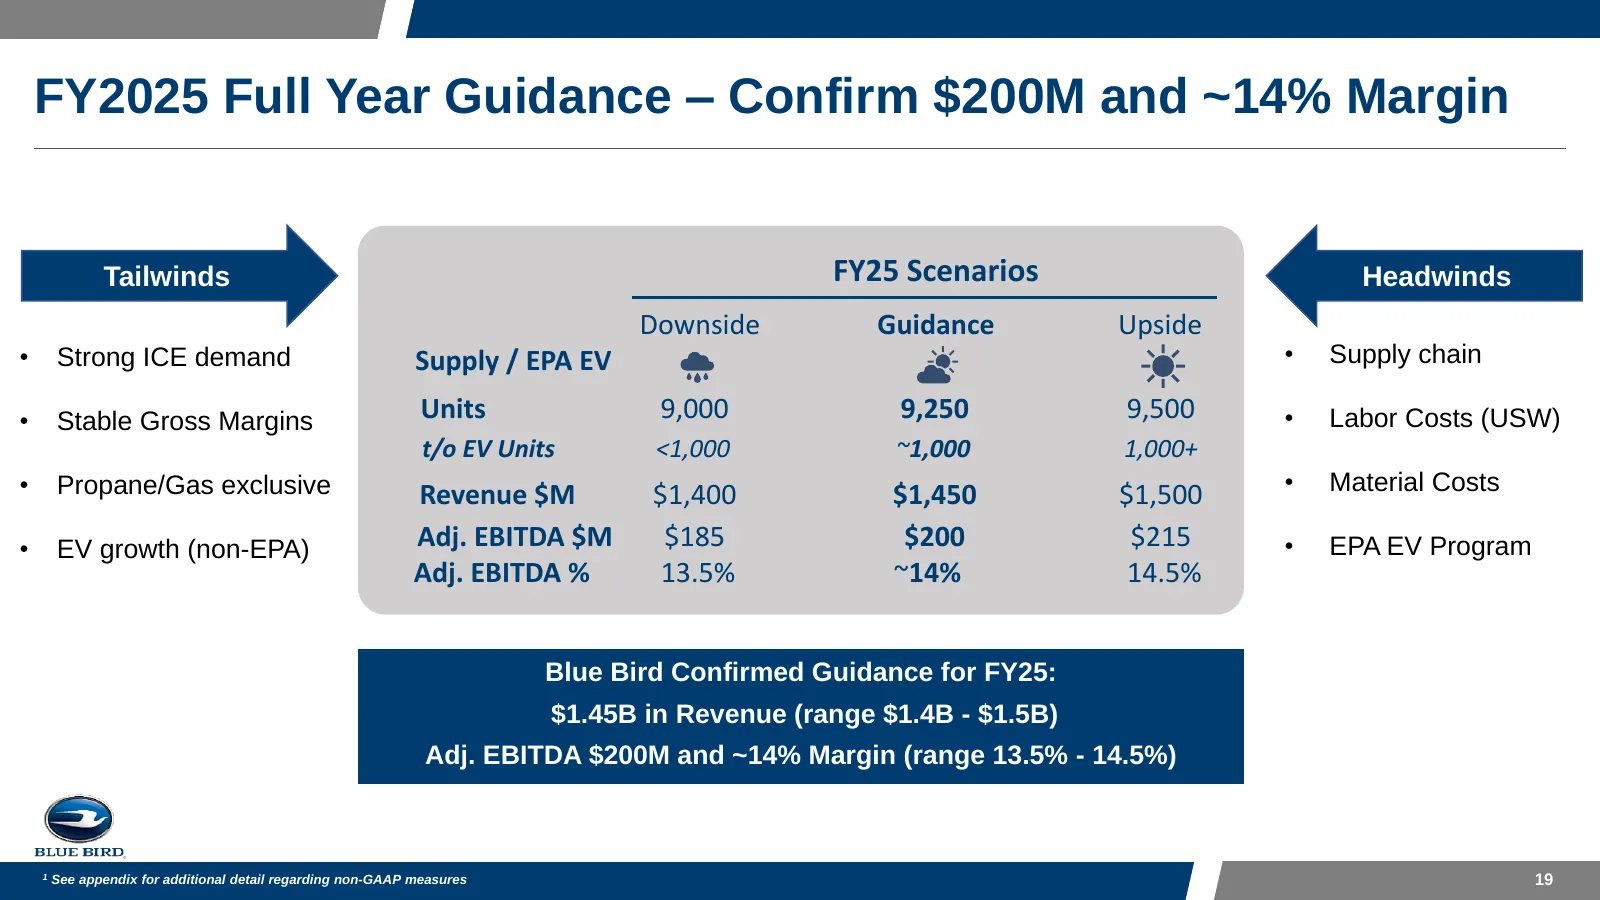
Slide 19: FY2025 Full Year Guidance – Confirm $200M and ~14% Margin
FY2025 Full Year Guidance – Confirm $200M and ~14% Margin Tailwinds FY25 Scenarios Headwinds Downside Guidance Upside • Strong ICE demand Supply / EPA EV • Supply chain • Stable Gross Margins Units 9,000 9,250 9,500 • Labor Costs (USW) t/o EV Units <1,000 ~1,000 1,000+ • Propane/Gas exclusive • Mate
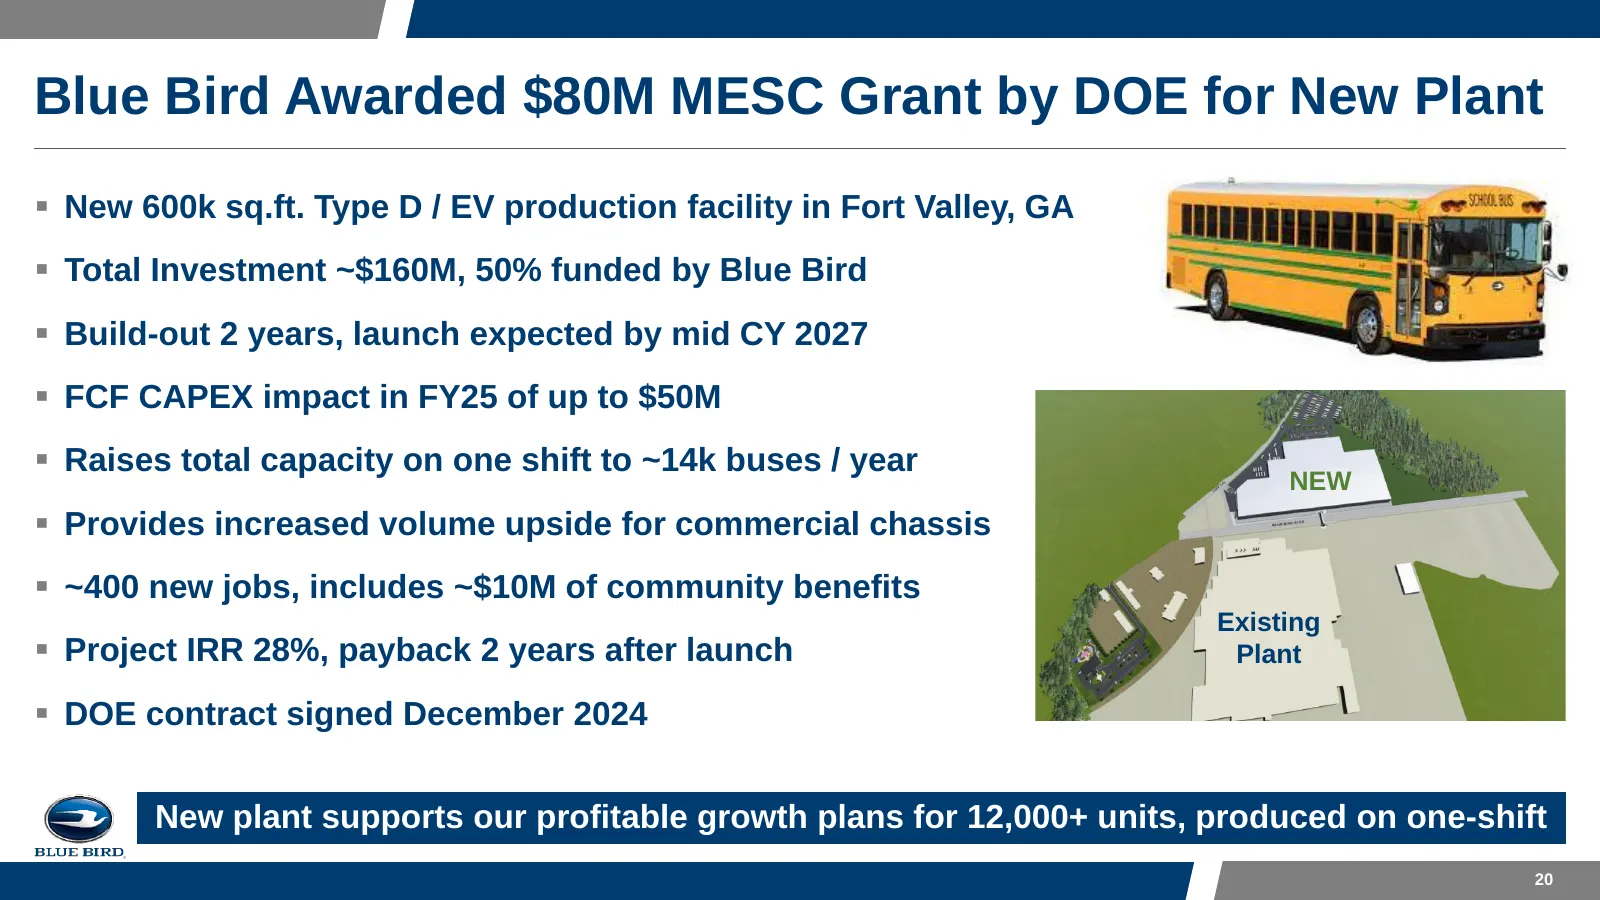
Slide 20: Blue Bird Awarded $80M MESC Grant by DOE for New Plant
Blue Bird Awarded $80M MESC Grant by DOE for New Plant ▪ New 600k sq.ft. Type D / EV production facility in Fort Valley, GA ▪ Total Investment ~$160M, 50% funded by Blue Bird ▪ Build-out 2 years, launch expected by mid CY 2027 ▪ FCF CAPEX impact in FY25 of up to $50M ▪ Raises total capacity on one s
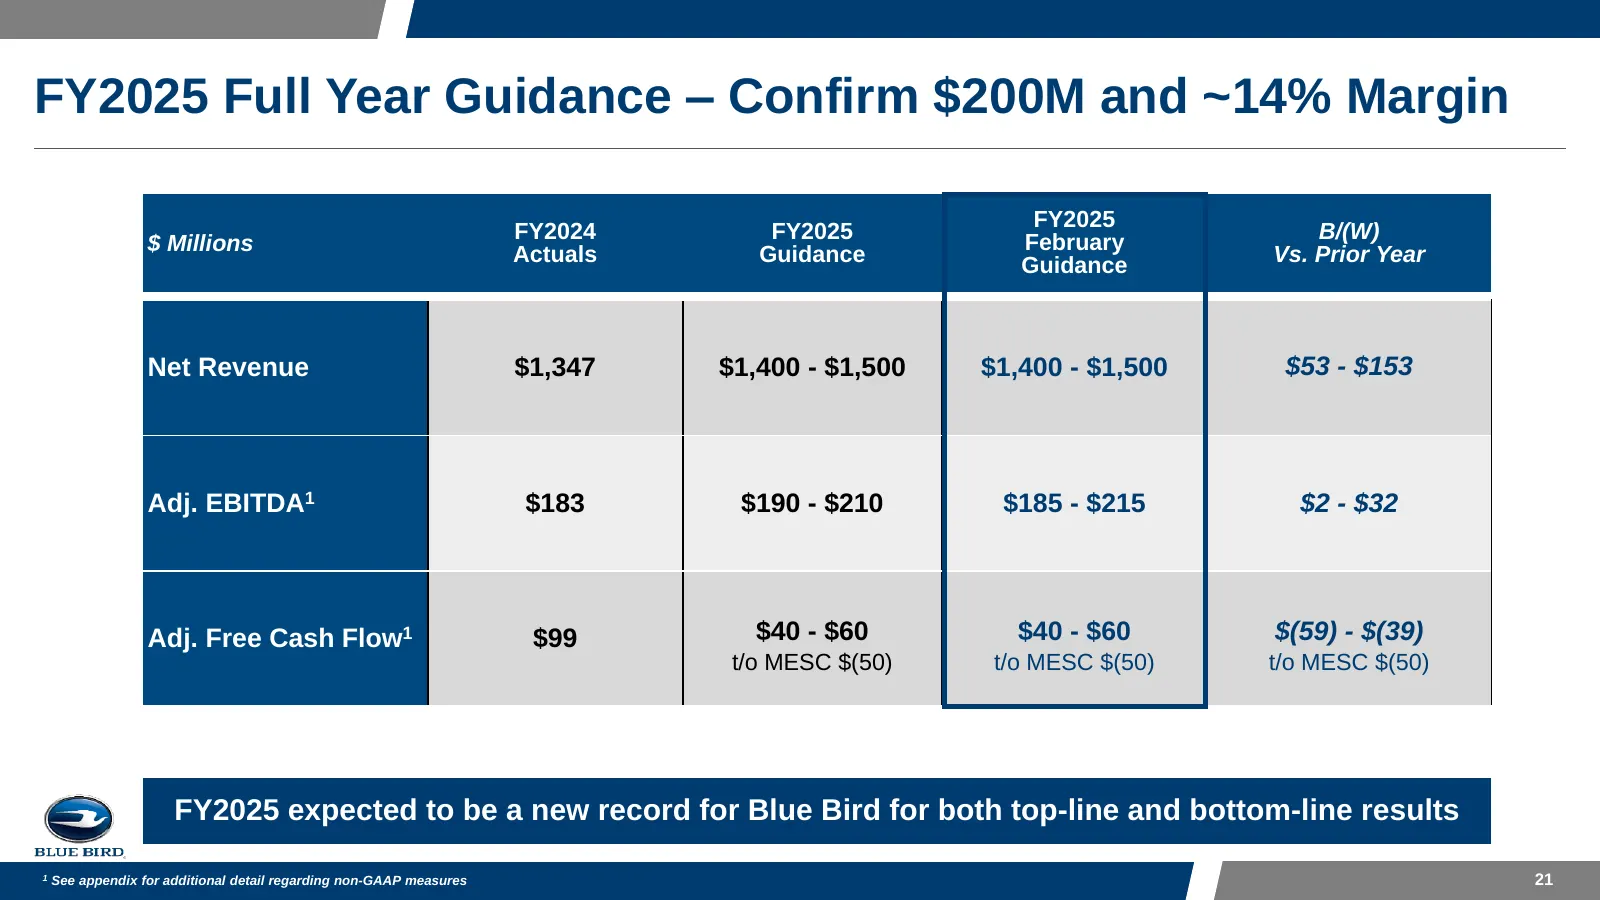
Slide 21: FY2025 Full Year Guidance – Confirm $200M and ~14% Margin
FY2025 Full Year Guidance – Confirm $200M and ~14% Margin FY2024 FY2025 FY2025 B/(W) $ Millions Actuals Guidance February Vs. Prior Year Guidance Net Revenue $1,347 $1,400 - $1,500 $1,400 - $1,500 $53 - $153 Adj. EBITDA1 $183 $190 - $210 $185 - $215 $2 - $32 Adj. Free Cash Flow1 $99 $40 - $60 $40 -
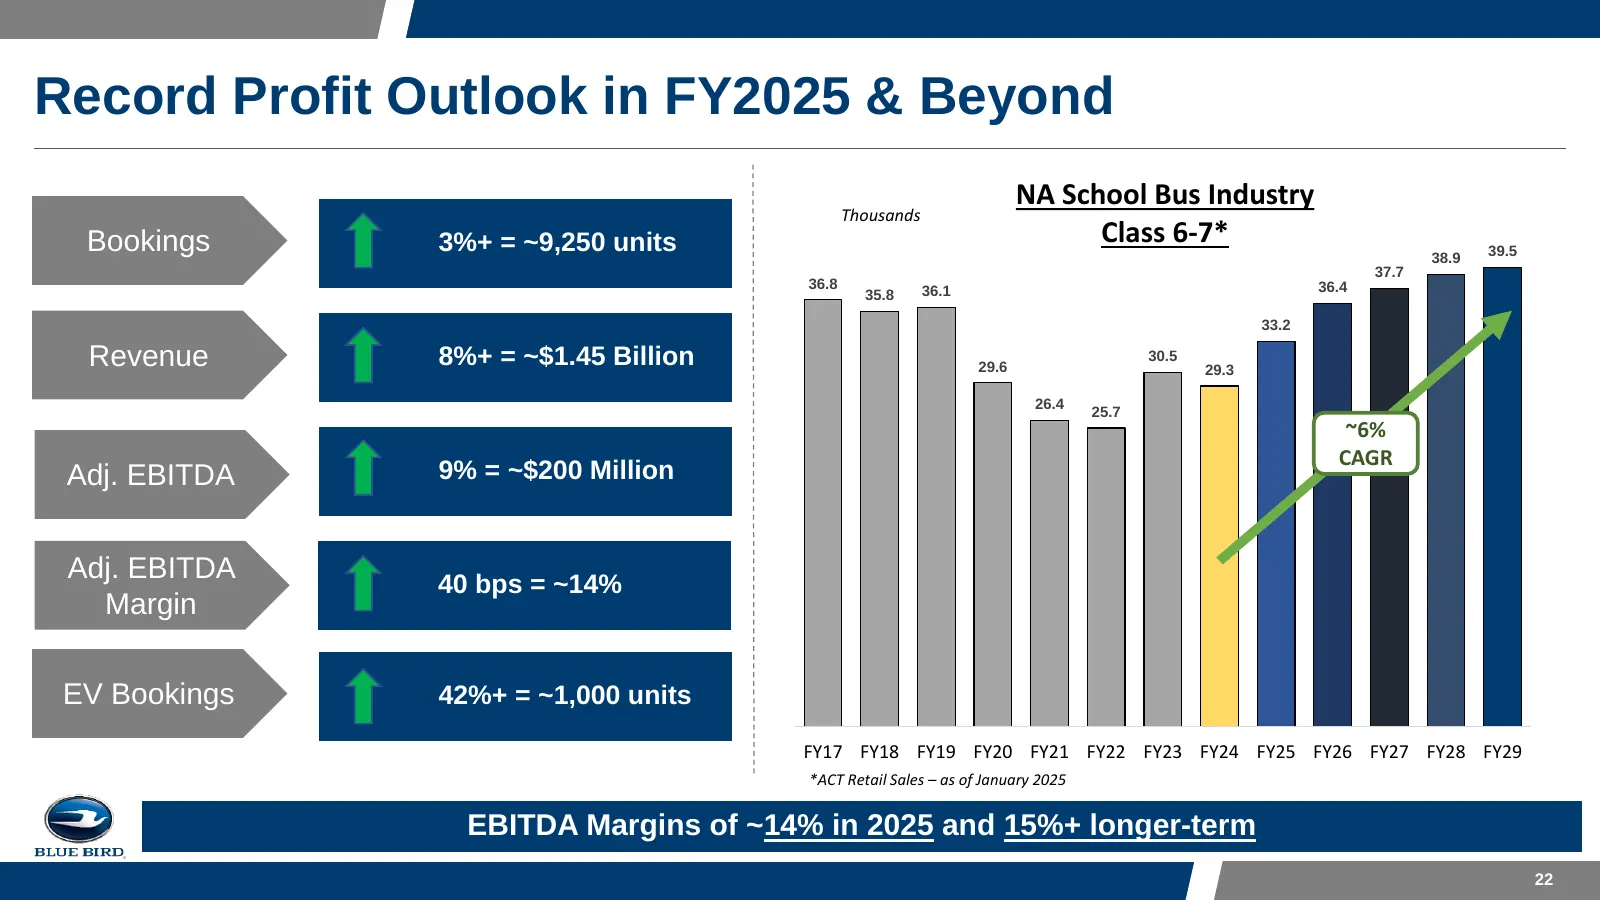
Slide 22: Record Profit Outlook in FY2025 & Beyond
Record Profit Outlook in FY2025 & Beyond NA School Bus Industry Thousands Bookings 3%+ = ~9,250 units Class 6-7* 39.5 38.9 37.7 36.8 36.1 36.4 35.8 33.2 Revenue 8%+ = ~$1.45 Billion 29.6 30.5 29.3 26.4 25.7 ~6% CAGR Adj. EBITDA 9% = ~$200 Million Adj. EBITDA 40 bps = ~14% Margin EV Bookings 42%+ = ~
Slide 23: Solid Growth Runway
Solid Growth Runway 23
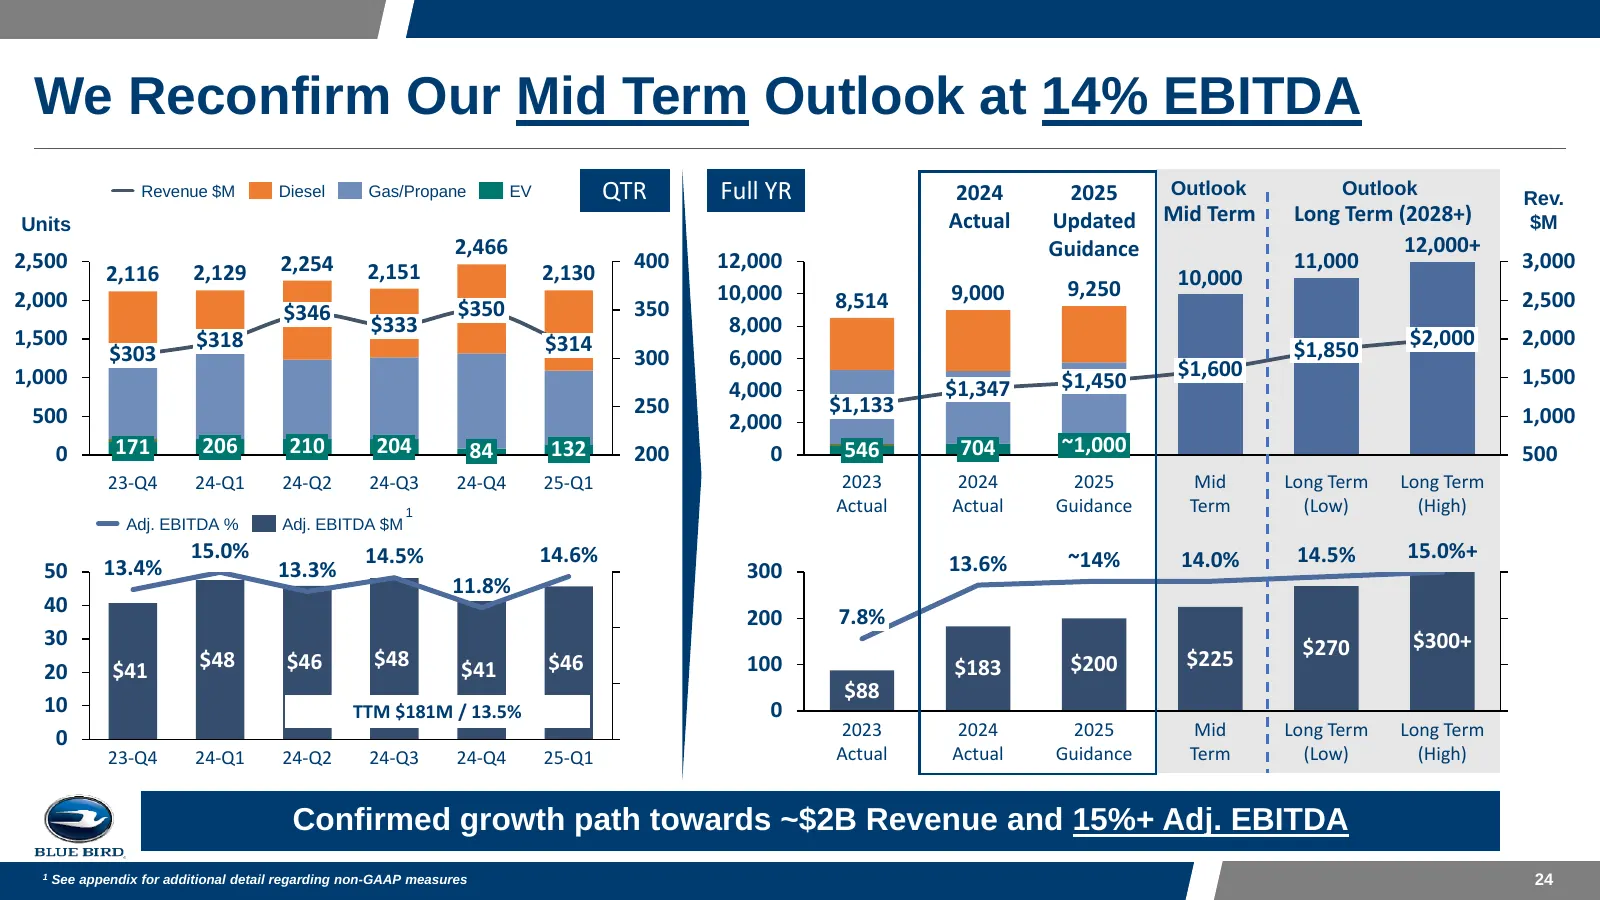
Slide 24: We Reconfirm Our Mid Term Outlook at 14% EBITDA
We Reconfirm Our Mid Term Outlook at 14% EBITDA Revenue $M Diesel Gas/Propane EV QTR Full YR 2024 2025 Outlook Outlook Rev. Units Actual Updated Mid Term Long Term (2028+) $M 2,466 Guidance 12,000+ 2,500 2,254 2,151 400 12,000 11,000 3,000 2,116 2,129 2,130 10,000 2,000 10,000 9,000 9,250 2,500 $350
Slide 25: Strong Outlook Ahead for Blue Bird / Investment Highlights
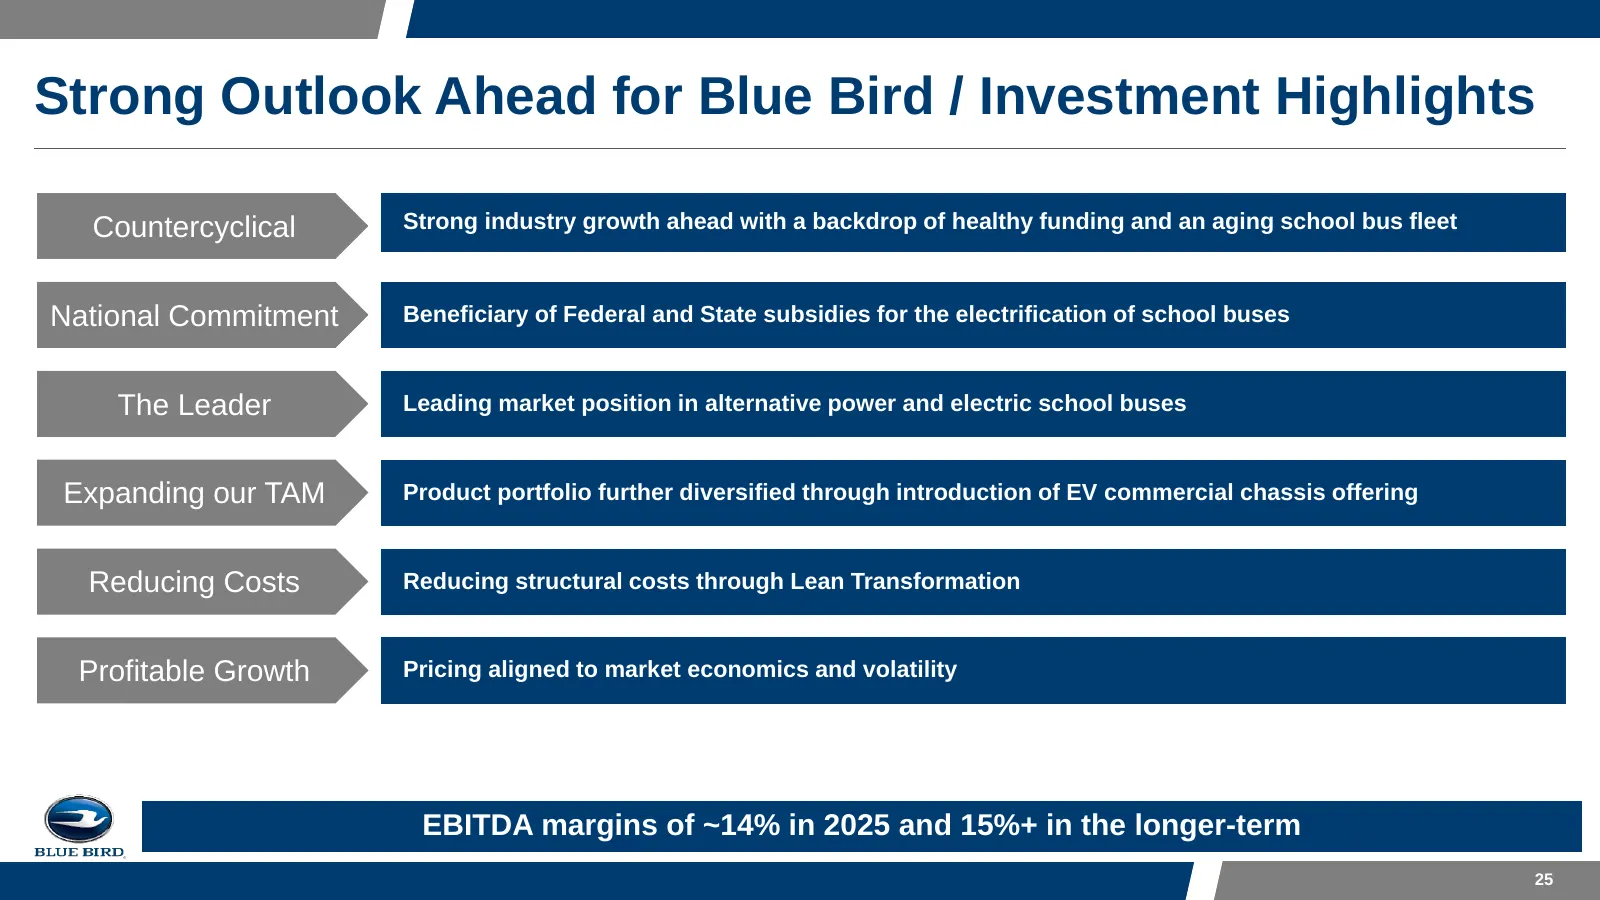
Strong Outlook Ahead for Blue Bird / Investment Highlights Countercyclical Strong industry growth ahead with a backdrop of healthy funding and an aging school bus fleet National Commitment Beneficiary of Federal and State subsidies for the electrification of school buses The Leader Leading market po
Slide 26: Appendix
Appendix 26
Slide 27: Key FY2025 Q1 Takeaways: Near-Record Quarterly Profit
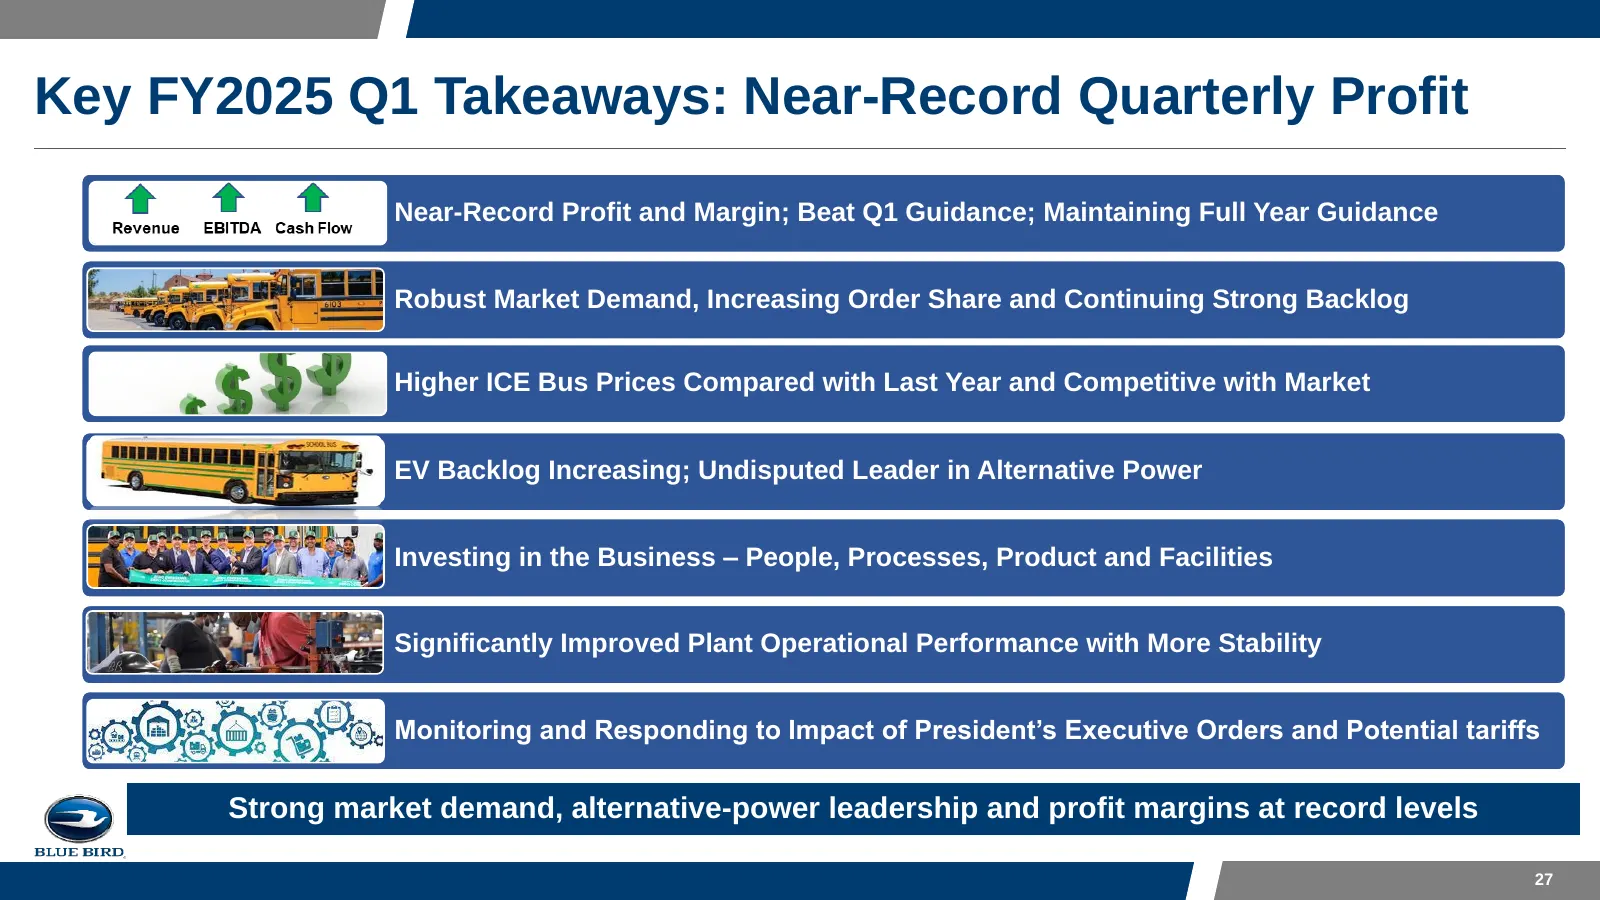
Key FY2025 Q1 Takeaways: Near-Record Quarterly Profit Near-Record Profit and Margin; Beat Q1 Guidance; Maintaining Full Year Guidance Robust Market Demand, Increasing Order Share and Continuing Strong Backlog Higher ICE Bus Prices Compared with Last Year and Competitive with Market EV Backlog Increa
Slide 28: FY2025 Q1 Financial Results and Key Business Highlights
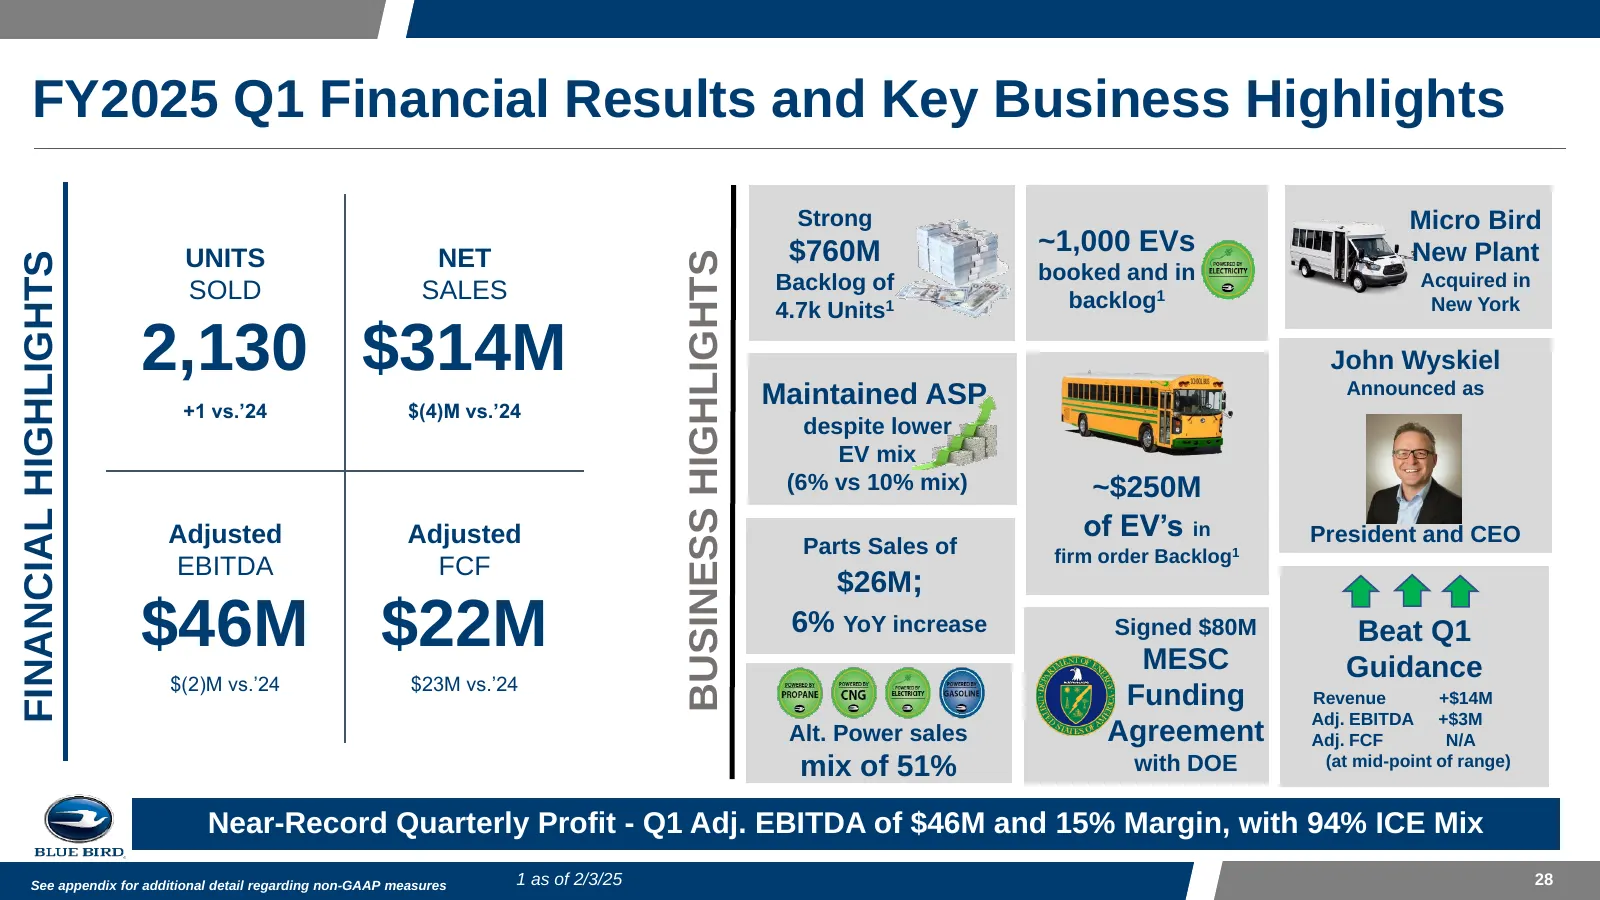
FY2025 Q1 Financial Results and Key Business Highlights Strong Micro Bird $760M ~1,000 EVs New Plant UNITS NET BUSINESS HIGHLIGHTS FINANCIAL HIGHLIGHTS Backlog of booked and in Acquired in SOLD SALES backlog1 New York 4.7k Units1 2,130 $314M John Wyskiel Announced as +1 vs.’24 $(4)M vs.’24 Maintaine
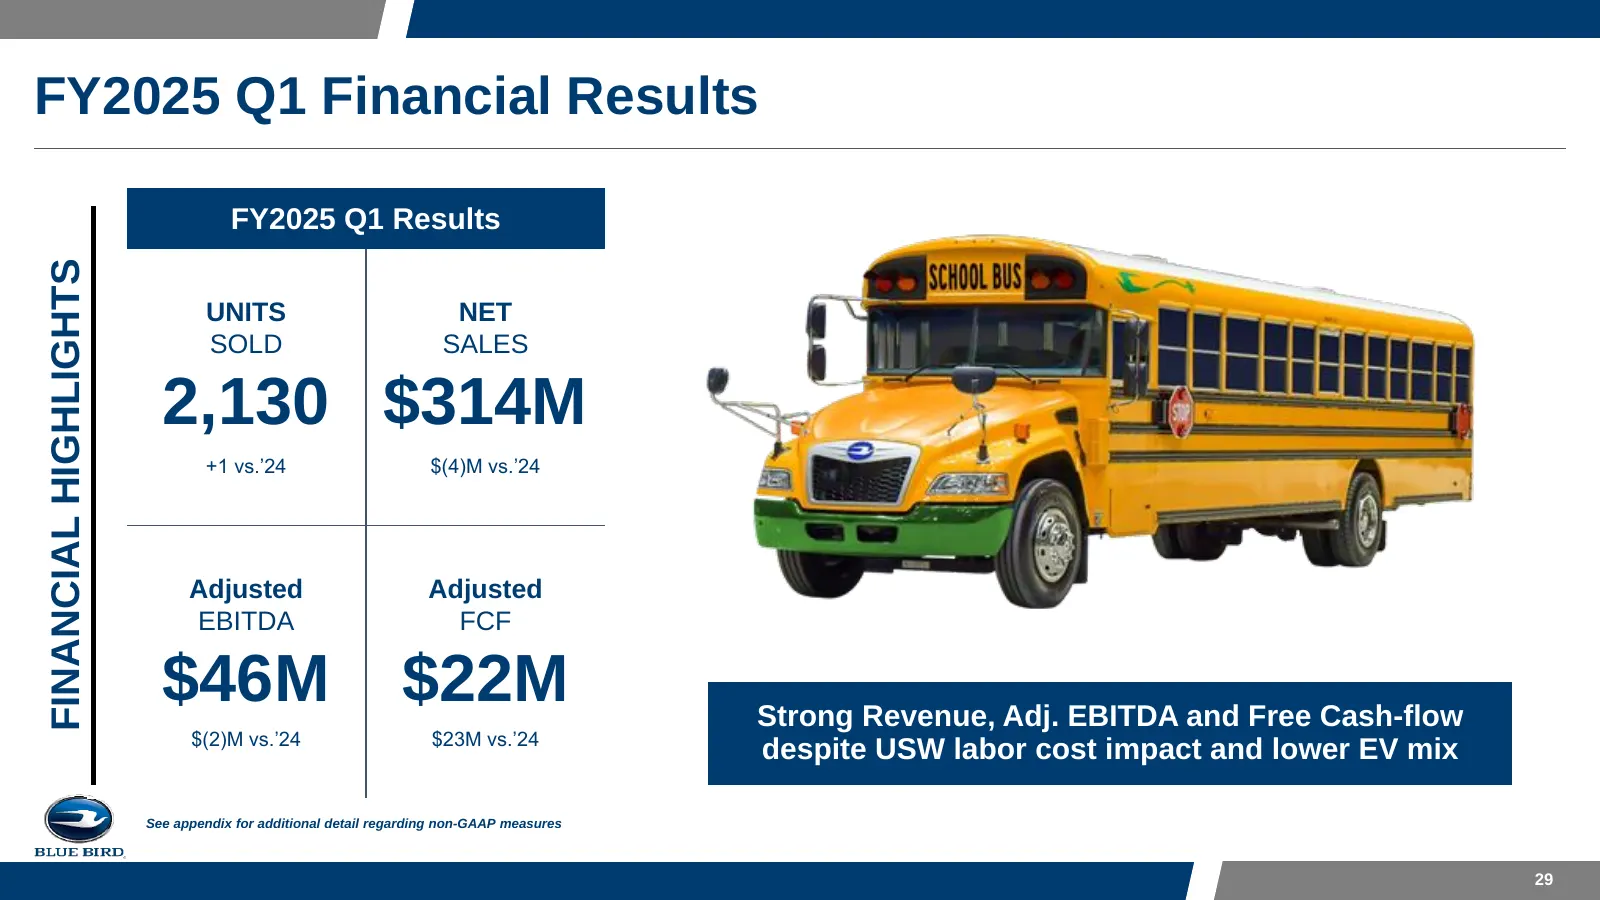
Slide 29: FY2025 Q1 Financial Results
FY2025 Q1 Financial Results FY2025 Q1 Results FINANCIAL HIGHLIGHTS UNITS NET SOLD SALES 2,130 $314M +1 vs.’24 $(4)M vs.’24 Adjusted Adjusted EBITDA FCF $46M $22M Strong Revenue, Adj. EBITDA and Free Cash-flow $(2)M vs.’24 $23M vs.’24 despite USW labor cost impact and lower EV mix See appendix for ad
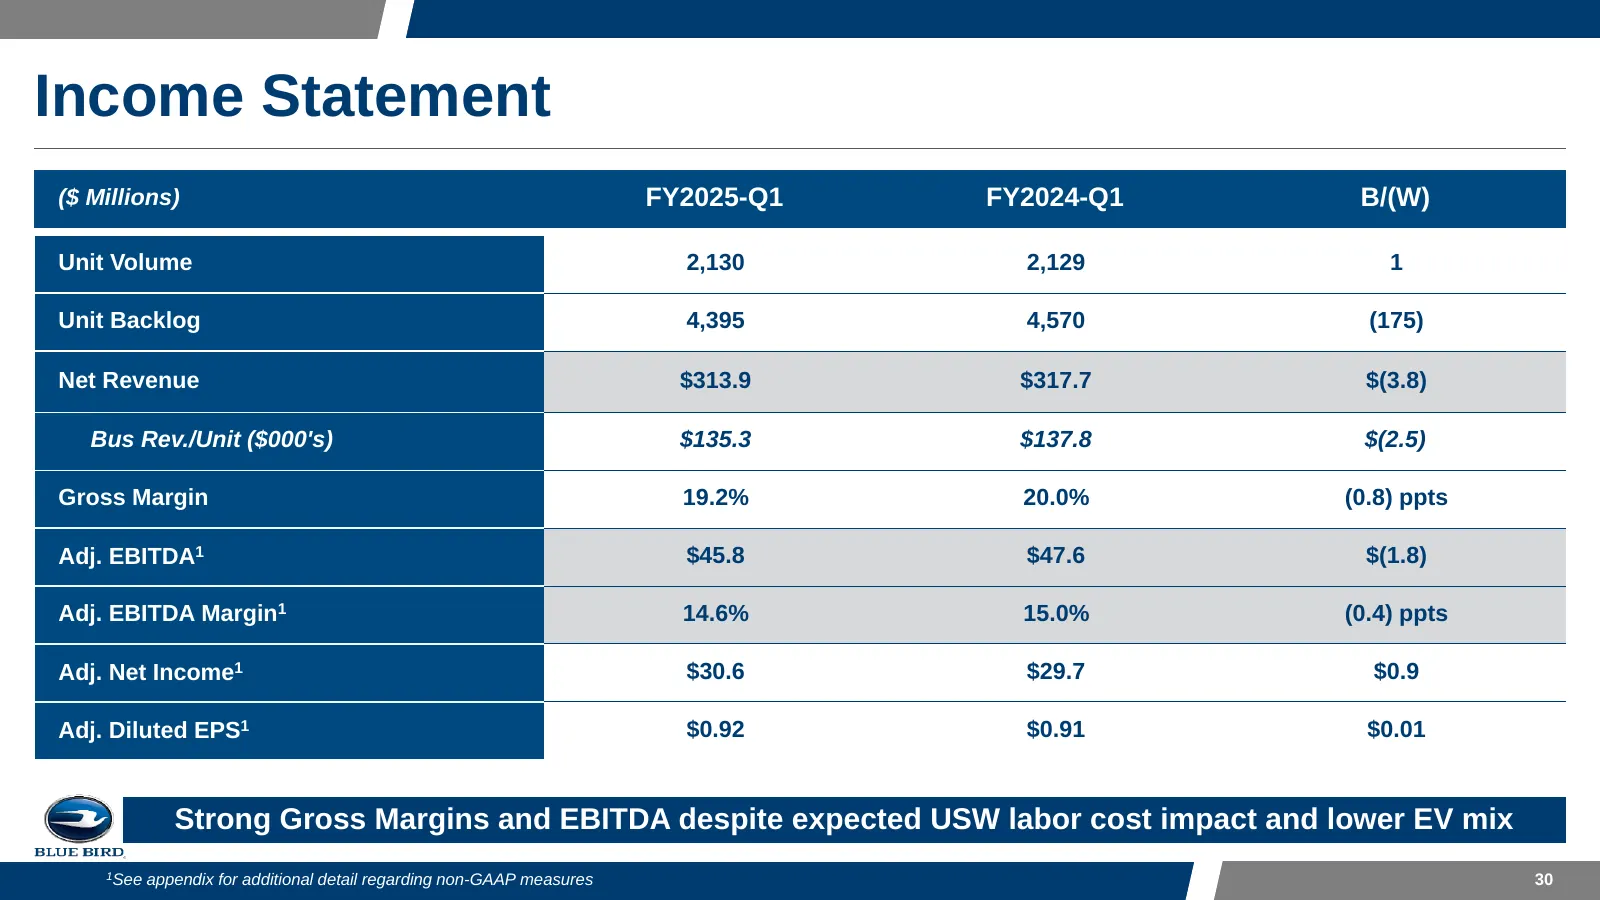
Slide 30: Income Statement
Income Statement ($ Millions) FY2025-Q1 FY2024-Q1 B/(W) Unit Volume 2,130 2,129 1 Unit Backlog 4,395 4,570 (175) Net Revenue $313.9 $317.7 $(3.8) Bus Rev./Unit ($000's) $135.3 $137.8 $(2.5) Gross Margin 19.2% 20.0% (0.8) ppts Adj. EBITDA1 $45.8 $47.6 $(1.8) Adj. EBITDA Margin1 14.6% 15.0% (0.4) ppts
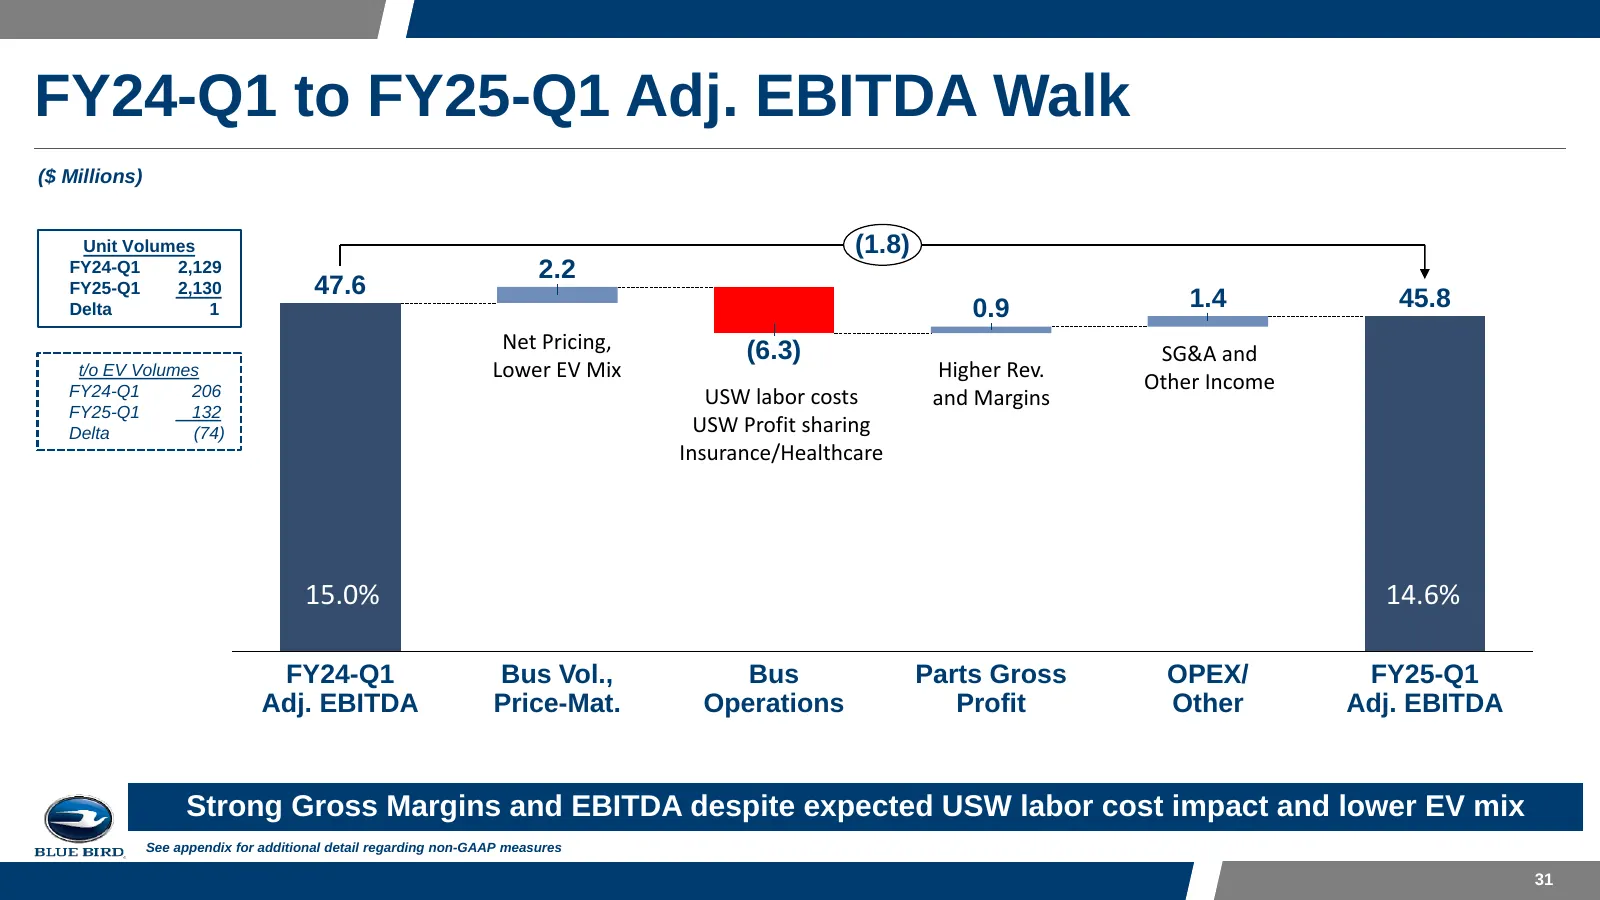
Slide 31: FY24-Q1 to FY25-Q1 Adj. EBITDA Walk
FY24-Q1 to FY25-Q1 Adj. EBITDA Walk ($ Millions) Unit Volumes (1.8) FY24-Q1 2,129 2.2 FY25-Q1 2,130 47.6 1.4 45.8 Delta 1 0.9 Net Pricing, (6.3) SG&A and t/o EV Volumes Lower EV Mix Higher Rev. FY24-Q1 206 Other Income USW labor costs and Margins FY25-Q1 132 Delta (74) USW Profit sharing Insurance/H
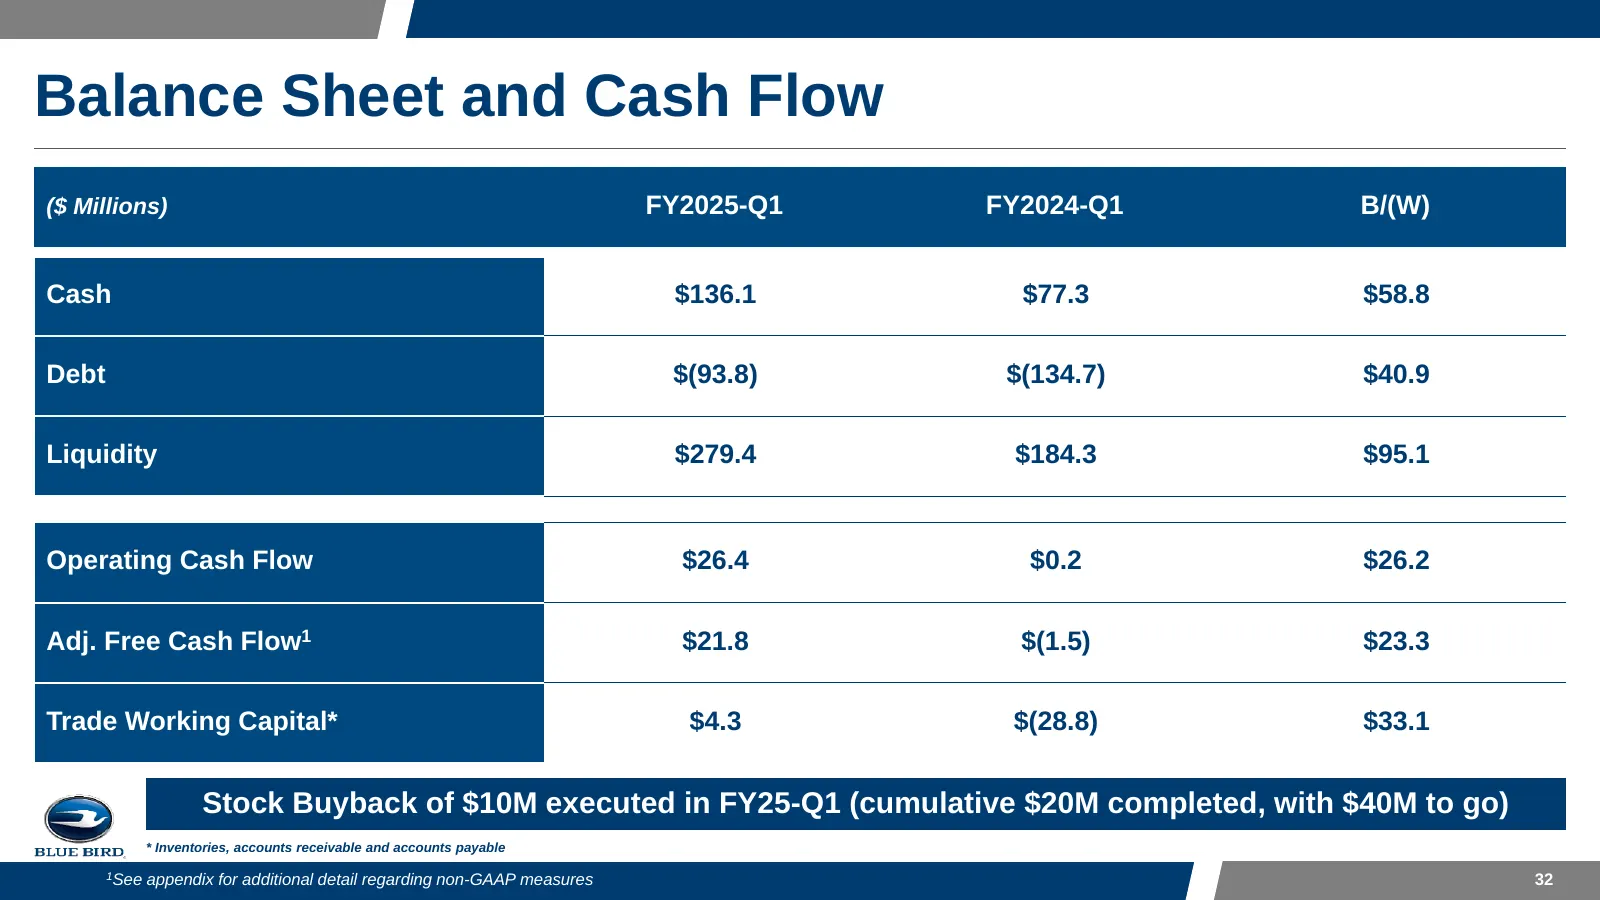
Slide 32: Balance Sheet and Cash Flow
Balance Sheet and Cash Flow ($ Millions) FY2025-Q1 FY2024-Q1 B/(W) Cash $136.1 $77.3 $58.8 Debt $(93.8) $(134.7) $40.9 Liquidity $279.4 $184.3 $95.1 Operating Cash Flow $26.4 $0.2 $26.2 Adj. Free Cash Flow1 $21.8 $(1.5) $23.3 Trade Working Capital* $4.3 $(28.8) $33.1 Stock Buyback of $10M executed i
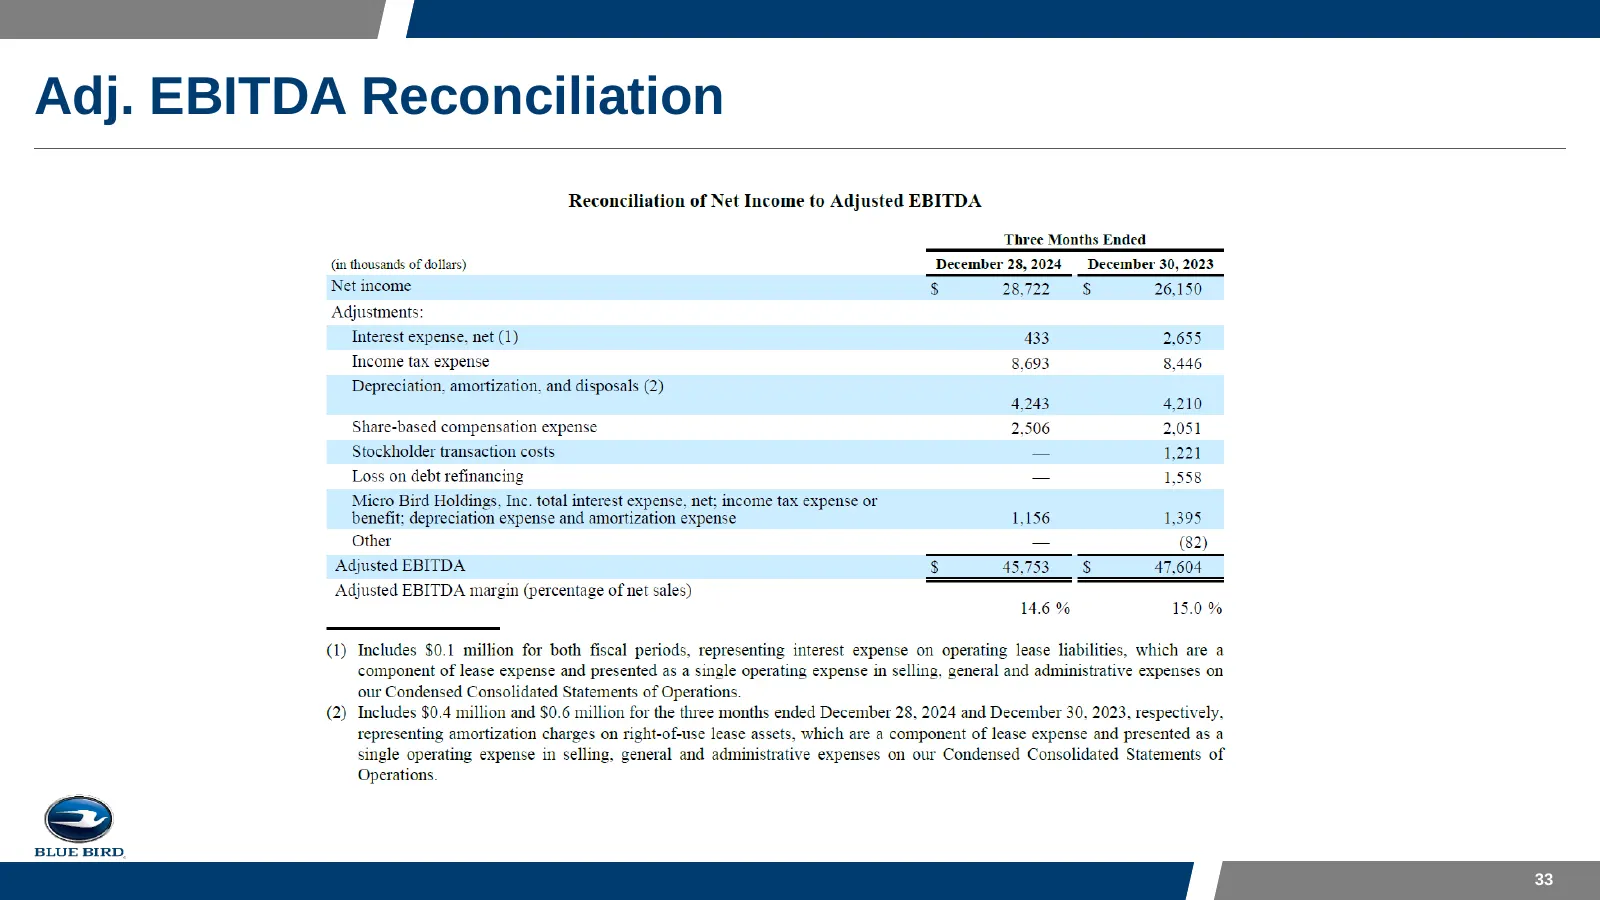
Slide 33: Adj. EBITDA Reconciliation
Adj. EBITDA Reconciliation 33
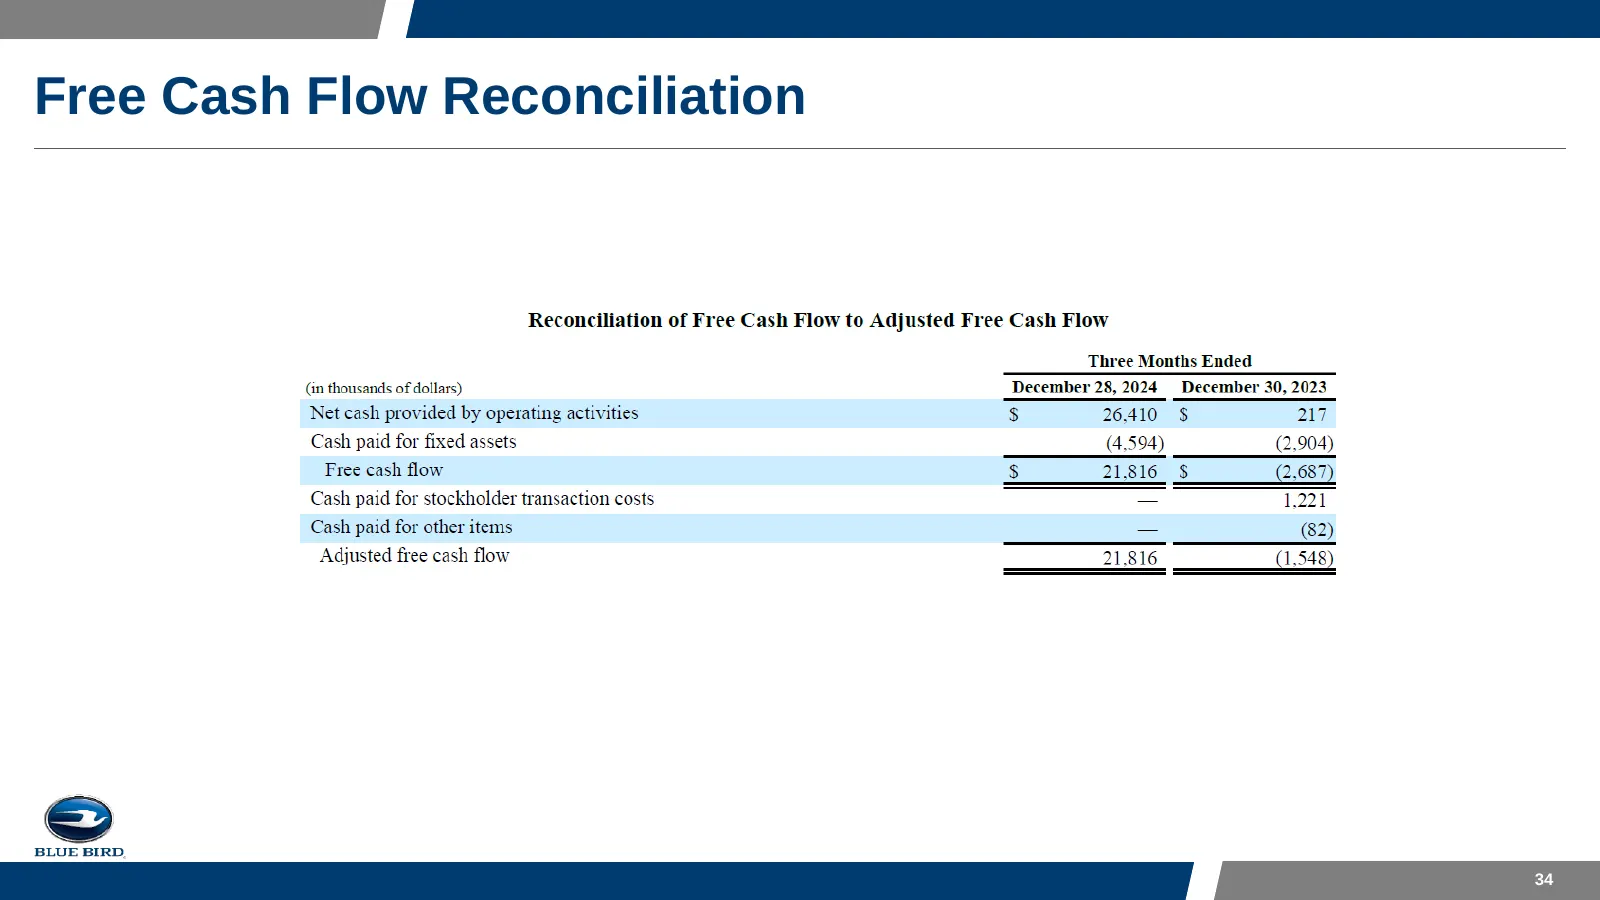
Slide 34: Free Cash Flow Reconciliation
Free Cash Flow Reconciliation 34
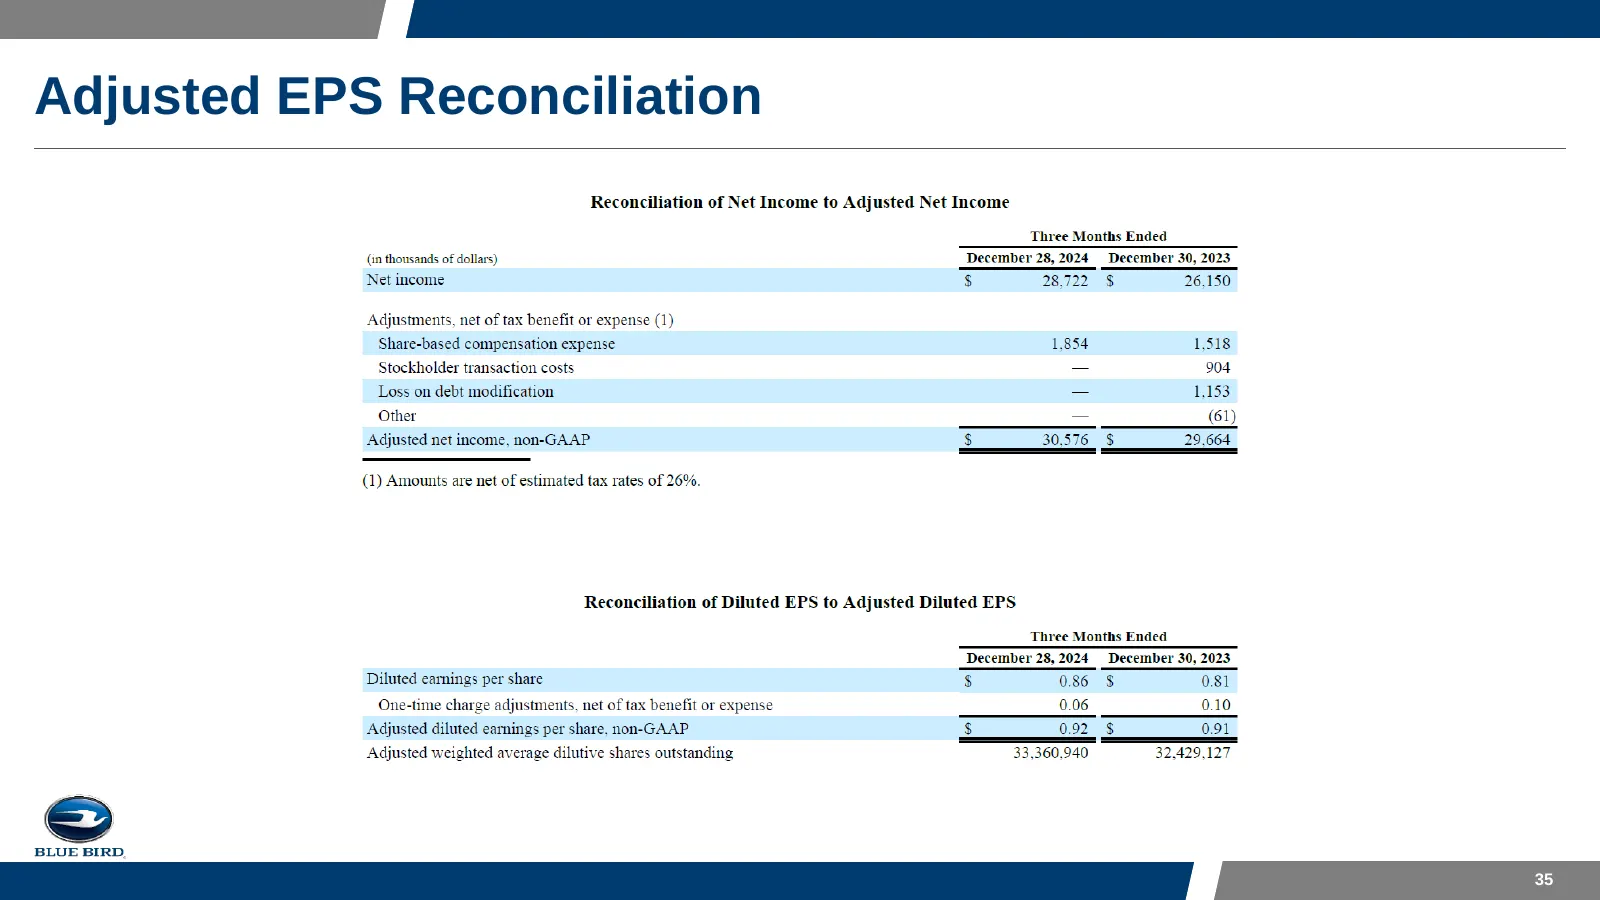
Slide 35: Adjusted EPS Reconciliation
Adjusted EPS Reconciliation 35
Slide 36: Investor Relations Contact Information
Investor Relations Contact Information Mark Benfield Mark.Benfield@Blue-Bird.com 36
Source: company website
More decks from Blue Bird Corporation
 Q3 2026 Earnings Presentation28 slides · Aug 5, 2026
 Investor Presentation (August 2026)36 slides · August 2026
 Q2 2026 Earnings Presentation30 slides · May 6, 2026
 Investor Presentation (May 2026)37 slides · May 2026
 Merger or Acquisition (February 2026)11 slides · Feb 17, 2026
 Q1 2026 Earnings Presentation25 slides · Feb 4, 2026