South Jersey Industries — Investor Presentation (June 2019)
44 slides from South Jersey Industries's investor presentation, Jun 18, 2019

Slide 1: Investor Presentation June 2019
Investor Presentation June 2019
Slide 2: Forward-Looking Statements and Use of Non-GAAP Measures
Forward-Looking Statements and Use of Non-GAAP Measures Certain statements contained in this presentation may qualify as “forward-looking statements” within the meaning of Section 27A of the Securities Act of 1933 and Section 21E of the Securities Exchange Act of 1934. All statements other than stat
Slide 3: Our Vision | Shareholder Value & Customer Satisfaction
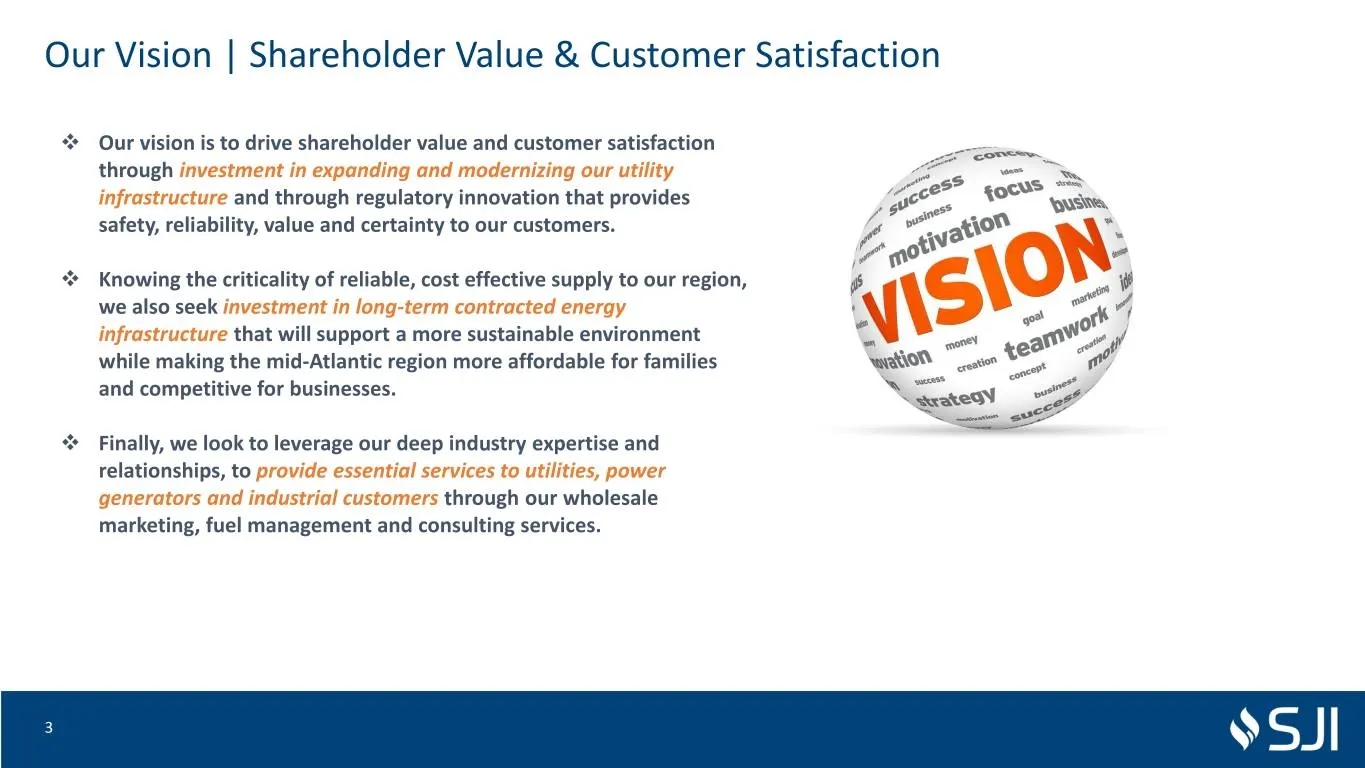
Our Vision | Shareholder Value & Customer Satisfaction ❖ Our vision is to drive shareholder value and customer satisfaction through investment in expanding and modernizing our utility infrastructure and through regulatory innovation that provides safety, reliability, value and certainty to our custo
Slide 4: Key Tenets of Growth Plan | 2018-2022
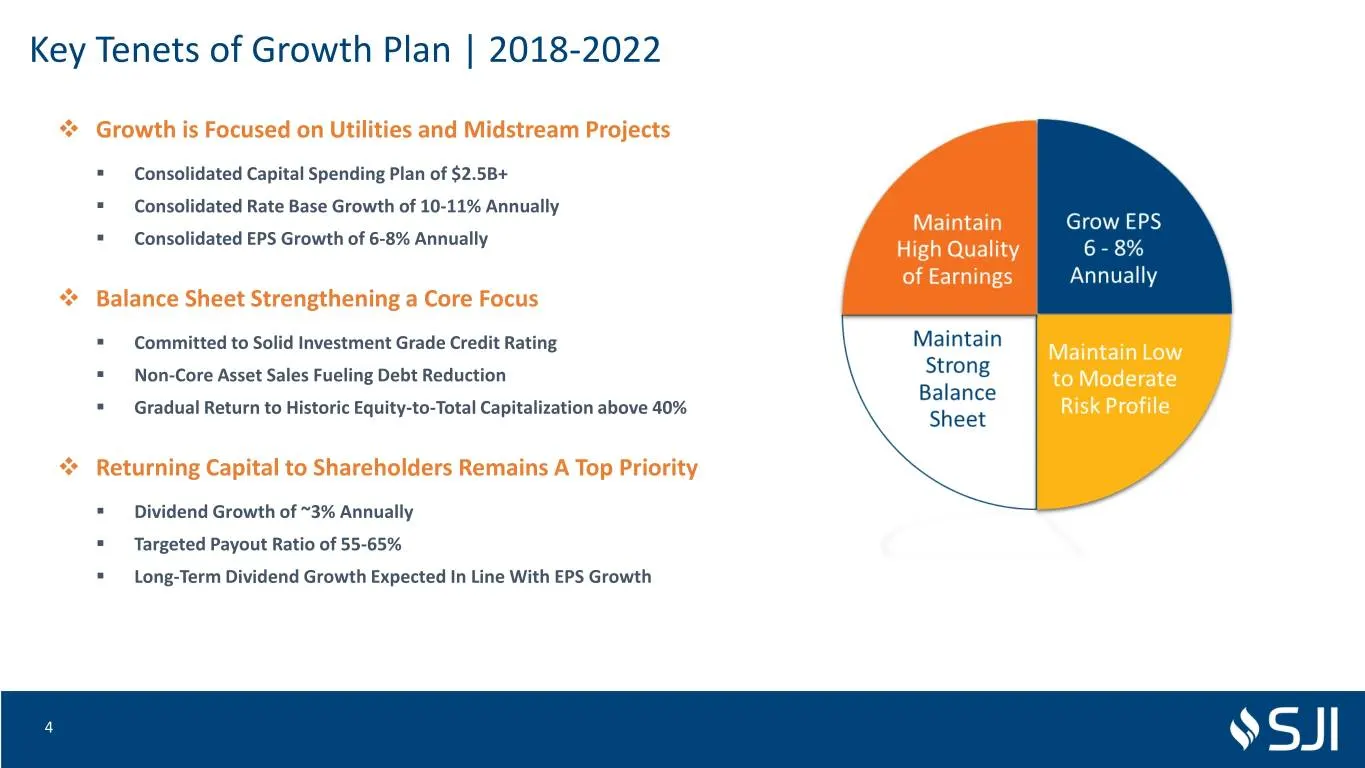
Key Tenets of Growth Plan | 2018-2022 ❖ Growth is Focused on Utilities and Midstream Projects ▪ Consolidated Capital Spending Plan of $2.5B+ ▪ Consolidated Rate Base Growth of 10-11% Annually ▪ Consolidated EPS Growth of 6-8% Annually ❖ Balance Sheet Strengthening a Core Focus ▪ Committed to Solid I
Slide 5: Environmental, Social and Corporate Governance (ESG)
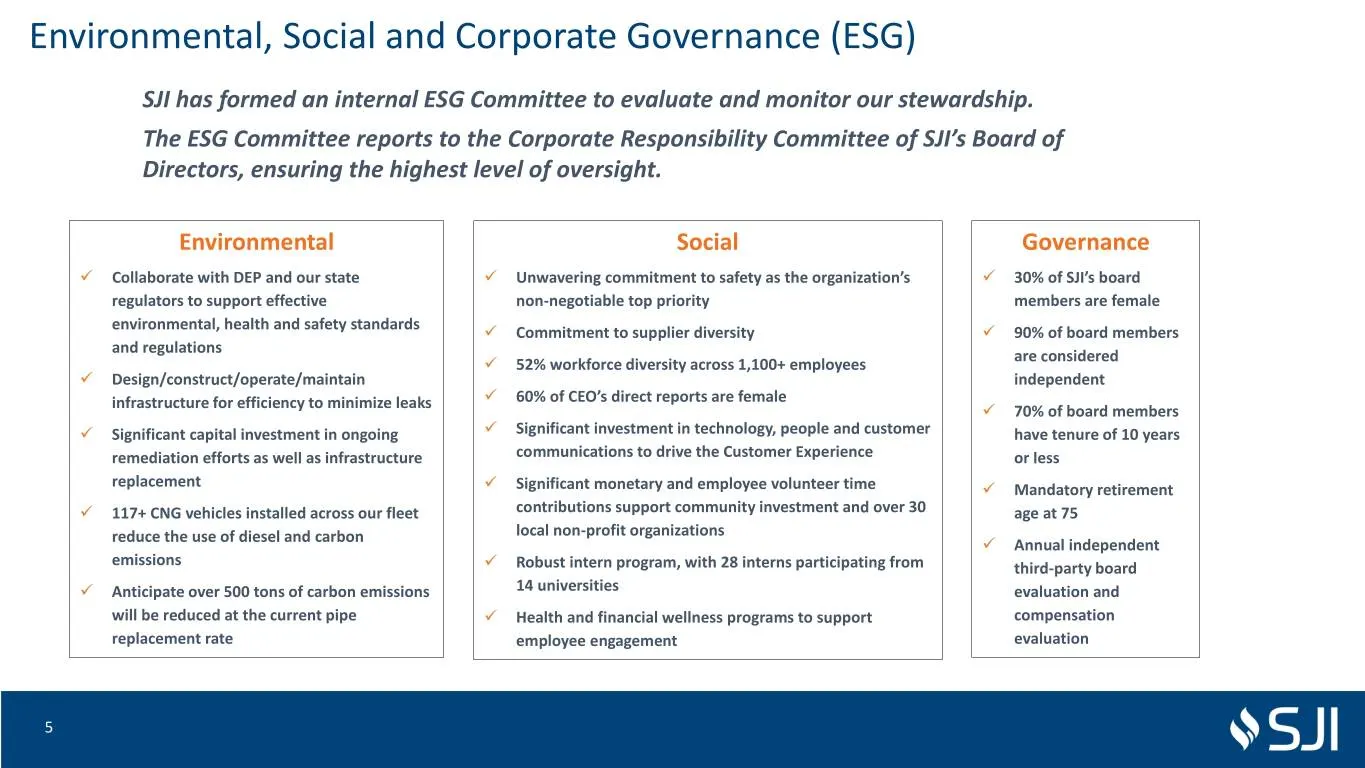
Environmental, Social and Corporate Governance (ESG) SJI has formed an internal ESG Committee to evaluate and monitor our stewardship. The ESG Committee reports to the Corporate Responsibility Committee of SJI’s Board of Directors, ensuring the highest level of oversight. Environmental Social Govern
Slide 6: Business Transformation
Business Transformation 6
Slide 7: Business Transformation | Successful Execution of Strategy
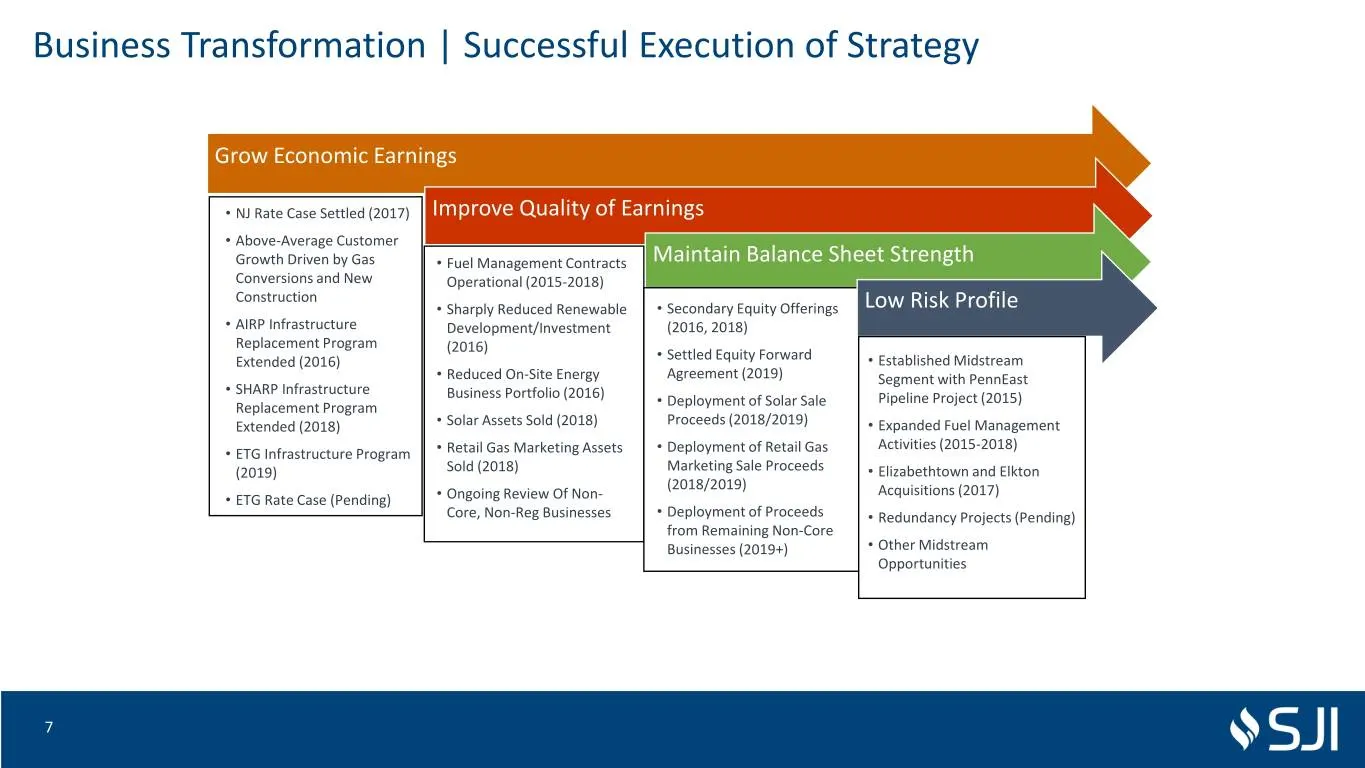
Business Transformation | Successful Execution of Strategy Grow Economic Earnings • NJ Rate Case Settled (2017) Improve Quality of Earnings • Above-Average Customer Growth Driven by Gas • Fuel Management Contracts Maintain Balance Sheet Strength Conversions and New Operational (2015-2018) Constructi
Slide 8: Strategic Transformation | Acquisitions A Perfect Fit
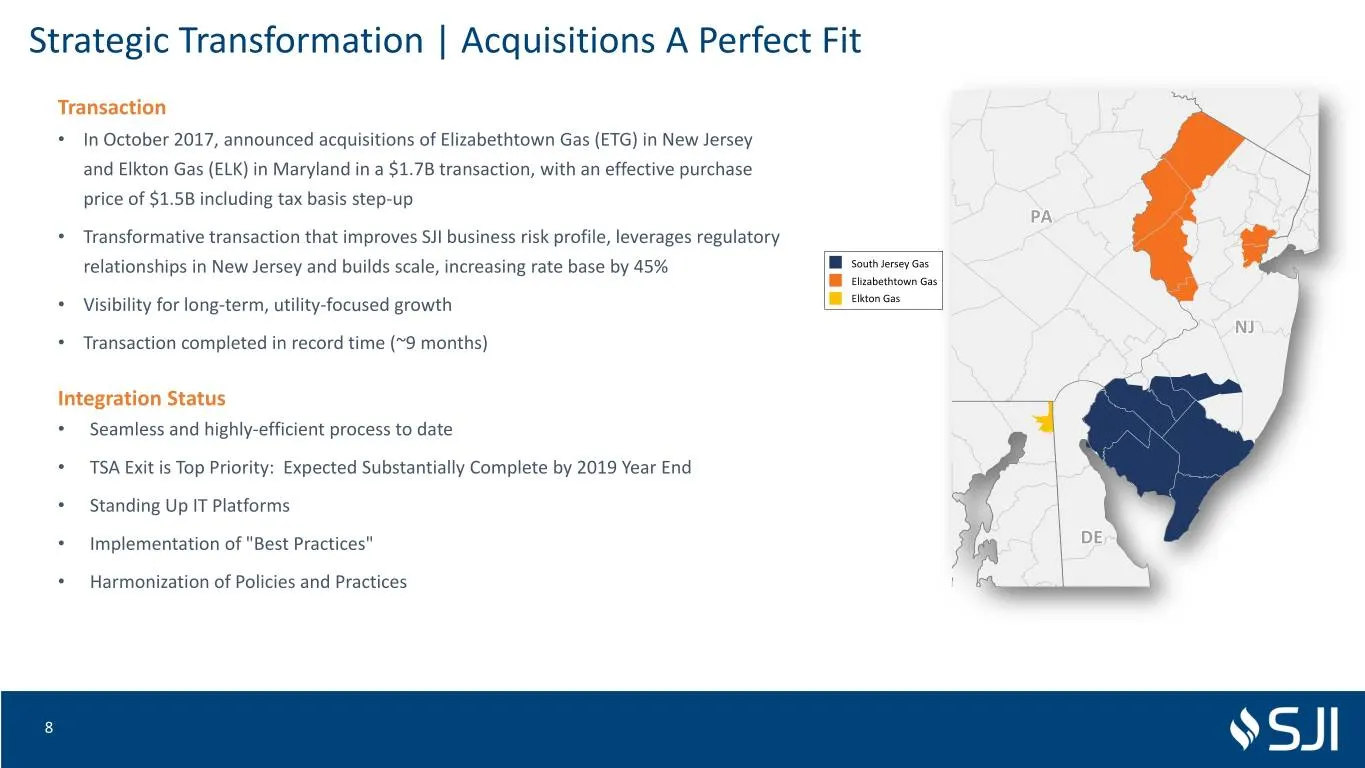
NYNY Strategic Transformation | Acquisitions A Perfect Fit Transaction • In October 2017, announced acquisitions of Elizabethtown Gas (ETG) in New Jersey and Elkton Gas (ELK) in Maryland in a $1.7B transaction, with an effective purchase price of $1.5B including tax basis step-up PAPA • Transformati
Slide 9: Strategic Transformation | Asset Sales
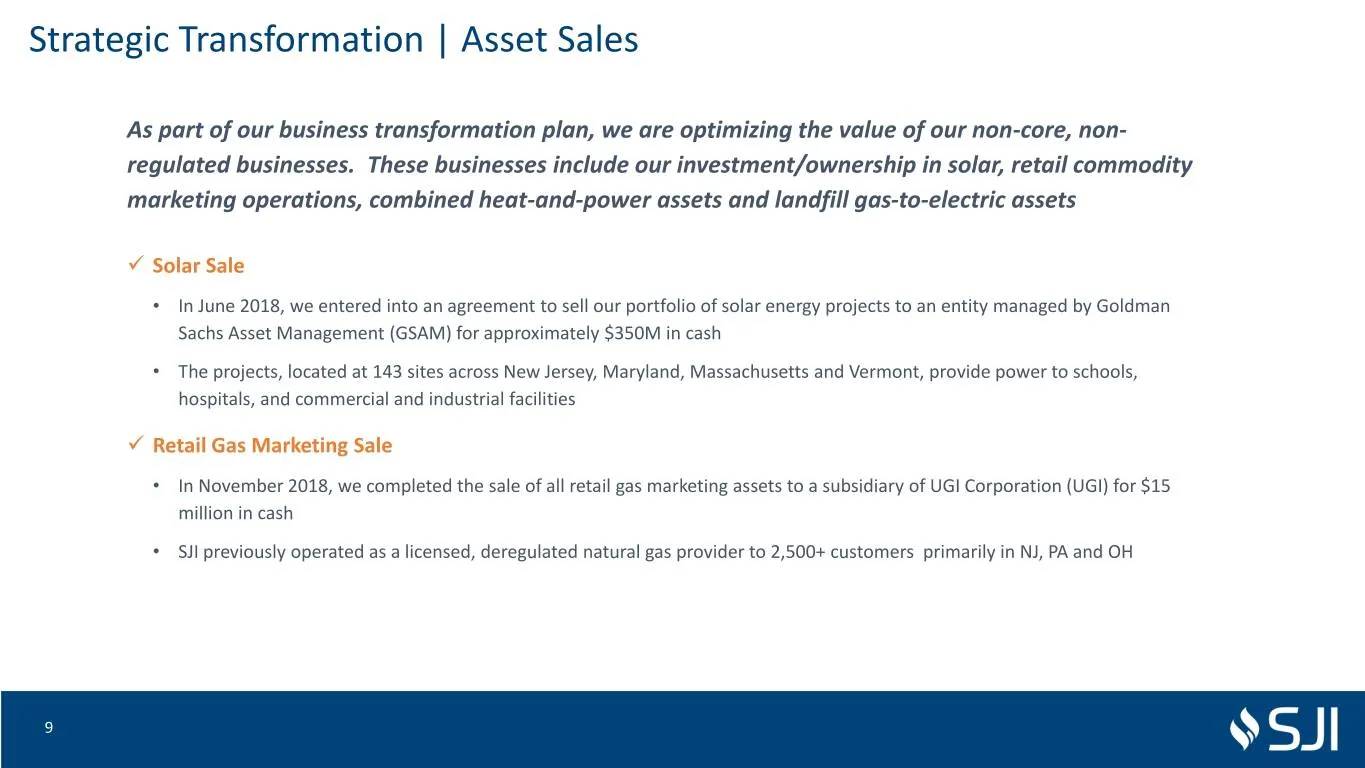
Strategic Transformation | Asset Sales As part of our business transformation plan, we are optimizing the value of our non-core, non- regulated businesses. These businesses include our investment/ownership in solar, retail commodity marketing operations, combined heat-and-power assets and landfill g
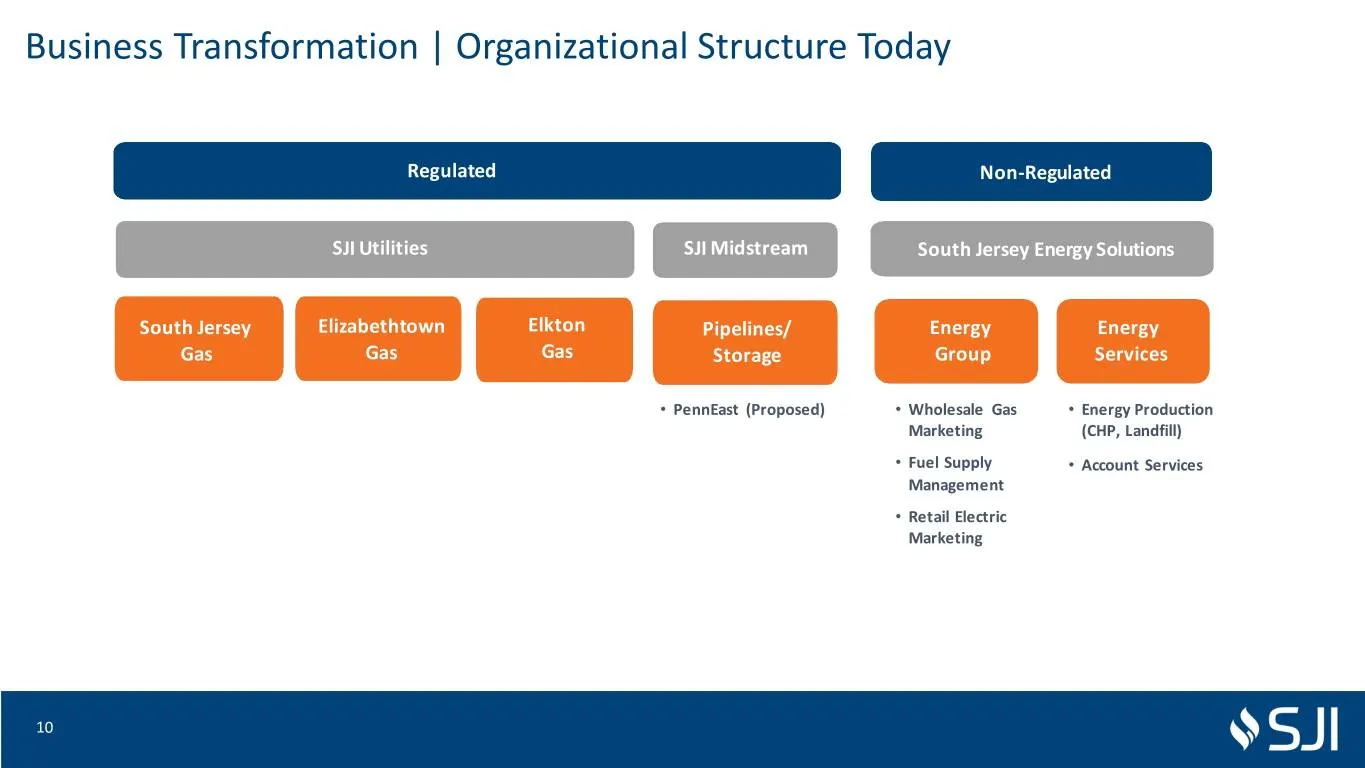
Slide 10: Business Transformation | Organizational Structure Today
Business Transformation | Organizational Structure Today Regulated Non-Regulated SJI Utilities SJI Midstream South Jersey Energy Solutions South Jersey Elizabethtown Elkton Pipelines/ Energy Energy Gas Gas Gas Storage Group Services • PennEast (Proposed) • Wholesale Gas • Energy Production Marketing
Slide 11: Business Transformation | Next Steps
Business Transformation | Next Steps ➢ Acquisition Integration ▪ Integration of ETG/Elkton and Adoption of Best Practices ➢ Business Transformation Initiative ▪ Leveraging Talent and Technology to Improve Business Processes and Results ➢ Non-Core Businesses ▪ Complete Repositioning of Non-Utility Bu
Slide 12: SJI Utilities (SJIU)
SJI Utilities (SJIU) 12
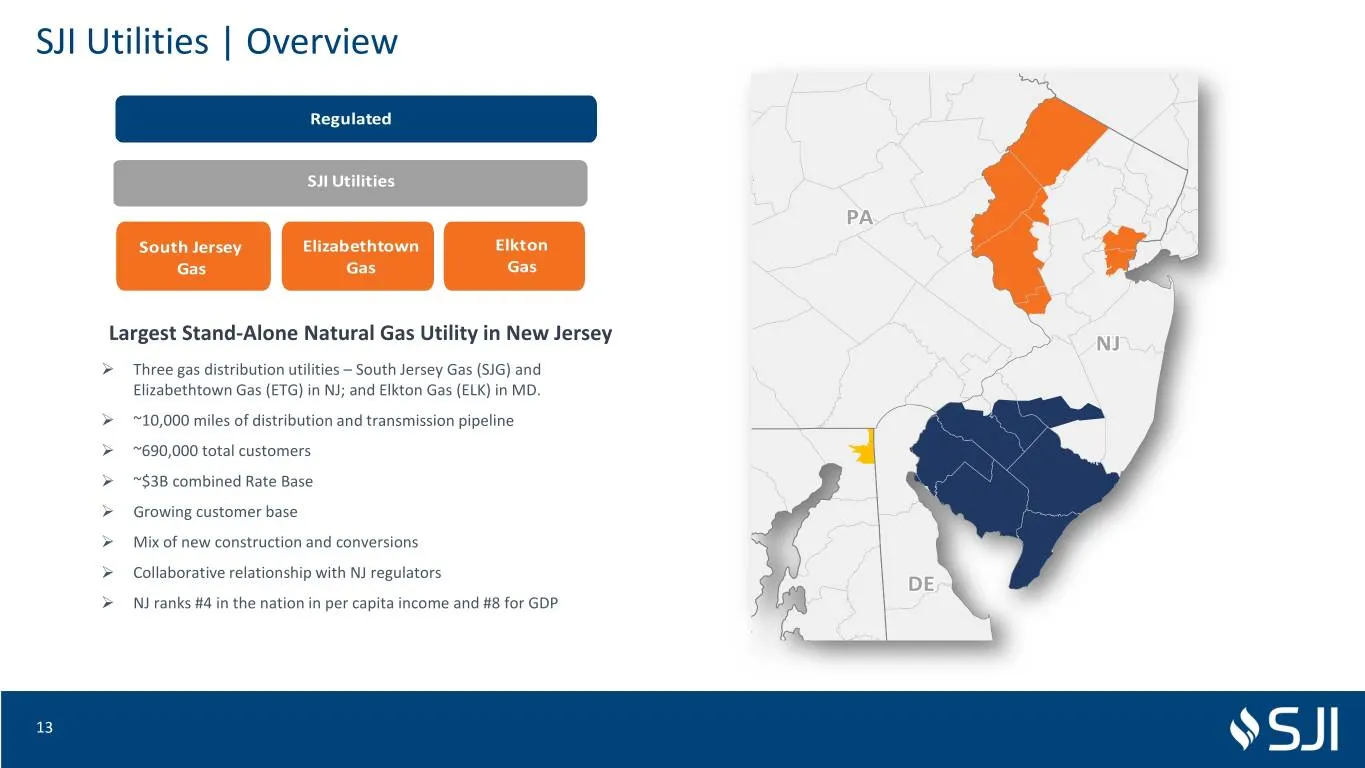
Slide 13: SJI Utilities | Overview
NYNY SJI Utilities | Overview Regulated SJI Utilities PAPA South Jersey Elizabethtown Elkton Gas Gas Gas Largest Stand-Alone Natural Gas Utility in New Jersey NJNJ ➢ Three gas distribution utilities – South Jersey Gas (SJG) and Elizabethtown Gas (ETG) in NJ; and Elkton Gas (ELK) in MD. ➢ ~10,000 mil
Slide 14: SJI Utilities | South Jersey Gas
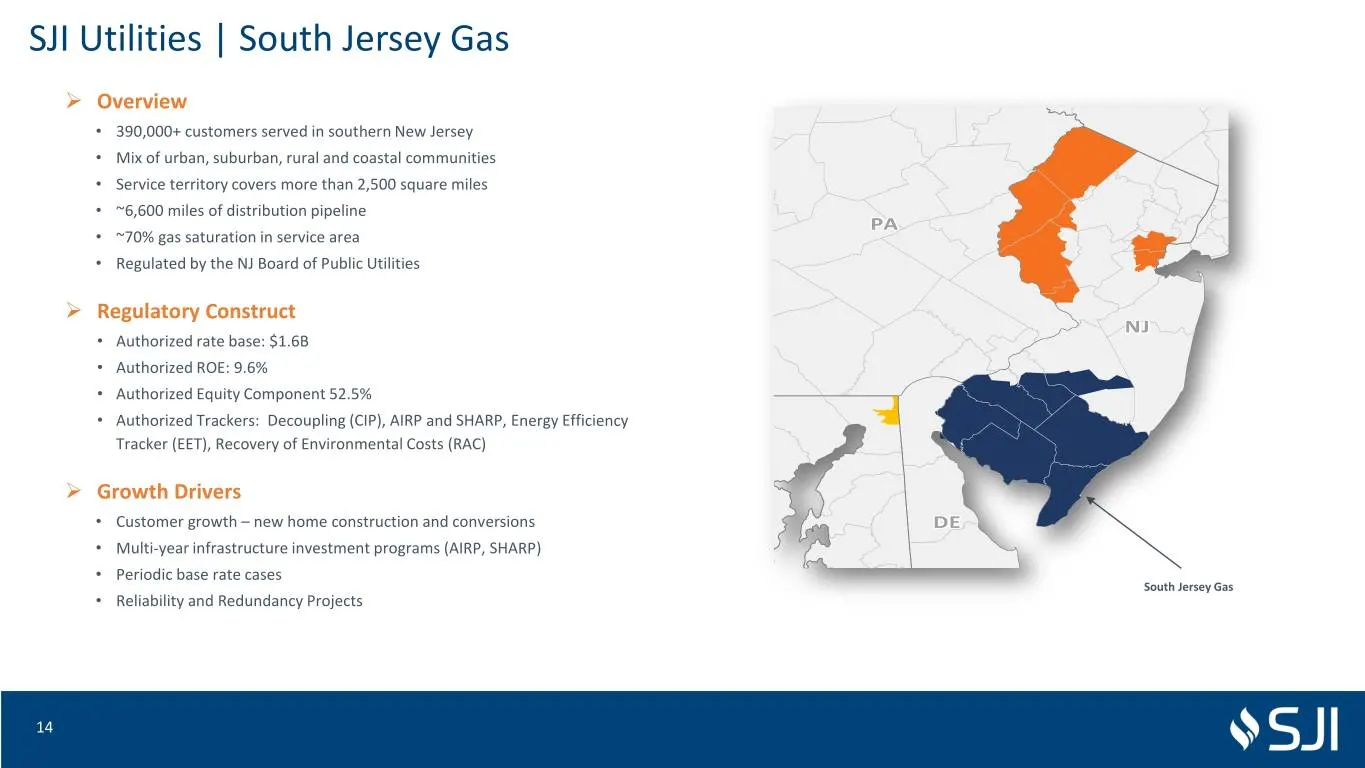
NYNY SJI Utilities | South Jersey Gas ➢ Overview • 390,000+ customers served in southern New Jersey • Mix of urban, suburban, rural and coastal communities • Service territory covers more than 2,500 square miles • ~6,600 miles of distribution pipeline PAPA • ~70% gas saturation in service area • Reg
Slide 15: SJI Utilities | Elizabethtown Gas
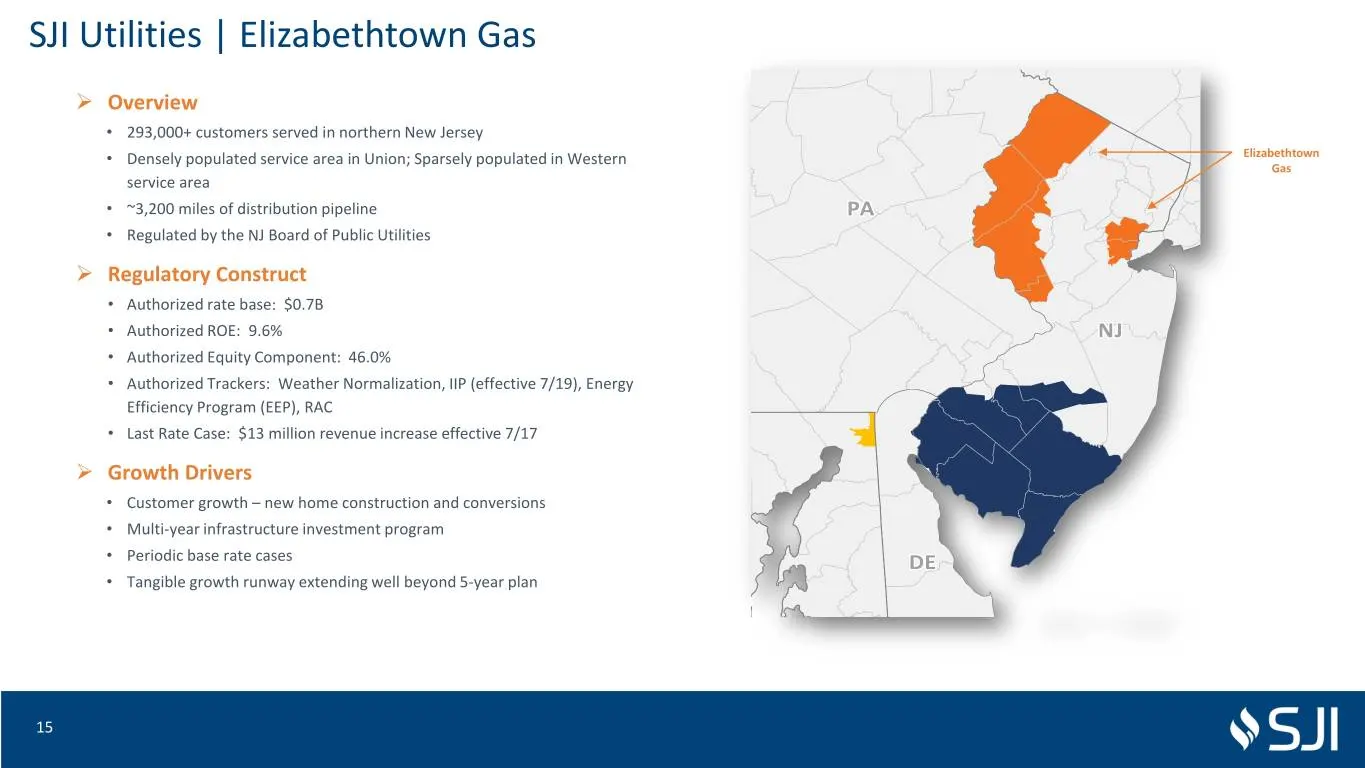
NYNY SJI Utilities | Elizabethtown Gas ➢ Overview • 293,000+ customers served in northern New Jersey • Densely populated service area in Union; Sparsely populated in Western Elizabethtown Gas service area • ~3,200 miles of distribution pipeline PAPA • Regulated by the NJ Board of Public Utilities ➢
Slide 16: SJI Utilities | Elkton Gas
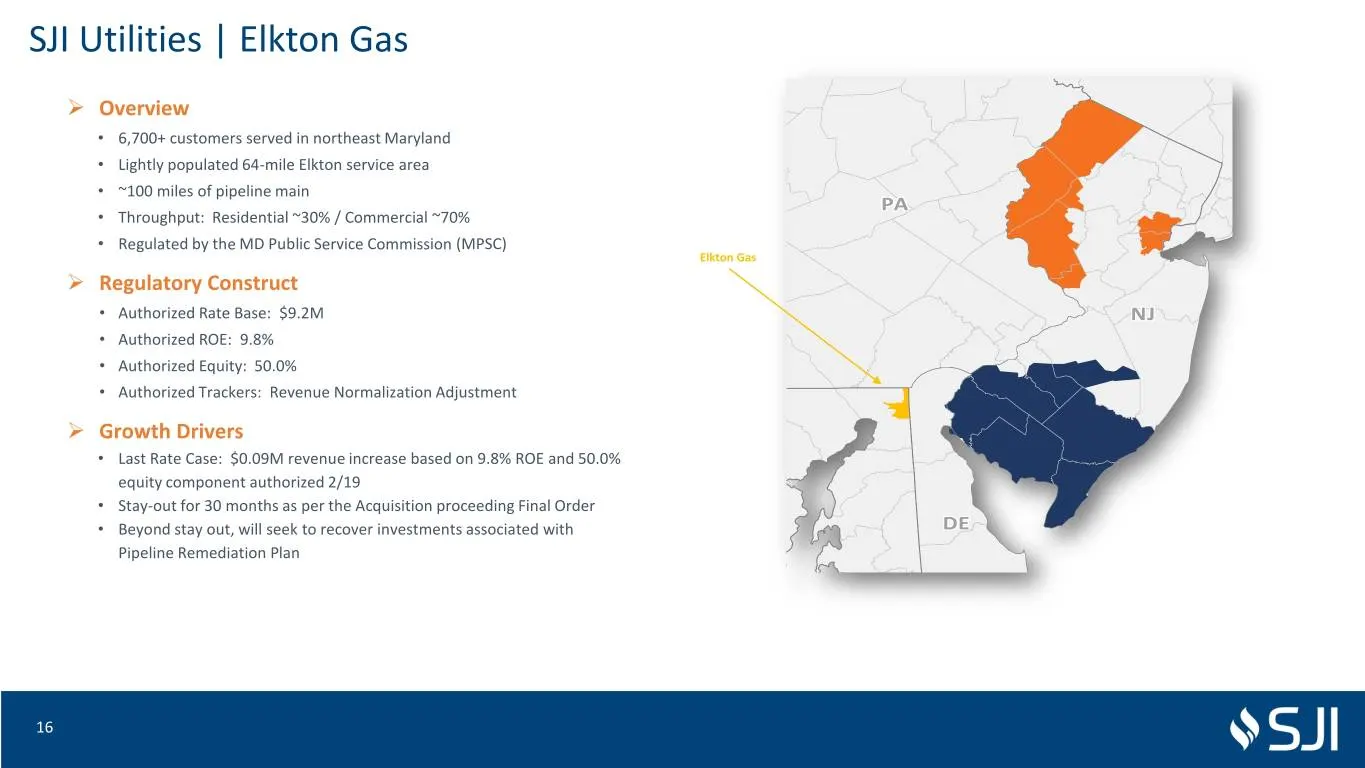
NYNY SJI Utilities | Elkton Gas ➢ Overview • 6,700+ customers served in northeast Maryland • Lightly populated 64-mile Elkton service area • ~100 miles of pipeline main PAPA • Throughput: Residential ~30% / Commercial ~70% • Regulated by the MD Public Service Commission (MPSC) Elkton Gas ➢ Regulator
Slide 17: SJI Utilities | Safety is Our Top Priority
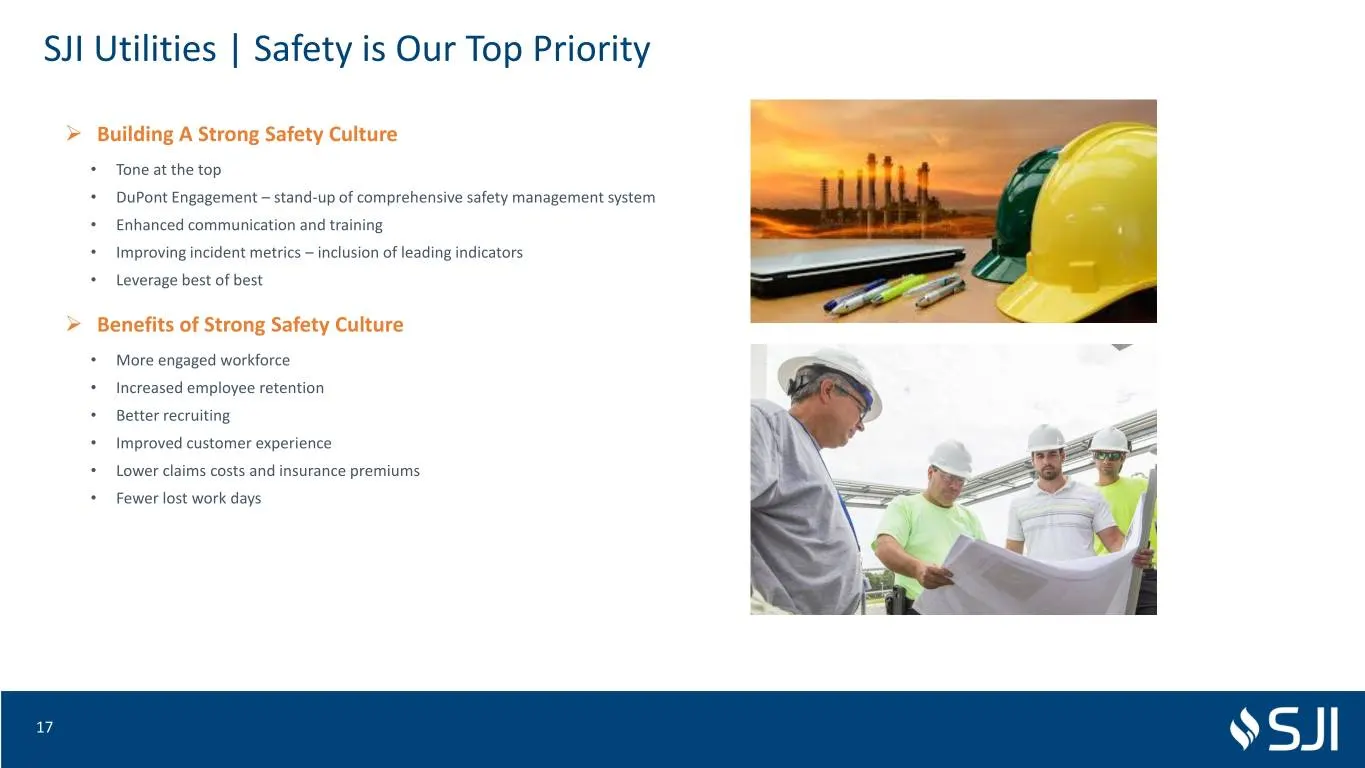
SJI Utilities | Safety is Our Top Priority ➢ Building A Strong Safety Culture • Tone at the top • DuPont Engagement – stand-up of comprehensive safety management system • Enhanced communication and training • Improving incident metrics – inclusion of leading indicators • Leverage best of best ➢ Bene
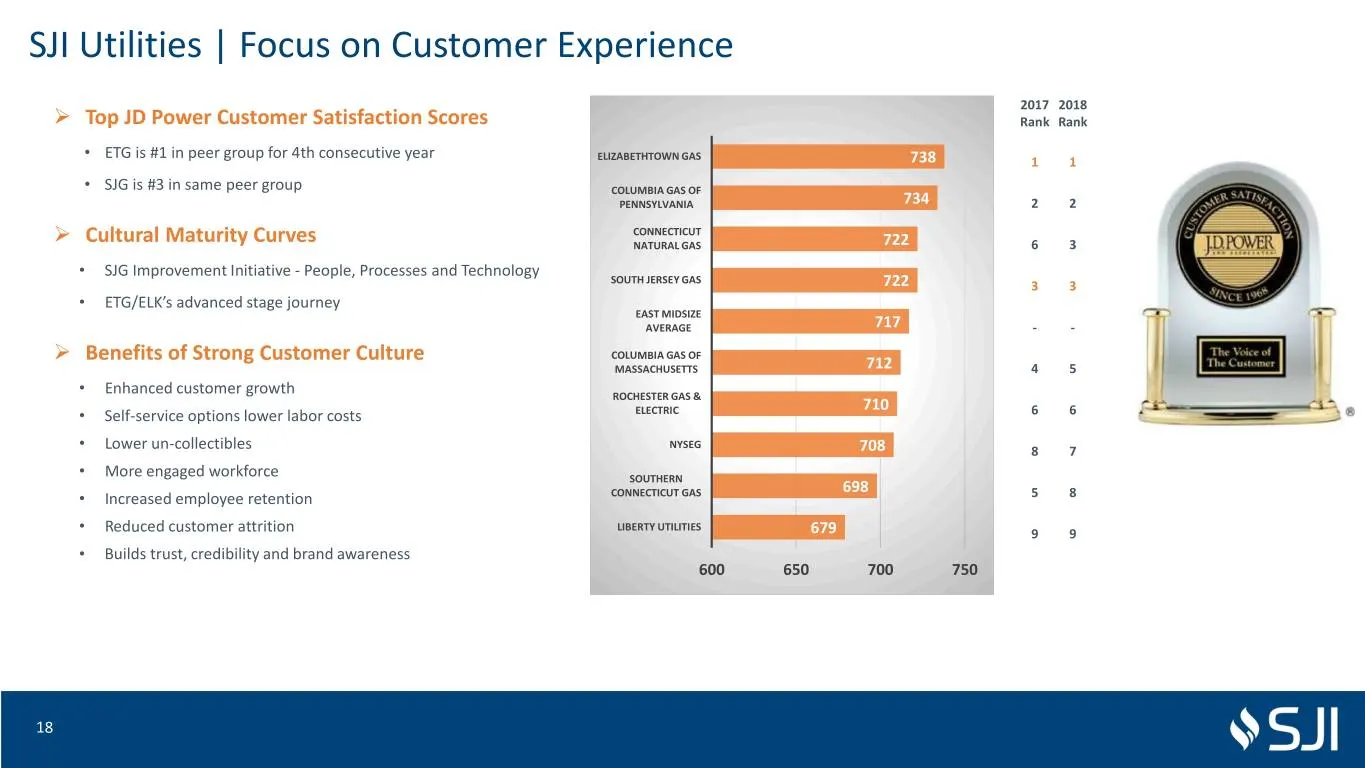
Slide 18: SJI Utilities | Focus on Customer Experience
SJI Utilities | Focus on Customer Experience 2017 2018 ➢ Top JD Power Customer Satisfaction Scores Rank Rank • ETG is #1 in peer group for 4th consecutive year ELIZABETHTOWN GAS 738 1 1 • SJG is #3 in same peer group COLUMBIA GAS OF PENNSYLVANIA 734 2 2 ➢ CONNECTICUT Cultural Maturity Curves NATURAL
Slide 19: Customer Growth
Customer Growth 19
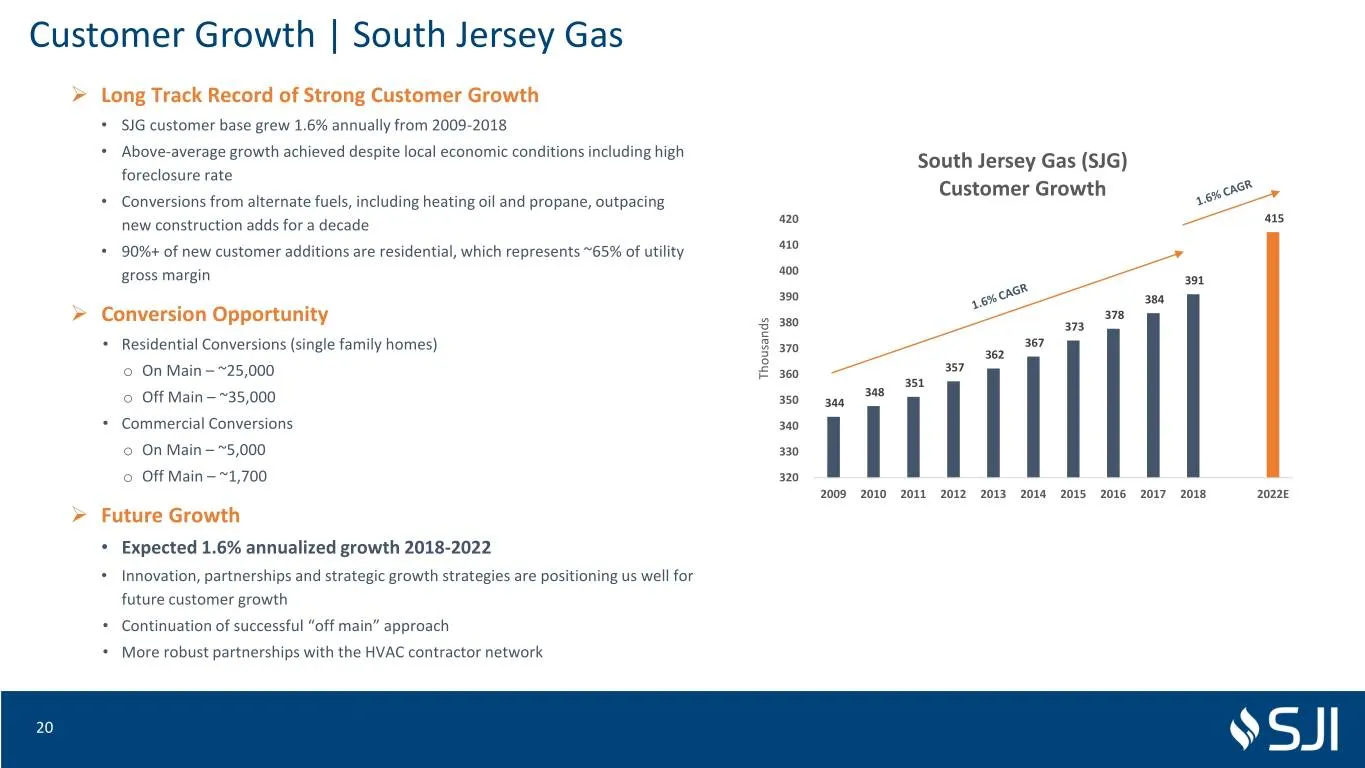
Slide 20: Customer Growth | South Jersey Gas
Customer Growth | South Jersey Gas ➢ Long Track Record of Strong Customer Growth • SJG customer base grew 1.6% annually from 2009-2018 • Above-average growth achieved despite local economic conditions including high South Jersey Gas (SJG) foreclosure rate Customer Growth • Conversions from alternate
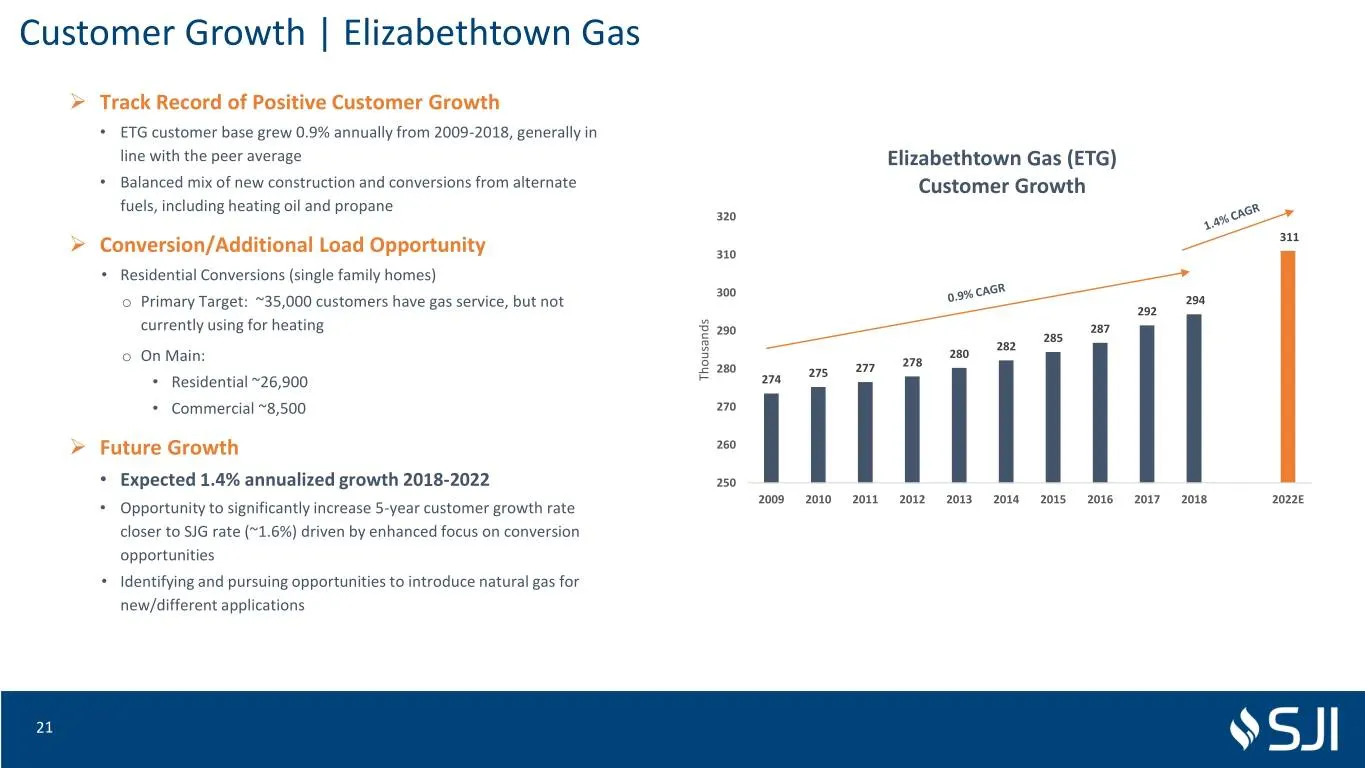
Slide 21: Customer Growth | Elizabethtown Gas
Customer Growth | Elizabethtown Gas ➢ Track Record of Positive Customer Growth • ETG customer base grew 0.9% annually from 2009-2018, generally in line with the peer average Elizabethtown Gas (ETG) • Balanced mix of new construction and conversions from alternate Customer Growth fuels, including hea
Slide 22: Regulatory Initiatives
Regulatory Initiatives 22
Slide 23: Regulatory Initiatives | SJG Infrastructure Modernization
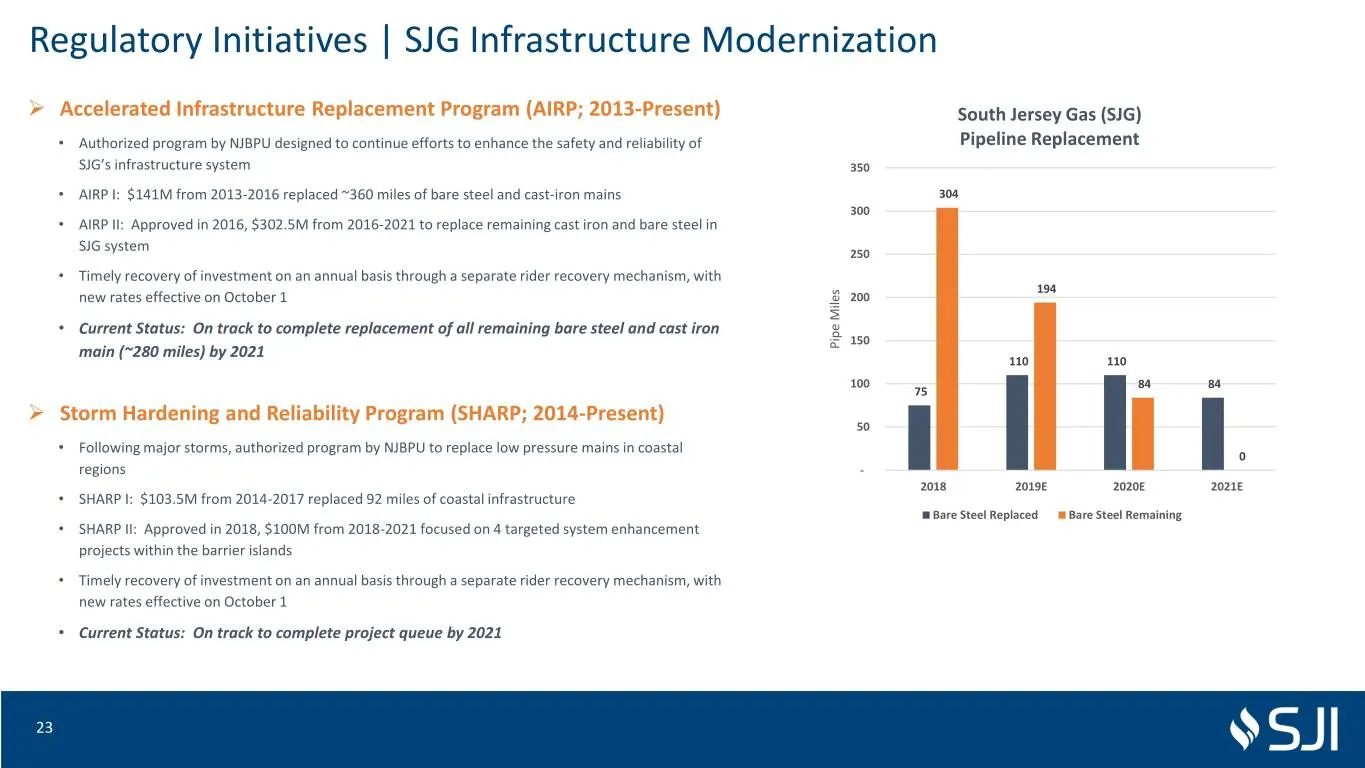
Regulatory Initiatives | SJG Infrastructure Modernization ➢ Accelerated Infrastructure Replacement Program (AIRP; 2013-Present) South Jersey Gas (SJG) • Authorized program by NJBPU designed to continue efforts to enhance the safety and reliability of Pipeline Replacement SJG’s infrastructure system
Slide 24: Regulatory Initiatives | ETG Infrastructure Modernization
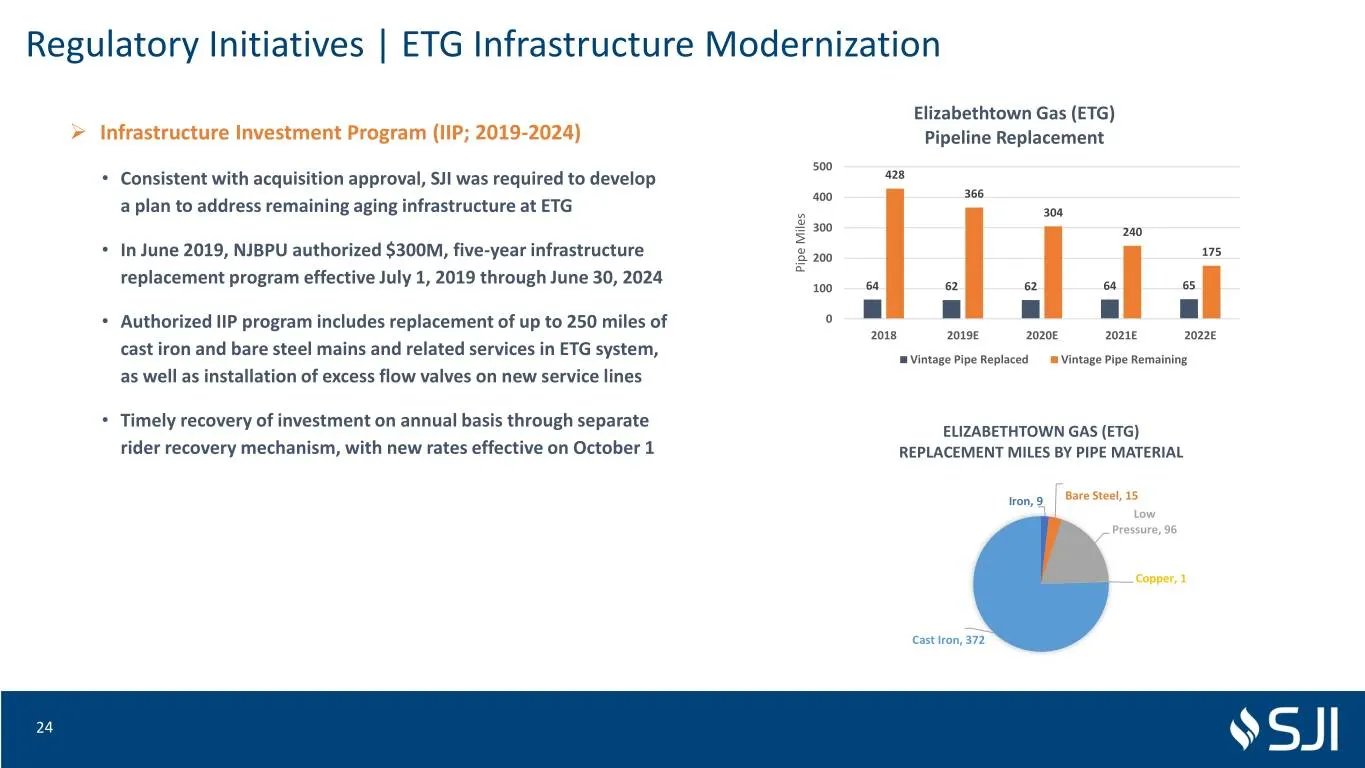
Regulatory Initiatives | ETG Infrastructure Modernization Elizabethtown Gas (ETG) ➢ Infrastructure Investment Program (IIP; 2019-2024) Pipeline Replacement 500 • Consistent with acquisition approval, SJI was required to develop 428 400 366 a plan to address remaining aging infrastructure at ETG 304
Slide 25: Regulatory Initiatives | ETG Base Rate Case
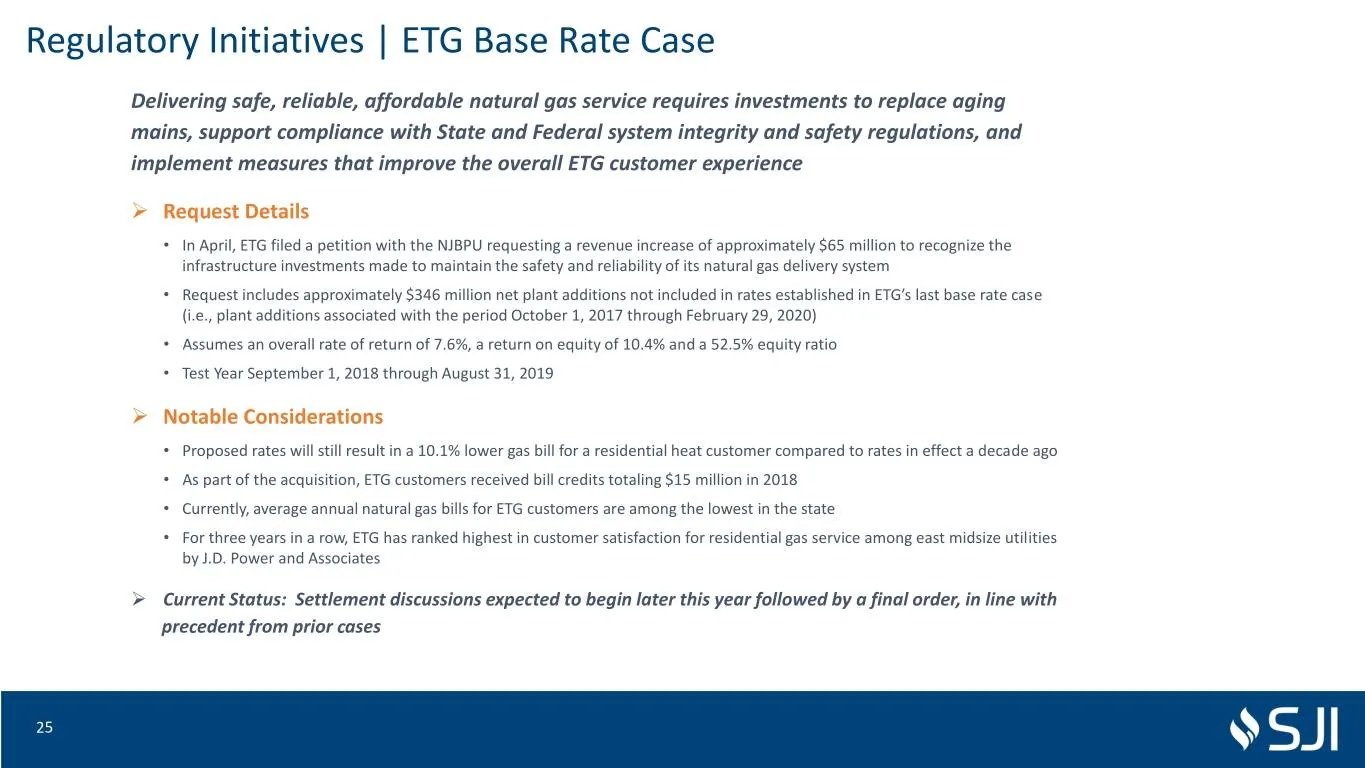
Regulatory Initiatives | ETG Base Rate Case Delivering safe, reliable, affordable natural gas service requires investments to replace aging mains, support compliance with State and Federal system integrity and safety regulations, and implement measures that improve the overall ETG customer experienc
Slide 26: Regulatory Initiatives | 2019/2020
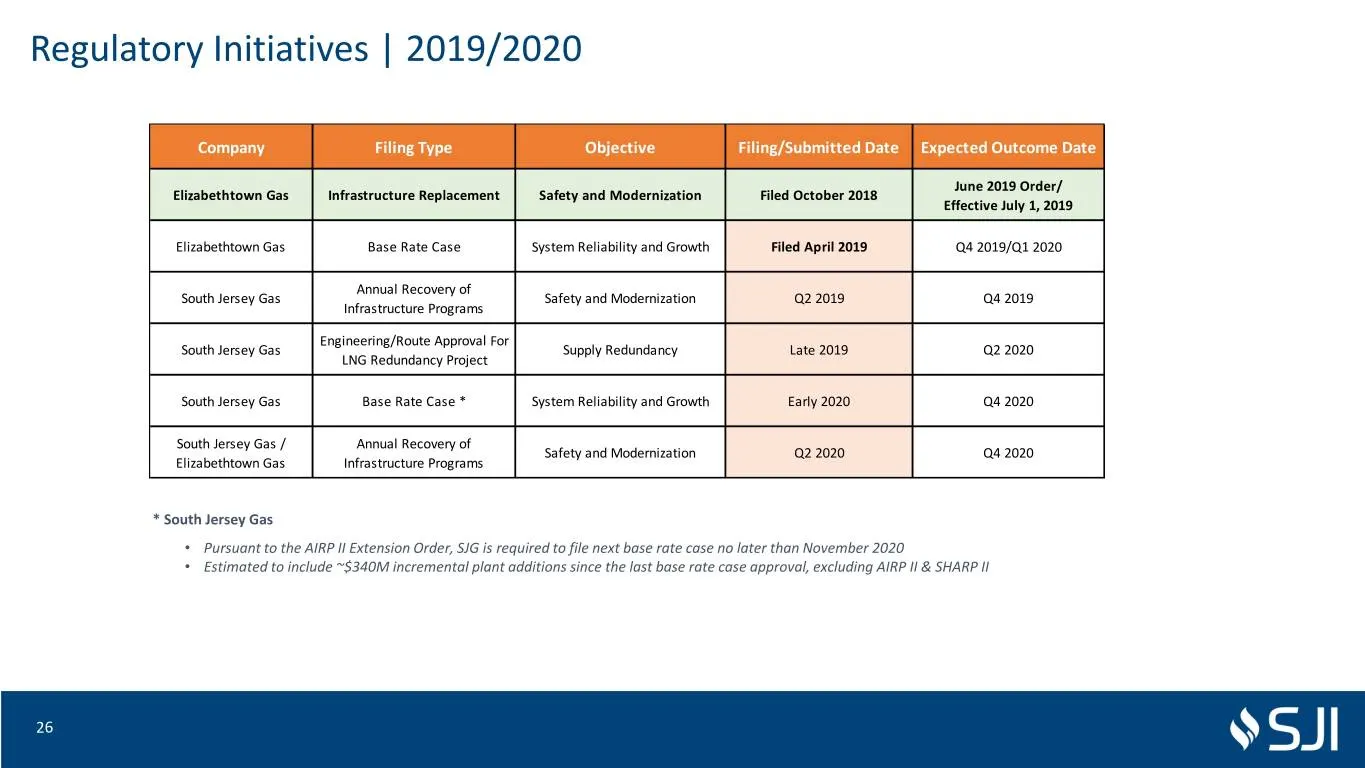
Regulatory Initiatives | 2019/2020 Company Filing Type Objective Filing/Submitted Date Expected Outcome Date June 2019 Order/ Elizabethtown Gas Infrastructure Replacement Safety and Modernization Filed October 2018 Effective July 1, 2019 Elizabethtown Gas Base Rate Case System Reliability and Growth
Slide 27: Regulatory Initiatives | Redundancy Projects
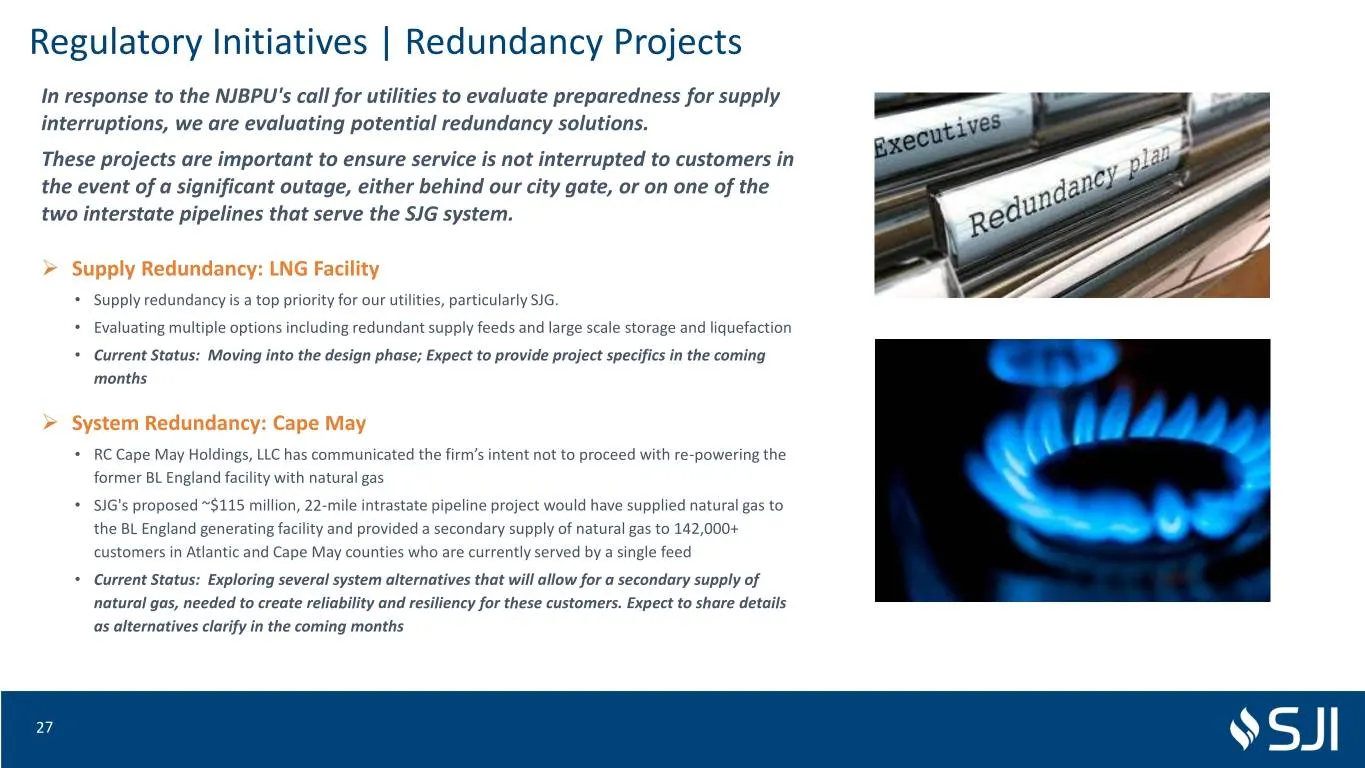
Regulatory Initiatives | Redundancy Projects In response to the NJBPU's call for utilities to evaluate preparedness for supply interruptions, we are evaluating potential redundancy solutions. These projects are important to ensure service is not interrupted to customers in the event of a significant
Slide 28: Midstream
Midstream 28
Slide 29: Midstream | PennEast Pipeline
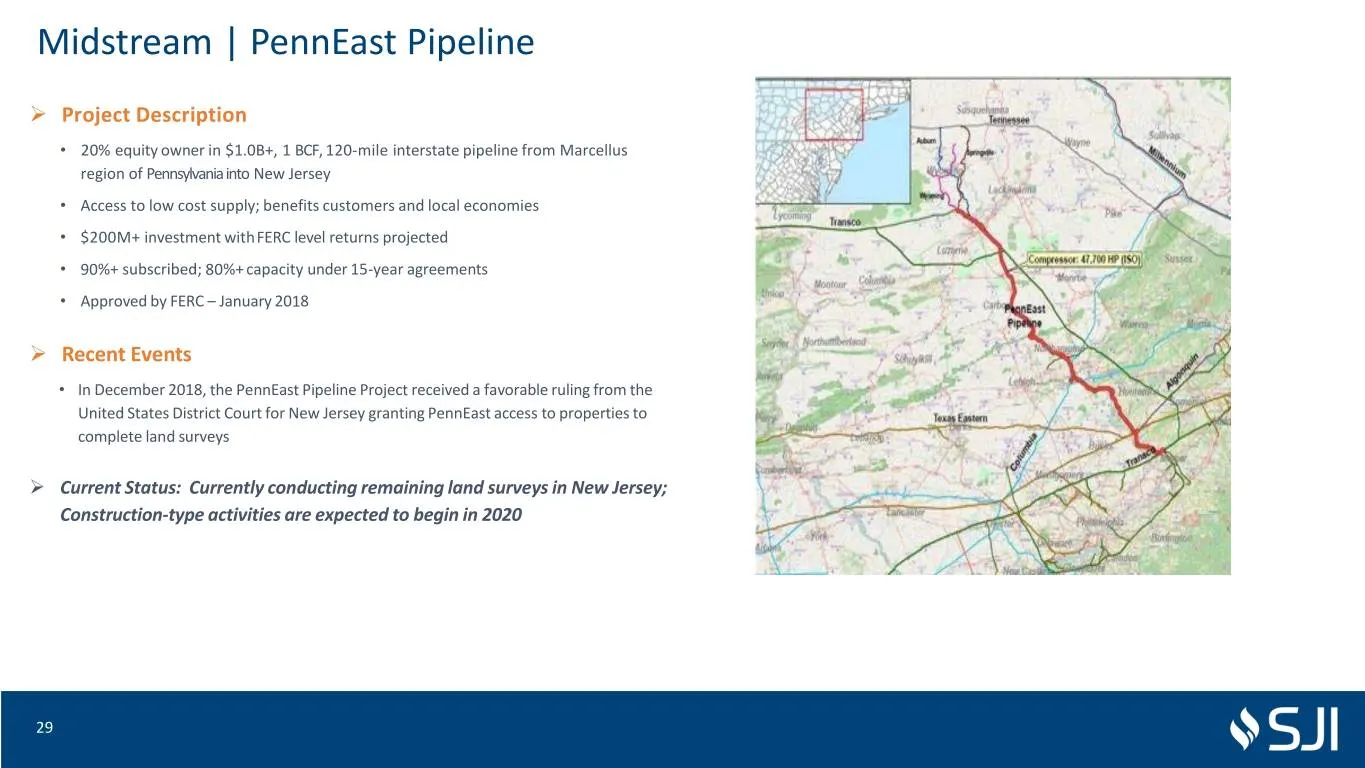
Midstream | PennEast Pipeline ➢ Project Description • 20% equity owner in $1.0B+, 1 BCF, 120-mile interstate pipeline from Marcellus region of Pennsylvania into New Jersey • Access to low cost supply; benefits customers and local economies • $200M+ investment withFERC level returns projected • 90%+
Slide 30: Non-Utility Operations
Non-Utility Operations 30
Slide 31: Non-Utility Operations | Overview
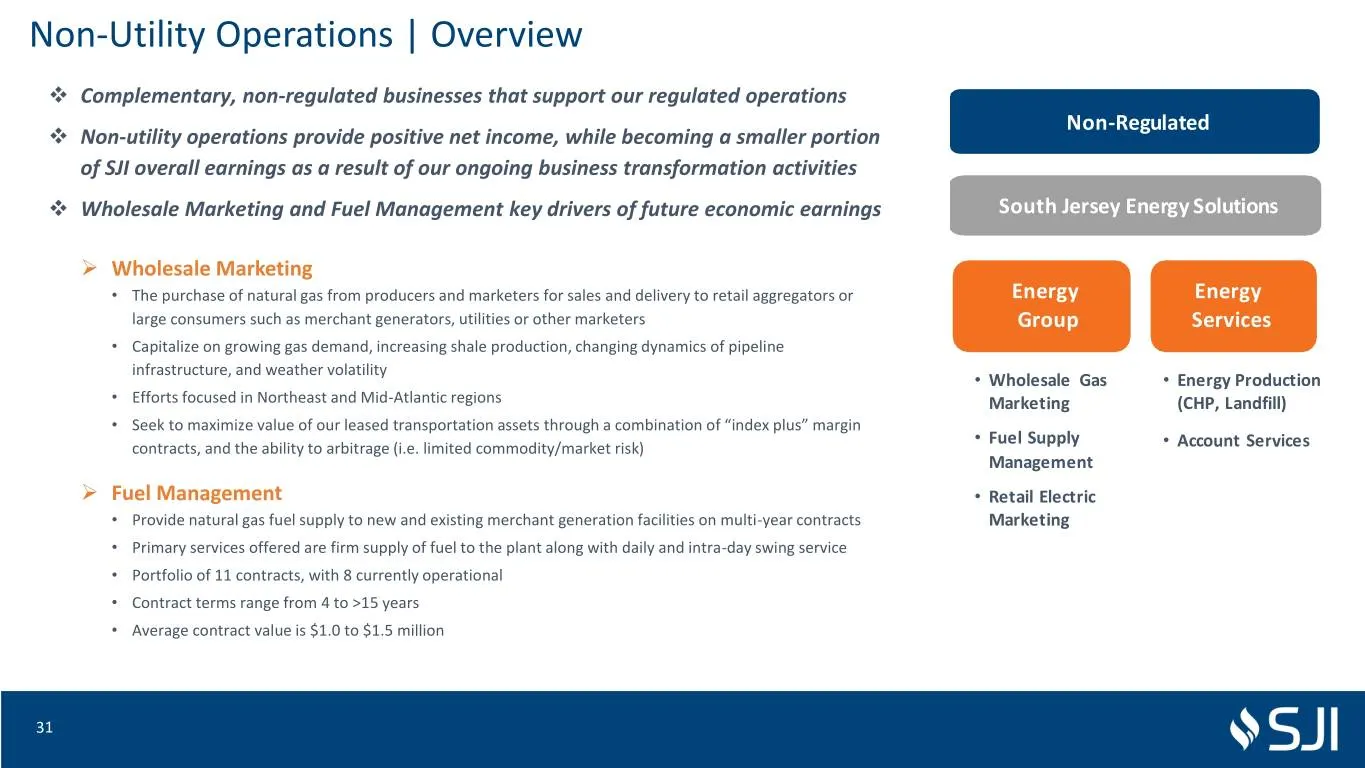
Non-Utility Operations | Overview ❖ Complementary, non-regulated businesses that support our regulated operations Non-Regulated ❖ Non-utility operations provide positive net income, while becoming a smaller portion of SJI overall earnings as a result of our ongoing business transformation activities
Slide 32: Non-Utility Operations | Fuel Management Contracts
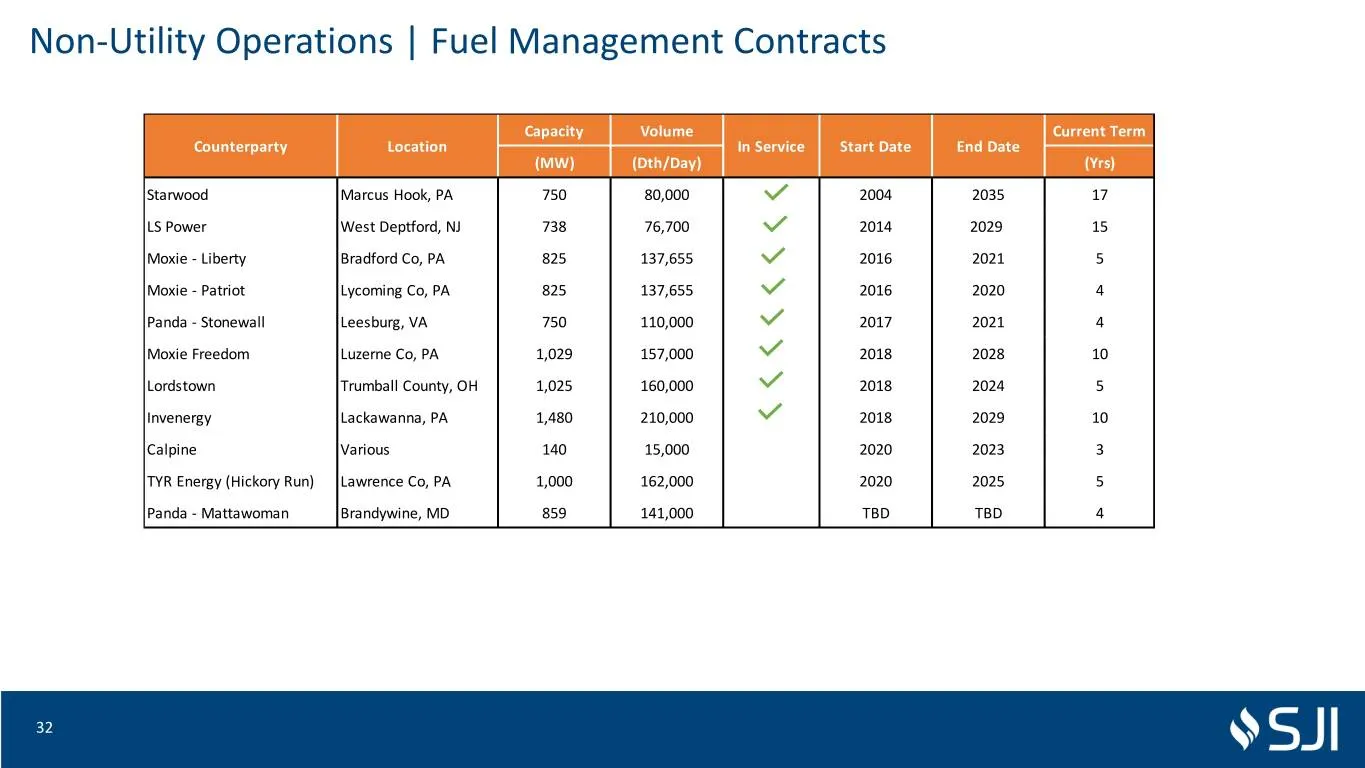
Non-Utility Operations | Fuel Management Contracts Capacity Volume Current Term Counterparty Location In Service Start Date End Date (MW) (Dth/Day) (Yrs) Starwood Marcus Hook, PA 750 80,000 2004 2035 17 LS Power West Deptford, NJ 738 76,700 2014 2029 15 Moxie - Liberty Bradford Co, PA 825 137,655 20
Slide 33: Recent Financial Performance
Recent Financial Performance 33
Slide 34: Financial Performance | 1Q'19 Summary
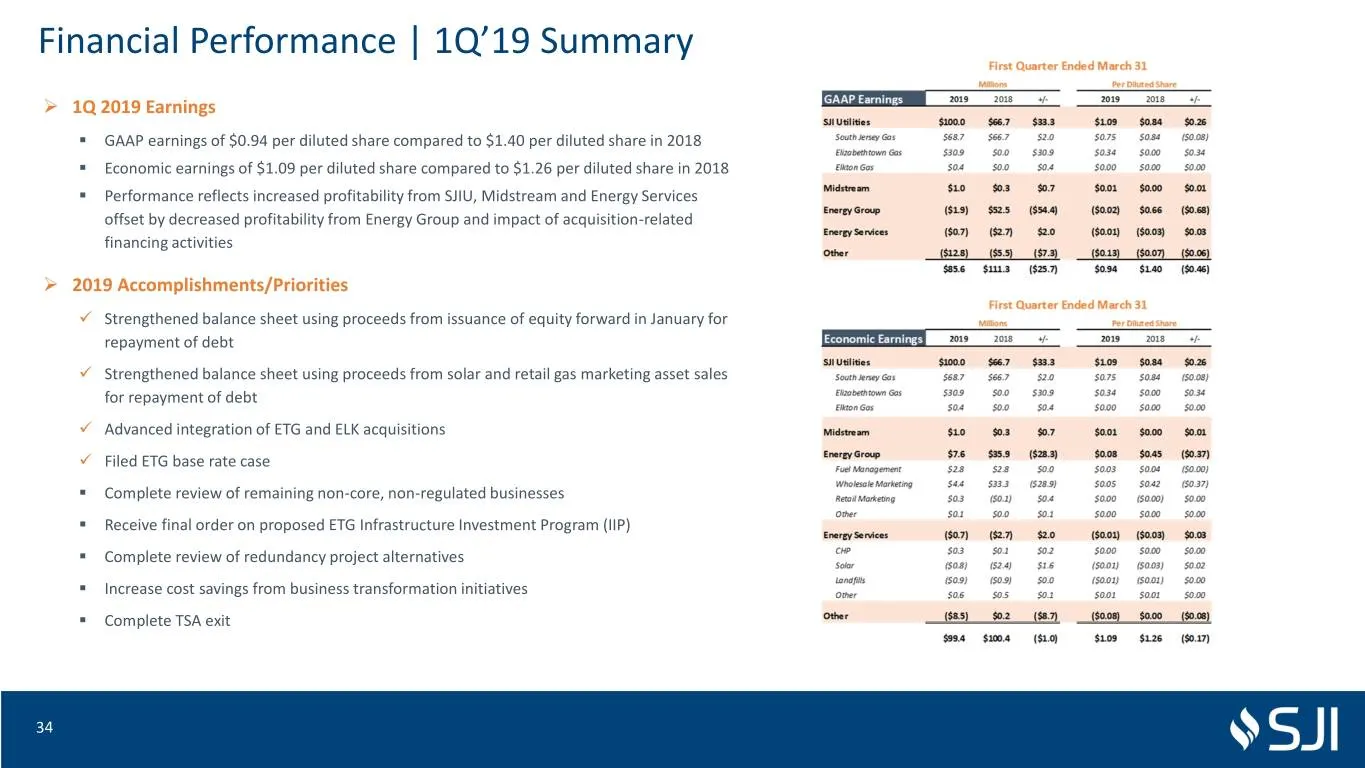
Financial Performance | 1Q’19 Summary ➢ 1Q 2019 Earnings ▪ GAAP earnings of $0.94 per diluted share compared to $1.40 per diluted share in 2018 ▪ Economic earnings of $1.09 per diluted share compared to $1.26 per diluted share in 2018 ▪ Performance reflects increased profitability from SJIU, Midstre
Slide 35: Financial Performance | Economic Earnings Bridge - Q1'18 to Q1'19
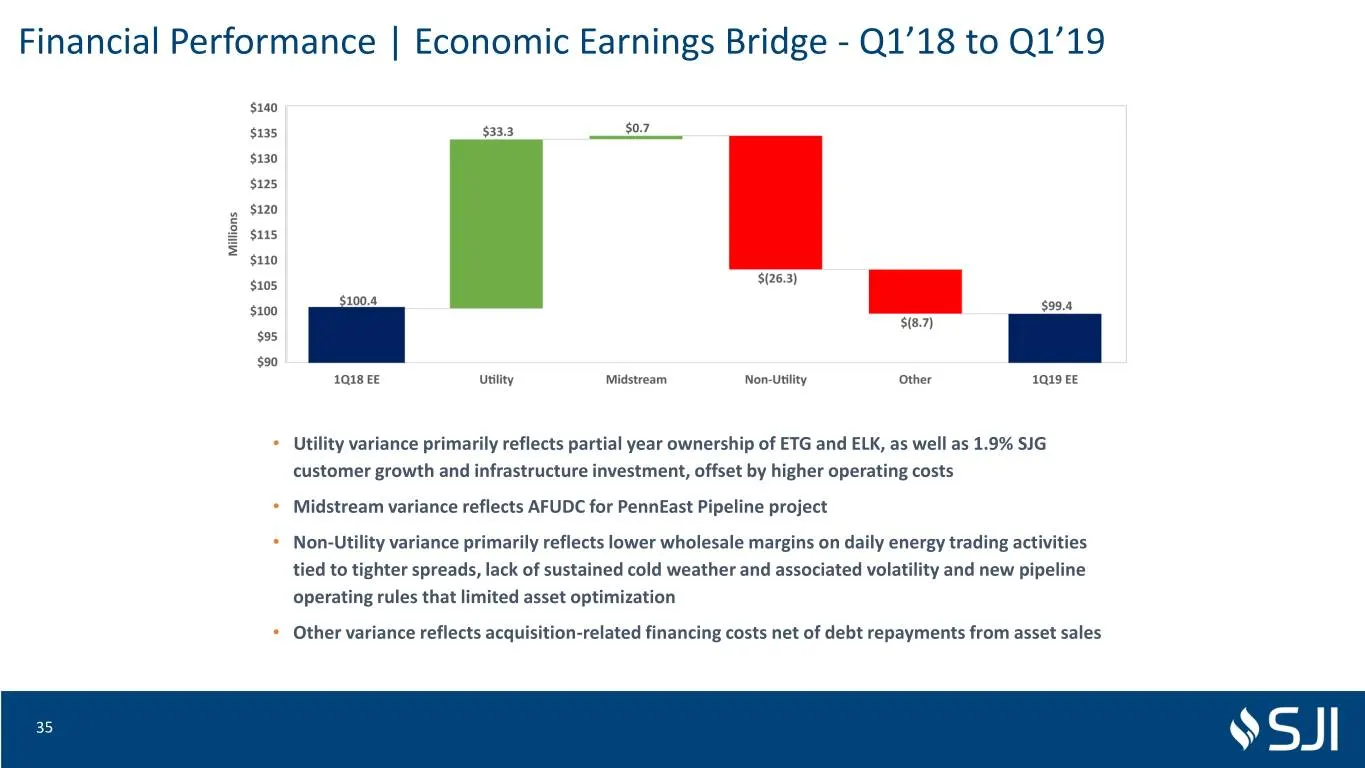
Financial Performance | Economic Earnings Bridge - Q1’18 to Q1’19 • Utility variance primarily reflects partial year ownership of ETG and ELK, as well as 1.9% SJG customer growth and infrastructure investment, offset by higher operating costs • Midstream variance reflects AFUDC for PennEast Pipeline
Slide 36: 2019/2020 Guidance
2019/2020 Guidance 36
Slide 37: Guidance | 2019 Reaffirmed
Guidance | 2019 Reaffirmed ❖ SJI reaffirms its expectation for 2019 economic earnings in the range of $98 million to $107 million, or $1.05 to $1.15 per diluted share. ❖ Economic earnings guidance primarily reflects 1) regulated operations that represent 80-85% of economic earnings excluding acquisi
Slide 38: Guidance | Economic Earnings Bridge - 2018 to 2019 Midpoints
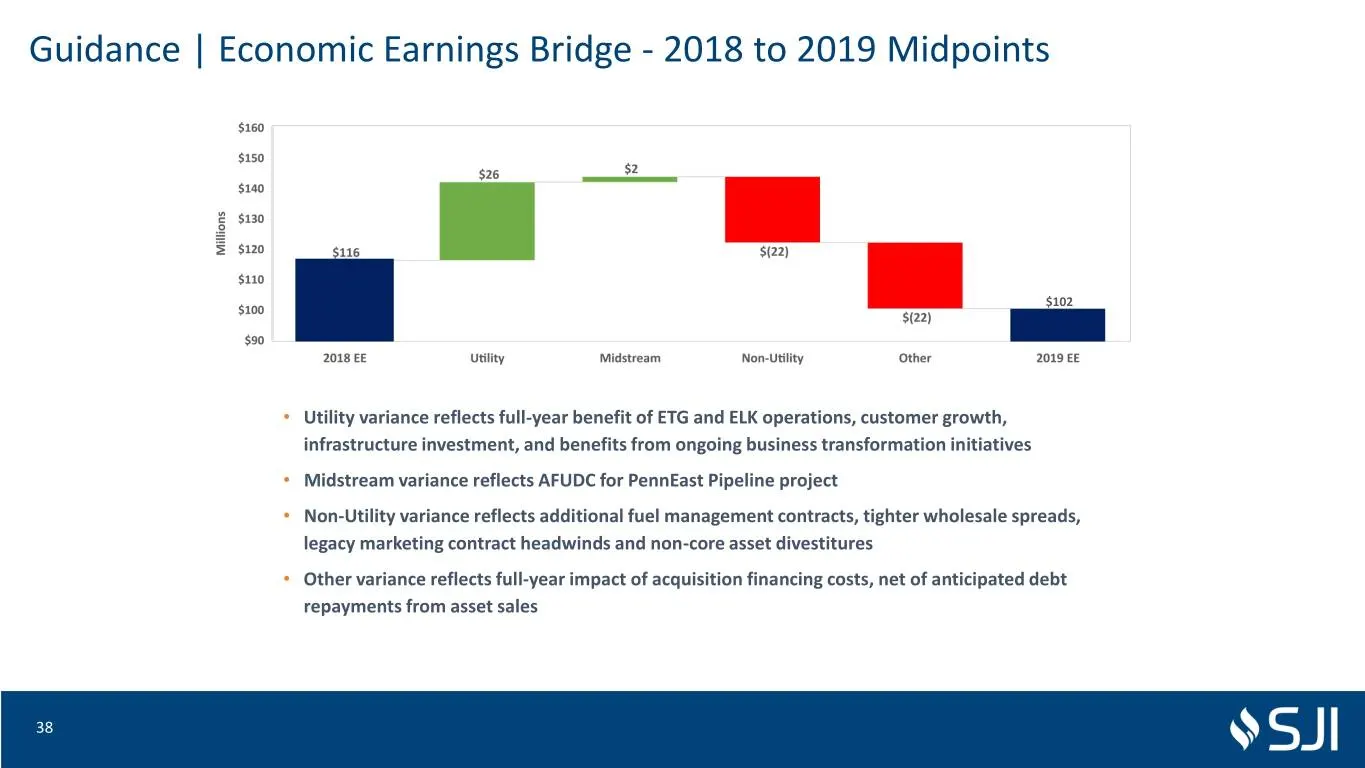
Guidance | Economic Earnings Bridge - 2018 to 2019 Midpoints $102 • Utility variance reflects full-year benefit of ETG and ELK operations, customer growth, infrastructure investment, and benefits from ongoing business transformation initiatives • Midstream variance reflects AFUDC for PennEast Pipeli
Slide 39: Guidance | 2020
Guidance | 2020 ❖ SJI expects 2020 economic earnings in the range of $147 million to $160 million, or $1.53 to $1.67 per diluted share. ❖ Economic earnings guidance primarily reflects 1) regulated operations that represent approximately 80% of earnings excluding acquisition-related interest costs, 2
Slide 40: Guidance | Economic Earnings Bridge - 2019 to 2020 Midpoints
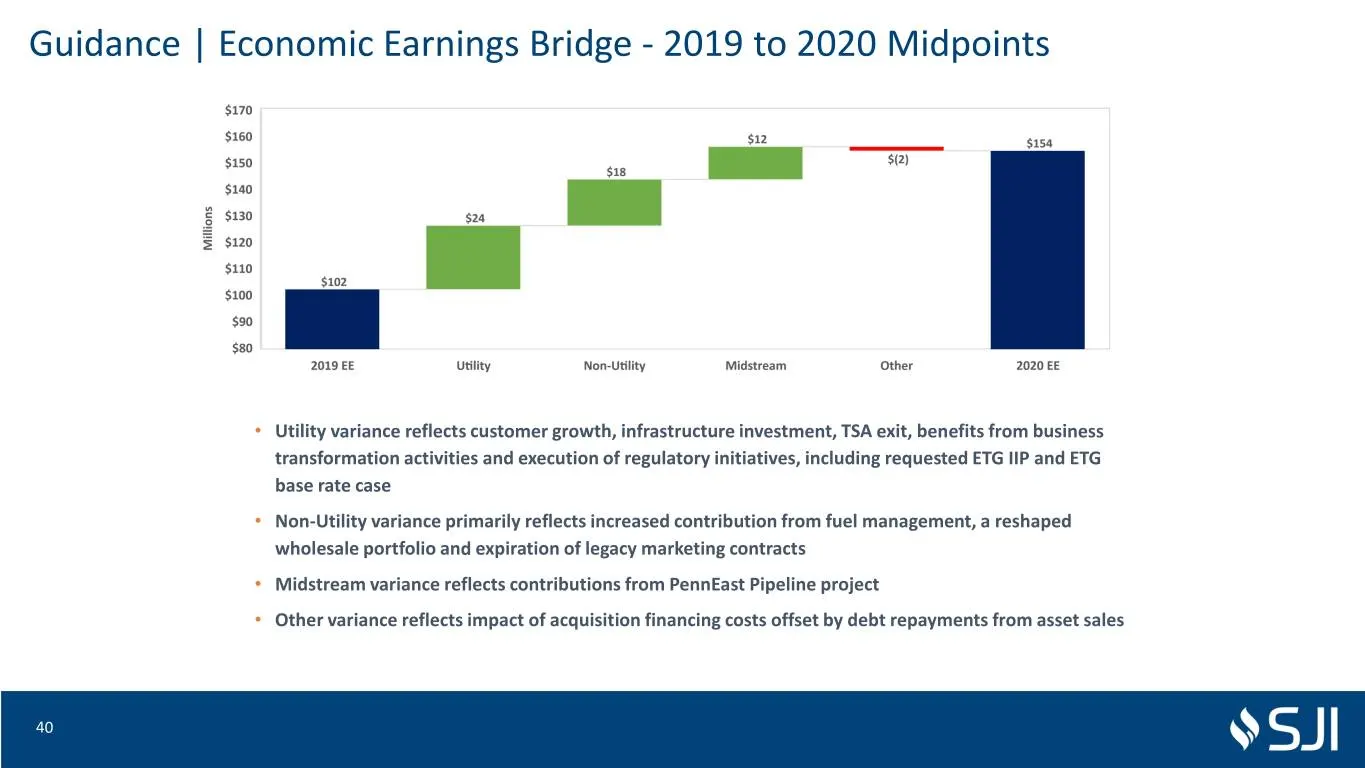
Guidance | Economic Earnings Bridge - 2019 to 2020 Midpoints • Utility variance reflects customer growth, infrastructure investment, TSA exit, benefits from business transformation activities and execution of regulatory initiatives, including requested ETG IIP and ETG base rate case • Non-Utility va
Slide 41: Guidance | Capital Expenditures
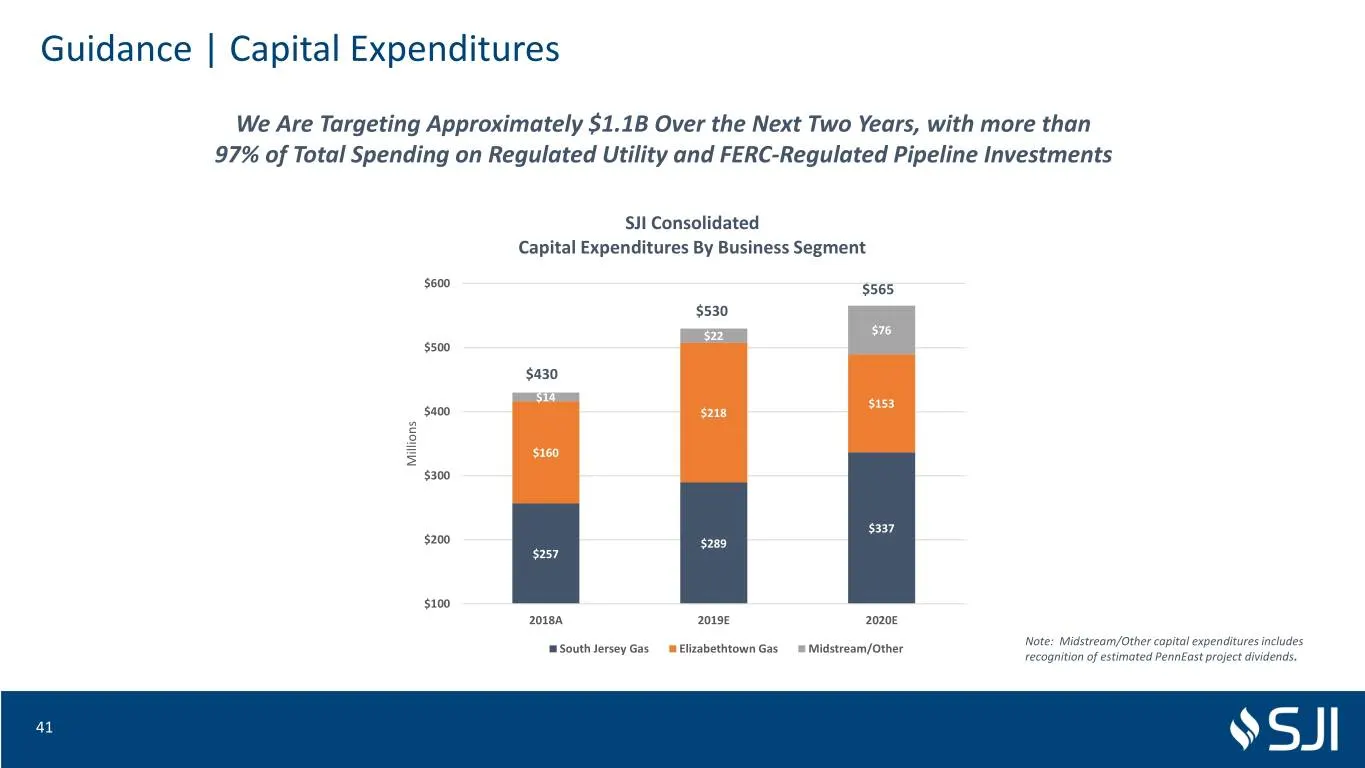
Guidance | Capital Expenditures We Are Targeting Approximately $1.1B Over the Next Two Years, with more than 97% of Total Spending on Regulated Utility and FERC-Regulated Pipeline Investments SJI Consolidated Capital Expenditures By Business Segment $600 $565 $530 $22 $76 $500 $430 $14 $153 $400 $21
Slide 42: Guidance | Long-Term Growth
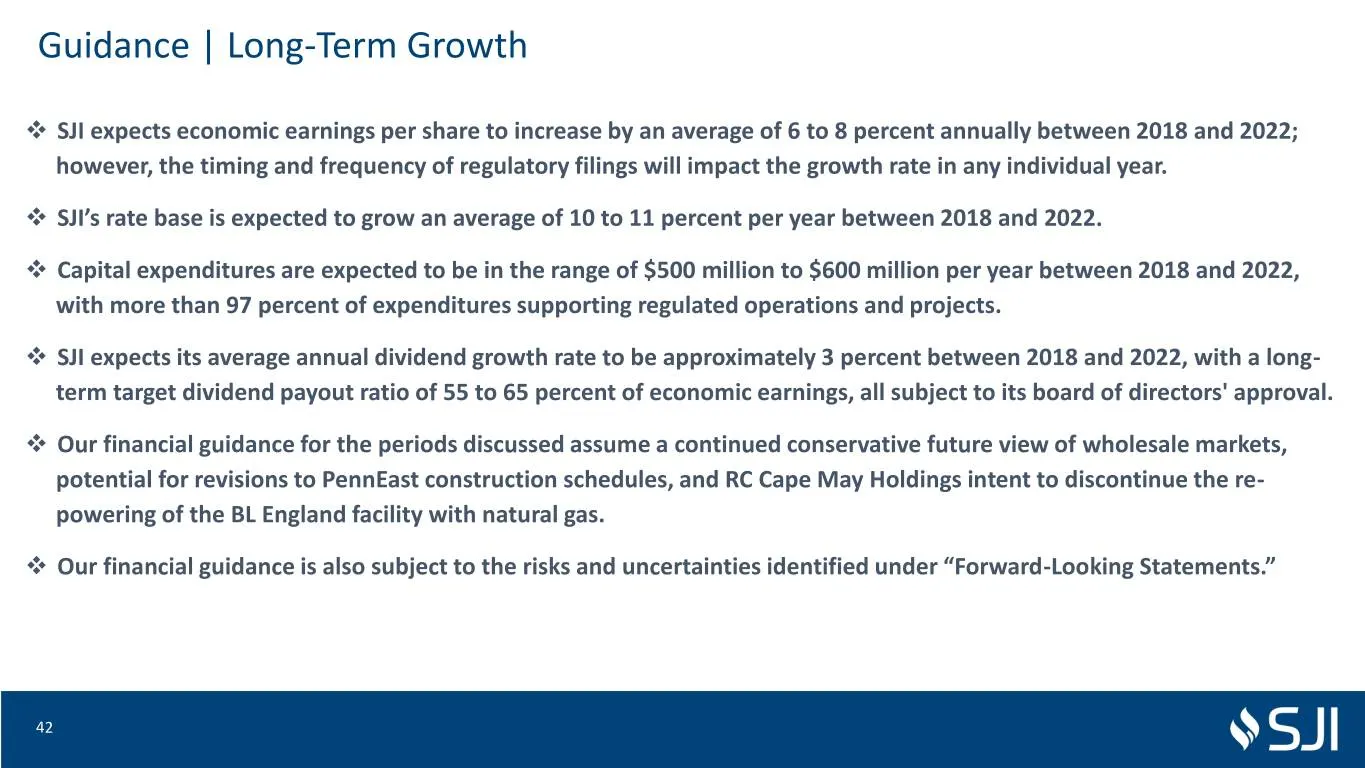
Guidance | Long-Term Growth ❖ SJI expects economic earnings per share to increase by an average of 6 to 8 percent annually between 2018 and 2022; however, the timing and frequency of regulatory filings will impact the growth rate in any individual year. ❖ SJI’s rate base is expected to grow an avera
Slide 43: SJI Investment Rationale
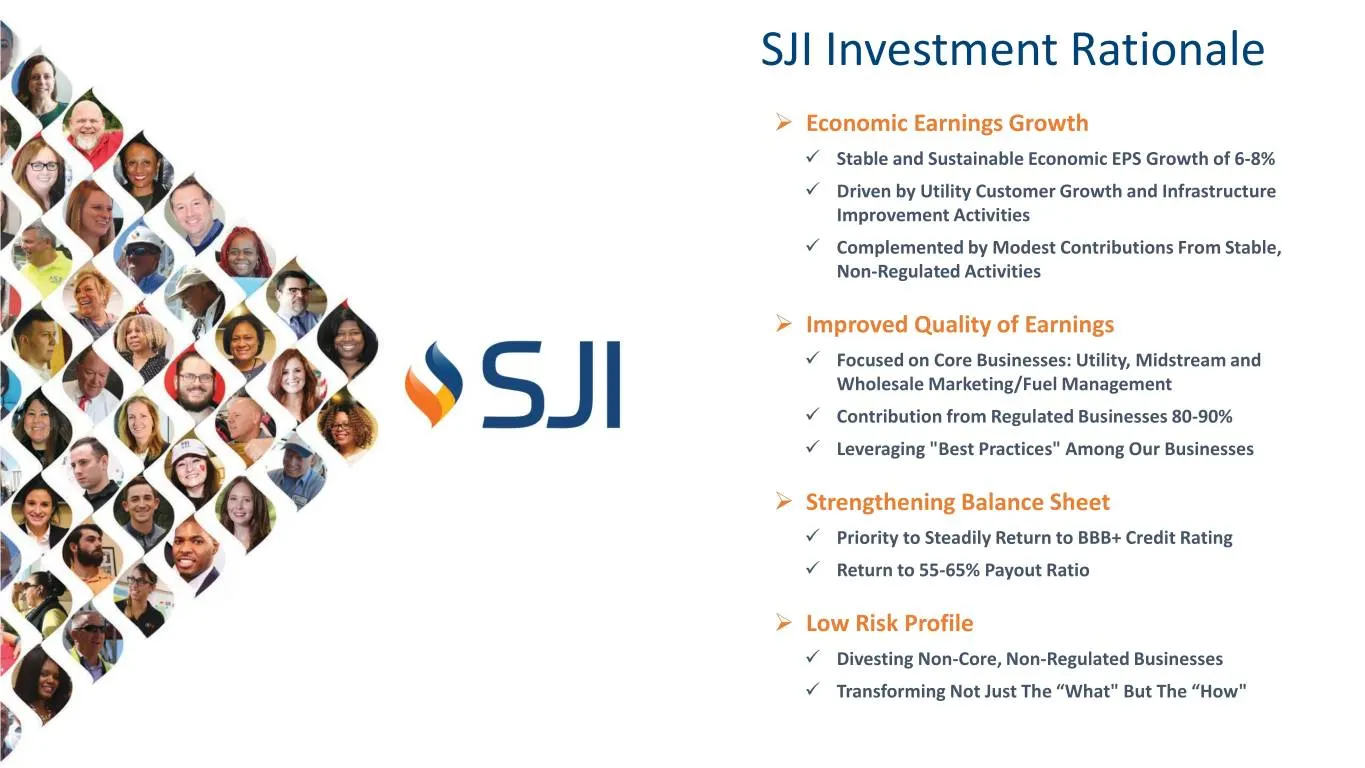
SJI Investment Rationale ➢ Economic Earnings Growth ✓ Stable and Sustainable Economic EPS Growth of 6-8% ✓ Driven by Utility Customer Growth and Infrastructure Improvement Activities ✓ Complemented by Modest Contributions From Stable, Non-Regulated Activities ➢ Improved Quality of Earnings ✓ Focused
Slide 44: Non-GAAP Financial Measures
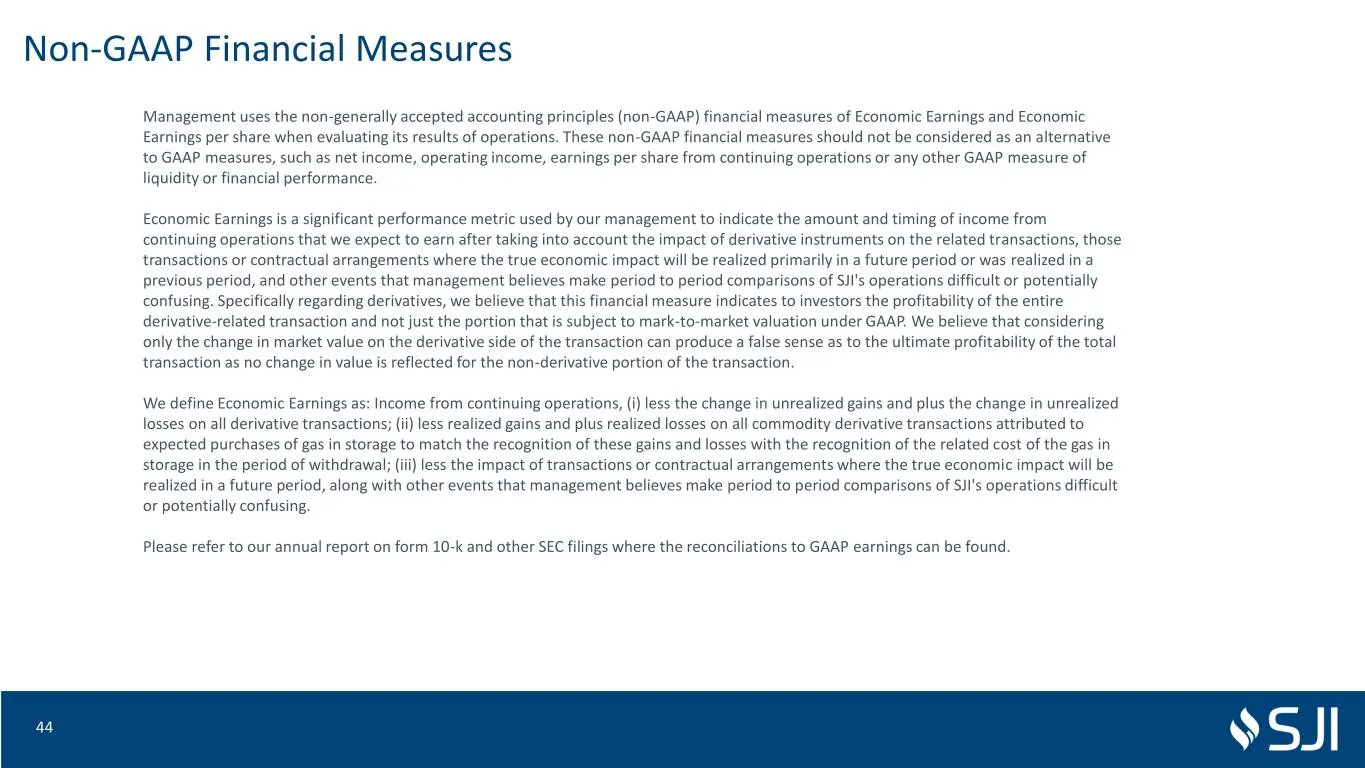
Non-GAAP Financial Measures Management uses the non-generally accepted accounting principles (non-GAAP) financial measures of Economic Earnings and Economic Earnings per share when evaluating its results of operations. These non-GAAP financial measures should not be considered as an alternative to G
Source: SEC EDGAR · 8-K filed Jun 18, 2019
More decks from South Jersey Industries Inc
 FY2021 Earnings Presentation29 slides · Feb 24, 2022
 Q3 2021 Earnings Presentation31 slides · Nov 3, 2021
 Q2 2021 Earnings Presentation31 slides · Aug 4, 2021
 Investor Day (May 2021)88 slides · May 6, 2021
 FY2020 Earnings Presentation31 slides · Feb 24, 2021
 Q3 2020 Earnings Presentation37 slides · Nov 4, 2020