Magnetite Mines Ltd. · ASX:MGT
Magnetite Mines — Royal Resources — Shareholder Meeting (November 2014)
31 slides from Magnetite Mines's shareholder meeting presentation, Nov 28, 2014
Slide 1: 2014 AGM Review of Activities
2014 AGM Review of Activities Dr Gavin England Chief Geologist 28 Nov 2014
Slide 2: Disclaimer and Competent Person's Statement
Disclaimer and Competent Person’s Statement This presentation has been prepared by Royal Resources Limited (ABN 34 108 102 432) (“Royal”) based on information available to it. No representation or warranty, express or implied, is made as to the fairness, accuracy, completeness or correctness of the
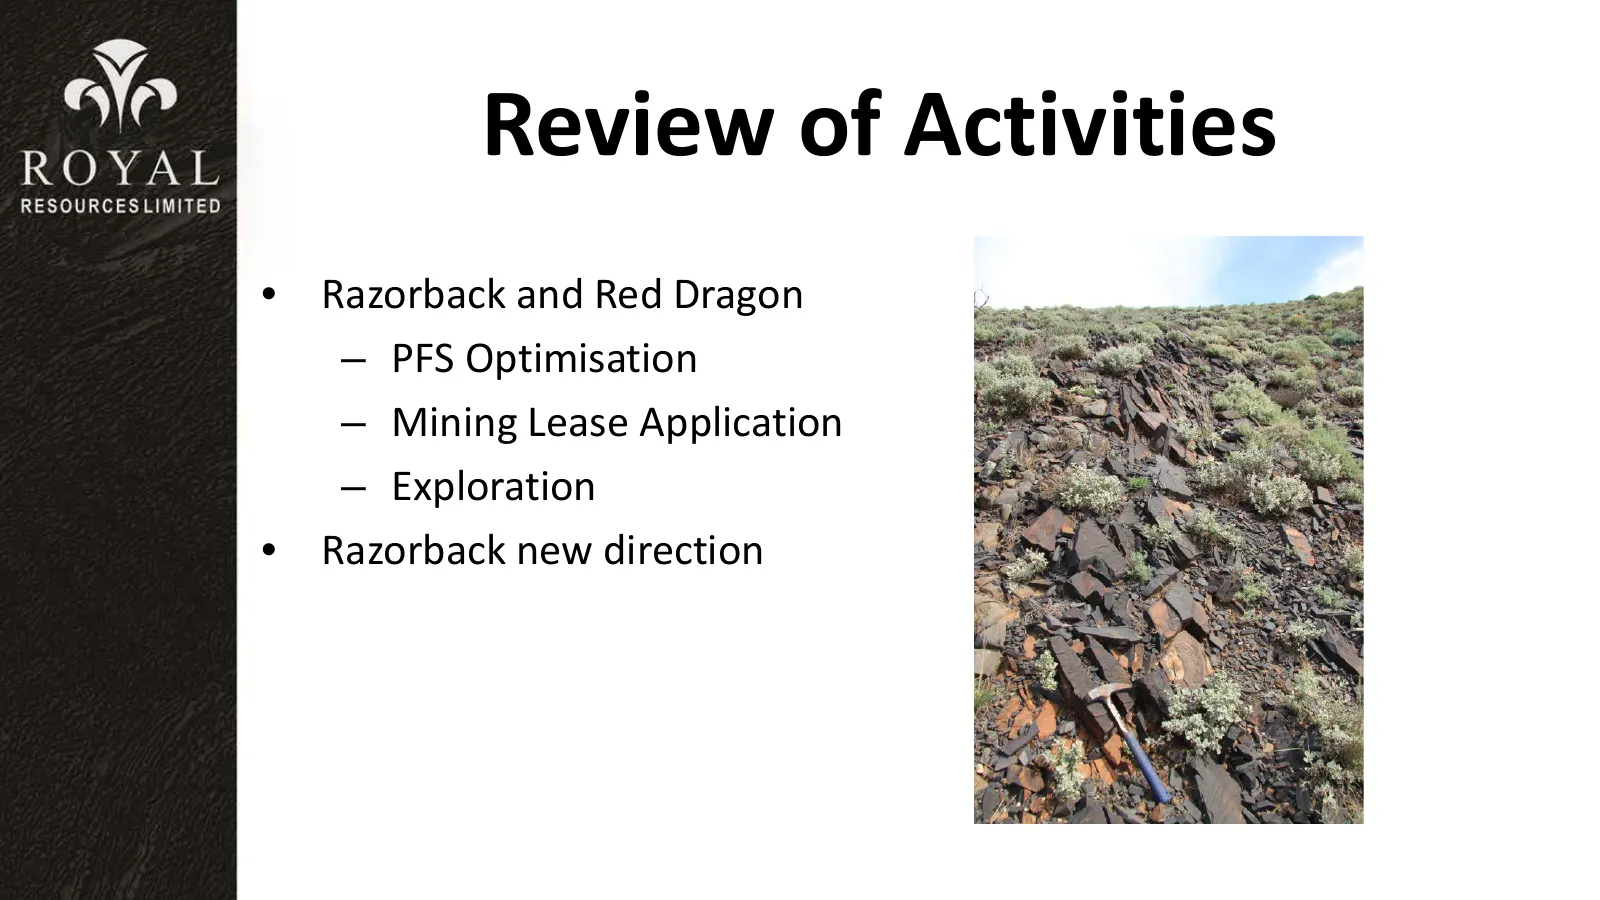
Slide 3: Review of Activities
Review of Activities • Razorback and Red Dragon – PFS Optimisation – Mining Lease Application – Exploration • Razorback new direction
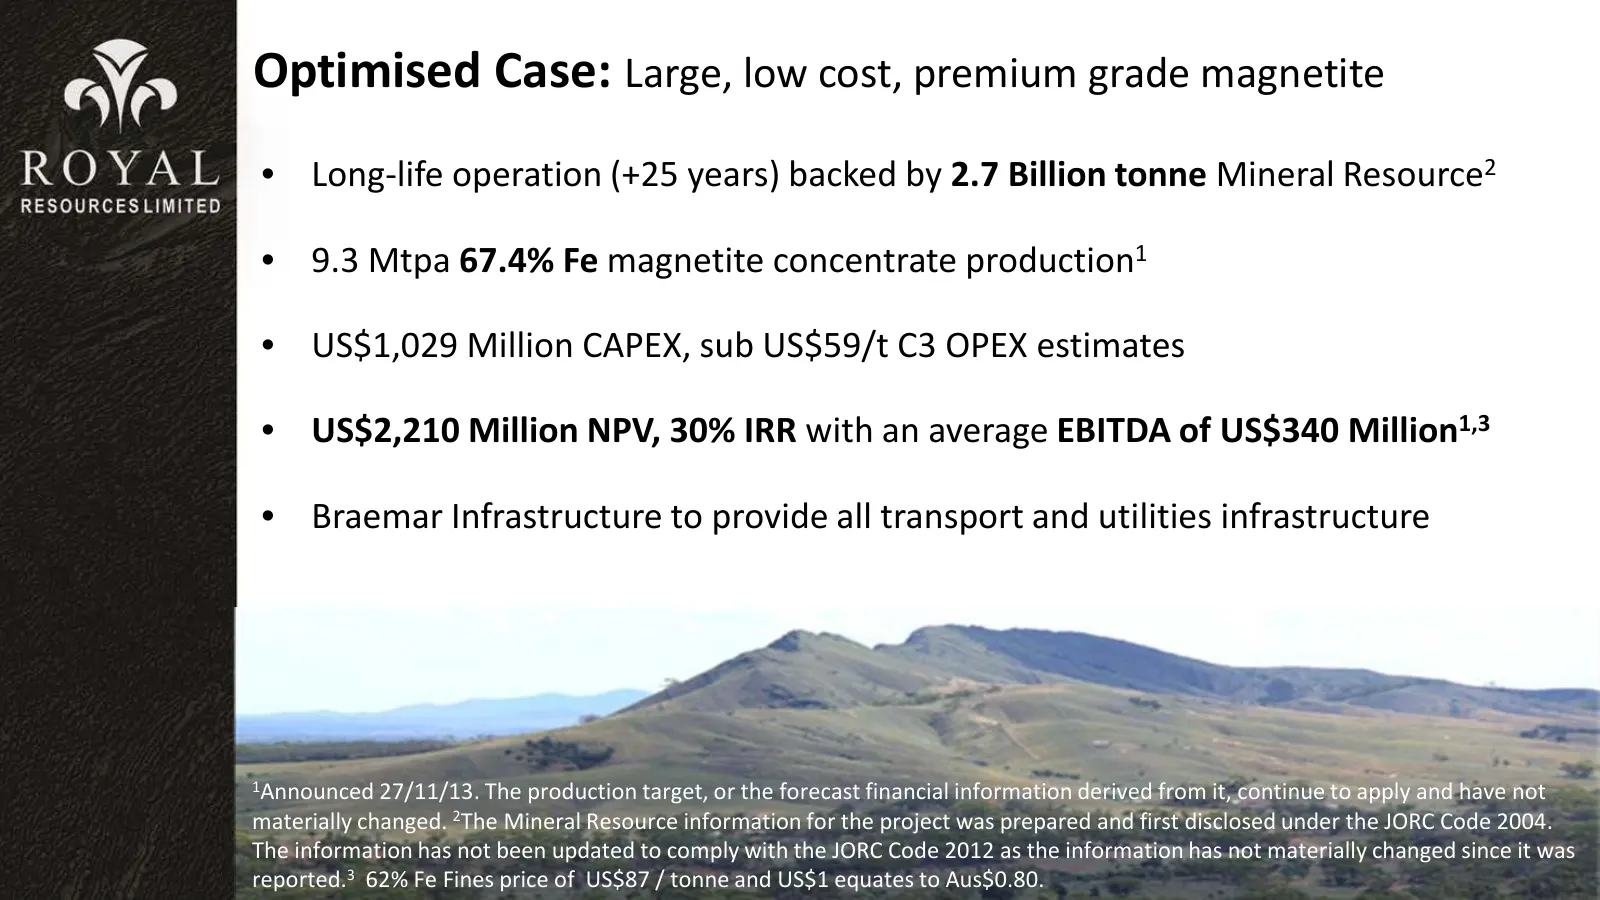
Slide 4: Optimised Case: Large, low cost, premium grade magnetite
Optimised Case: Large, low cost, premium grade magnetite • Long-life operation (+25 years) backed by 2.7 Billion tonne Mineral Resource2 • 9.3 Mtpa 67.4% Fe magnetite concentrate production1 • US$1,029 Million CAPEX, sub US$59/t C3 OPEX estimates • US$2,210 Million NPV, 30% IRR with an average EBITD
Slide 5: Razorback Premium Iron Project
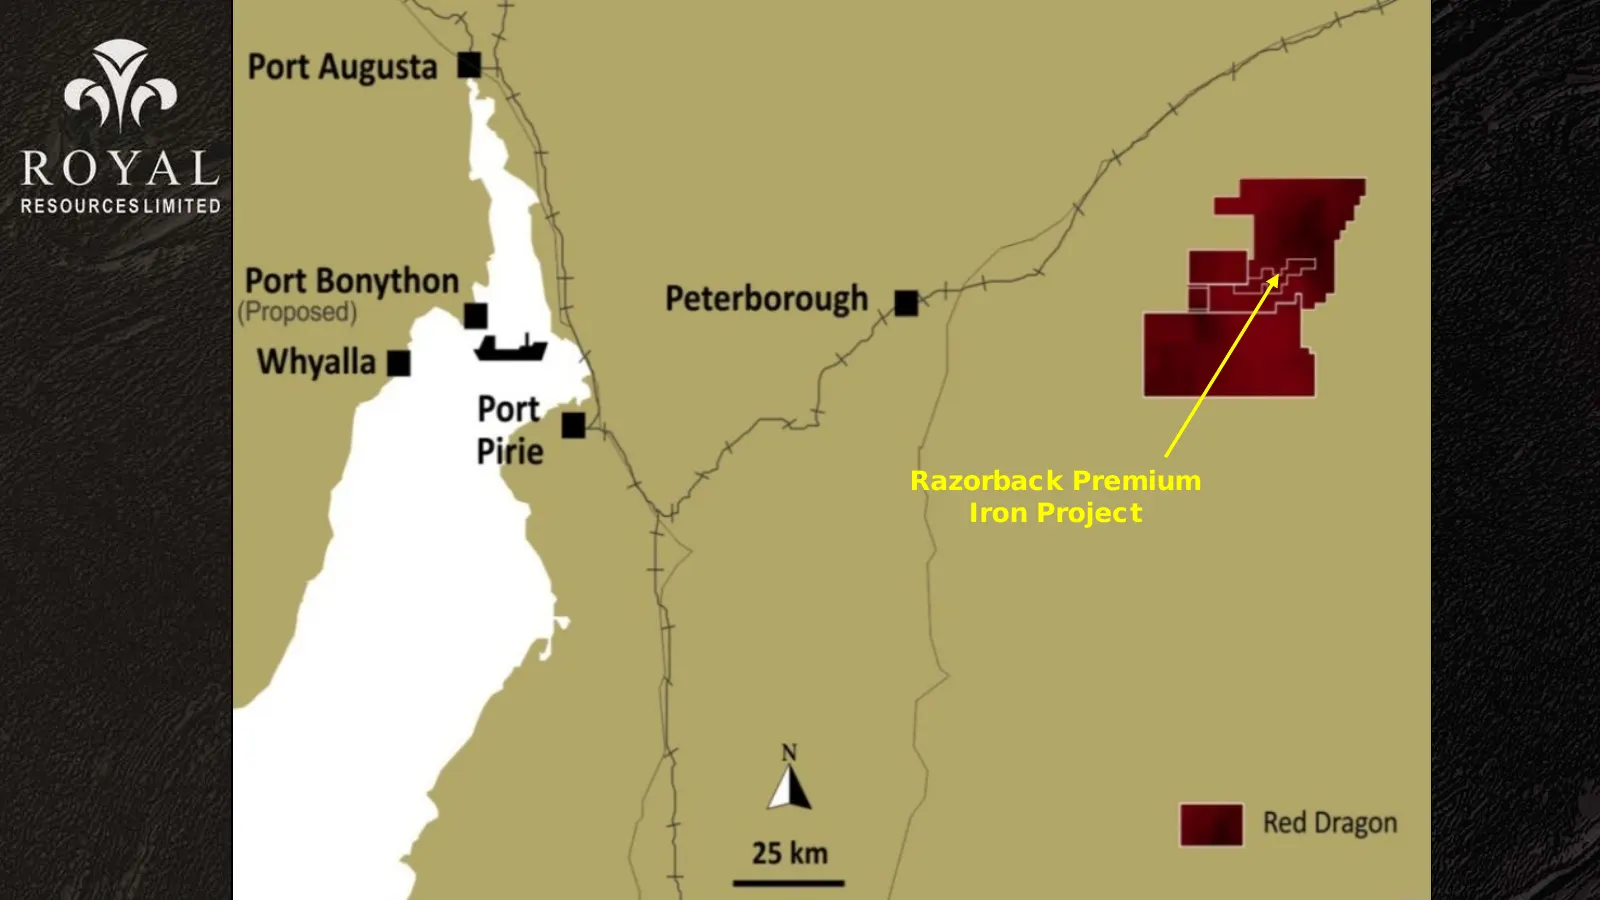
Razorback Premium Iron Project
Slide 6: Red Dragon Venture
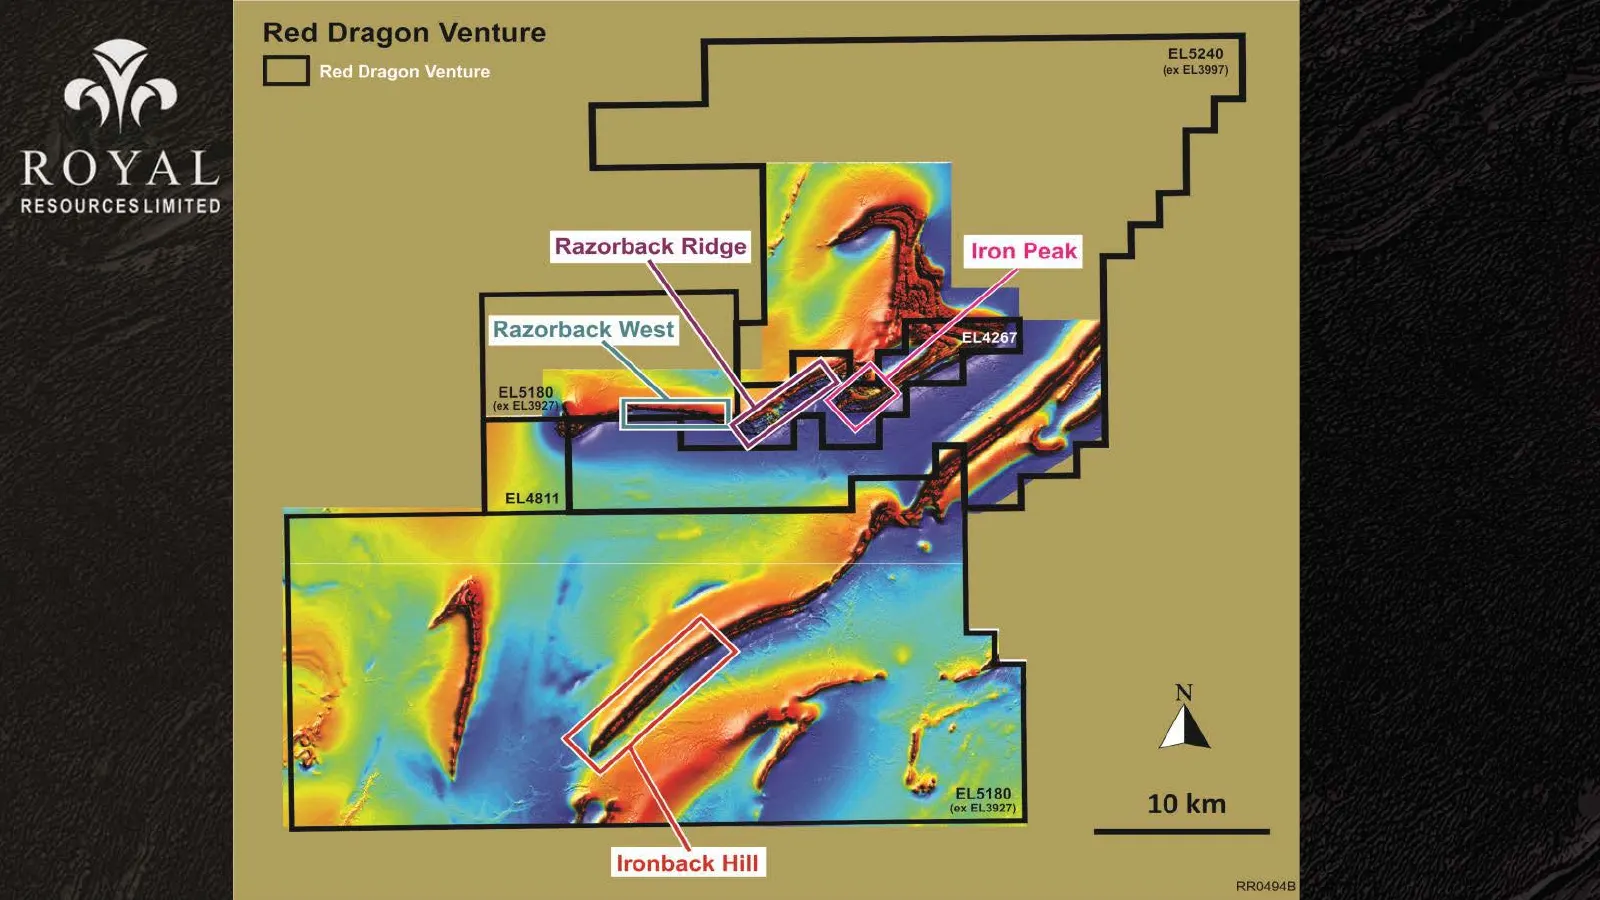
Red Dragon Venture S 7 EL5240 CI (ex £13997) (a ROYAL RESOURCES LIMITED Razorback Ridge Iron Peak . Ke aN A “ “ot evsia0 10 km lronback Hill RRO4048
Slide 7: Razorback History: Progress achieved to date
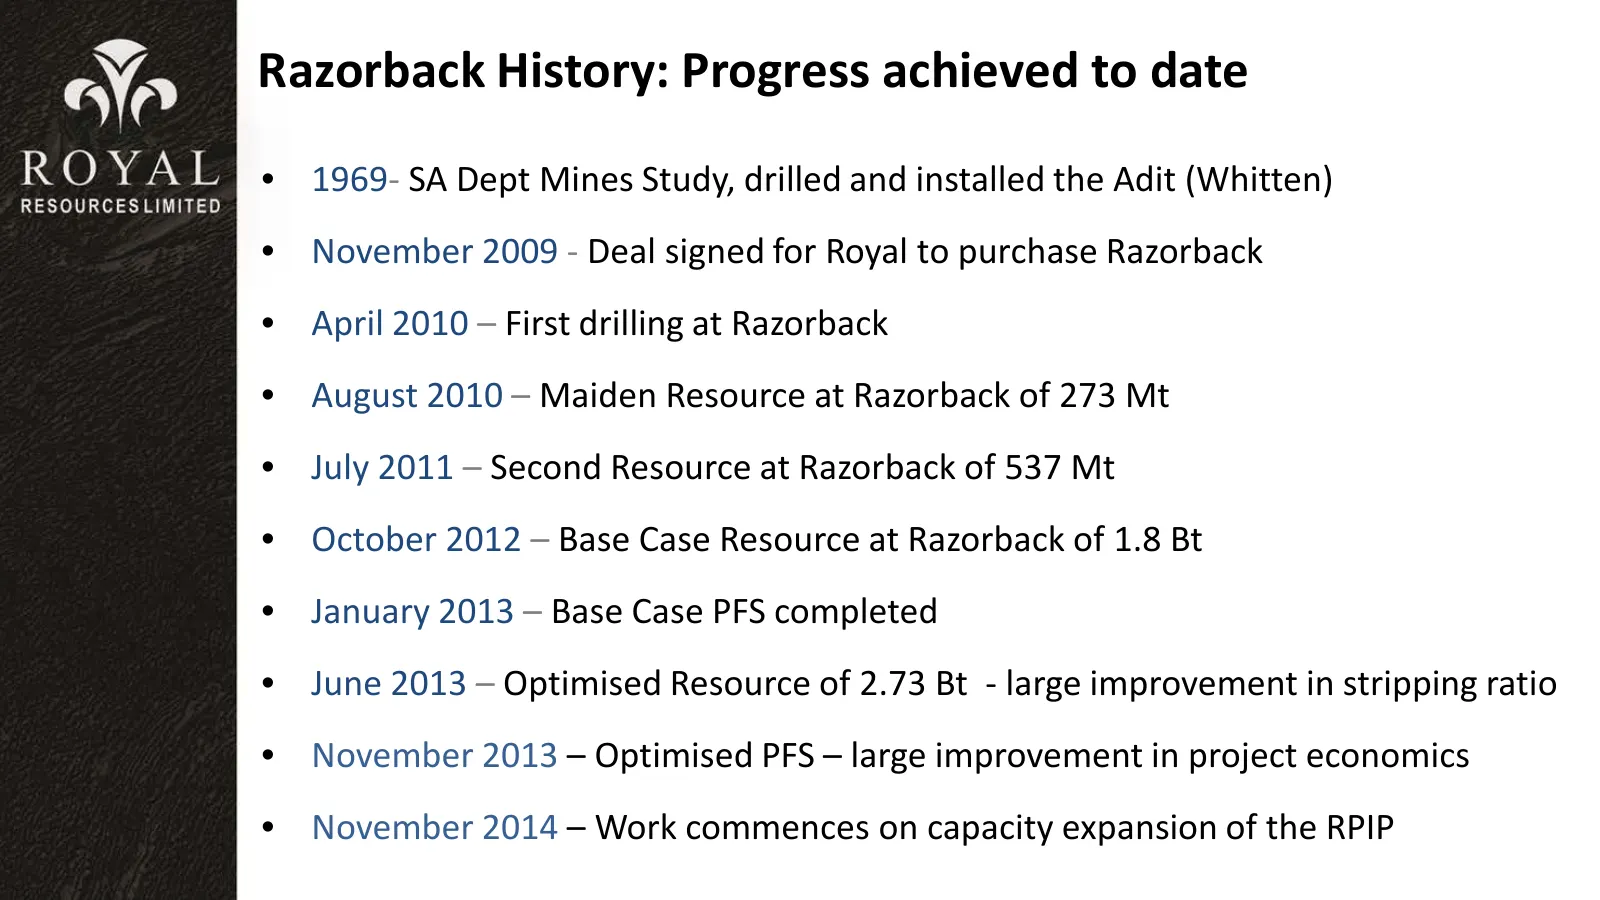
Razorback History: Progress achieved to date • 1969- SA Dept Mines Study, drilled and installed the Adit (Whitten) • November 2009 - Deal signed for Royal to purchase Razorback • April 2010 – First drilling at Razorback • August 2010 – Maiden Resource at Razorback of 273 Mt • July 2011 – Second Reso
Slide 8: Razorback Project: Resource profile 2014
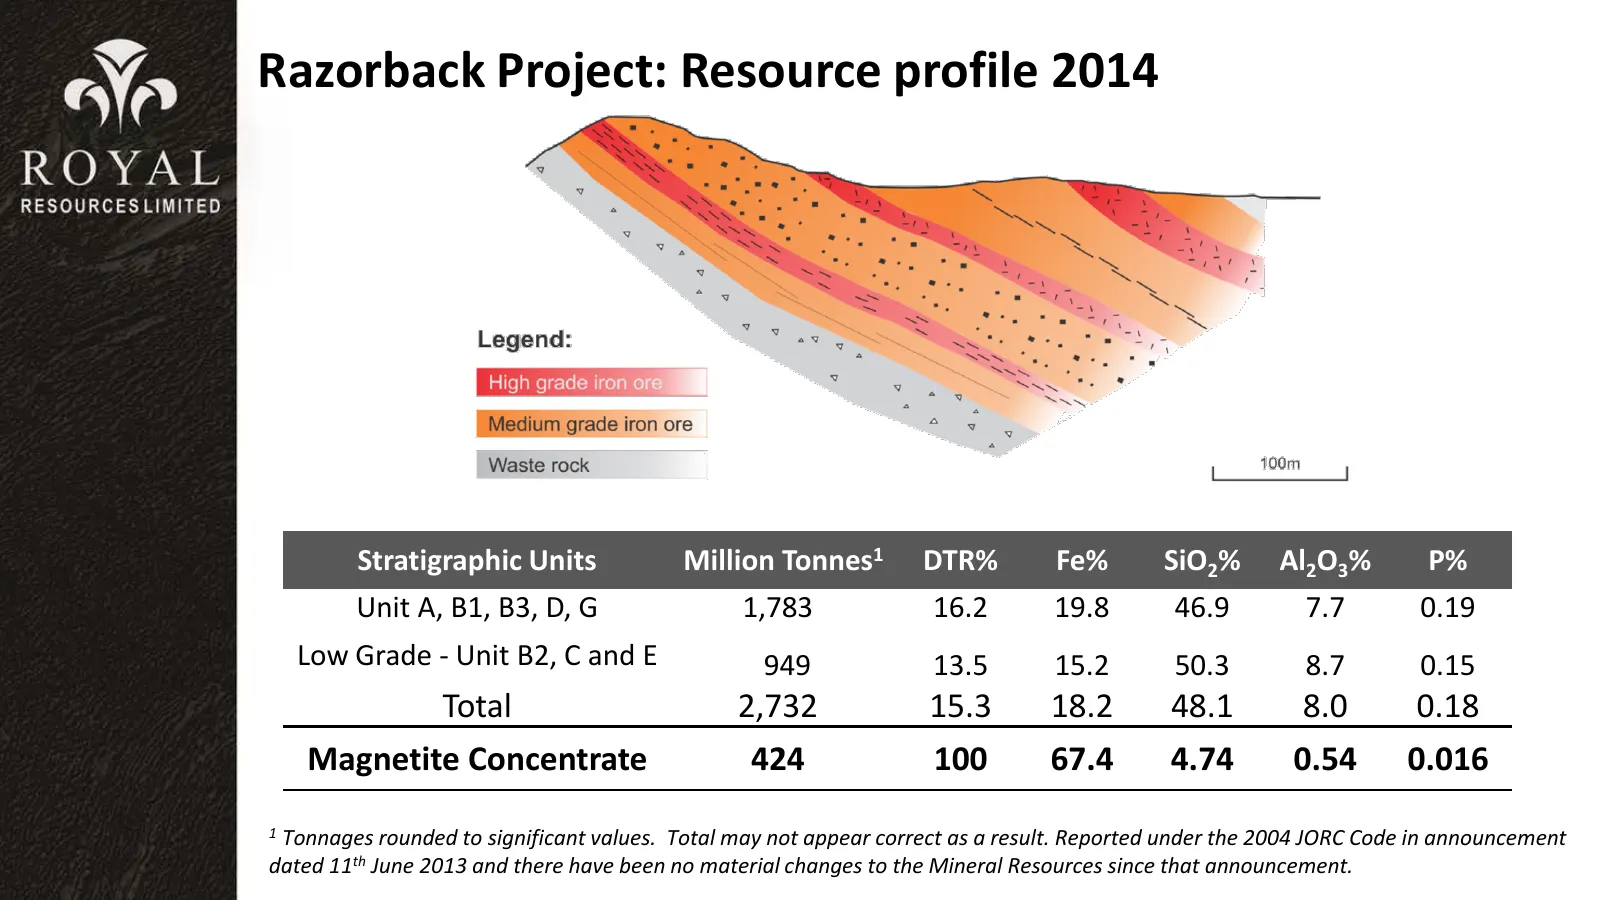
Razorback Project: Resource profile 2014 Stratigraphic Units Million Tonnes1 DTR% Fe% SiO2% Al2O3% P% Unit A, B1, B3, D, G 1,783 16.2 19.8 46.9 7.7 0.19 Low Grade - Unit B2, C and E 949 13.5 15.2 50.3 8.7 0.15 Total 2,732 15.3 18.2 48.1 8.0 0.18 Magnetite Concentrate 424 100 67.4 4.74 0.54 0.016 1 T
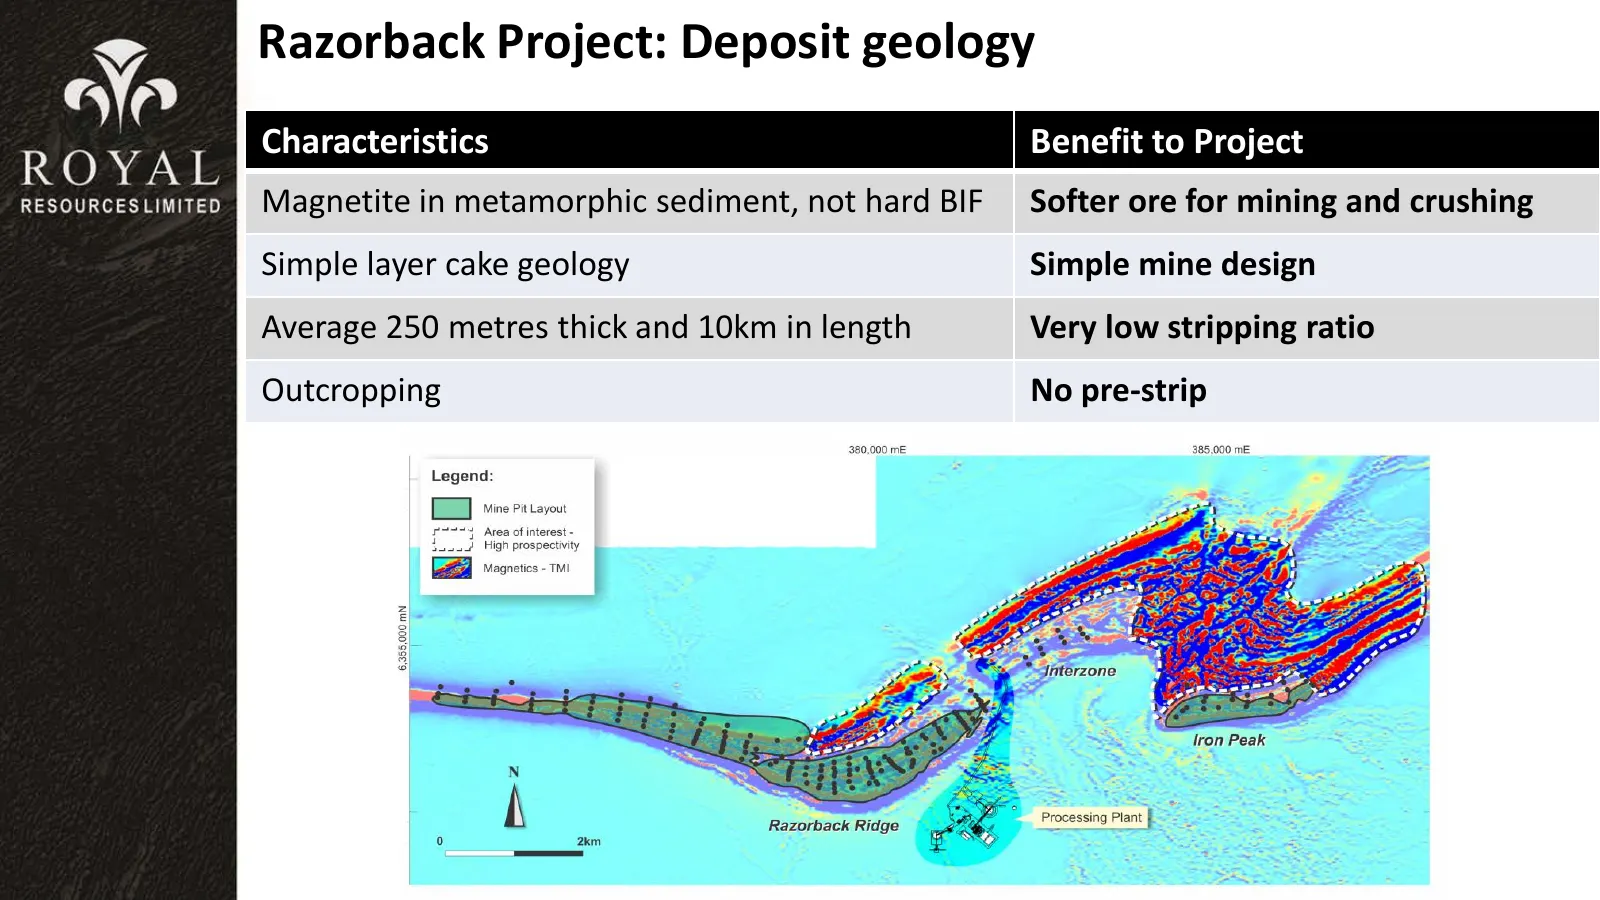
Slide 9: Razorback Project: Deposit geology
Razorback Project: Deposit geology Characteristics Benefit to Project Magnetite in metamorphic sediment, not hard BIF Softer ore for mining and crushing Simple layer cake geology Simple mine design Average 250 metres thick and 10km in length Very low stripping ratio Outcropping No pre-strip
Slide 10: 2014 PFS Optimisation Outcomes
2014 PFS Optimisation Outcomes • Reduction in product transport costs, outsourcing infrastructure to BIPL • Increased production rate to 9.3 Mtpa and improvement in recoveries1 • Reduction in mining costs through the significant reduction in the Strip Ratio and the use of In-Pit Crushers • Reduction
Slide 11: Razorback Project: Open pit design with conventional processing
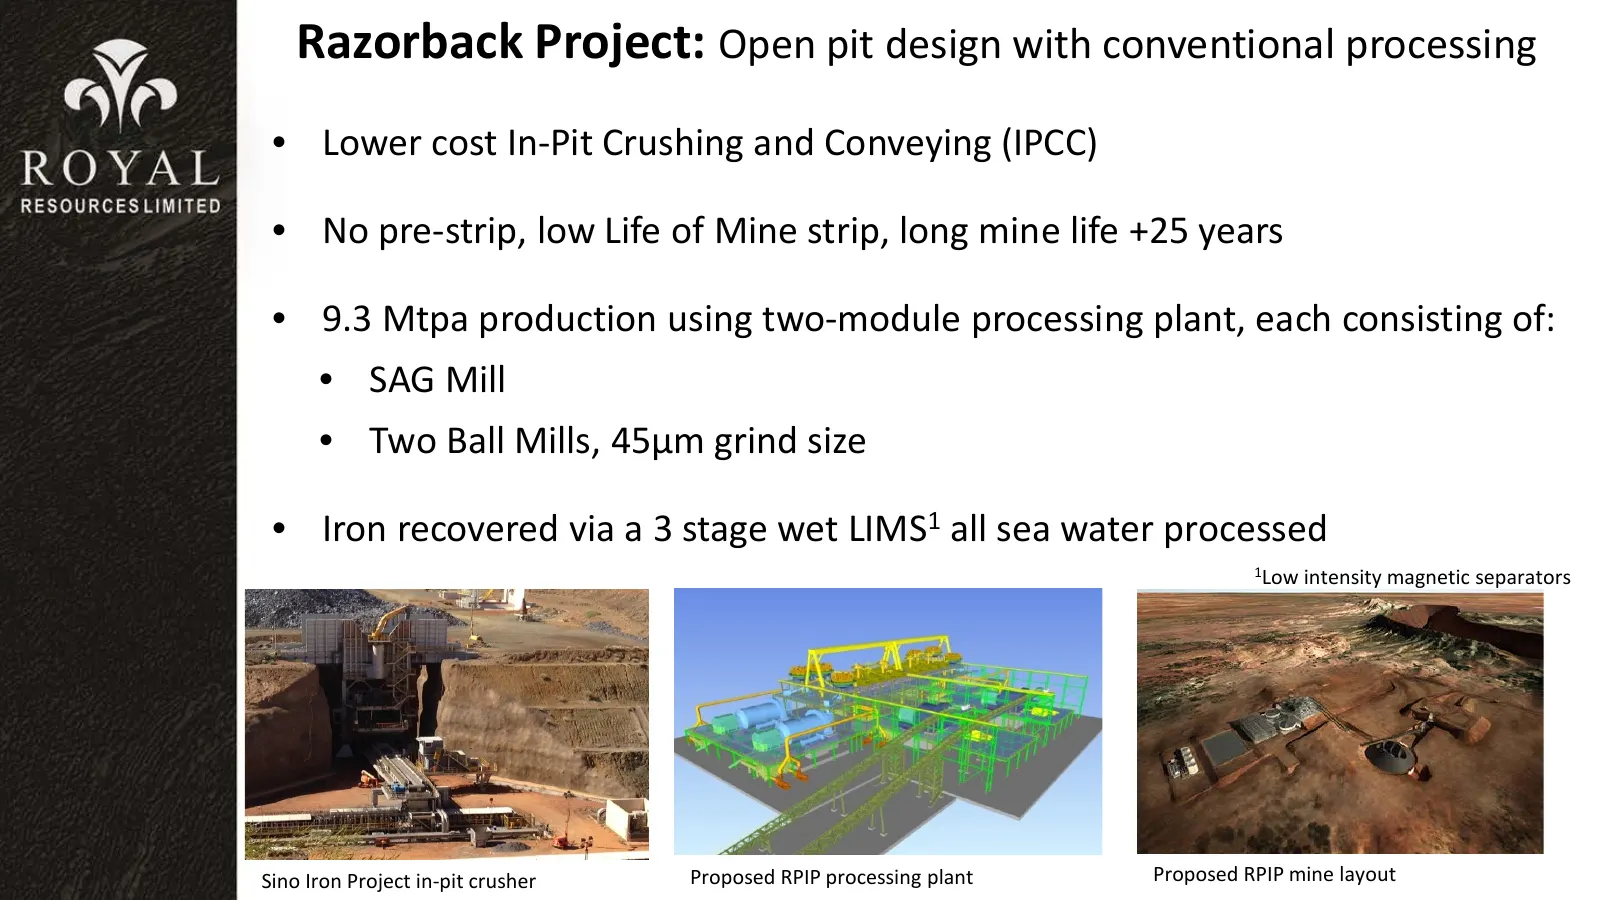
Razorback Project: Open pit design with conventional processing • Lower cost In-Pit Crushing and Conveying (IPCC) • No pre-strip, low Life of Mine strip, long mine life +25 years • 9.3 Mtpa production using two-module processing plant, each consisting of: • SAG Mill • Two Ball Mills, 45µm grind size
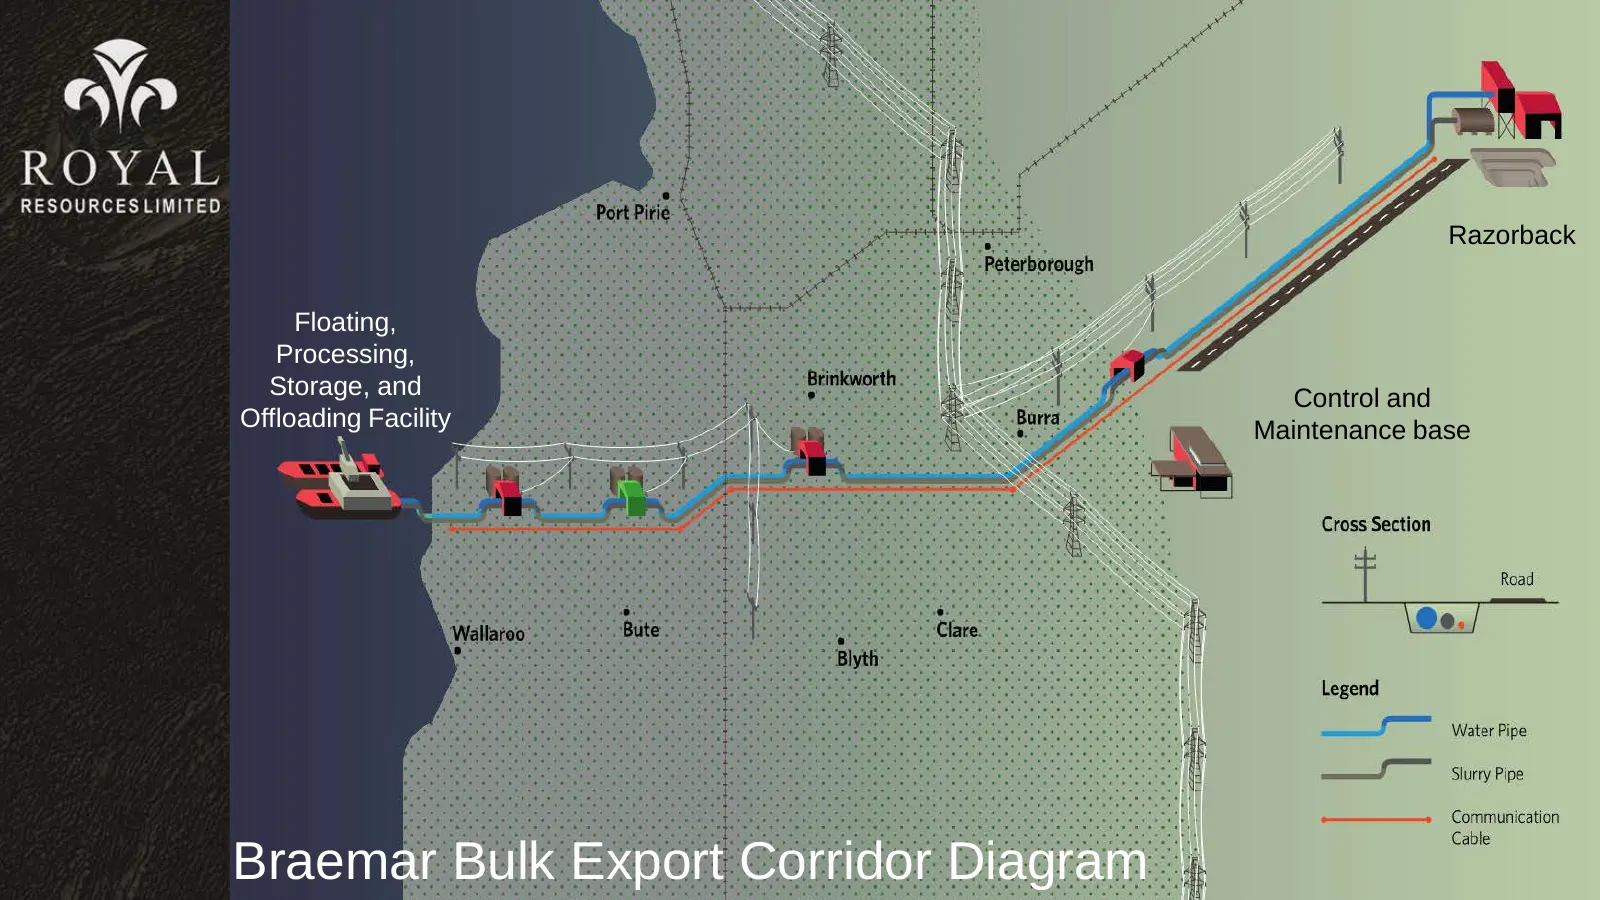
Slide 12: Braemar Bulk Export Corridor Diagram
Razorback Floating, Processing, Storage, and Control and Offloading Facility Maintenance base Braemar Bulk Export Corridor Diagram
Slide 13: Razorback Premium Iron Project: A new generation mine
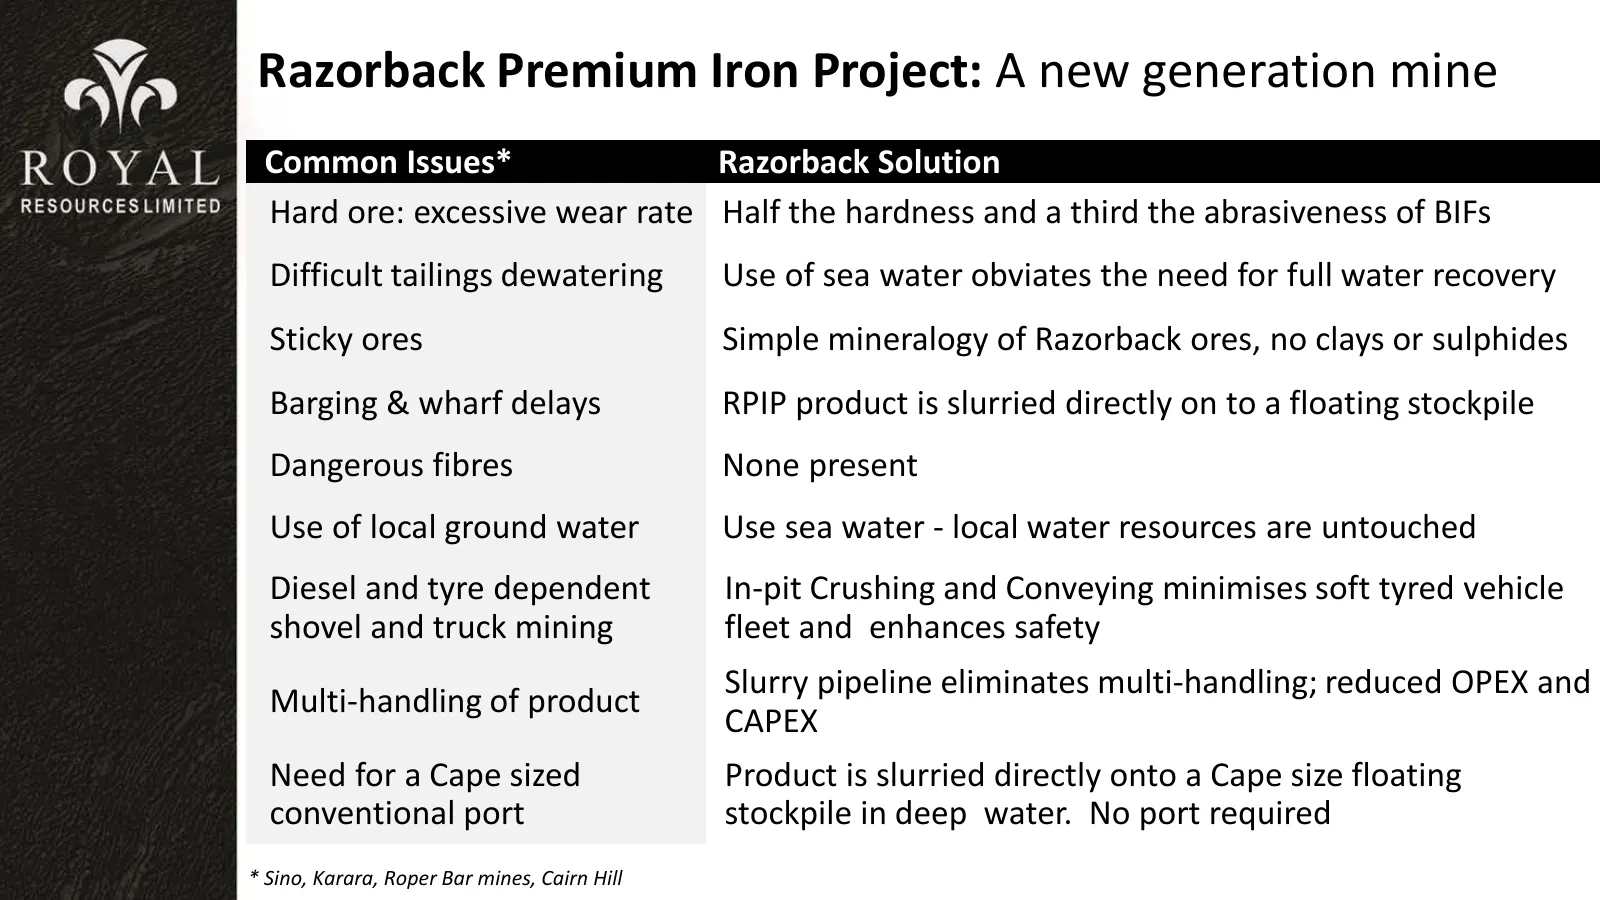
Razorback Premium Iron Project: A new generation mine Common Issues* Razorback Solution Hard ore: excessive wear rate Half the hardness and a third the abrasiveness of BIFs Difficult tailings dewatering Use of sea water obviates the need for full water recovery Sticky ores Simple mineralogy of Razor
Slide 14: Mining Lease Application in progress
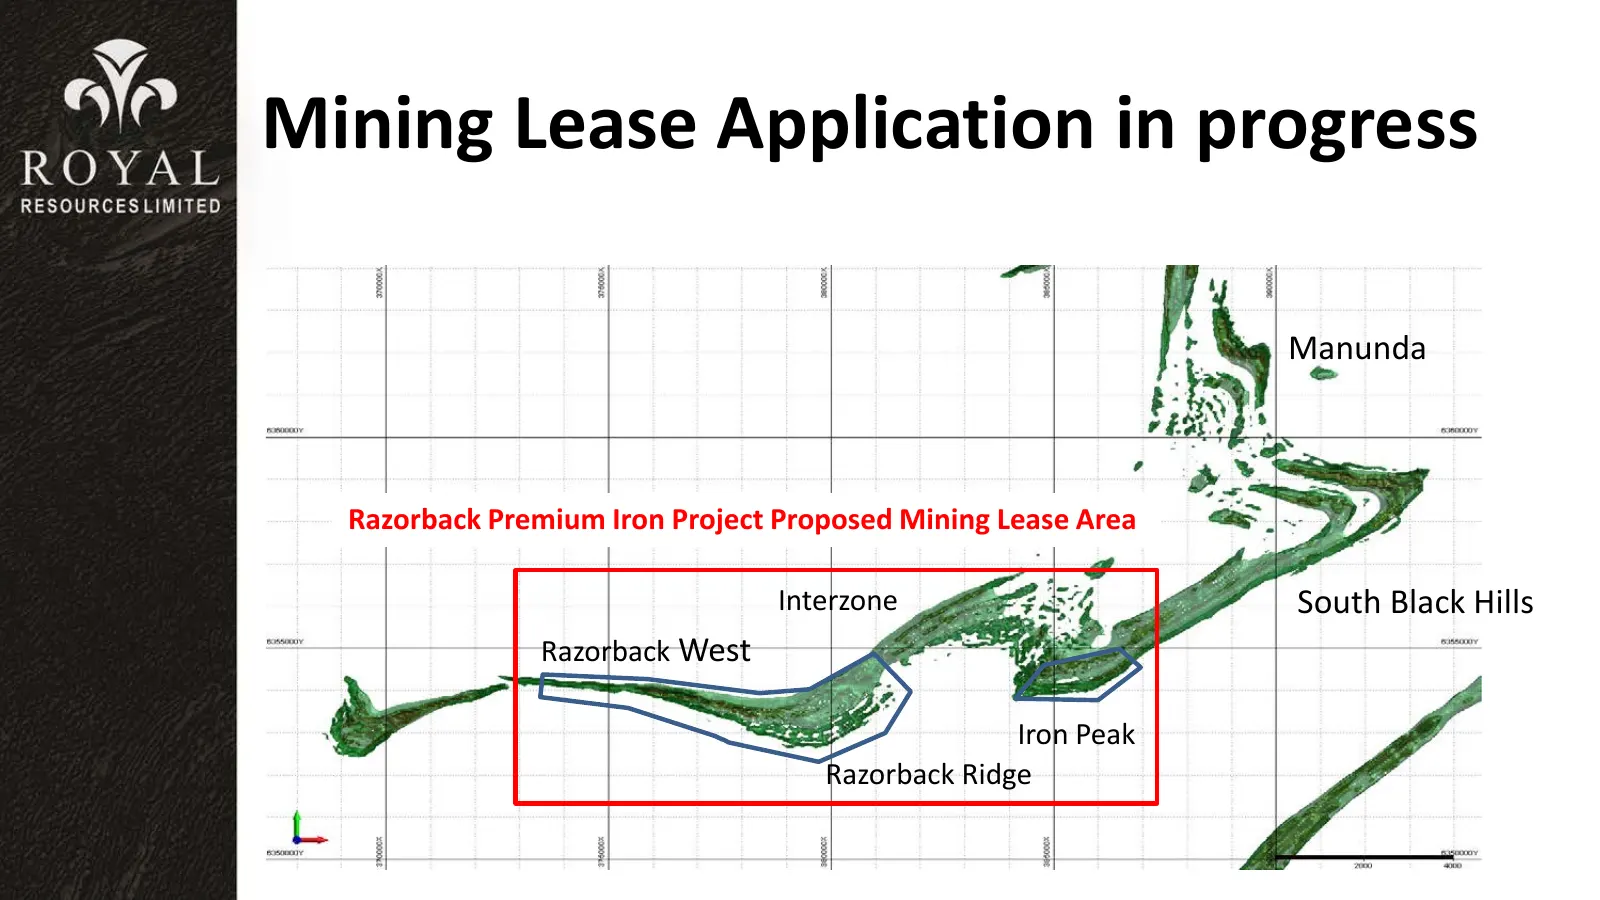
Mining Lease Application in progress Manunda Razorback Premium Iron Project Proposed Mining Lease Area Interzone South Black Hills Razorback West Iron Peak Razorback Ridge
Slide 15: Razorback Project Future Direction
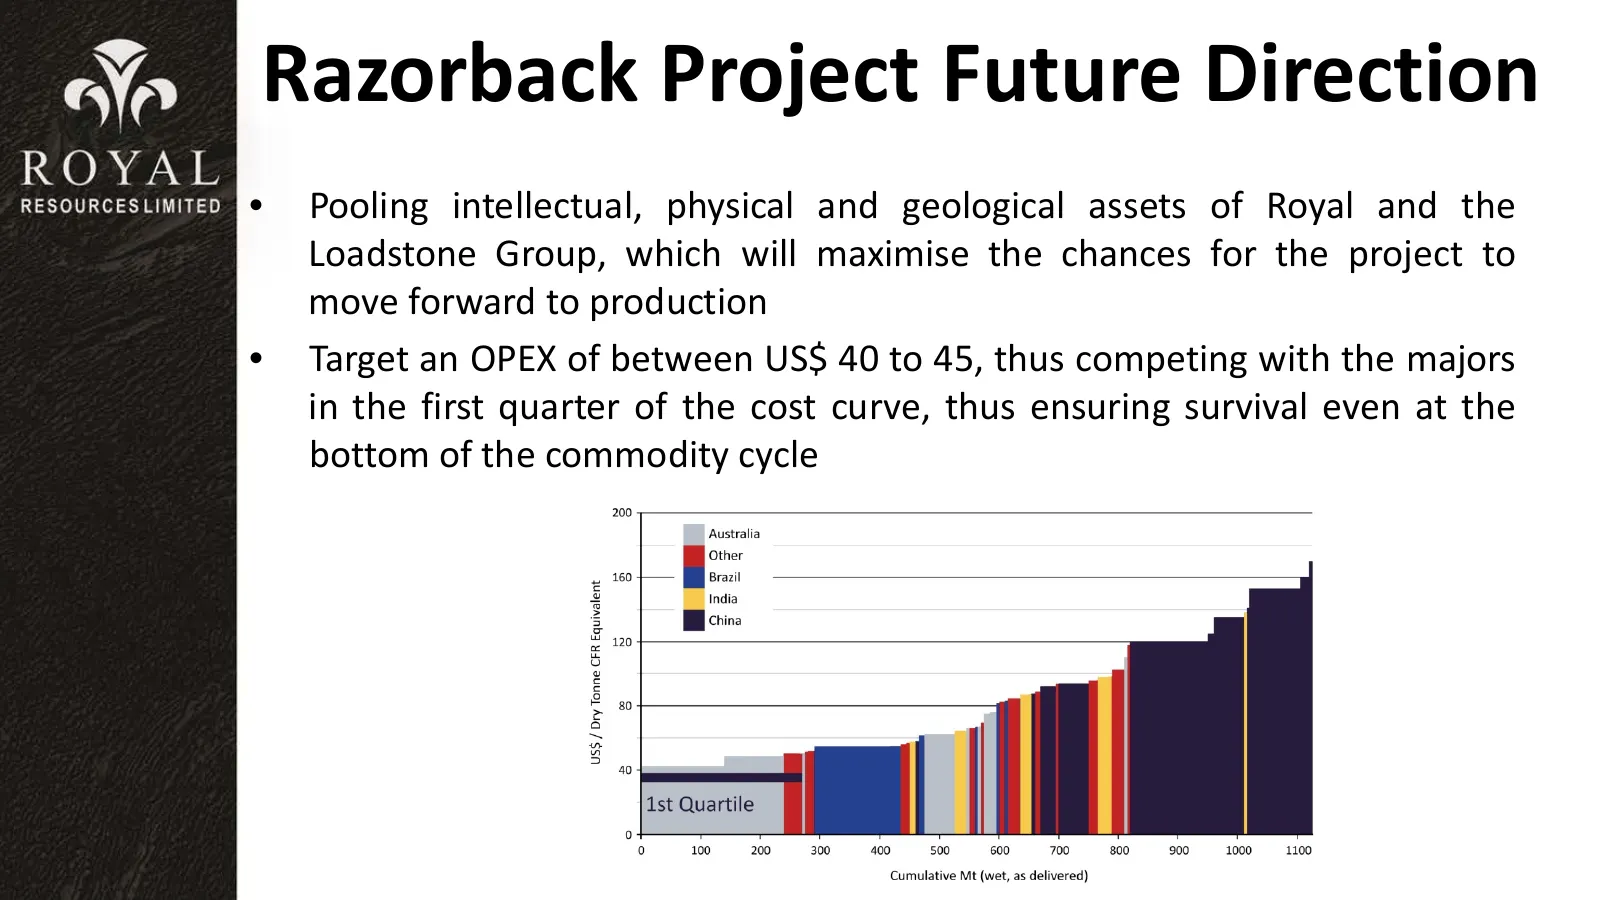
Razorback Project Future Direction • Pooling intellectual, physical and geological assets of Royal and the Loadstone Group, which will maximise the chances for the project to move forward to production • Target an OPEX of between US$ 40 to 45, thus competing with the majors in the first quarter of t
Slide 16: Razorback Project Future Direction
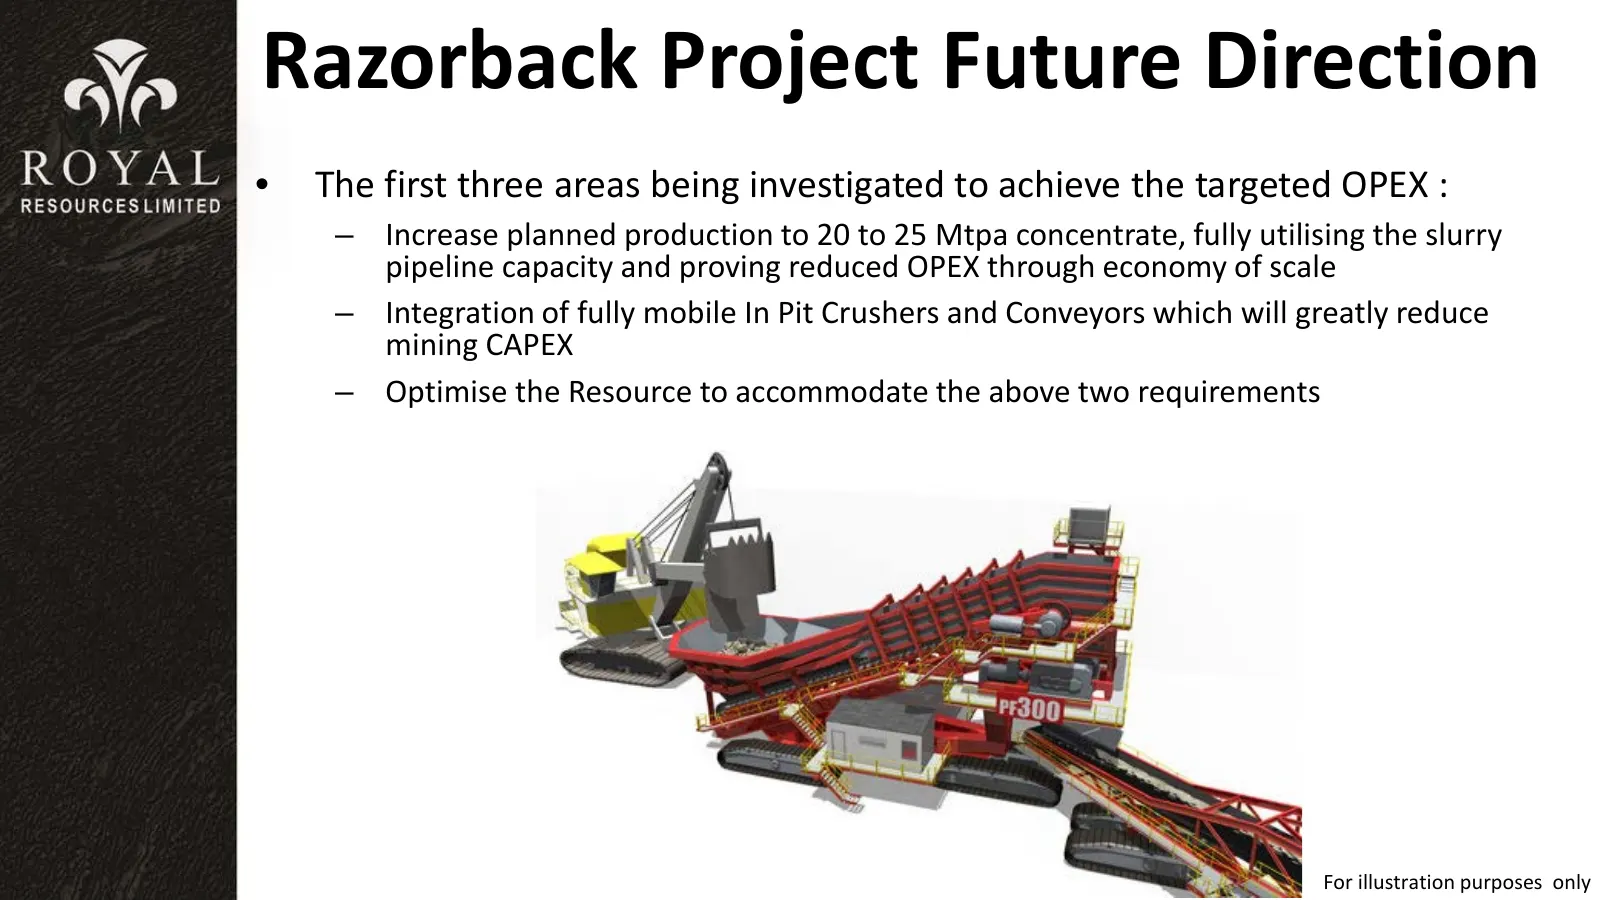
Razorback Project Future Direction • The first three areas being investigated to achieve the targeted OPEX : – Increase planned production to 20 to 25 Mtpa concentrate, fully utilising the slurry pipeline capacity and proving reduced OPEX through economy of scale – Integration of fully mobile In Pit
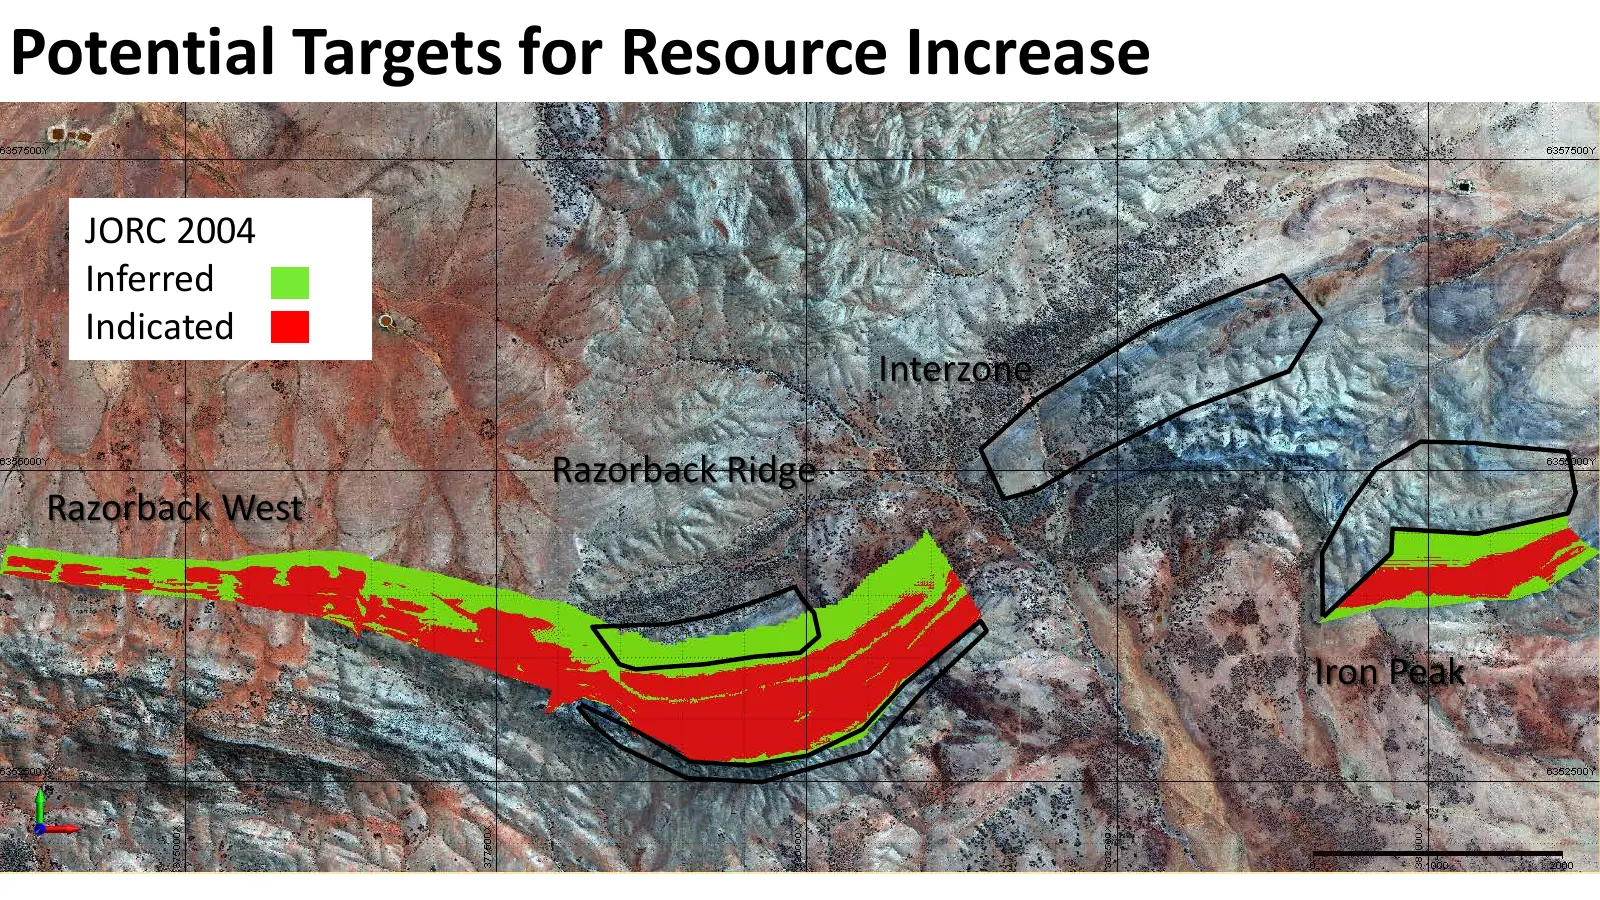
Slide 17: Potential Targets for Resource Increase
Potential Targets for Resource Increase JORC 2004 Inferred Indicated Interzone Razorback Ridge Razorback West Iron Peak
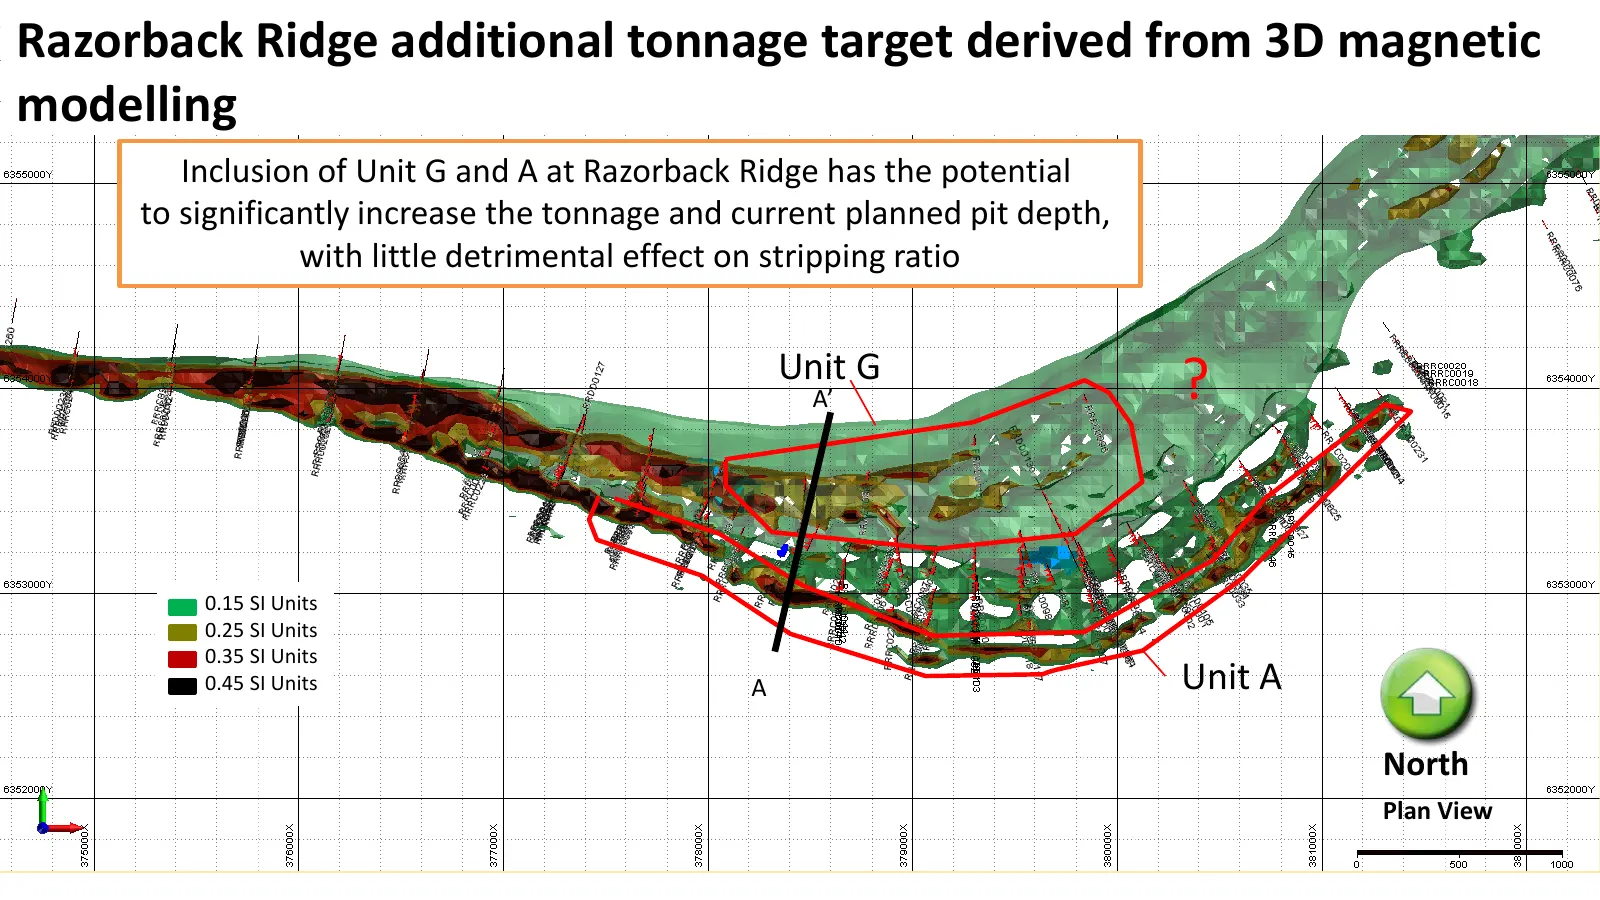
Slide 18: Razorback Ridge additional tonnage target from 3D magnetic modelling
Razorback Ridge additional tonnage target derived from 3D magnetic modelling Inclusion of Unit G and A at Razorback Ridge has the potential to significantly increase the tonnage and current planned pit depth, with little detrimental effect on stripping ratio Unit G A’ ? 0.15 SI Units 0.25 SI Units 0
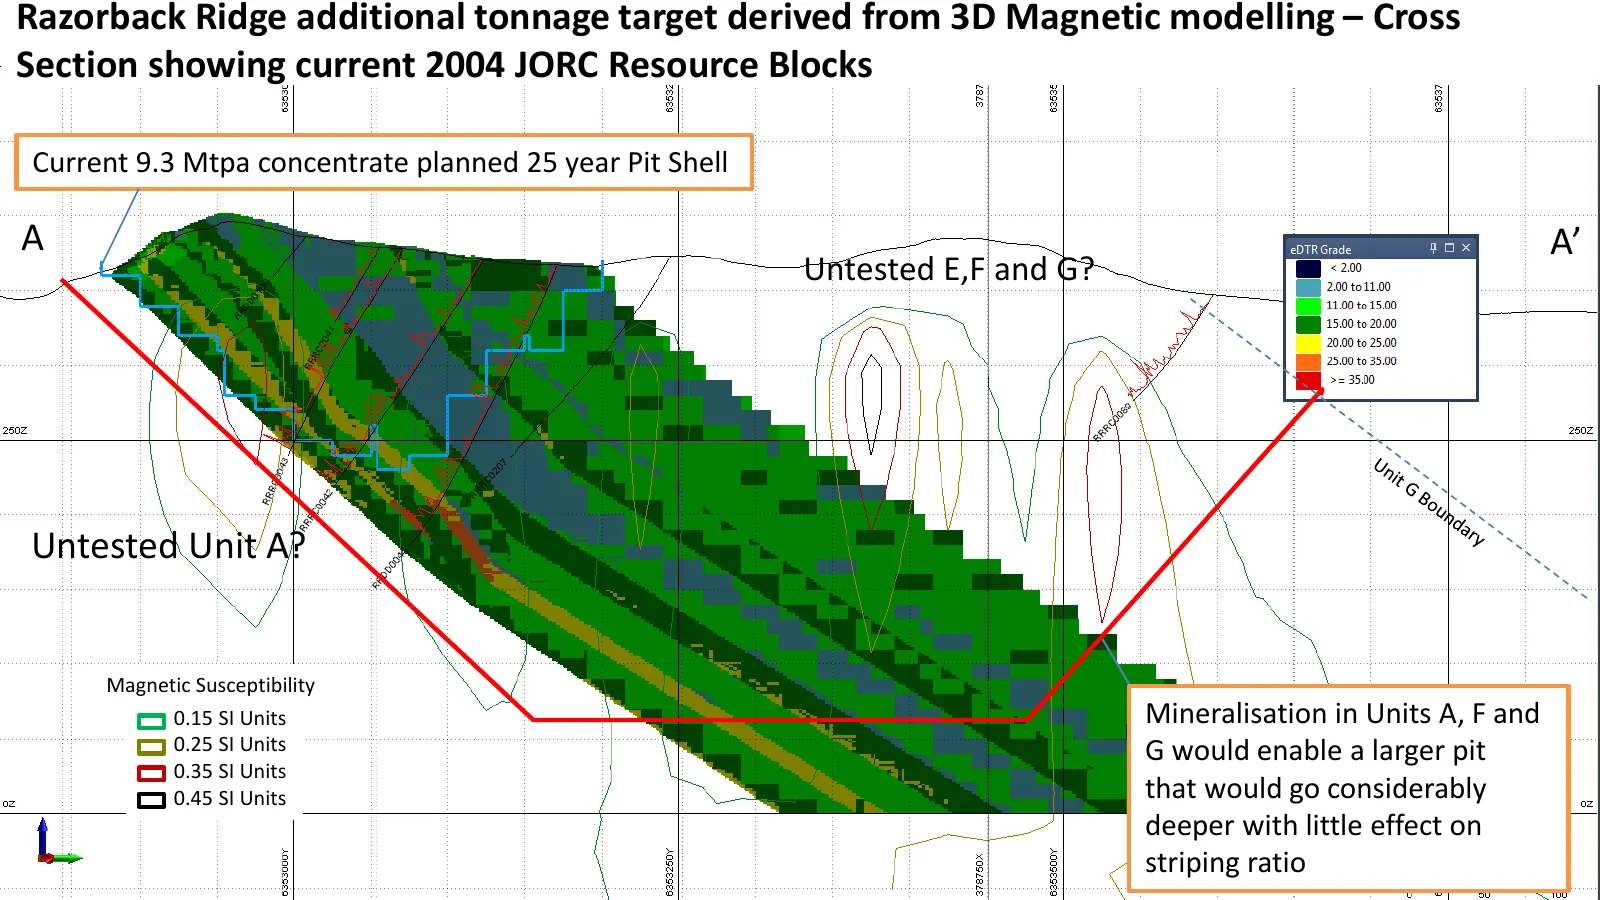
Slide 19: Razorback Ridge Resource – cross section
Razorback Ridge additional tonnage target derived from 3D Magnetic modelling – Cross Section showing current 2004 JORC Resource Blocks A A’ Current 9.3 Mtpa concentrate planned 25 year Pit Shell A A’ Untested E,F and G? Untested Unit A? Magnetic Susceptibility Razorback Ridge 0.15 SI Units Mineralis
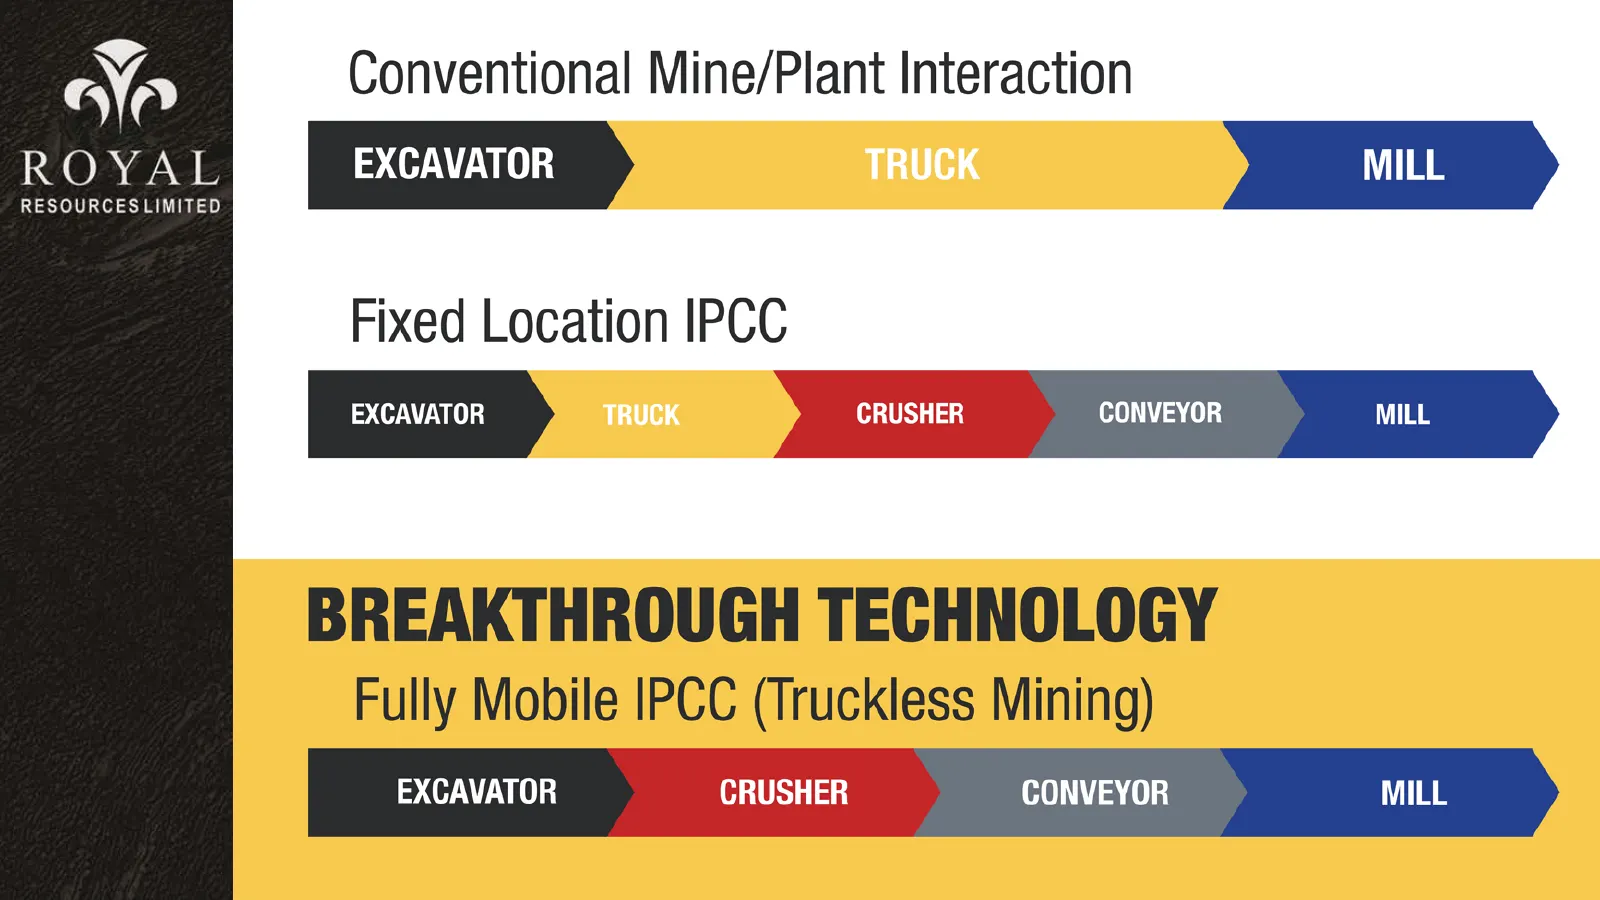
Slide 20: Fixed Location vs Fully Mobile IPCC
or Conventional Mine/Plant Interaction ROYAL EXCAVATOR MILL Fixed Location IPCC EXCAVATOR CONVEYOR MILL BREAKTHROUGH TECHNOLOGY Fully Mobile IPCC (Truckless Mining) EXCAVATOR CONVEYOR MILL
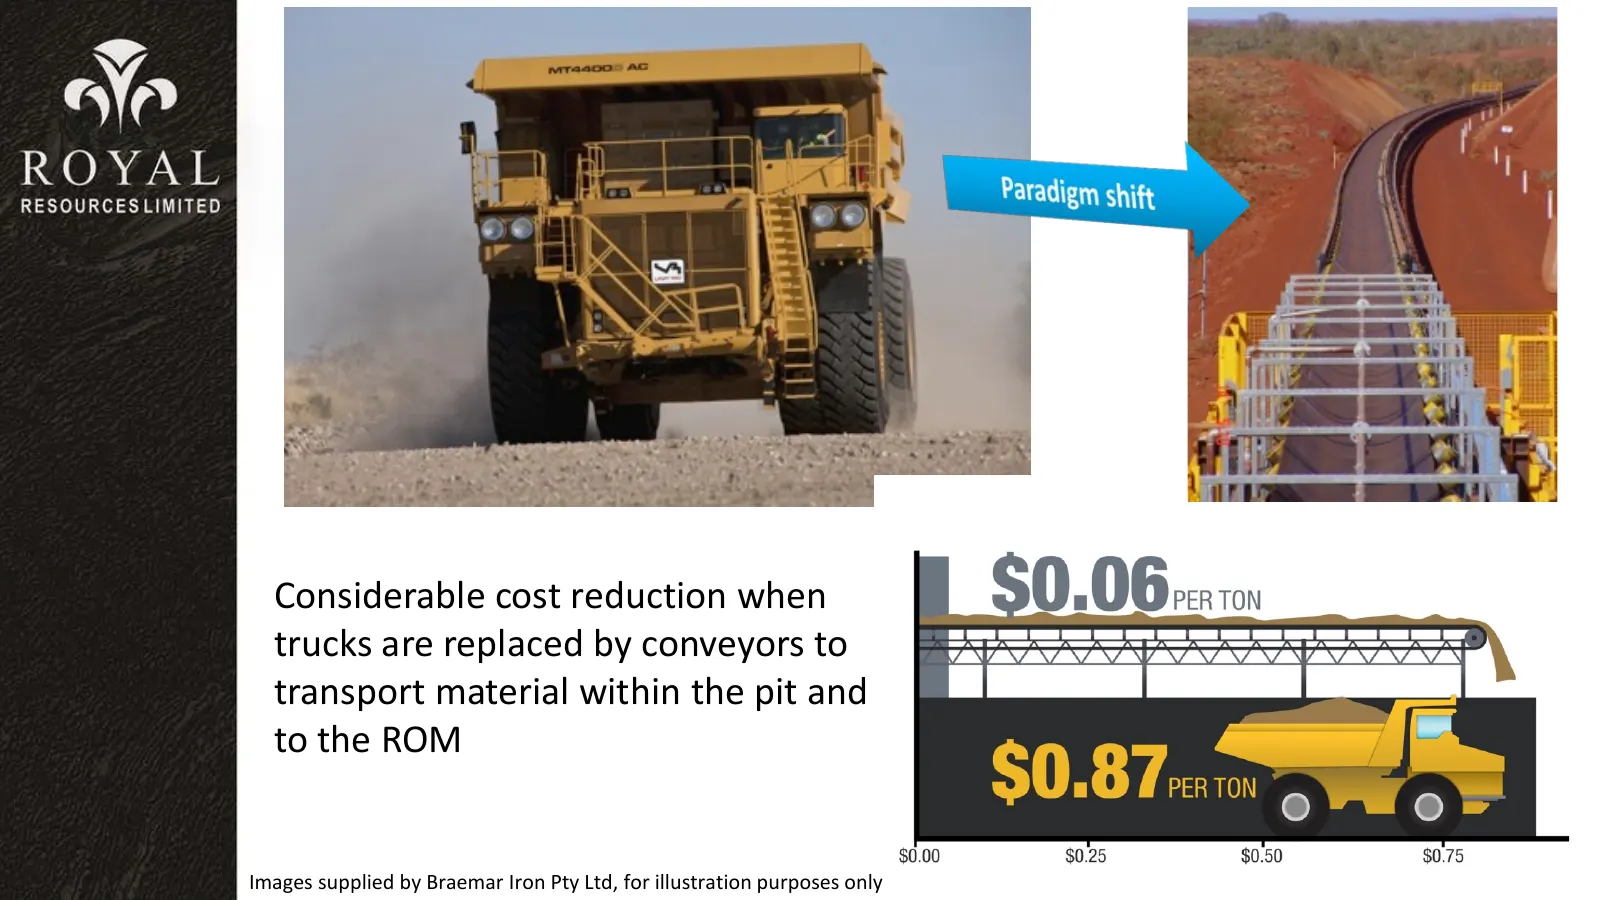
Slide 21: Considerable cost reduction when trucks are replaced by conveyors
Considerable cost reduction when trucks are replaced by conveyors to transport material within the pit and to the ROM Images supplied by Braemar Iron Pty Ltd, for illustration purposes only
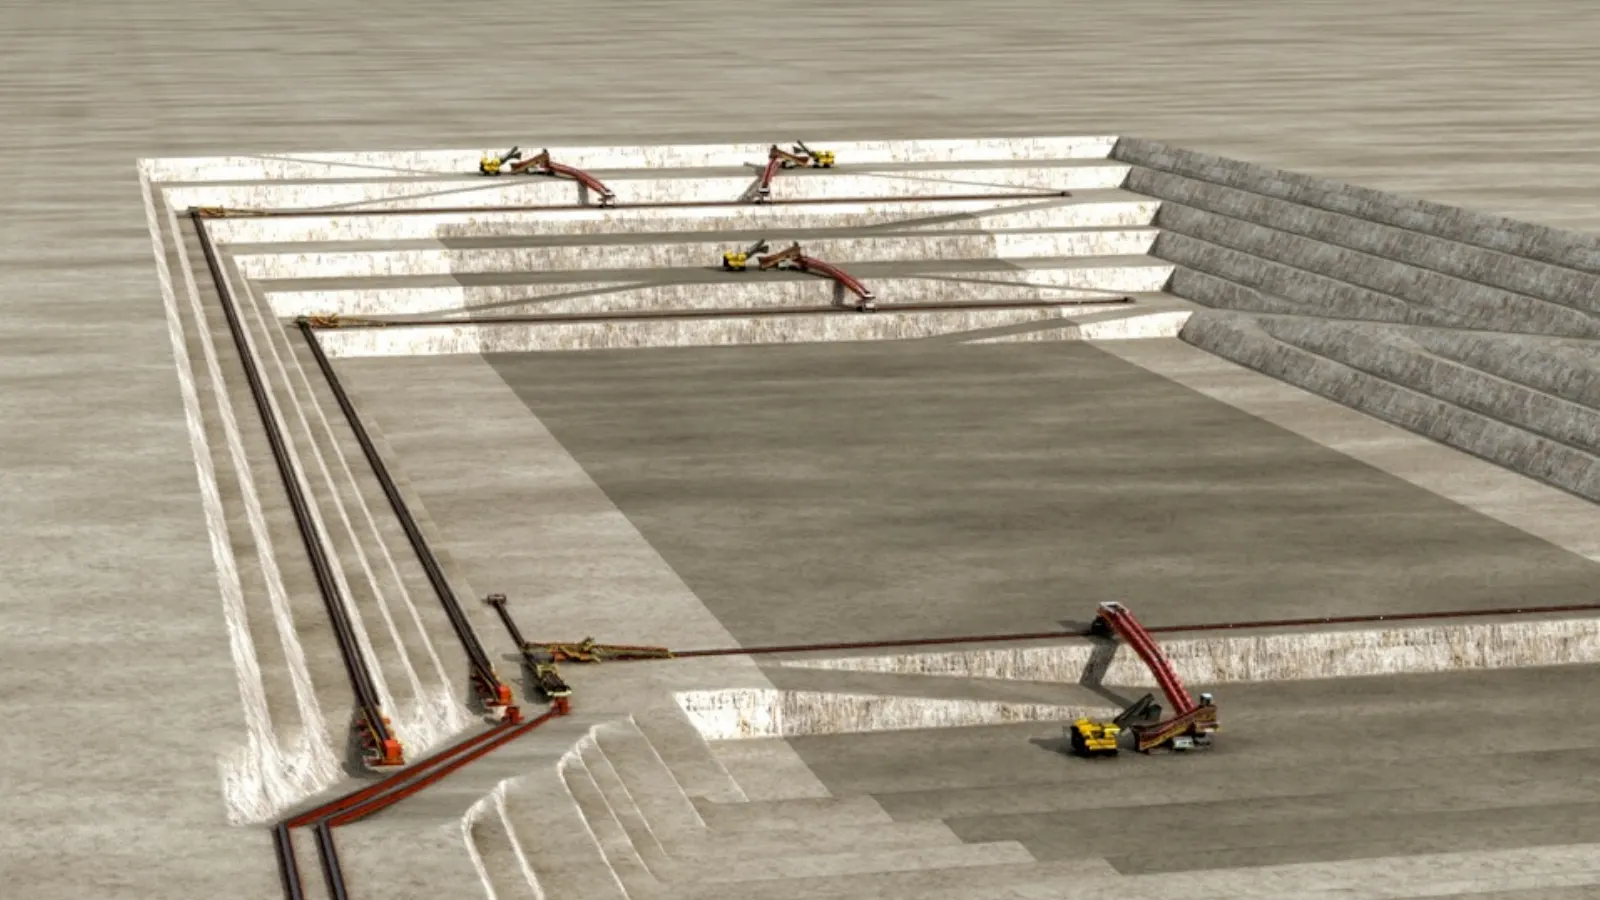
Slide 22
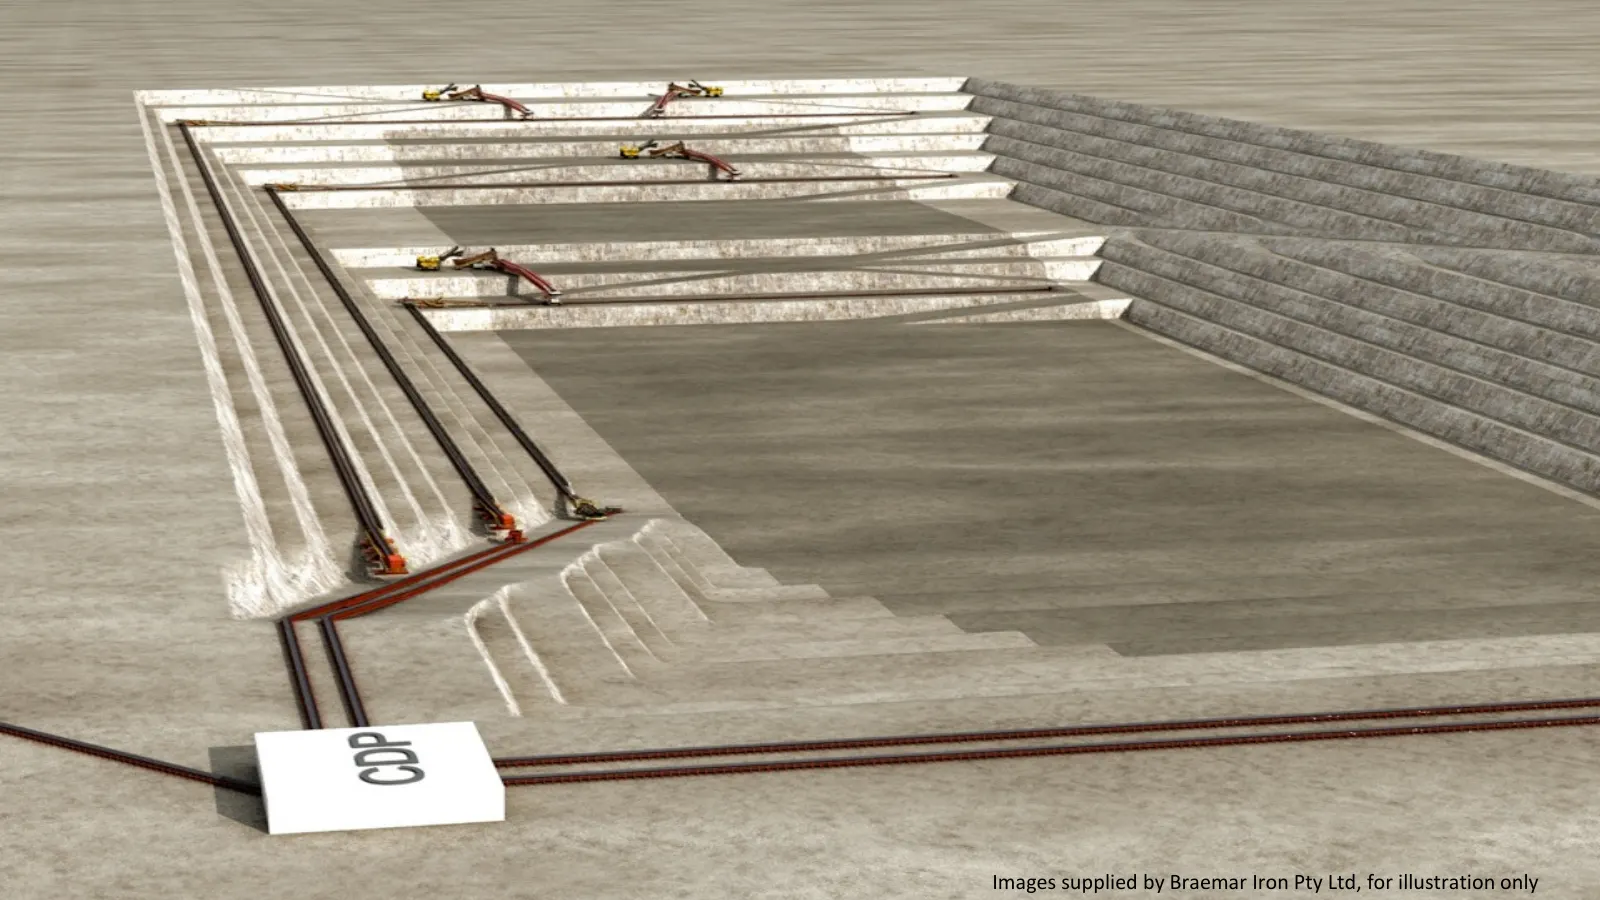
Slide 23: Images supplied by Braemar Iron Pty Ltd, for illustration only
Images supplied by Braemar Iron Pty Ltd, for illustration only
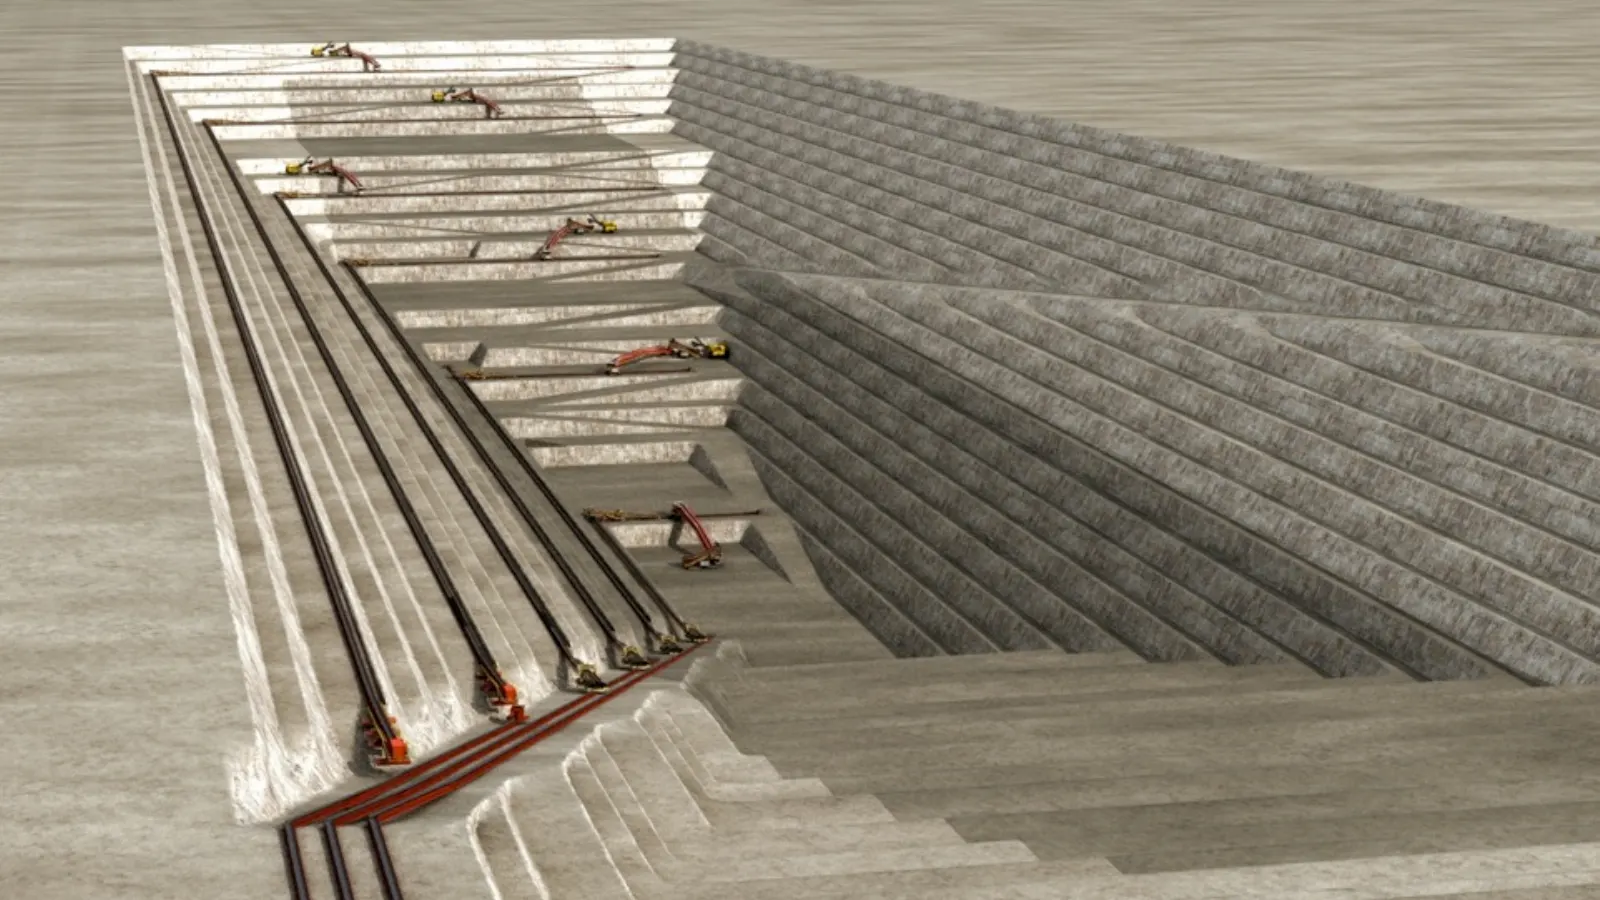
Slide 24
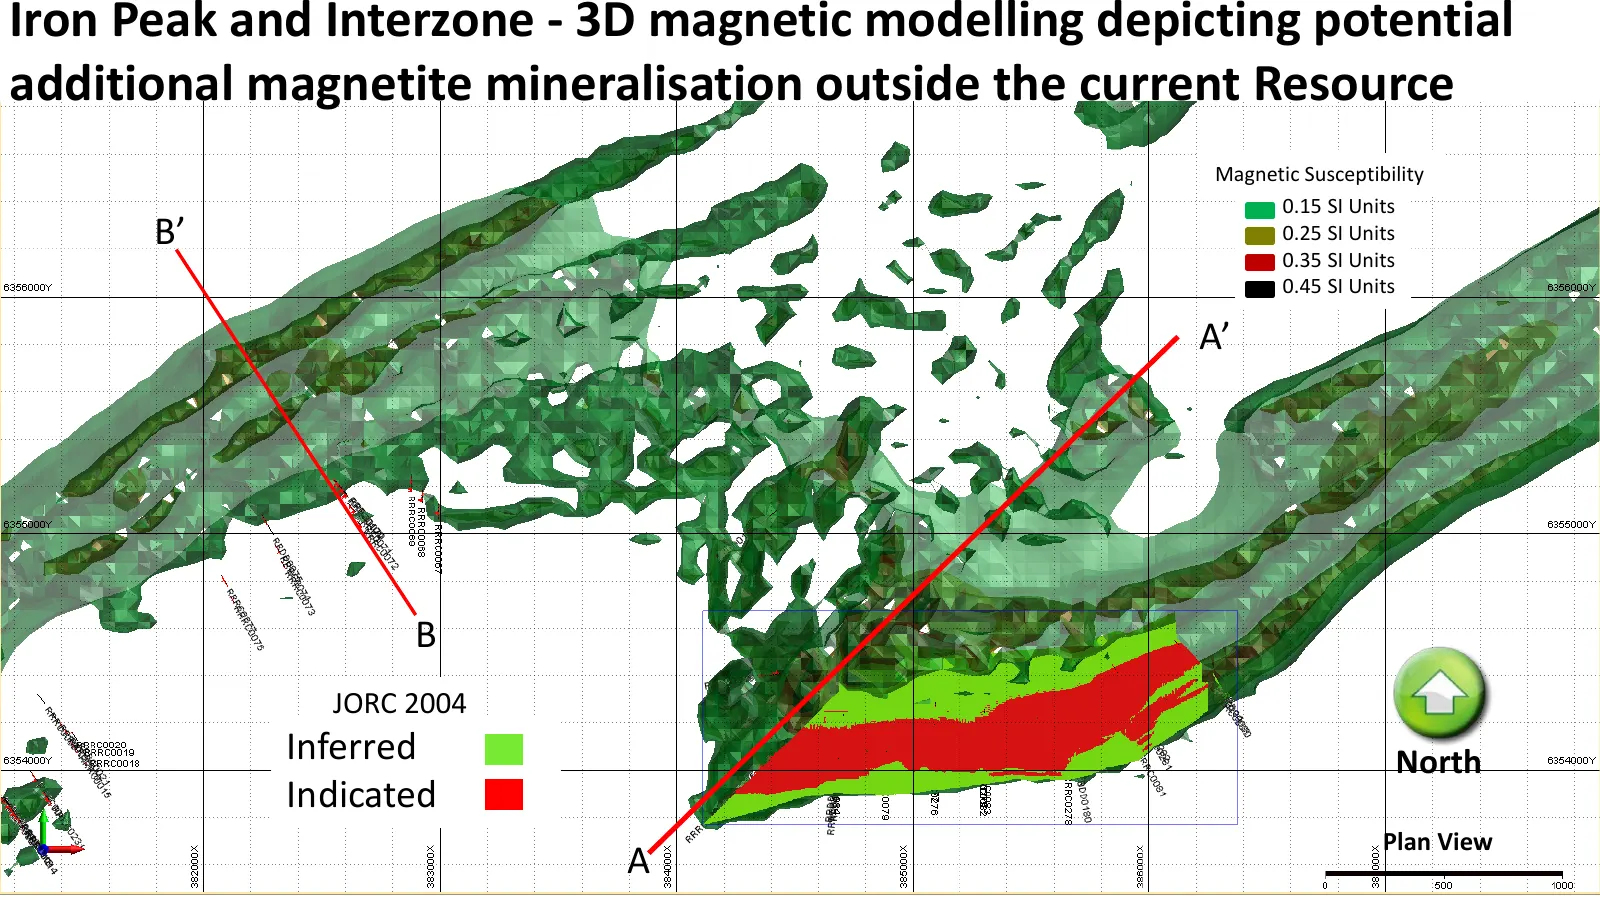
Slide 25: Iron Peak and Interzone - 3D magnetic modelling (plan view)
Iron Peak and Interzone - 3D magnetic modelling depicting potential additional magnetite mineralisation outside the current Resource Magnetic Susceptibility 0.15 SI Units B’ 0.25 SI Units 0.35 SI Units 0.45 SI Units A’ B JORC 2004 Inferred North Indicated Plan View A
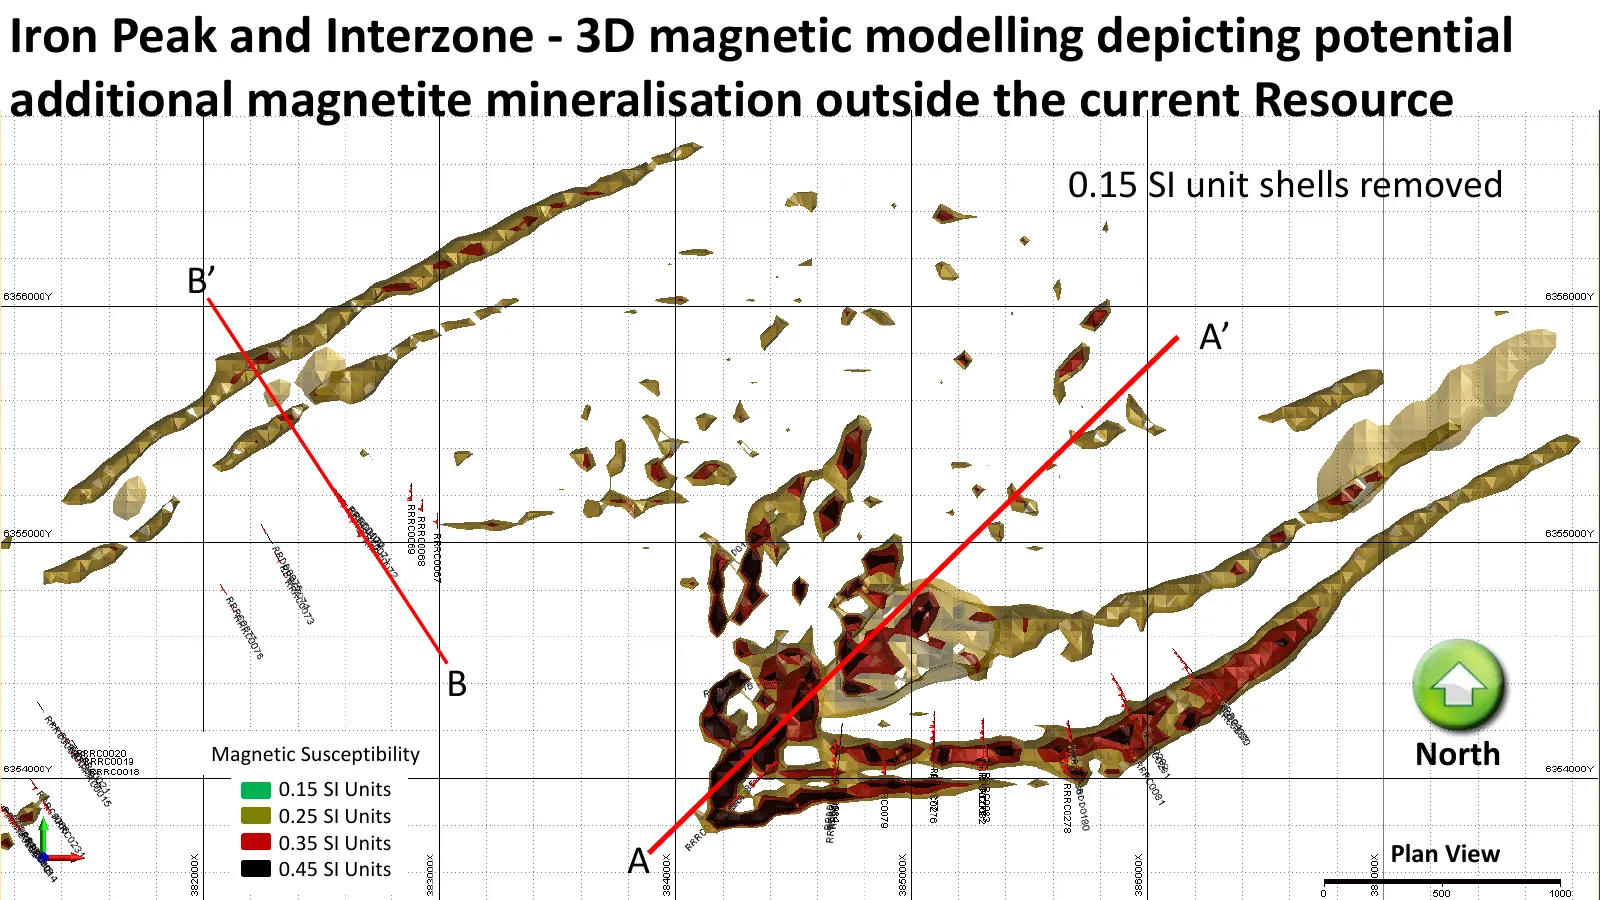
Slide 26: Iron Peak and Interzone - 3D magnetic modelling
Iron Peak and Interzone - 3D magnetic modelling depicting potential additional magnetite mineralisation outside the current Resource 0.15 SI unit shells removed B’ A’ B Magnetic Susceptibility North 0.15 SI Units 0.25 SI Units 0.35 SI Units 0.45 SI Units A Plan View
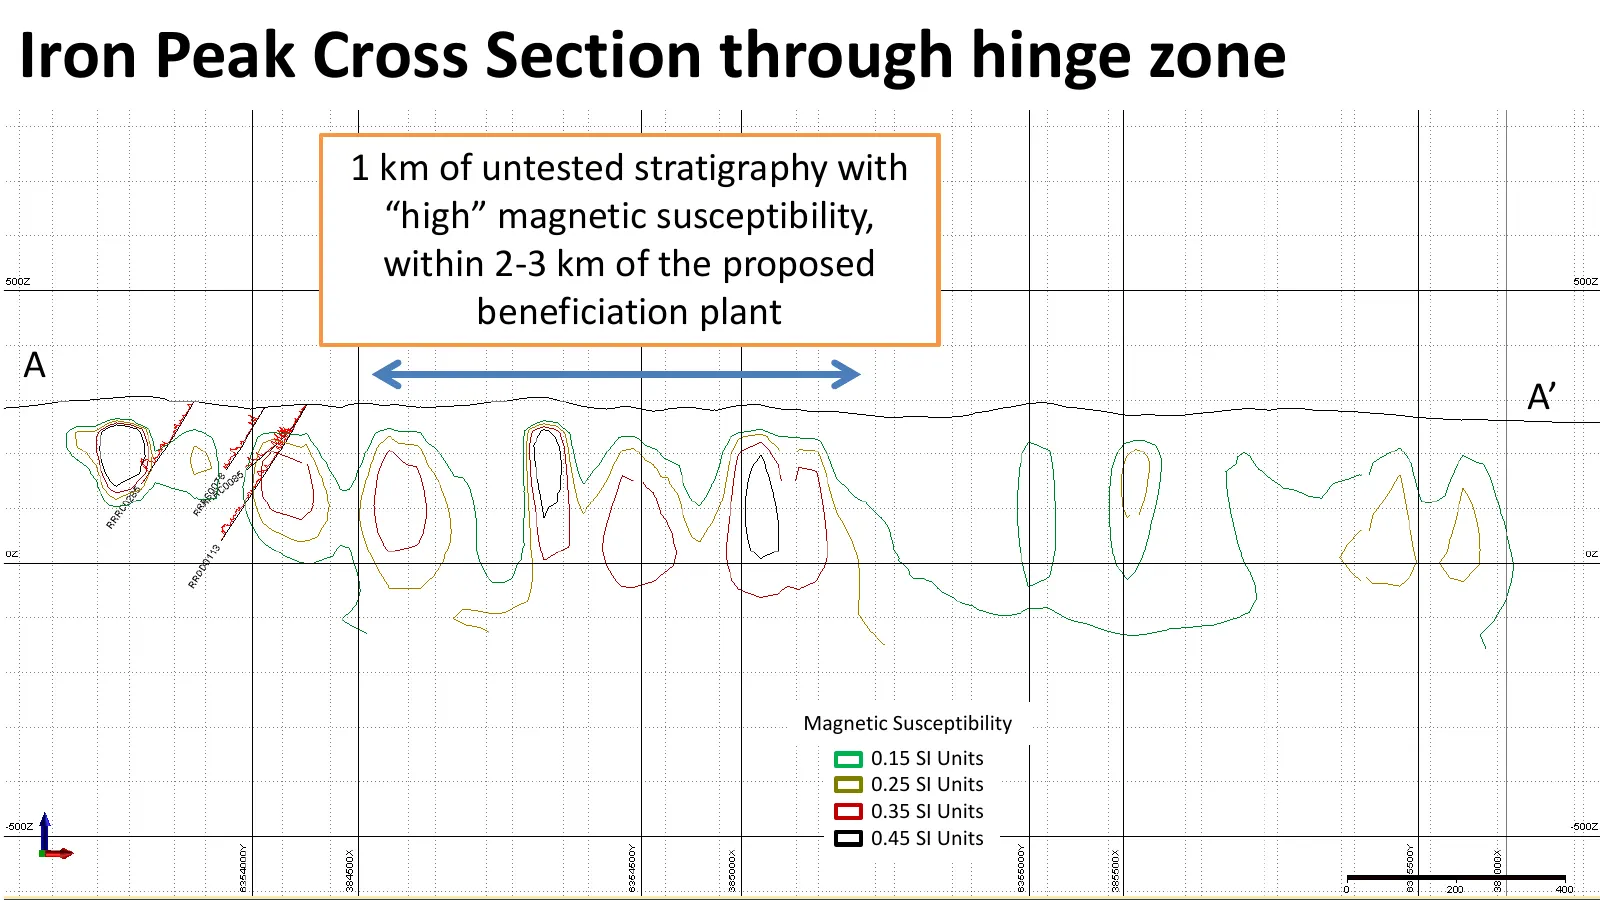
Slide 27: Iron Peak Cross Section through hinge zone
Iron Peak Cross Section through hinge zone 1 km of untested stratigraphy with “high” magnetic susceptibility, within 2-3 km of the proposed beneficiation plant A A’ Magnetic Susceptibility 0.15 SI Units 0.25 SI Units 0.35 SI Units 0.45 SI Units
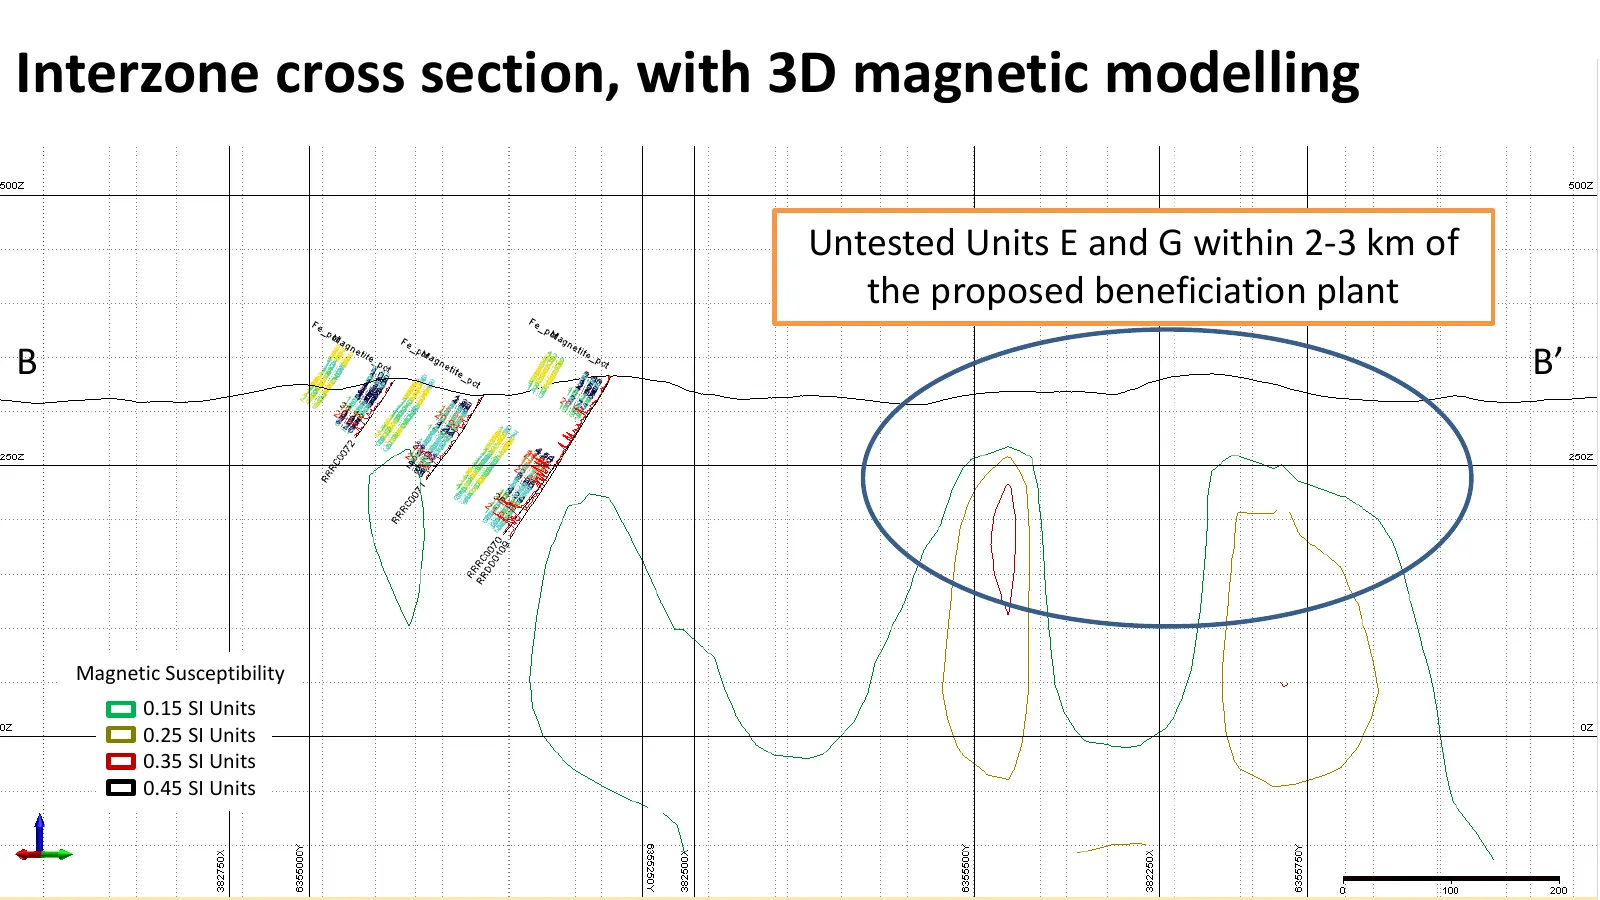
Slide 28: Interzone cross section, with 3D magnetic modelling
Interzone cross section, with 3D magnetic modelling Untested Units E and G within 2-3 km of the proposed beneficiation plant B B’ Magnetic Susceptibility 0.15 SI Units 0.25 SI Units 0.35 SI Units 0.45 SI Units
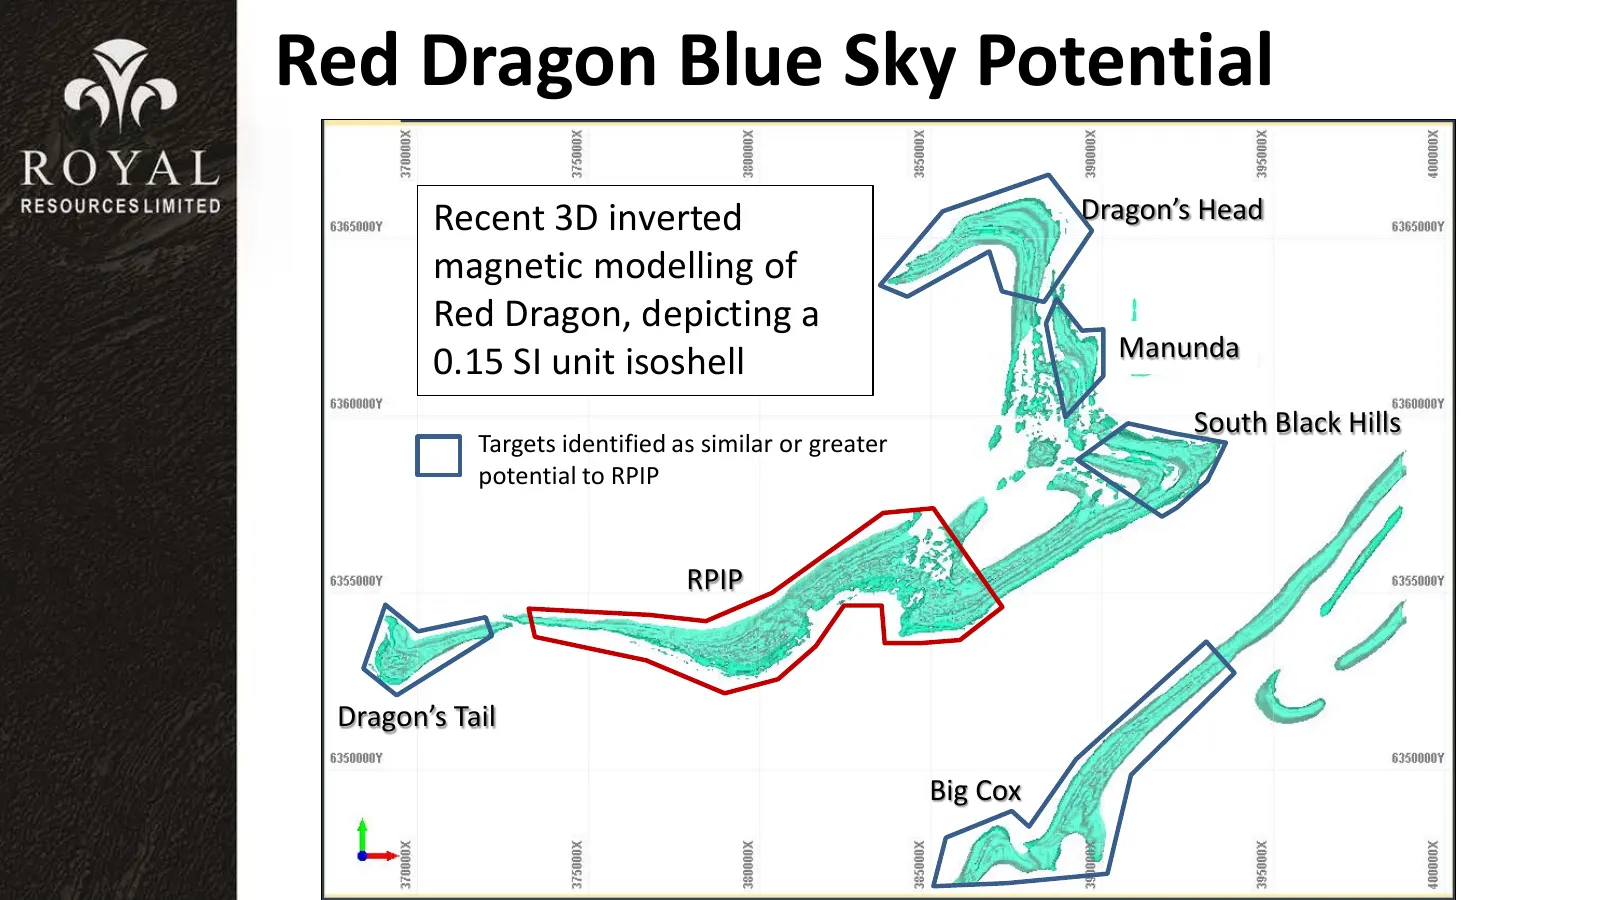
Slide 29: Red Dragon Blue Sky Potential
Red Dragon Blue Sky Potential Recent 3D inverted Dragon’s Head magnetic modelling of Red Dragon, depicting a Manunda 0.15 SI unit isoshell South Black Hills Targets identified as similar or greater potential to RPIP RPIP Dragon’s Tail Big Cox
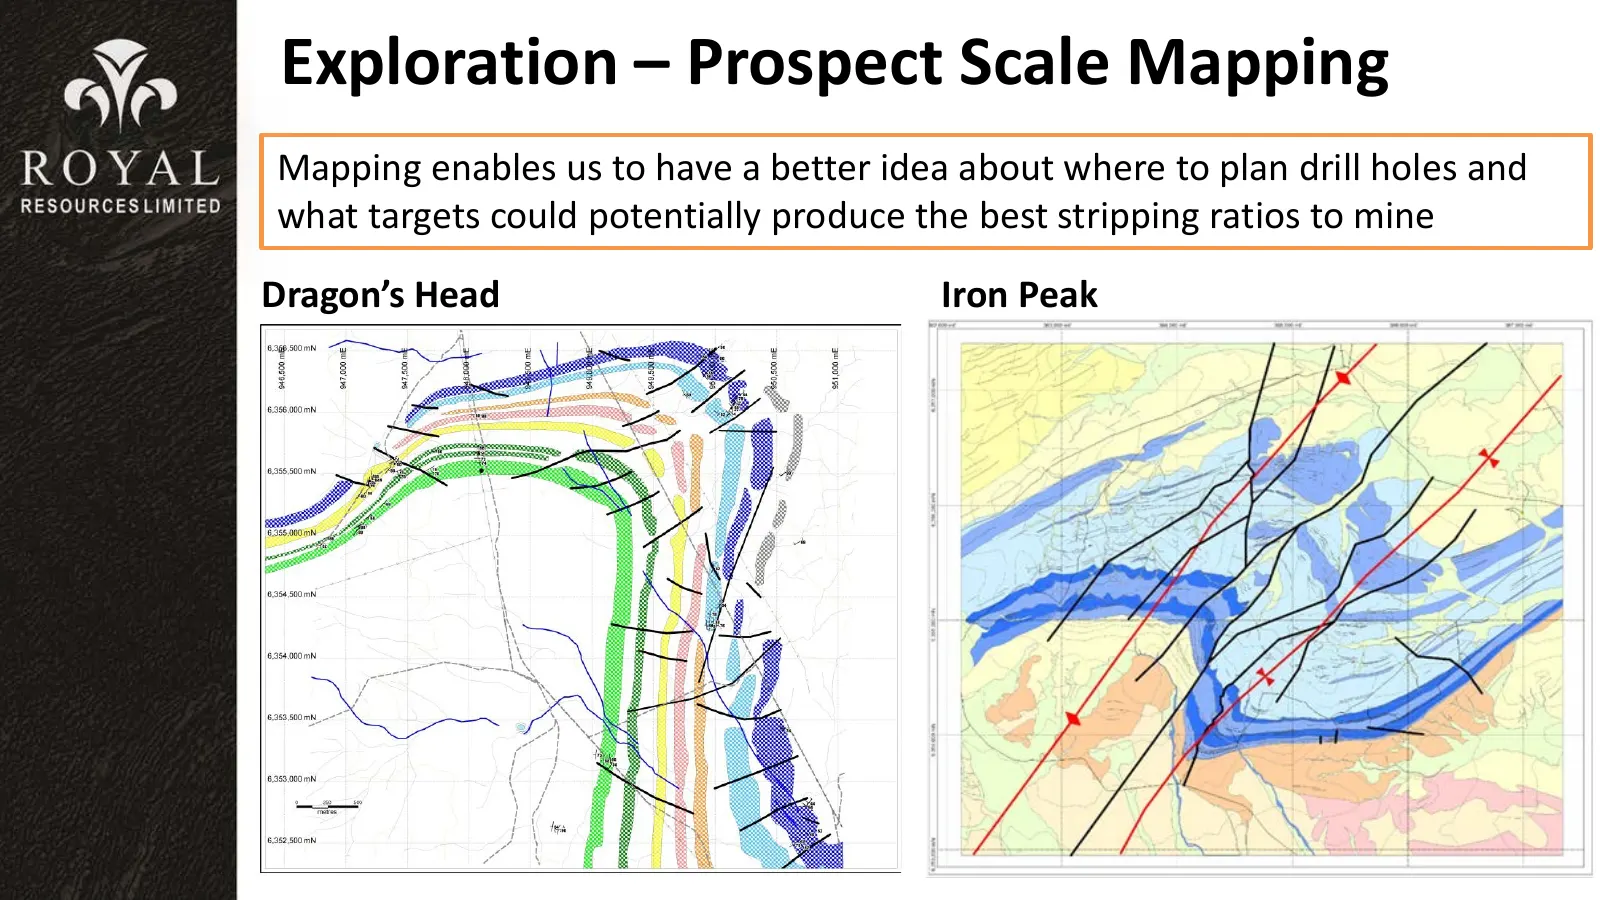
Slide 30: Exploration – Prospect Scale Mapping
Exploration – Prospect Scale Mapping Mapping enables us to have a better idea about where to plan drill holes and what targets could potentially produce the best stripping ratios to mine Dragon’s Head Iron Peak
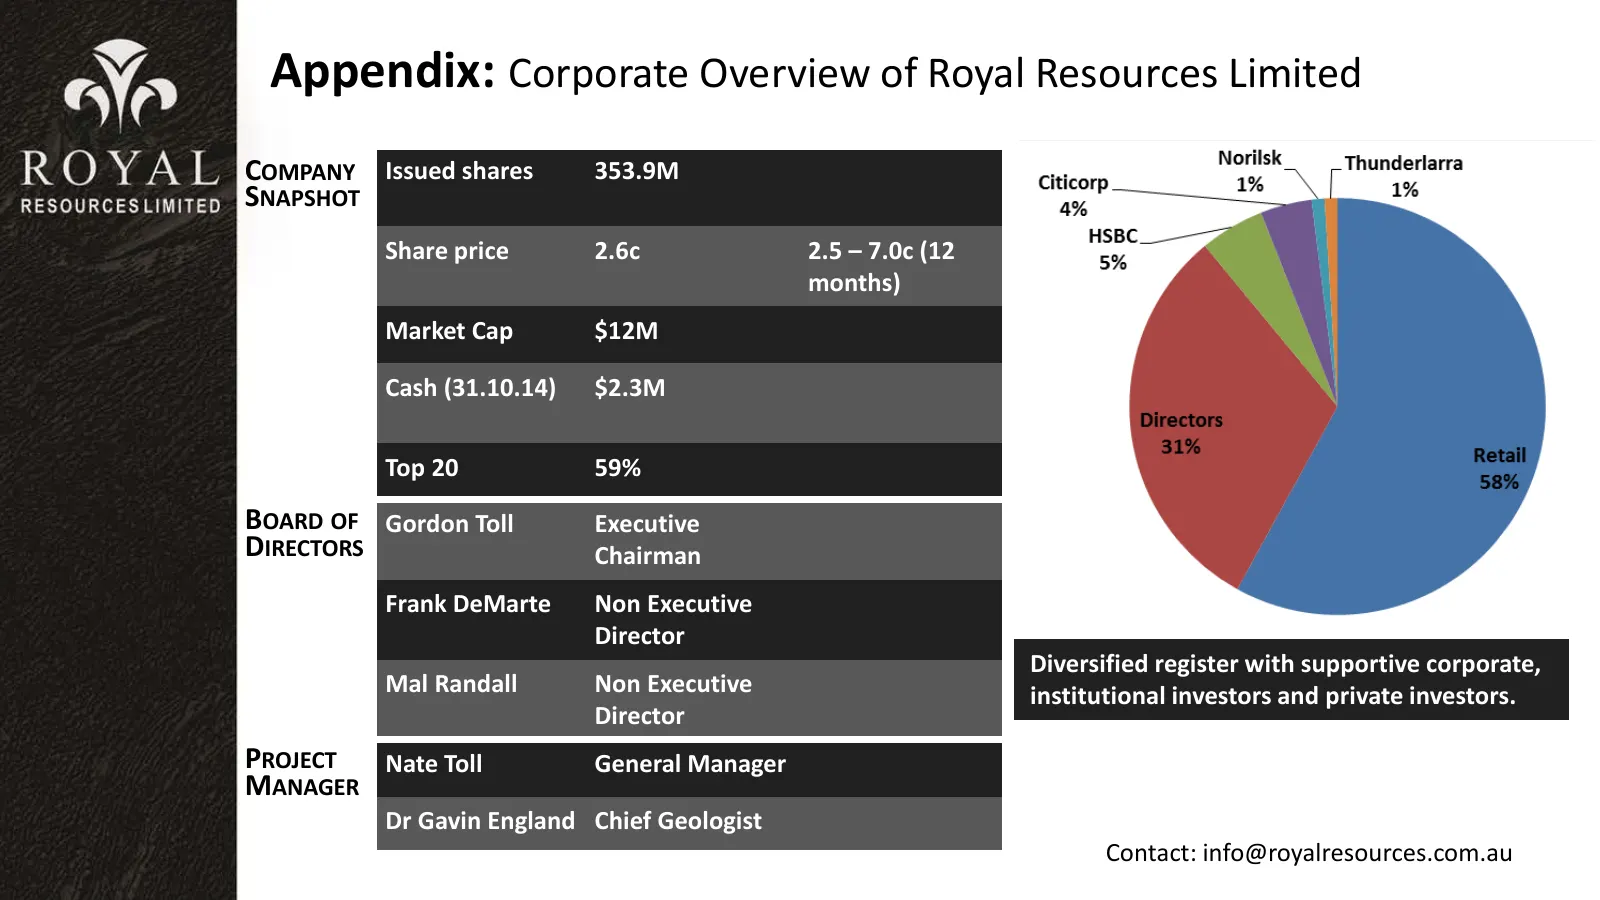
Slide 31: Appendix: Corporate Overview of Royal Resources Limited
Appendix: Corporate Overview of Royal Resources Limited COMPANY Issued shares 353.9M SNAPSHOT Share price 2.6c 2.5 – 7.0c (12 months) Market Cap $12M Cash (31.10.14) $2.3M Top 20 59% BOARD OF Gordon Toll Executive DIRECTORS Chairman Frank DeMarte Non Executive Director Diversified register with supp
Source: Internet Archive copy of magnetitemines.com
More decks from Magnetite Mines Ltd.
 Investor Presentation (September 2026)41 slides · September 2026
 Investor Presentation (March 2026)22 slides · Mar 10, 2026
 Shareholder Meeting (November 2025)18 slides · Nov 26, 2025
 Investor Presentation (August 2025)22 slides · Aug 8, 2025
 TACTIC Conference 202516 slides · Jul 30, 2025
 The Australian Green Iron & Steel Forum 202519 slides · Mar 26, 2025