ESB Financial — Merger or Acquisition (October 2014)
22 slides from ESB Financial's merger presentation, Oct 29, 2014
Slide 1: Acquisition of ESB Financial Corporation
WesBanco By all accounts, better. Acquisition of ESB Financial Corporation October 30, 2014 ESB FINANCIAL CORPORATION
Slide 2: Forward-Looking Statements
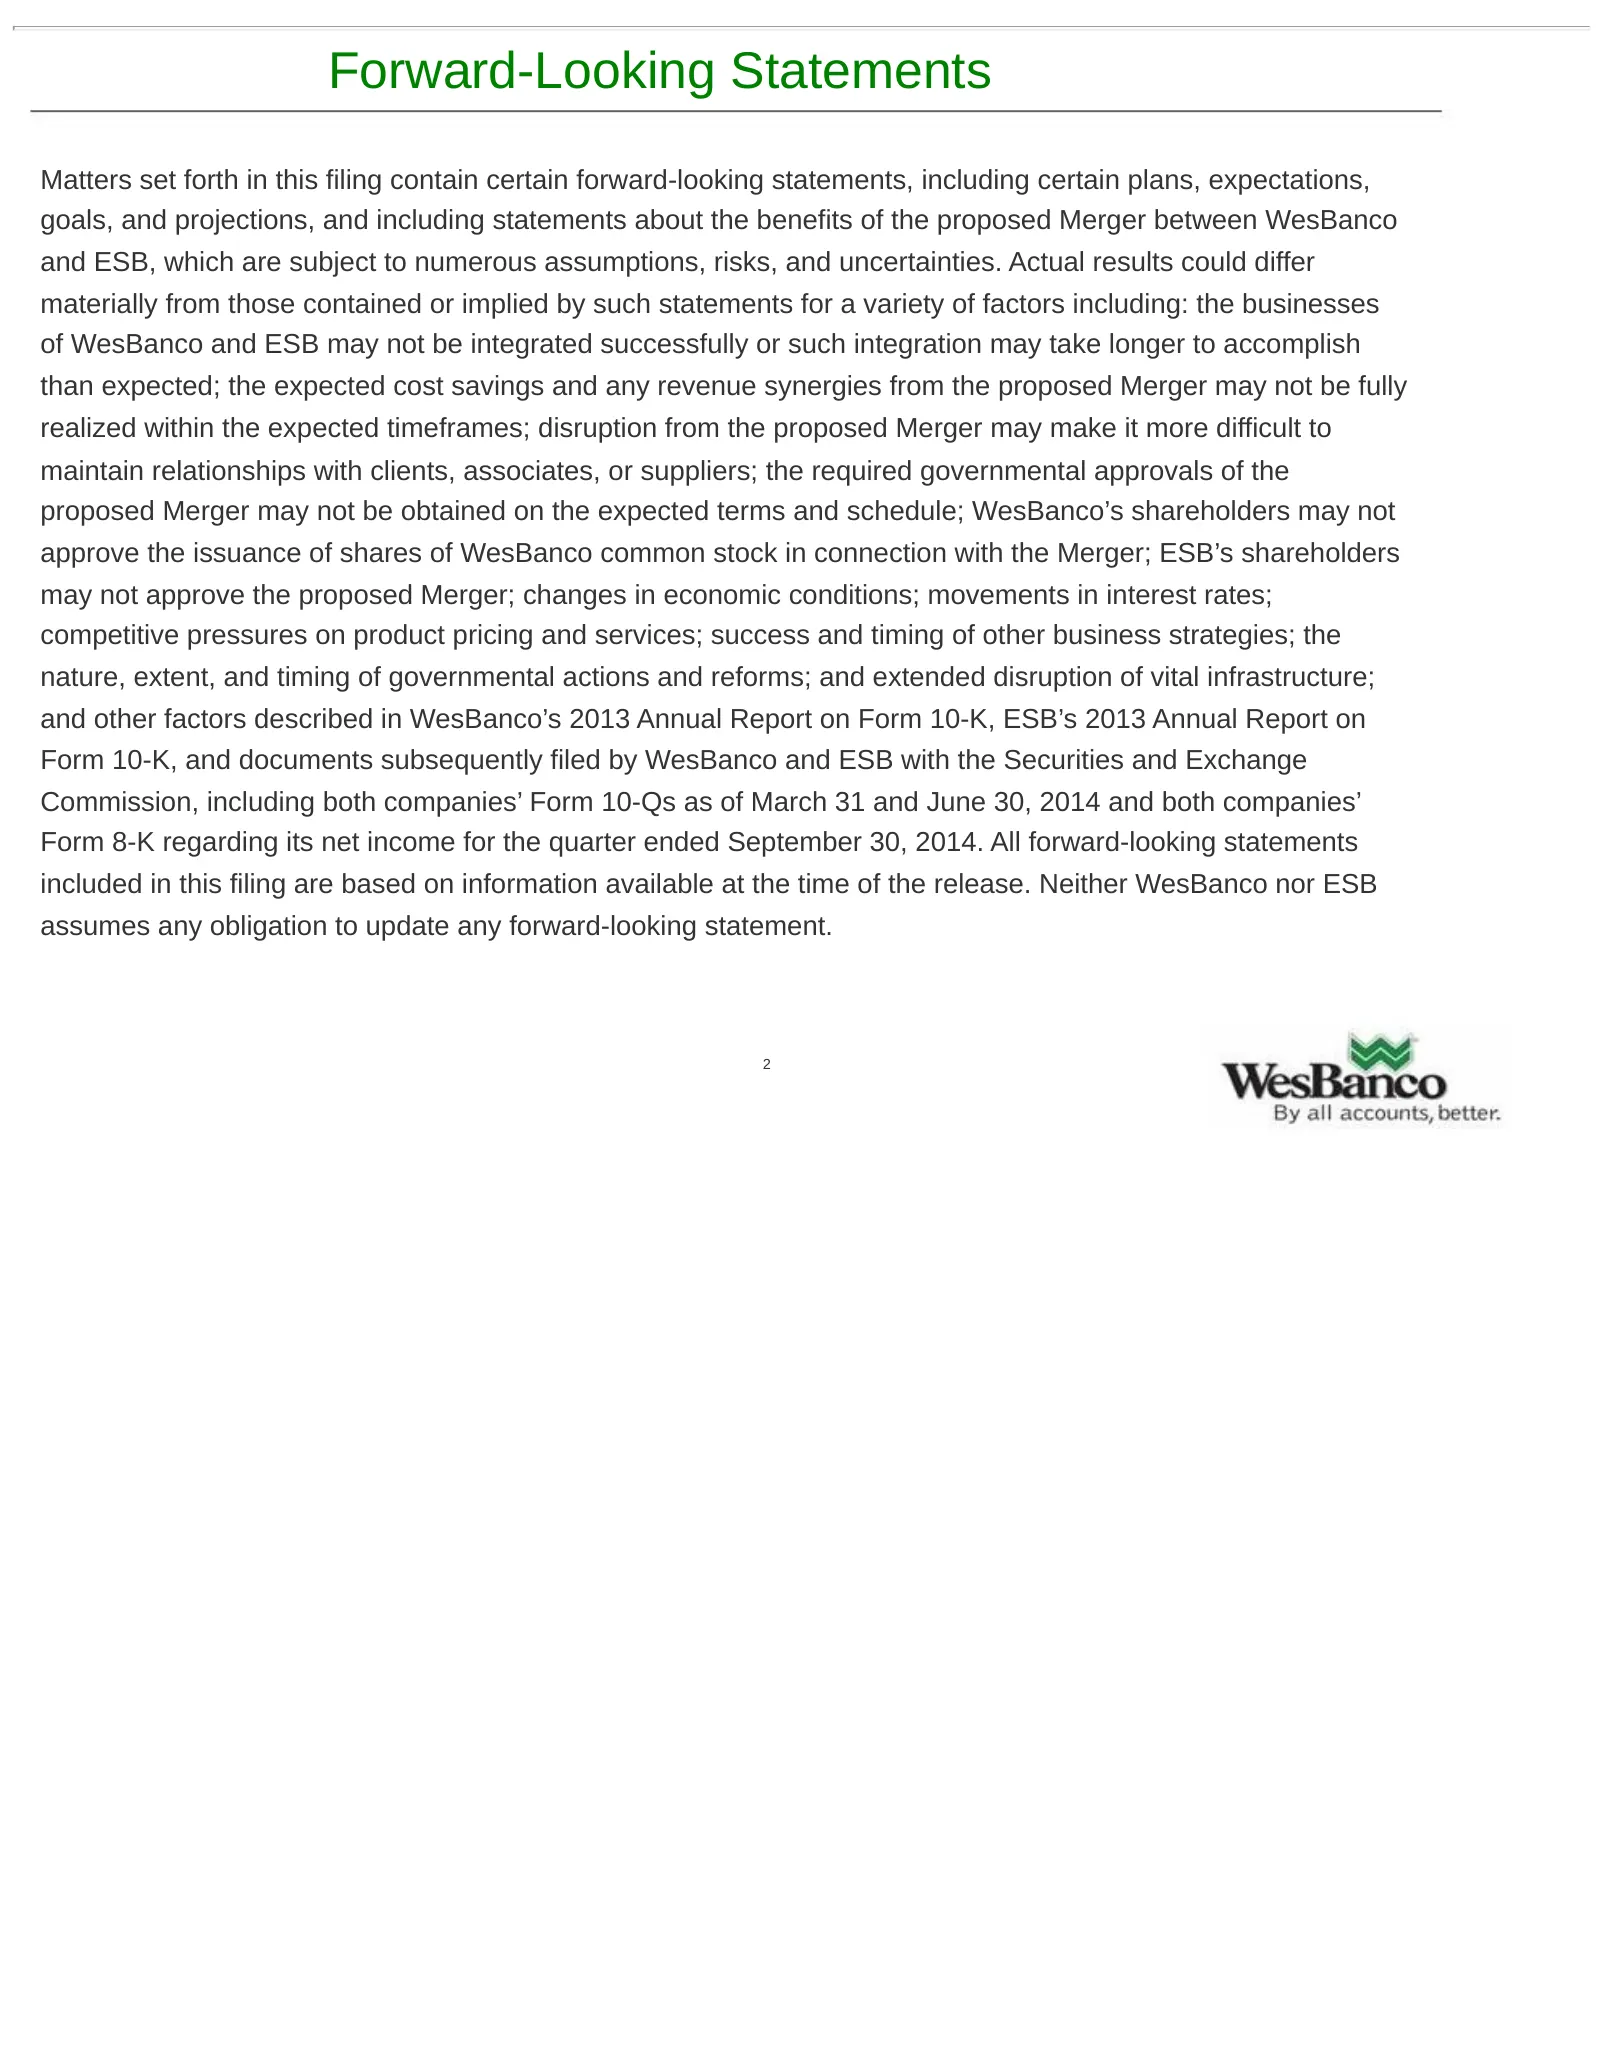
Forward-Looking Statements Matters set forth in this filing contain certain forward-looking statements, including certain plans, expectations, goals, and projections, and including statements about the benefits of the proposed Merger between WesBanco and ESB, which are subject to numerous assumption
Slide 3: Transaction Highlights
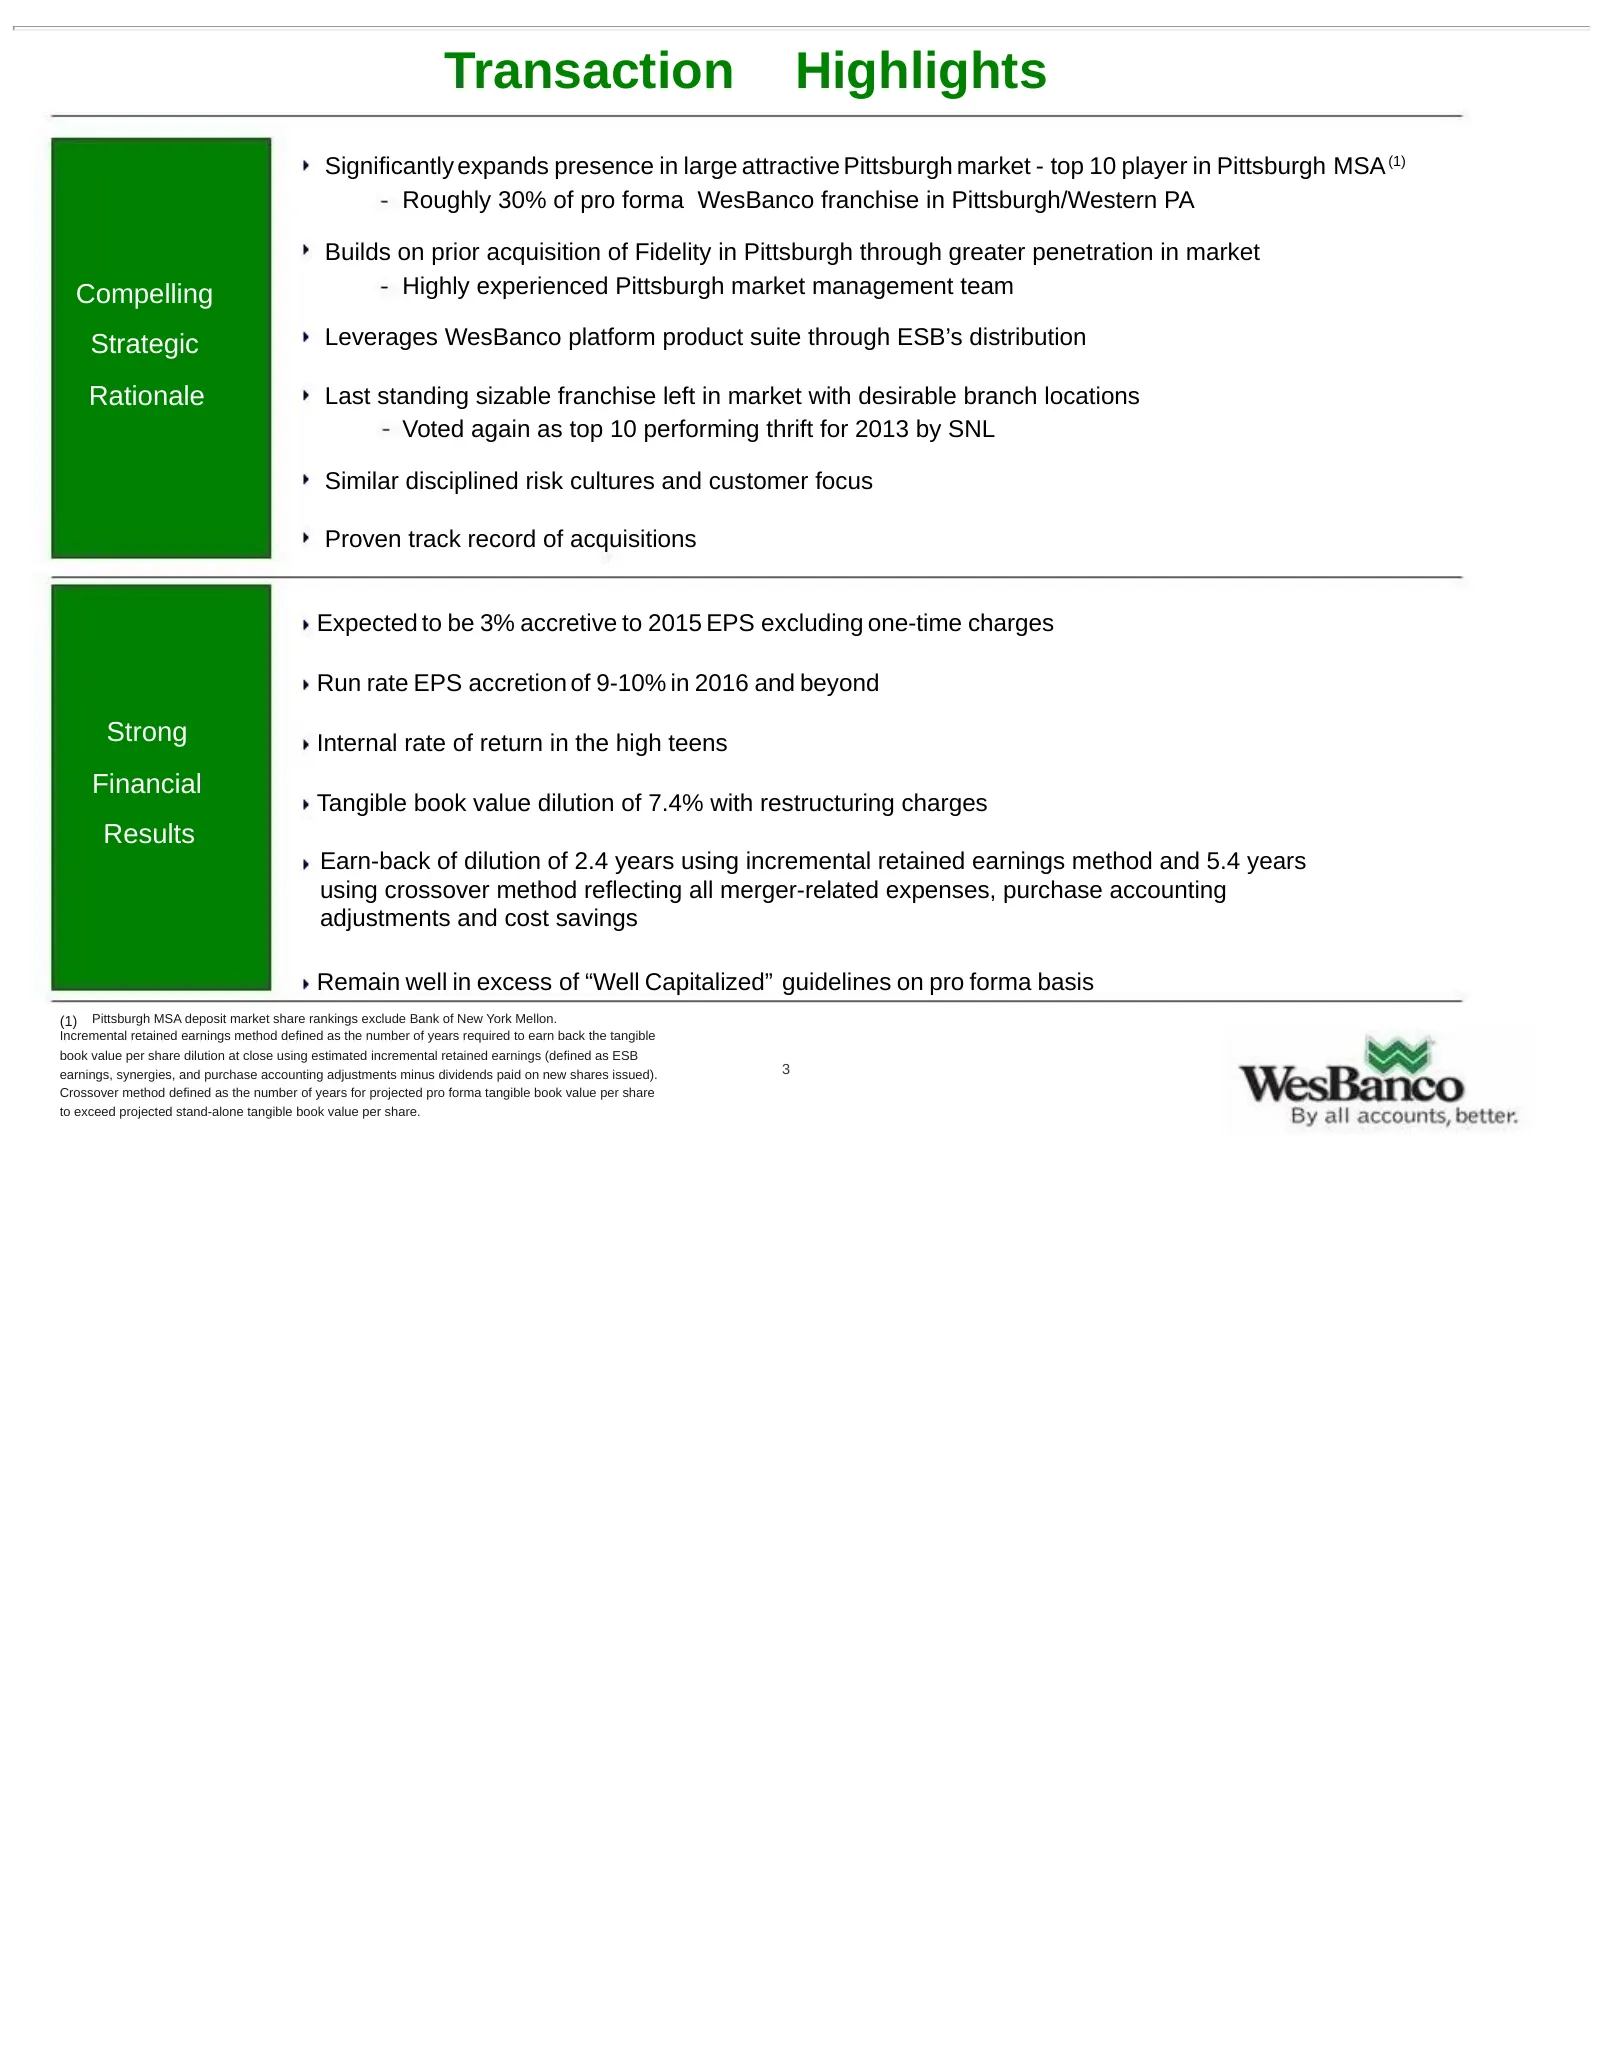
Transaction Highlights Significantly expands presence in large attractive Pittsburgh market - top 10 player in Pittsburgh MSA (1) Roughly 30% of pro forma WesBanco franchise in Pittsburgh/Western PA Builds on prior acquisition of Fidelity in Pittsburgh through greater penetration in market Compellin
Slide 4: Summary of Key Terms
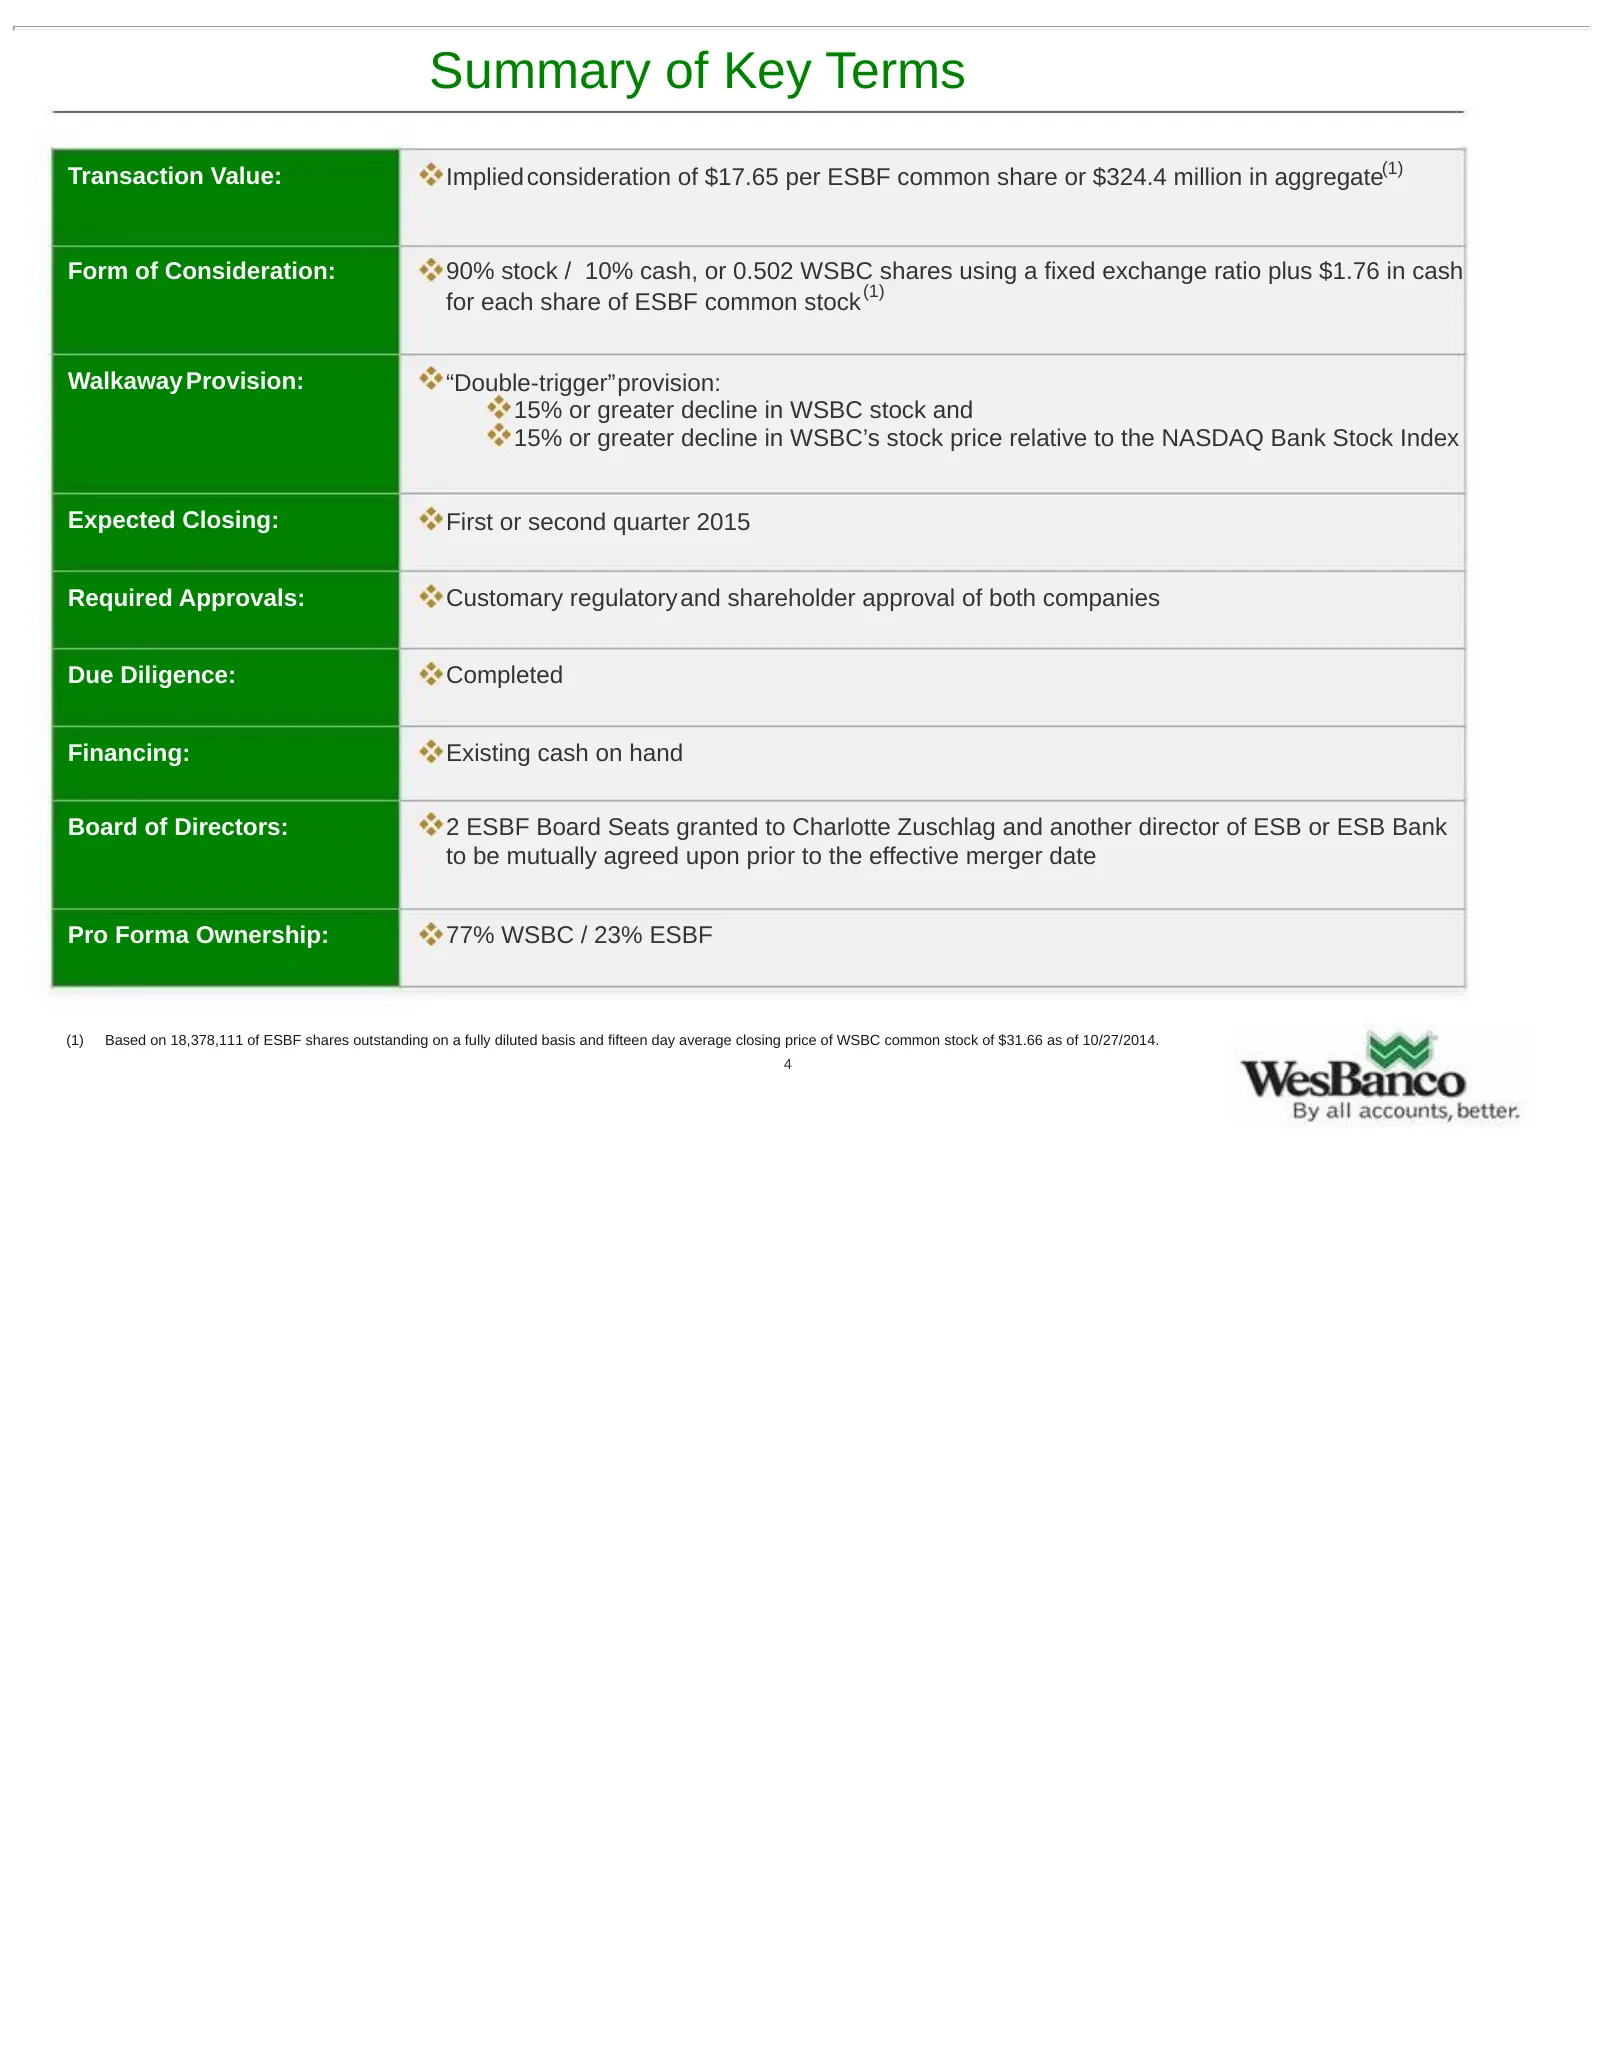
Summary of Key Terms Transaction Value: Implied consideration of $17.65 per ESBF common share or $324.4 million in aggregate(1) Form of Consideration: 90% stock / 10% cash, or 0.502 WSBC shares using a fixed exchange ratio plus $1.76 in cash (1) for each share of ESBF common stock Walkaway Provision
Slide 5: Franchise Comparison
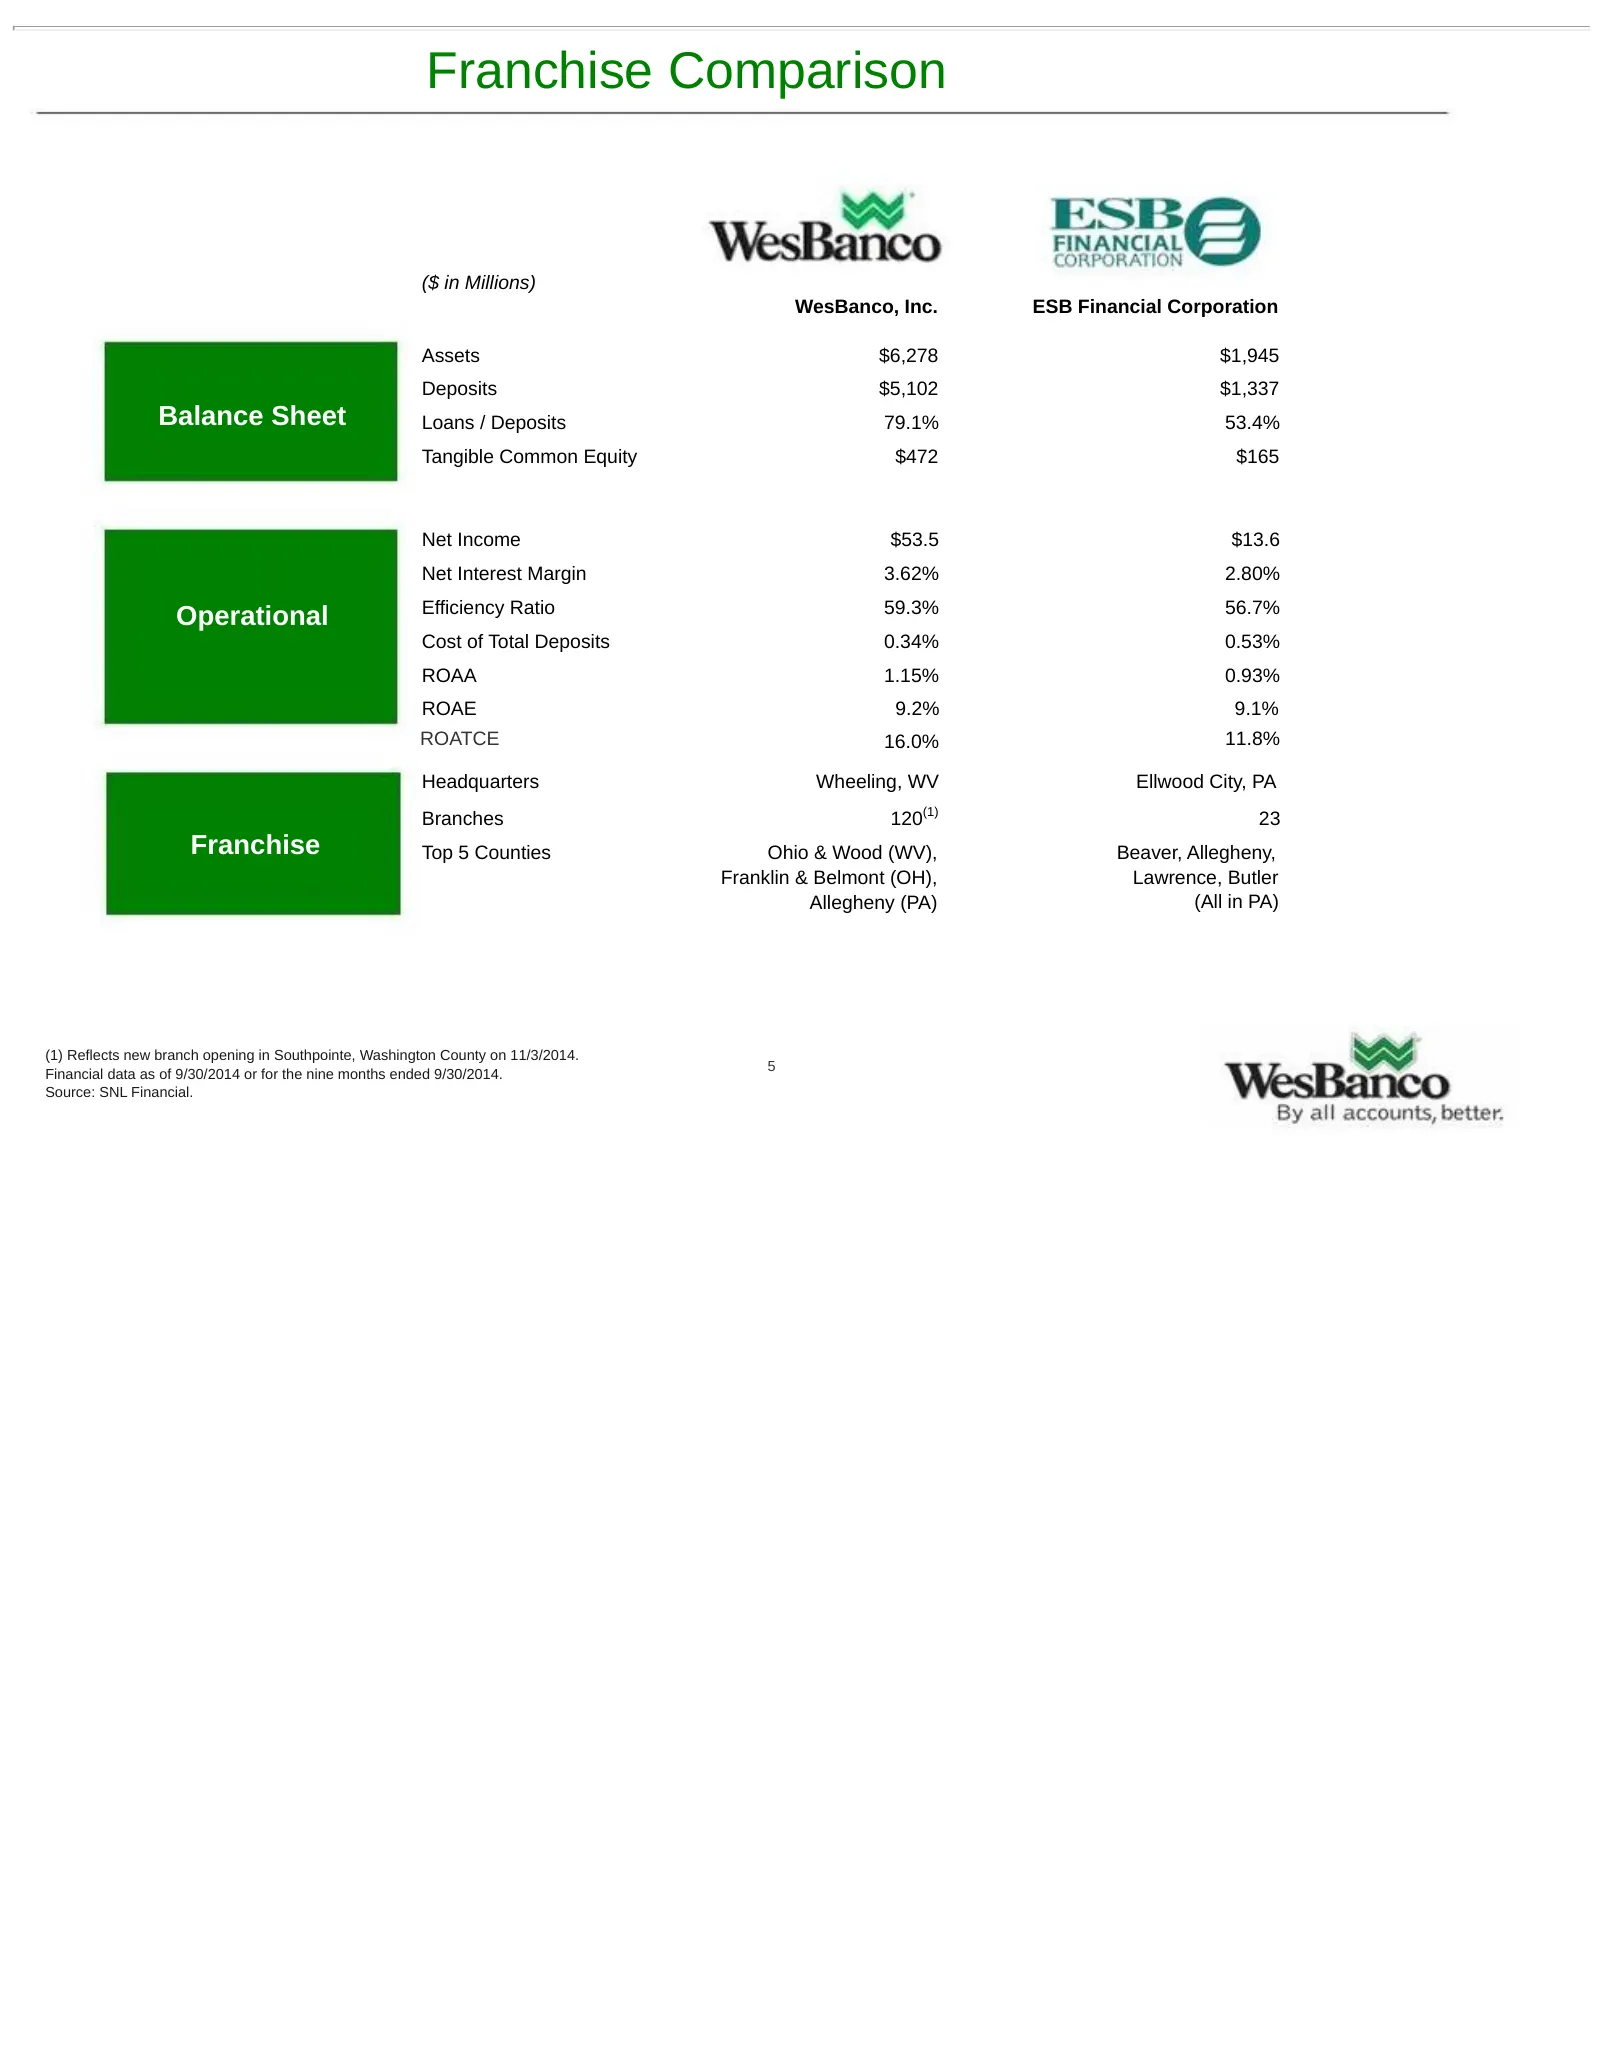
Franchise Comparison ($ in Millions) WesBanco, Inc. ESB Financial Corporation Assets $6,278 $1,945 Deposits $5,102 $1,337 Balance Sheet Loans / Deposits 79.1% 53.4% Tangible Common Equity $472 $165 Net Income $53.5 $13.6 Net Interest Margin 3.62% 2.80% Efficiency Ratio 59.3% 56.7% Operational Cost o
Slide 6: Acquisition of ESB Would Make WSBC Top 10 Player in Pittsburgh MSA
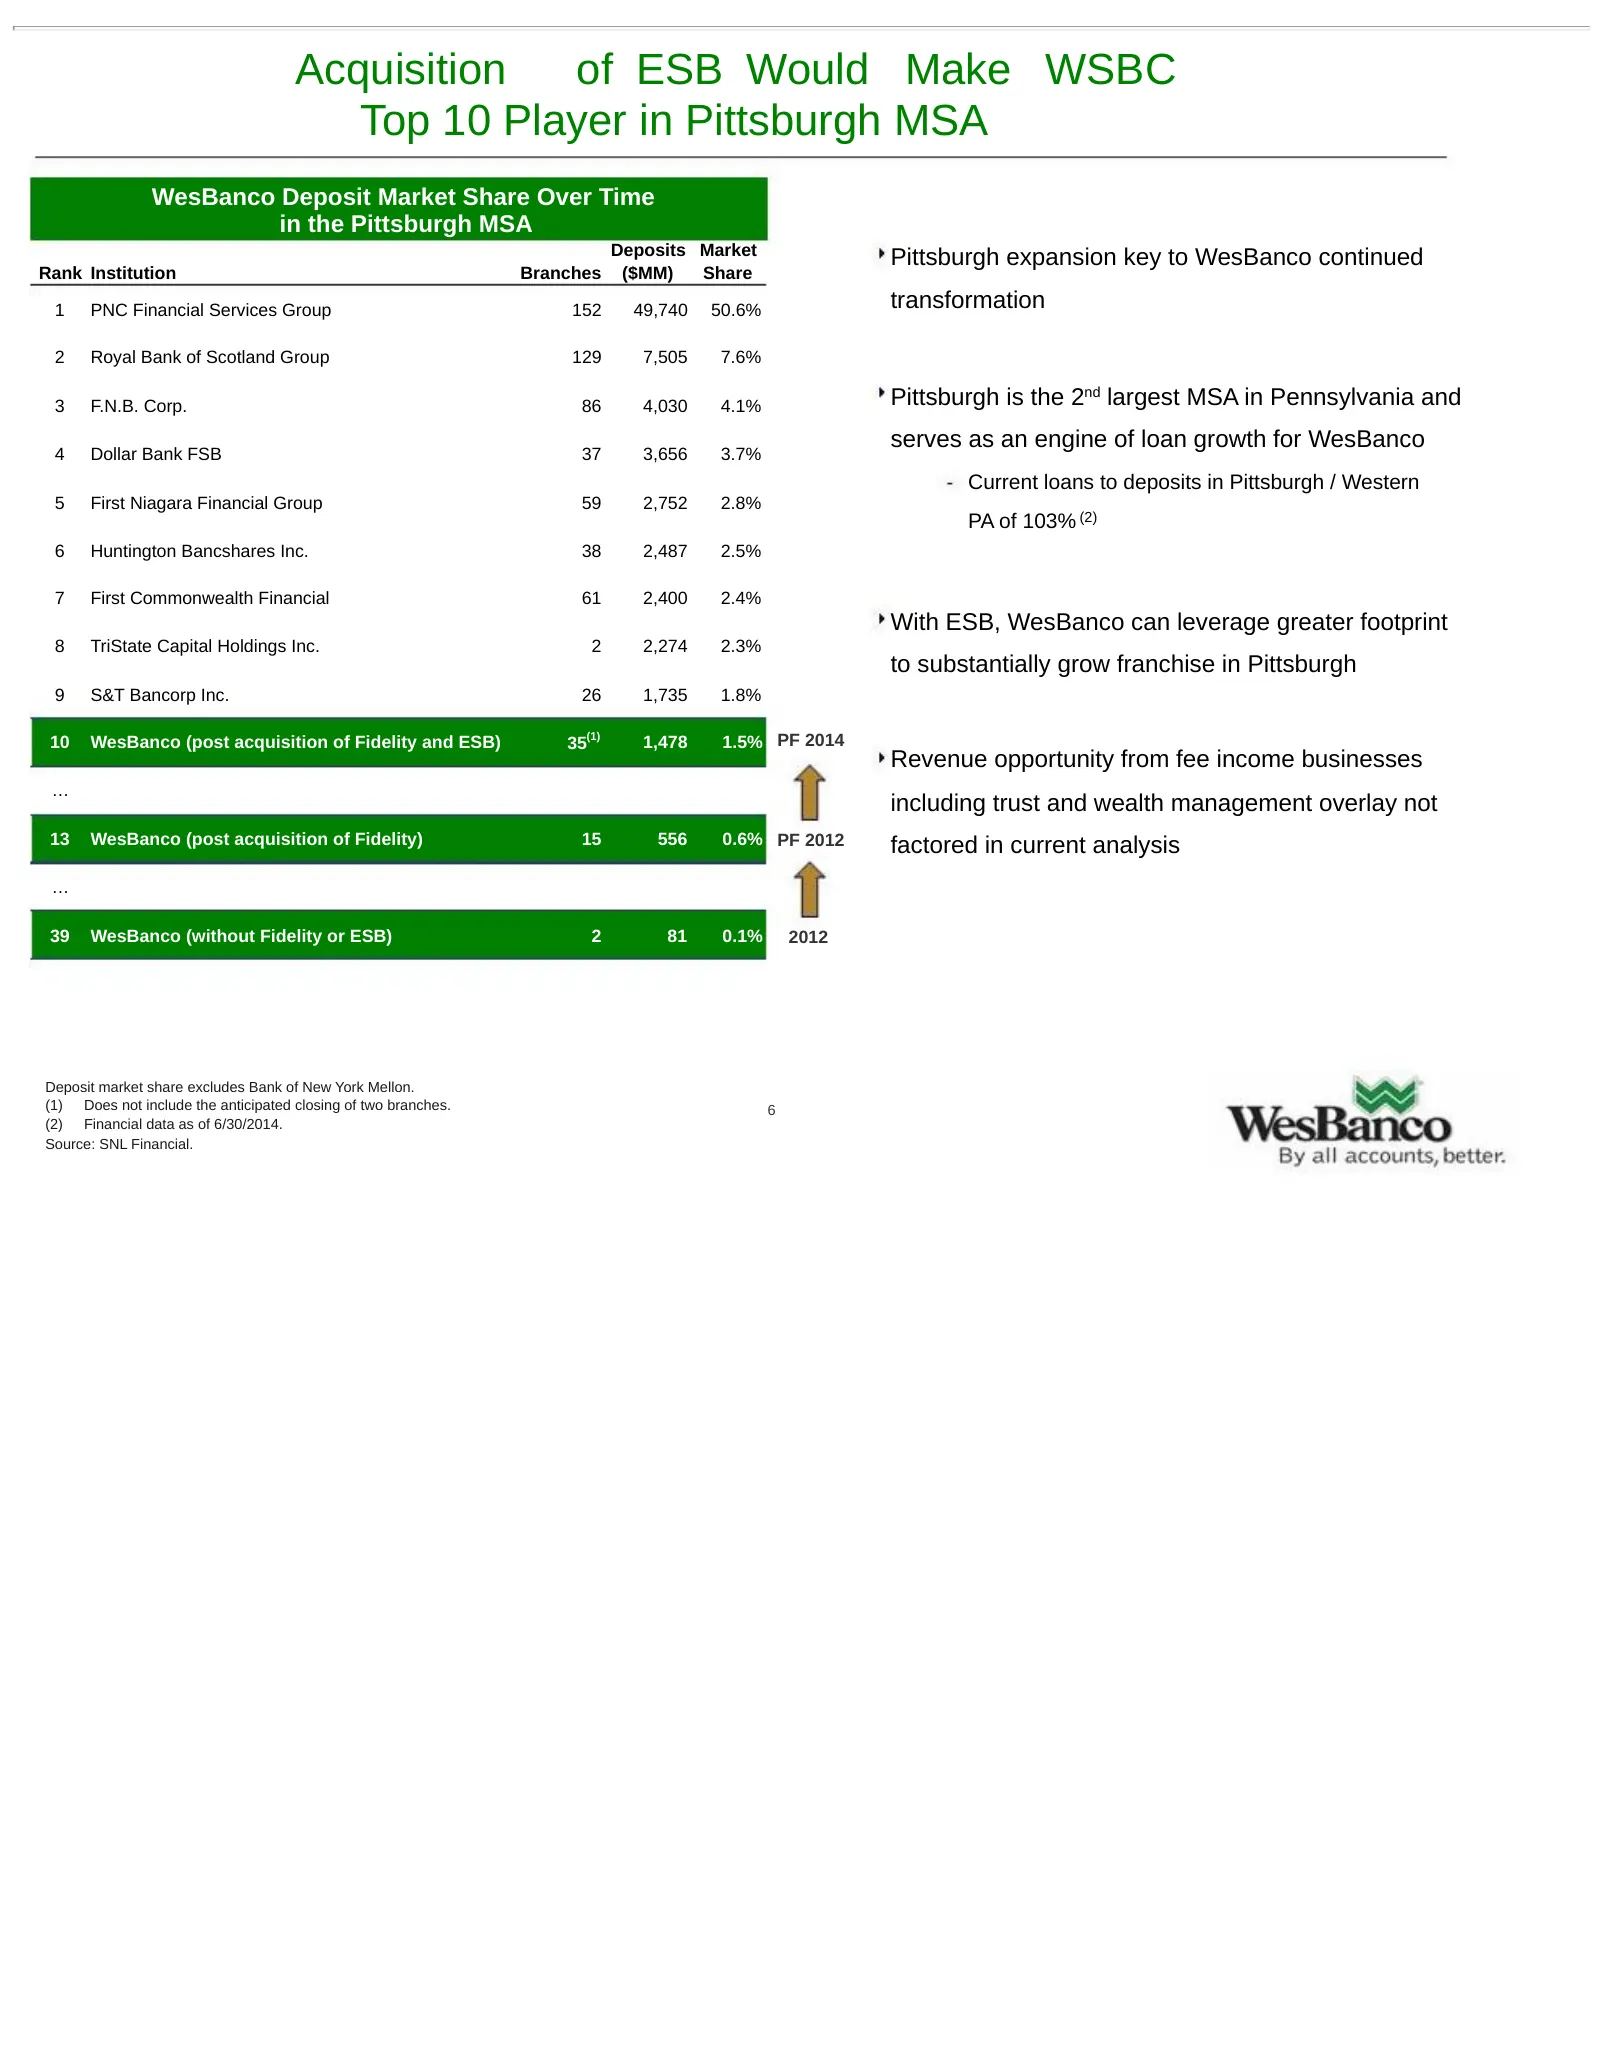
Acquisition of ESB Would Make WSBC Top 10 Player in Pittsburgh MSA WesBanco Deposit Market Share Over Time in the Pittsburgh MSA Deposits Market Pittsburgh expansion key to WesBanco continued Rank Institution Branches ($MM) Share 1 PNC Financial Services Group 152 49,740 50.6% transformation 2 Royal
Slide 7: Complementary Pro Forma Branch Map in Pittsburgh MSA / Western Pennsylvania
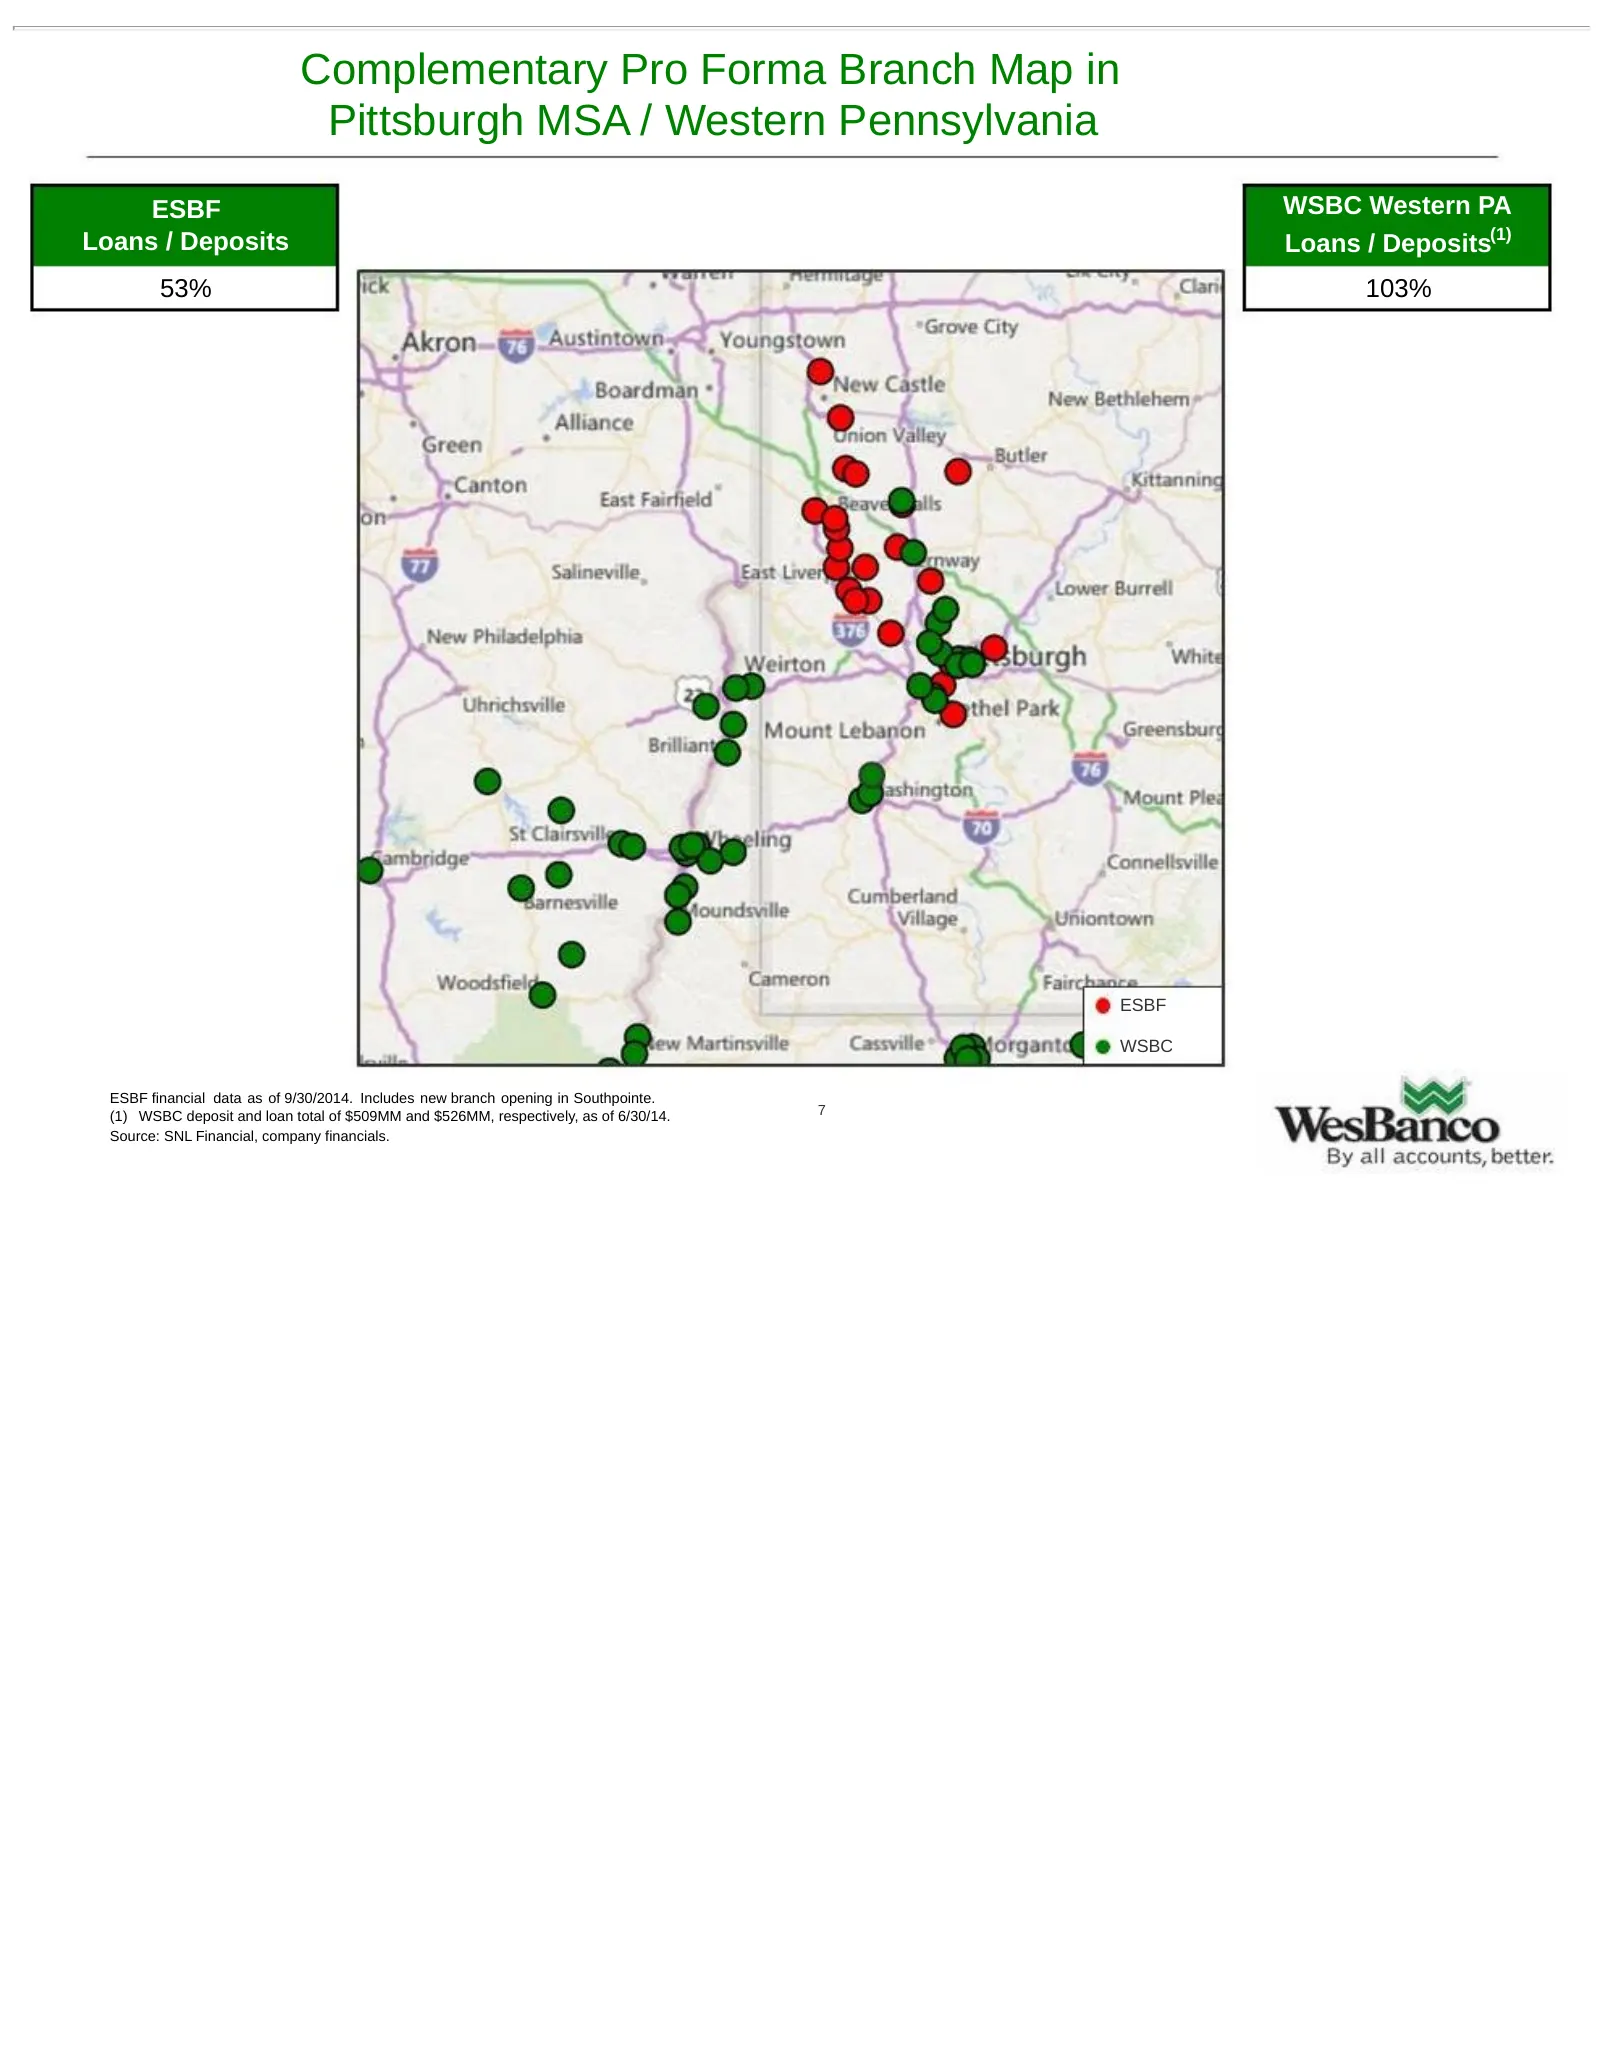
Complementary Pro Forma Branch Map in Pittsburgh MSA / Western Pennsylvania ESBF WSBC Western PA Loans / Deposits Loans / Deposits(1) 53% 103% ESBF WSBC ESBF financial data as of 9/30/2014. Includes new branch opening in Southpointe. (1) WSBC deposit and loan total of $509MM and $526MM, respectively
Slide 8: ESB Further Reinforces WesBanco Footprint in Marcellus/Utica Shale Play
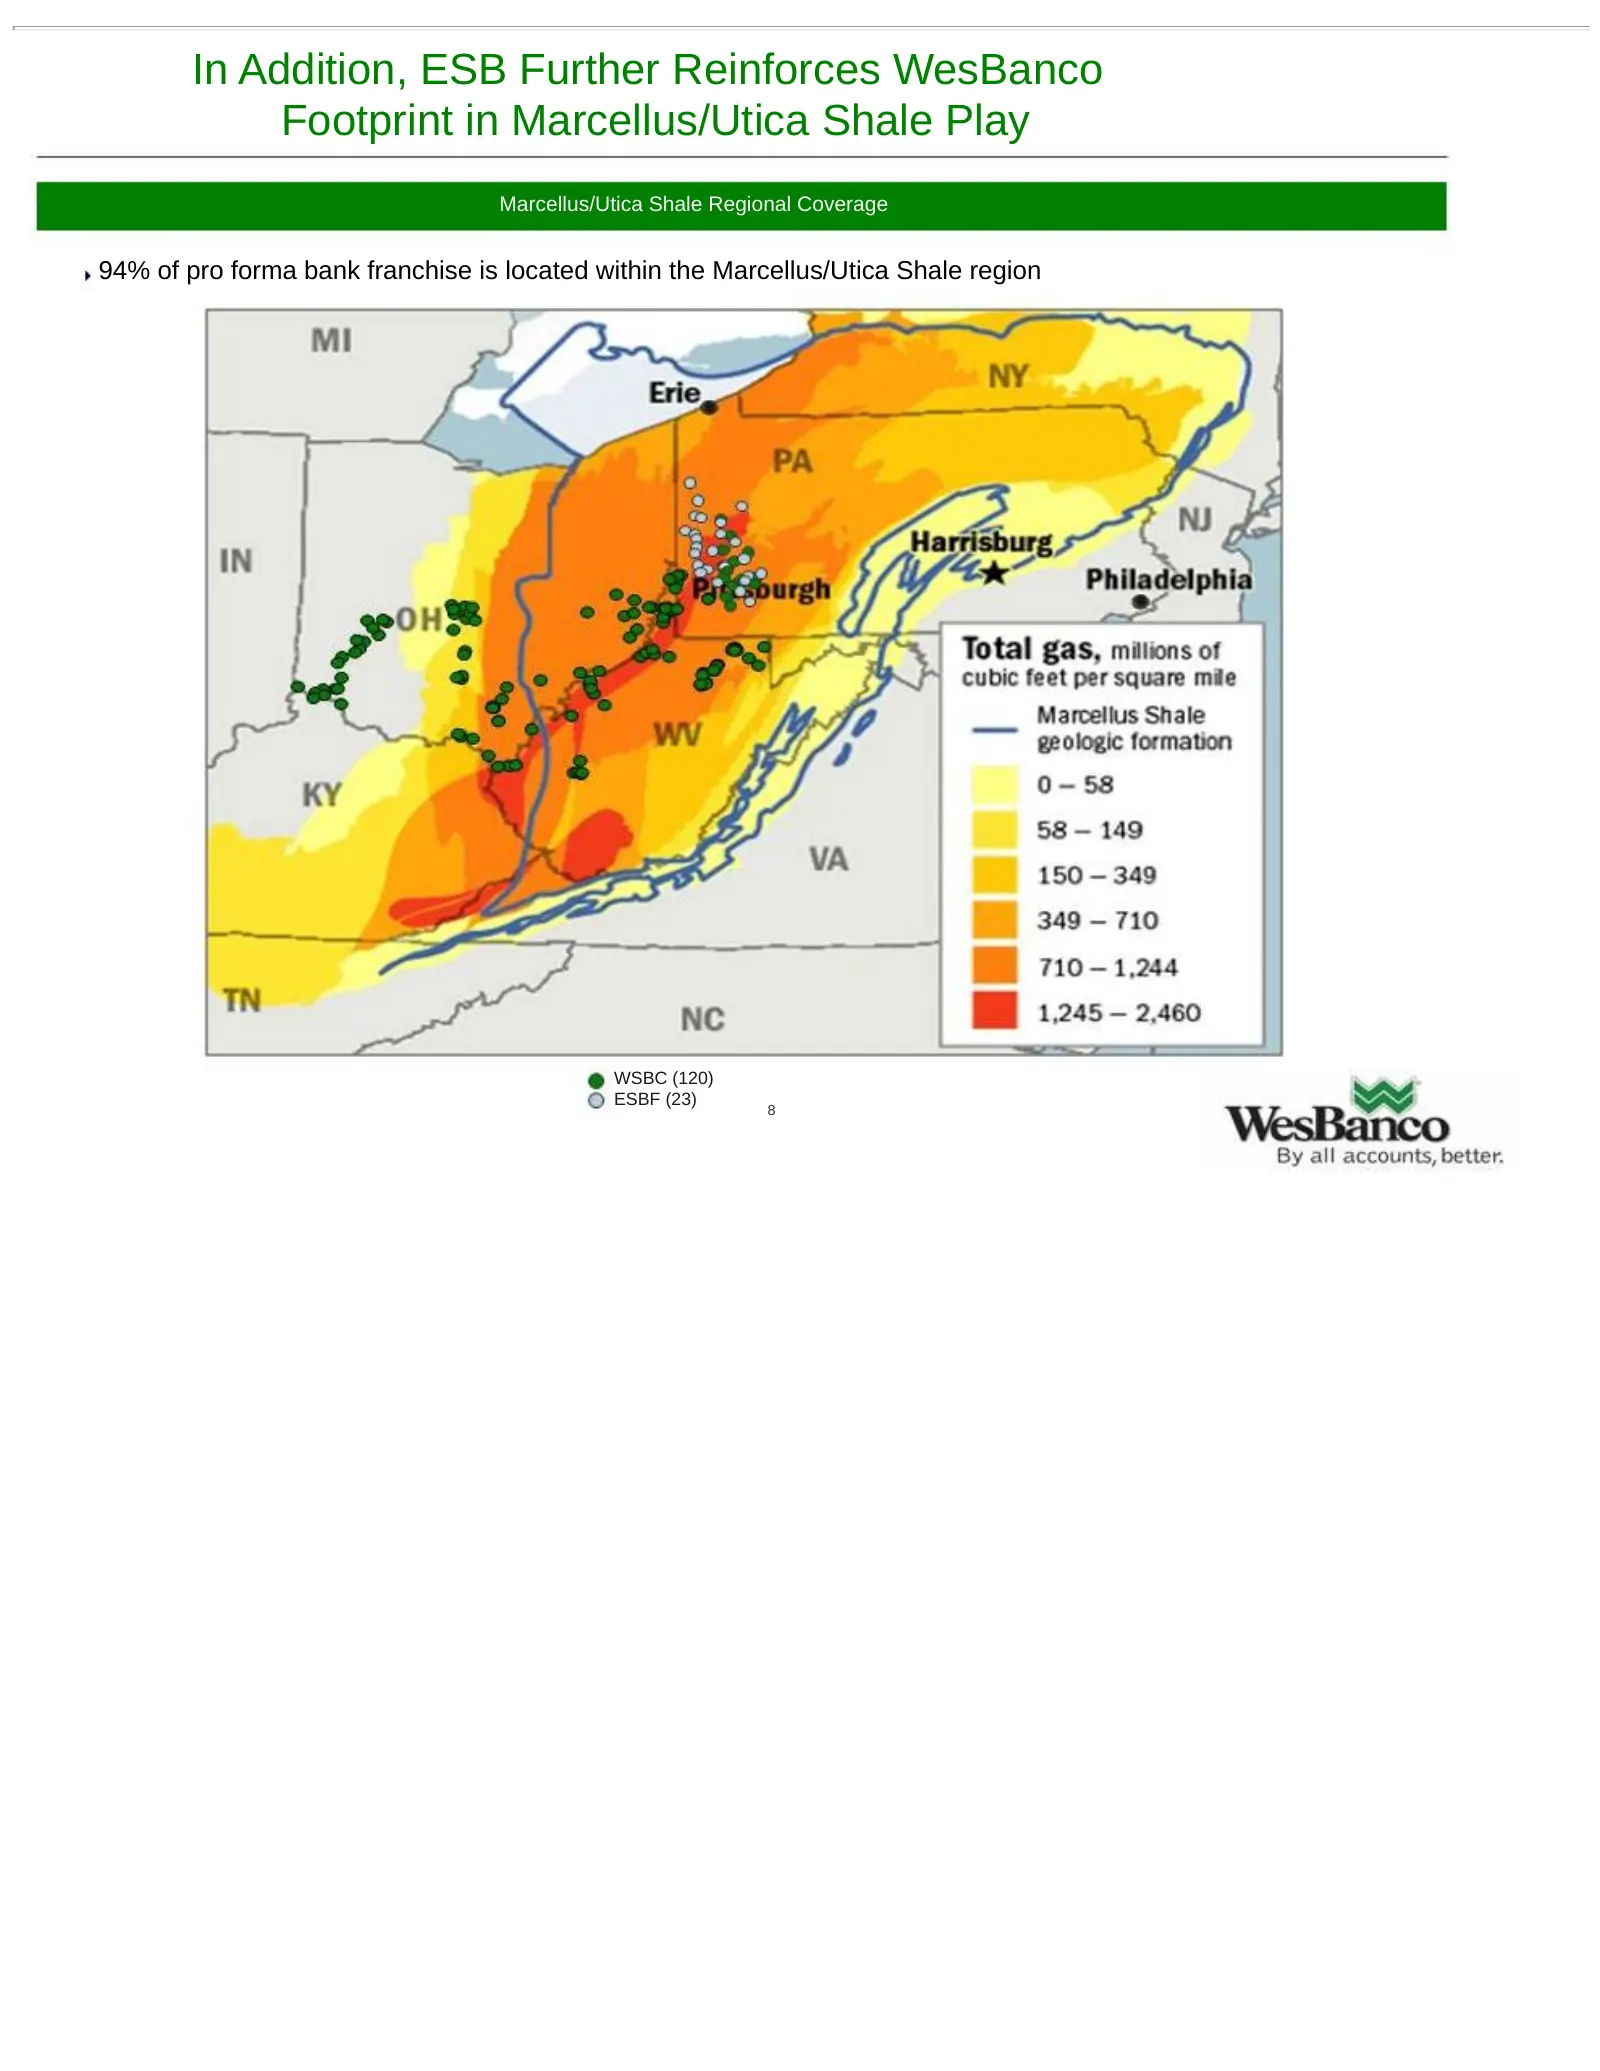
In Addition, ESB Further Reinforces WesBanco Footprint in Marcellus/Utica Shale Play Marcellus/Utica Shale Regional Coverage 94% of pro forma bank franchise is located within the Marcellus/Utica Shale region WSBC (120) ESBF (23) 8
Slide 9: Pittsburgh / Western PA Would Comprise Almost 30% of WesBanco's Franchise
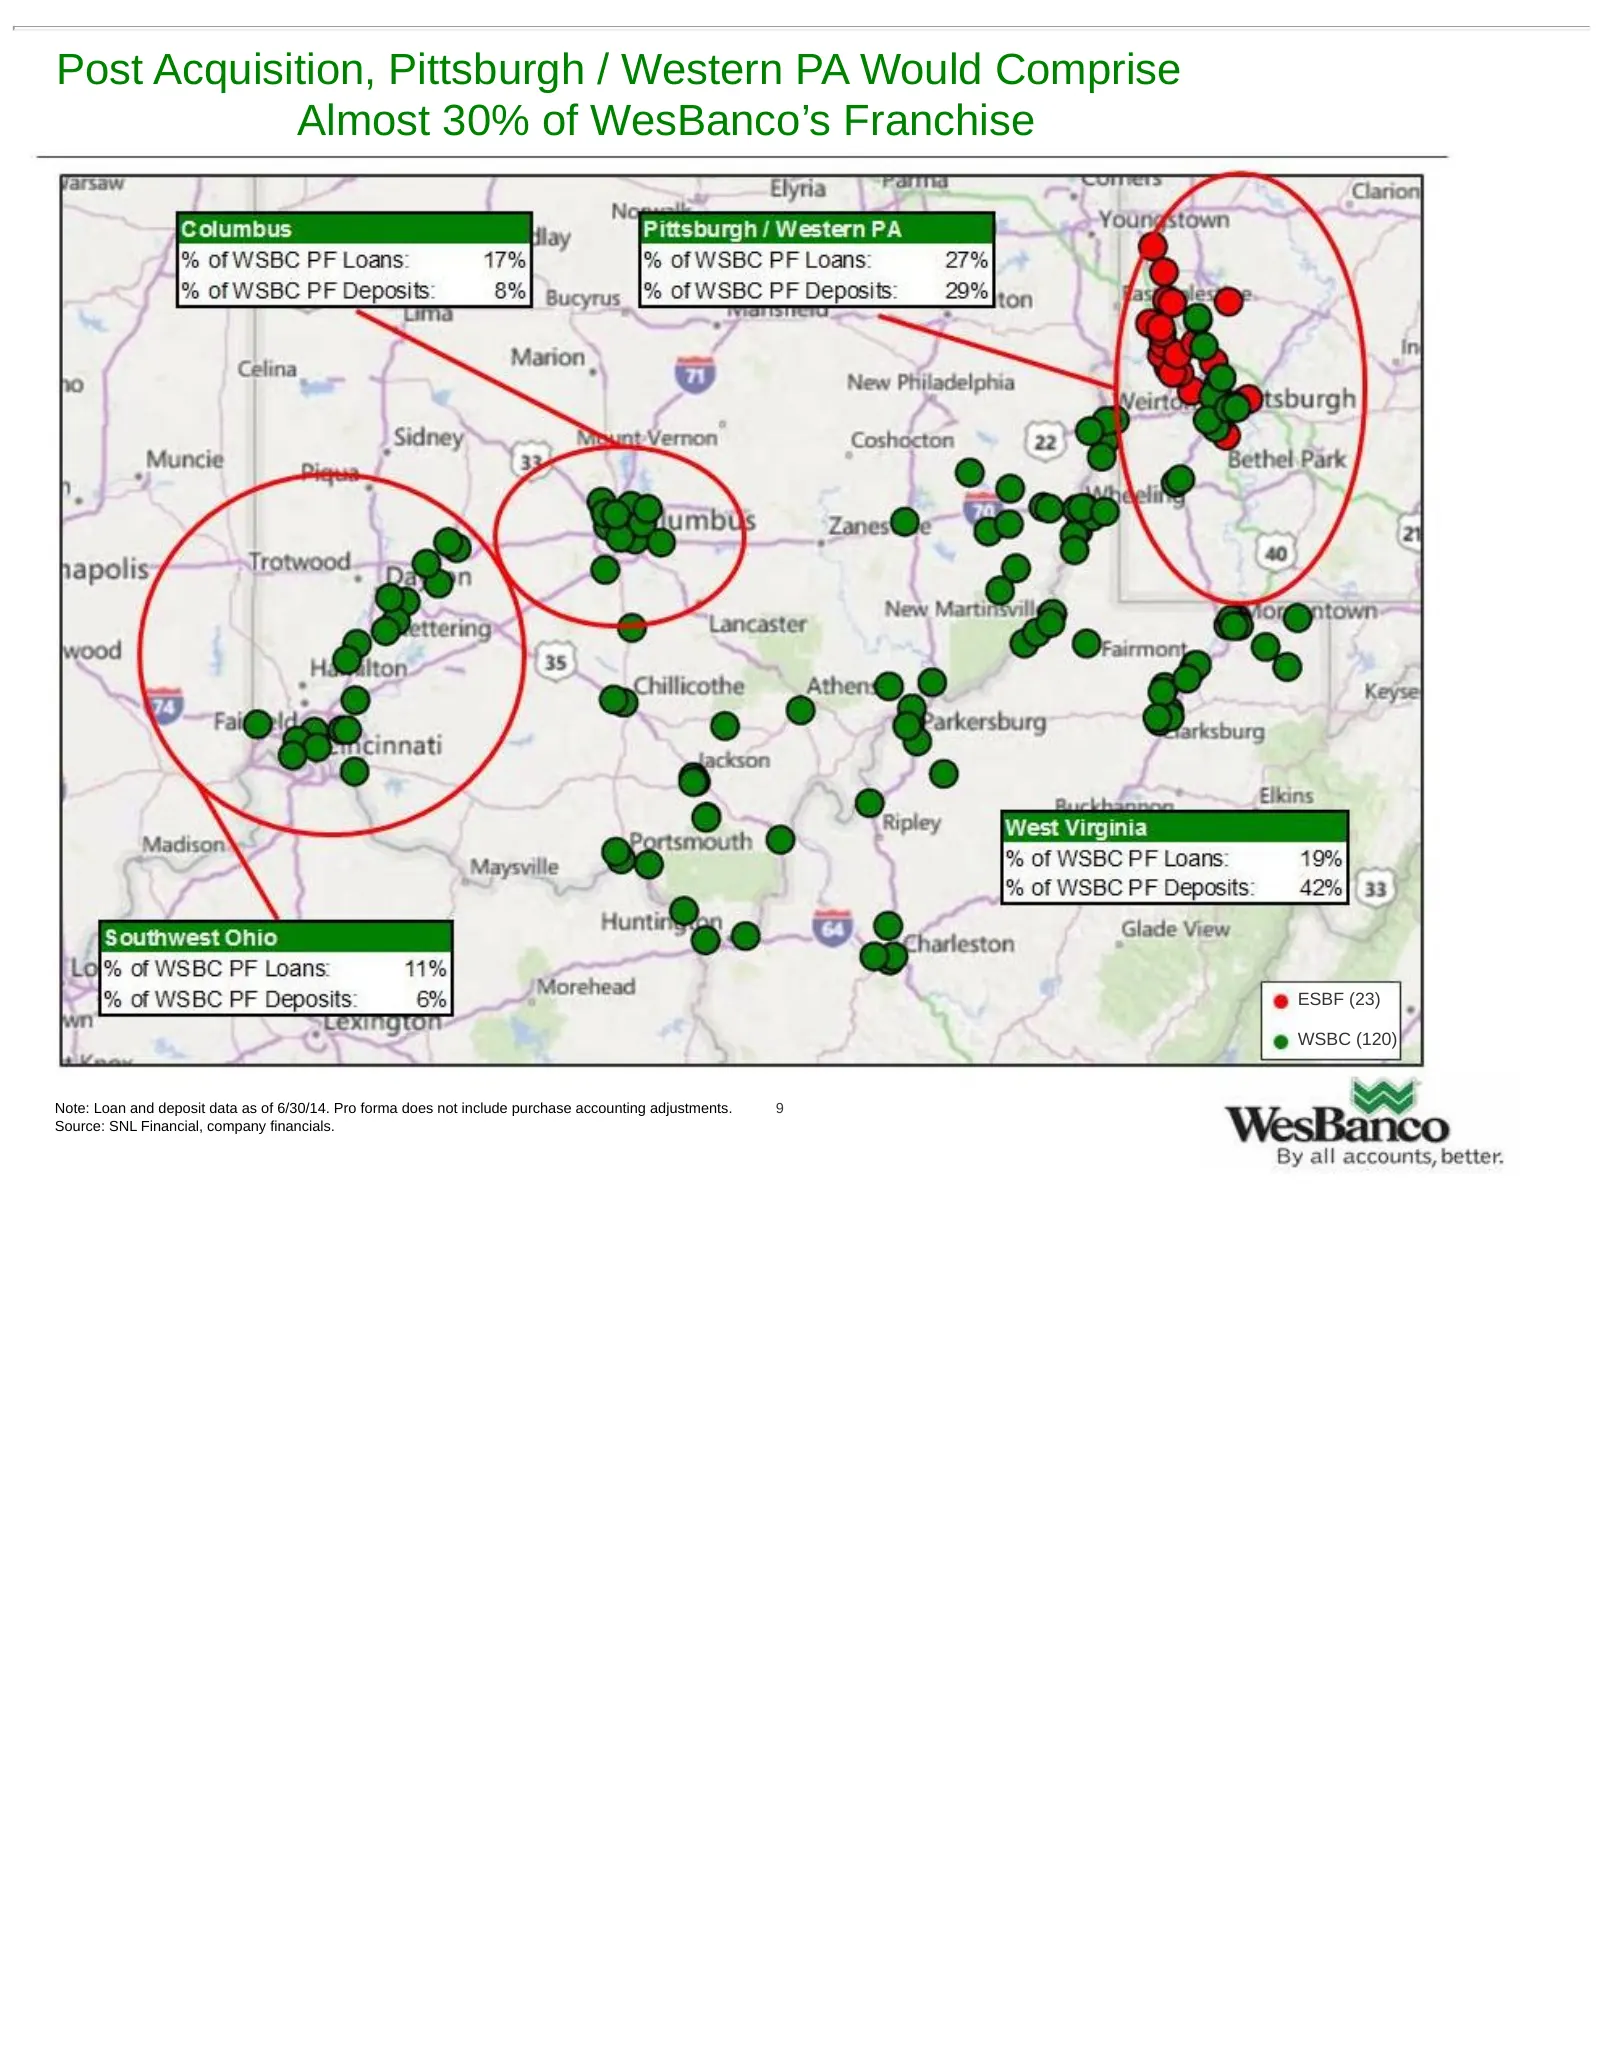
Post Acquisition, Pittsburgh / Western PA Would Comprise Almost 30% of WesBanco’s Franchise ESBF (23) WSBC (120) Note: Loan and deposit data as of 6/30/14. Pro forma does not include purchase accounting adjustments. 9 Source: SNL Financial, company financials.
Slide 10: Pittsburgh Continues to be a Vibrant Market
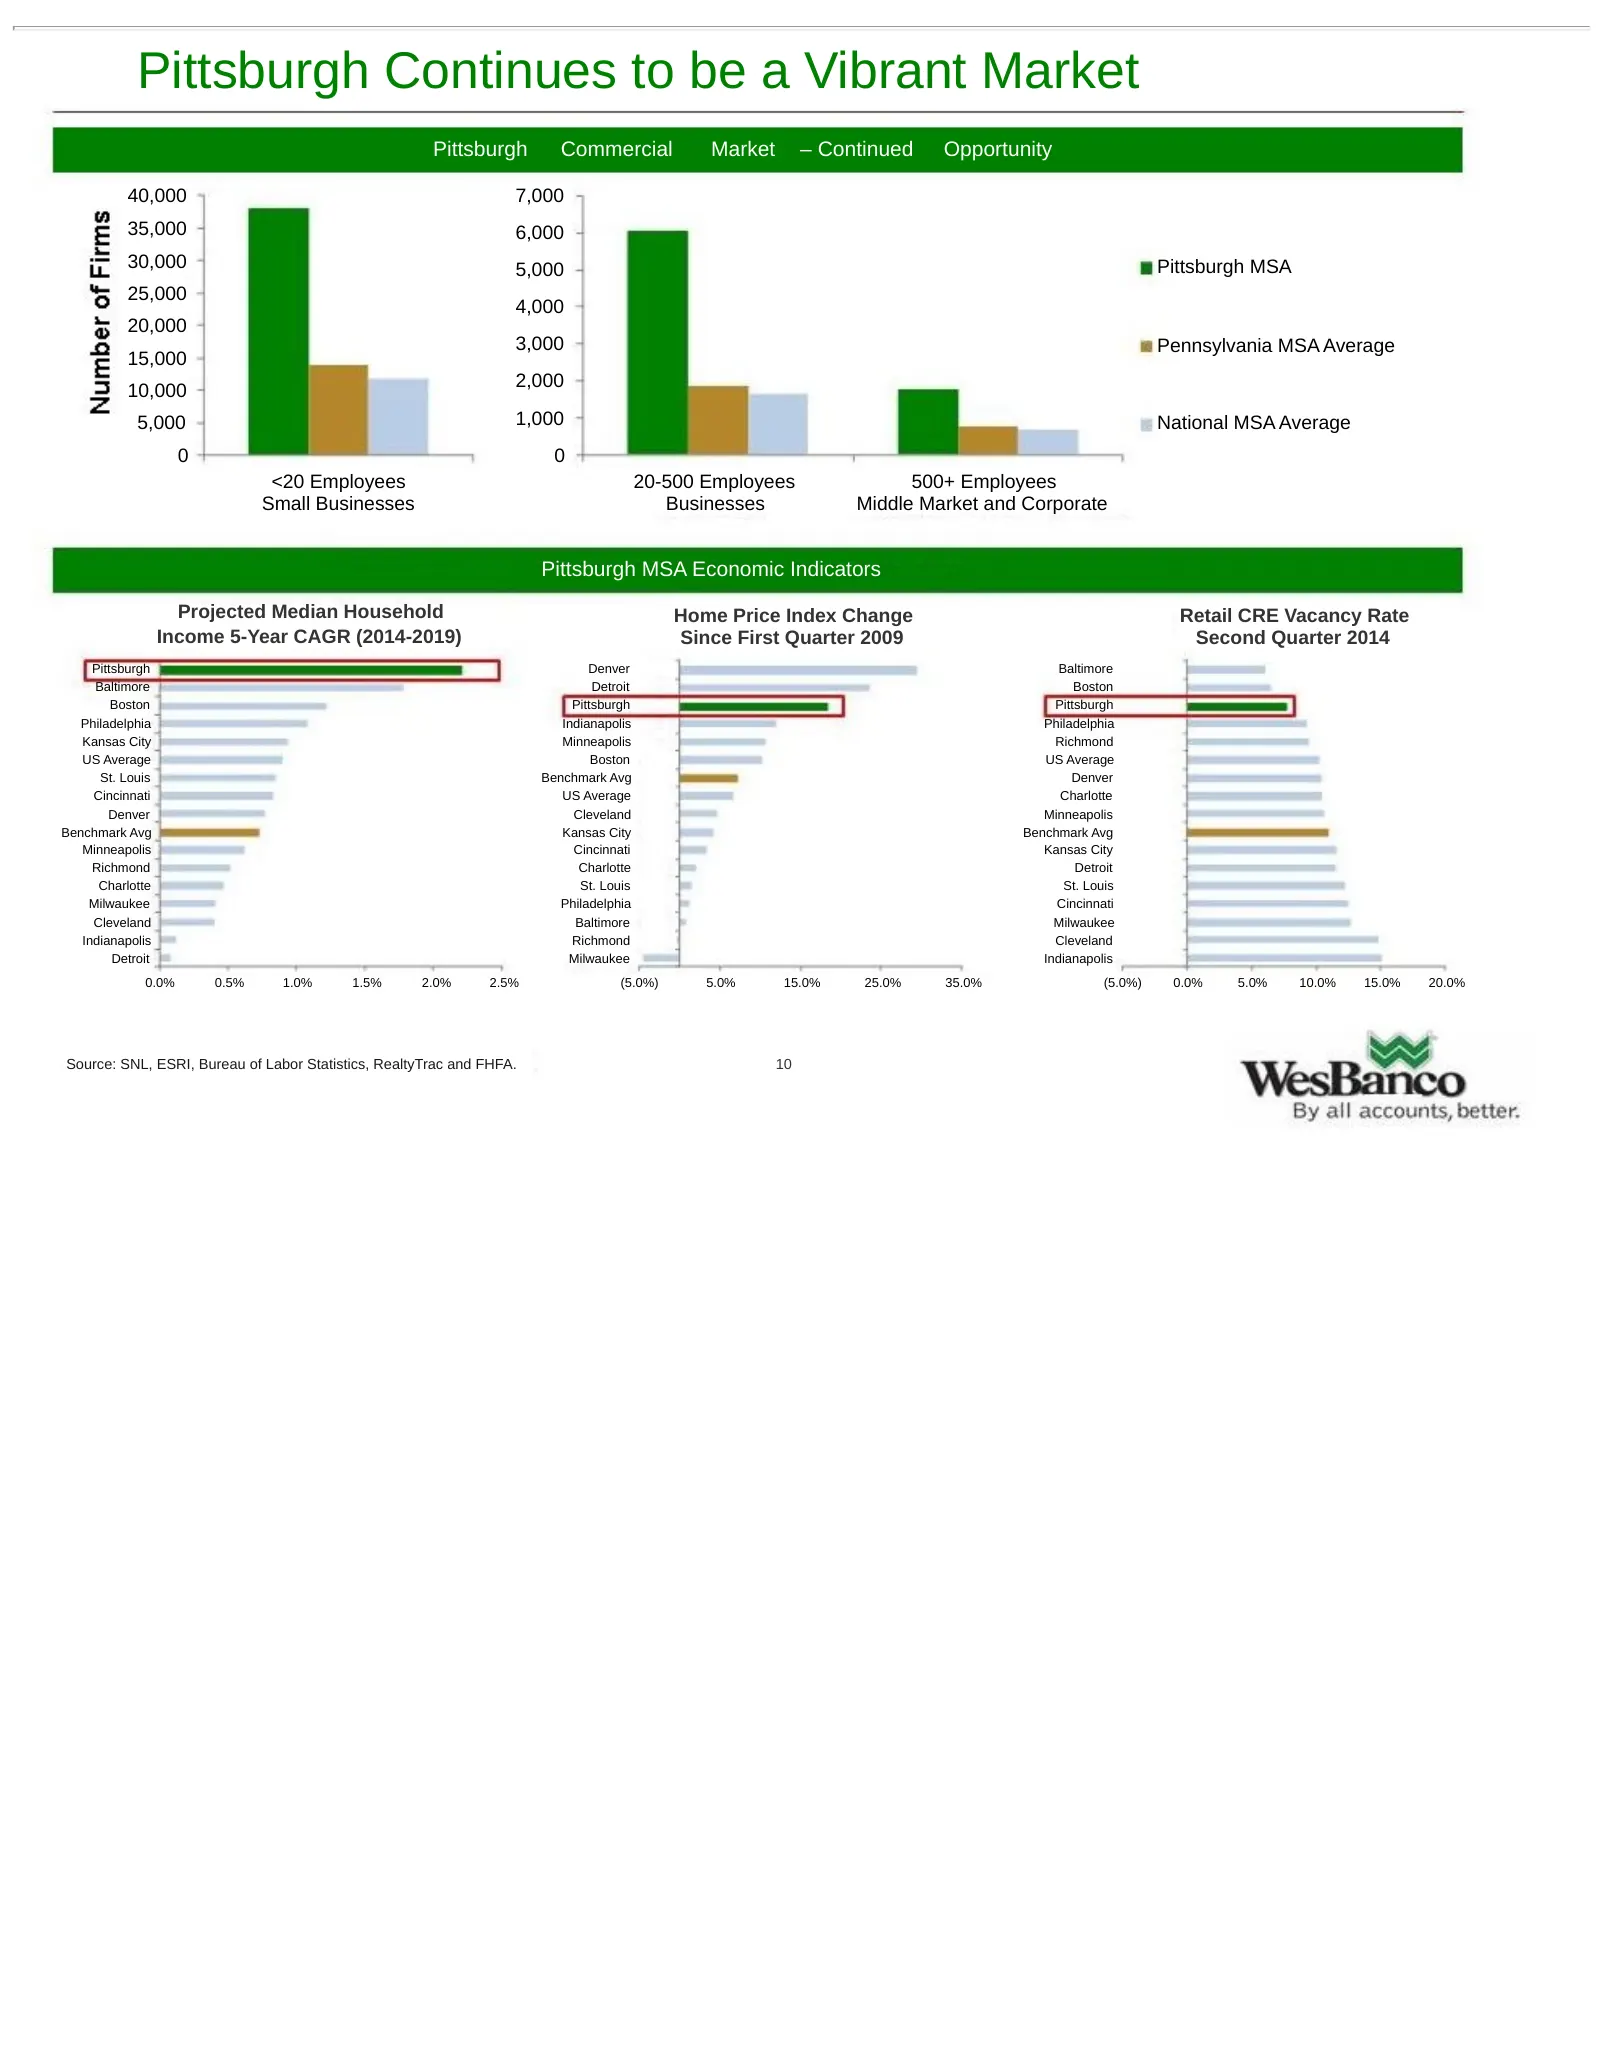
Pittsburgh Continues to be a Vibrant Market Pittsburgh Commercial Market – Continued Opportunity 40,000 7,000 35,000 6,000 30,000 5,000 Pittsburgh MSA 25,000 4,000 20,000 3,000 Pennsylvania MSA Average 15,000 2,000 10,000 5,000 1,000 National MSA Average 0 0 <20 Employees 20-500 Employees 500+ Emplo
Slide 11: Pro Forma Financial Impact
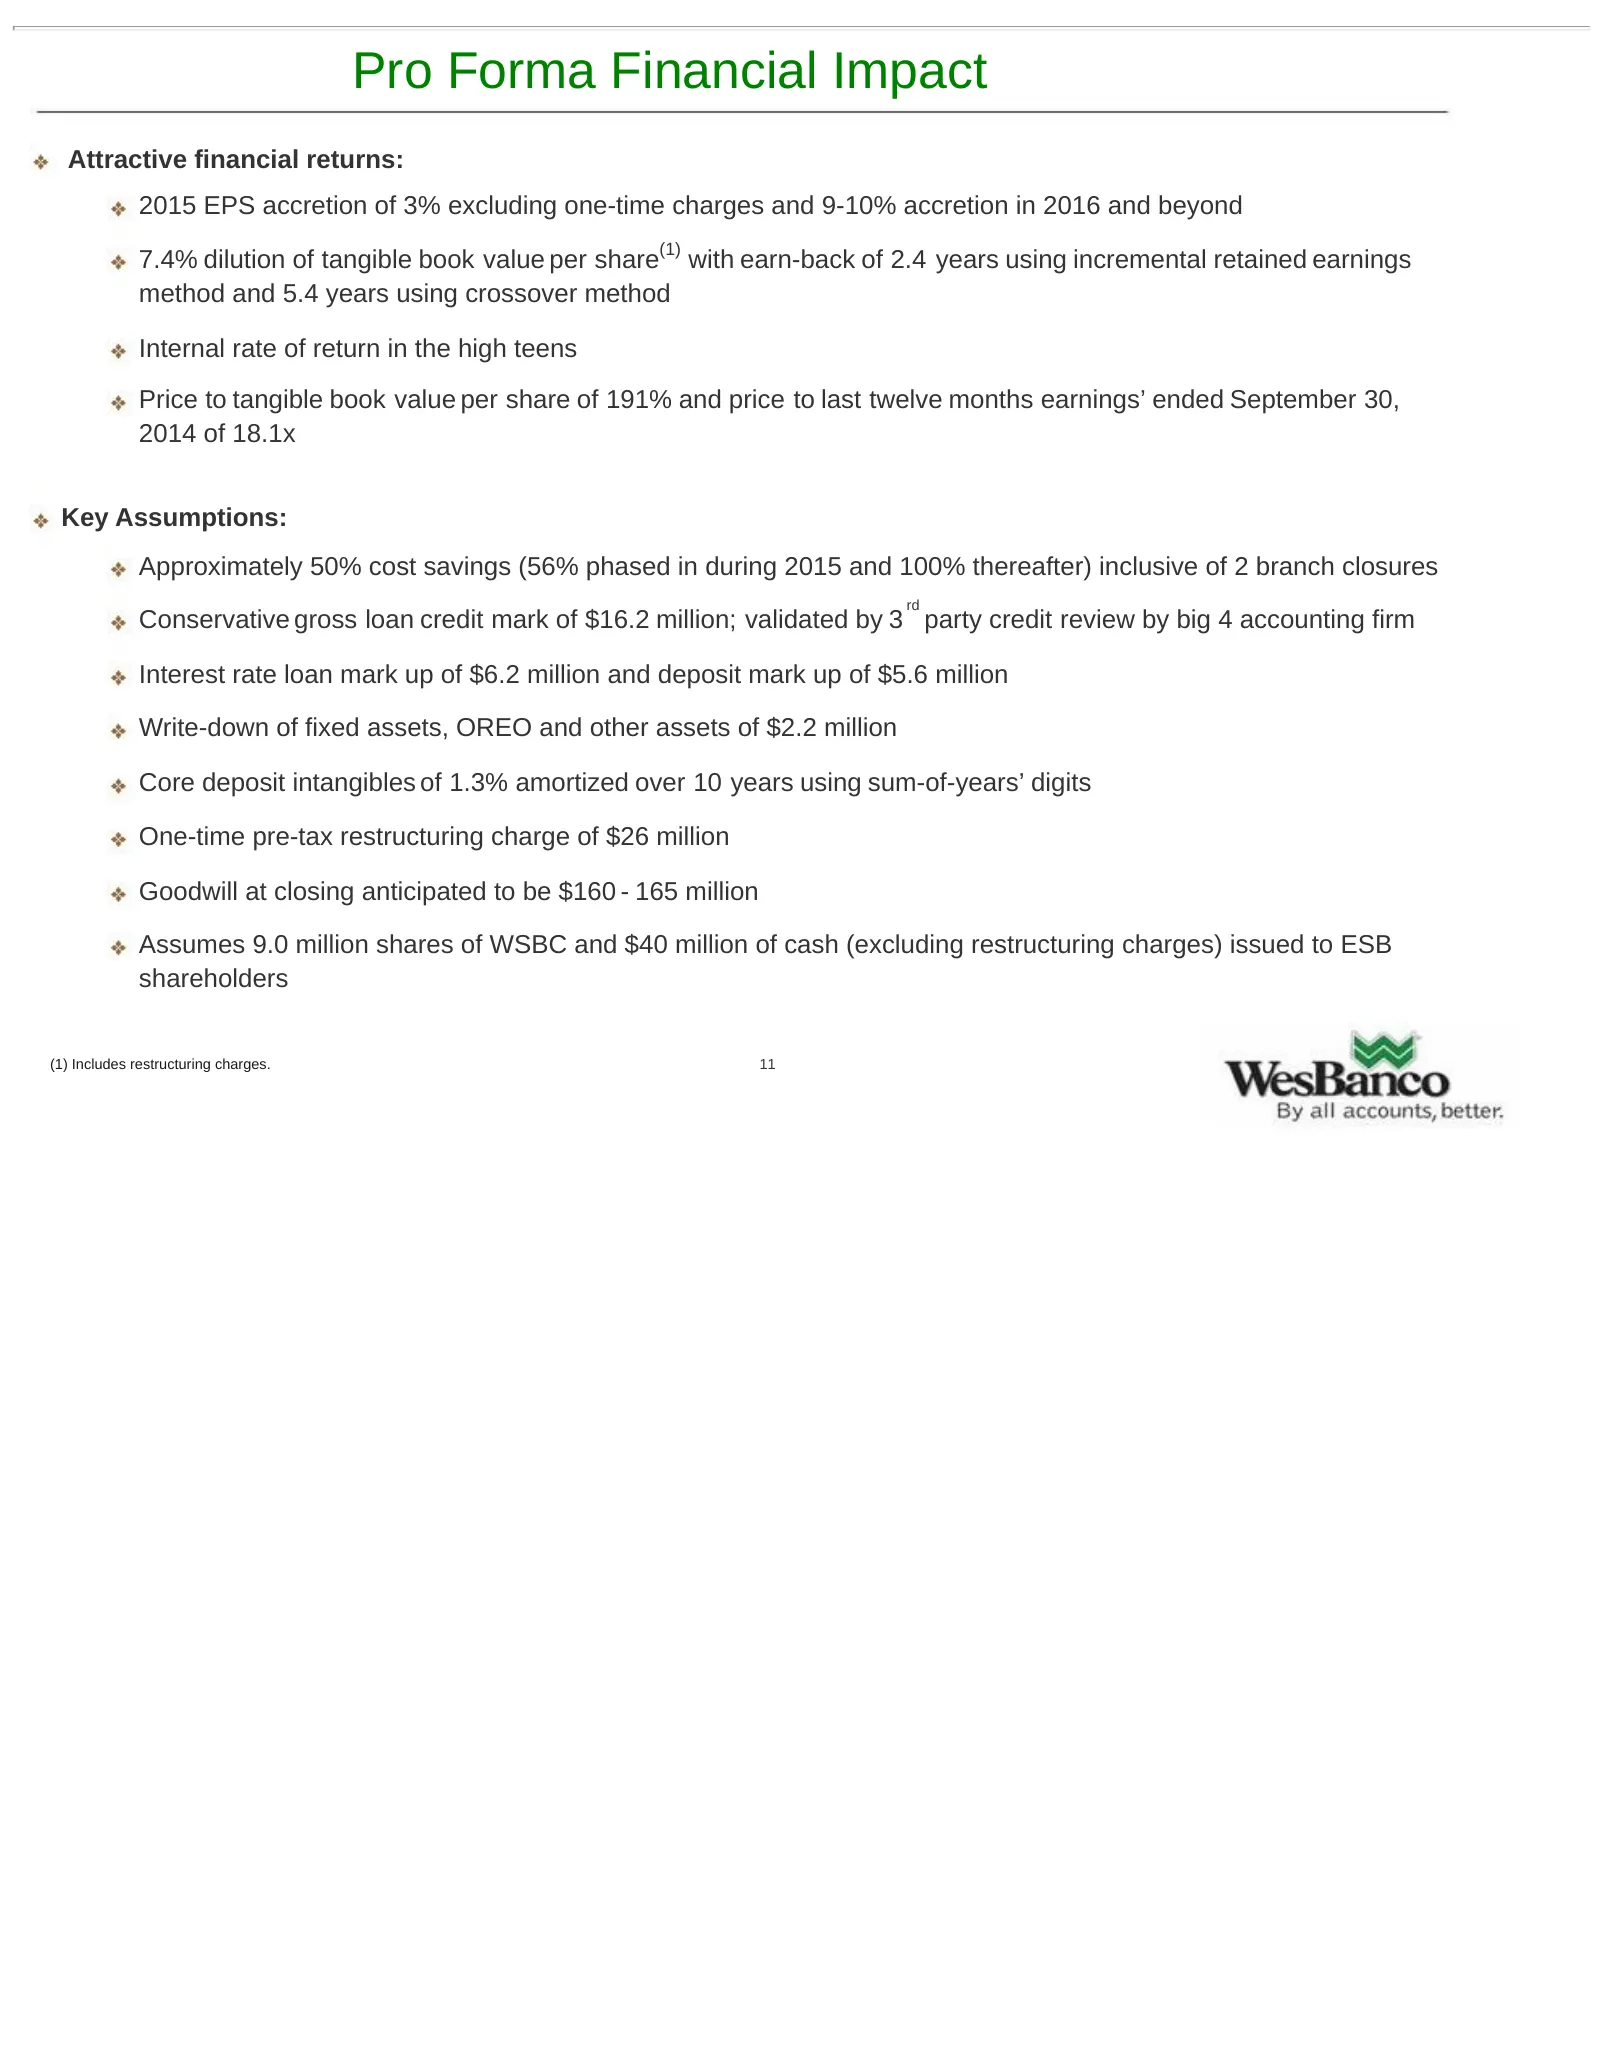
Pro Forma Financial Impact Attractive financial returns: 2015 EPS accretion of 3% excluding one-time charges and 9-10% accretion in 2016 and beyond (1) 7.4% dilution of tangible book value per share with earn-back of 2.4 years using incremental retained earnings method and 5.4 years using crossover
Slide 12: Cost Savings Largely Driven By Elimination of Executive Officers, Back-Office Synergies and Branch Closures
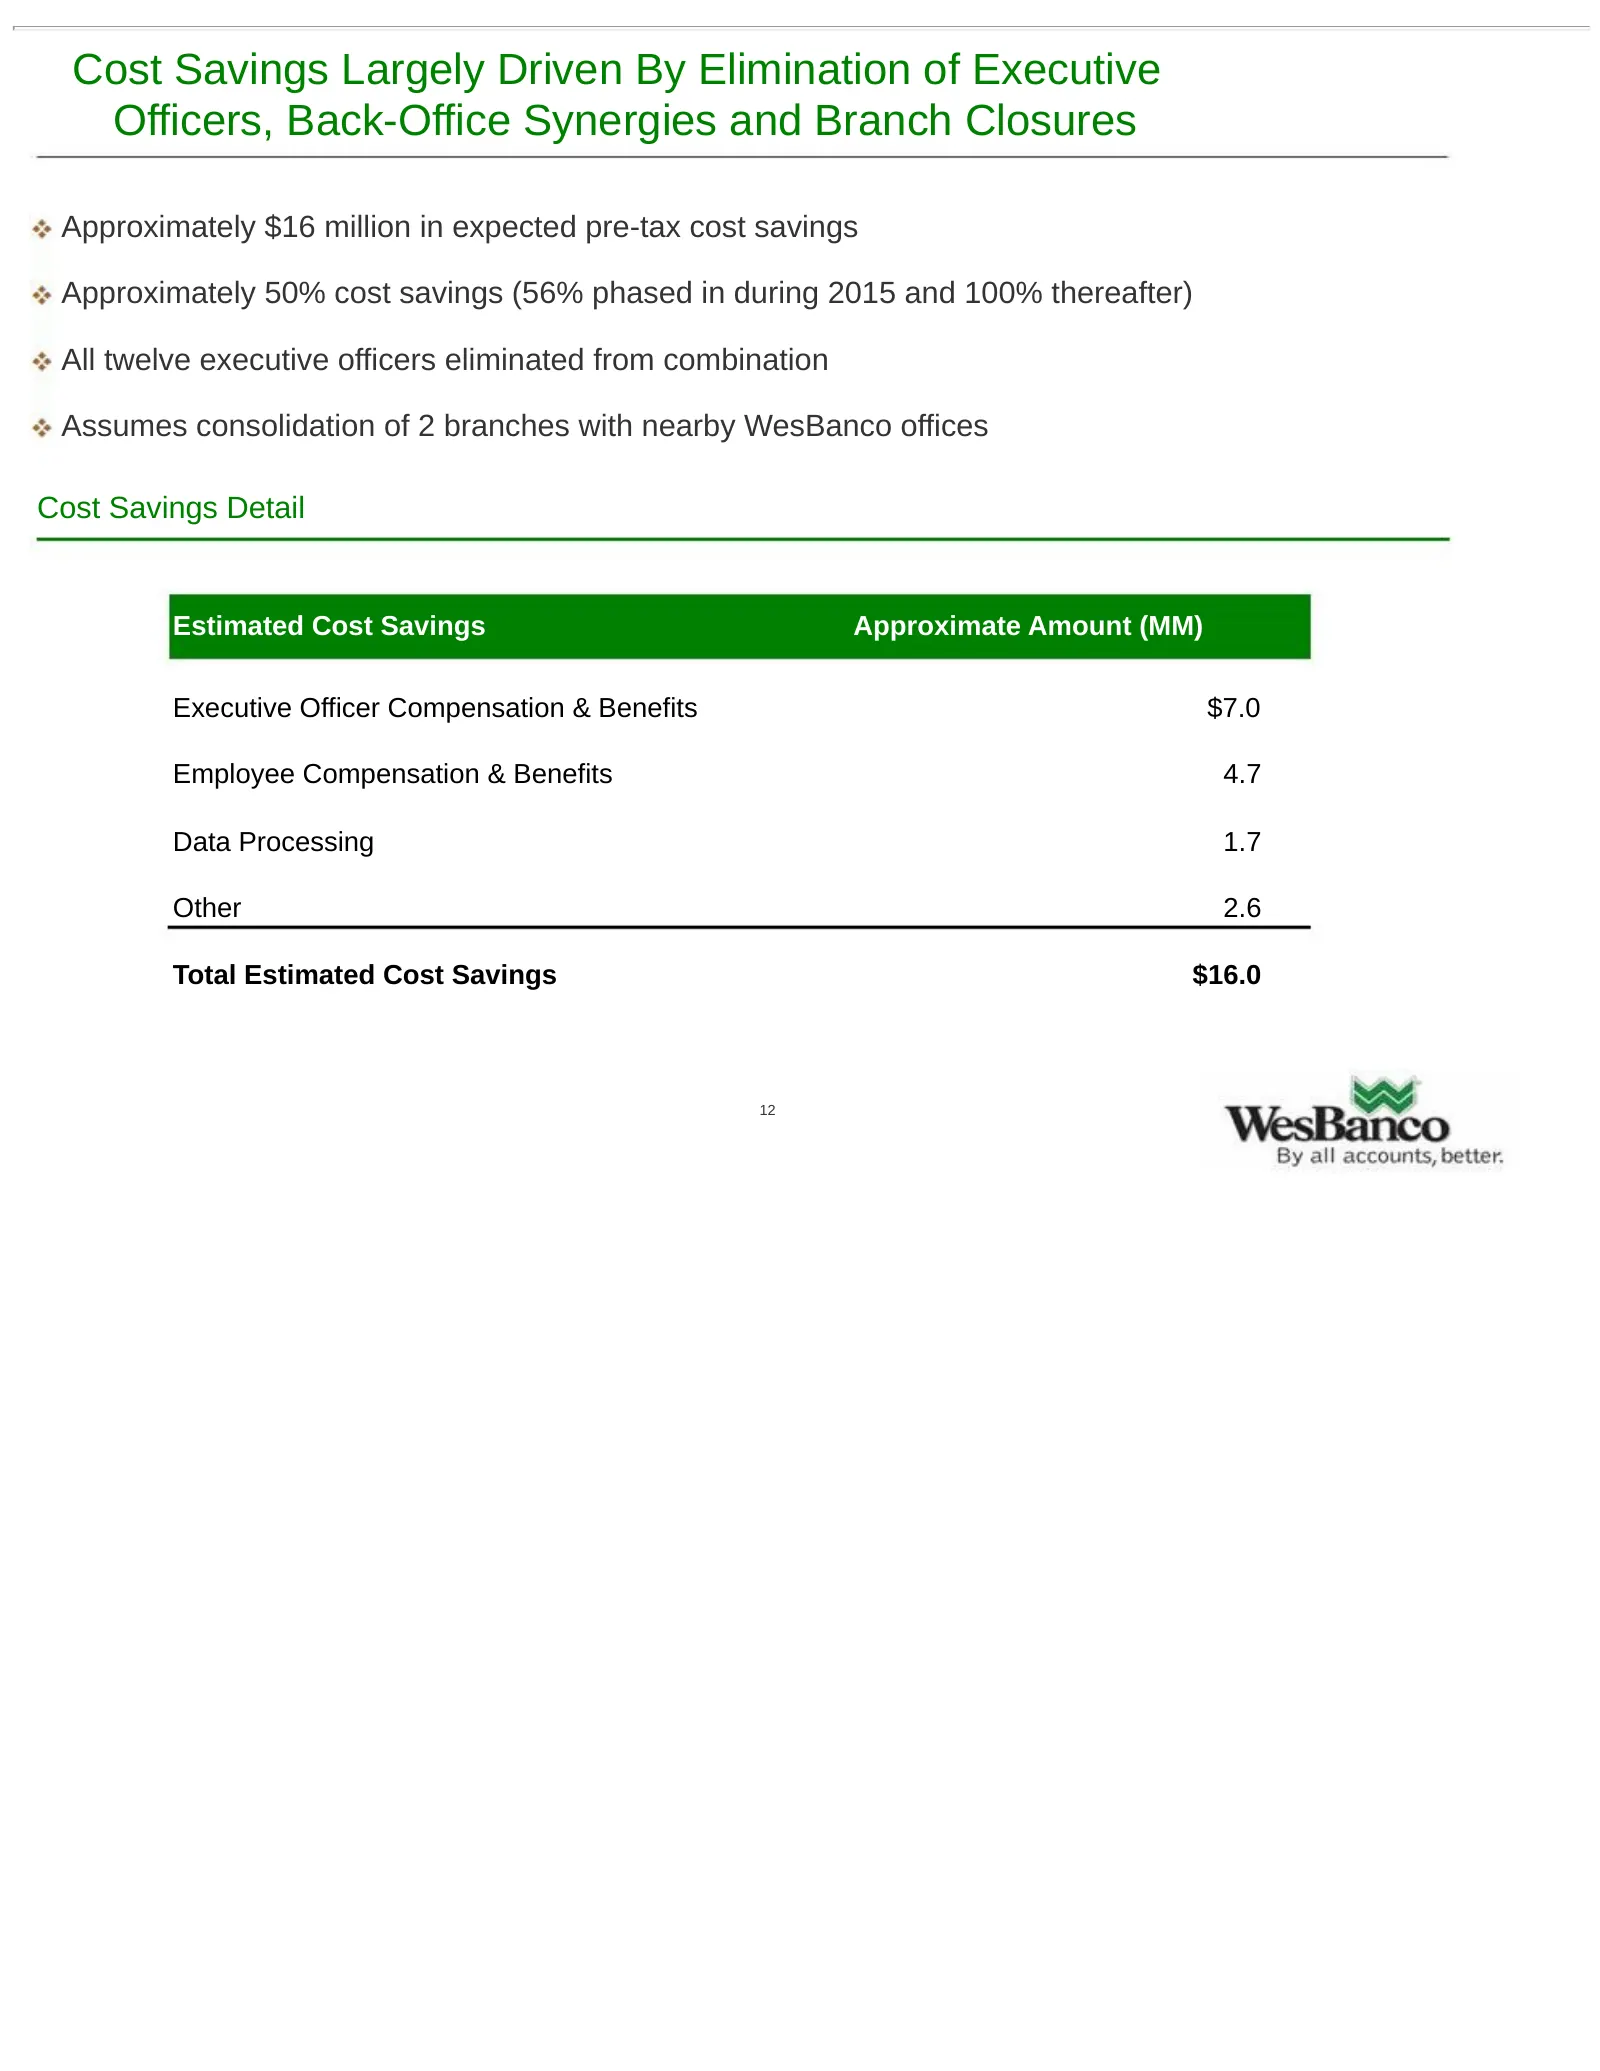
Cost Savings Largely Driven By Elimination of Executive Officers, Back-Office Synergies and Branch Closures Approximately $16 million in expected pre-tax cost savings Approximately 50% cost savings (56% phased in during 2015 and 100% thereafter) All twelve executive officers eliminated from combinat
Slide 13: Pro Forma Capital Ratios Remain Strong
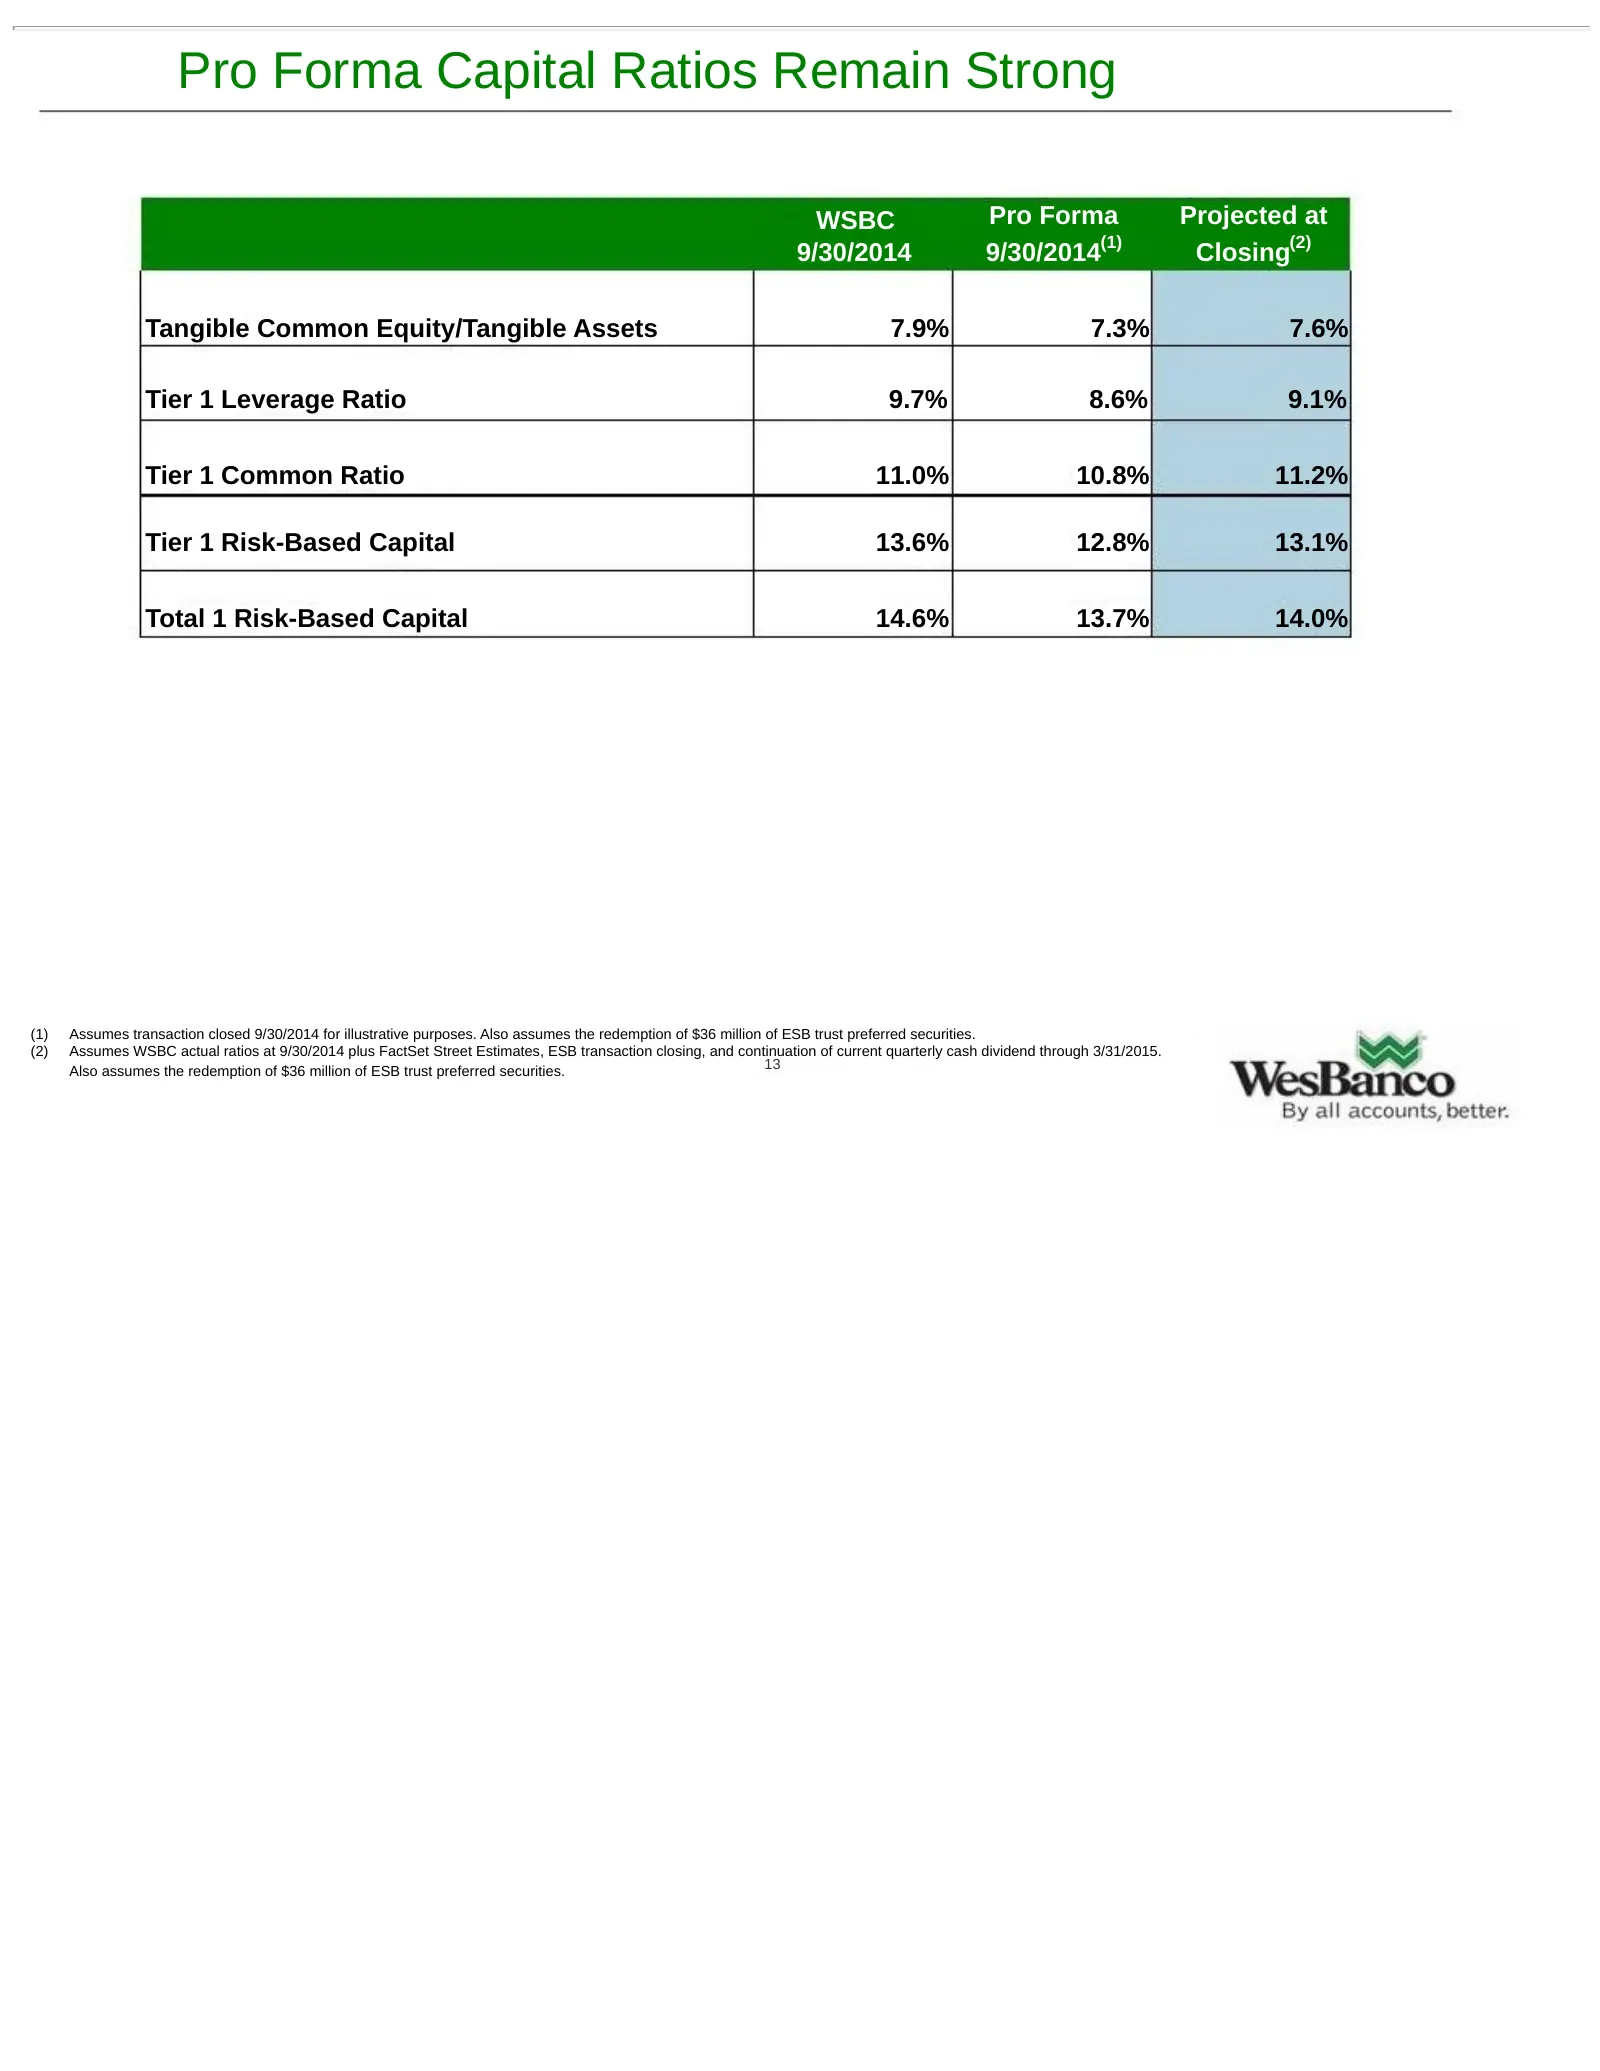
Pro Forma Capital Ratios Remain Strong WSBC Pro Forma Projected at 9/30/2014 9/30/2014(1) Closing(2) Tangible Common Equity/Tangible Assets 7.9% 7.3% 7.6% Tier 1 Leverage Ratio 9.7% 8.6% 9.1% Tier 1 Common Ratio 11.0% 10.8% 11.2% Tier 1 Risk-Based Capital 13.6% 12.8% 13.1% Total 1 Risk-Based Capital
Slide 14: Pricing In Line With Relevant Deals
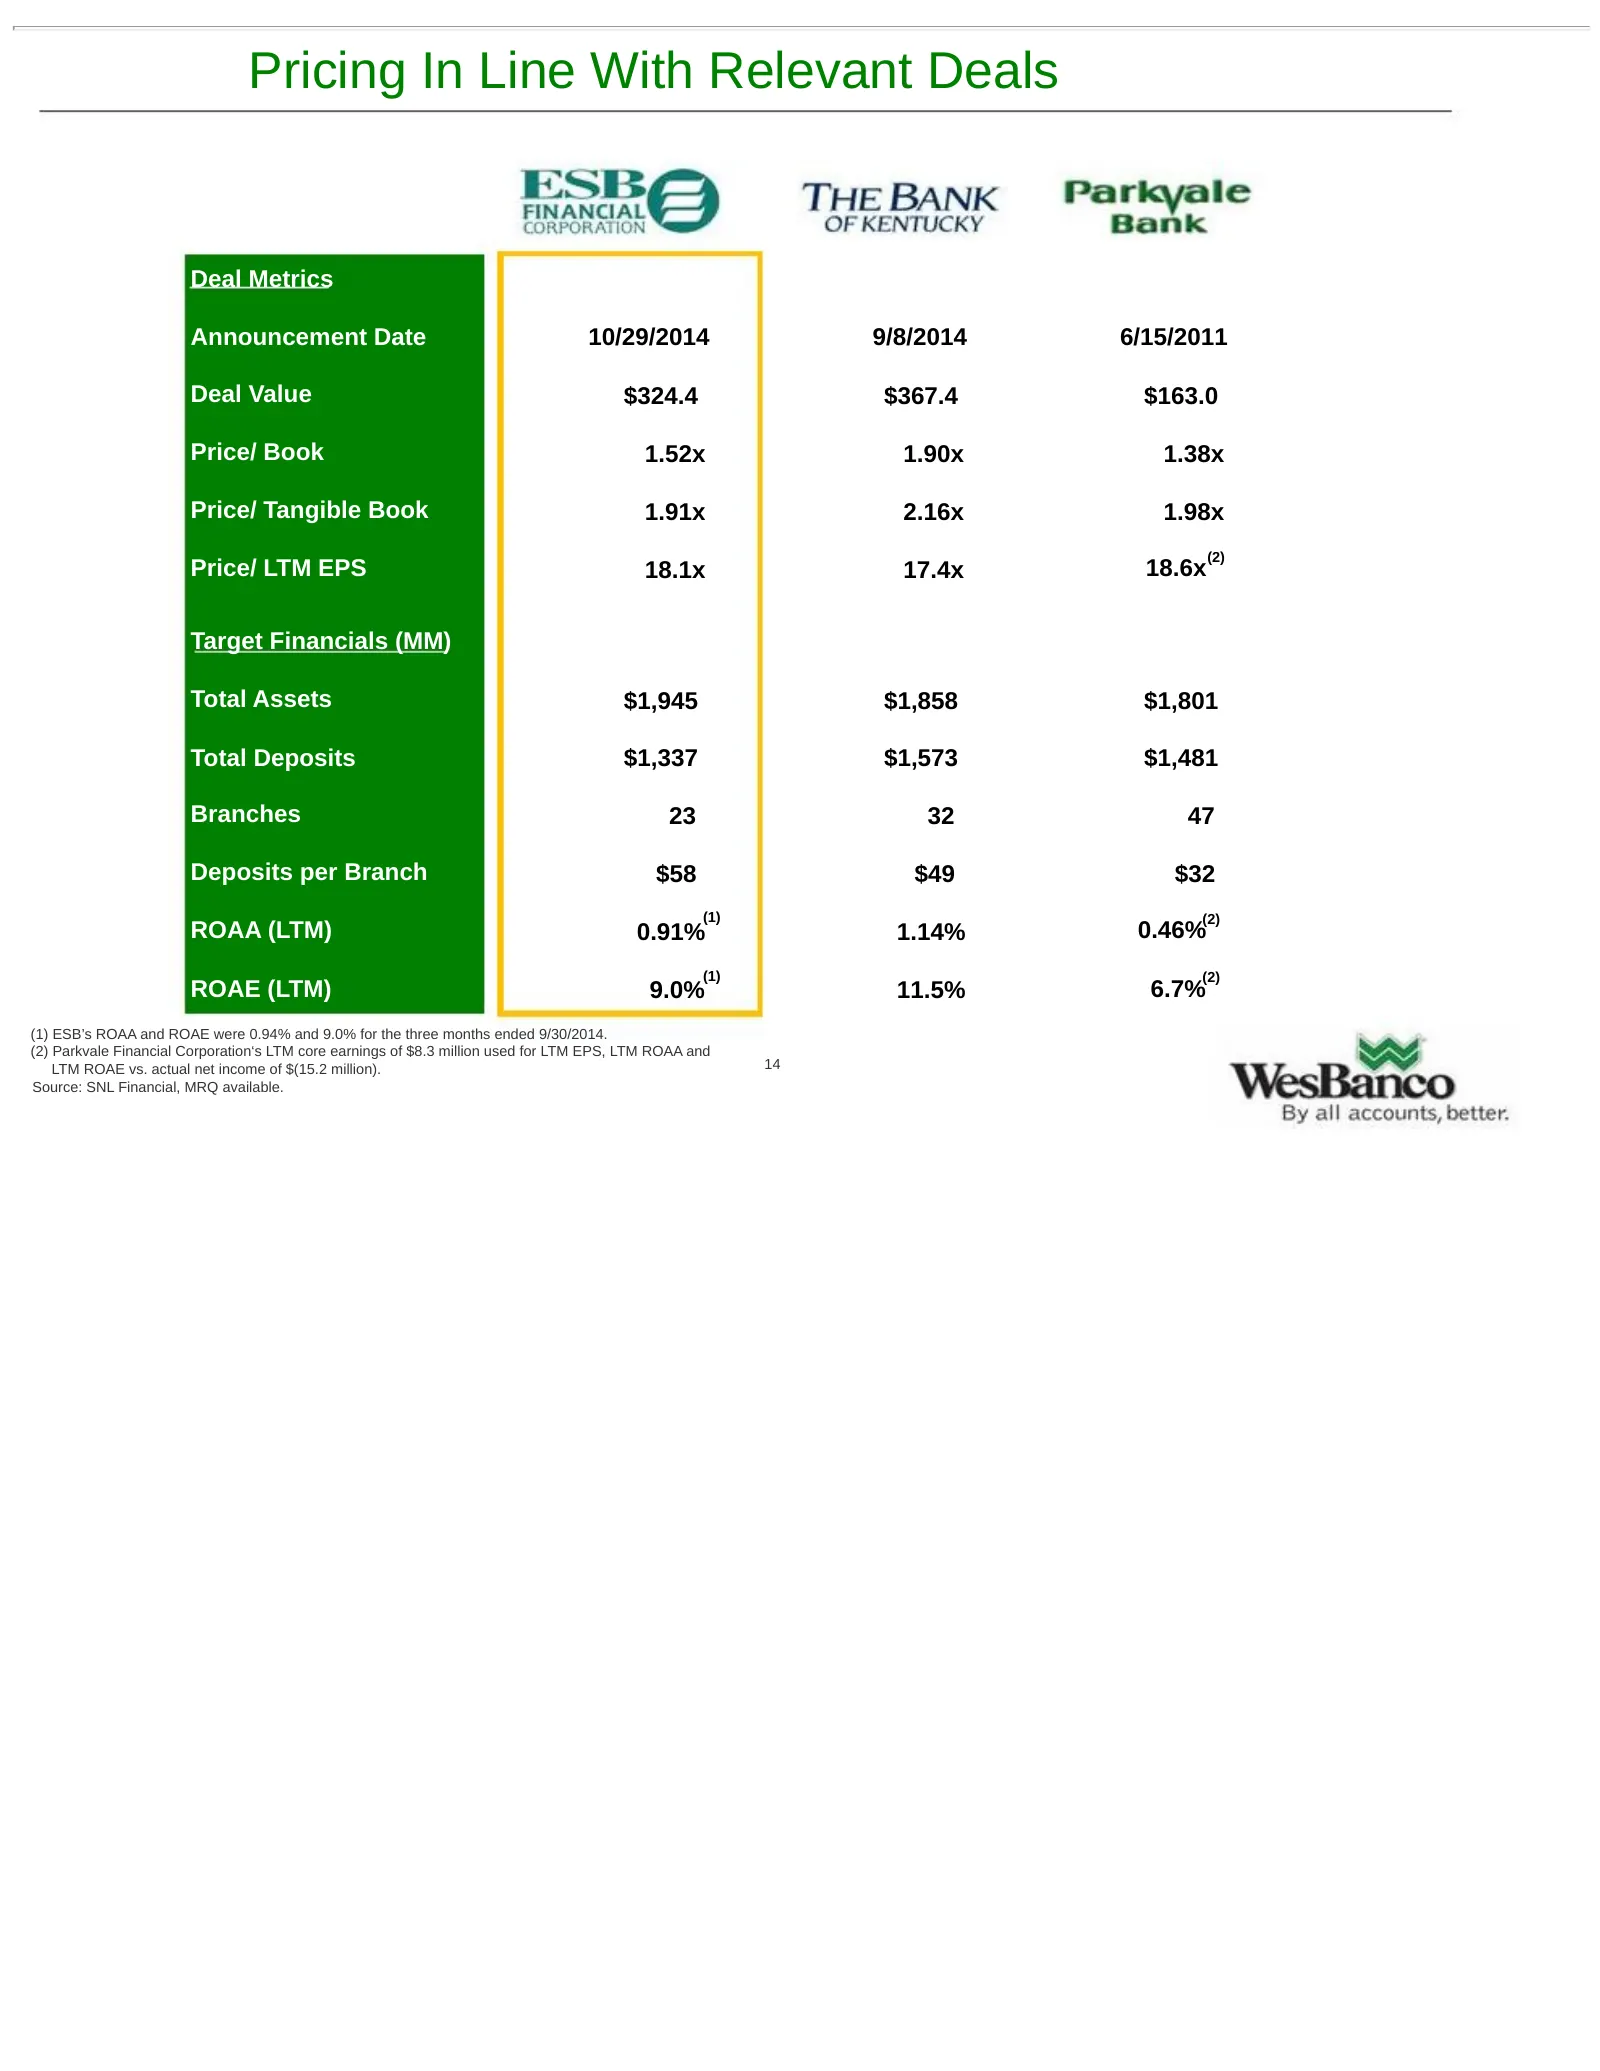
Pricing In Line With Relevant Deals Deal Metrics Announcement Date 10/29/2014 9/8/2014 6/15/2011 Deal Value $324.4 $367.4 $163.0 Price/ Book 1.52x 1.90x 1.38x Price/ Tangible Book 1.91x 2.16x 1.98x (2) Price/ LTM EPS 18.1x 17.4x 18.6x Target Financials (MM) Total Assets $1,945 $1,858 $1,801 Total De
Slide 15: Summary
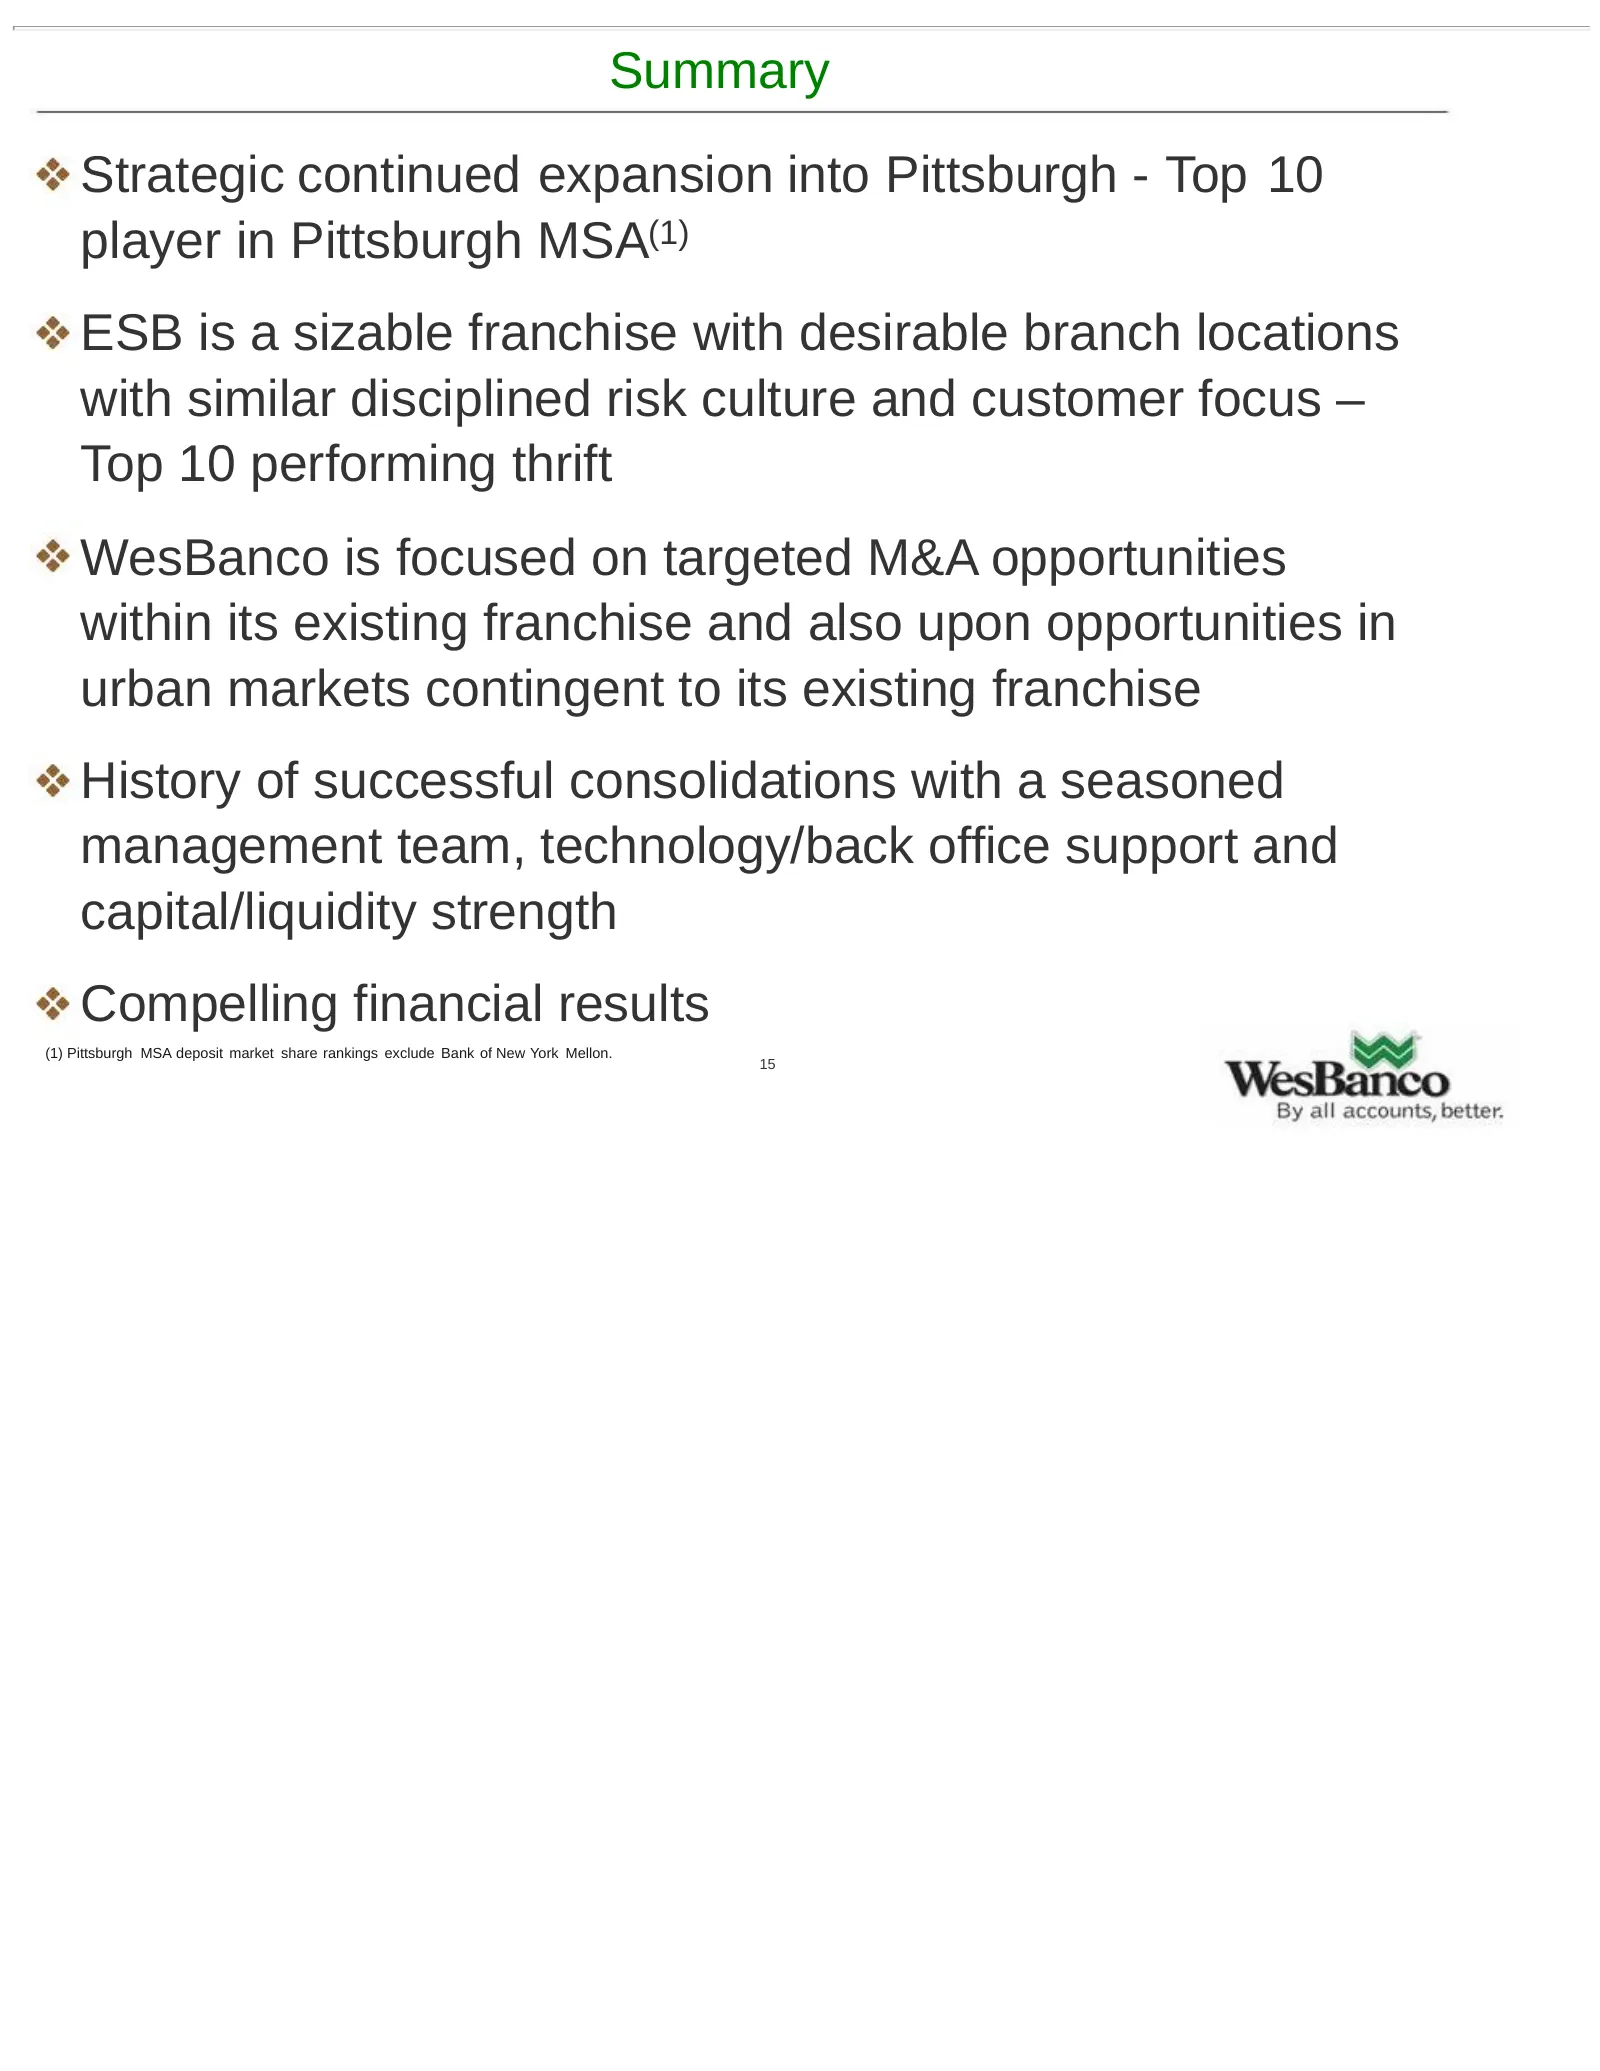
Summary Strategic continued expansion into Pittsburgh - Top 10 player in Pittsburgh MSA(1) ESB is a sizable franchise with desirable branch locations with similar disciplined risk culture and customer focus – Top 10 performing thrift WesBanco is focused on targeted M&A opportunities within its exist
Slide 16: Appendix
By all accounts, better. Appendix
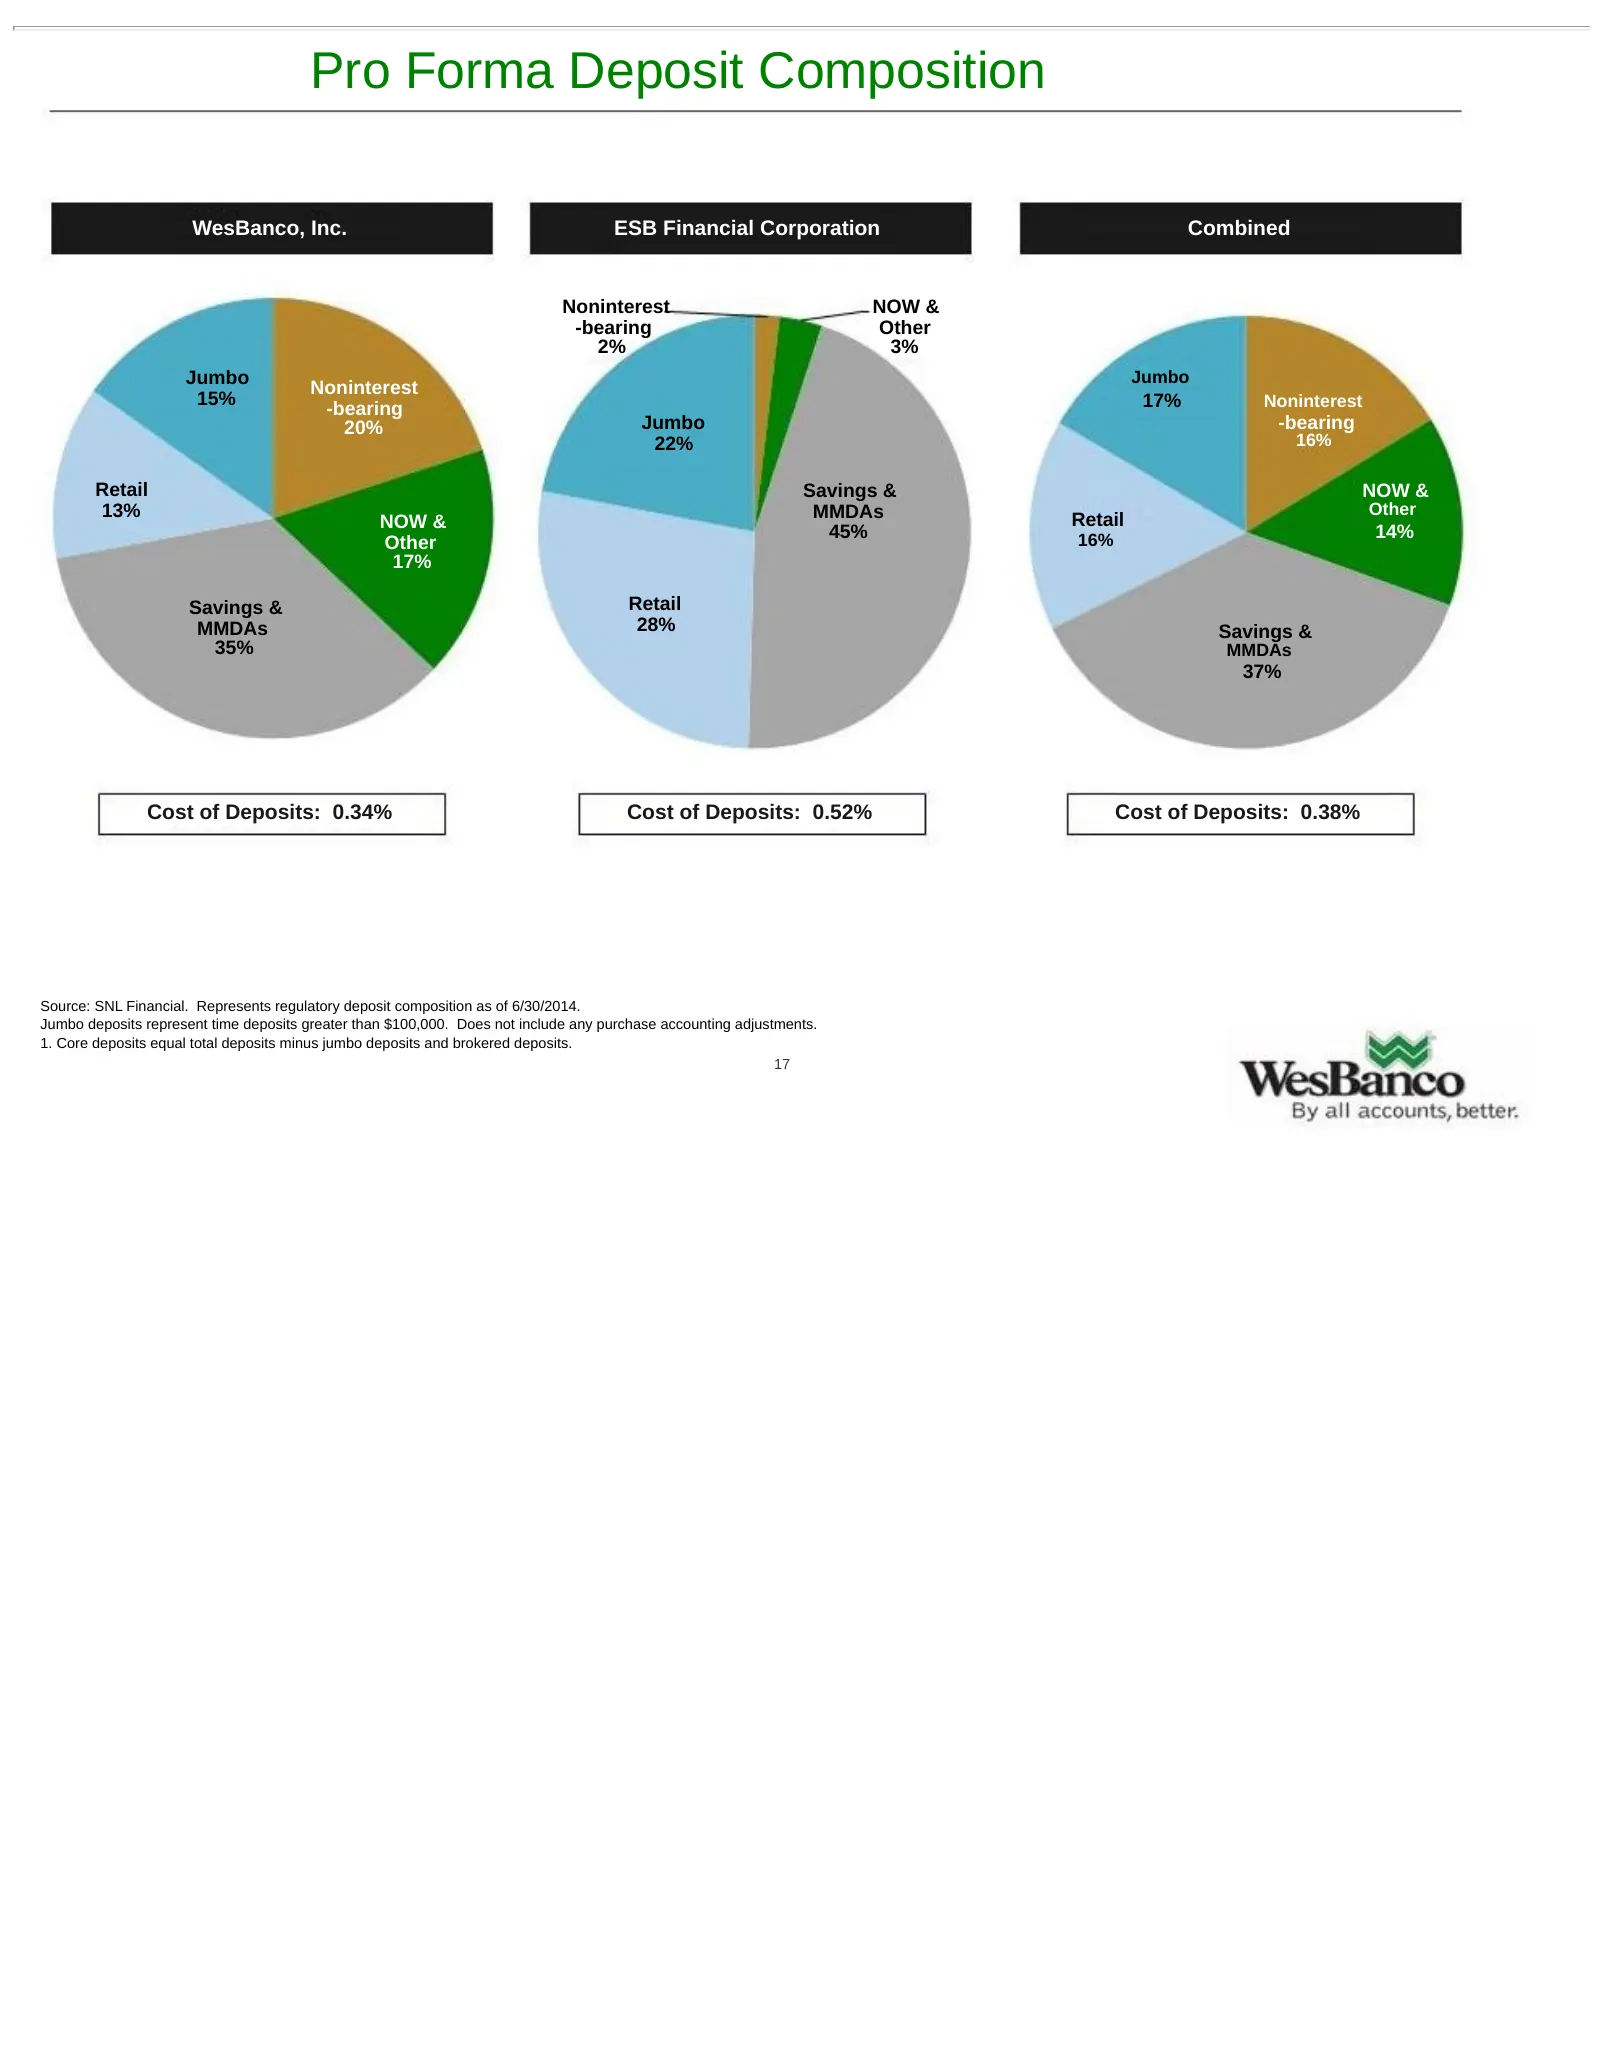
Slide 17: Pro Forma Deposit Composition
Pro Forma Deposit Composition WesBanco, Inc. ESB Financial Corporation Combined Noninterest NOW & -bearing Other 2% 3% Jumbo Jumbo Noninterest 15% -bearing 17% Noninterest 20% Jumbo -bearing 22% 16% Retail Savings & NOW & 13% MMDAs Other NOW & Retail 45% 16% 14% Other 17% Savings & Retail MMDAs 28%
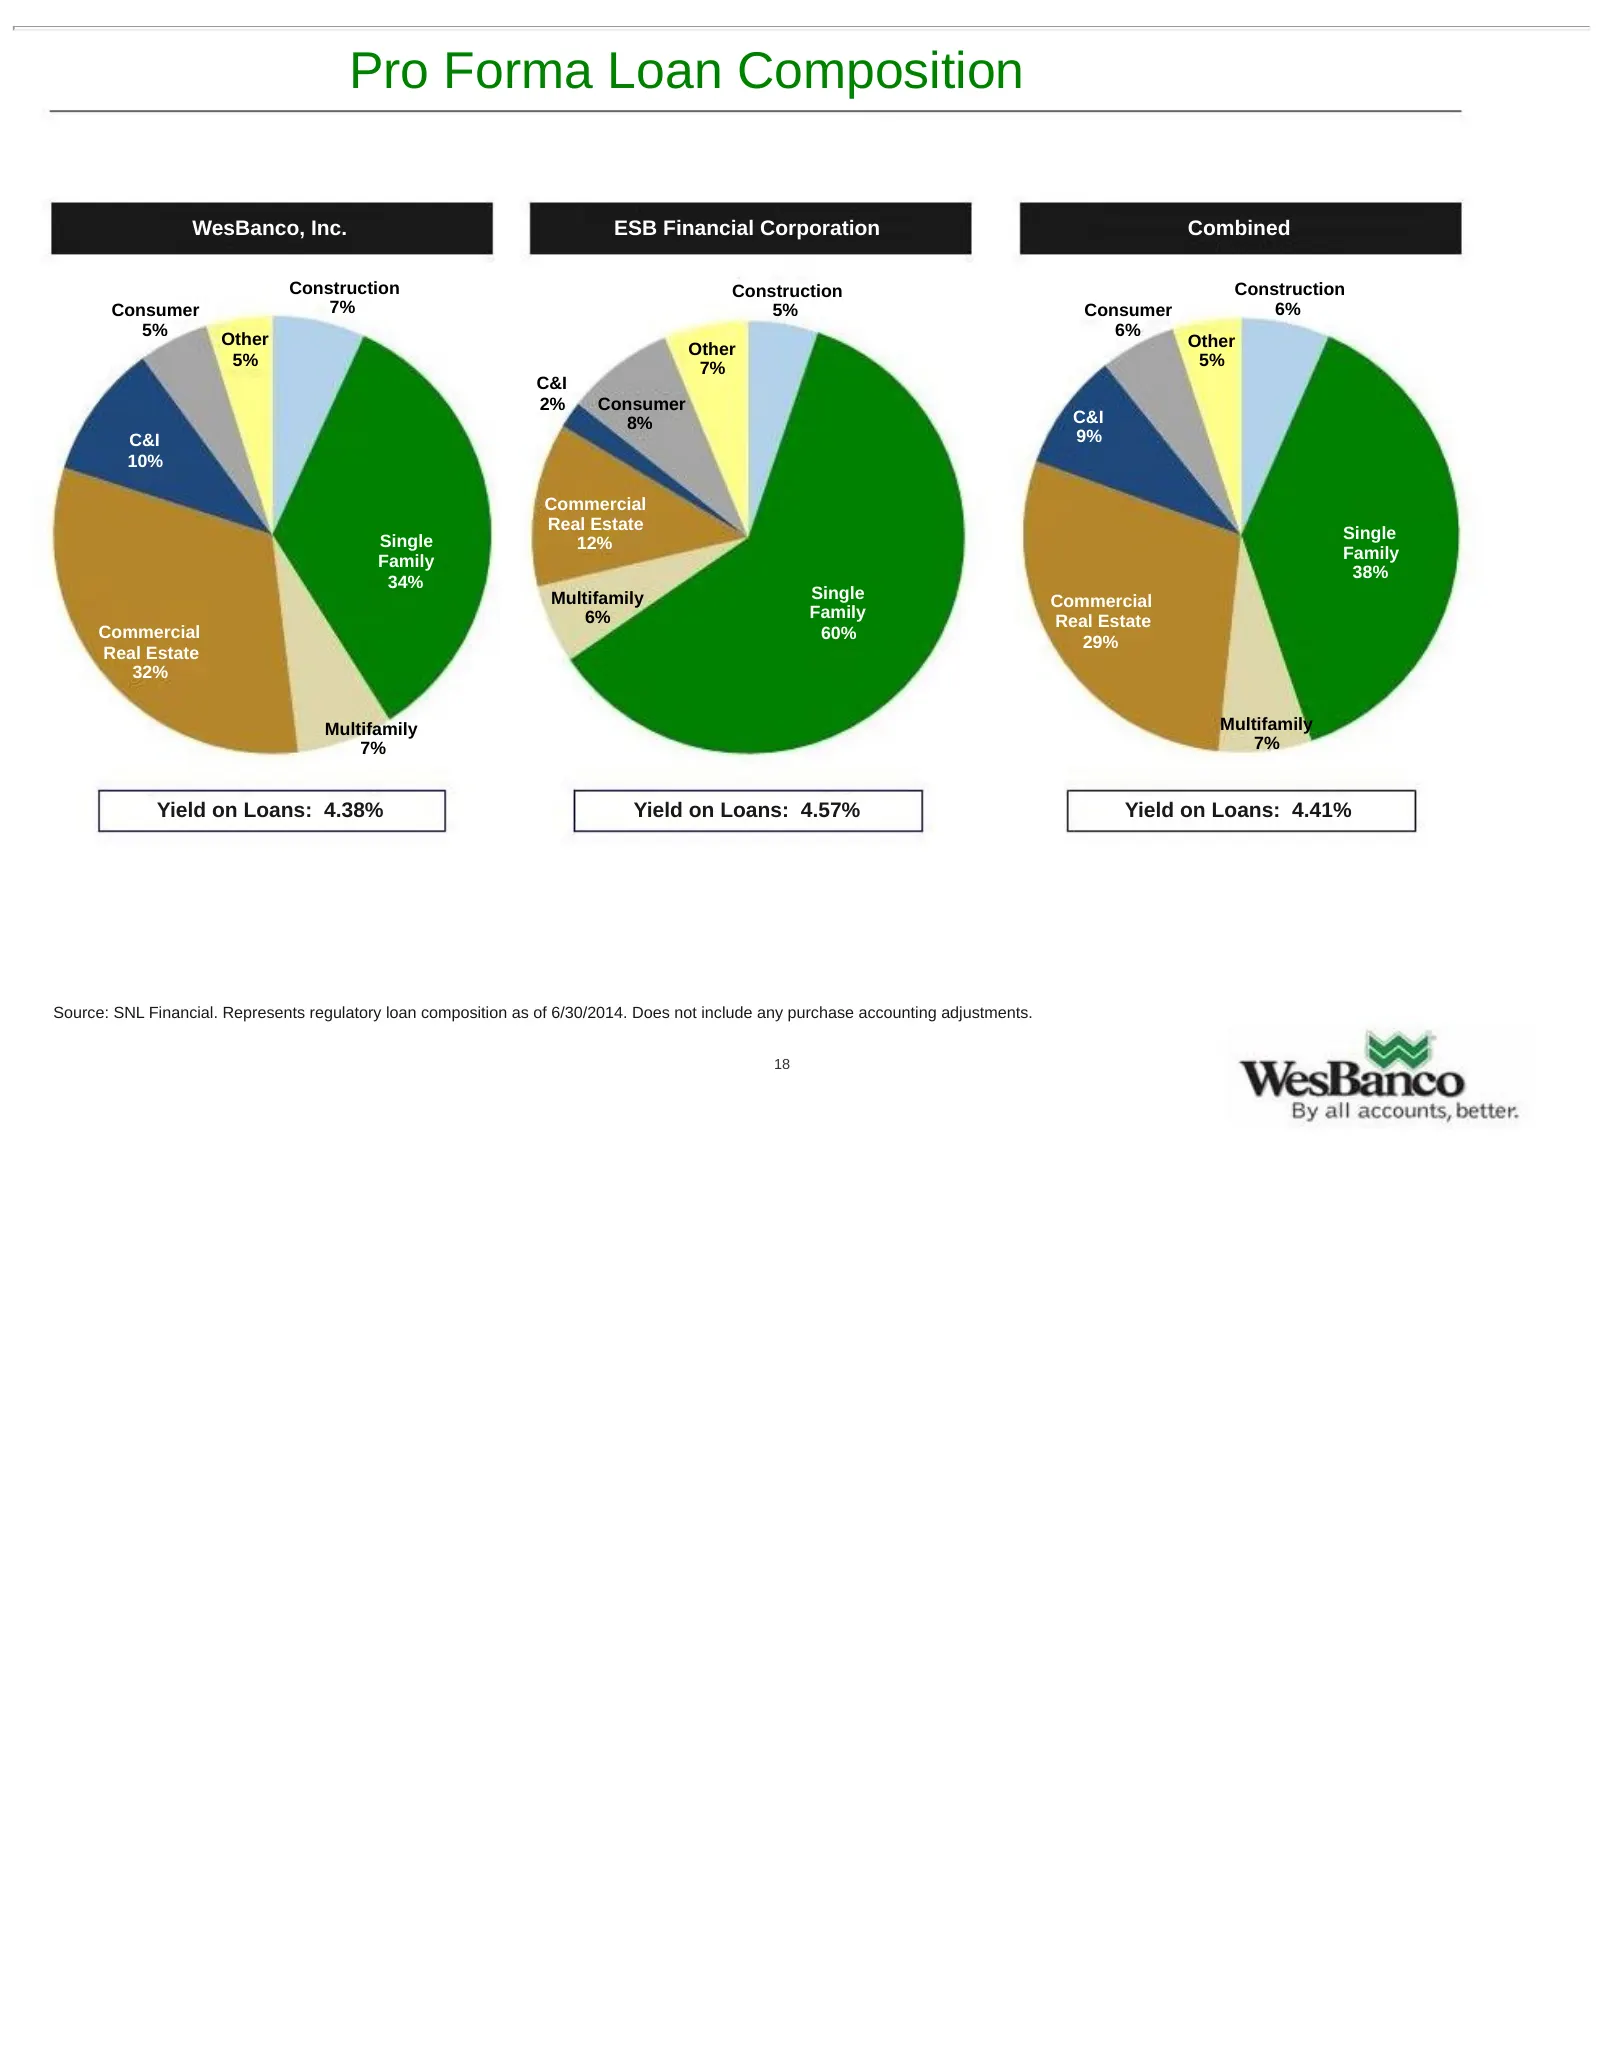
Slide 18: Pro Forma Loan Composition
Pro Forma Loan Composition WesBanco, Inc. ESB Financial Corporation Combined Construction Construction Construction Consumer 7% 5% Consumer 6% 5% 6% Other Other Other 5% 7% 5% C&I 2% Consumer 8% C&I C&I 9% 10% Commercial Real Estate Single Single 12% Family Family 38% 34% Multifamily Single Commerci
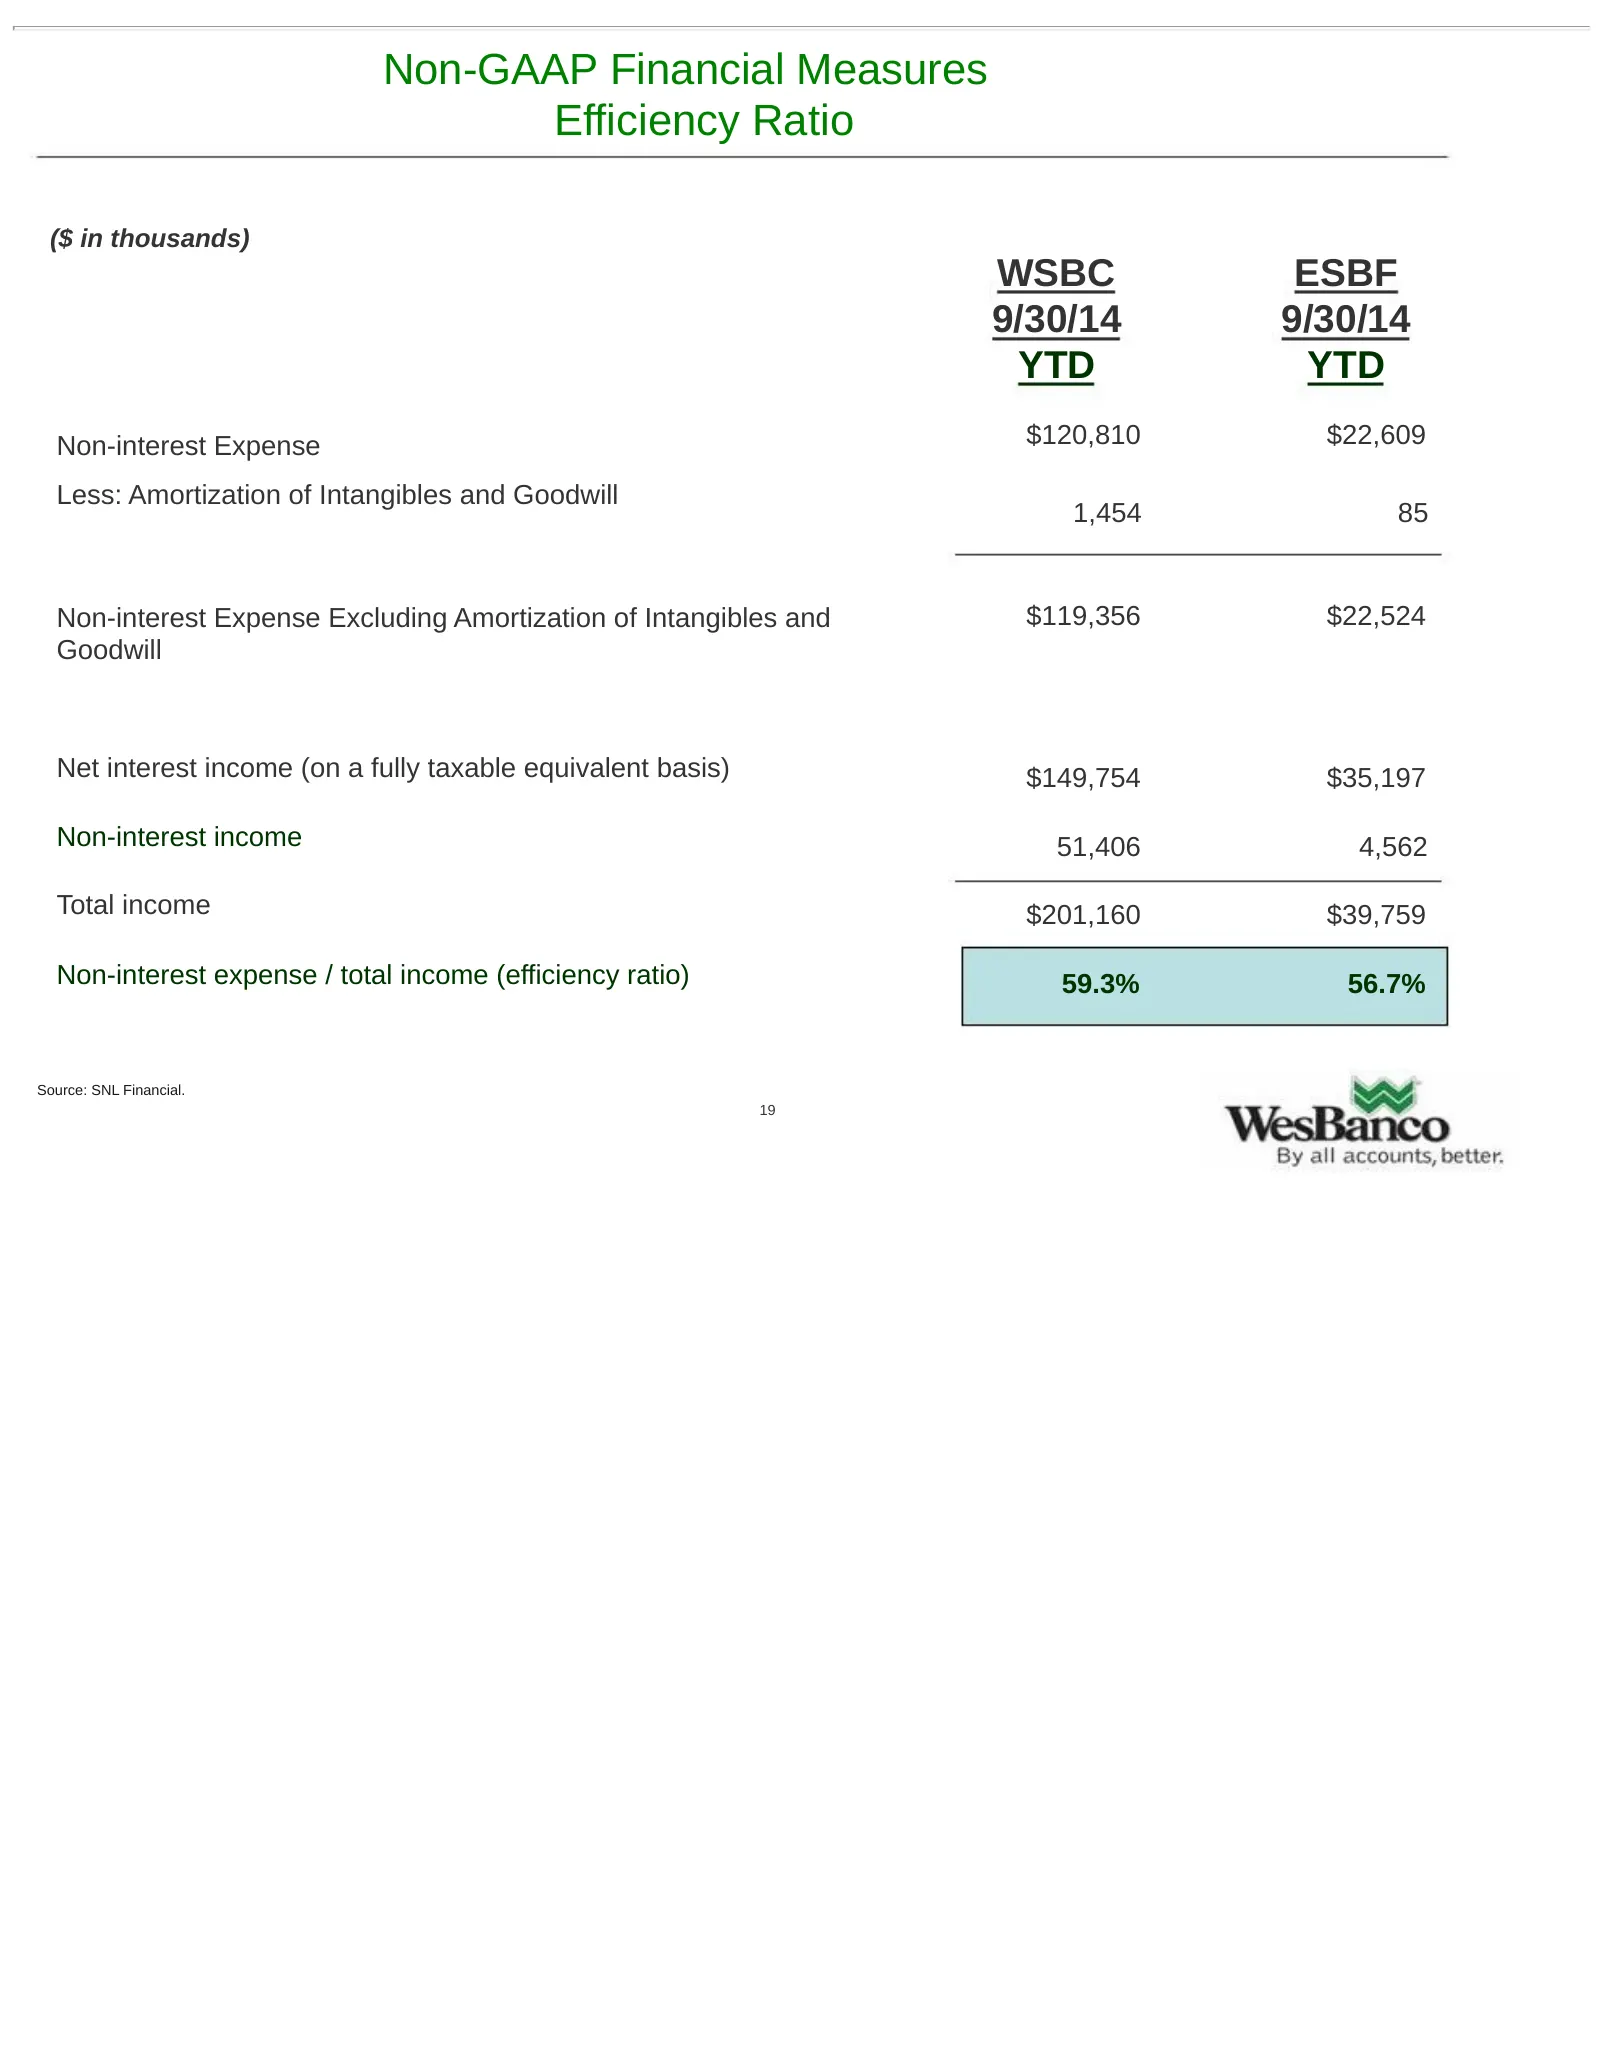
Slide 19: Non-GAAP Financial Measures Efficiency Ratio
Non-GAAP Financial Measures Efficiency Ratio ($ in thousands) WSBC ESBF 9/30/14 9/30/14 YTD YTD Non-interest Expense $120,810 $22,609 Less: Amortization of Intangibles and Goodwill 1,454 85 Non-interest Expense Excluding Amortization of Intangibles and $119,356 $22,524 Goodwill Net interest income (
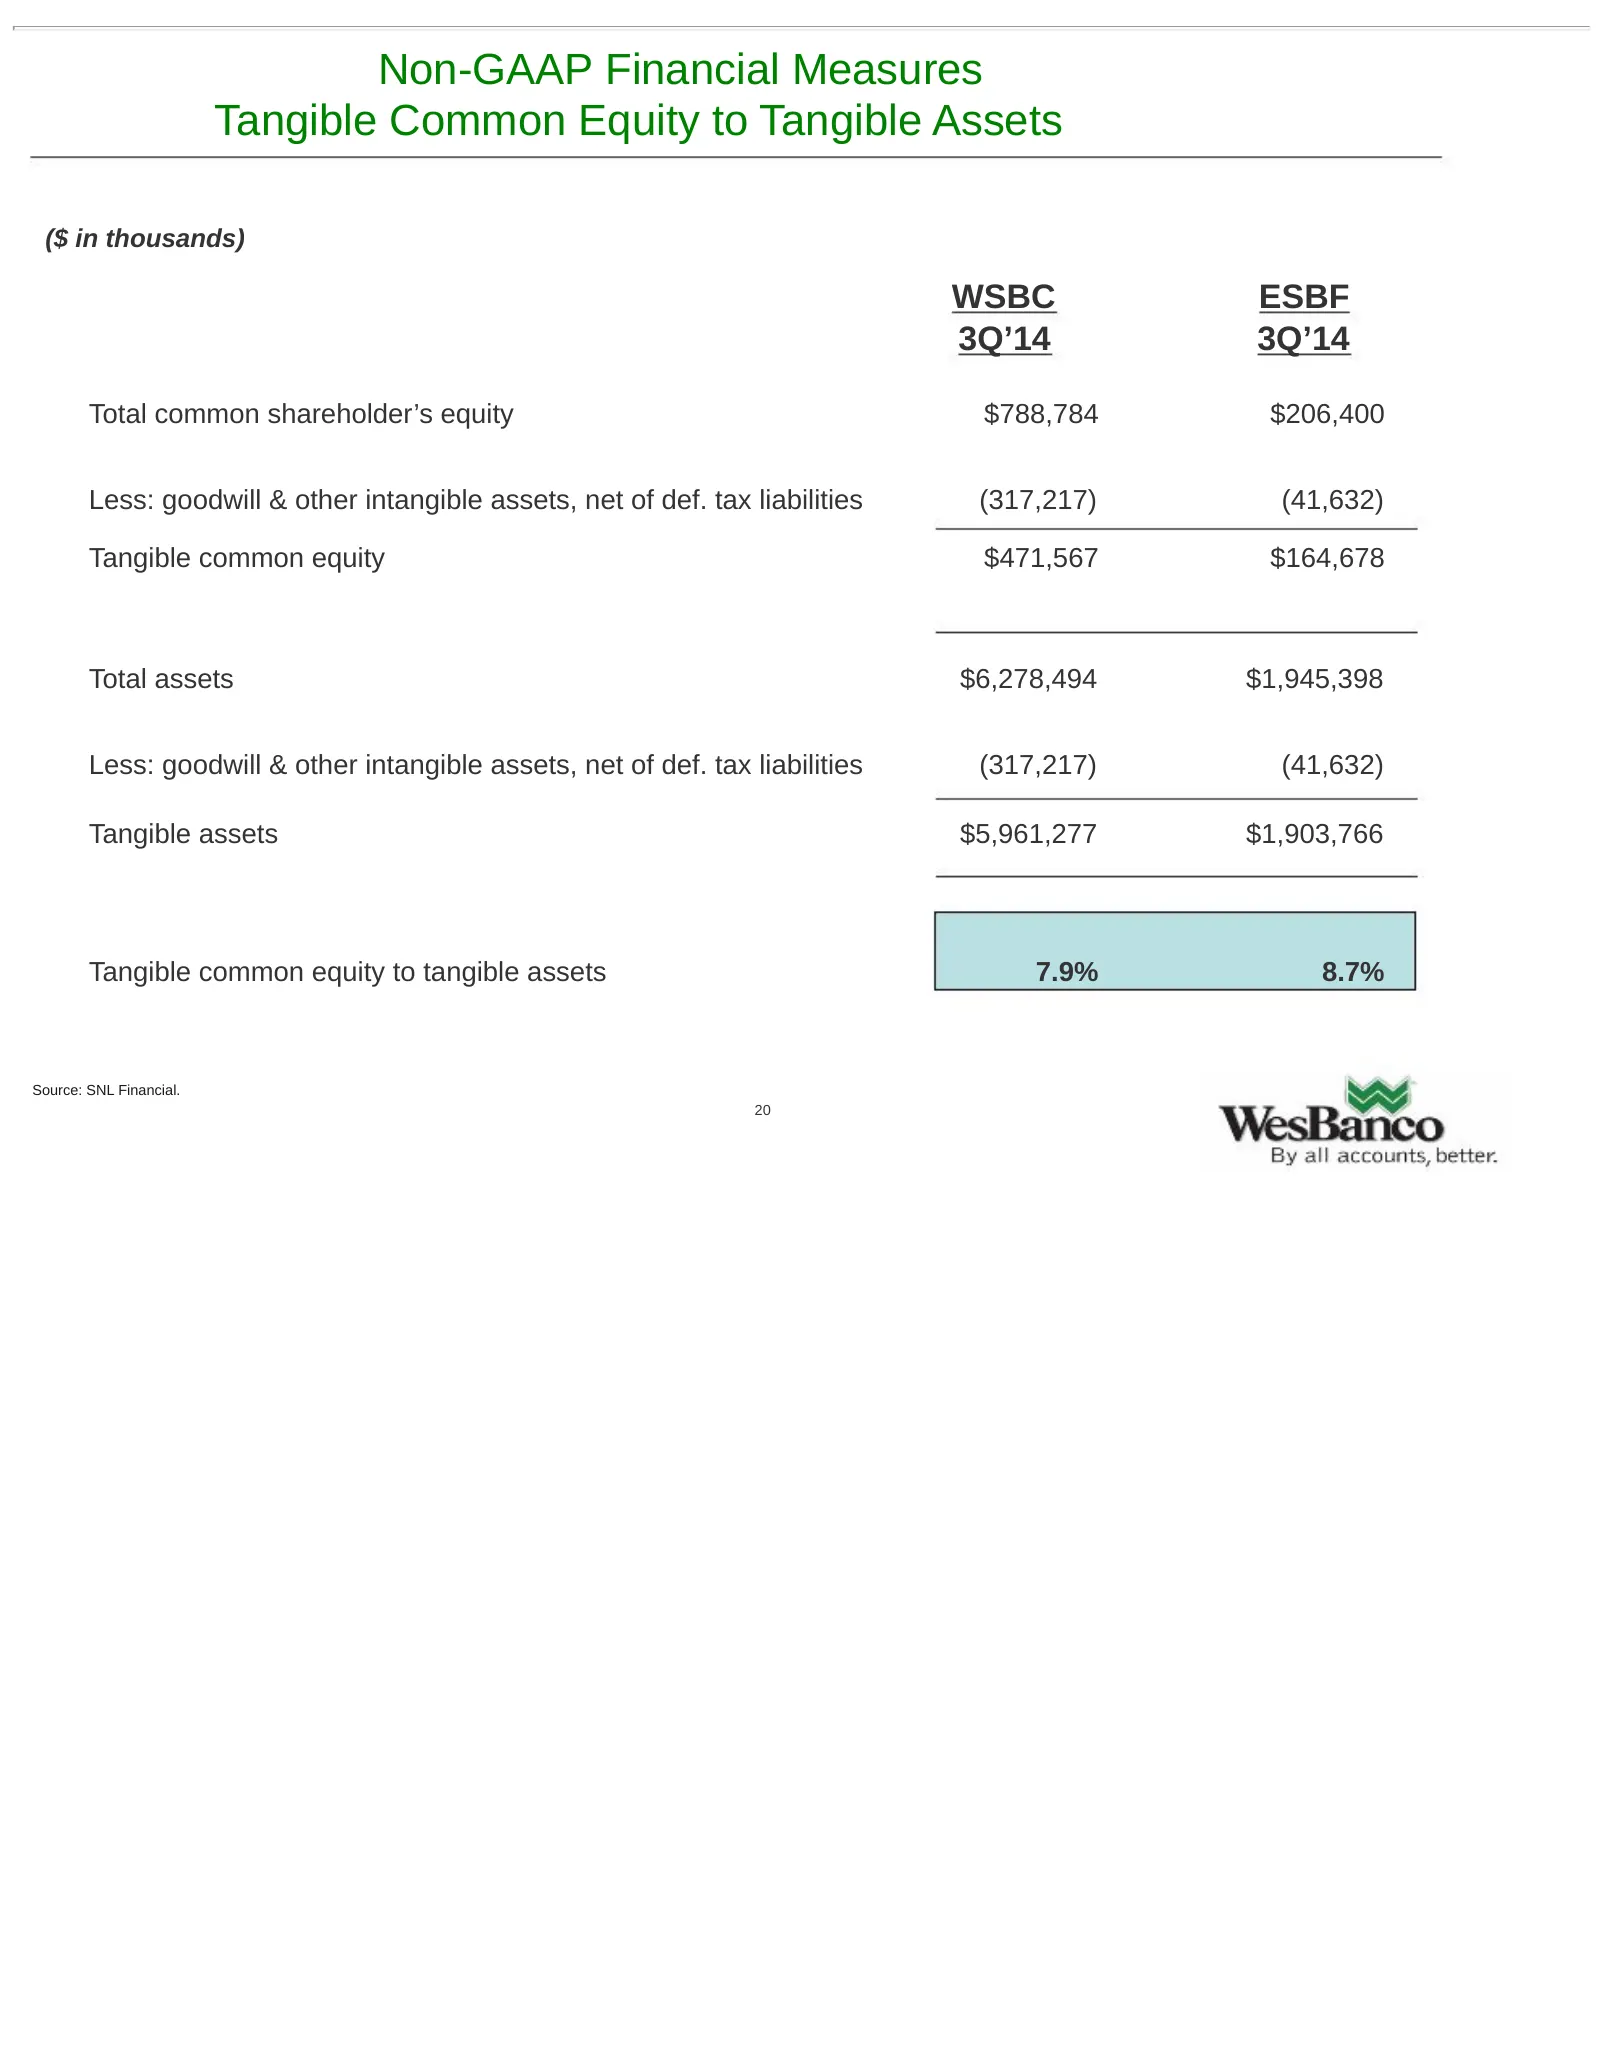
Slide 20: Non-GAAP Financial Measures Tangible Common Equity to Tangible Assets
Non-GAAP Financial Measures Tangible Common Equity to Tangible Assets ($ in thousands) WSBC ESBF 3Q’14 3Q’14 Total common shareholder’s equity $788,784 $206,400 Less: goodwill & other intangible assets, net of def. tax liabilities (317,217) (41,632) Tangible common equity $471,567 $164,678 Total ass
Slide 21: Non-GAAP Financial Measures Return on Average Tangible Common Equity
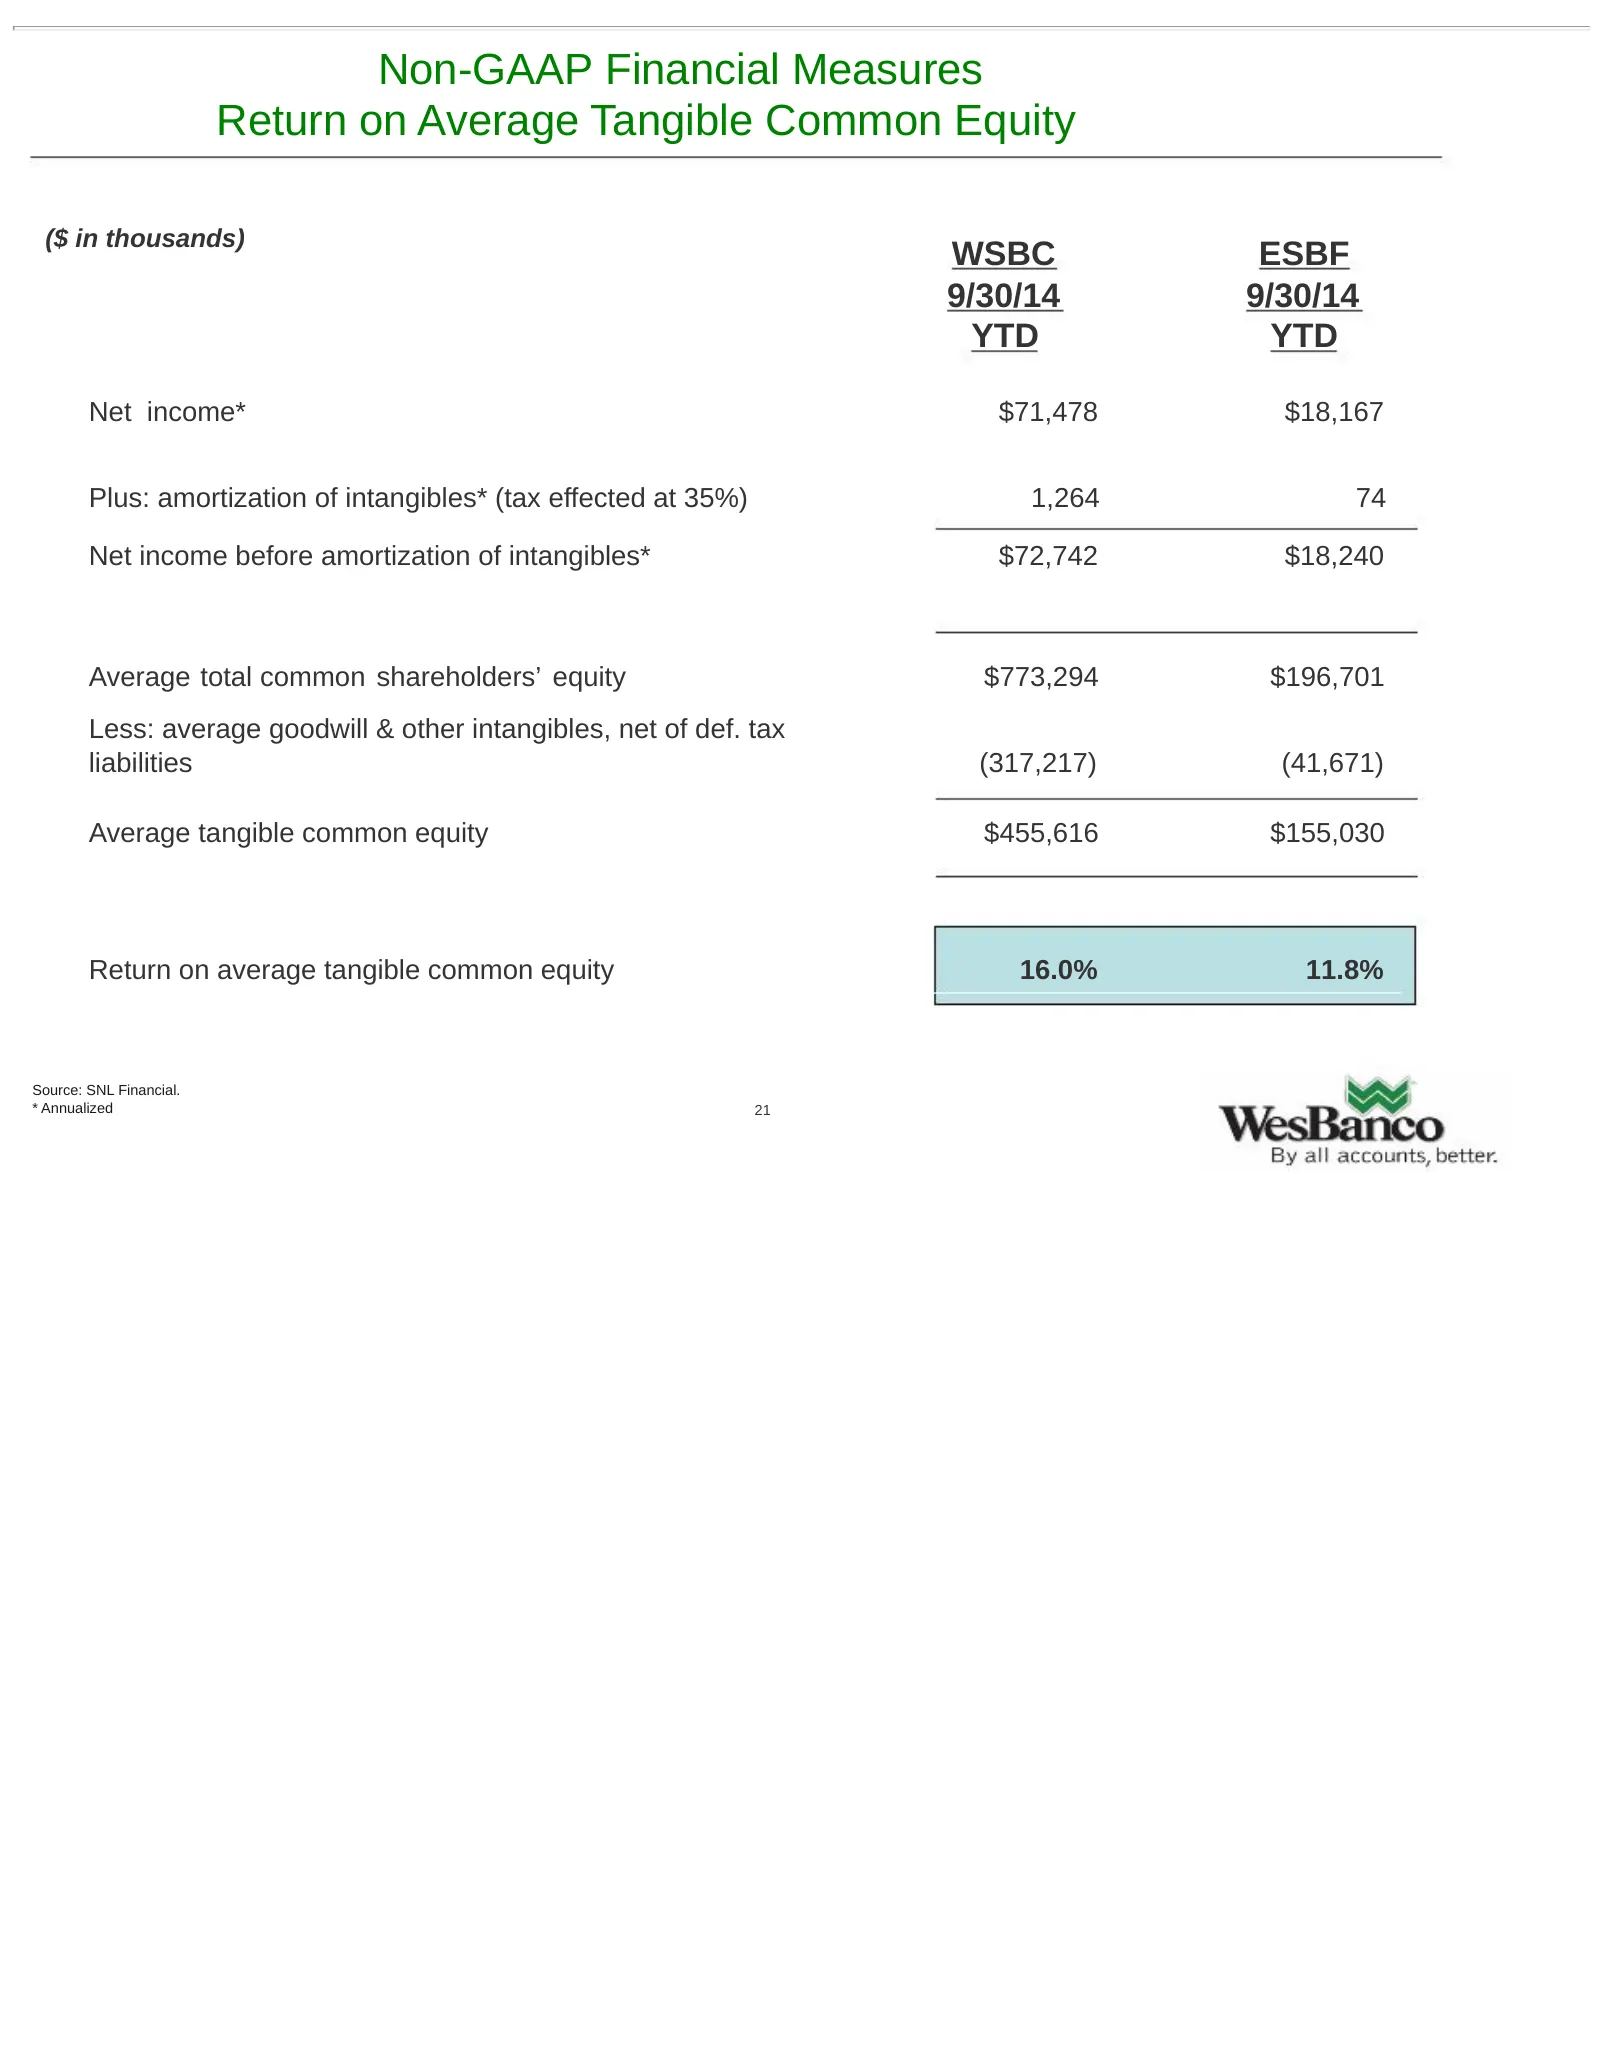
Non-GAAP Financial Measures Return on Average Tangible Common Equity ($ in thousands) WSBC ESBF 9/30/14 9/30/14 YTD YTD Net income* $71,478 $18,167 Plus: amortization of intangibles* (tax effected at 35%) 1,264 74 Net income before amortization of intangibles* $72,742 $18,240 Average total common sh
Slide 22: WesBanco
Wy WesBanco By all accounts, better.
Source: SEC EDGAR · 425 filed Oct 29, 2014