Canara Bank · NSE:CANBK
Canara Bank — Q3 FY2021-22 Earnings Presentation
47 slides from Canara Bank's earnings presentation, December 2021

Slide 1: High-tech Banking: Financial Results Q3 FY 2021-22
High-tech Banking Multi - dimensional excellence Financial Results: Q3(FY 2021-22) Page 1
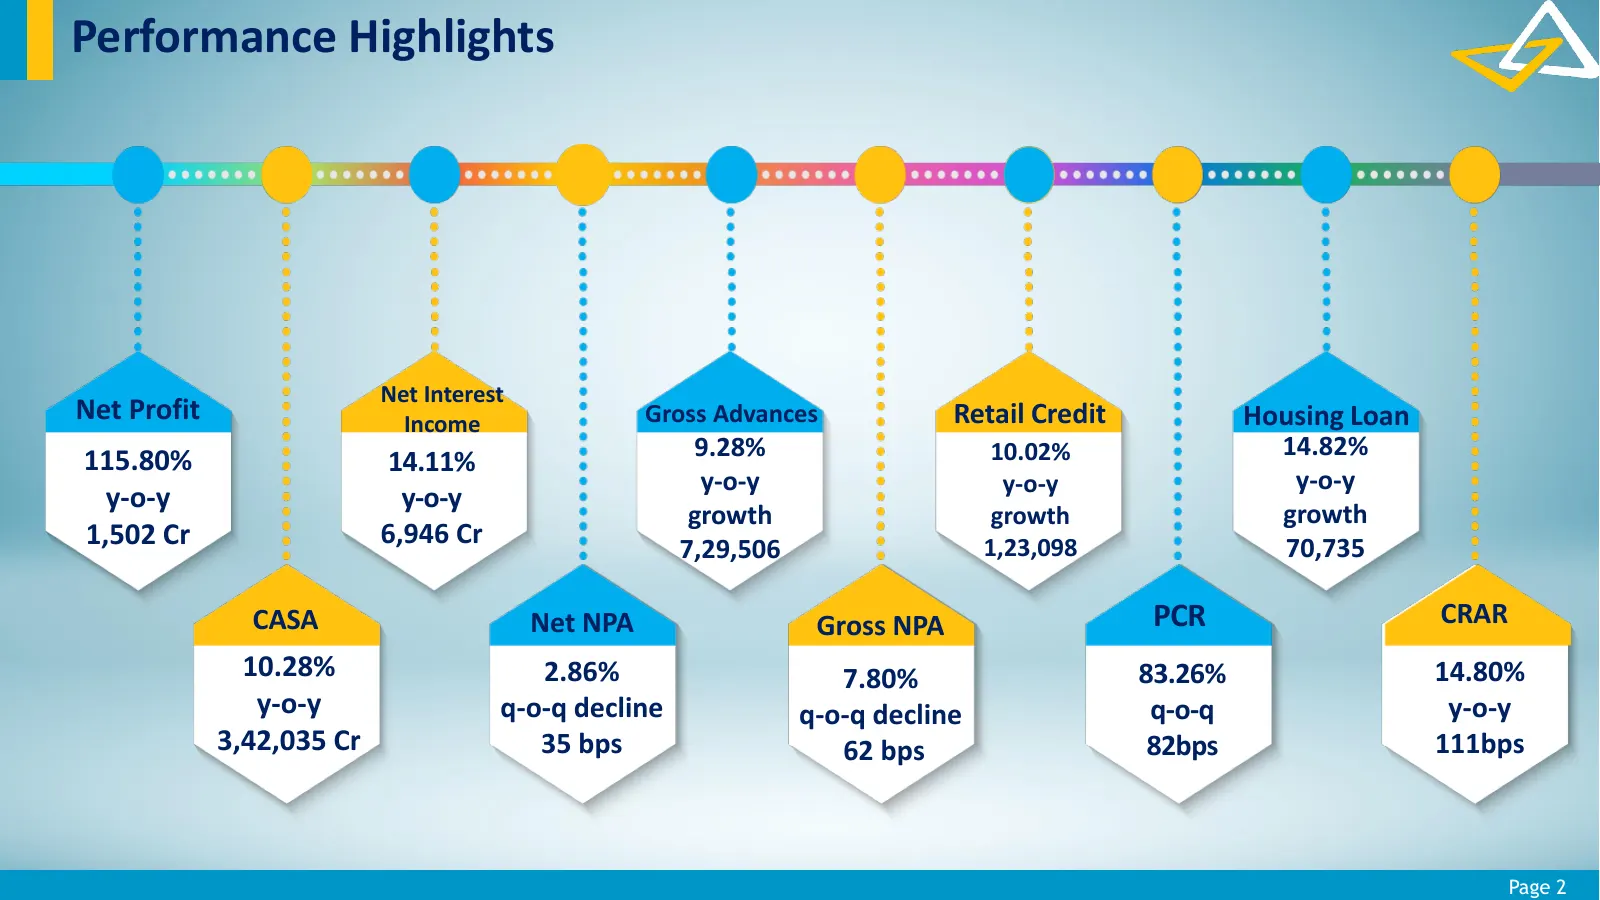
Slide 2: Performance Highlights
Performance Highlights Net Interest Net Profit Income Gross Advances Retail Credit Housing Loan 9.28% 10.02% 14.82% 115.80% 14.11% y-o-y y-o-y y-o-y y-o-y y-o-y growth growth growth 1,502 Cr 6,946 Cr 7,29,506 1,23,098 70,735 CASA Net NPA Gross NPA PCR CRAR 10.28% 2.86% 7.80% 83.26% 14.80% y-o-y q-o-
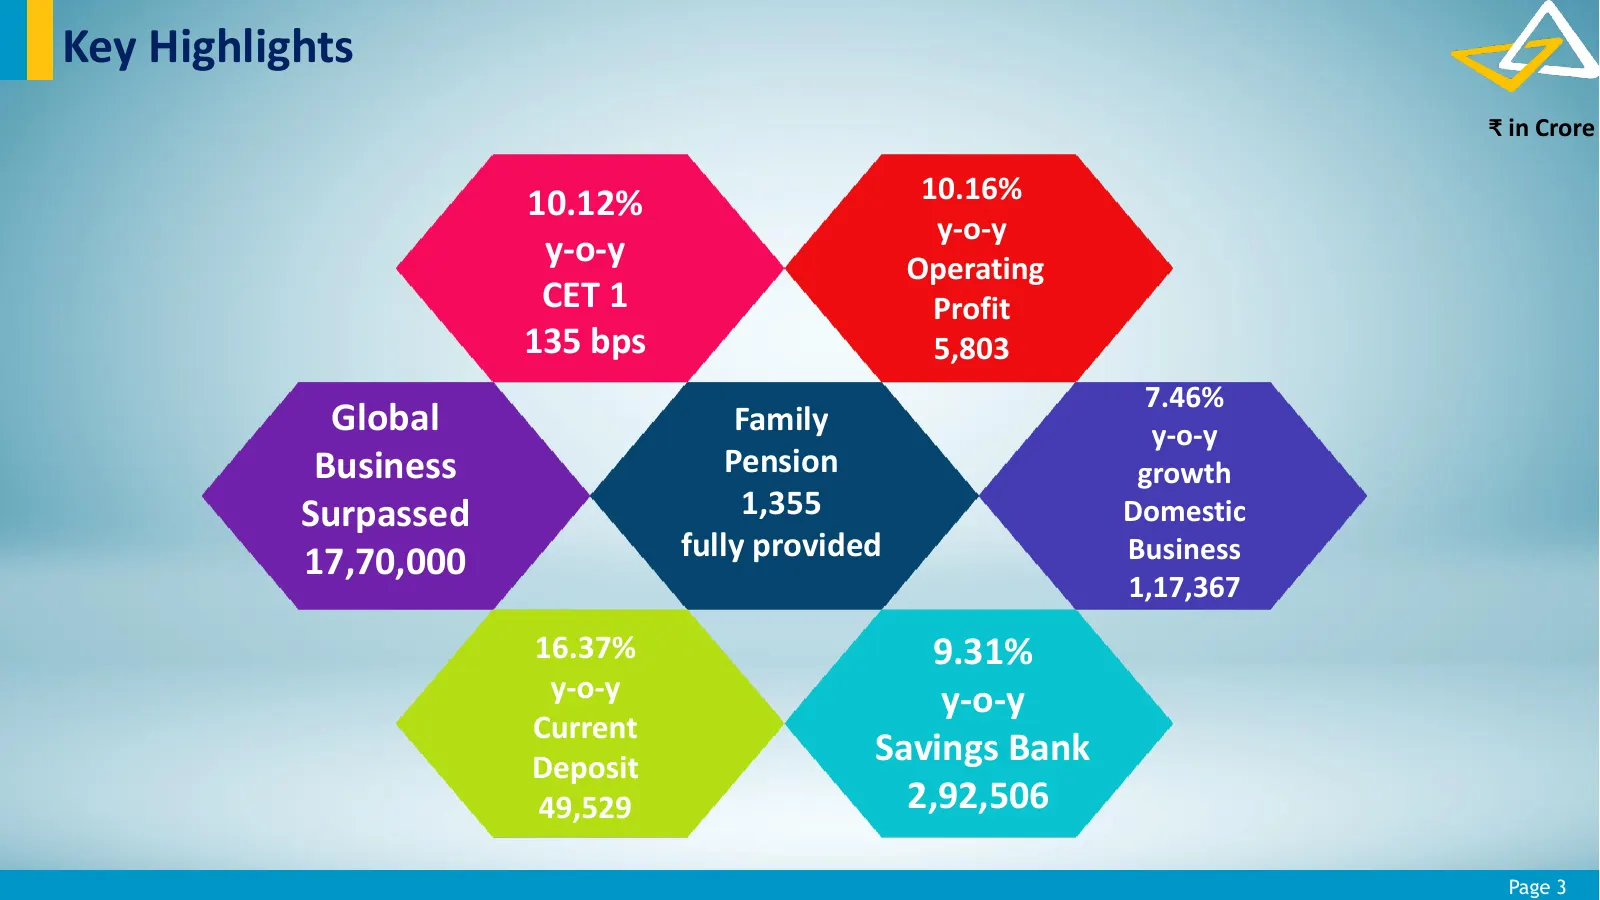
Slide 3: Key Highlights
Key Highlights ₹ in Crore 10.12% 10.16% y-o-y y-o-y Operating CET 1 Profit 135 bps 5,803 7.46% Global Family y-o-y Business Pension growth Surpassed 1,355 Domestic 17,70,000 fully provided Business 1,17,367 16.37% 9.31% y-o-y y-o-y Current Deposit Savings Bank 49,529 2,92,506 Page 3
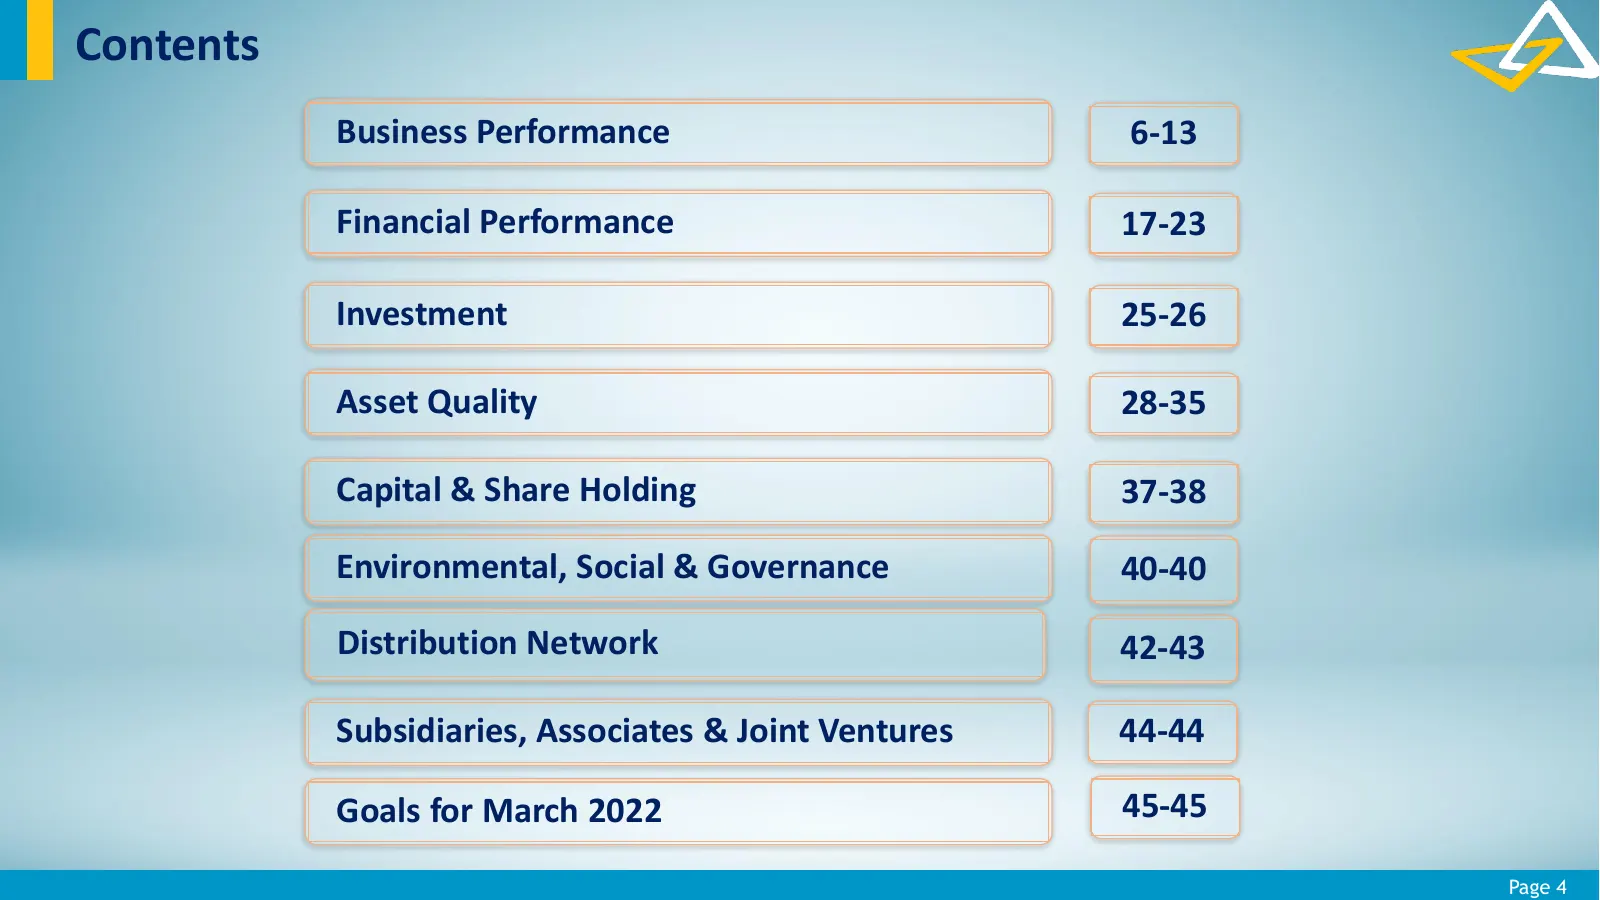
Slide 4: Contents
Contents Business Performance 6-13 Financial Performance 17-23 Investment 25-26 Asset Quality 28-35 Capital & Share Holding 37-38 Environmental, Social & Governance 40-40 Distribution Network 42-43 Subsidiaries, Associates & Joint Ventures 44-44 Goals for March 2022 45-45 Page 4

Slide 5: Business Performance
Business Performance Page 5
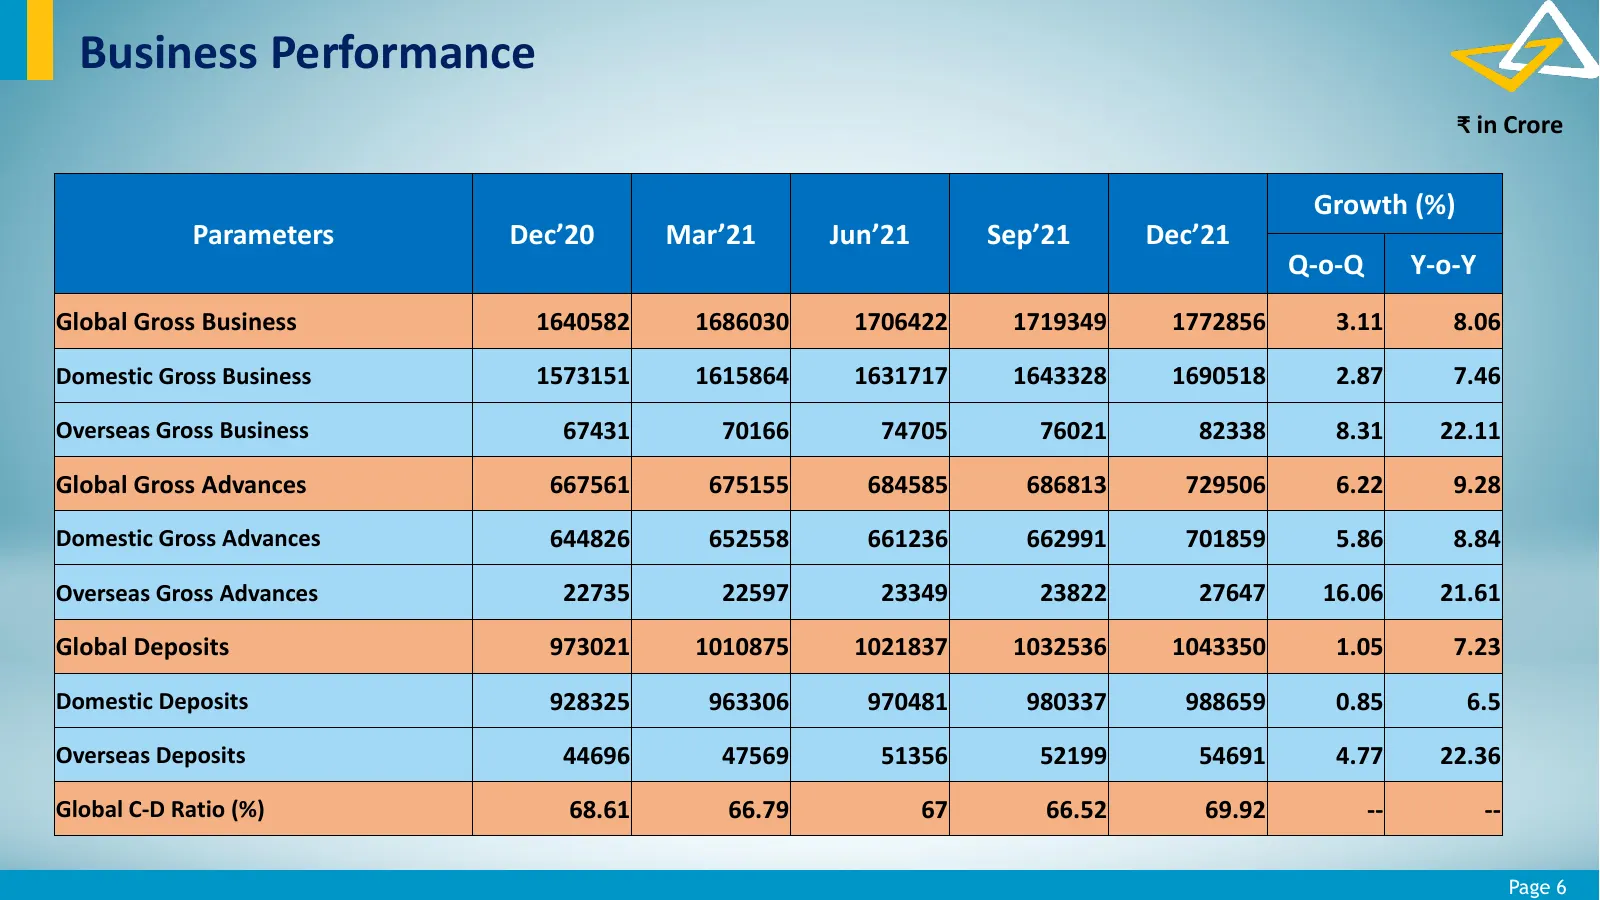
Slide 6: Business Performance
Business Performance ₹ in Crore Growth (%) Parameters Dec’20 Mar’21 Jun’21 Sep’21 Dec’21 Q-o-Q Y-o-Y Global Gross Business 1640582 1686030 1706422 1719349 1772856 3.11 8.06 Domestic Gross Business 1573151 1615864 1631717 1643328 1690518 2.87 7.46 Overseas Gross Business 67431 70166 74705 76021 82338
Slide 7: Domestic Deposit Mix
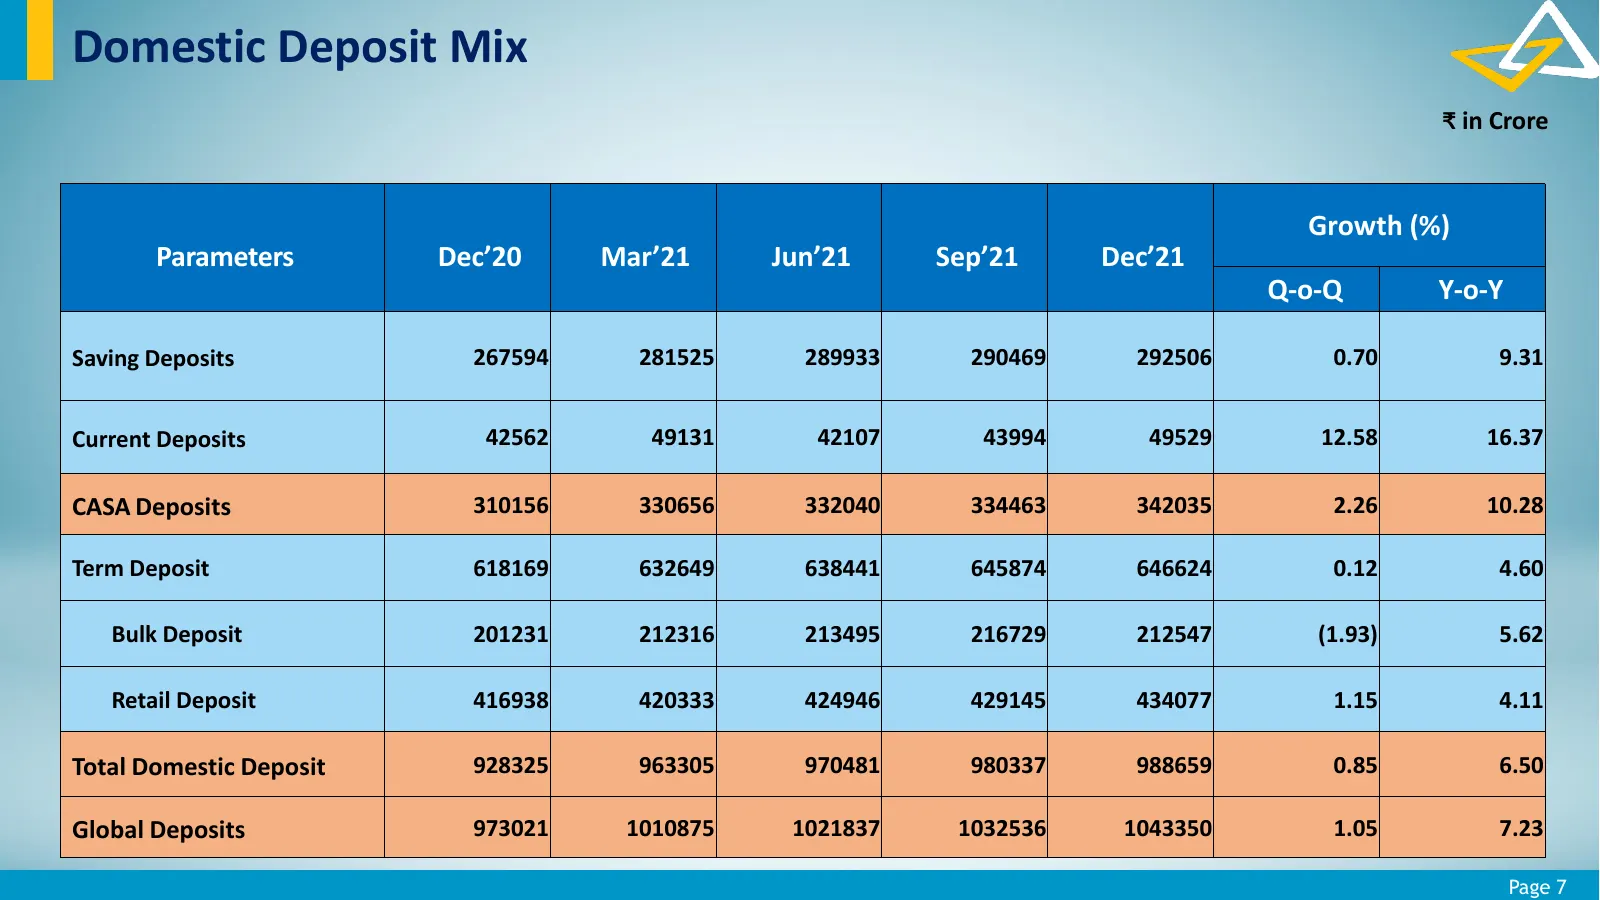
Domestic Deposit Mix ₹ in Crore Growth (%) Parameters Dec’20 Mar’21 Jun’21 Sep’21 Dec’21 Q-o-Q Y-o-Y Saving Deposits 267594 281525 289933 290469 292506 0.70 9.31 Current Deposits 42562 49131 42107 43994 49529 12.58 16.37 CASA Deposits 310156 330656 332040 334463 342035 2.26 10.28 Term Deposit 618169
Slide 8: Domestic Deposit & Retail Credit Mix
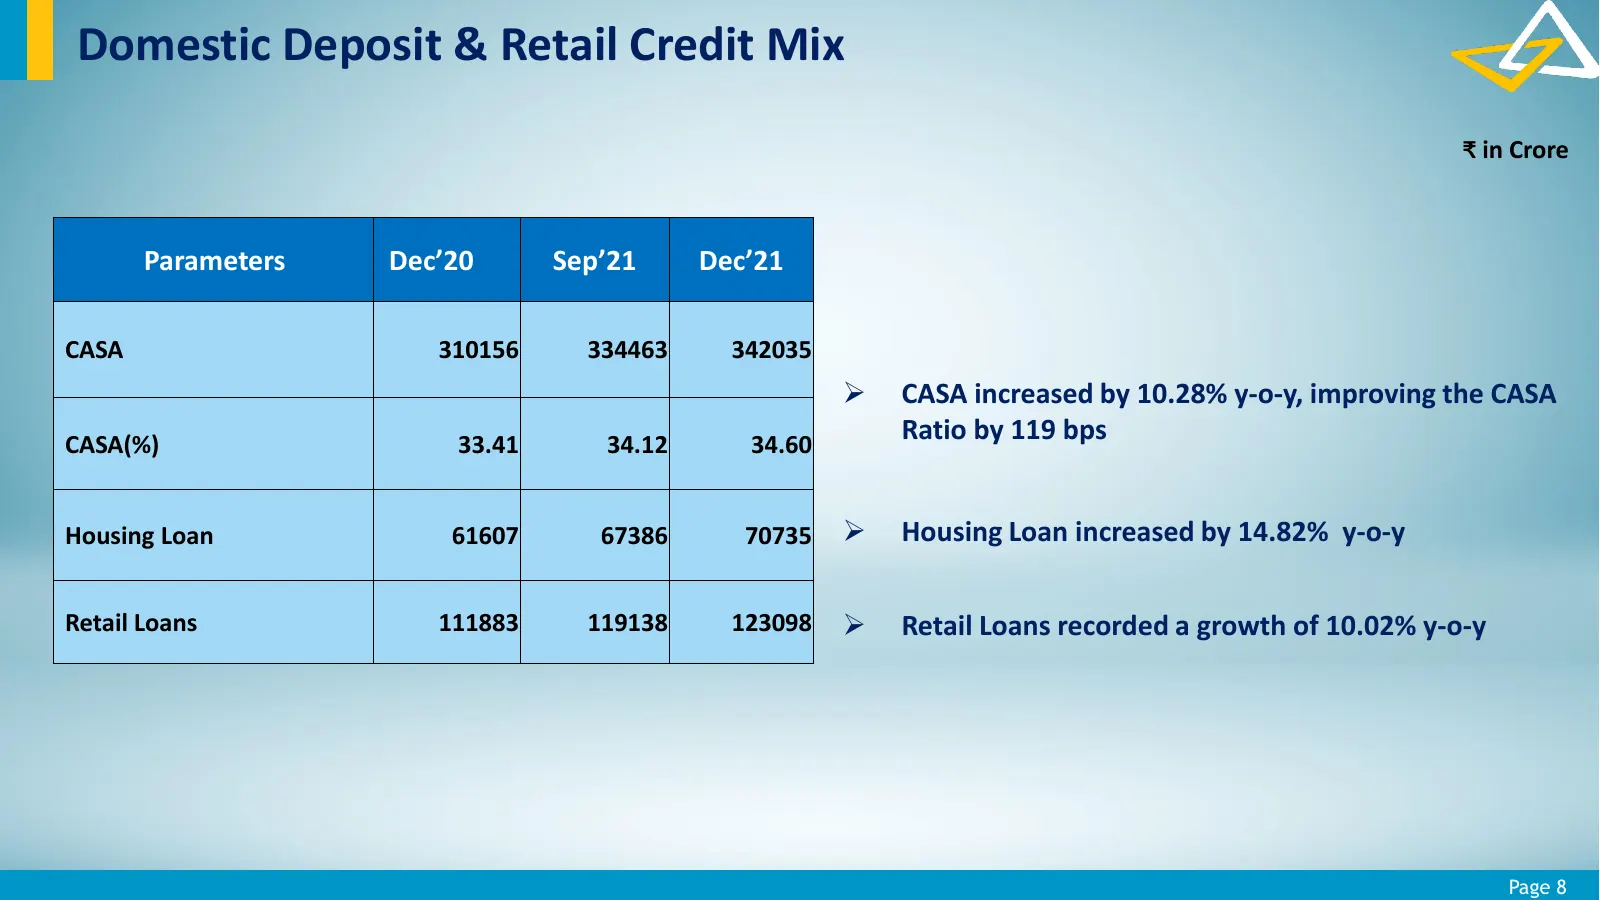
Domestic Deposit & Retail Credit Mix ₹ in Crore Parameters Dec’20 Sep’21 Dec’21 CASA 310156 334463 342035 CASA increased by 10.28% y-o-y, improving the CASA CASA(%) 33.41 34.12 34.60 Ratio by 119 bps Housing Loan 61607 67386 70735 Housing Loan increased by 14.82% y-o-y Retail Loans 111883 119138
Slide 9: Advances Mix
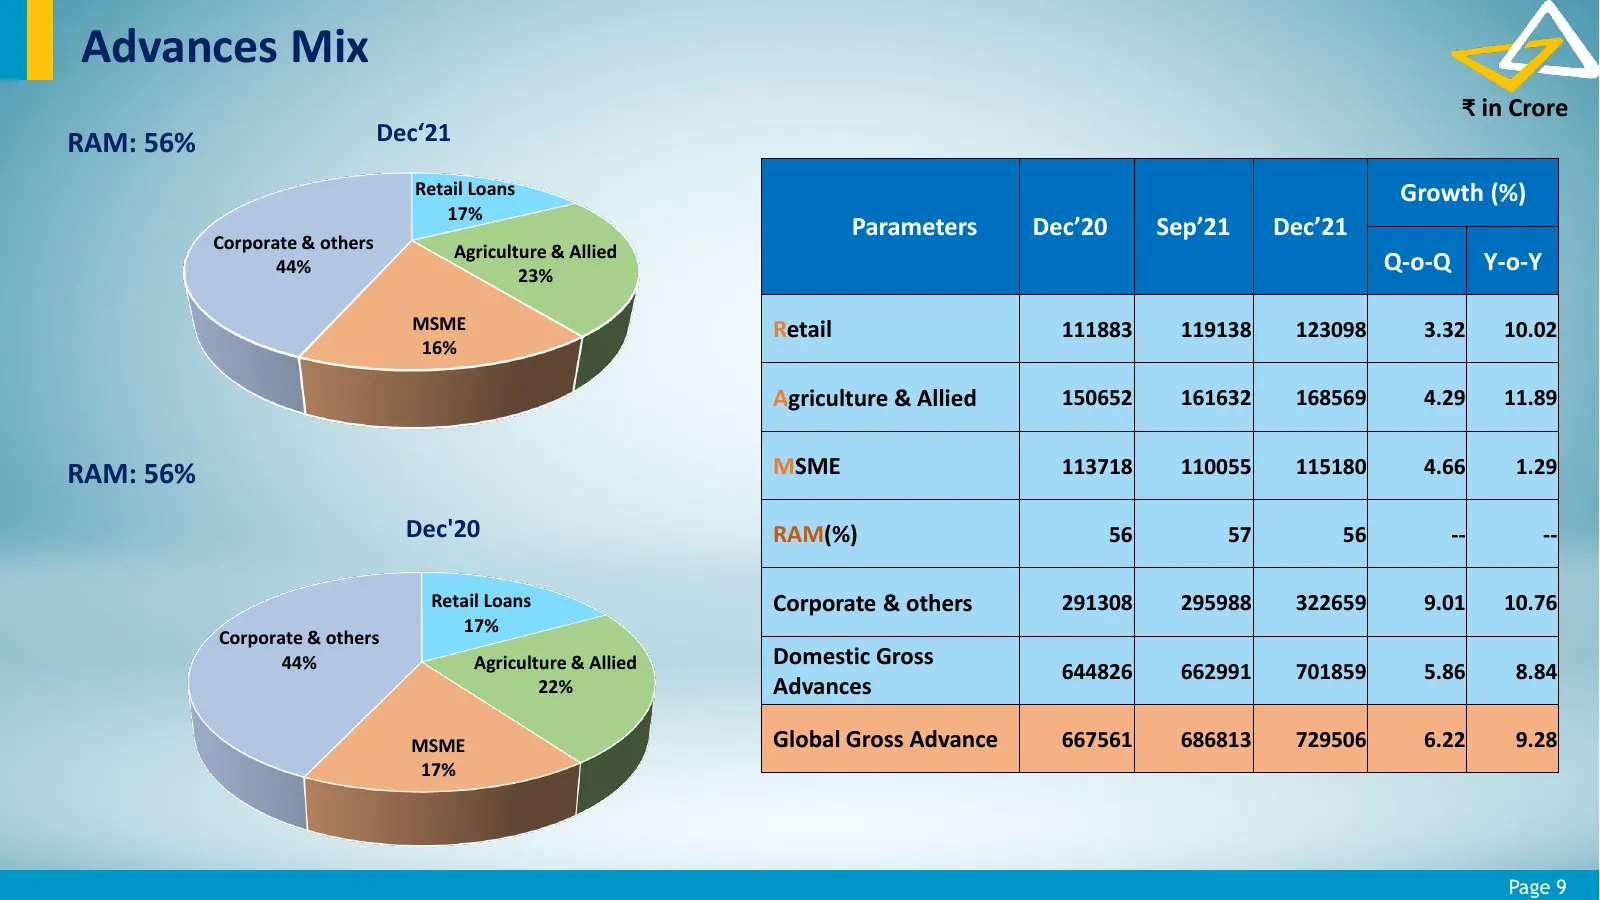
Advances Mix ₹ in Crore RAM: 56% Dec‘21 Retail Loans Growth (%) 17% Parameters Dec’20 Sep’21 Dec’21 Corporate & others Agriculture & Allied 44% 23% Q-o-Q Y-o-Y MSME Retail 111883 119138 123098 3.32 10.02 16% Agriculture & Allied 150652 161632 168569 4.29 11.89 RAM: 56% MSME 113718 110055 115180 4.66
Slide 10: Exceeded the Mandated Targets under Priority Sector
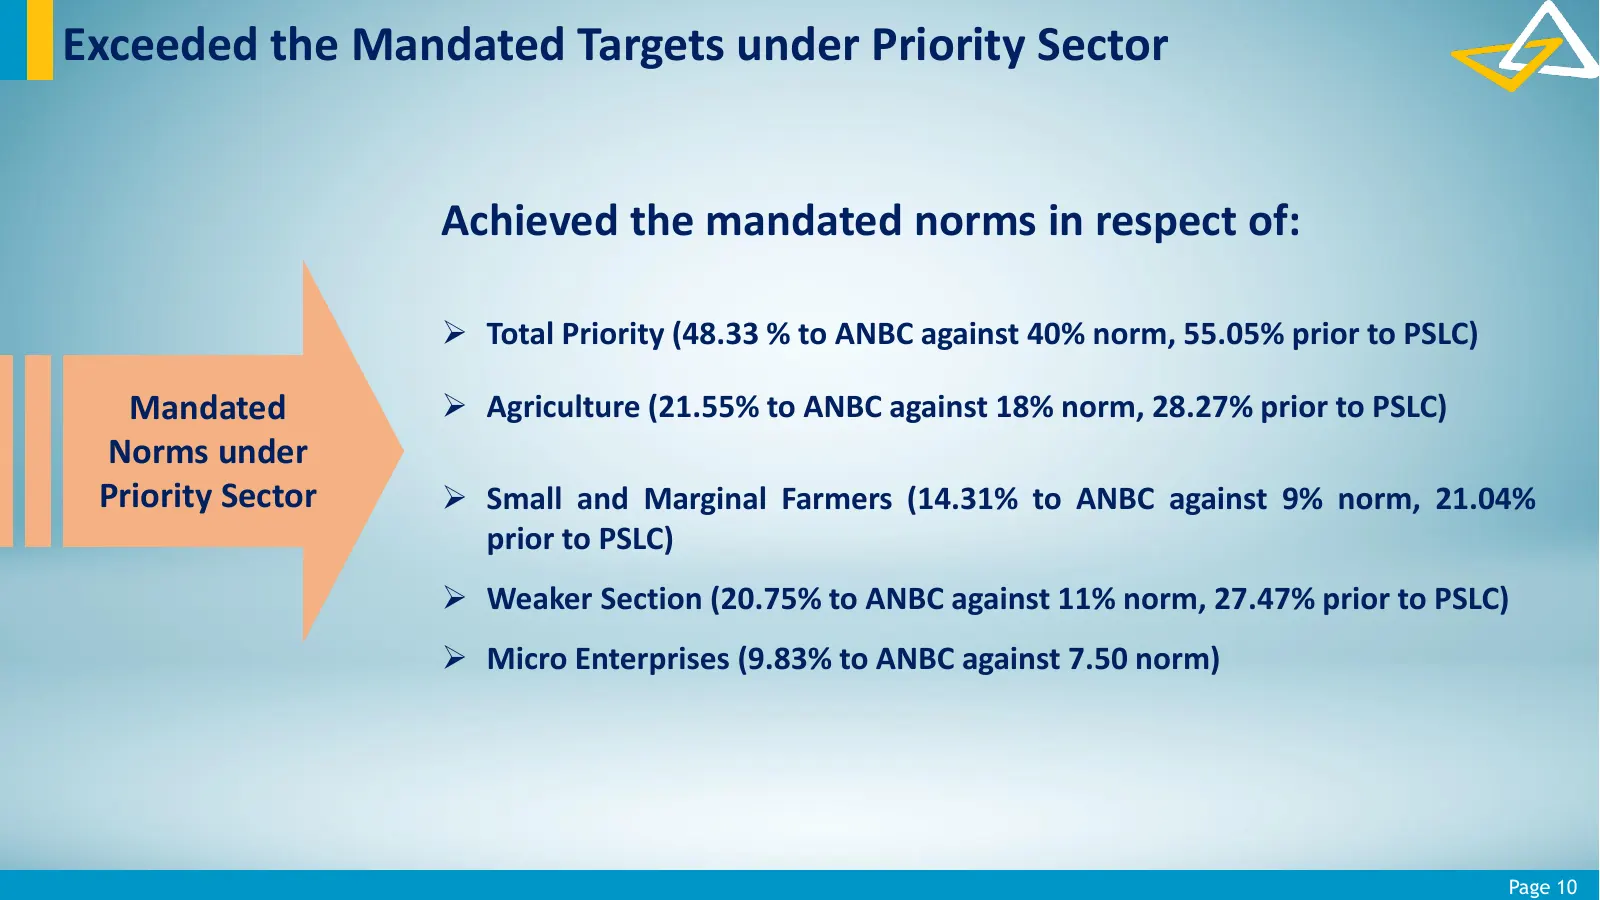
Exceeded the Mandated Targets under Priority Sector Achieved the mandated norms in respect of: Total Priority (48.33 % to ANBC against 40% norm, 55.05% prior to PSLC) Mandated Agriculture (21.55% to ANBC against 18% norm, 28.27% prior to PSLC) Norms under Priority Sector Small and Marginal Far
Slide 11: Retail Credit
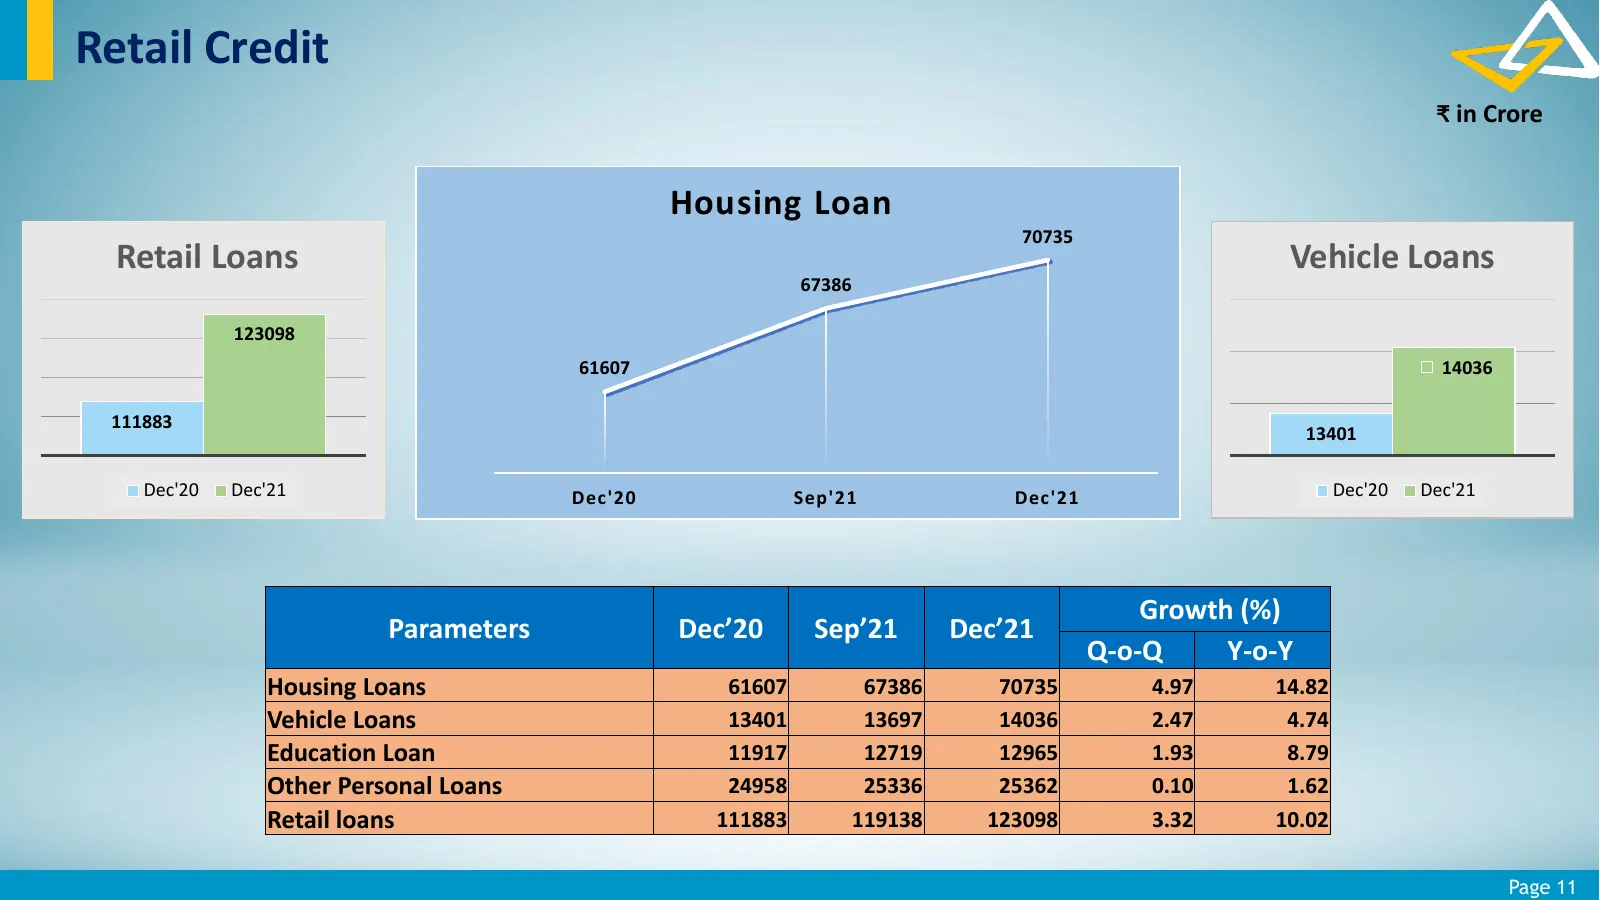
Retail Credit ₹ in Crore Housing Loan 70735 Retail Loans Vehicle Loans 67386 123098 61607 14036 111883 13401 Dec'20 Dec'21 Dec'20 Sep'21 Dec'21 Dec'20 Dec'21 Growth (%) Parameters Dec’20 Sep’21 Dec’21 Q-o-Q Y-o-Y Housing Loans 61607 67386 70735 4.97 14.82 Vehicle Loans 13401 13697 14036 2.47 4.74 Ed
Slide 12: Industry Credit
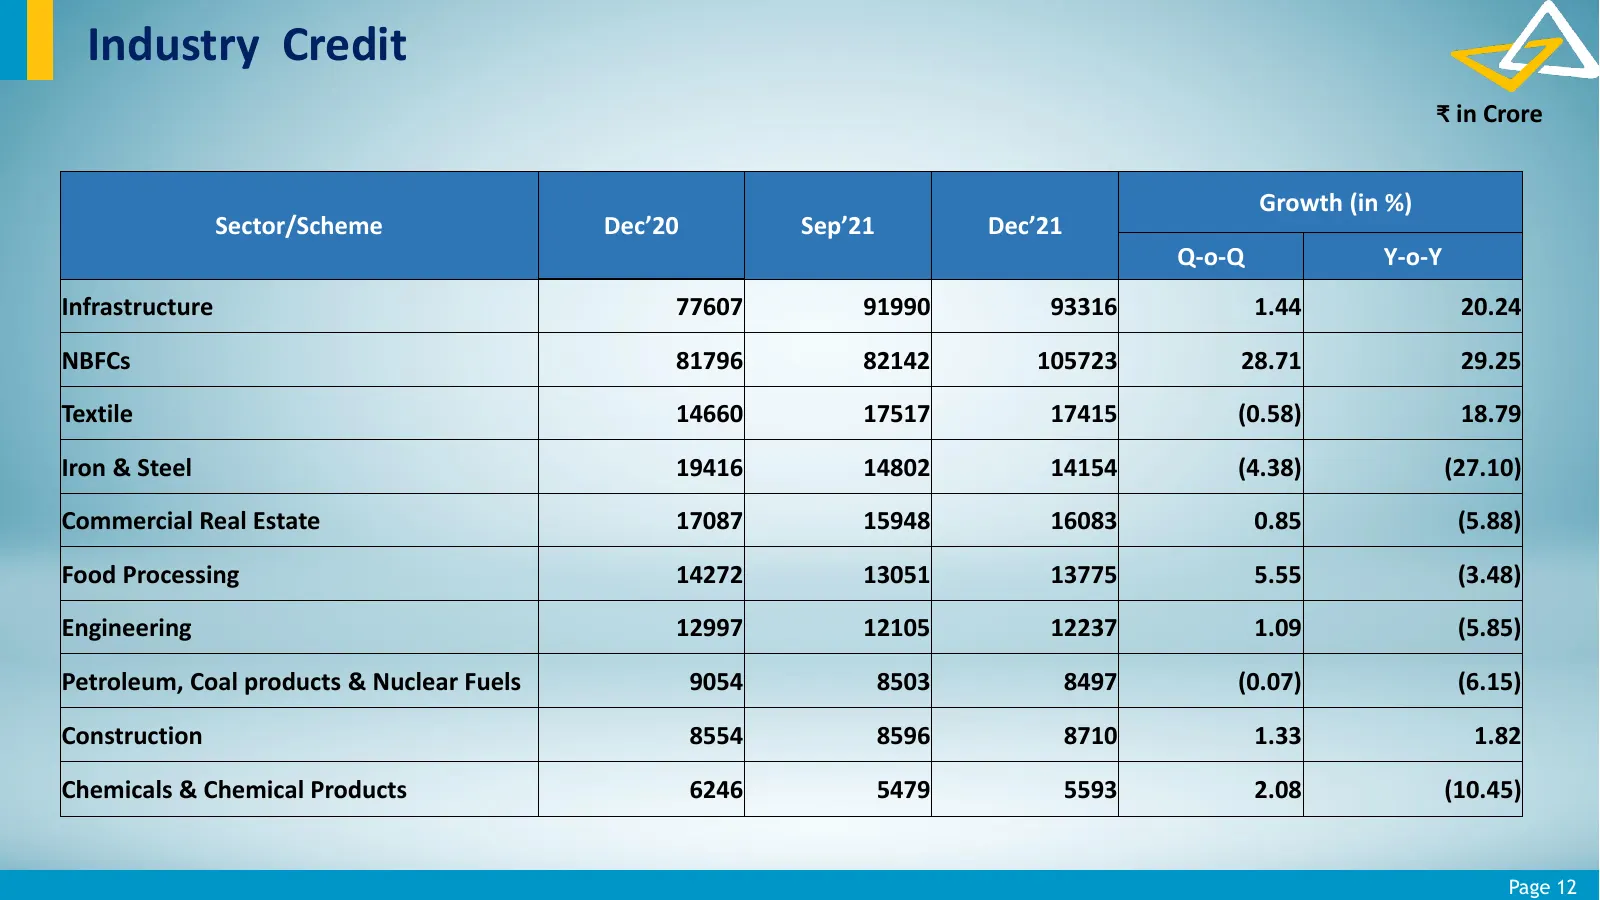
Industry Credit ₹ in Crore Growth (in %) Sector/Scheme Dec’20 Sep’21 Dec’21 Q-o-Q Y-o-Y Infrastructure 77607 91990 93316 1.44 20.24 NBFCs 81796 82142 105723 28.71 29.25 Textile 14660 17517 17415 (0.58) 18.79 Iron & Steel 19416 14802 14154 (4.38) (27.10) Commercial Real Estate 17087 15948 16083 0.85
Slide 13: COVID-19 Credit Support
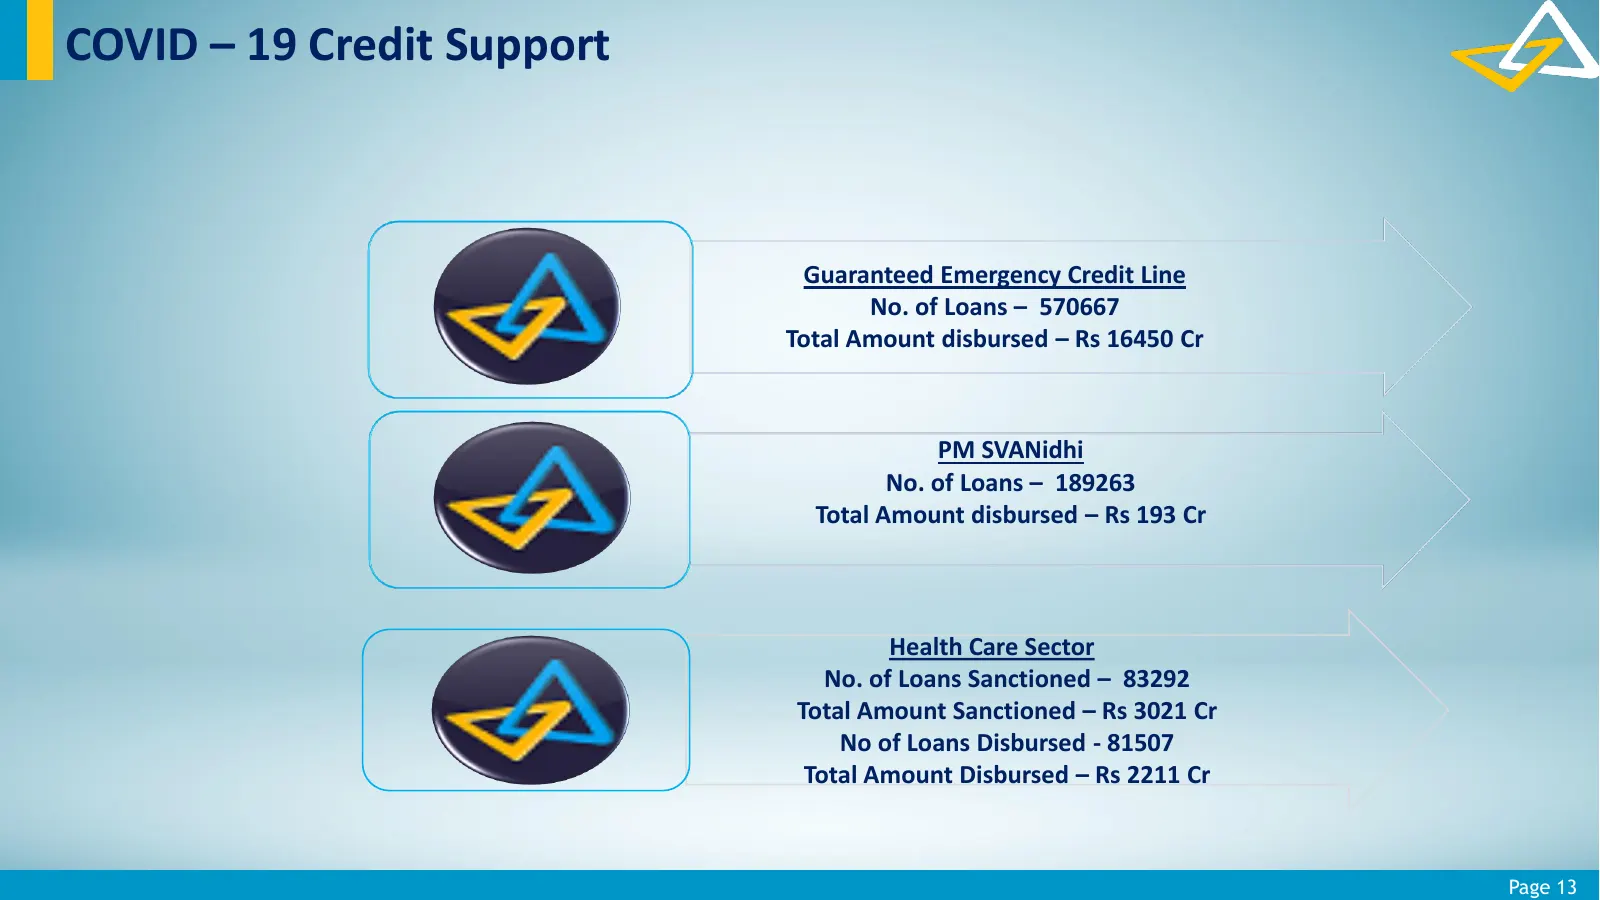
COVID – 19 Credit Support Guaranteed Emergency Credit Line No. of Loans – 570667 Total Amount disbursed – Rs 16450 Cr PM SVANidhi No. of Loans – 189263 Total Amount disbursed – Rs 193 Cr Health Care Sector No. of Loans Sanctioned – 83292 Total Amount Sanctioned – Rs 3021 Cr No of Loans Disbursed - 8
Slide 14: Rating Profile
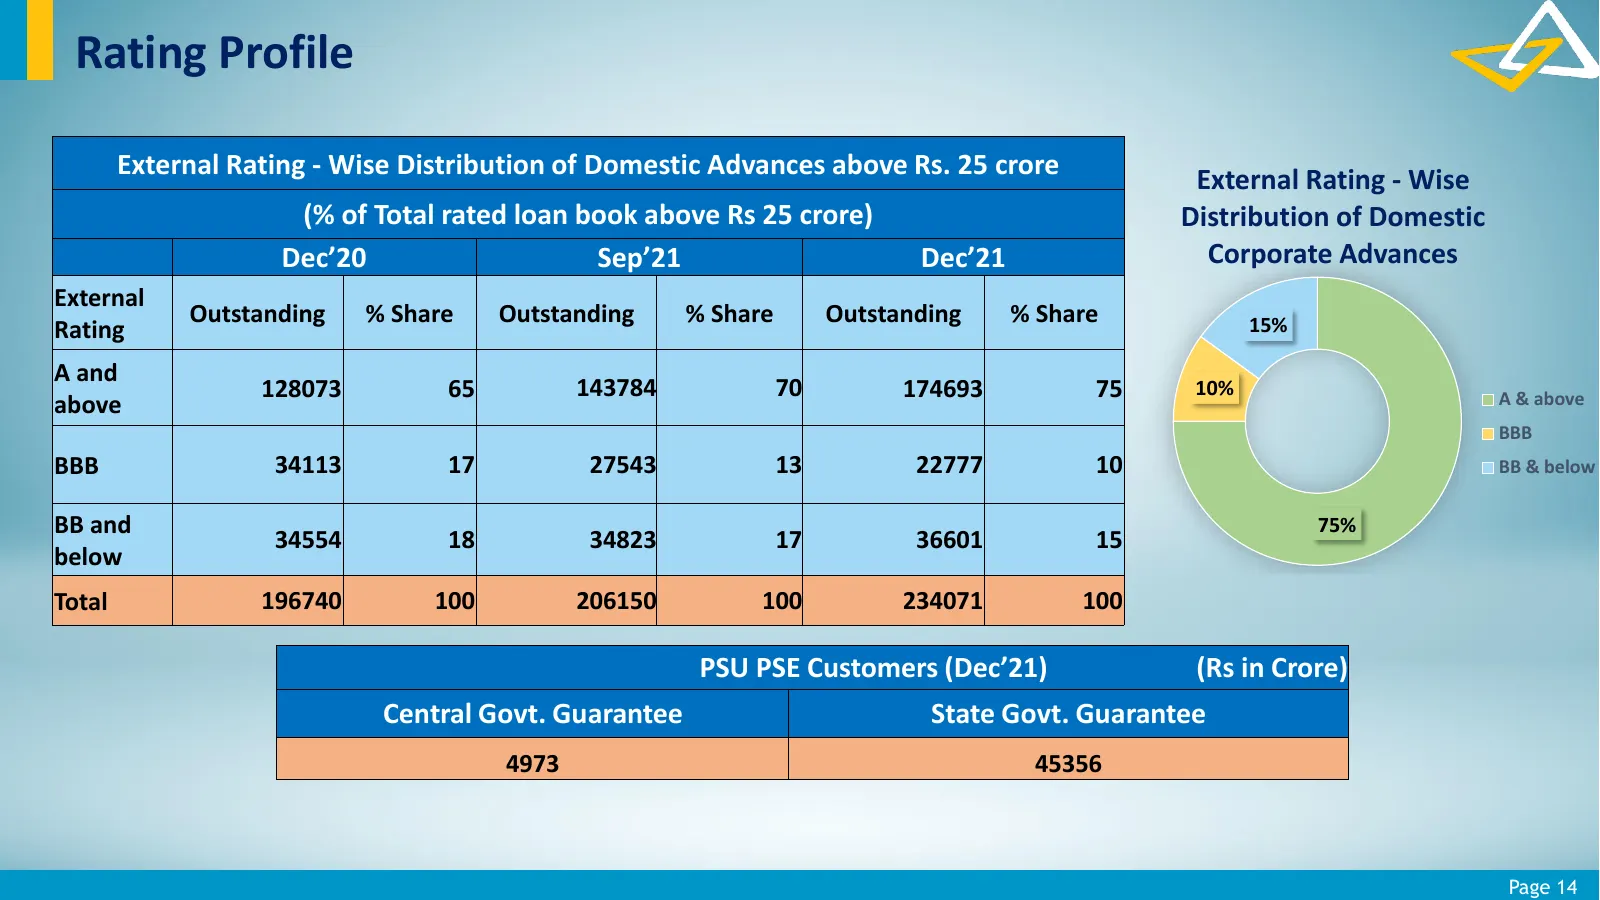
Rating Profile External Rating - Wise Distribution of Domestic Advances above Rs. 25 crore External Rating - Wise (% of Total rated loan book above Rs 25 crore) Distribution of Domestic Dec’20 Sep’21 Dec’21 Corporate Advances External Outstanding % Share Outstanding % Share Outstanding % Share 15% R
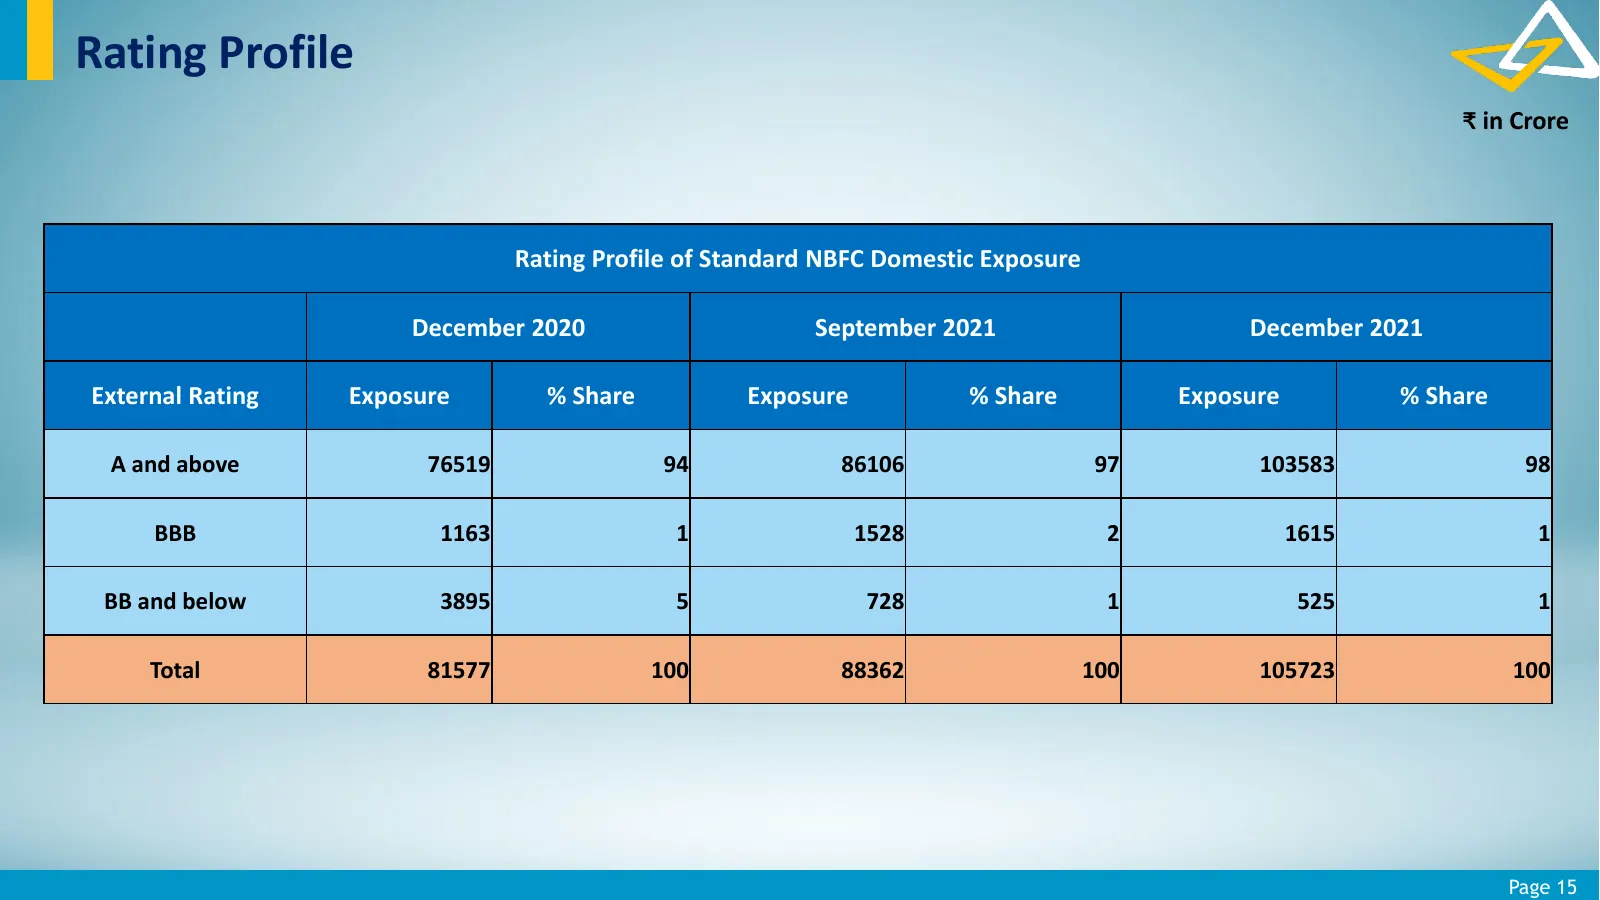
Slide 15: Rating Profile of Standard NBFC Domestic Exposure
Rating Profile ₹ in Crore Rating Profile of Standard NBFC Domestic Exposure December 2020 September 2021 December 2021 External Rating Exposure % Share Exposure % Share Exposure % Share A and above 76519 94 86106 97 103583 98 BBB 1163 1 1528 2 1615 1 BB and below 3895 5 728 1 525 1 Total 81577 100 8

Slide 16: Financial Performance
Financial Performance Page 16
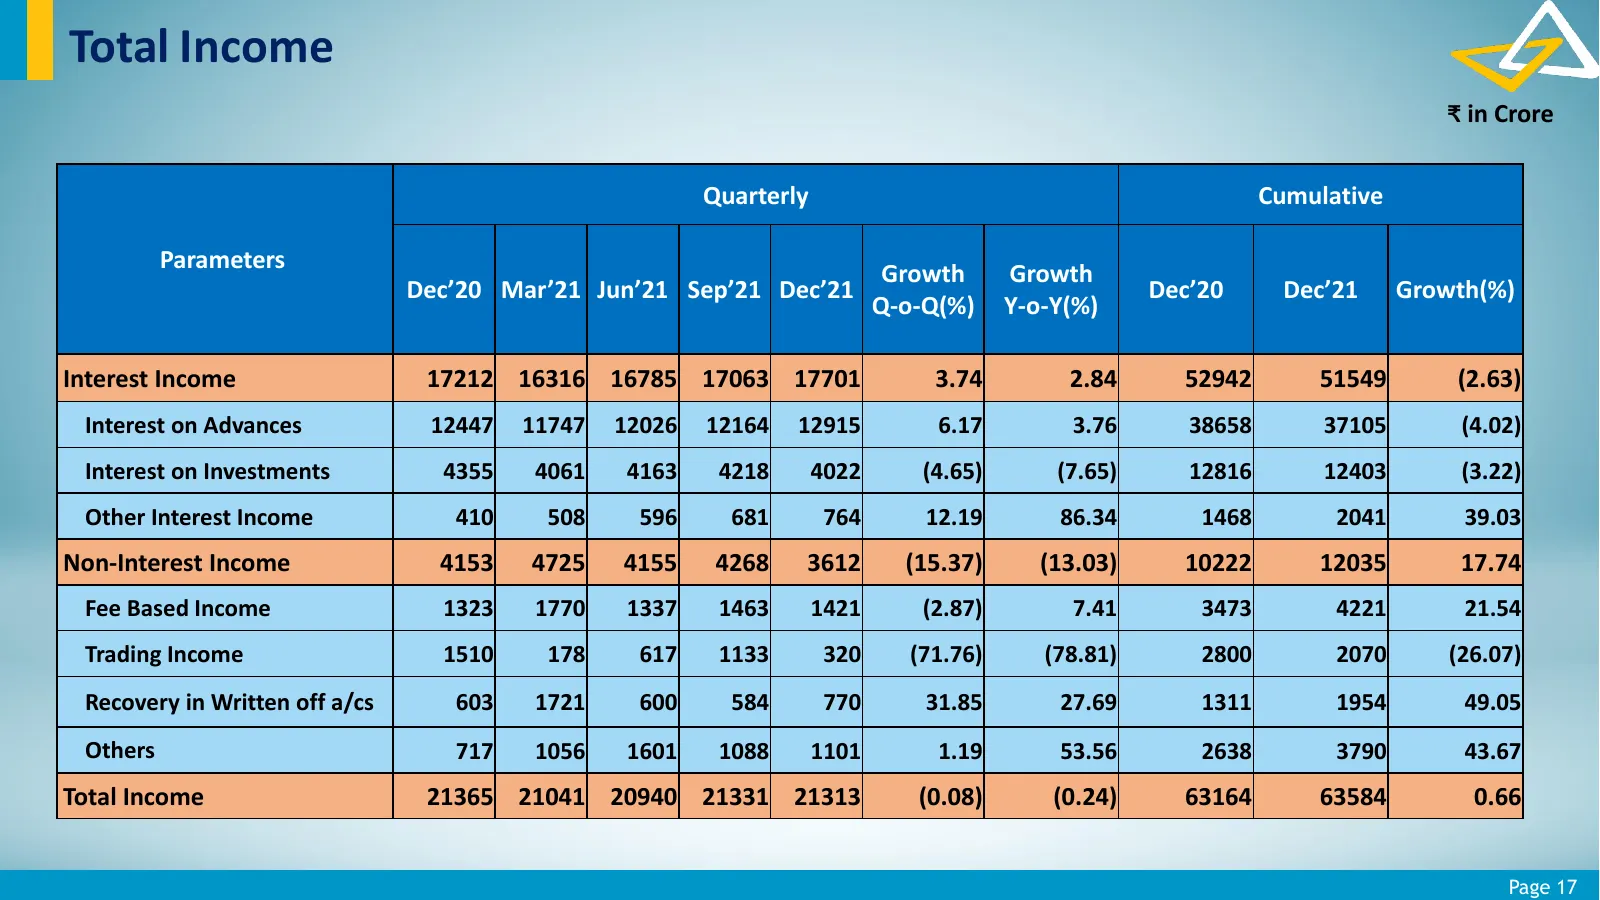
Slide 17: Total Income
Total Income ₹ in Crore Quarterly Cumulative Parameters Growth Growth Dec’20 Mar’21 Jun’21 Sep’21 Dec’21 Dec’20 Dec’21 Growth(%) Q-o-Q(%) Y-o-Y(%) Interest Income 17212 16316 16785 17063 17701 3.74 2.84 52942 51549 (2.63) Interest on Advances 12447 11747 12026 12164 12915 6.17 3.76 38658 37105 (4.02
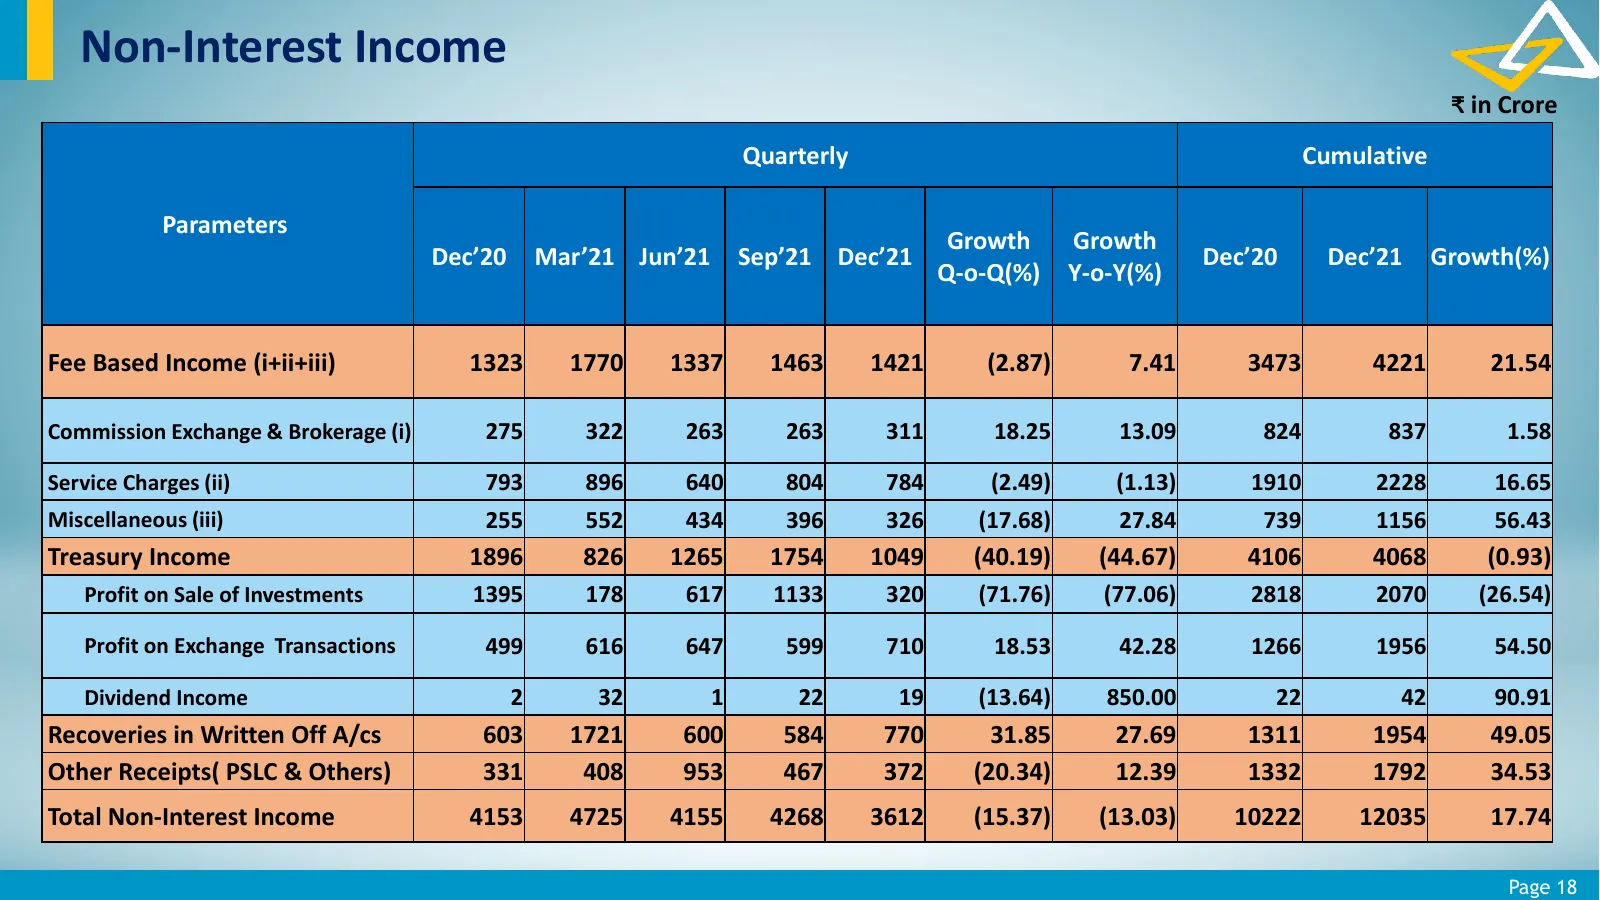
Slide 18: Non-Interest Income
Non-Interest Income ₹ in Crore Quarterly Cumulative Parameters Growth Growth Dec’20 Mar’21 Jun’21 Sep’21 Dec’21 Dec’20 Dec’21 Growth(%) Q-o-Q(%) Y-o-Y(%) Fee Based Income (i+ii+iii) 1323 1770 1337 1463 1421 (2.87) 7.41 3473 4221 21.54 Commission Exchange & Brokerage (i) 275 322 263 263 311 18.25 13.
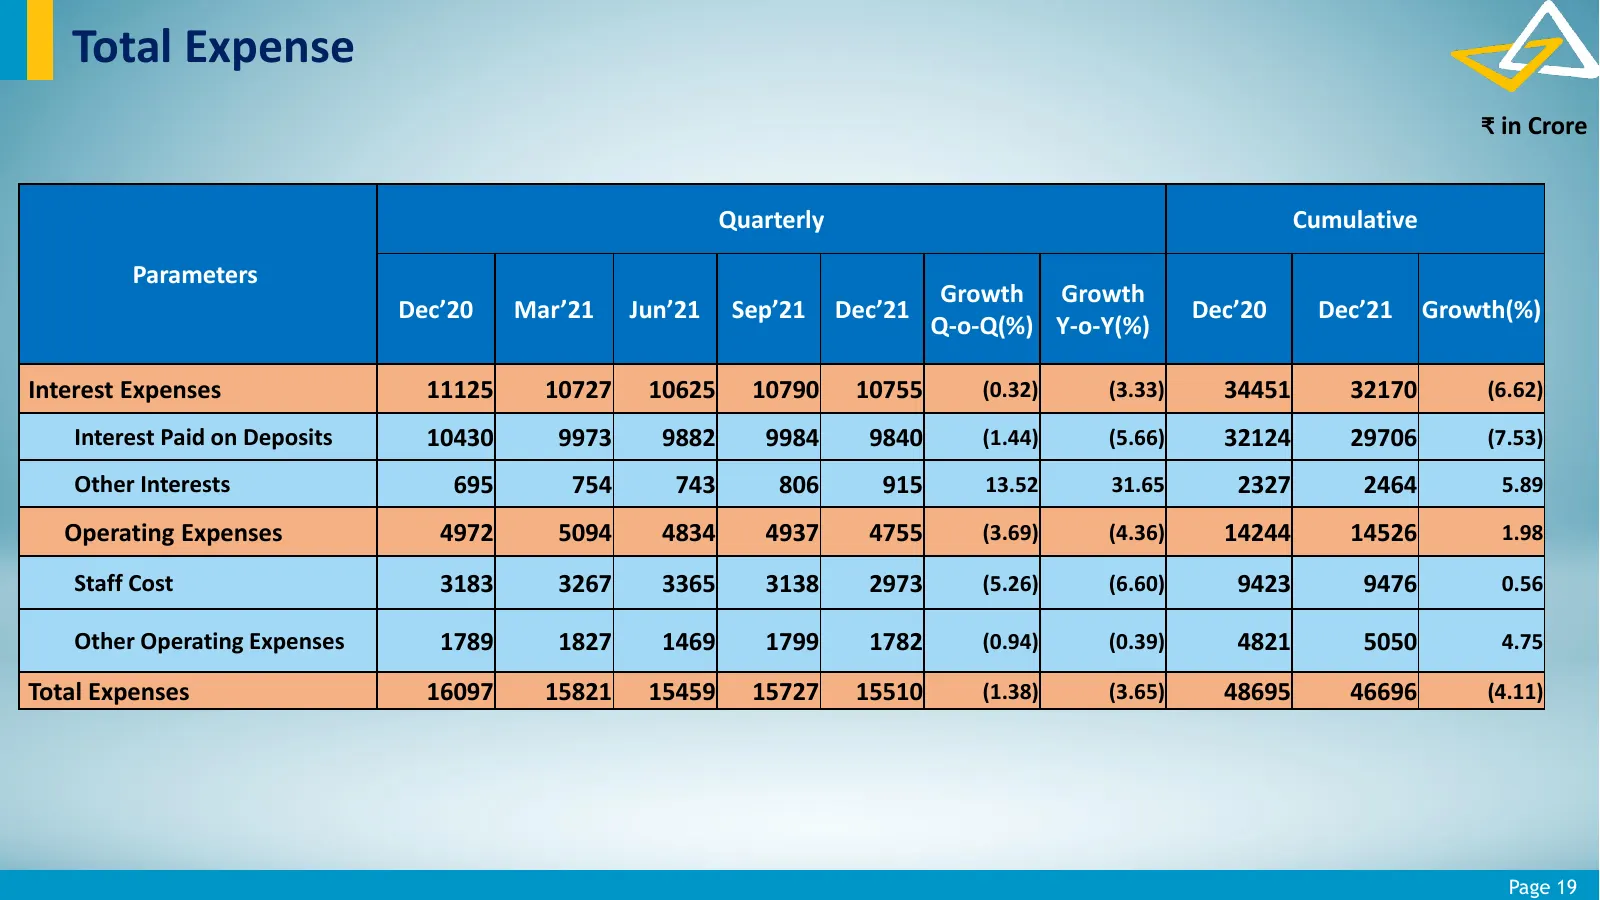
Slide 19: Total Expense
Total Expense ₹ in Crore Quarterly Cumulative Parameters Growth Growth Dec’20 Mar’21 Jun’21 Sep’21 Dec’21 Dec’20 Dec’21 Growth(%) Q-o-Q(%) Y-o-Y(%) Interest Expenses 11125 10727 10625 10790 10755 (0.32) (3.33) 34451 32170 (6.62) Interest Paid on Deposits 10430 9973 9882 9984 9840 (1.44) (5.66) 32124
Slide 20: Financials at a Glance
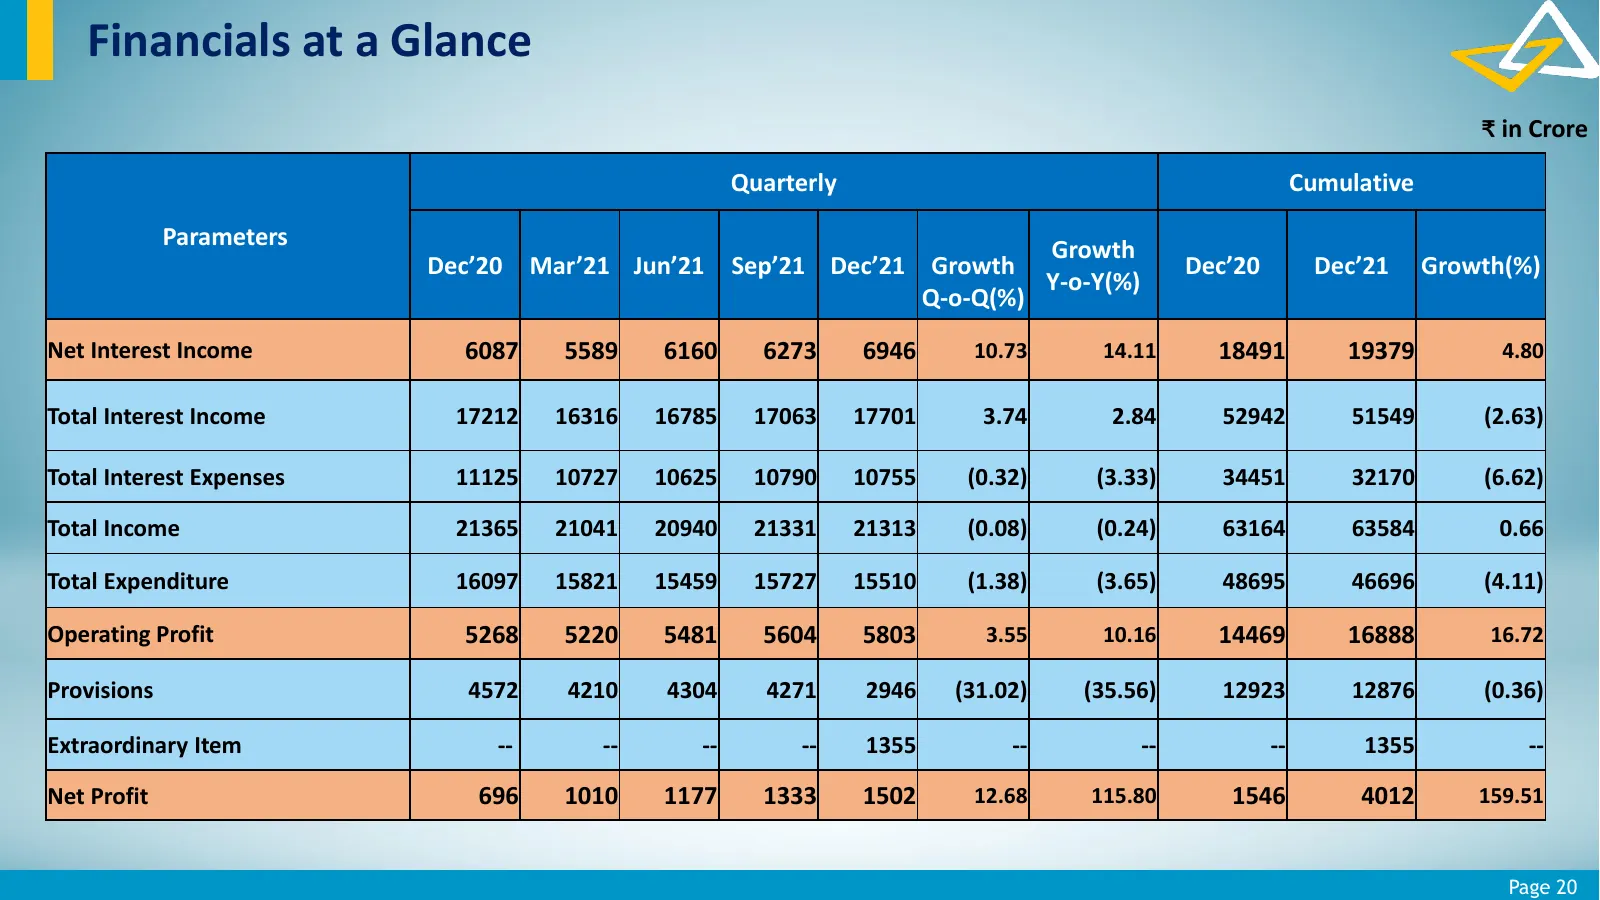
Financials at a Glance ₹ in Crore Quarterly Cumulative Parameters Growth Dec’20 Mar’21 Jun’21 Sep’21 Dec’21 Growth Dec’20 Dec’21 Growth(%) Y-o-Y(%) Q-o-Q(%) Net Interest Income 6087 5589 6160 6273 6946 10.73 14.11 18491 19379 4.80 Total Interest Income 17212 16316 16785 17063 17701 3.74 2.84 52942 5
Slide 21: Provisions
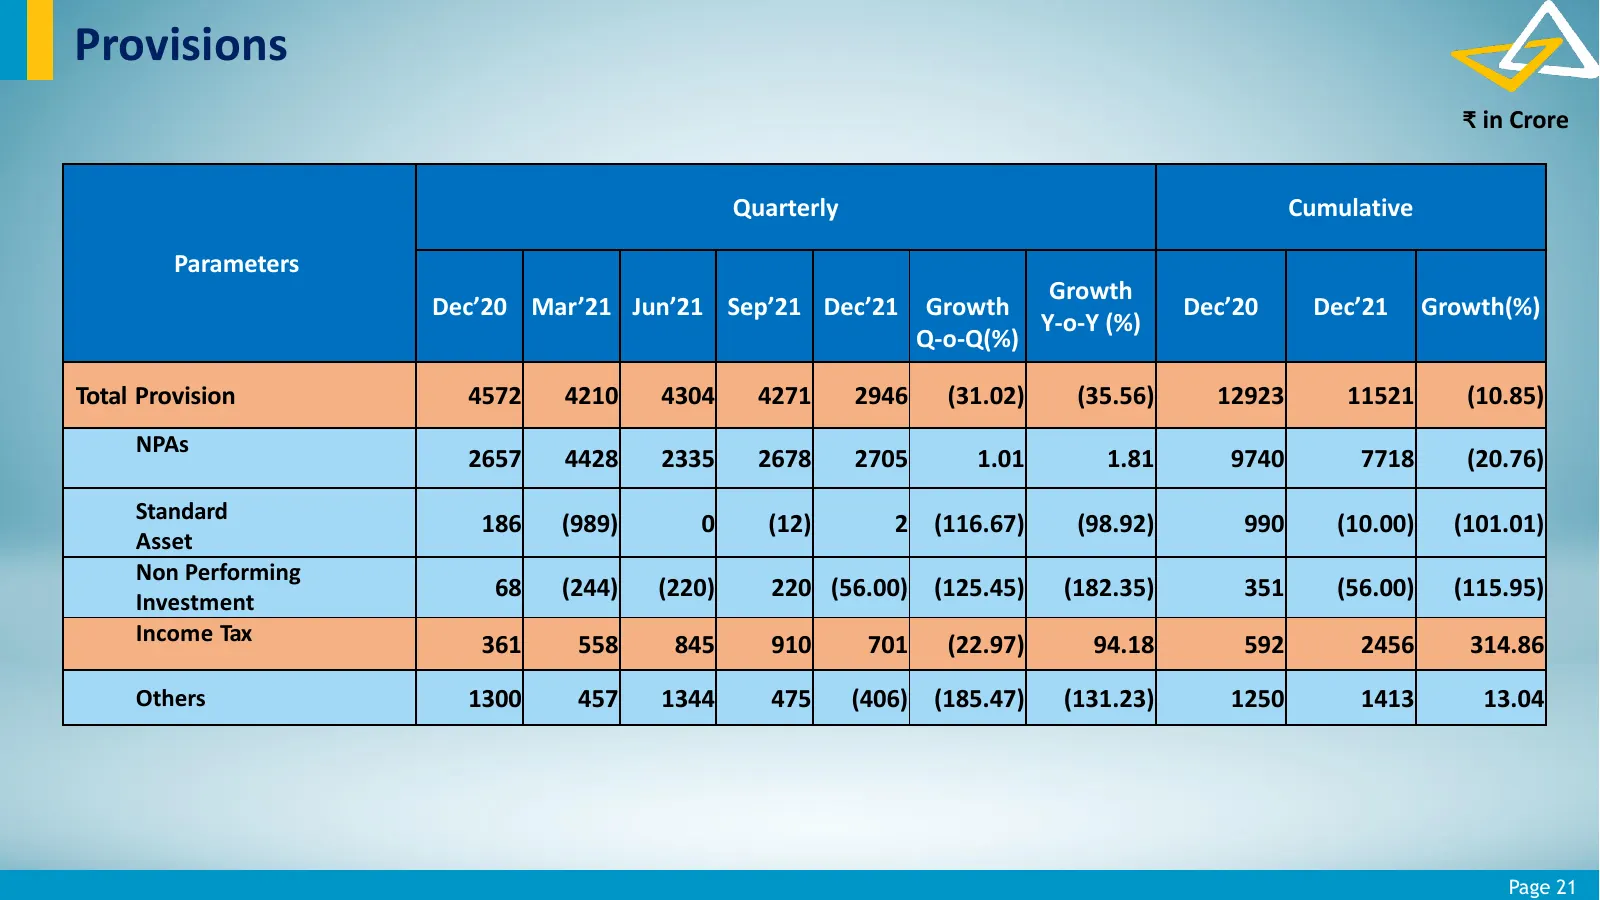
Provisions ₹ in Crore Quarterly Cumulative Parameters Growth Dec’20 Mar’21 Jun’21 Sep’21 Dec’21 Growth Dec’20 Dec’21 Growth(%) Y-o-Y (%) Q-o-Q(%) Total Provision 4572 4210 4304 4271 2946 (31.02) (35.56) 12923 11521 (10.85) NPAs 2657 4428 2335 2678 2705 1.01 1.81 9740 7718 (20.76) Standard 186 (989)
Slide 22: Key Ratios
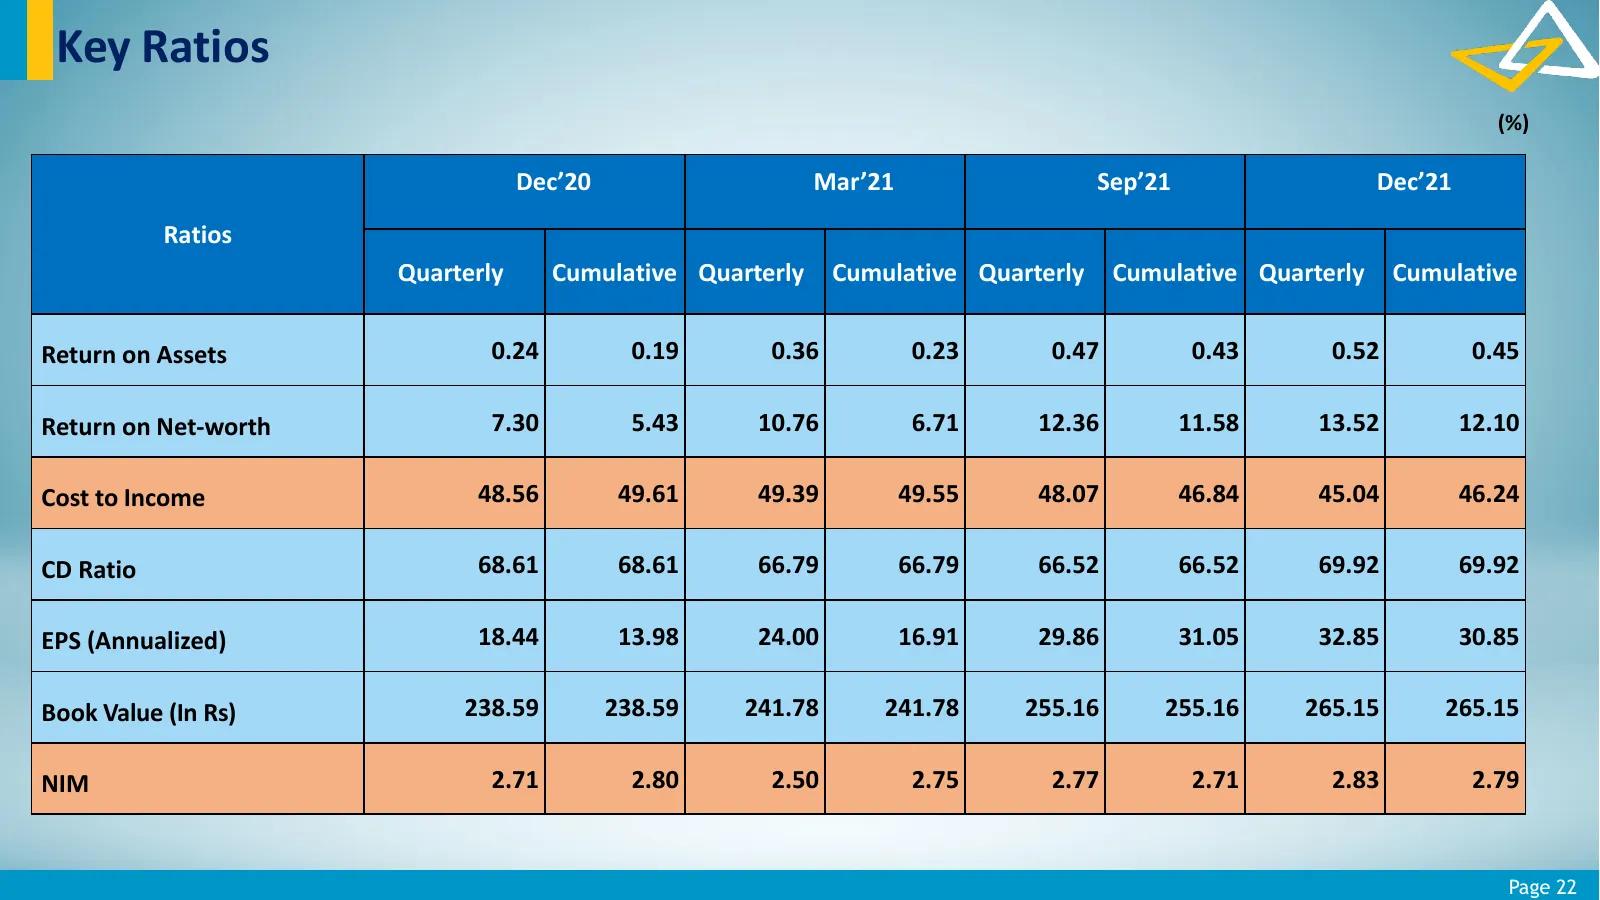
Key Ratios (%) Dec’20 Mar’21 Sep’21 Dec’21 Ratios Quarterly Cumulative Quarterly Cumulative Quarterly Cumulative Quarterly Cumulative Return on Assets 0.24 0.19 0.36 0.23 0.47 0.43 0.52 0.45 Return on Net-worth 7.30 5.43 10.76 6.71 12.36 11.58 13.52 12.10 Cost to Income 48.56 49.61 49.39 49.55 48.07
Slide 23: Key Ratios – 9M FY22
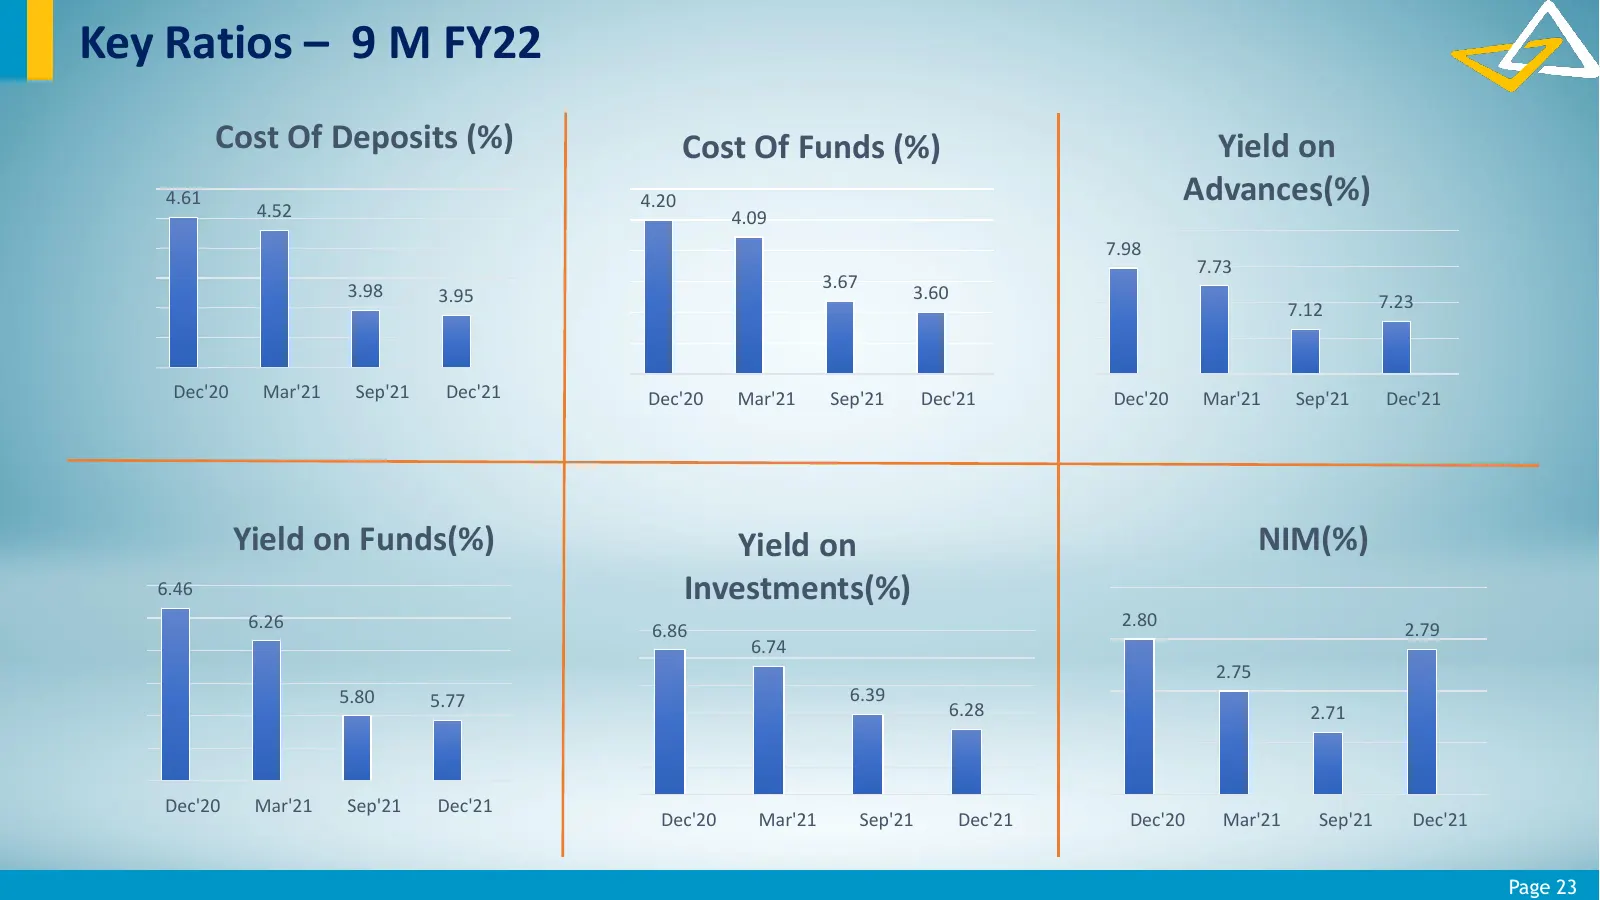
Key Ratios – 9 M FY22 Cost Of Deposits (%) Cost Of Funds (%) Yield on 4.61 4.52 4.20 Advances(%) 4.09 7.98 7.73 3.98 3.67 3.95 3.60 7.23 7.12 Dec'20 Mar'21 Sep'21 Dec'21 Dec'20 Mar'21 Sep'21 Dec'21 Dec'20 Mar'21 Sep'21 Dec'21 Yield on Funds(%) Yield on NIM(%) 6.46 Investments(%) 6.26 2.80 6.86 2.79

Slide 24: Investments
Investments Page 24
Slide 25: Investment Portfolio
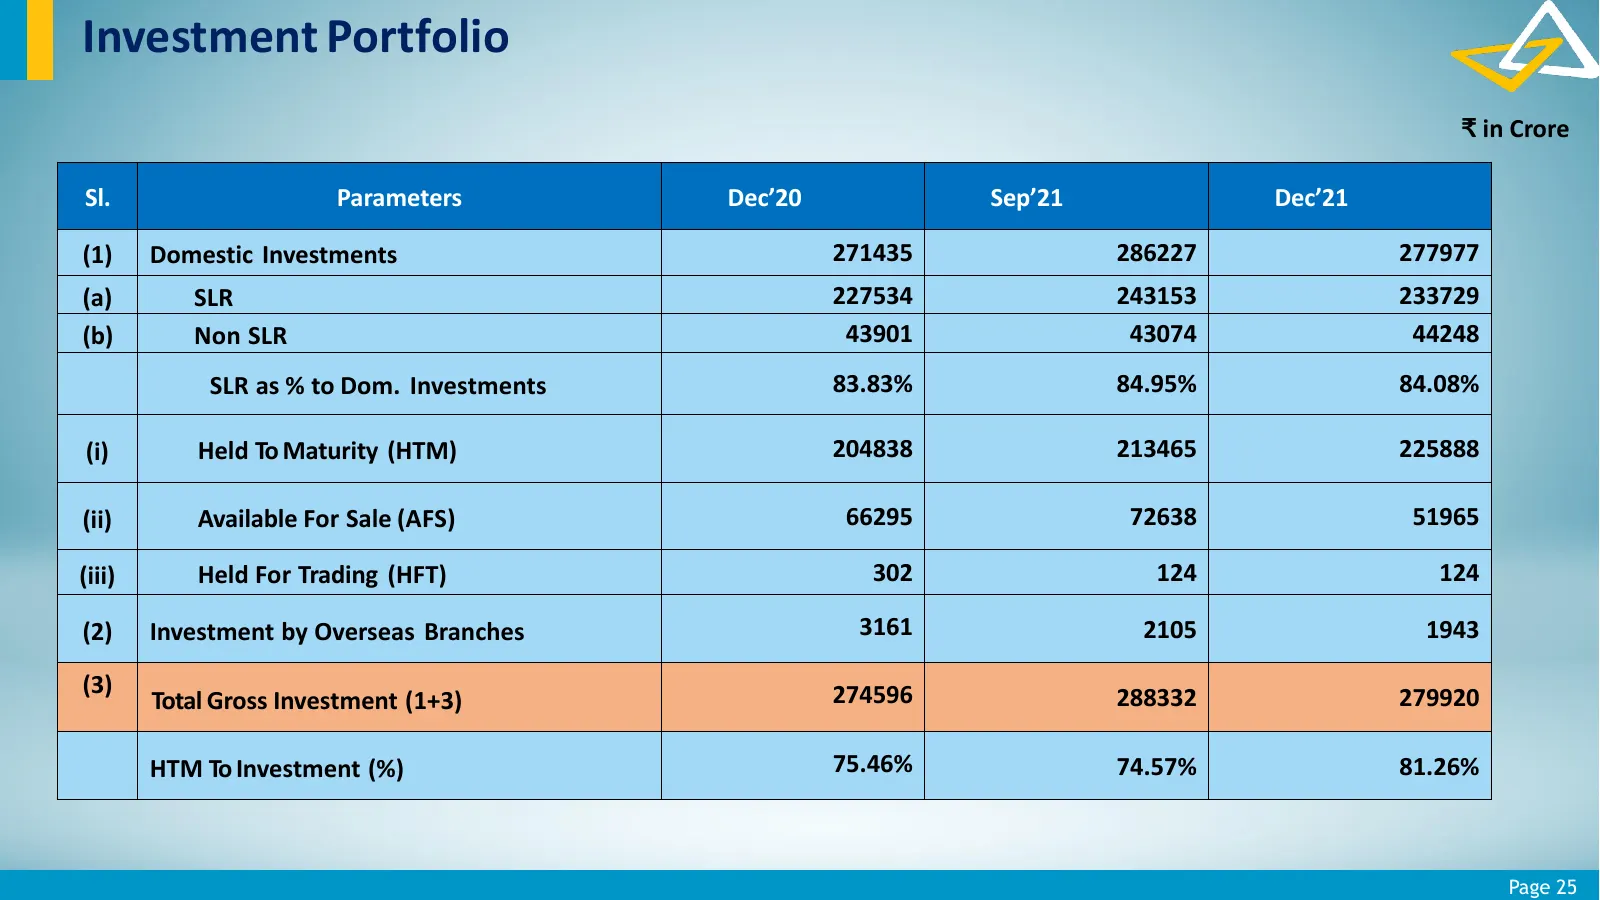
Investment Portfolio ₹ in Crore Sl. Parameters Dec’20 Sep’21 Dec’21 (1) Domestic Investments 271435 286227 277977 (a) SLR 227534 243153 233729 (b) Non SLR 43901 43074 44248 SLR as % to Dom. Investments 83.83% 84.95% 84.08% (i) Held To Maturity (HTM) 204838 213465 225888 (ii) Available For Sale (AFS)
Slide 26: Non SLR Portfolio
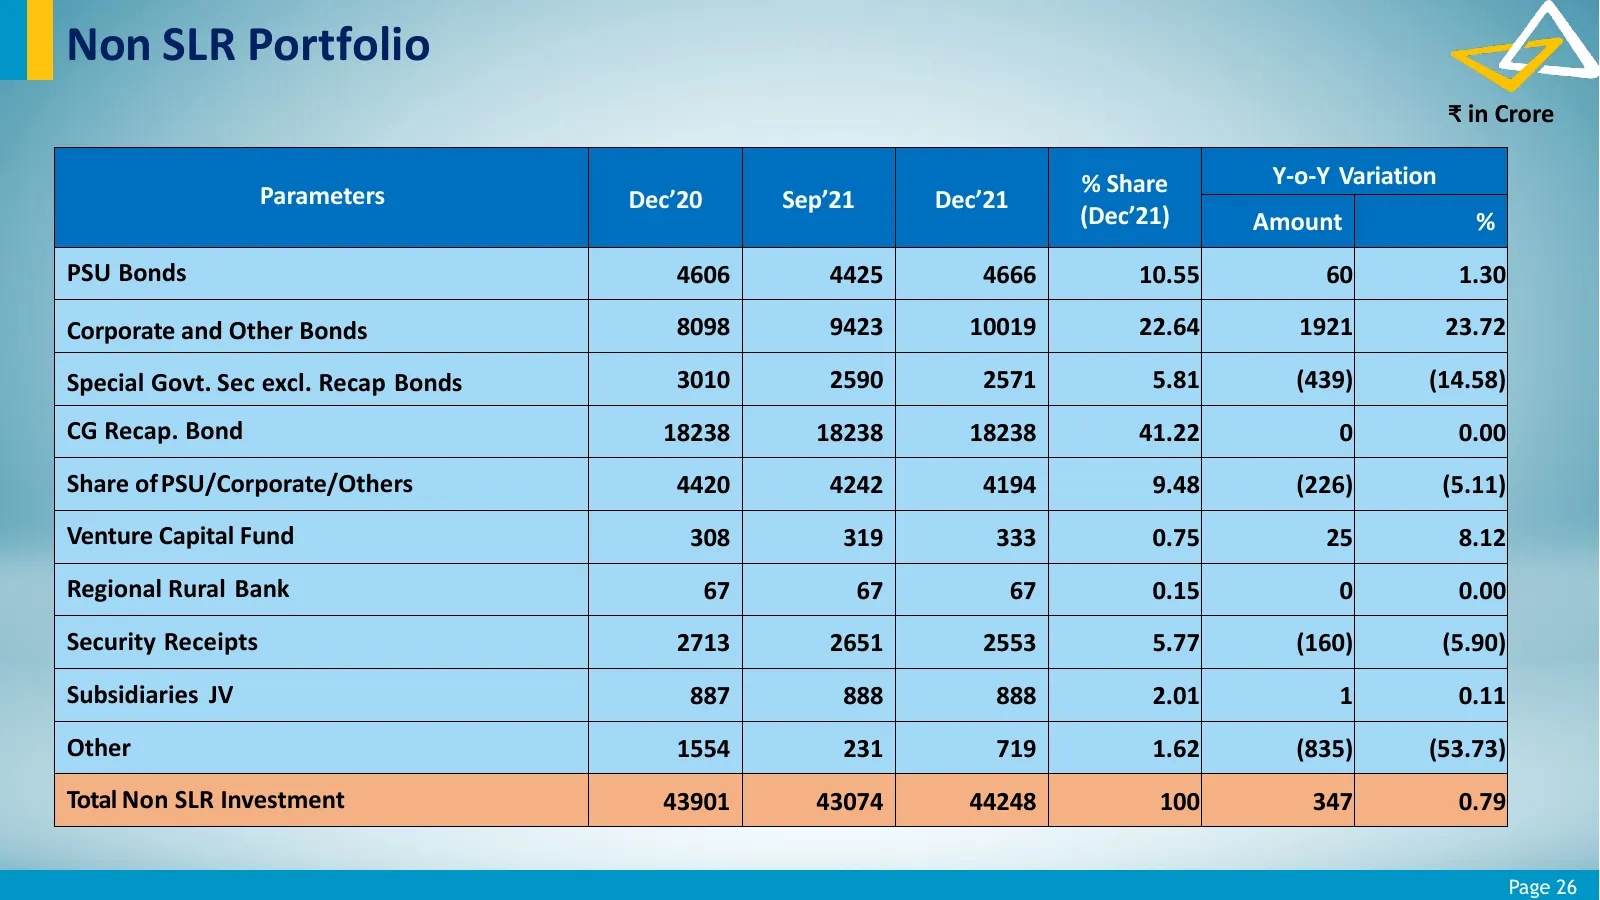
Non SLR Portfolio ₹ in Crore % Share Y-o-Y Variation Parameters Dec’20 Sep’21 Dec’21 (Dec’21) Amount % PSU Bonds 4606 4425 4666 10.55 60 1.30 Corporate and Other Bonds 8098 9423 10019 22.64 1921 23.72 Special Govt. Sec excl. Recap Bonds 3010 2590 2571 5.81 (439) (14.58) CG Recap. Bond 18238 18238 18

Slide 27: Asset Quality
Asset Quality Page 27
Slide 28: Asset Quality Ratios
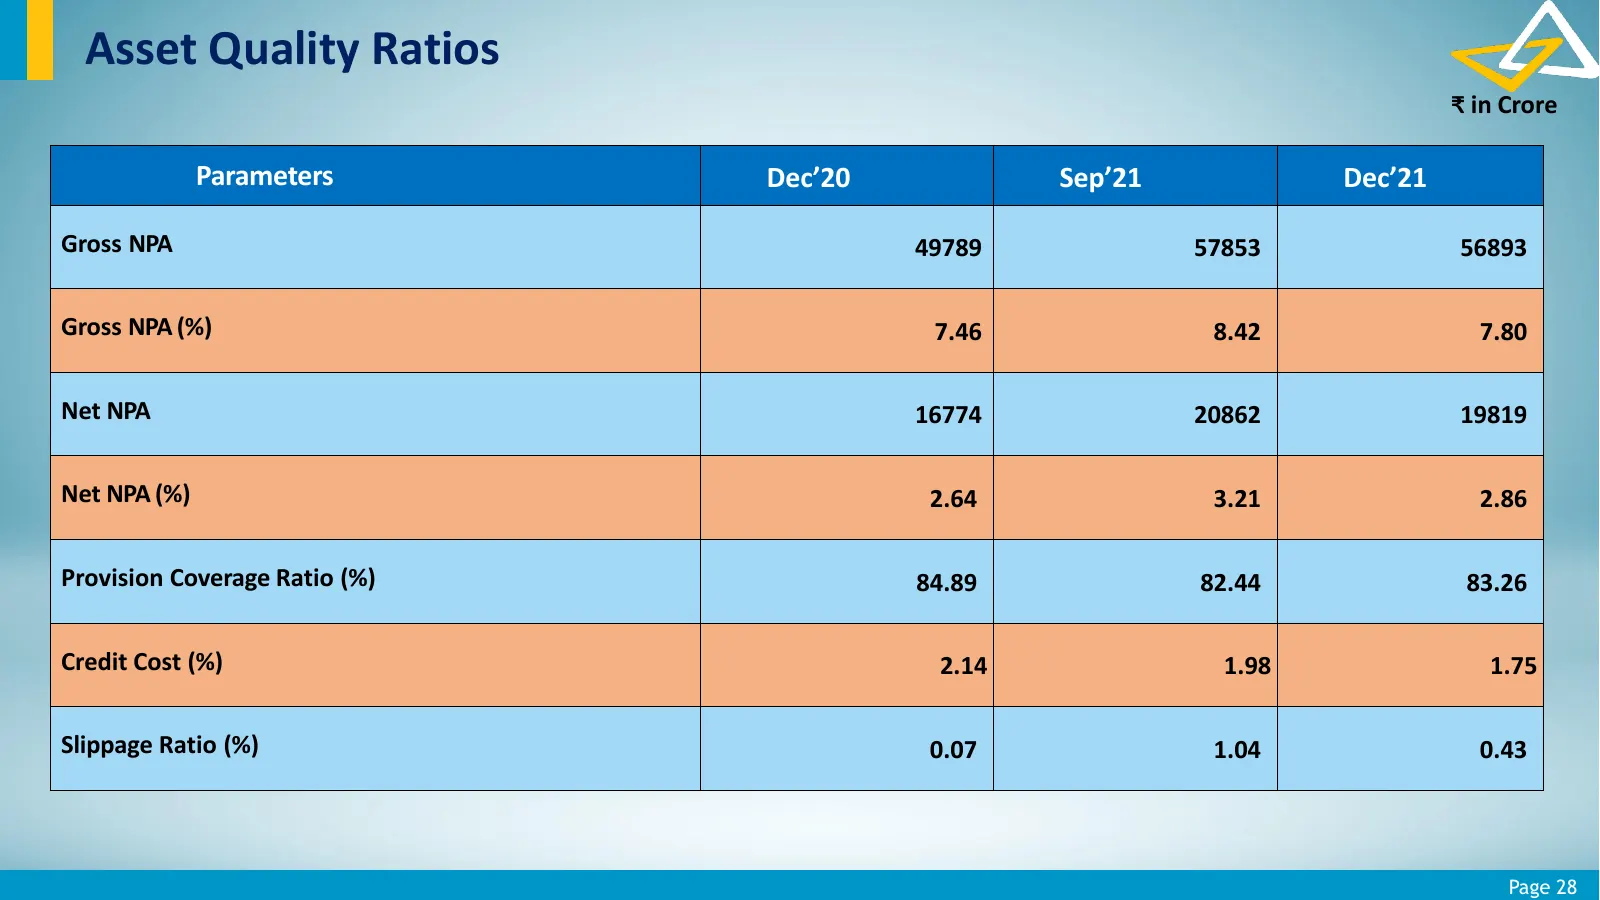
Asset Quality Ratios ₹ in Crore Parameters Dec’20 Sep’21 Dec’21 Gross NPA 49789 57853 56893 Gross NPA (%) 7.46 8.42 7.80 Net NPA 16774 20862 19819 Net NPA (%) 2.64 3.21 2.86 Provision Coverage Ratio (%) 84.89 82.44 83.26 Credit Cost (%) 2.14 1.98 1.75 Slippage Ratio (%) 0.07 1.04 0.43 Page 28
Slide 29: Movement of NPA
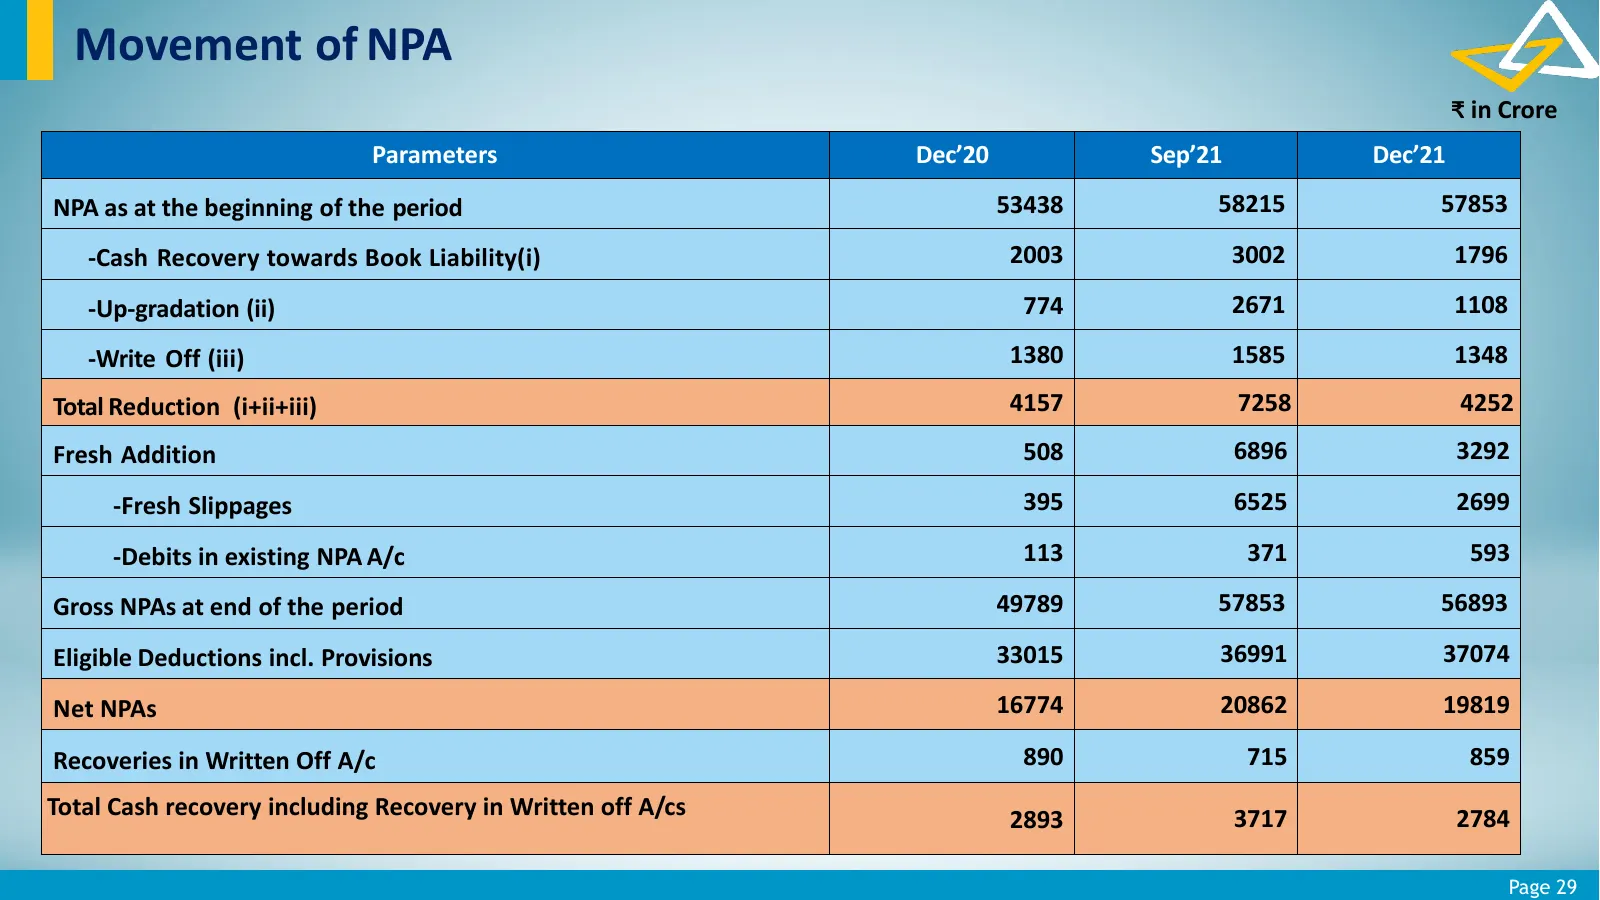
Movement of NPA ₹ in Crore Parameters Dec’20 Sep’21 Dec’21 NPA as at the beginning of the period 53438 58215 57853 -Cash Recovery towards Book Liability(i) 2003 3002 1796 -Up-gradation (ii) 774 2671 1108 -Write Off (iii) 1380 1585 1348 Total Reduction (i+ii+iii) 4157 7258 4252 Fresh Addition 508 689
Slide 30: NPA Classification: Sector Wise
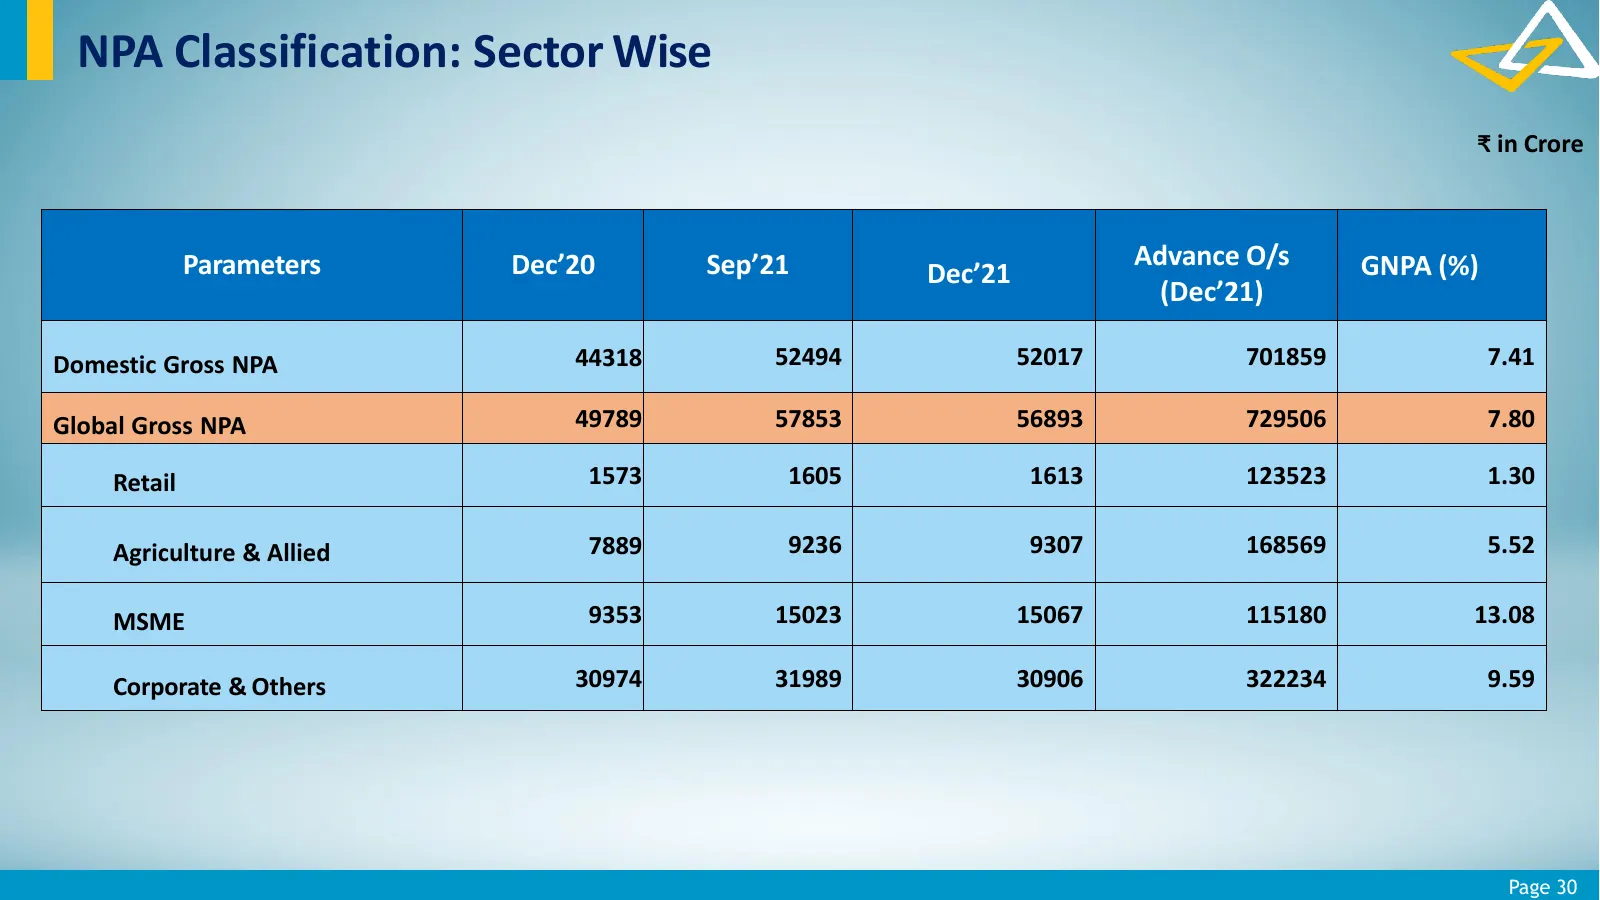
NPA Classification: Sector Wise ₹ in Crore Parameters Dec’20 Sep’21 Advance O/s GNPA (%) Dec’21 (Dec’21) Domestic Gross NPA 44318 52494 52017 701859 7.41 Global Gross NPA 49789 57853 56893 729506 7.80 Retail 1573 1605 1613 123523 1.30 Agriculture & Allied 7889 9236 9307 168569 5.52 MSME 9353 15023 1
Slide 31: Retail Sector NPA
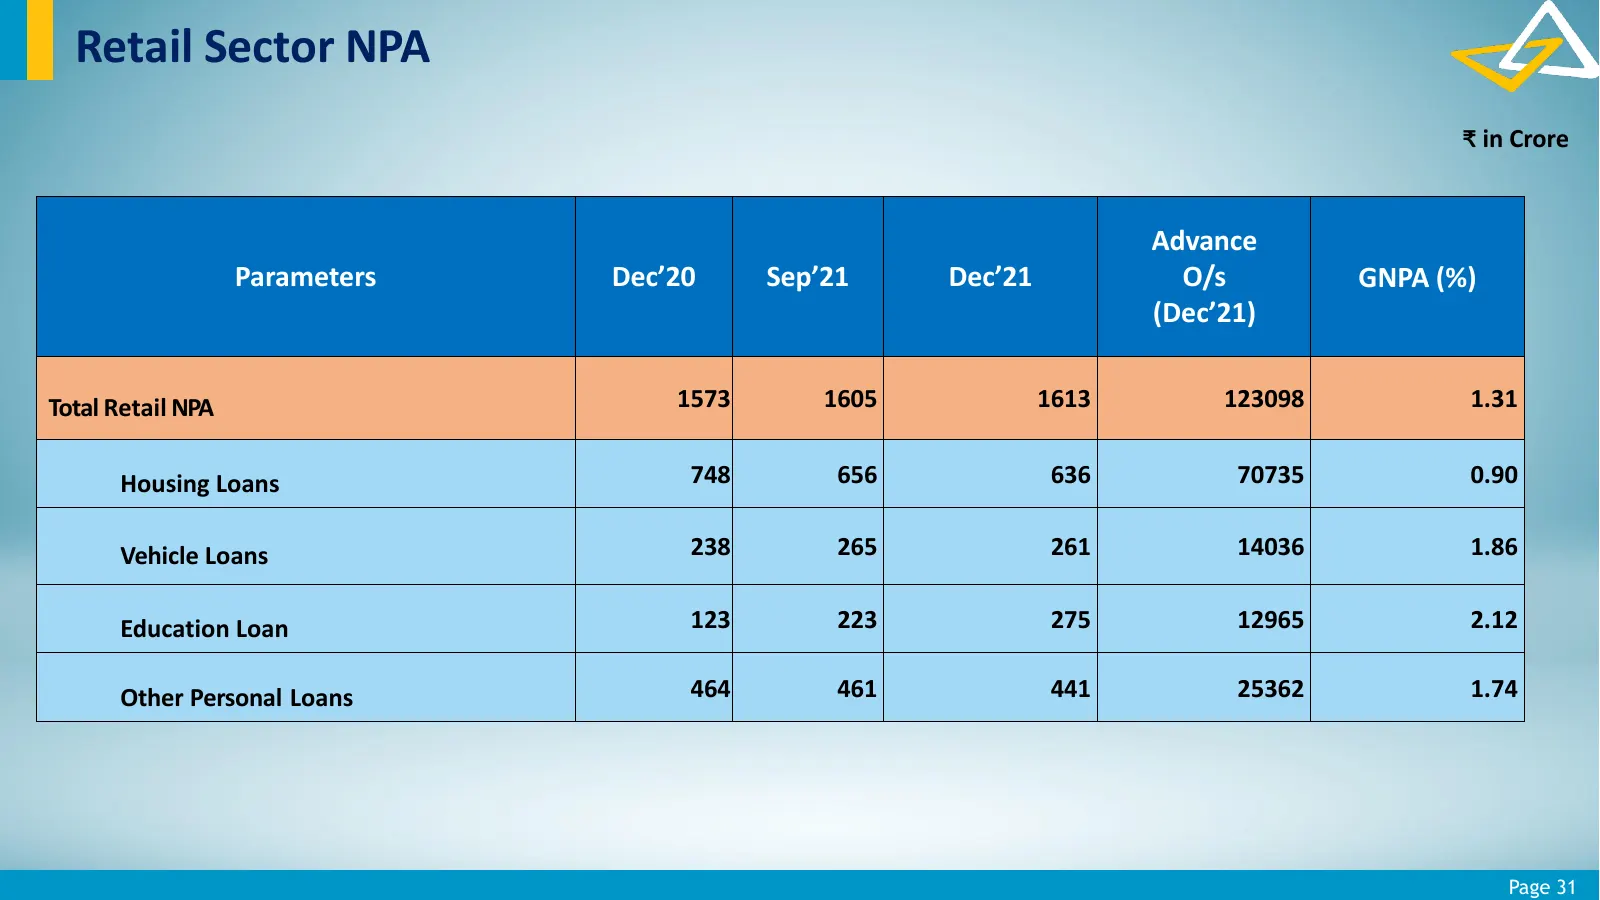
Retail Sector NPA ₹ in Crore Advance Parameters Dec’20 Sep’21 Dec’21 O/s GNPA (%) (Dec’21) Total Retail NPA 1573 1605 1613 123098 1.31 Housing Loans 748 656 636 70735 0.90 Vehicle Loans 238 265 261 14036 1.86 Education Loan 123 223 275 12965 2.12 Other Personal Loans 464 461 441 25362 1.74 Page 31
Slide 32: NPA Classification: Industry wise
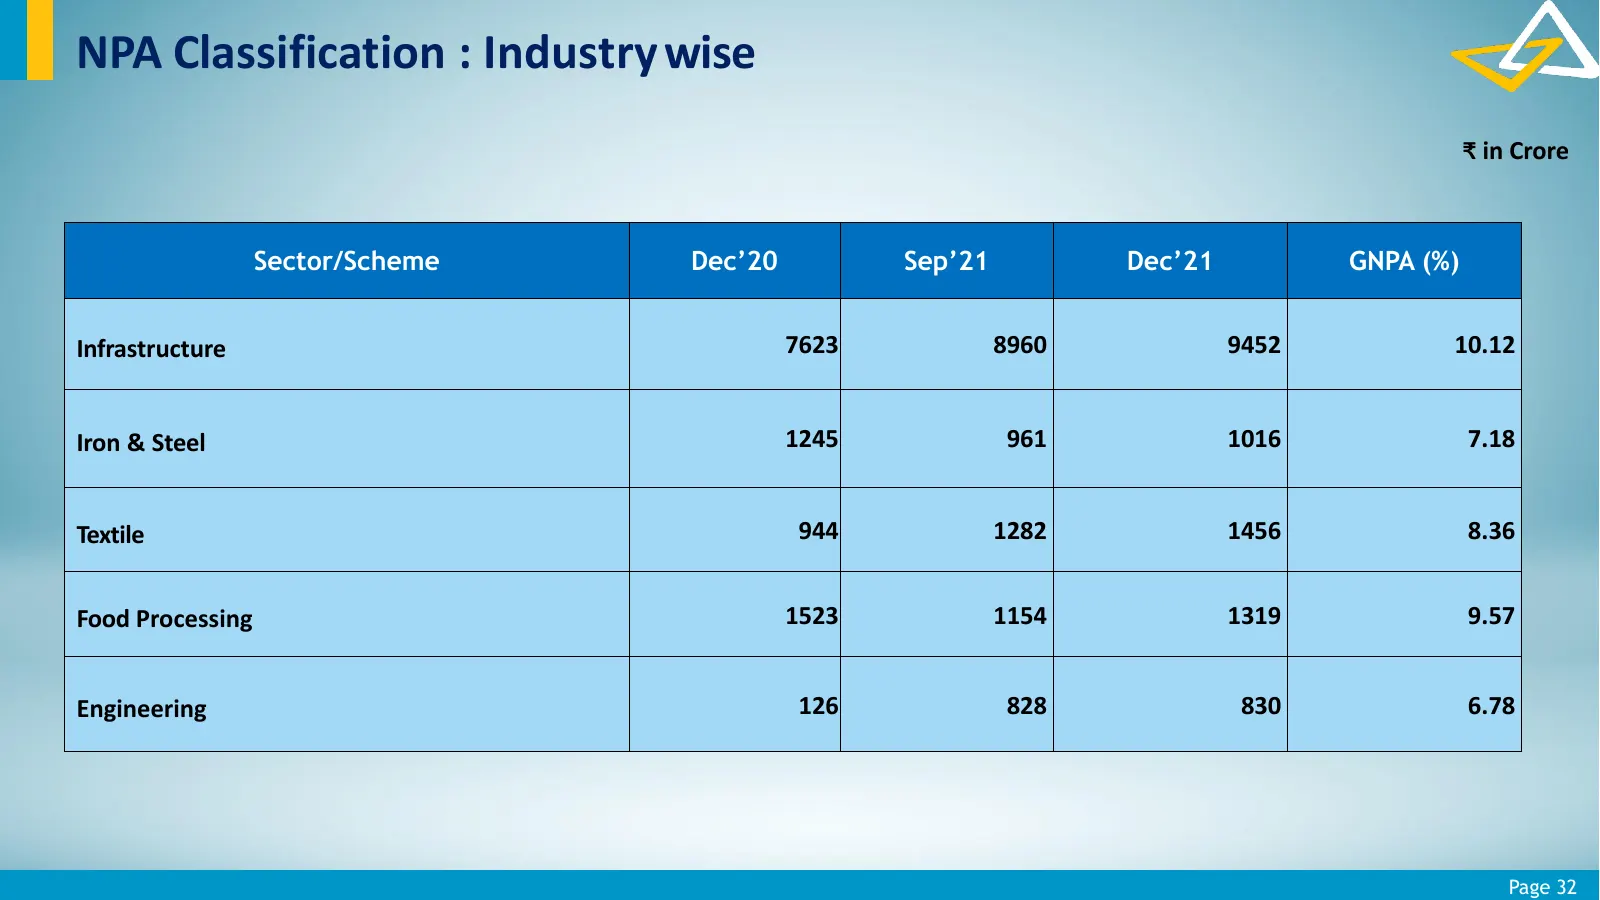
NPA Classification : Industry wise ₹ in Crore Sector/Scheme Dec’20 Sep’21 Dec’21 GNPA (%) Infrastructure 7623 8960 9452 10.12 Iron & Steel 1245 961 1016 7.18 Textile 944 1282 1456 8.36 Food Processing 1523 1154 1319 9.57 Engineering 126 828 830 6.78 Page 32
Slide 33: Resolution Framework for COVID-19
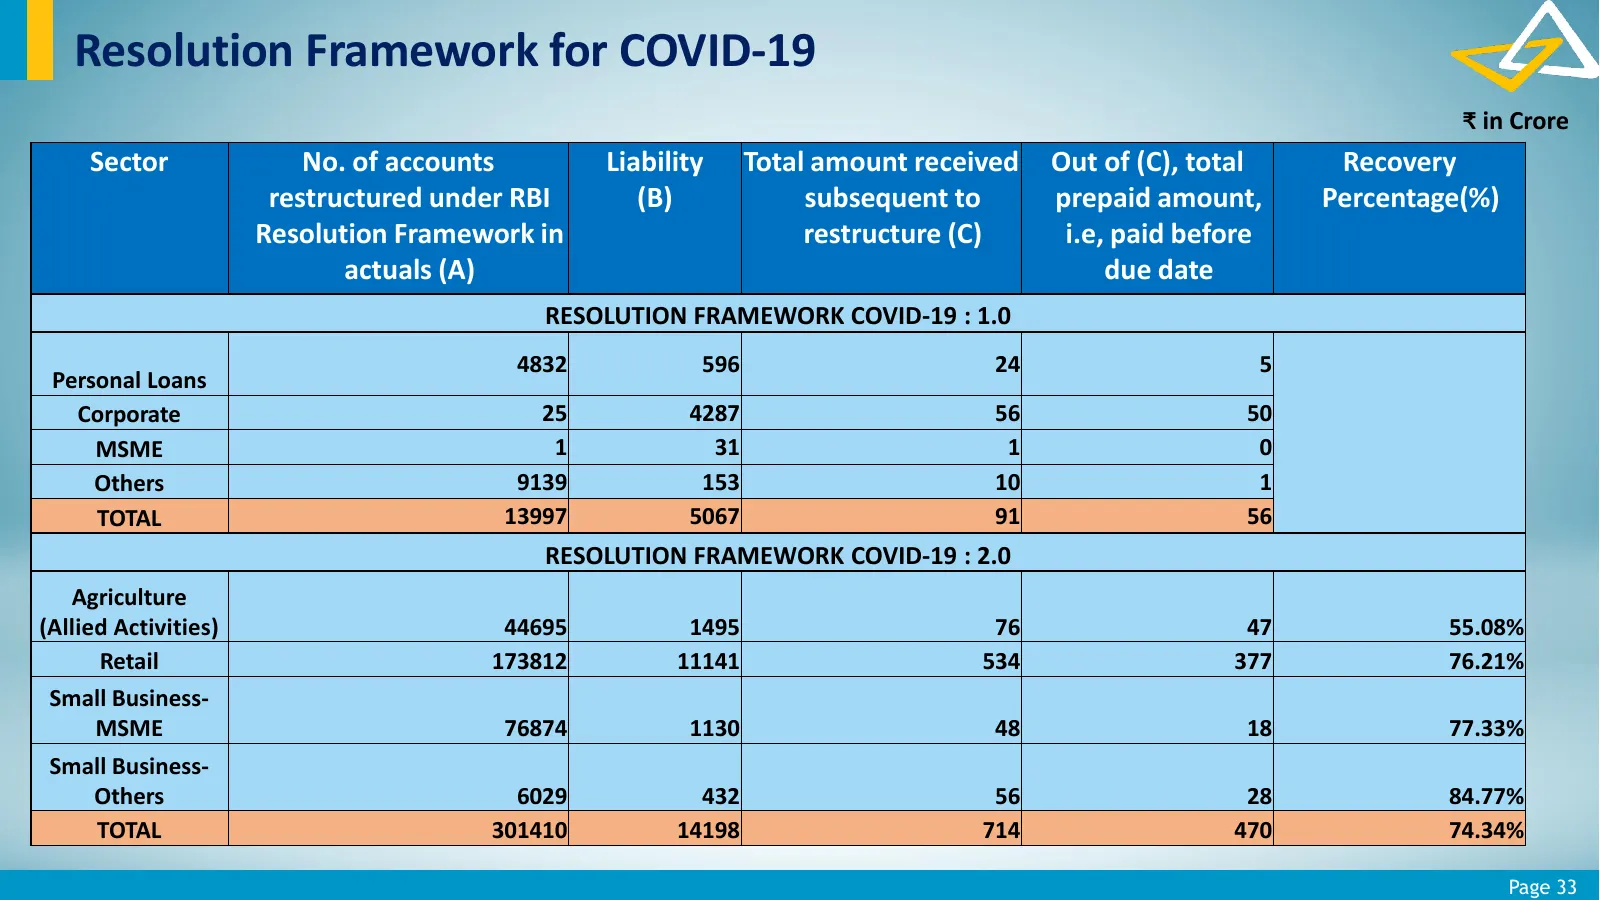
Resolution Framework for COVID-19 ₹ in Crore Sector No. of accounts Liability Total amount received Out of (C), total Recovery restructured under RBI (B) subsequent to prepaid amount, Percentage(%) Resolution Framework in restructure (C) i.e, paid before actuals (A) due date RESOLUTION FRAMEWORK COV
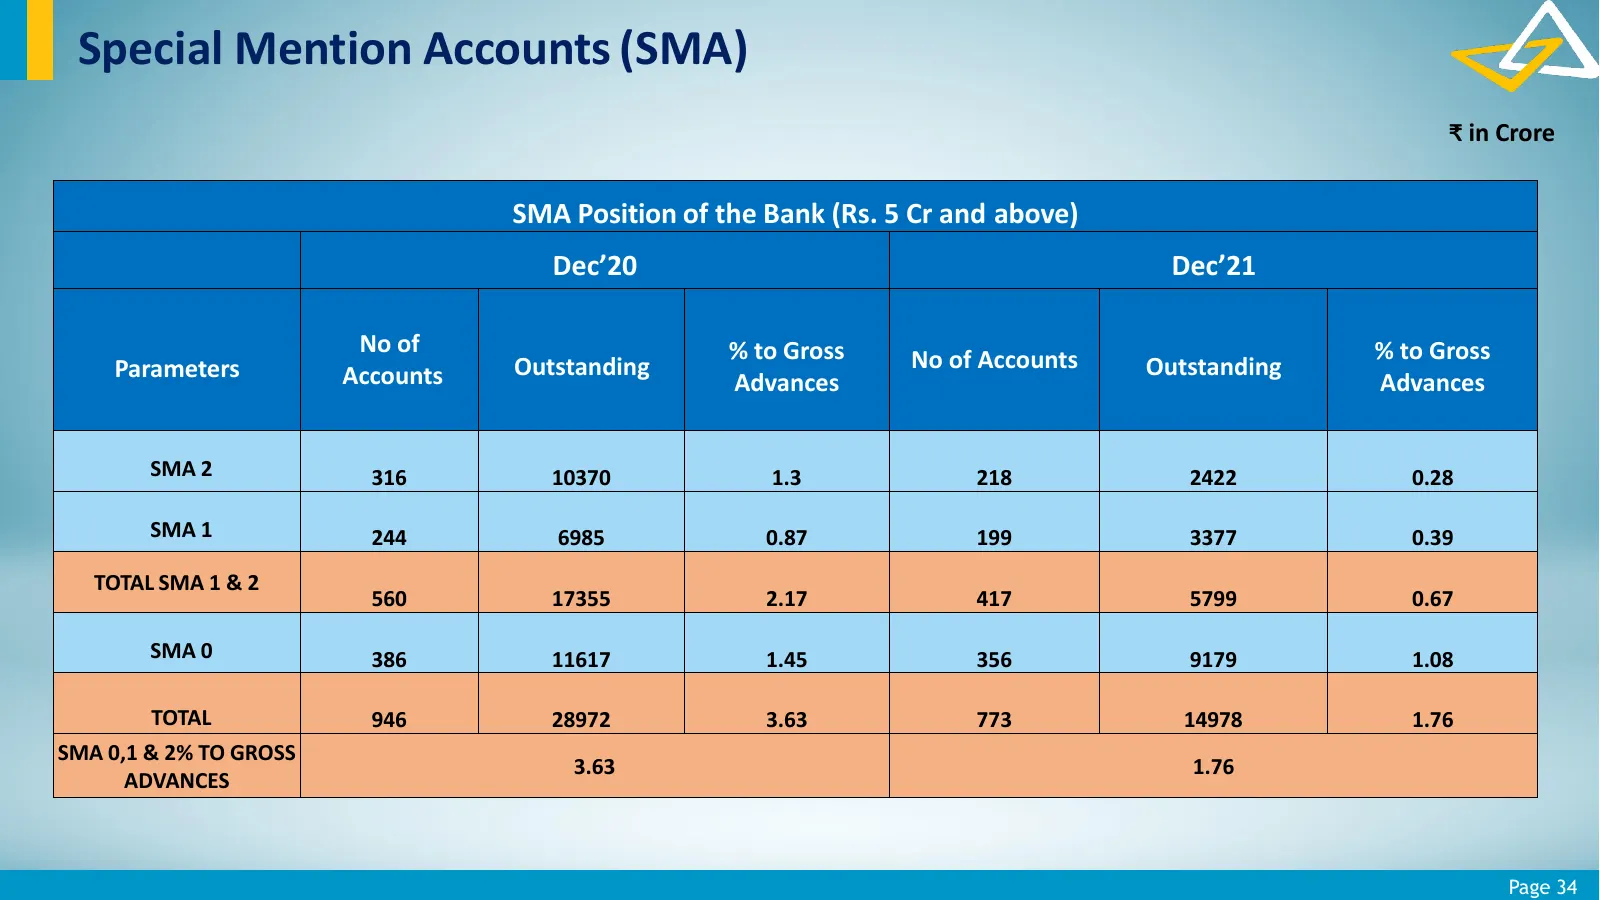
Slide 34: Special Mention Accounts (SMA)
Special Mention Accounts (SMA) ₹ in Crore SMA Position of the Bank (Rs. 5 Cr and above) Dec’20 Dec’21 No of % to Gross % to Gross Parameters Outstanding No of Accounts Outstanding Accounts Advances Advances SMA 2 316 10370 1.3 218 2422 0.28 SMA 1 244 6985 0.87 199 3377 0.39 TOTAL SMA 1 & 2 560 17355
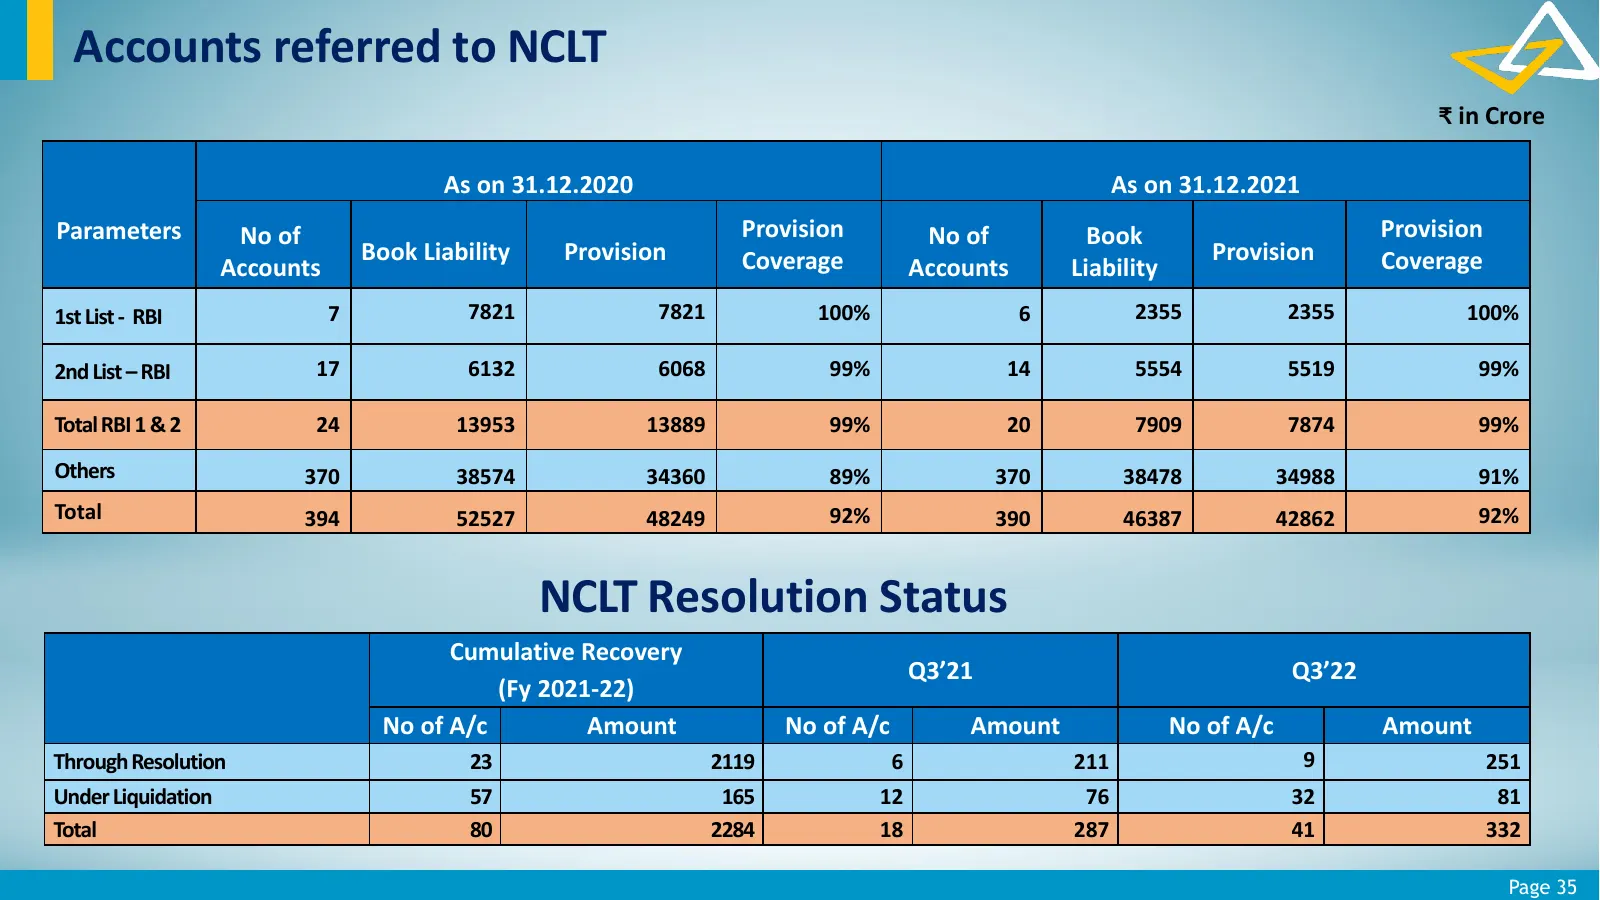
Slide 35: Accounts referred to NCLT
Accounts referred to NCLT ₹ in Crore As on 31.12.2020 As on 31.12.2021 Parameters No of Provision No of Book Provision Book Liability Provision Coverage Provision Coverage Accounts Accounts Liability 1st List - RBI 7 7821 7821 100% 6 2355 2355 100% 2nd List – RBI 17 6132 6068 99% 14 5554 5519 99% To

Slide 36: Capital and Shareholding
Capital and Shareholding Page 36
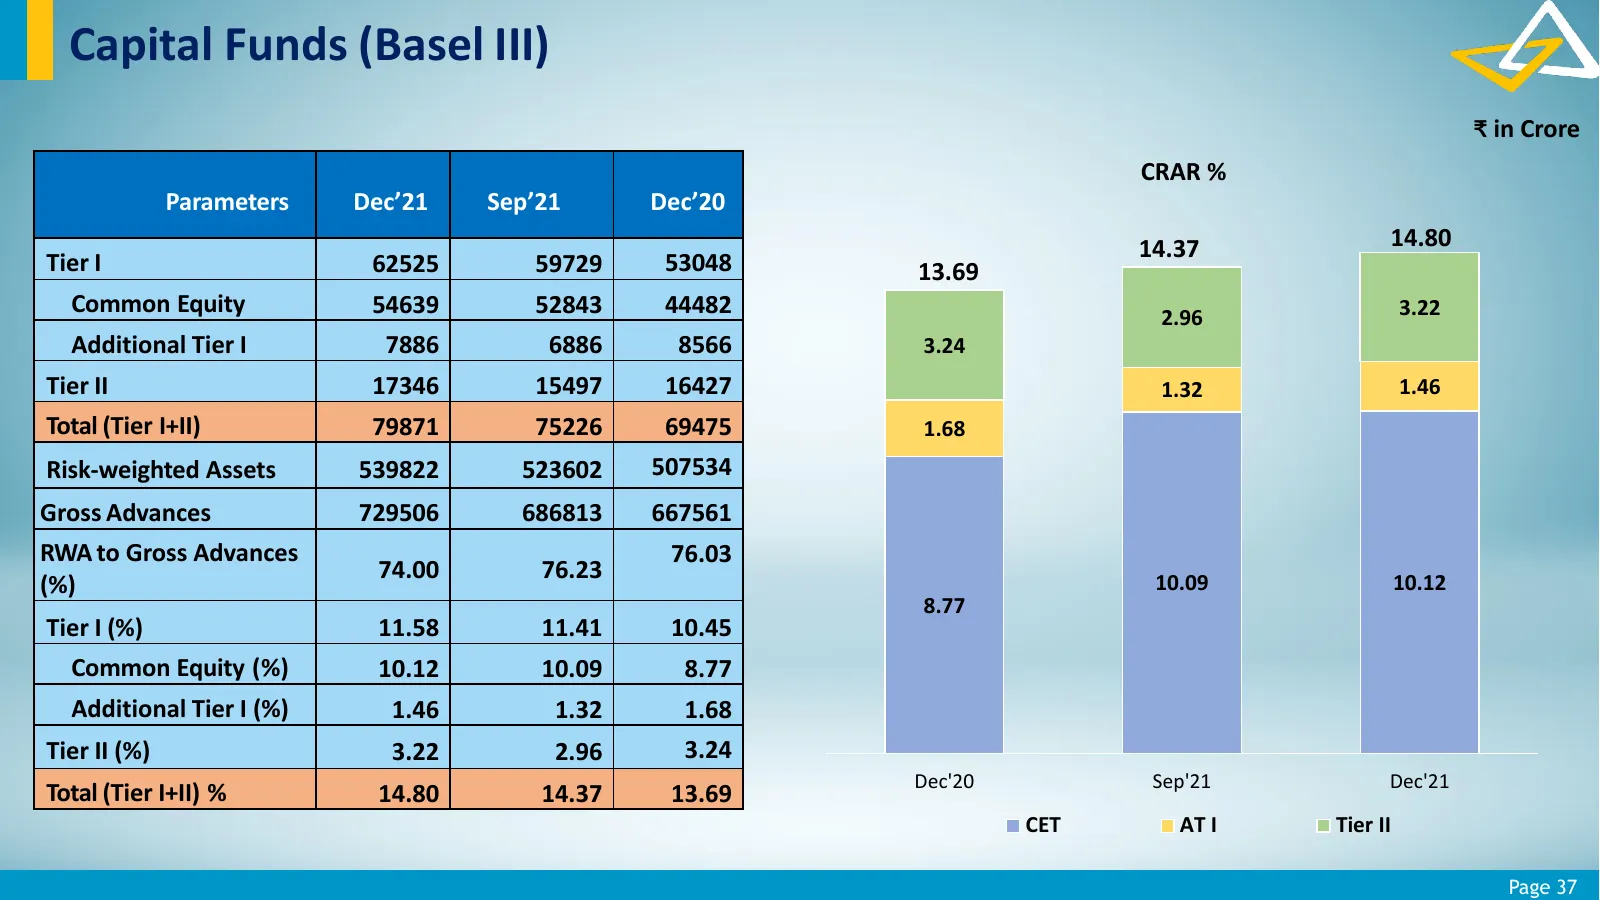
Slide 37: Capital Funds (Basel III)
Capital Funds (Basel III) ₹ in Crore CRAR % Parameters Dec’21 Sep’21 Dec’20 14.37 14.80 Tier I 62525 59729 53048 13.69 Common Equity 54639 52843 44482 2.96 3.22 Additional Tier I 7886 6886 8566 3.24 Tier II 17346 15497 16427 1.32 1.46 Total (Tier I+II) 79871 75226 69475 1.68 Risk-weighted Assets 539
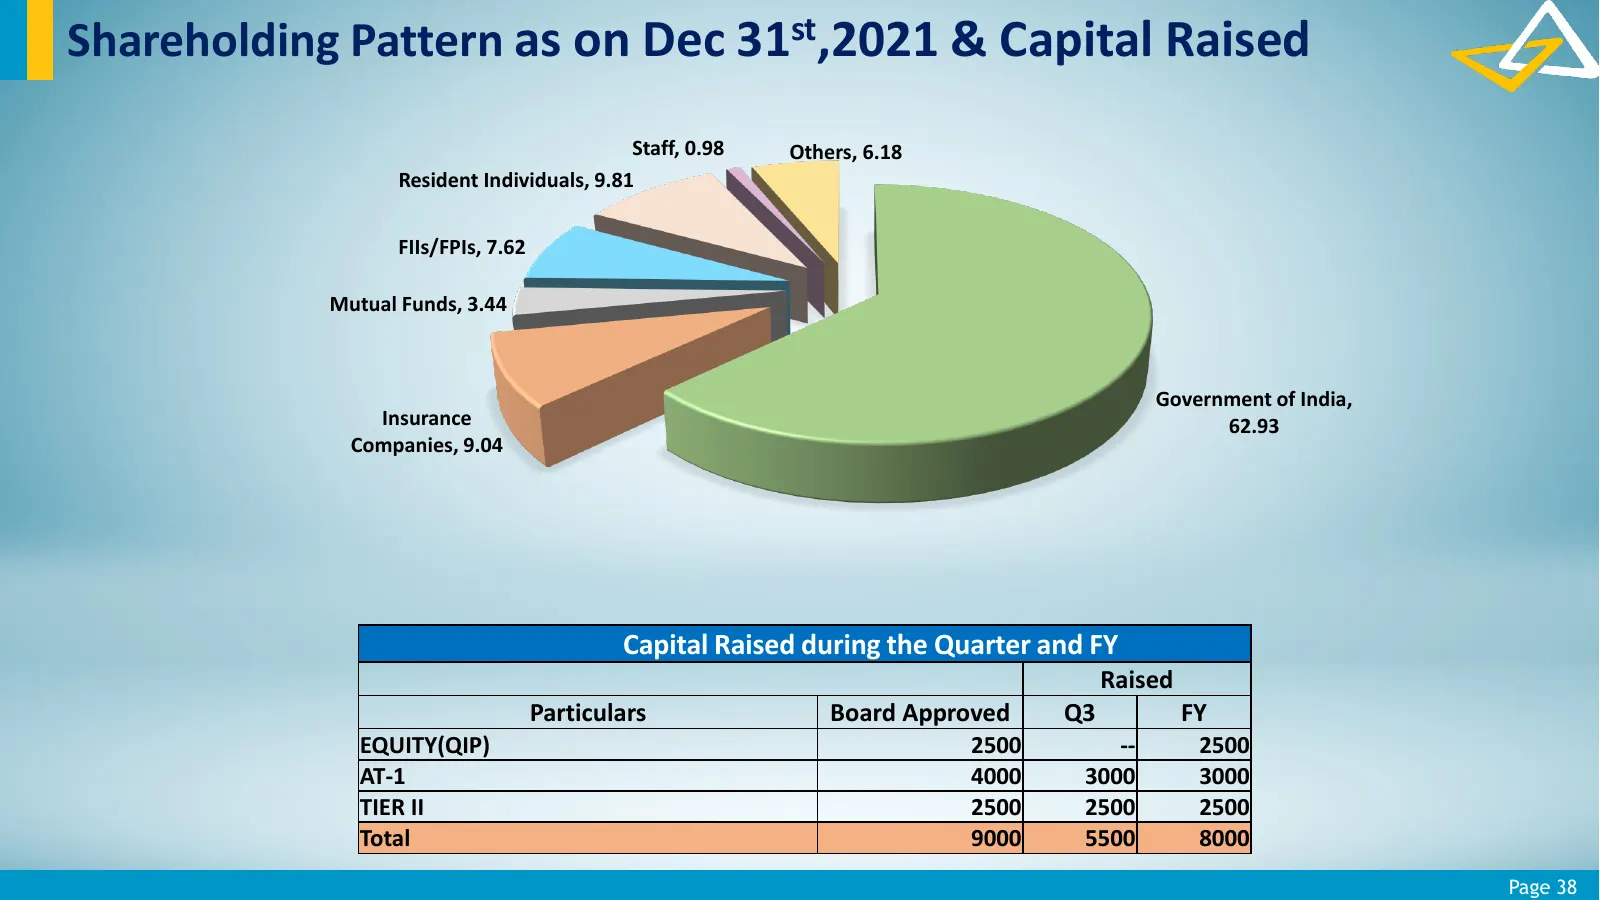
Slide 38: Shareholding Pattern & Capital Raised
Shareholding Pattern as on Dec 31st,2021 & Capital Raised Staff, 0.98 Others, 6.18 Resident Individuals, 9.81 FIIs/FPIs, 7.62 Mutual Funds, 3.44 Government of India, Insurance 62.93 Companies, 9.04 Capital Raised during the Quarter and FY Raised Particulars Board Approved Q3 FY EQUITY(QIP) 2500 -- 2

Slide 39: Environmental, Social & Governance
Environmental, Social & Governance Page 39
Slide 40: Environmental, Social & Governance (ESG) Practices
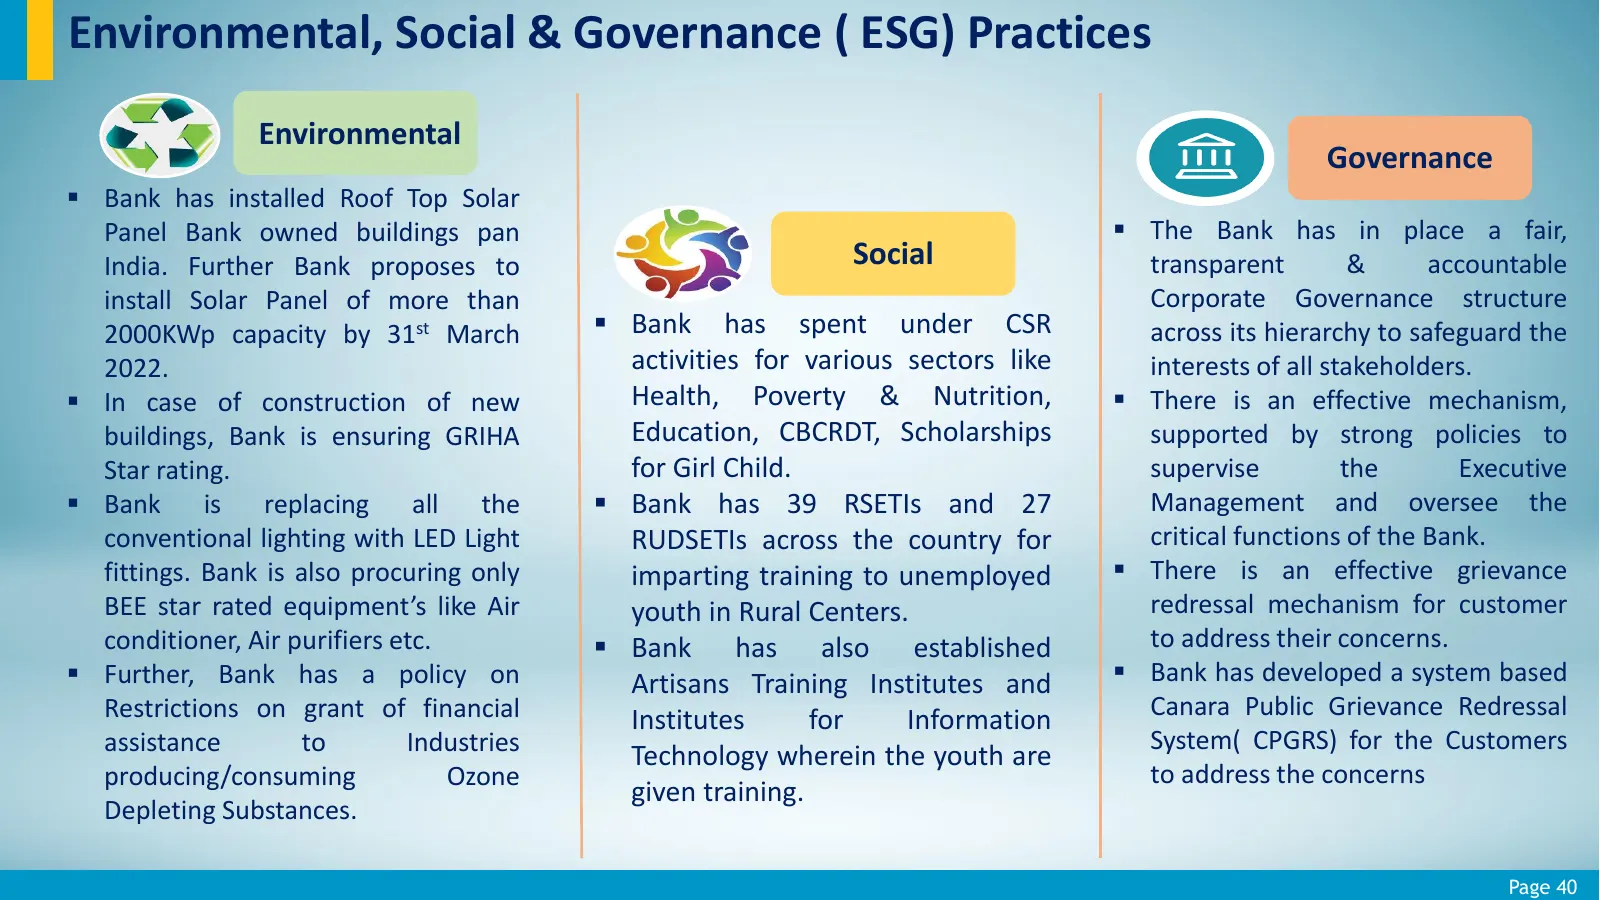
Environmental, Social & Governance ( ESG) Practices Environmental Governance Bank has installed Roof Top Solar Panel Bank owned buildings pan The Bank has in place a fair, India. Further Bank proposes to Social transparent & accountable install Solar Panel of more than Corporate Governance struc

Slide 41: Distribution Network
Distribution Network Page 41
Slide 42: Digital Footprint
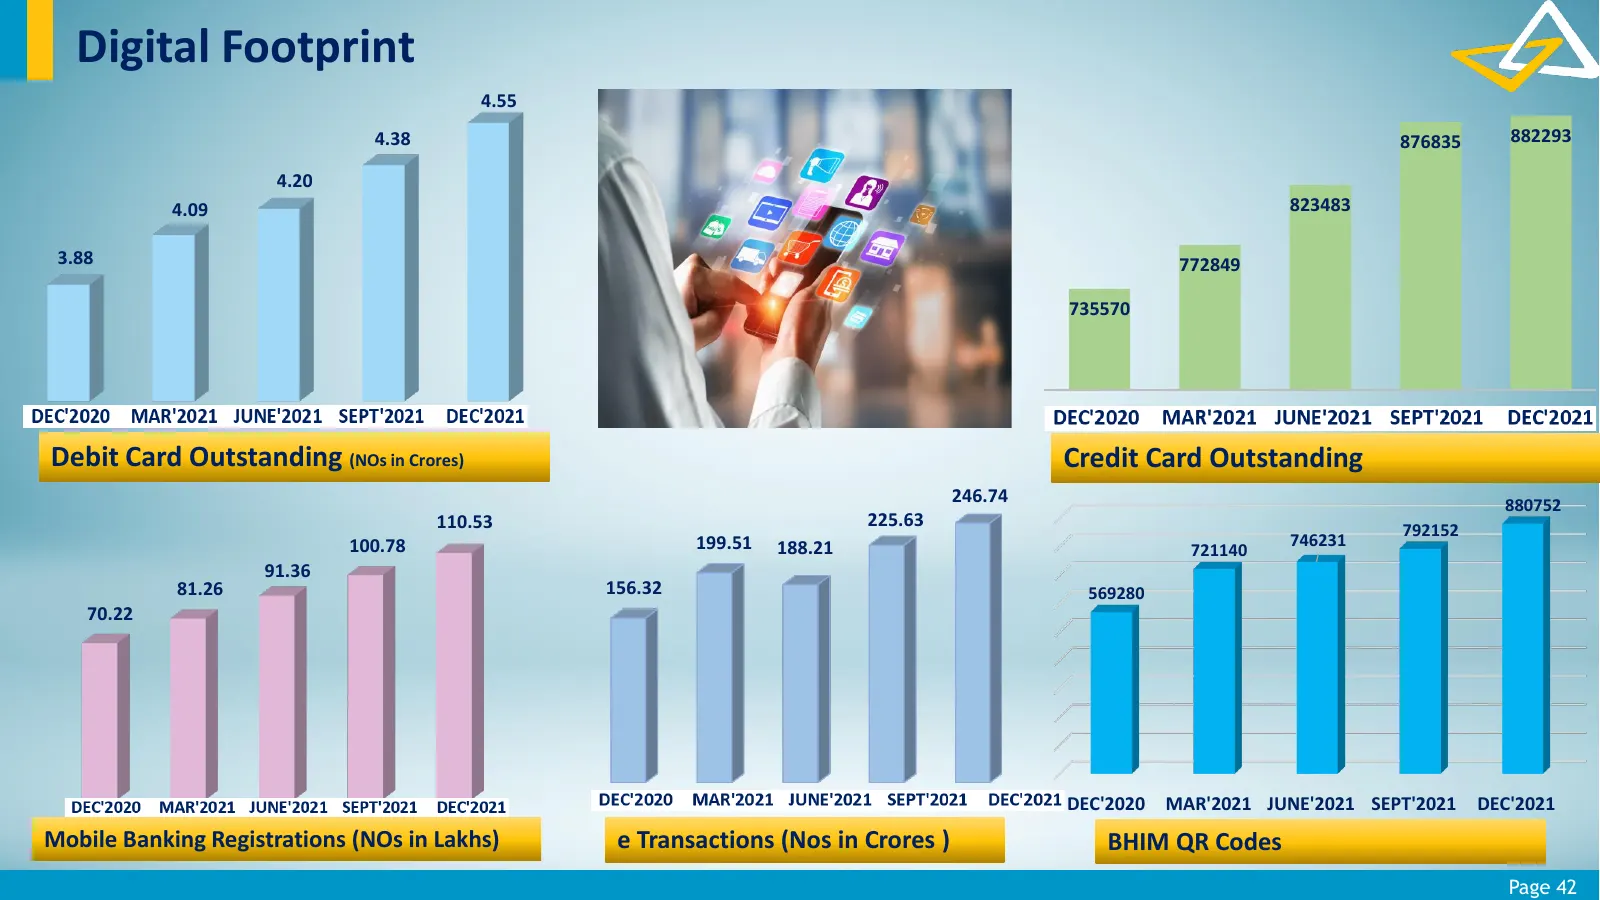
Digital Footprint 4.55 4.38 876835 882293 4.20 4.09 823483 3.88 772849 735570 Q3 -2021 Q4-2021 Q1-2022 Q2-2022 Q3-2022 Debit Card Outstanding (NOs in Crores) Credit Card Outstanding 246.74 880752 110.53 225.63 792152 100.78 199.51 188.21 746231 721140 91.36 81.26 156.32 569280 70.22 DEC'2020 MAR'202
Slide 43: Distribution Network
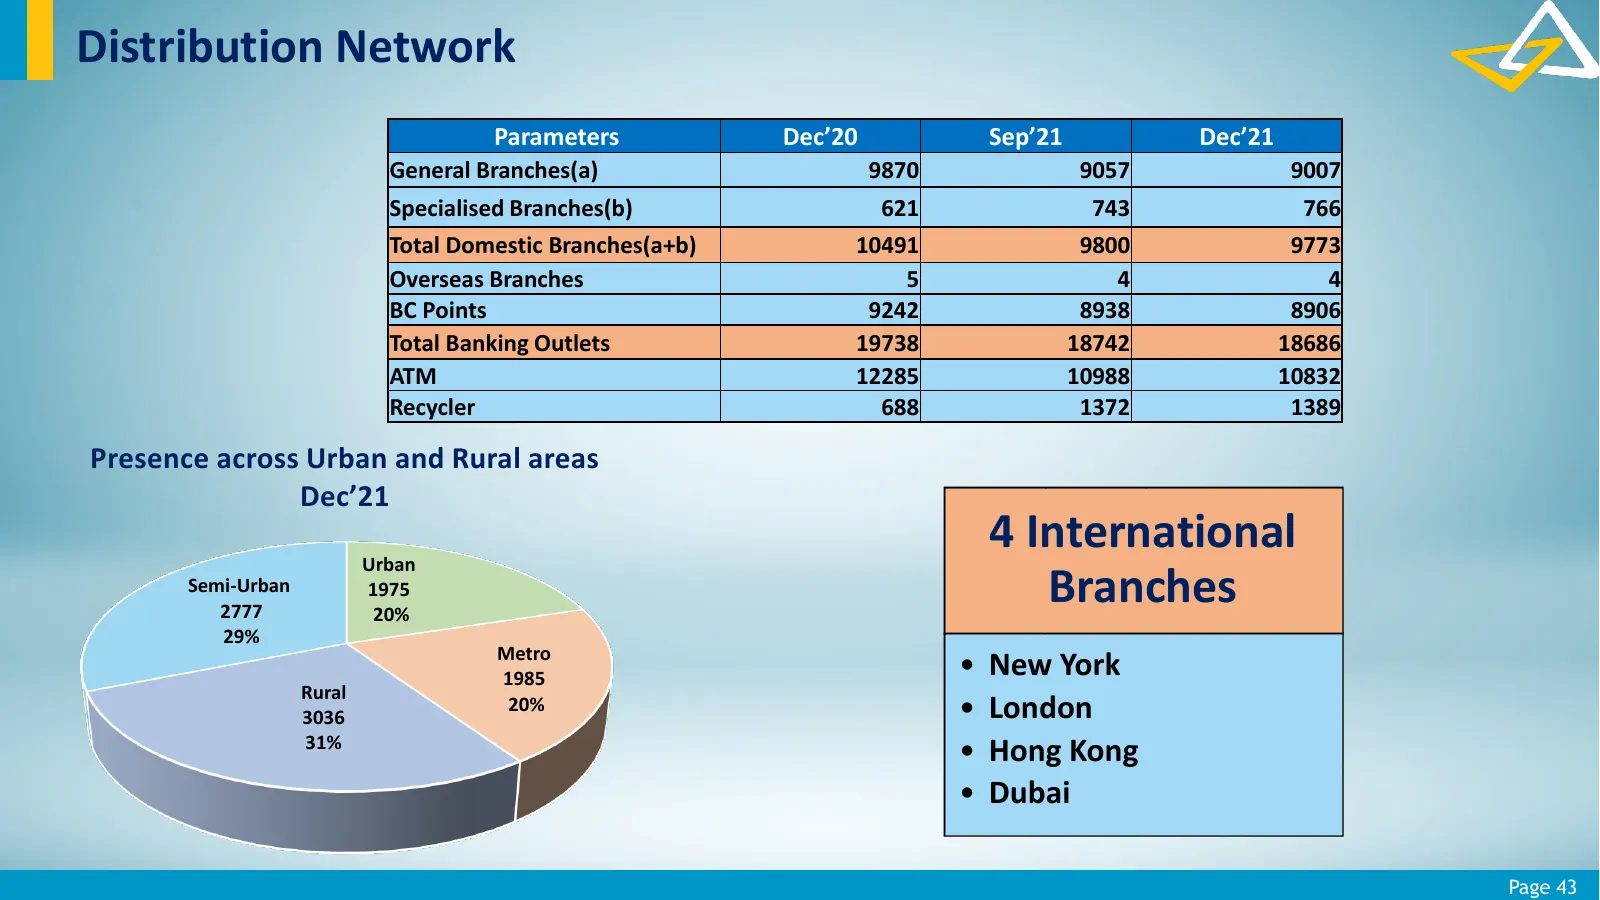
Distribution Network Parameters Dec’20 Sep’21 Dec’21 General Branches(a) 9870 9057 9007 Specialised Branches(b) 621 743 766 Total Domestic Branches(a+b) 10491 9800 9773 Overseas Branches 5 4 4 BC Points 9242 8938 8906 Total Banking Outlets 19738 18742 18686 ATM 12285 10988 10832 Recycler 688 1372 13
Slide 44: Subsidiaries, Associates & Joint Ventures
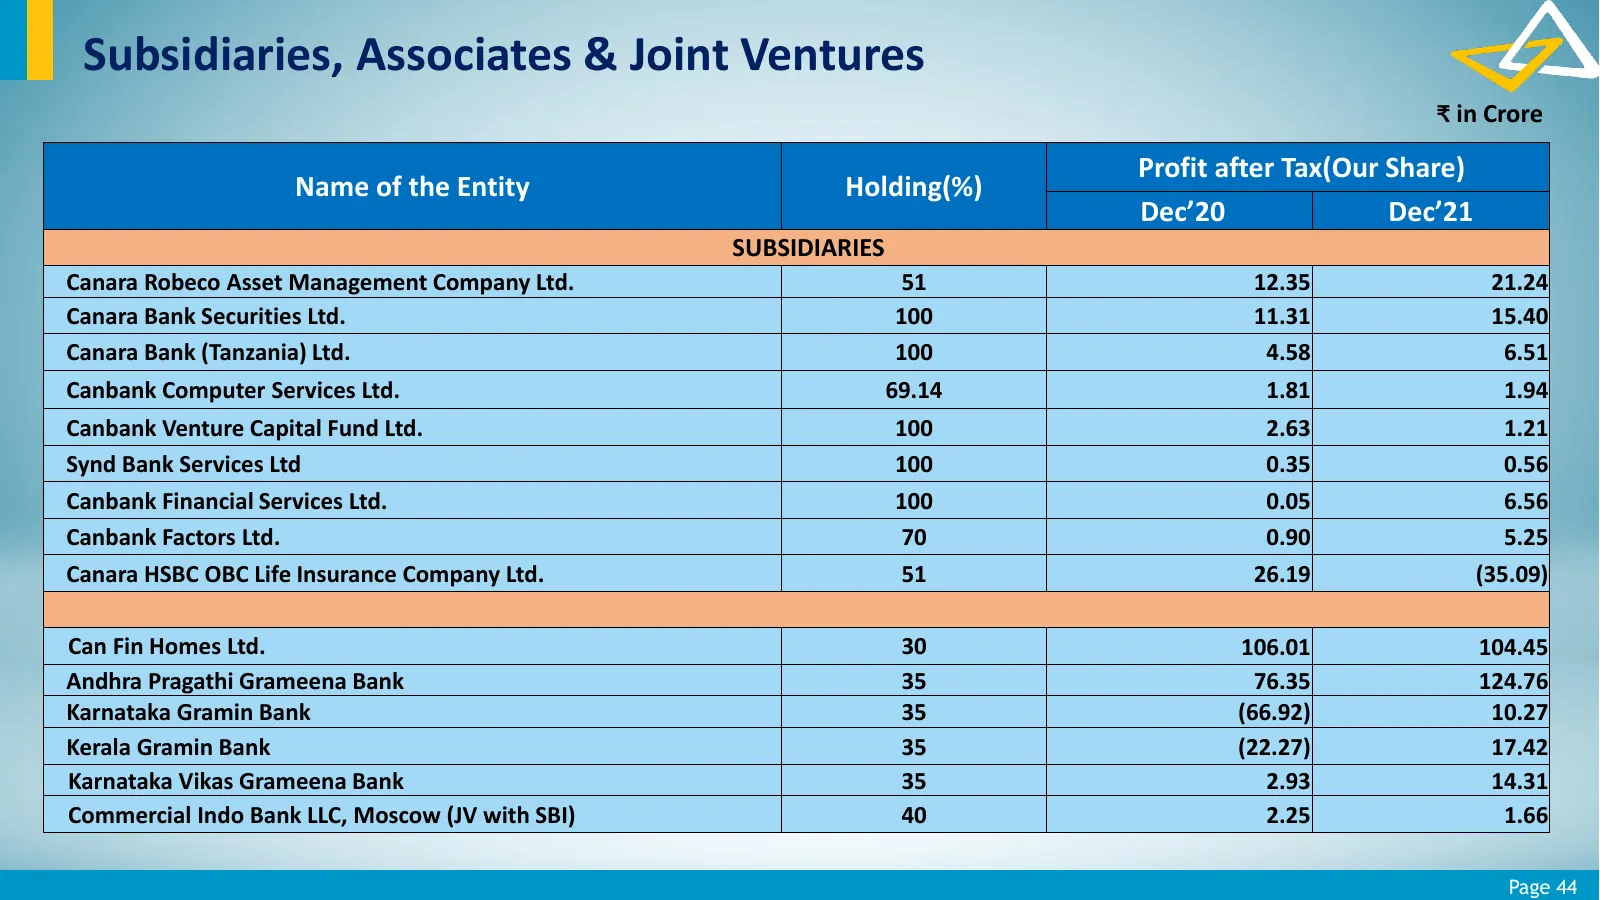
Subsidiaries, Associates & Joint Ventures ₹ in Crore Profit after Tax(Our Share) Name of the Entity Holding(%) Dec’20 Dec’21 SUBSIDIARIES Canara Robeco Asset Management Company Ltd. 51 12.35 21.24 Canara Bank Securities Ltd. 100 11.31 15.40 Canara Bank (Tanzania) Ltd. 100 4.58 6.51 Canbank Computer
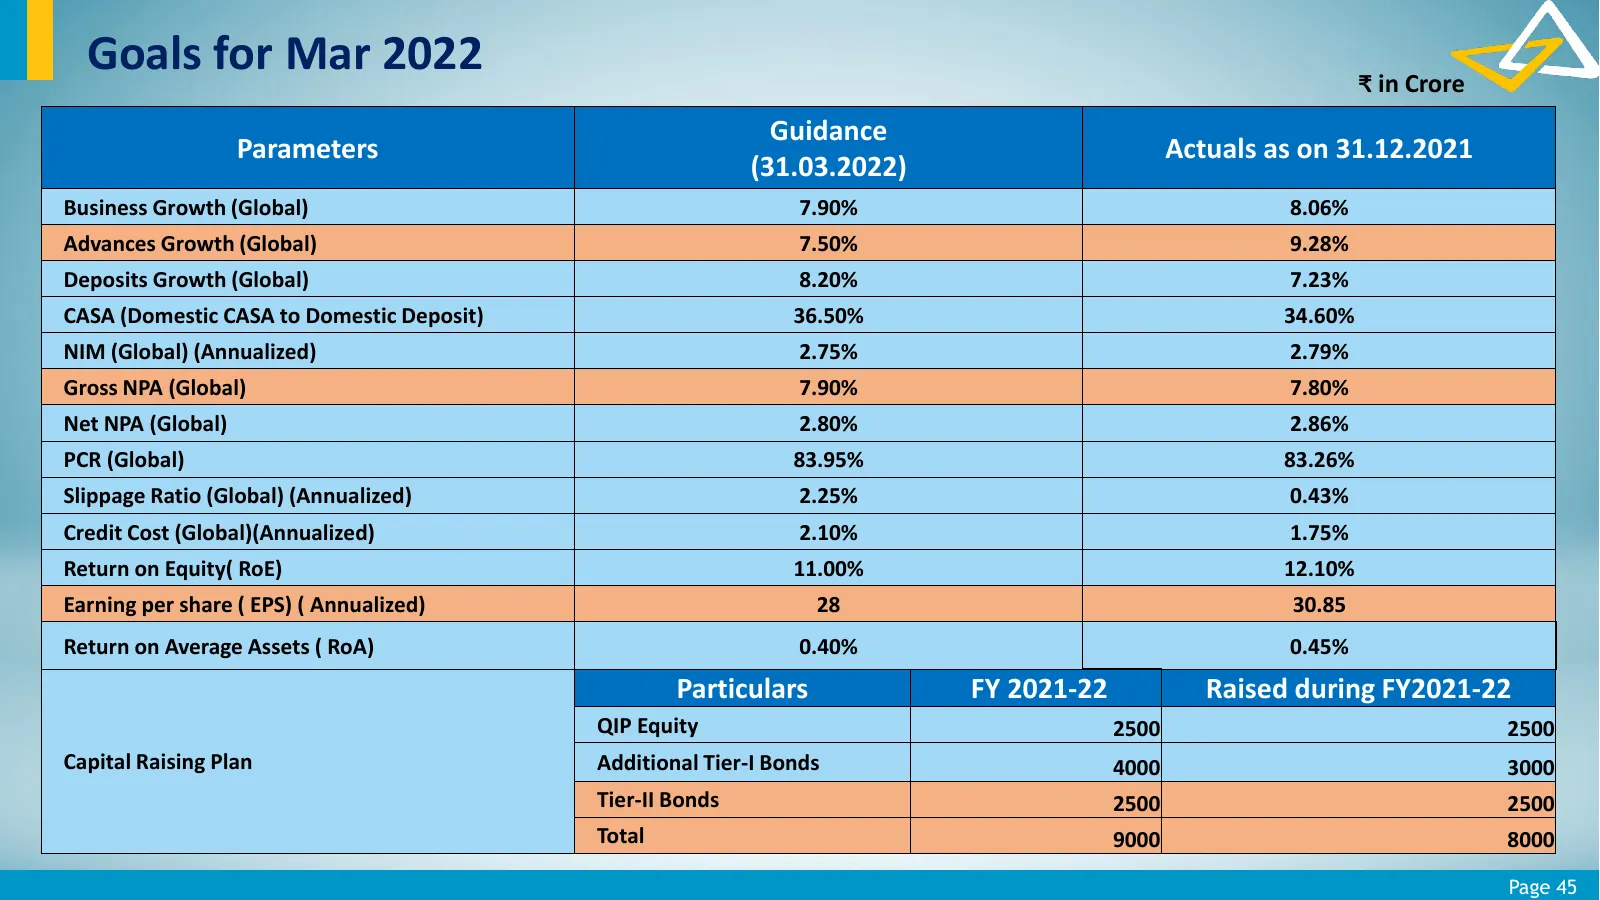
Slide 45: Goals for Mar 2022
Goals for Mar 2022 ₹ in Crore Guidance Parameters Actuals as on 31.12.2021 (31.03.2022) Business Growth (Global) 7.90% 8.06% Advances Growth (Global) 7.50% 9.28% Deposits Growth (Global) 8.20% 7.23% CASA (Domestic CASA to Domestic Deposit) 36.50% 34.60% NIM (Global) (Annualized) 2.75% 2.79% Gross NP
Slide 46: Disclaimer
Disclaimer This presentation has been prepared solely for information purposes only. It has no regard to any financial situations or informational needs of any particular reason. The forward looking statements involve a number of risk, uncertainties and other factors that could cause actual results

Slide 47: Thank You
Together We Can Thank You We express our heartfelt gratitude to all our stakeholders for their support & trust and solicit their continued patronage to make our beloved Bank grow exponentially in the coming years. Page 47
Source: Internet Archive copy of canarabank.com
More decks from Canara Bank
 Q2 FY2026-27 Earnings Presentation47 slides · Oct 14, 2026
 Q1 FY2026-27 Earnings Presentation47 slides · Jul 27, 2026
 Q4 FY2026 Earnings Presentation47 slides · May 11, 2026
 Q3 FY2025-26 Earnings Presentation47 slides · Jan 29, 2026
 Q2 FY2025-26 Earnings Presentation47 slides · Oct 30, 2025
 Q1 FY2025-26 Earnings Presentation47 slides · Jul 24, 2025