Old Mutual Ltd. · JSE:OMU
Old Mutual — FY2015 Earnings Presentation
57 slides from Old Mutual's earnings presentation, Mar 11, 2016

Slide 1: Appendices
APPENDICES 11 March 2016 INVESTMENT | SAVINGS | INSURANCE | BANKING
Slide 2: Index to Appendices
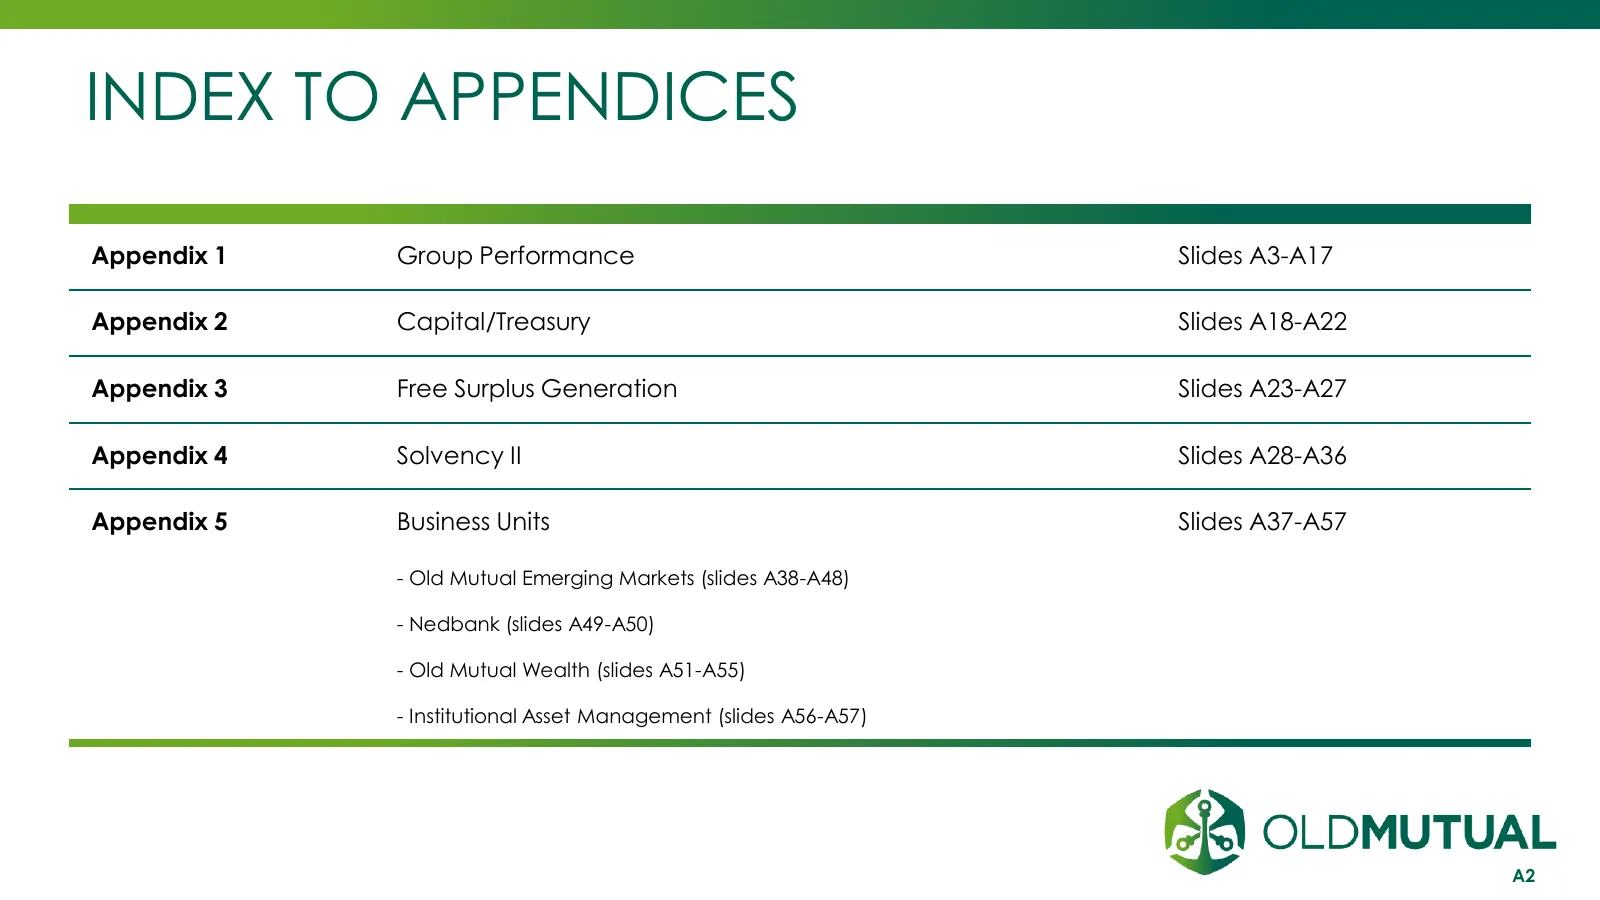
INDEX TO APPENDICES Appendix 1 Group Performance Slides A3-A17 Appendix 2 Capital/Treasury Slides A18-A22 Appendix 3 Free Surplus Generation Slides A23-A27 Appendix 4 Solvency II Slides A28-A36 Appendix 5 Business Units Slides A37-A57 - Old Mutual Emerging Markets (slides A38-A48) - Nedbank (slides
Slide 3: Appendix 1: Group Performance
APPENDIX 1 GROUP PERFORMANCE INVESTMENT | SAVINGS | INSURANCE | BANKING
Slide 4: Summarised P&L
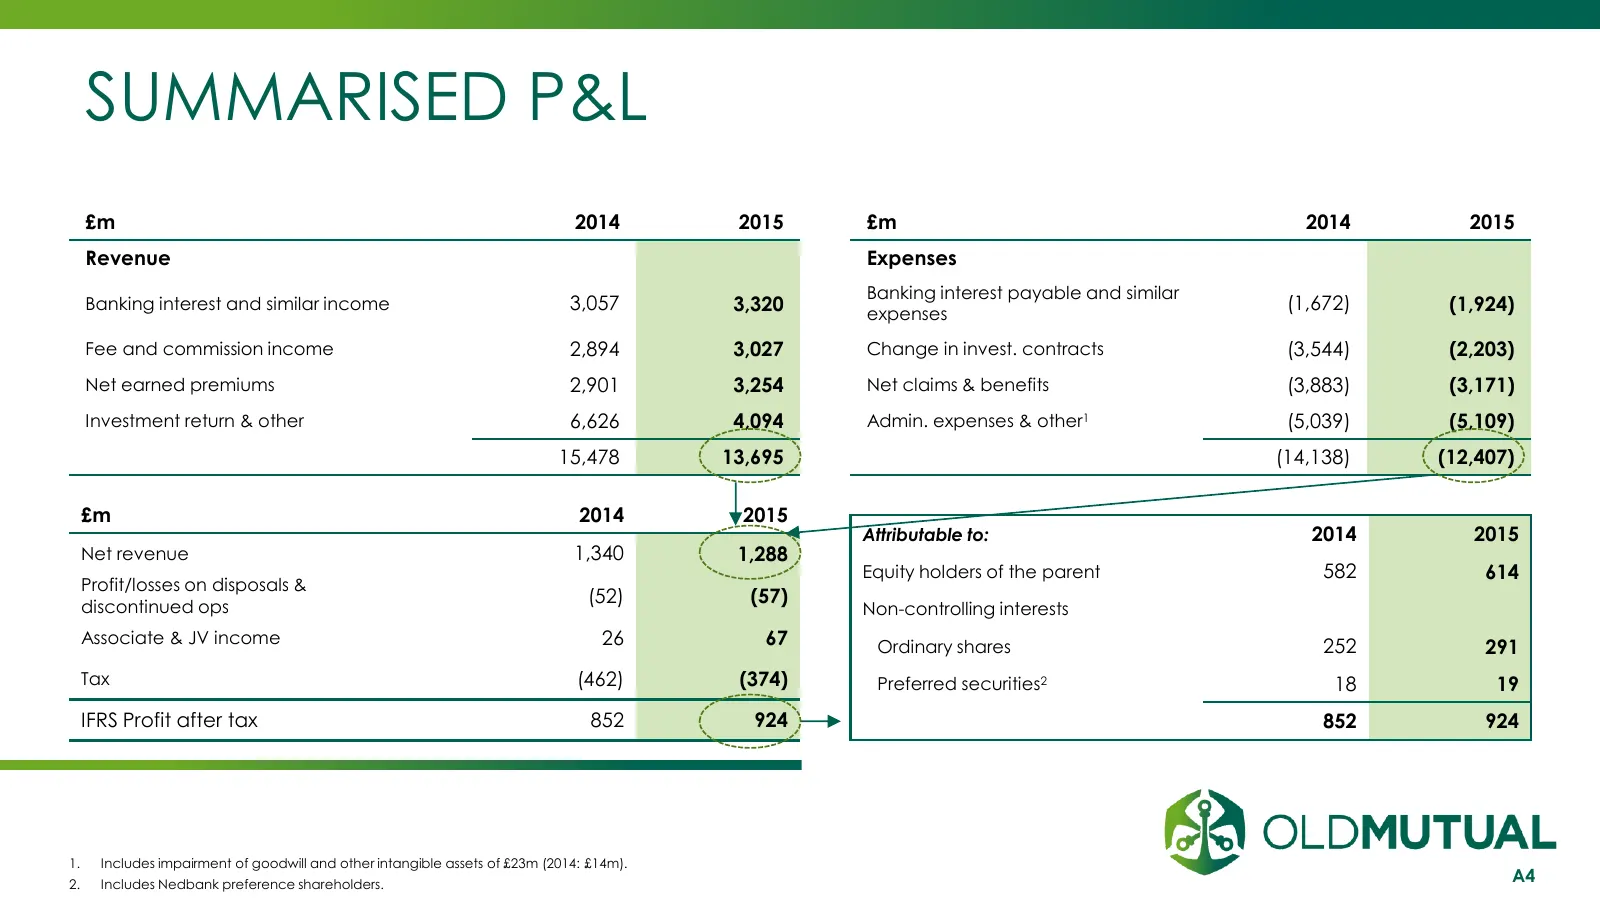
SUMMARISED P&L £m 2014 2015 £m 2014 2015 Revenue Expenses Banking interest payable and similar Banking interest and similar income 3,057 3,320 expenses (1,672) (1,924) Fee and commission income 2,894 3,027 Change in invest. contracts (3,544) (2,203) Net earned premiums 2,901 3,254 Net claims & benef
Slide 5: AOP Simplified Operating Result
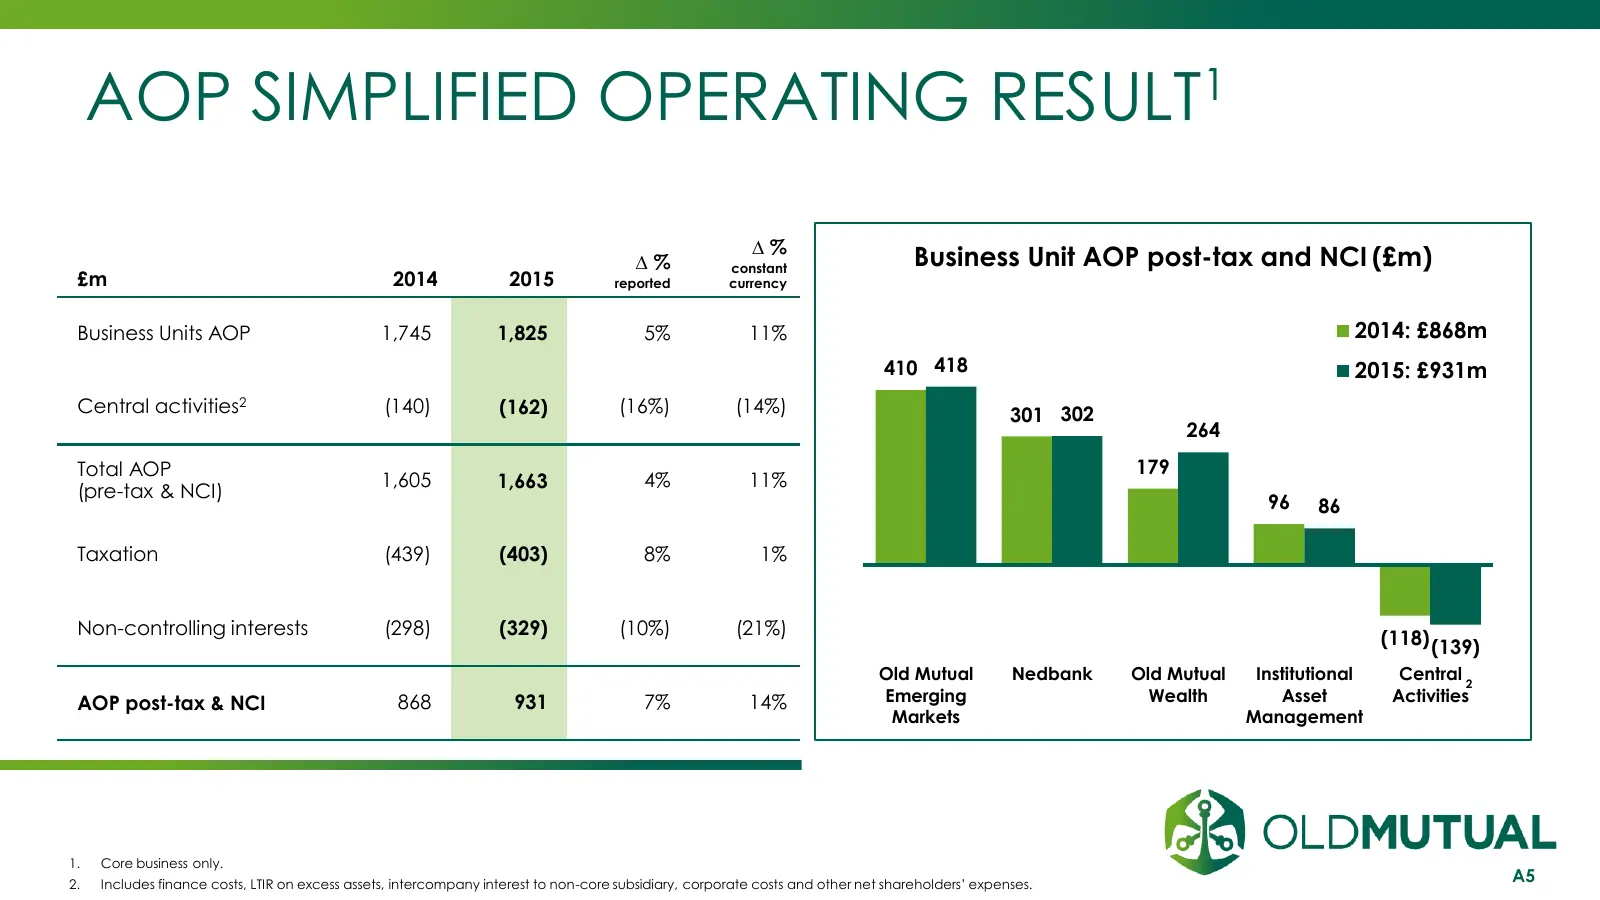
AOP SIMPLIFIED OPERATING RESULT1 ∆% ∆% constant Business Unit AOP post-tax and NCI (£m) £m 2014 2015 reported currency Business Units AOP 1,745 1,825 5% 11% 2014: £868m 410 418 2015: £931m Central activities2 (140) (162) (16%) (14%) 301 302 264 Total AOP 179 1,605 1,663 4% 11% (pre-tax & NCI) 96 86
Slide 6: 2015 Profit Analysis: H1 vs H2
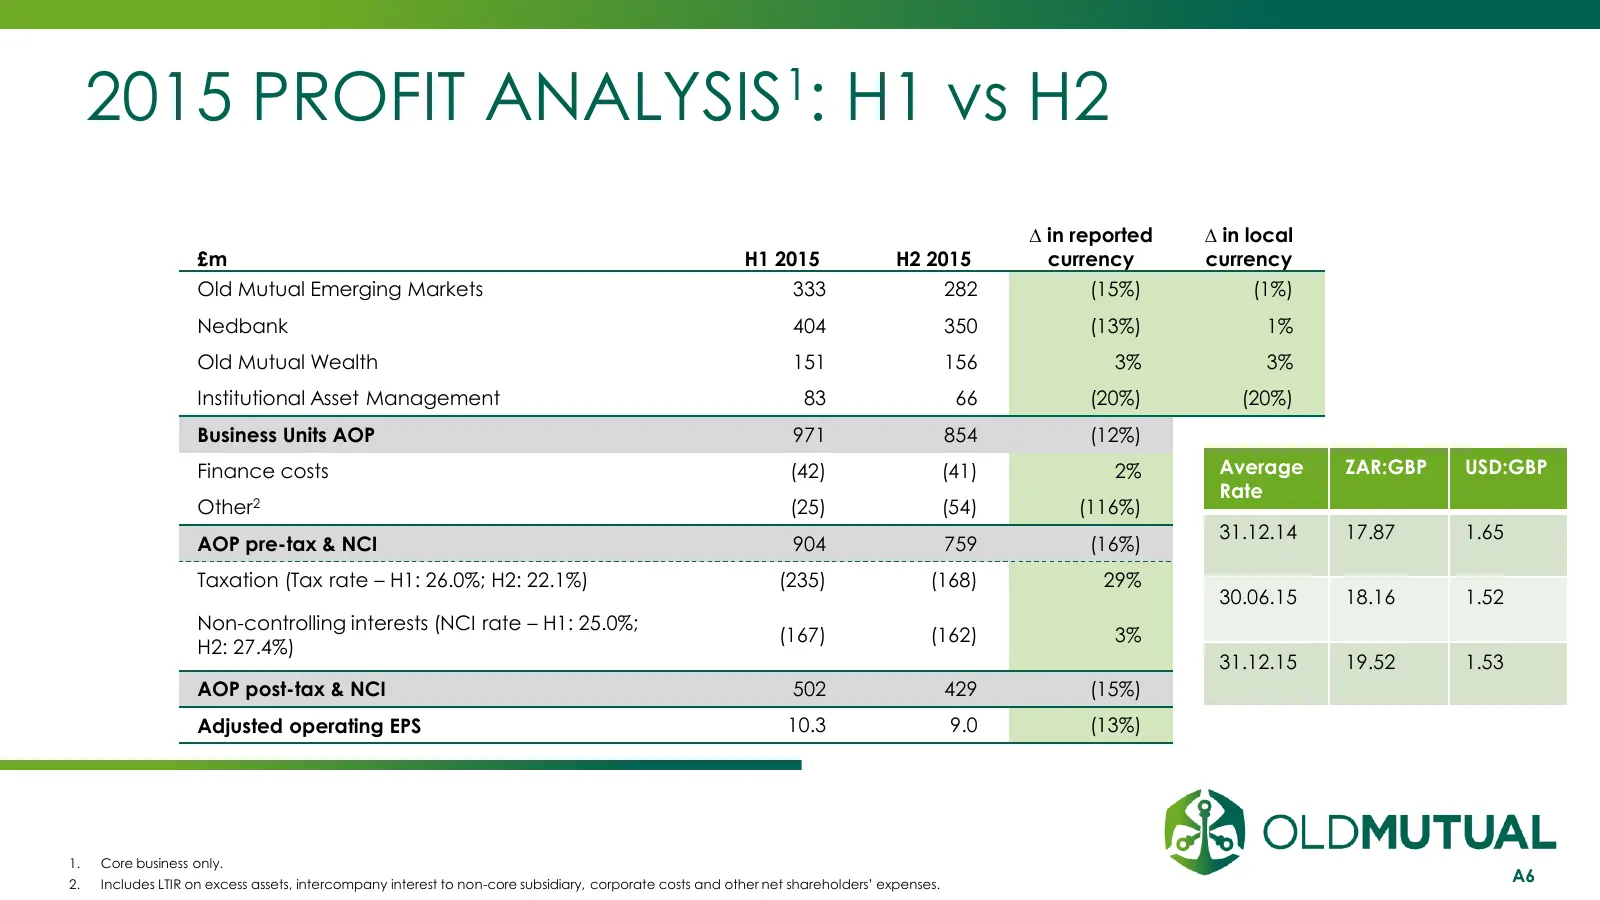
2015 PROFIT ANALYSIS1: H1 vs H2 ∆ in reported ∆ in local £m H1 2015 H2 2015 currency currency Old Mutual Emerging Markets 333 282 (15%) (1%) Nedbank 404 350 (13%) 1% Old Mutual Wealth 151 156 3% 3% Institutional Asset Management 83 66 (20%) (20%) Business Units AOP 971 854 (12%) Finance costs (42) (
Slide 7: Sources of Earnings (AOP)
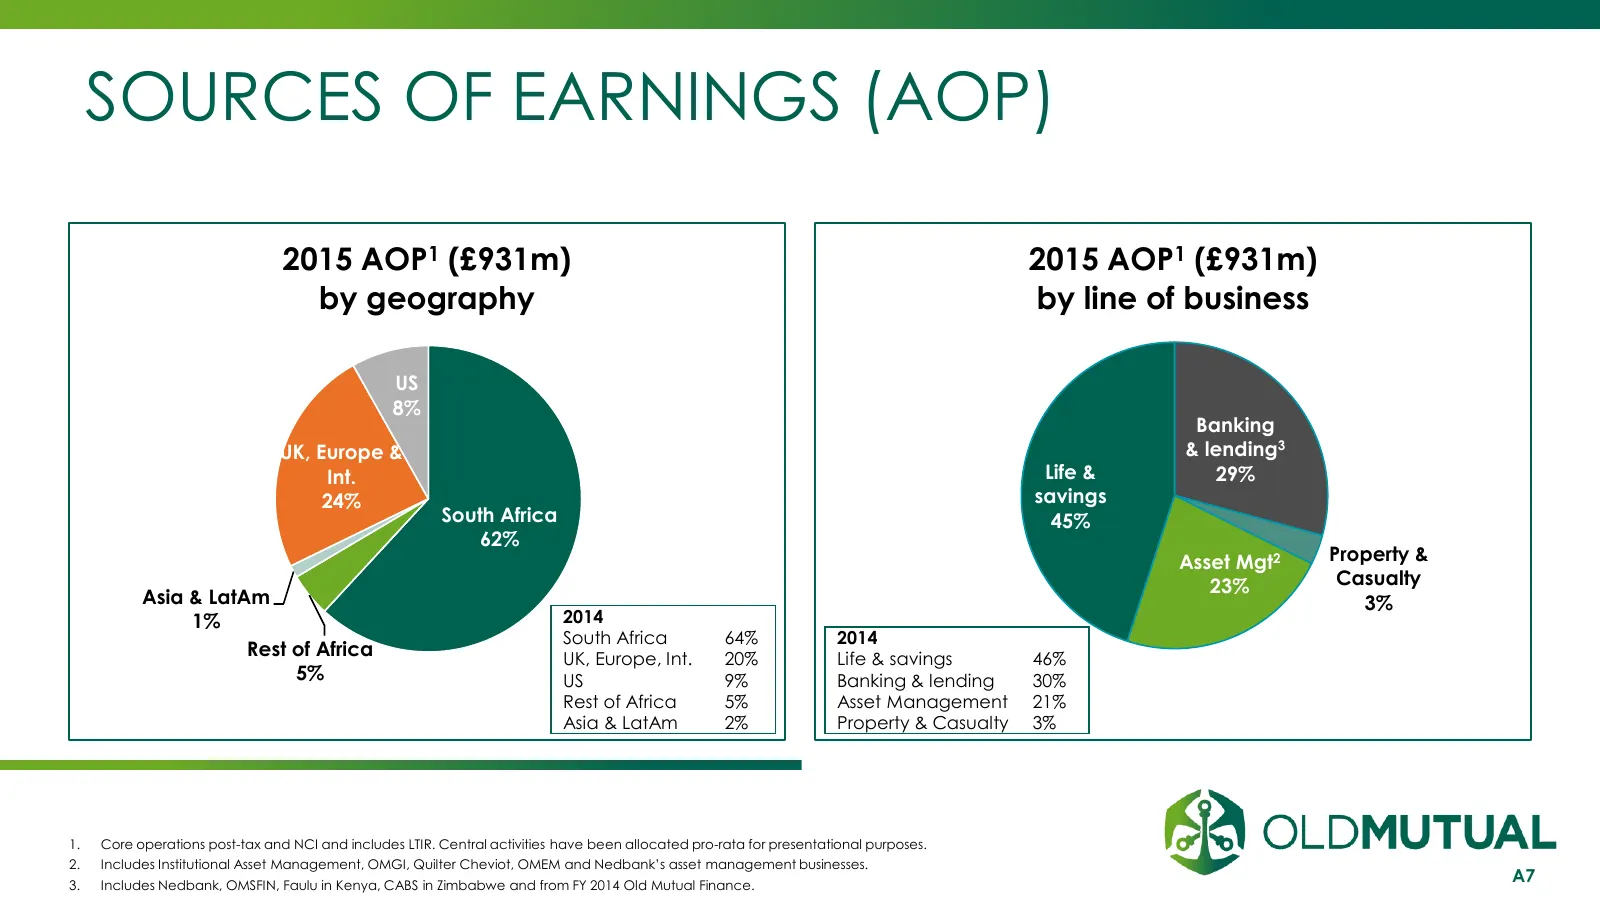
SOURCES OF EARNINGS (AOP) 2015 AOP1 (£931m) 2015 AOP1 (£931m) by geography by line of business US 8% Banking UK, Europe & & lending3 Int. Life & 29% 24% savings South Africa 45% 62% Asset Mgt2 Property & 23% Casualty Asia & LatAm 3% 1% 2014 South Africa 64% 2014 Rest of Africa UK, Europe, Int. 20% L
Slide 8: Earnings Split by Half Year and Key Statistics
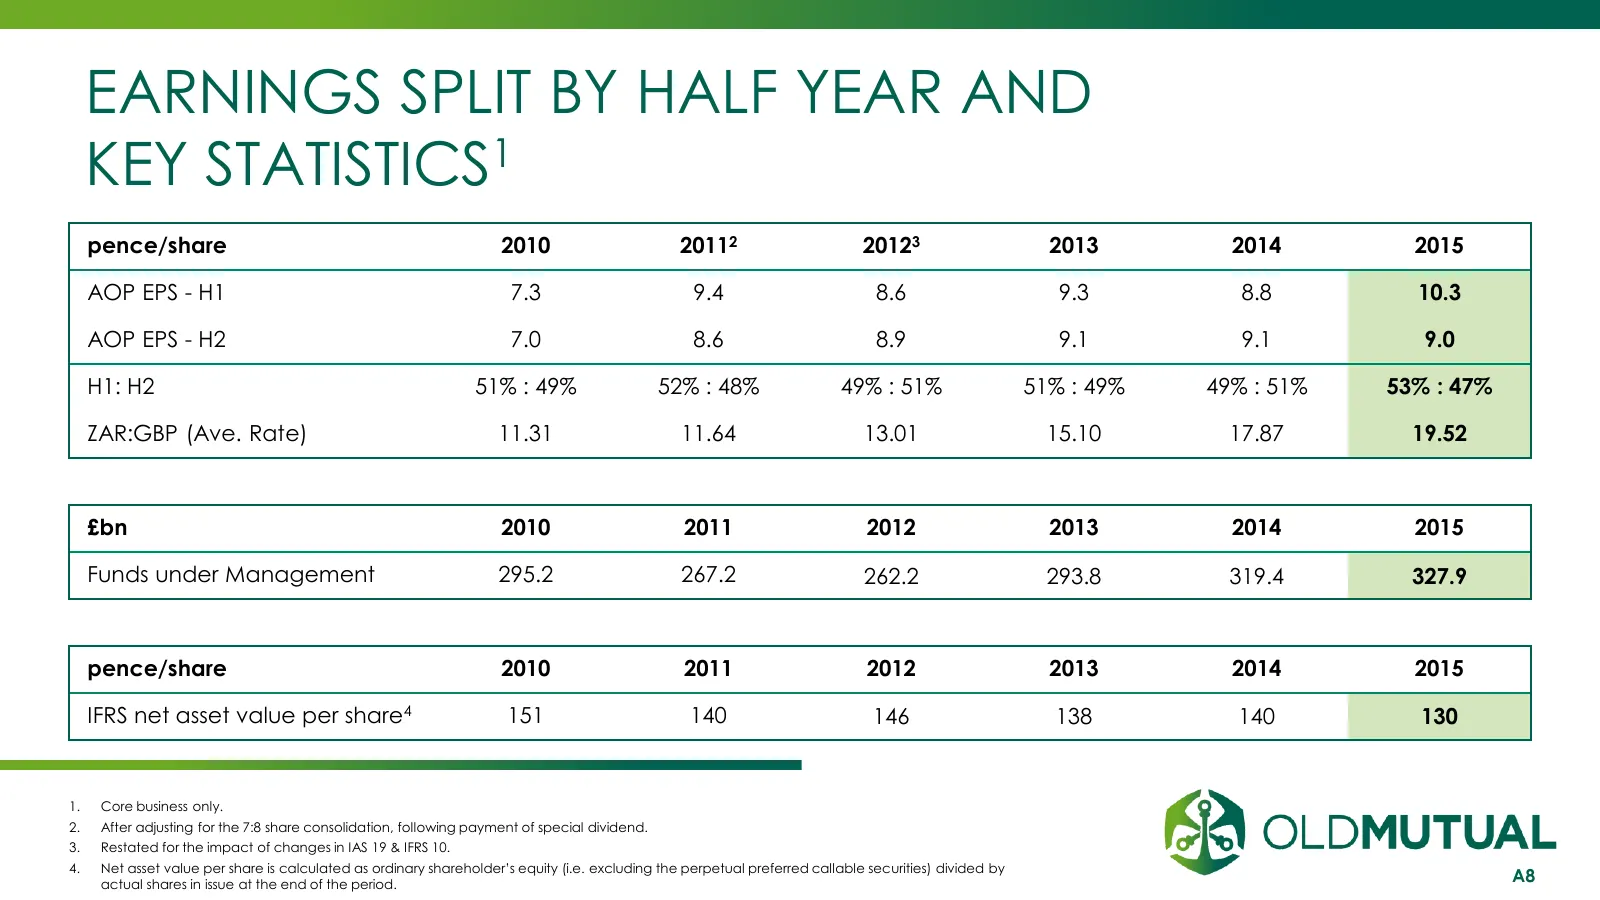
EARNINGS SPLIT BY HALF YEAR AND KEY STATISTICS1 pence/share 2010 20112 20123 2013 2014 2015 AOP EPS - H1 7.3 9.4 8.6 9.3 8.8 10.3 AOP EPS - H2 7.0 8.6 8.9 9.1 9.1 9.0 H1: H2 51% : 49% 52% : 48% 49% : 51% 51% : 49% 49% : 51% 53% : 47% ZAR:GBP (Ave. Rate) 11.31 11.64 13.01 15.10 17.87 19.52 £bn 2010 2
Slide 9: Reconciliation of 2015 AOP to Change in Equity Holders' Funds
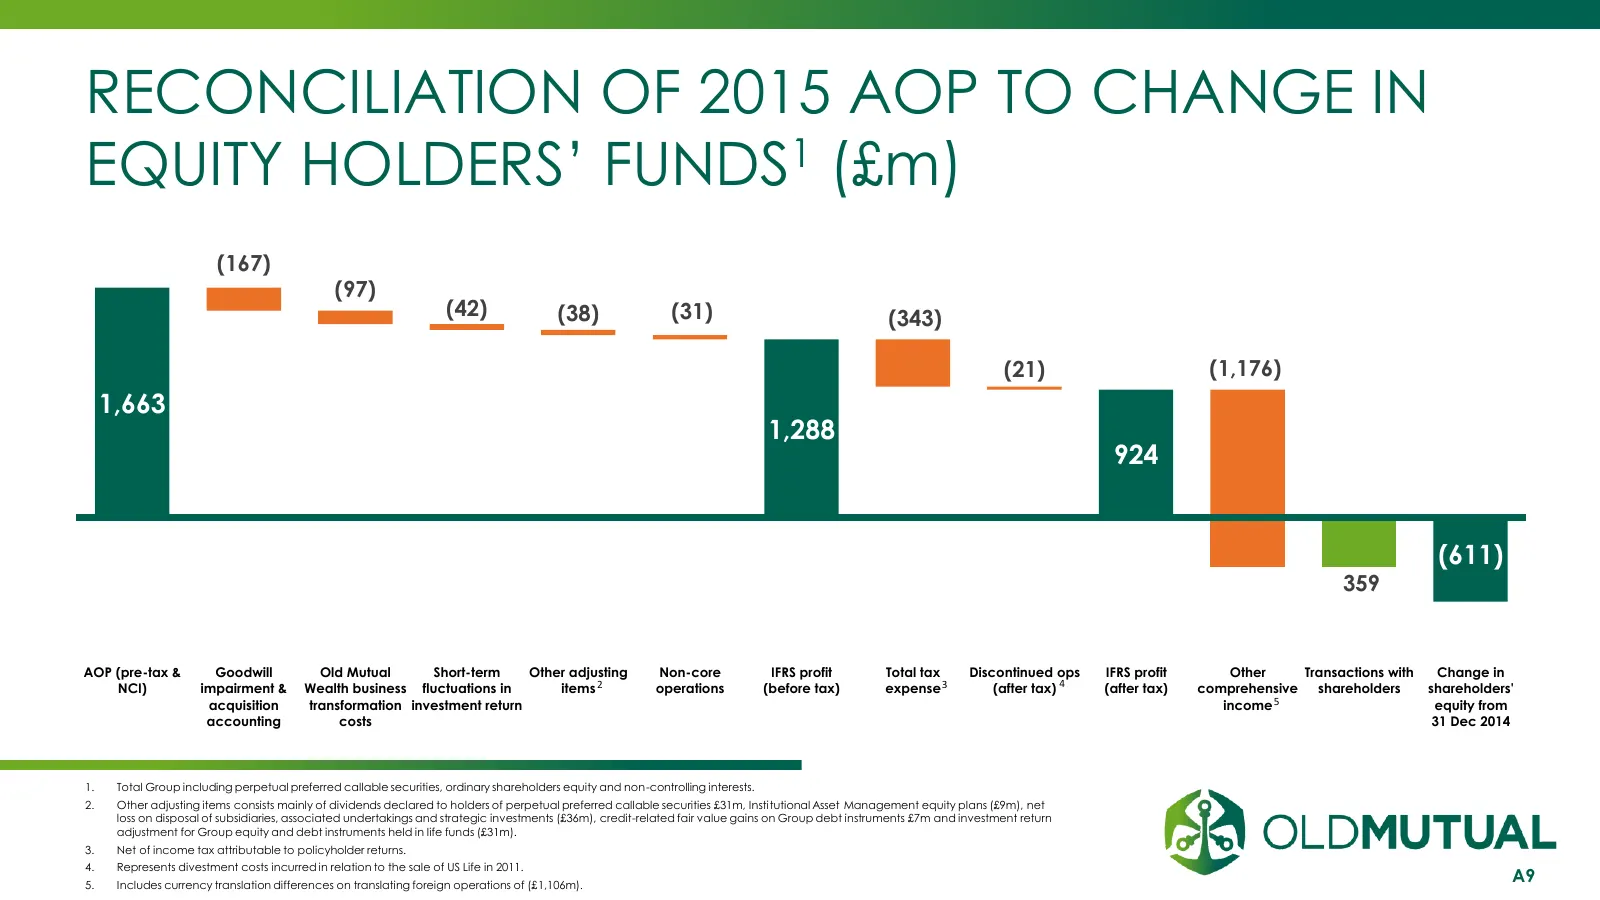
RECONCILIATION OF 2015 AOP TO CHANGE IN EQUITY HOLDERS’ FUNDS1 (£m) (167) (97) (42) (38) (31) (343) (21) (1,176) 1,663 1,288 924 (611) 359 AOP (pre-tax & Goodwill Old Mutual Short-term Other adjusting Non-core IFRS profit Total tax Discontinued ops IFRS profit Other Transactions with Change in NCI)
Slide 10: LTIR Calculation Methodology
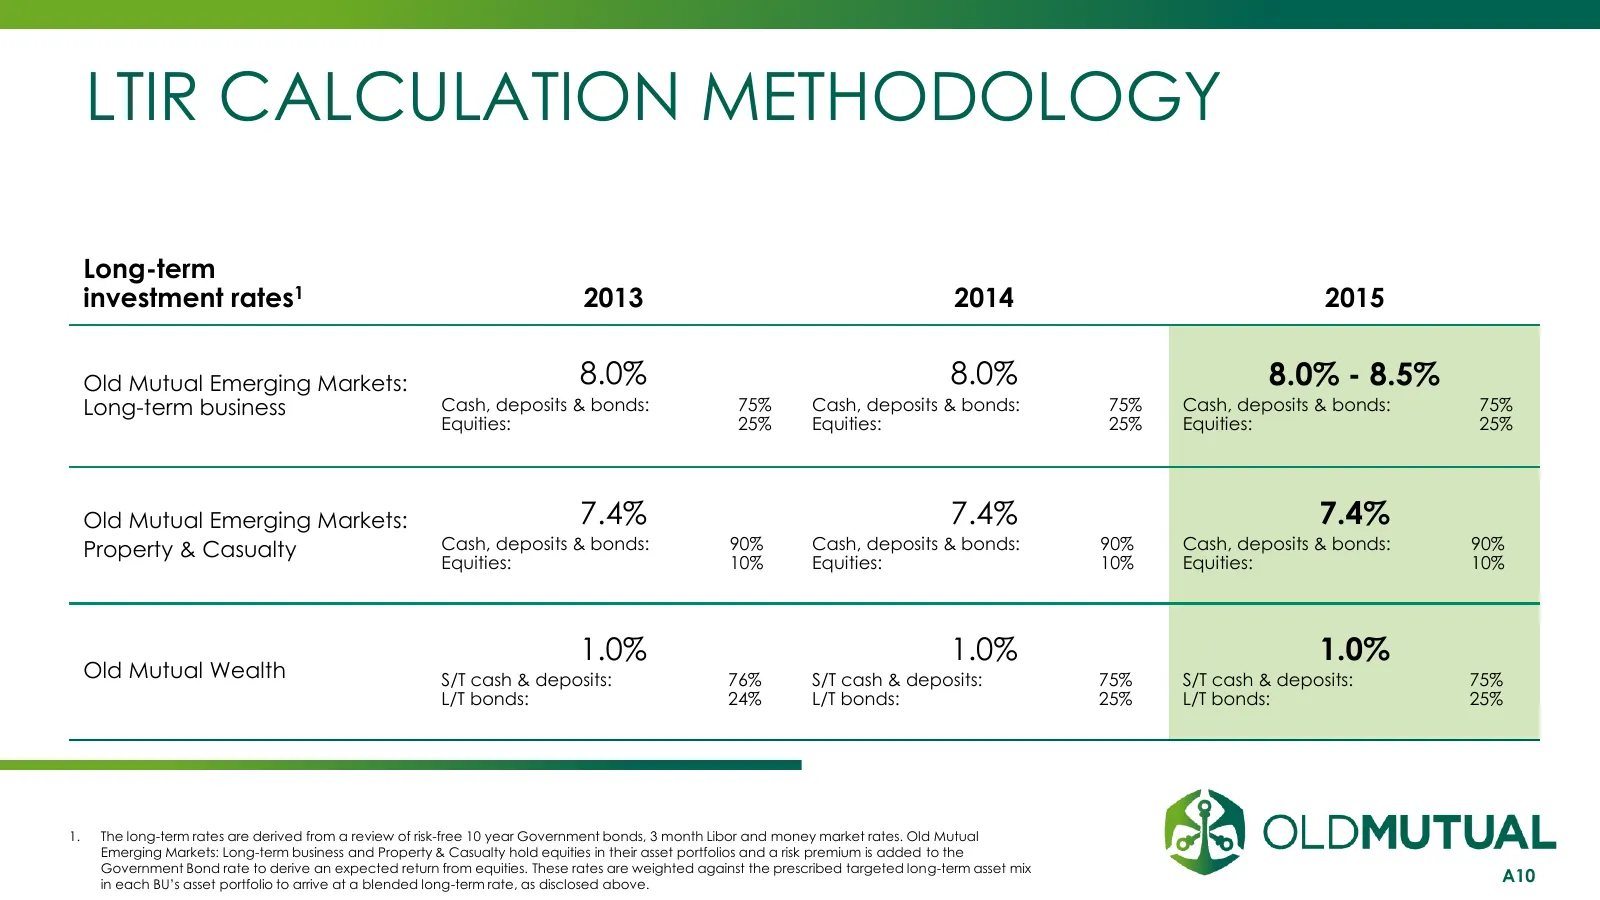
LTIR CALCULATION METHODOLOGY Long-term investment rates1 2013 2014 2015 Old Mutual Emerging Markets: 8.0% 8.0% 8.0% - 8.5% Long-term business Cash, deposits & bonds: 75% Cash, deposits & bonds: 75% Cash, deposits & bonds: 75% Equities: 25% Equities: 25% Equities: 25% Old Mutual Emerging Markets: 7.4
Slide 11: Adjusted Group NAV
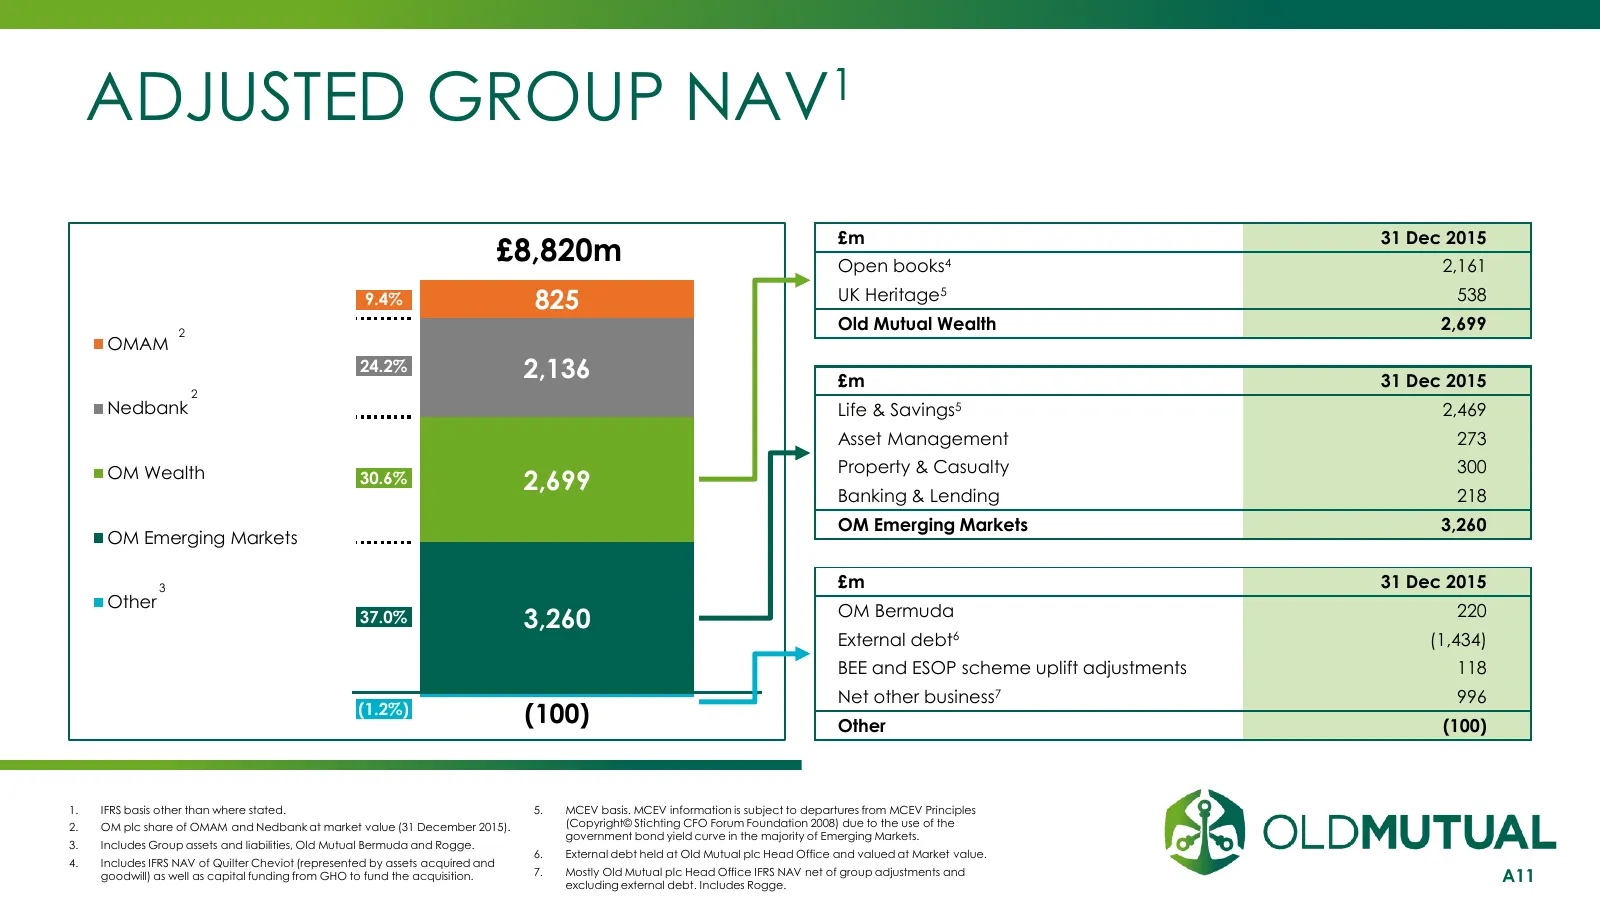
ADJUSTED GROUP NAV1 £m 31 Dec 2015 £8,820m Open books4 2,161 9.4% 825 UK Heritage5 538 2 Old Mutual Wealth 2,699 OMAM 24.2% 2,136 £m 31 Dec 2015 2 Nedbank Life & Savings5 2,469 Asset Management 273 OM Wealth Property & Casualty 300 30.6% 2,699 Banking & Lending 218 OM Emerging Markets 3,260 OM Emerg
Slide 12: Adjusted Group NAV per BU
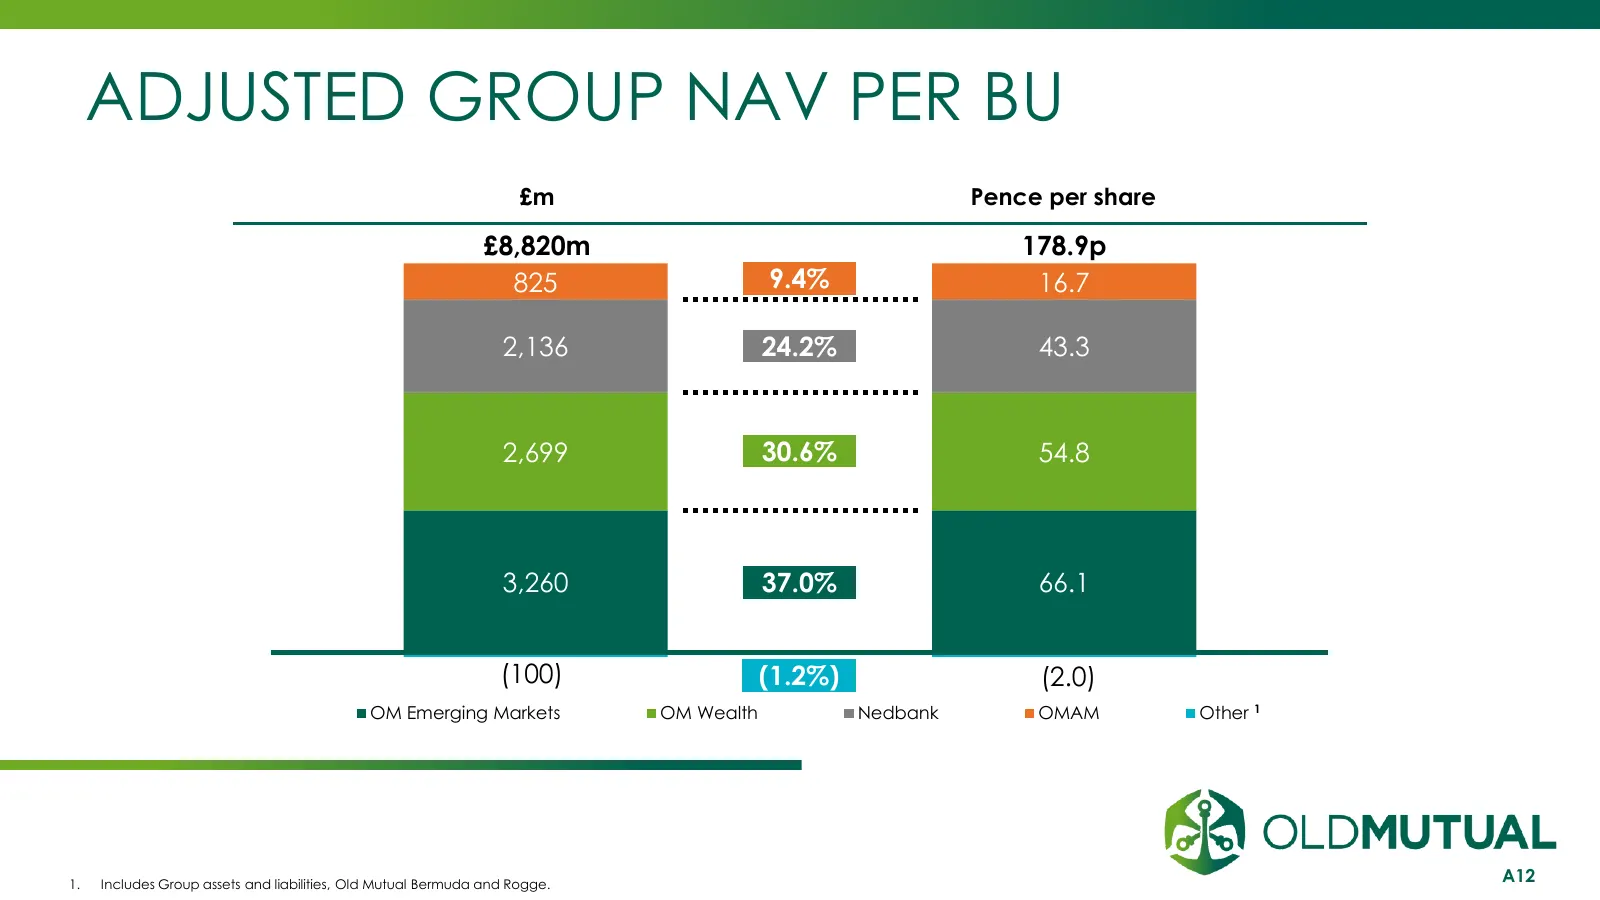
ADJUSTED GROUP NAV PER BU £m Pence per share £8,820m 178.9p 825 9.4% 16.7 2,136 24.2% 43.3 2,699 30.6% 54.8 3,260 37.0% 66.1 (100) (1.2%) (2.0) OM Emerging Markets OM Wealth Nedbank OMAM Other 1 1. Includes Group assets and liabilities, Old Mutual Bermuda and Rogge. A12
Slide 13: Adjusted Group NAV (£m)
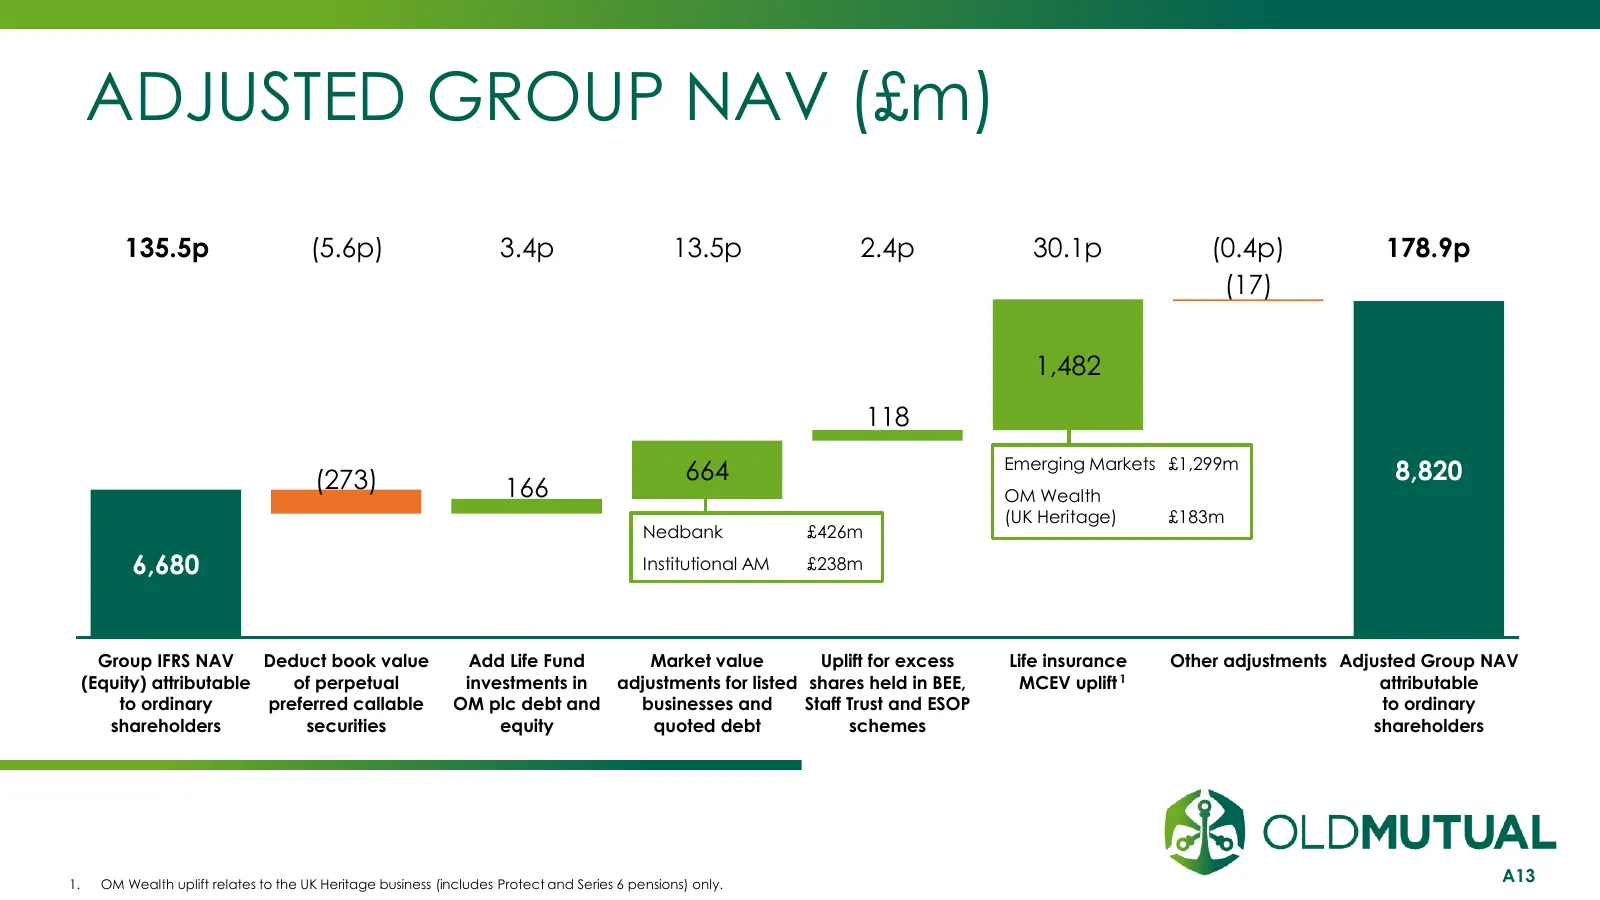
ADJUSTED GROUP NAV (£m) 135.5p (5.6p) 3.4p 13.5p 2.4p 30.1p (0.4p) 178.9p (17) 1,482 118 Emerging Markets £1,299m (273) 664 8,820 166 OM Wealth (UK Heritage) £183m Nedbank £426m 6,680 Institutional AM £238m Group IFRS NAV Deduct book value Add Life Fund Market value Uplift for excess Life insurance
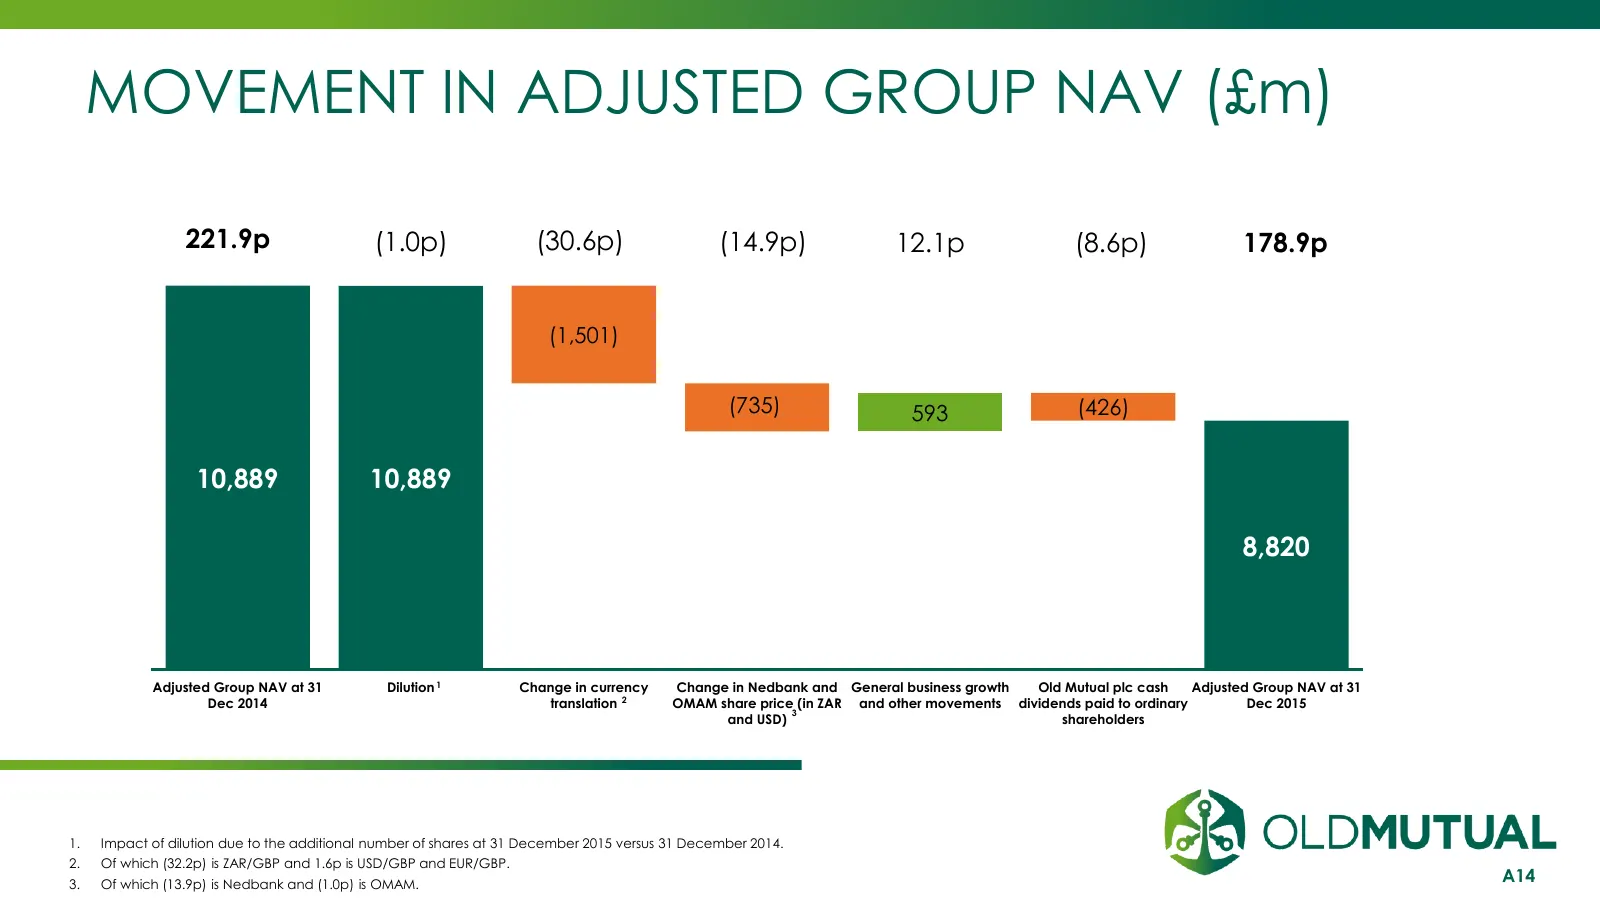
Slide 14: Movement in Adjusted Group NAV (£m)
MOVEMENT IN ADJUSTED GROUP NAV (£m) 221.9p (1.0p) (30.6p) (14.9p) 12.1p (8.6p) 178.9p (1,501) (735) 593 (426) 10,889 10,889 8,820 Adjusted Group NAV at 31 Dilution 1 Change in currency Change in Nedbank and General business growth Old Mutual plc cash Adjusted Group NAV at 31 Dec 2014 translation 2 O
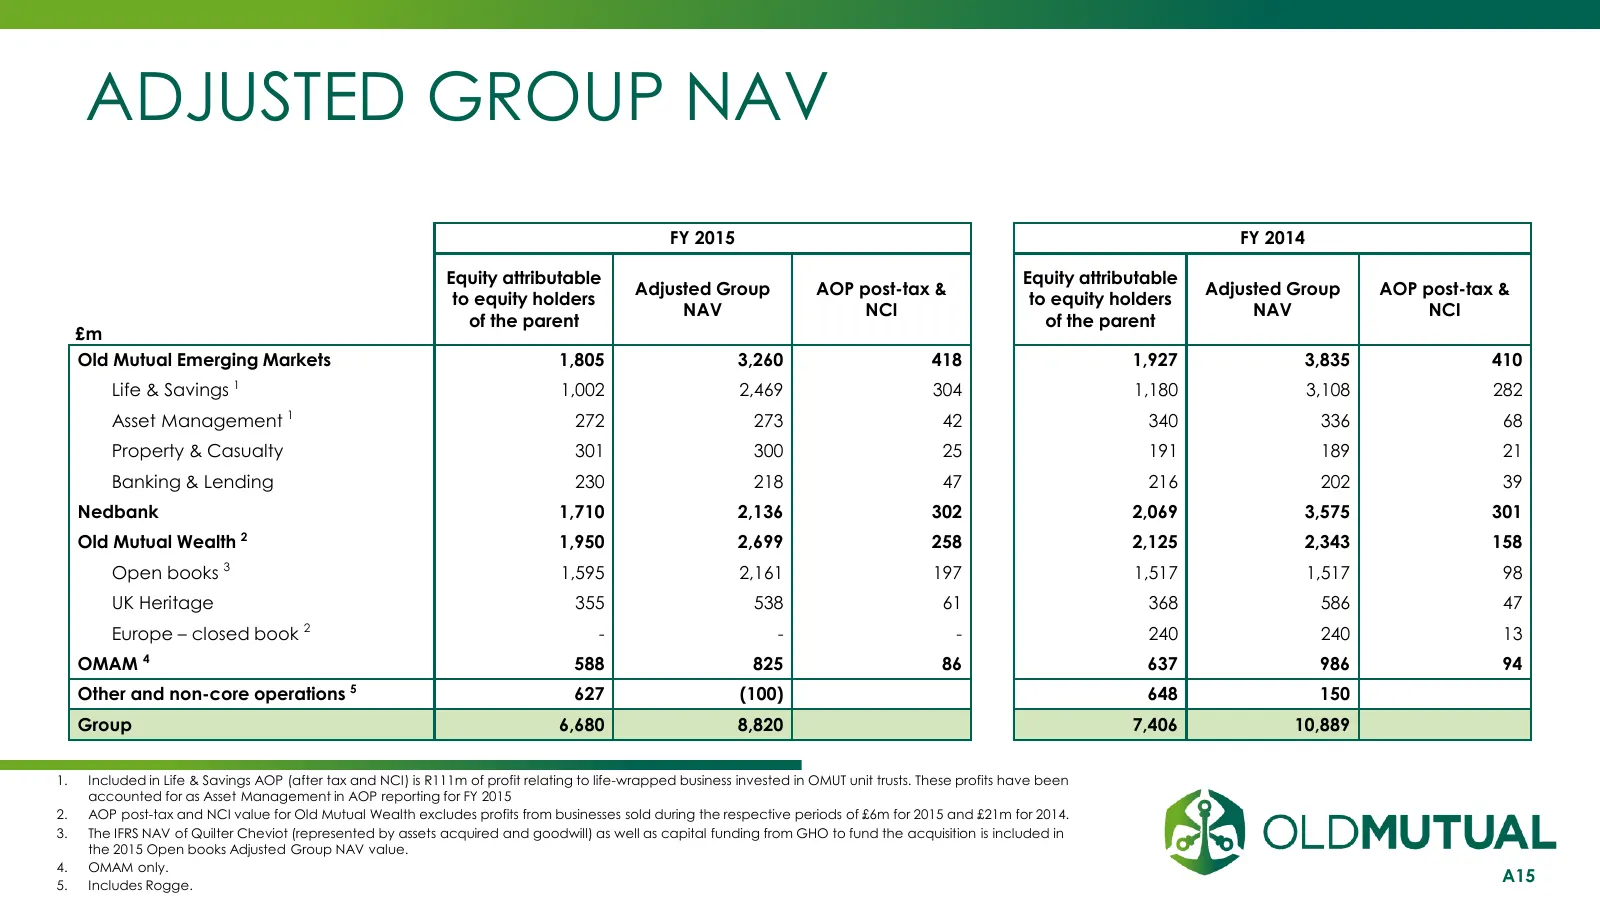
Slide 15: Adjusted Group NAV
ADJUSTED GROUP NAV FY 2015 FY 2014 Equity attributable Equity attributable Adjusted Group AOP post-tax & Adjusted Group AOP post-tax & to equity holders to equity holders NAV NCI NAV NCI of the parent of the parent £m Old Mutual Emerging Markets 1,805 3,260 418 1,927 3,835 410 Life & Savings 1 1,002
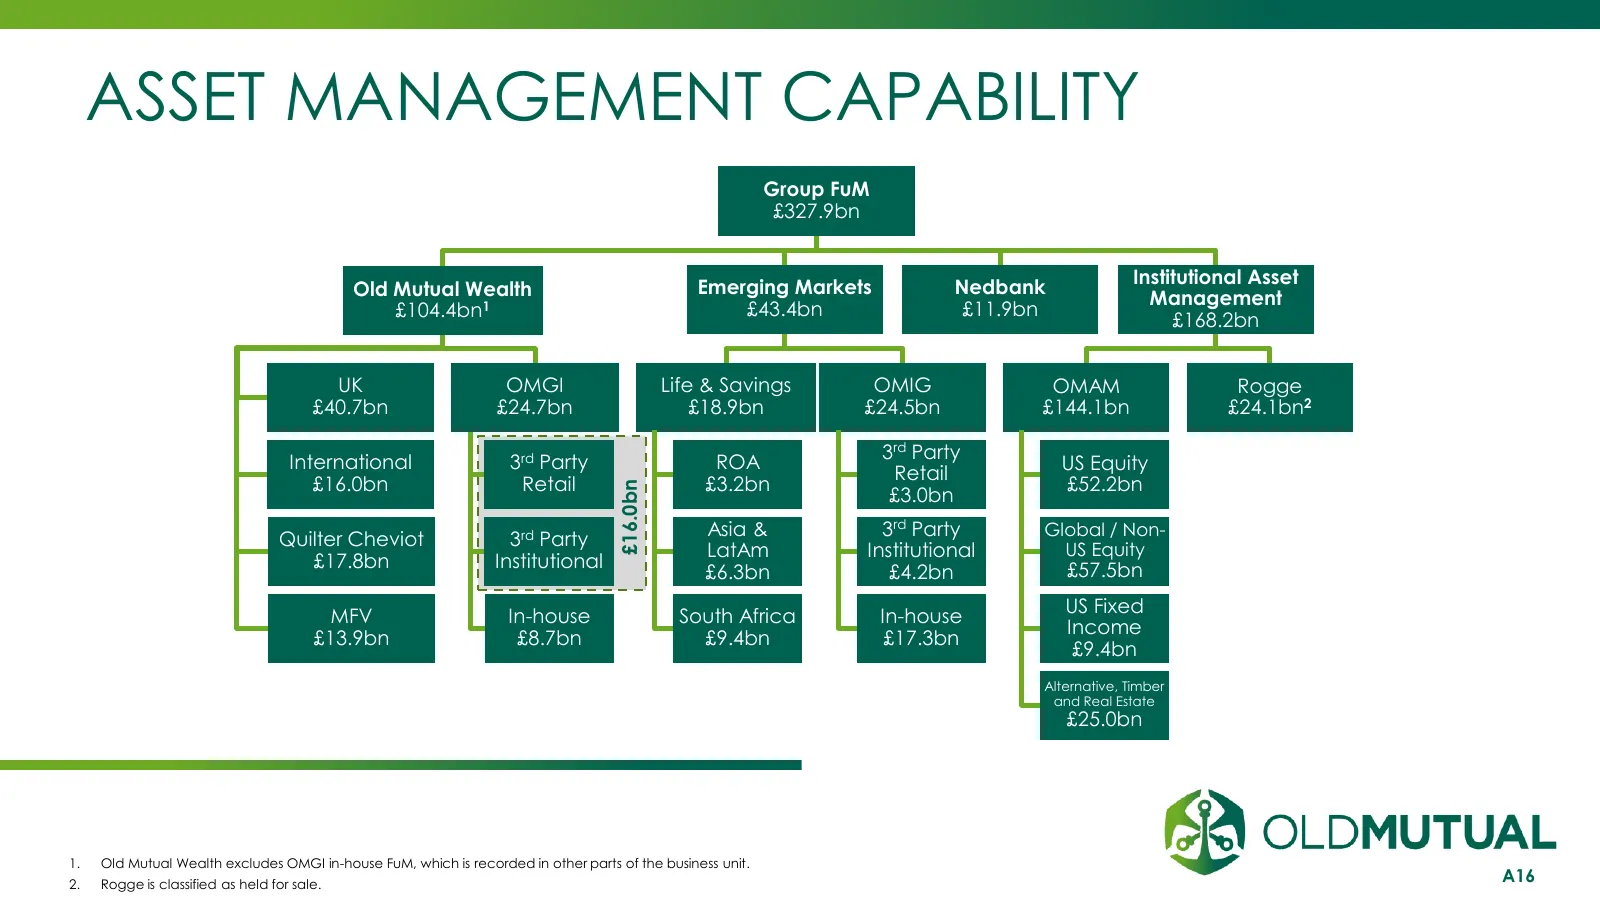
Slide 16: Asset Management Capability
ASSET MANAGEMENT CAPABILITY Group FuM £327.9bn Institutional Asset Old Mutual Wealth Emerging Markets Nedbank Management £104.4bn1 £43.4bn £11.9bn £168.2bn UK OMGI Life & Savings OMIG OMAM Rogge £40.7bn £24.7bn £18.9bn £24.5bn £144.1bn £24.1bn2 3rd Party International 3rd Party ROA US Equity Retail
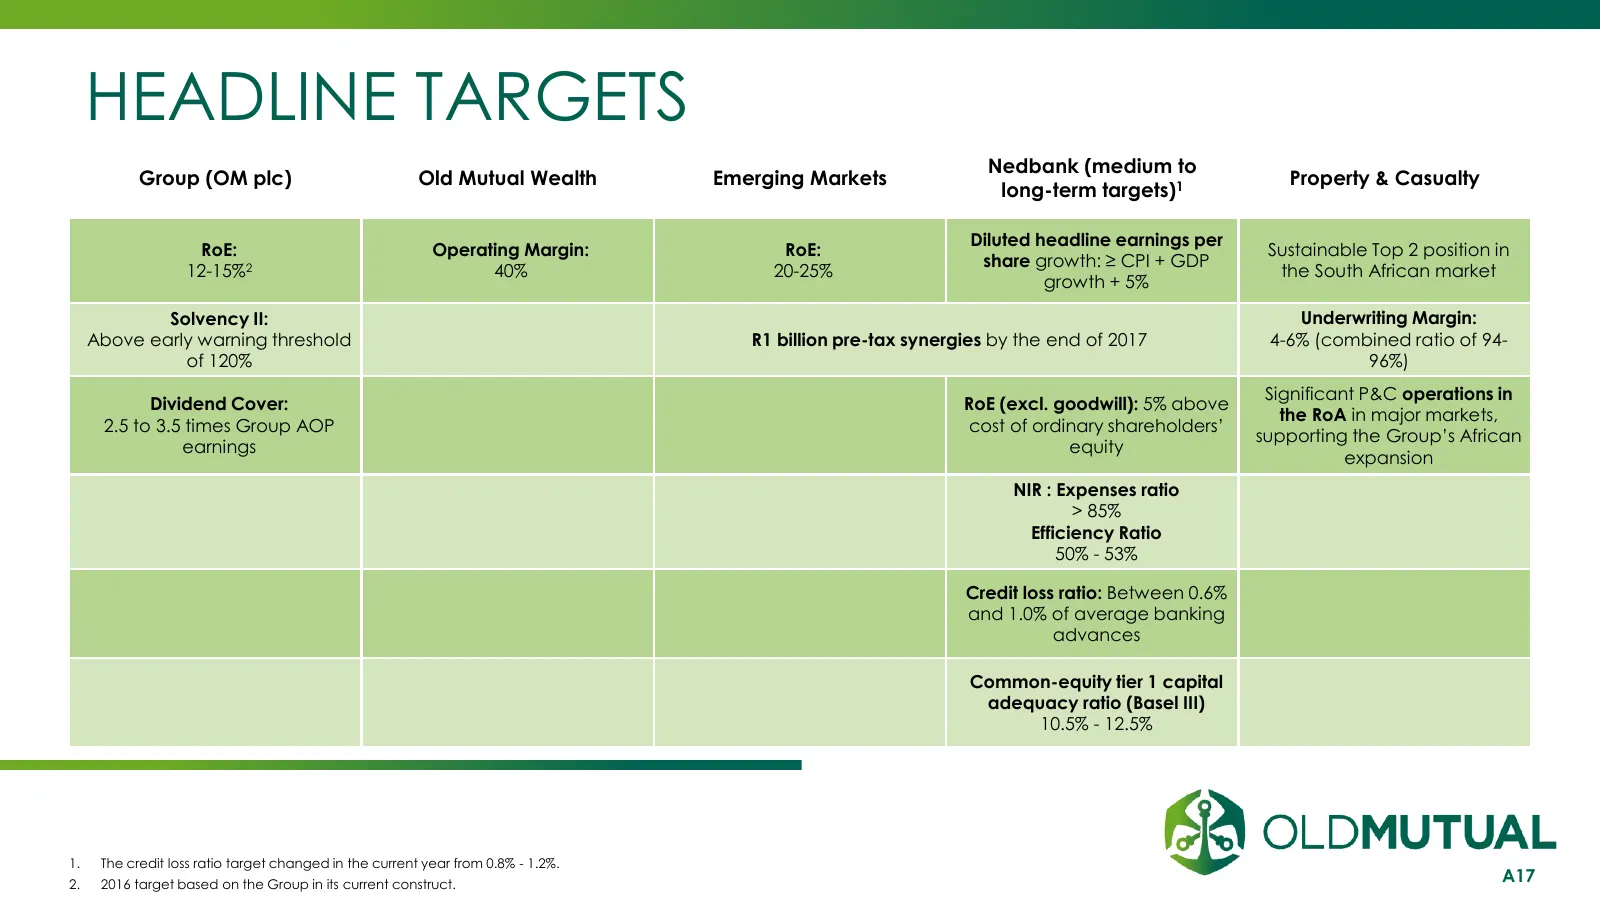
Slide 17: Headline Targets
HEADLINE TARGETS Nedbank (medium to Group (OM plc) Old Mutual Wealth Emerging Markets Property & Casualty long-term targets)1 Diluted headline earnings per RoE: Operating Margin: RoE: Sustainable Top 2 position in share growth: ≥ CPI + GDP 12-15%2 40% 20-25% the South African market growth + 5% Solv

Slide 18: Appendix 2: Capital / Treasury
APPENDIX 2 CAPITAL / TREASURY INVESTMENT | SAVINGS | INSURANCE | BANKING
Slide 19: FGD
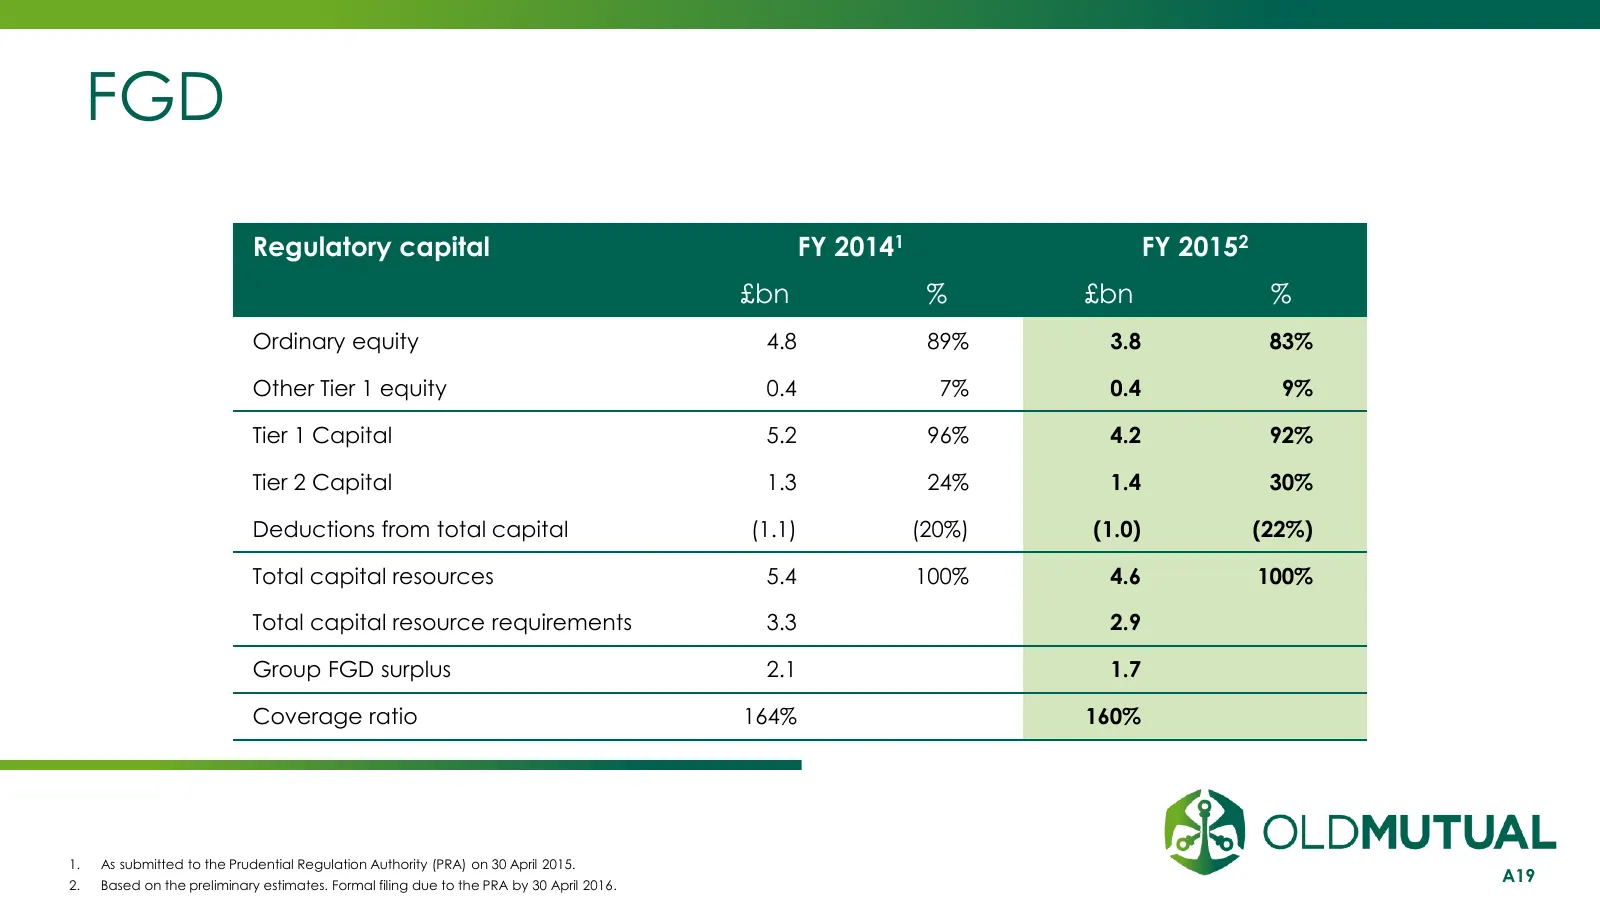
FGD Regulatory capital FY 20141 FY 20152 £bn % £bn % Ordinary equity 4.8 89% 3.8 83% Other Tier 1 equity 0.4 7% 0.4 9% Tier 1 Capital 5.2 96% 4.2 92% Tier 2 Capital 1.3 24% 1.4 30% Deductions from total capital (1.1) (20%) (1.0) (22%) Total capital resources 5.4 100% 4.6 100% Total capital resource
Slide 20: Summarised Balance Sheet
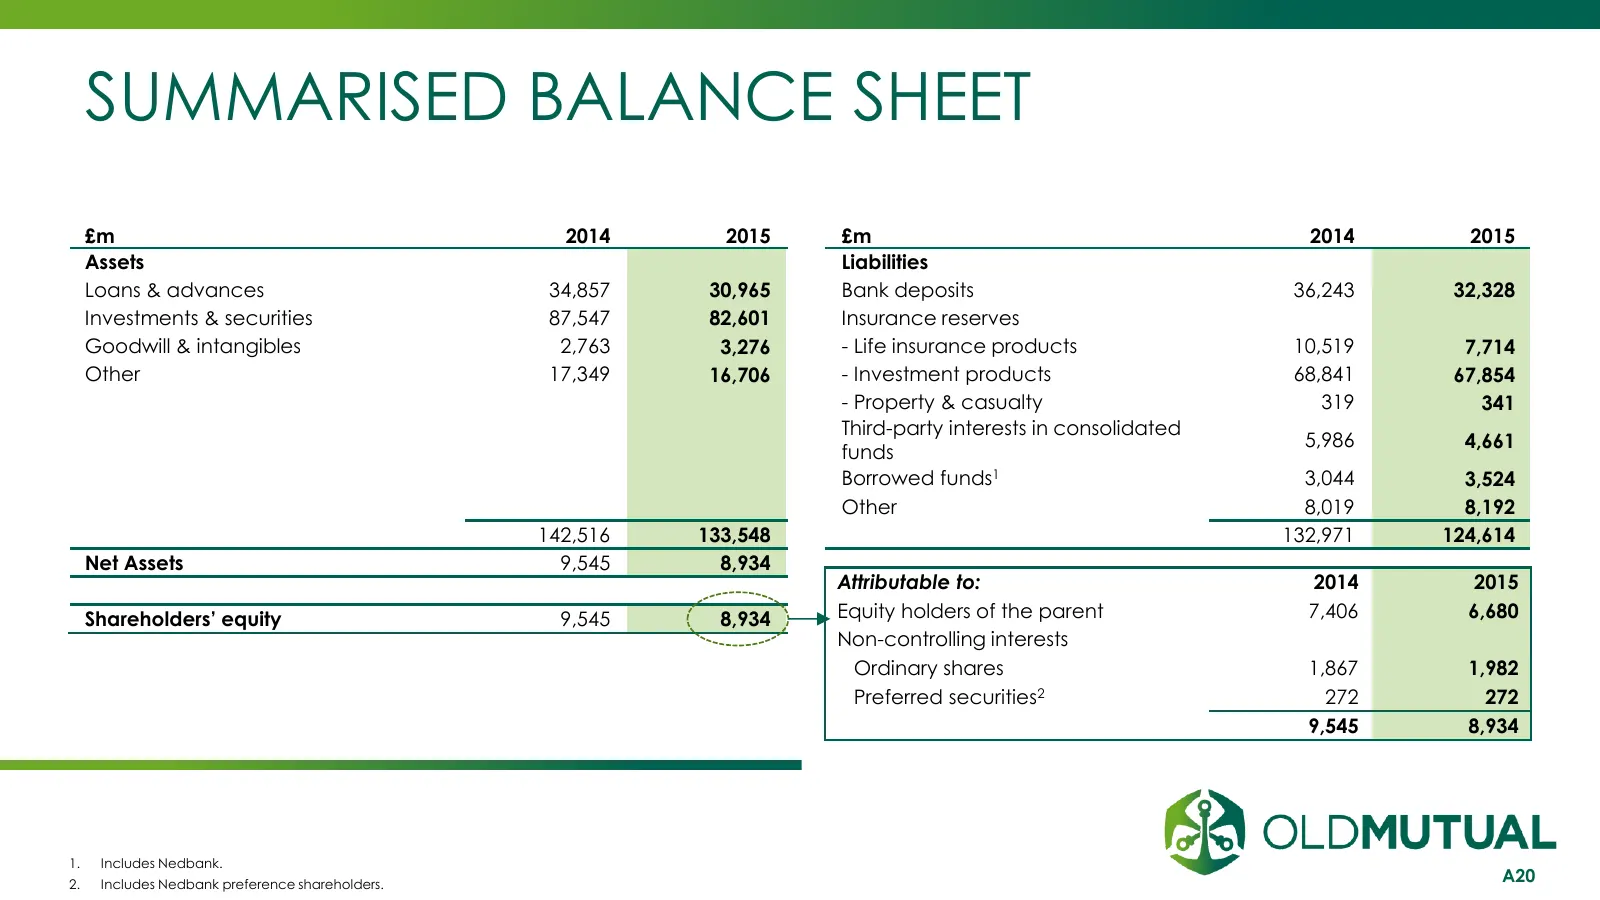
SUMMARISED BALANCE SHEET £m 2014 2015 £m 2014 2015 Assets Liabilities Loans & advances 34,857 30,965 Bank deposits 36,243 32,328 Investments & securities 87,547 82,601 Insurance reserves Goodwill & intangibles 2,763 3,276 - Life insurance products 10,519 7,714 Other 17,349 16,706 - Investment produc
Slide 21: Old Mutual Group Company Ratings
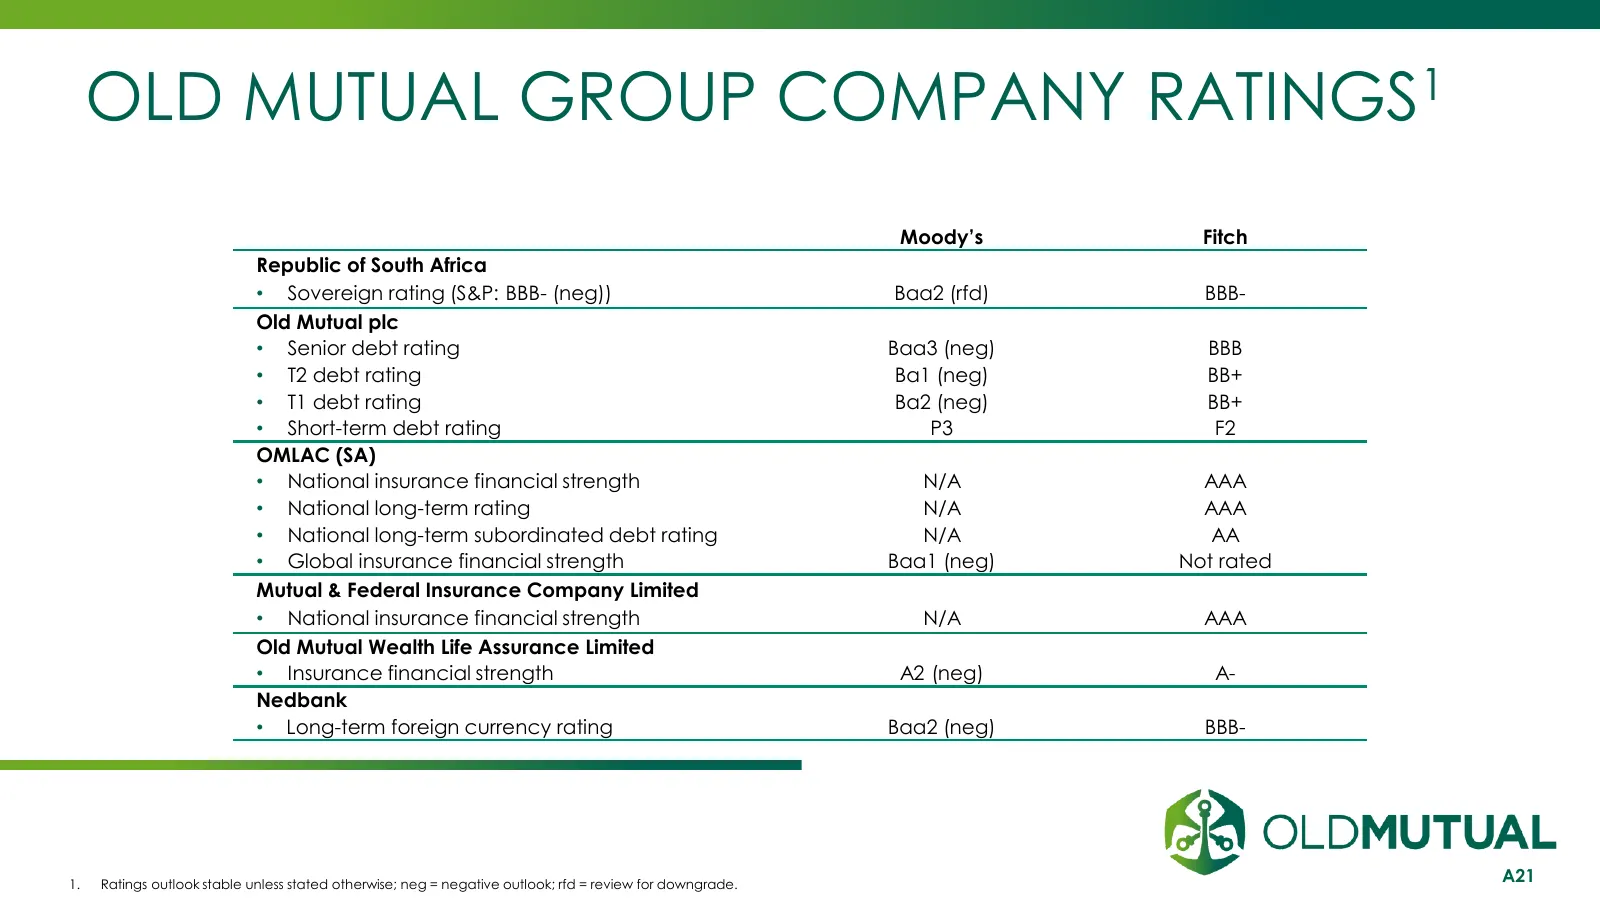
OLD MUTUAL GROUP COMPANY RATINGS1 Moody’s Fitch Republic of South Africa • Sovereign rating (S&P: BBB- (neg)) Baa2 (rfd) BBB- Old Mutual plc • Senior debt rating Baa3 (neg) BBB • T2 debt rating Ba1 (neg) BB+ • T1 debt rating Ba2 (neg) BB+ • Short-term debt rating P3 F2 OMLAC (SA) • National insuranc
Slide 22: Sources and Uses of PLC Cash
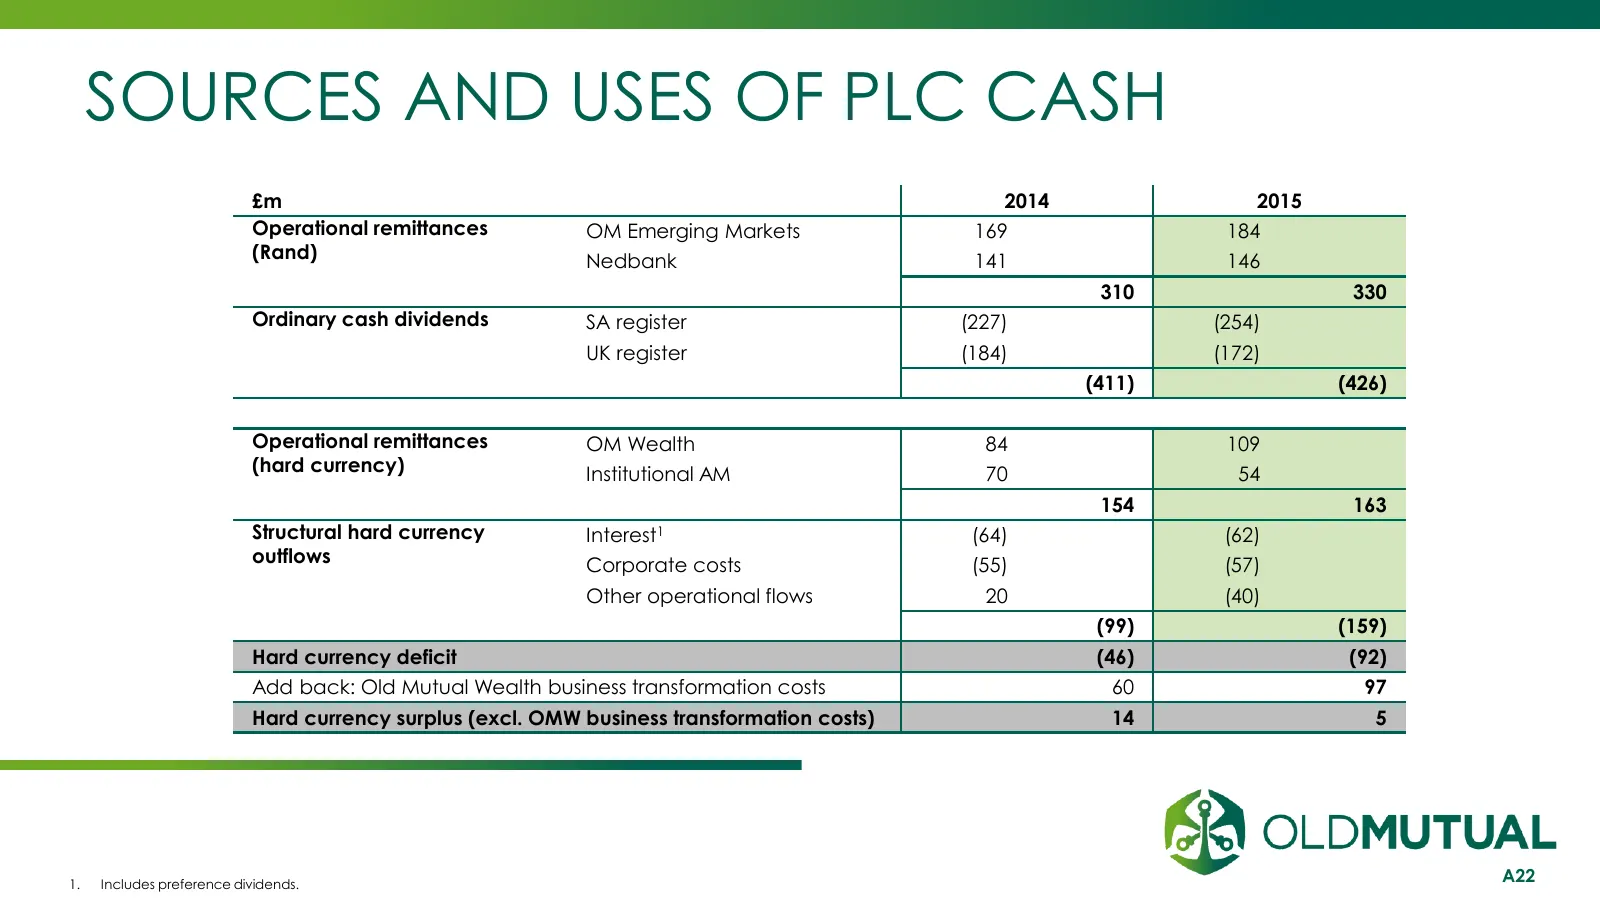
SOURCES AND USES OF PLC CASH £m 2014 2015 Operational remittances OM Emerging Markets 169 184 (Rand) Nedbank 141 146 310 330 Ordinary cash dividends SA register (227) (254) UK register (184) (172) (411) (426) Operational remittances OM Wealth 84 109 (hard currency) Institutional AM 70 54 154 163 Str

Slide 23: Appendix 3: Free Surplus Generation
APPENDIX 3 FREE SURPLUS GENERATION INVESTMENT | SAVINGS | INSURANCE | BANKING
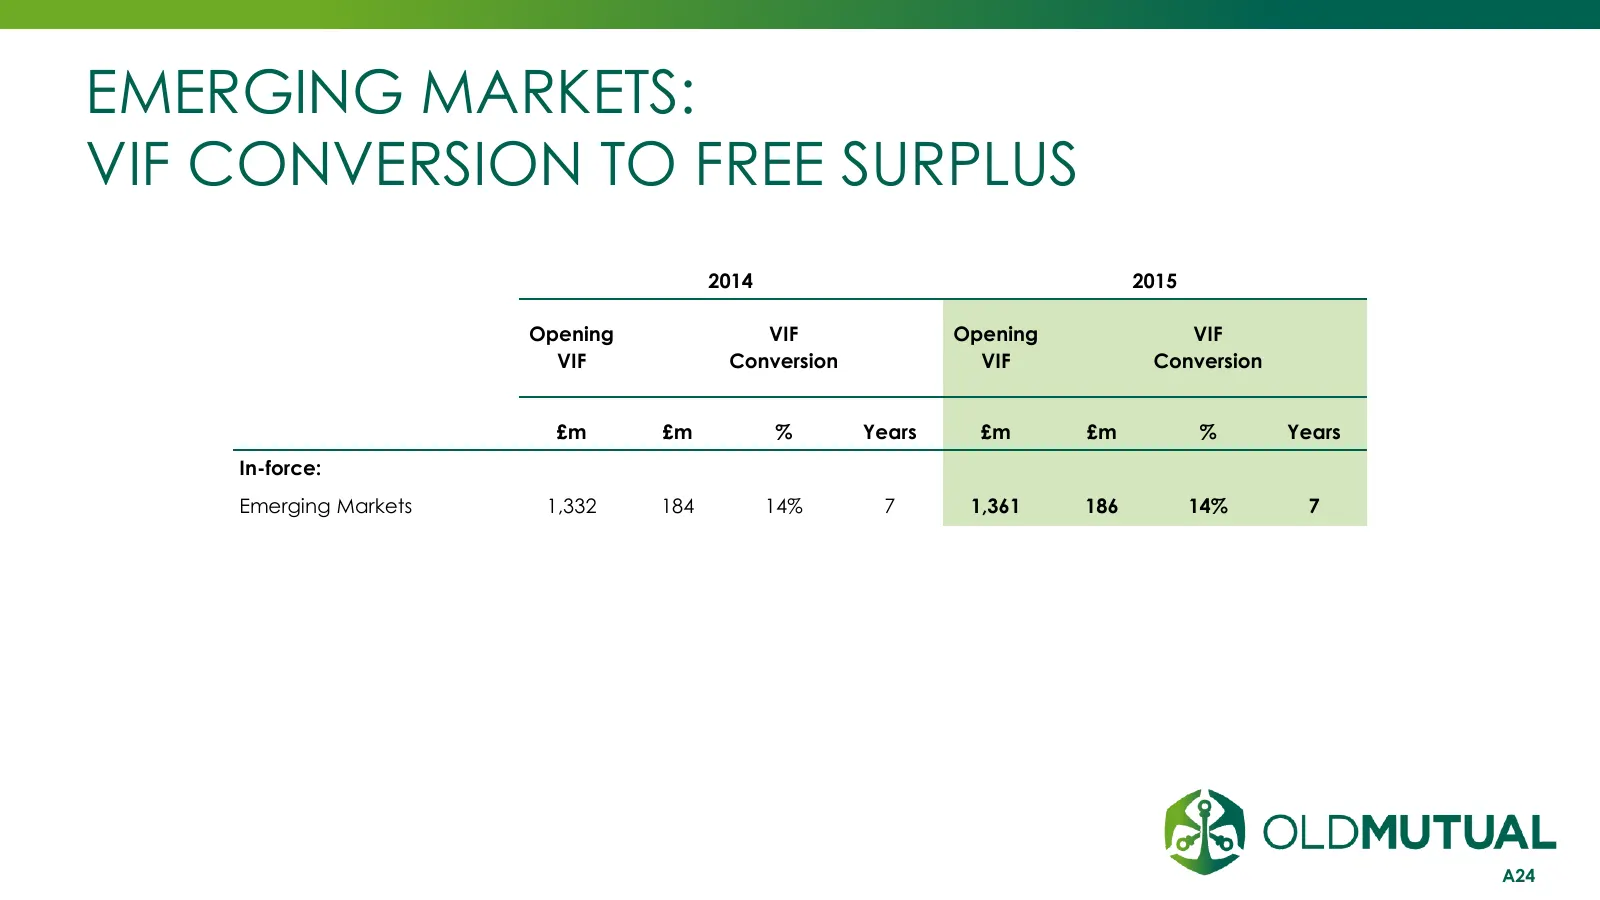
Slide 24: Emerging Markets: VIF Conversion to Free Surplus
EMERGING MARKETS: VIF CONVERSION TO FREE SURPLUS 2014 2015 Opening VIF Opening VIF VIF Conversion VIF Conversion £m £m % Years £m £m % Years In-force: Emerging Markets 1,332 184 14% 7 1,361 186 14% 7 A24
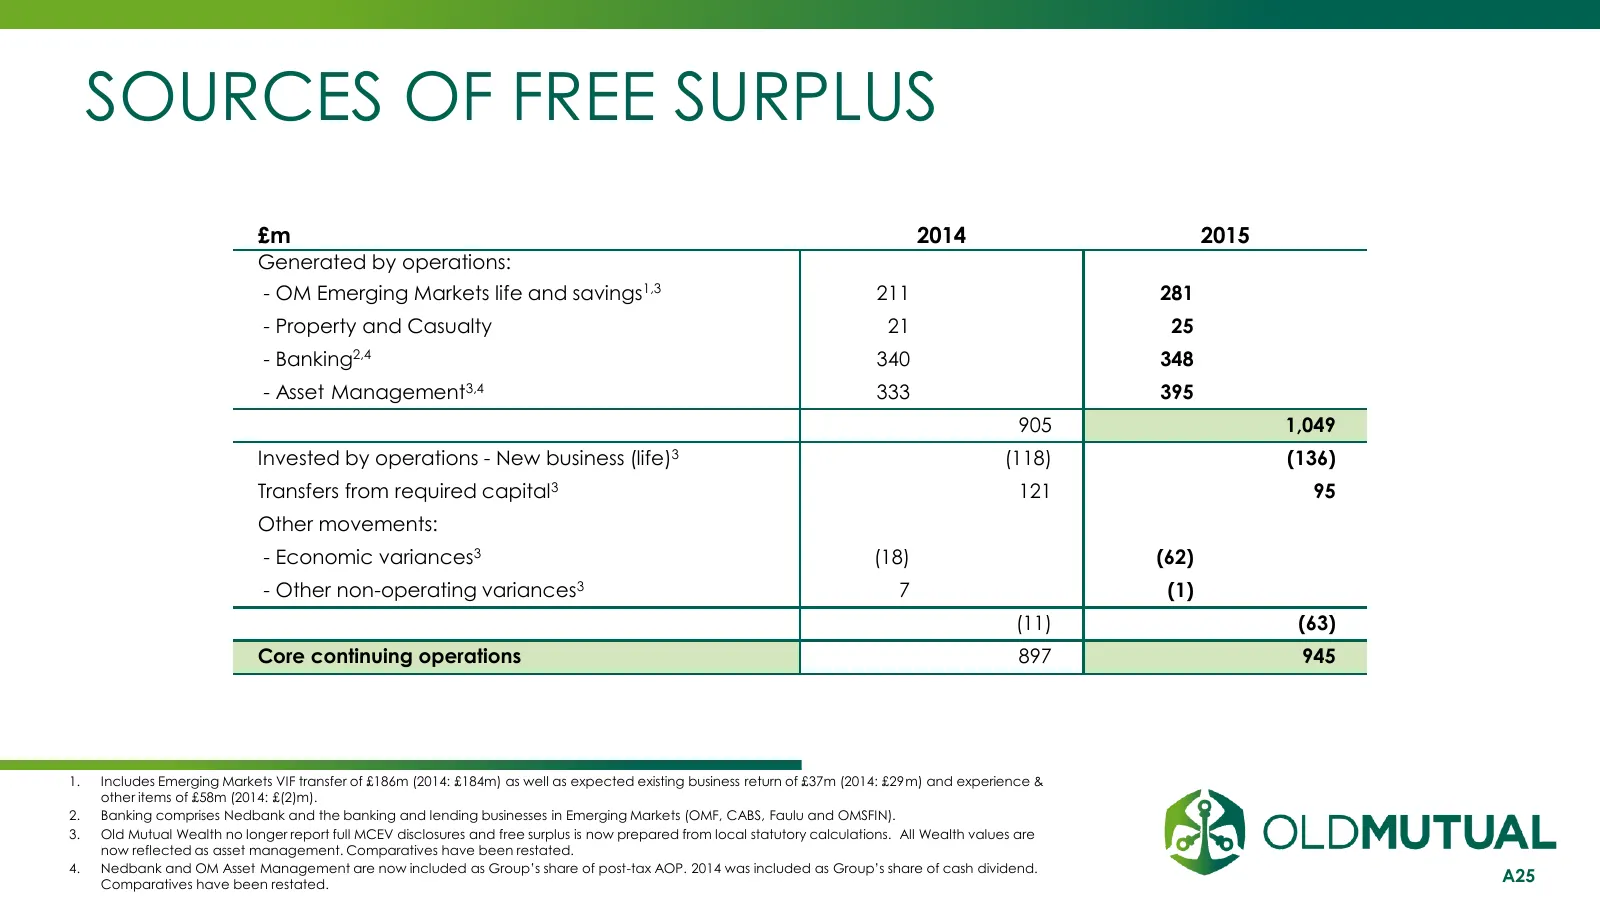
Slide 25: Sources of Free Surplus
SOURCES OF FREE SURPLUS £m 2014 2015 Generated by operations: - OM Emerging Markets life and savings1,3 211 281 - Property and Casualty 21 25 - Banking2,4 340 348 - Asset Management3,4 333 395 905 1,049 Invested by operations - New business (life)3 (118) (136) Transfers from required capital3 121 95
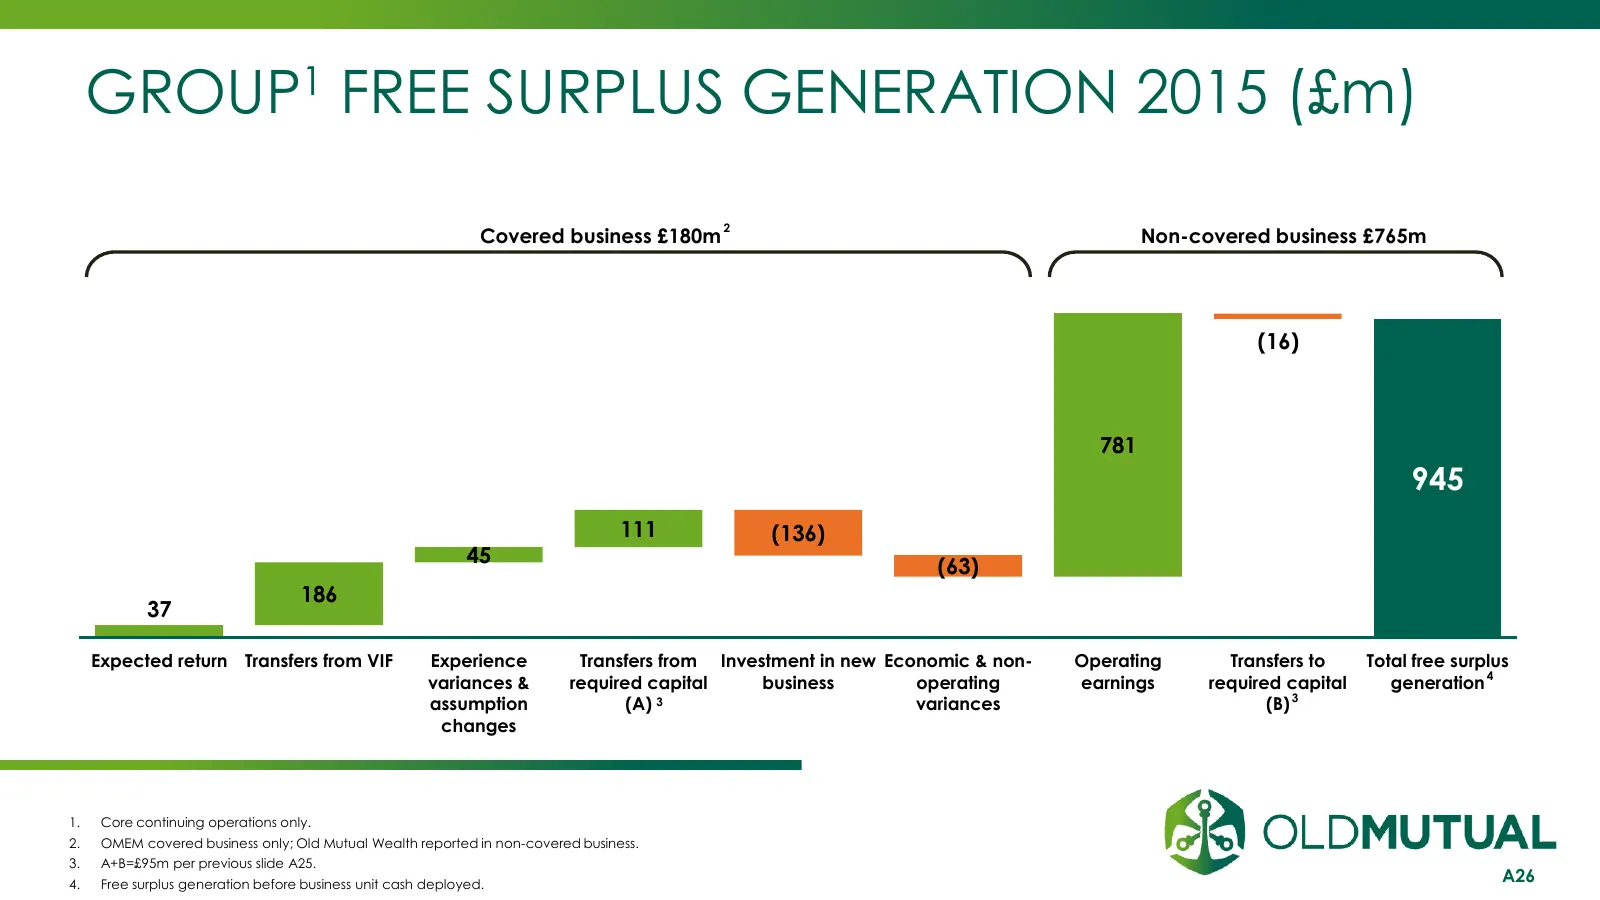
Slide 26: Group Free Surplus Generation 2015 (£m)
GROUP1 FREE SURPLUS GENERATION 2015 (£m) 2 Covered business £180m Non-covered business £765m (16) 781 945 111 (136) 45 (63) 186 37 Expected return Transfers from VIF Experience Transfers from Investment in new Economic & non- Operating Transfers to Total free surplus variances & required capital bus
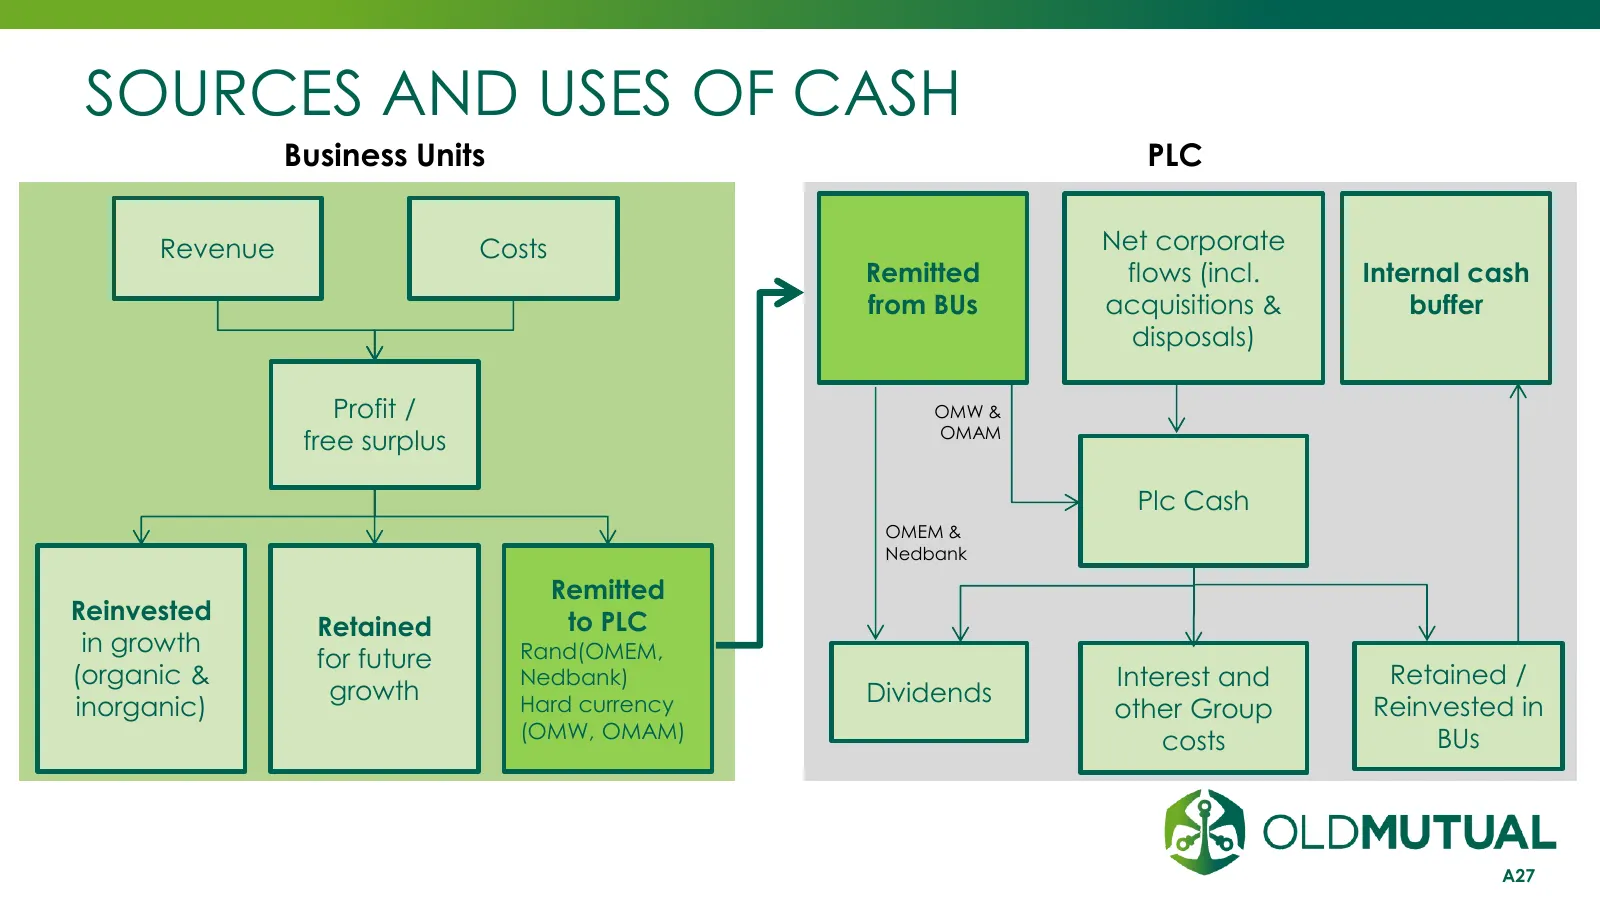
Slide 27: Sources and Uses of Cash
SOURCES AND USES OF CASH Business Units PLC Revenue Costs Net corporate Remitted flows (incl. Internal cash from BUs acquisitions & buffer disposals) Profit / OMW & OMAM free surplus Plc Cash OMEM & Nedbank Remitted Reinvested to PLC Retained in growth Rand(OMEM, for future (organic & Nedbank) Inter

Slide 28: Appendix 4: Solvency II
APPENDIX 4 SOLVENCY II INVESTMENT | SAVINGS | INSURANCE | BANKING
Slide 29: Group Capital
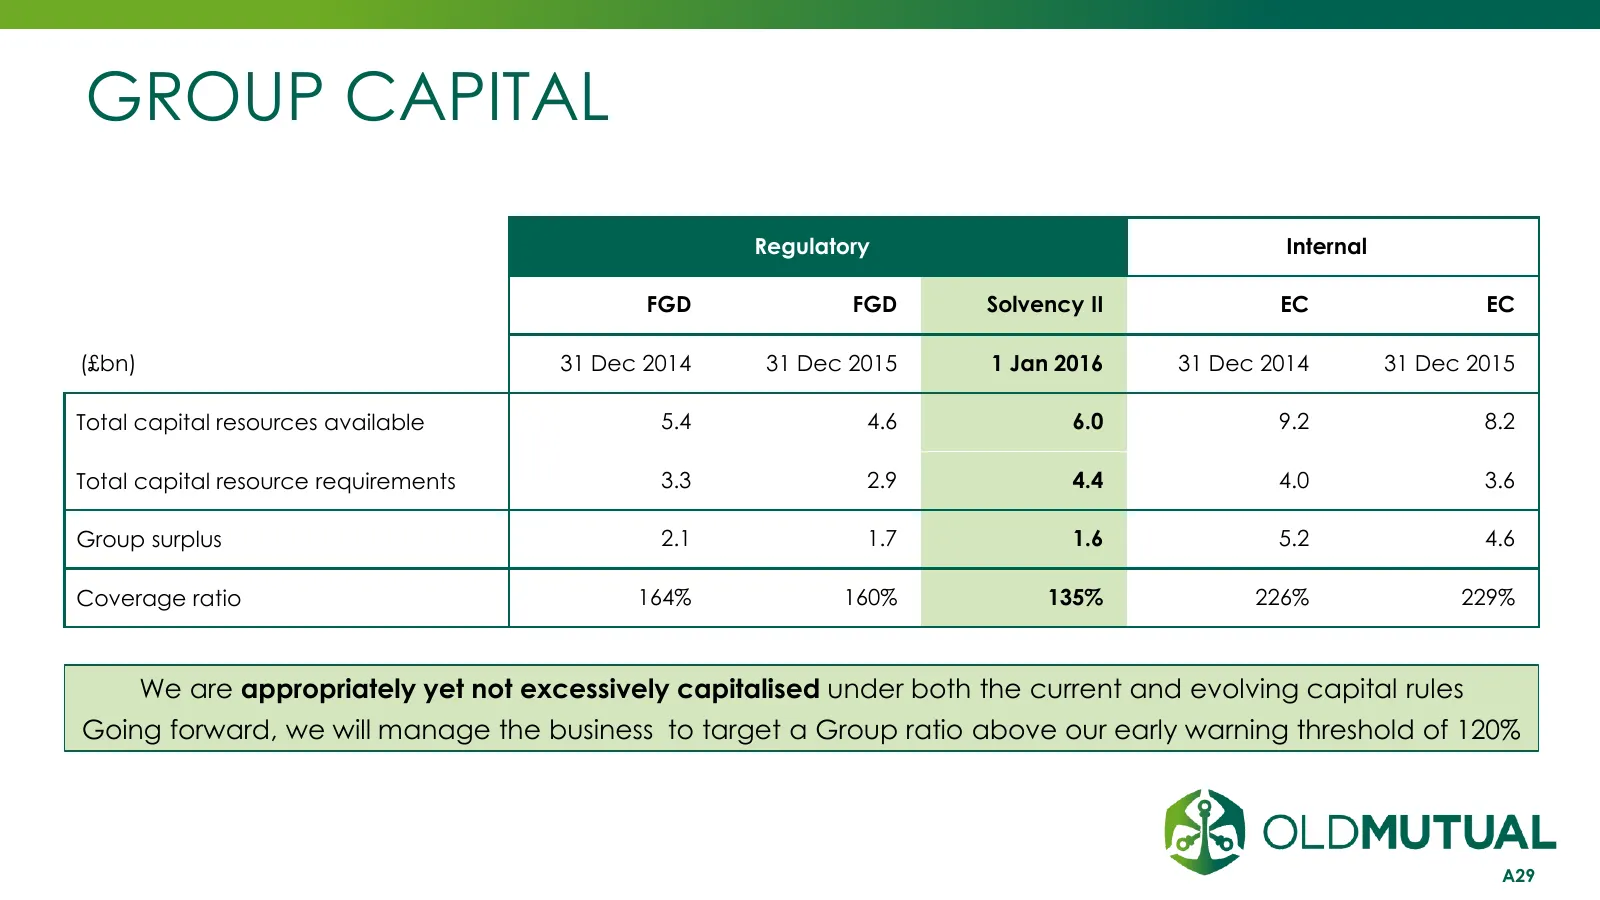
GROUP CAPITAL Regulatory Internal FGD FGD Solvency II EC EC (£bn) 31 Dec 2014 31 Dec 2015 1 Jan 2016 31 Dec 2014 31 Dec 2015 Total capital resources available 5.4 4.6 6.0 9.2 8.2 Total capital resource requirements 3.3 2.9 4.4 4.0 3.6 Group surplus 2.1 1.7 1.6 5.2 4.6 Coverage ratio 164% 160% 135% 2
Slide 30: Prudent Solvency II Preparation Basis
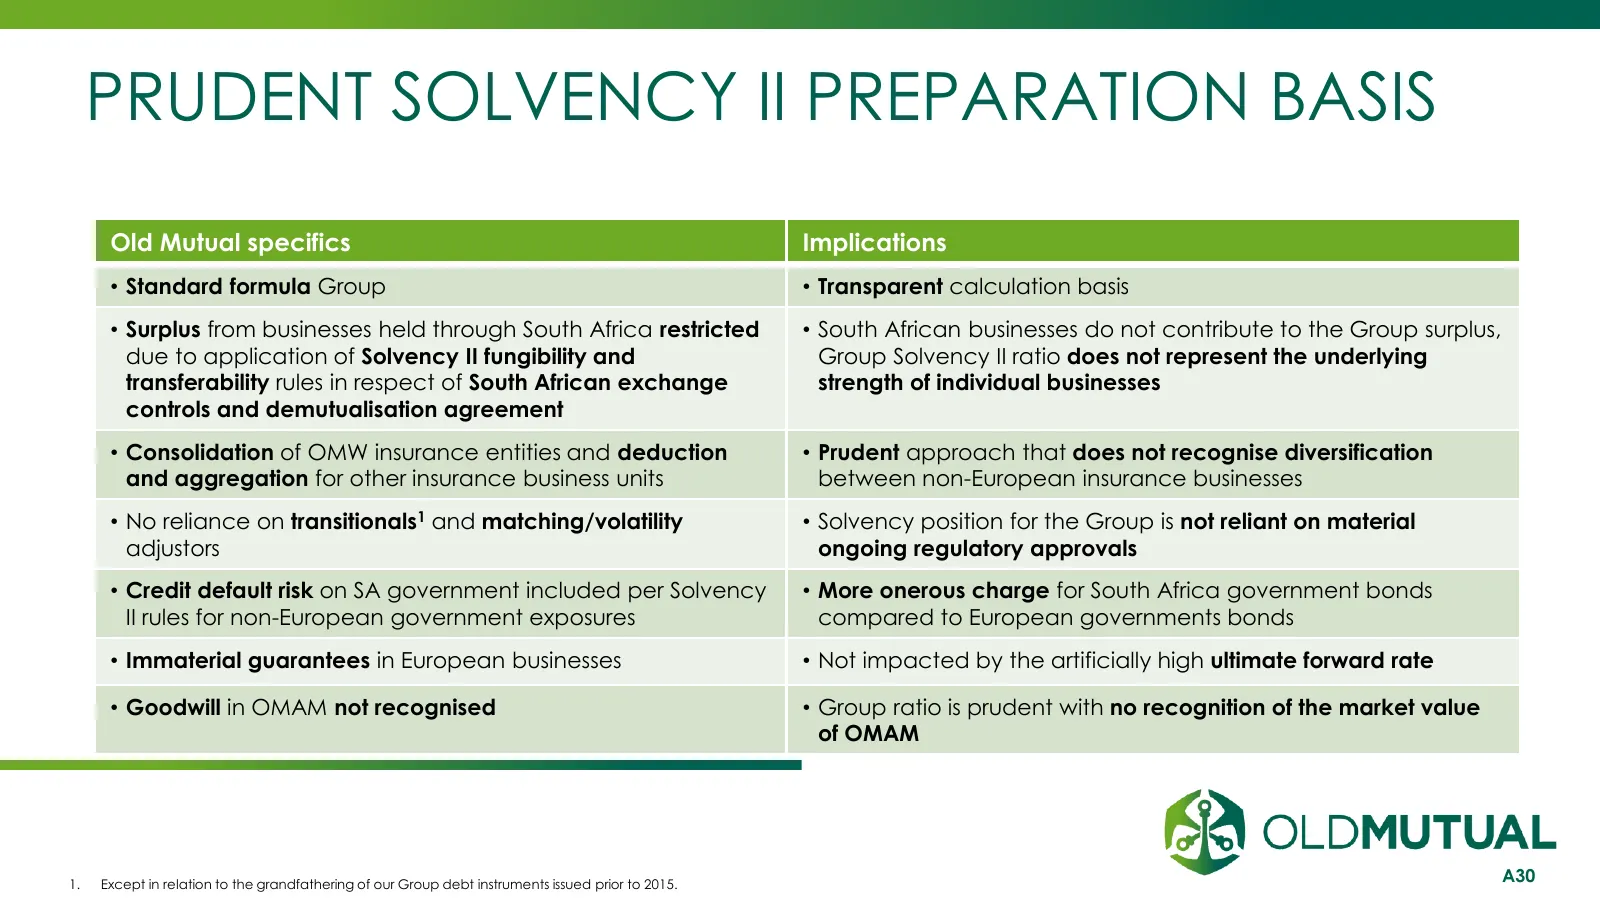
PRUDENT SOLVENCY II PREPARATION BASIS Old Mutual specifics Implications • Standard formula Group • Transparent calculation basis • Surplus from businesses held through South Africa restricted • South African businesses do not contribute to the Group surplus, due to application of Solvency II fungibi
Slide 31: Group Aggregation
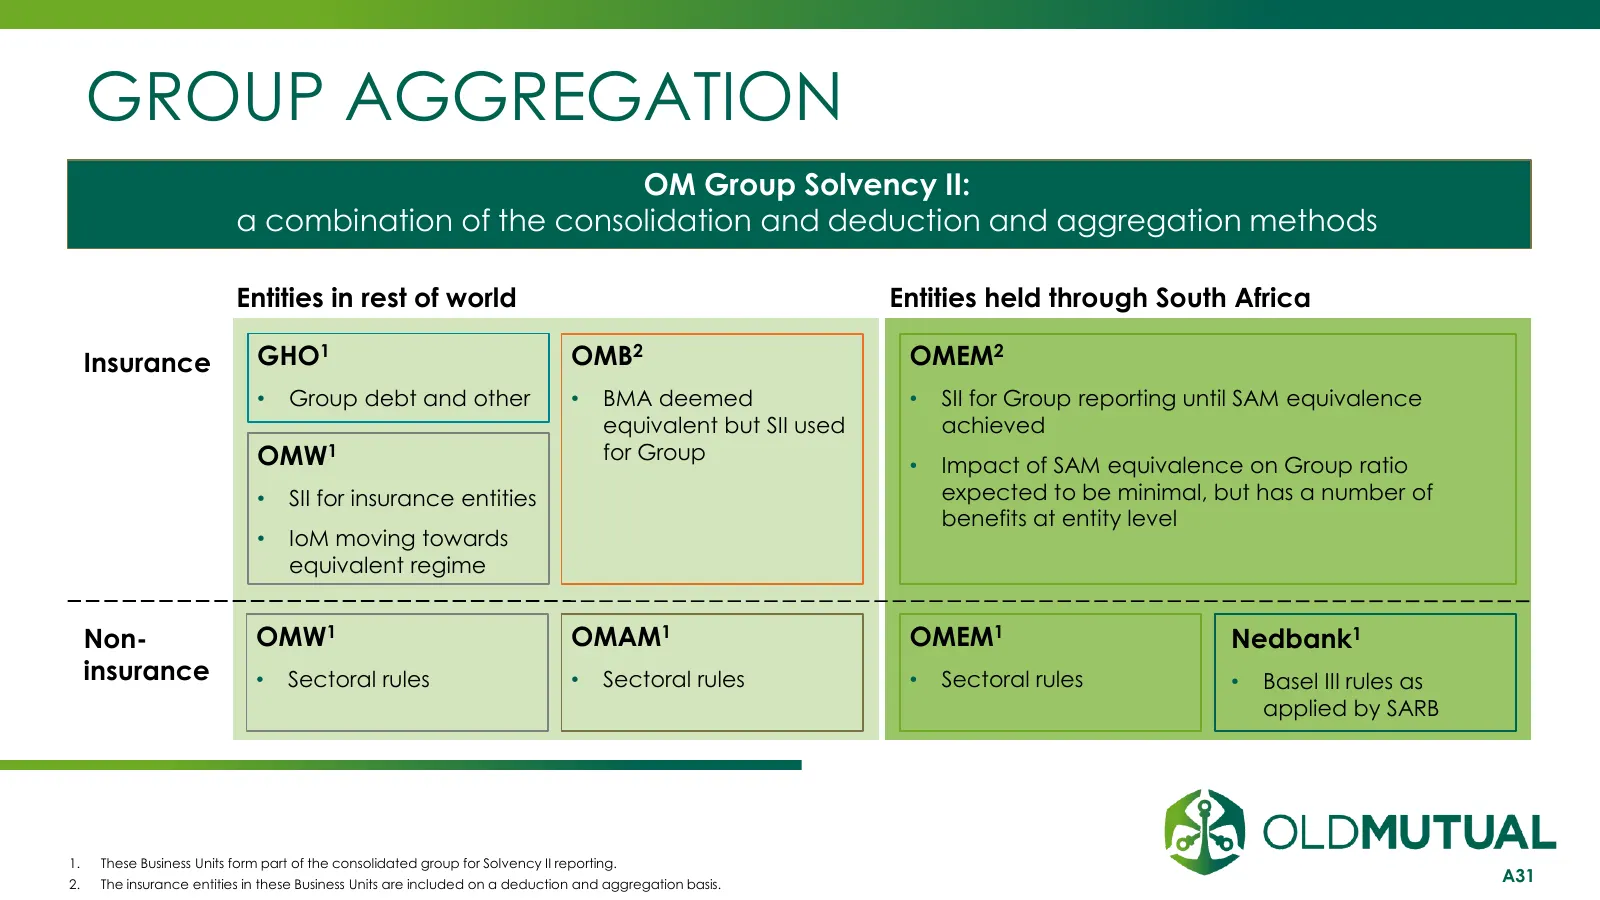
GROUP AGGREGATION OM Group Solvency II: a combination of the consolidation and deduction and aggregation methods Entities in rest of world Entities held through South Africa Insurance GHO1 OMB2 OMEM2 • Group debt and other • BMA deemed • SII for Group reporting until SAM equivalence equivalent but S
Slide 32: Moving from Group FGD to Group SII
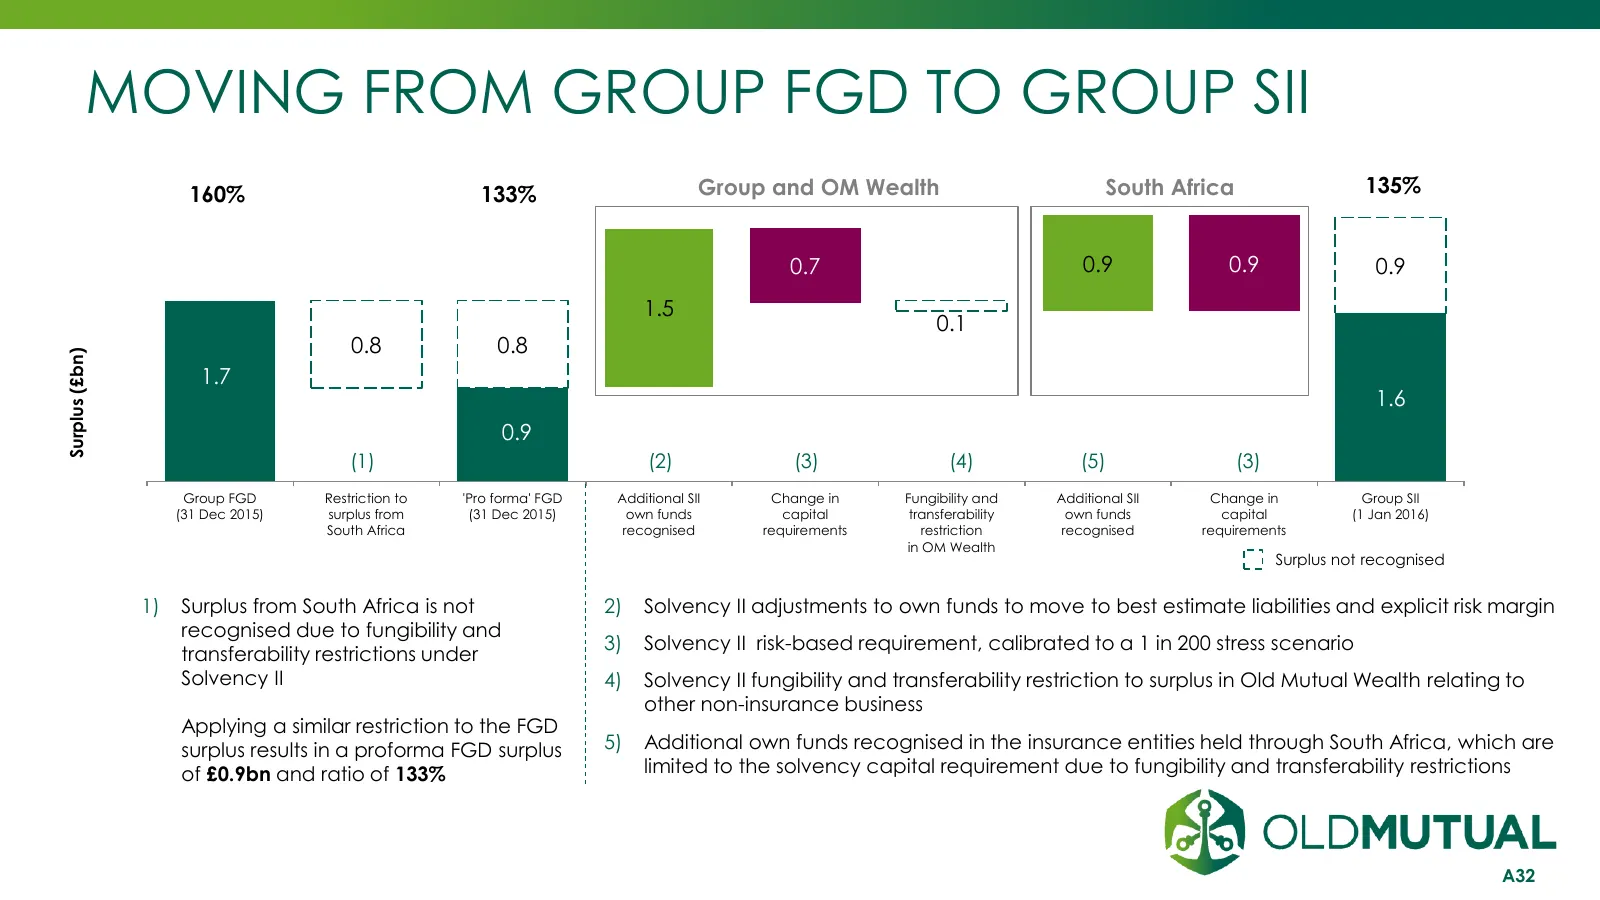
MOVING FROM GROUP FGD TO GROUP SII 160% 133% Group and OM Wealth South Africa 135% 0.7 0.9 0.9 0.9 1.5 0.1 0.8 0.8 Surplus (£bn) 1.7 1.6 0.9 (1) (2) (3) (4) (5) (3) Group FGD Restriction to 'Pro forma' FGD Additional SII Change in Fungibility and Additional SII Change in Group SII (31 Dec 2015) surp
Slide 33: Composition of Qualifying Solvency II Capital
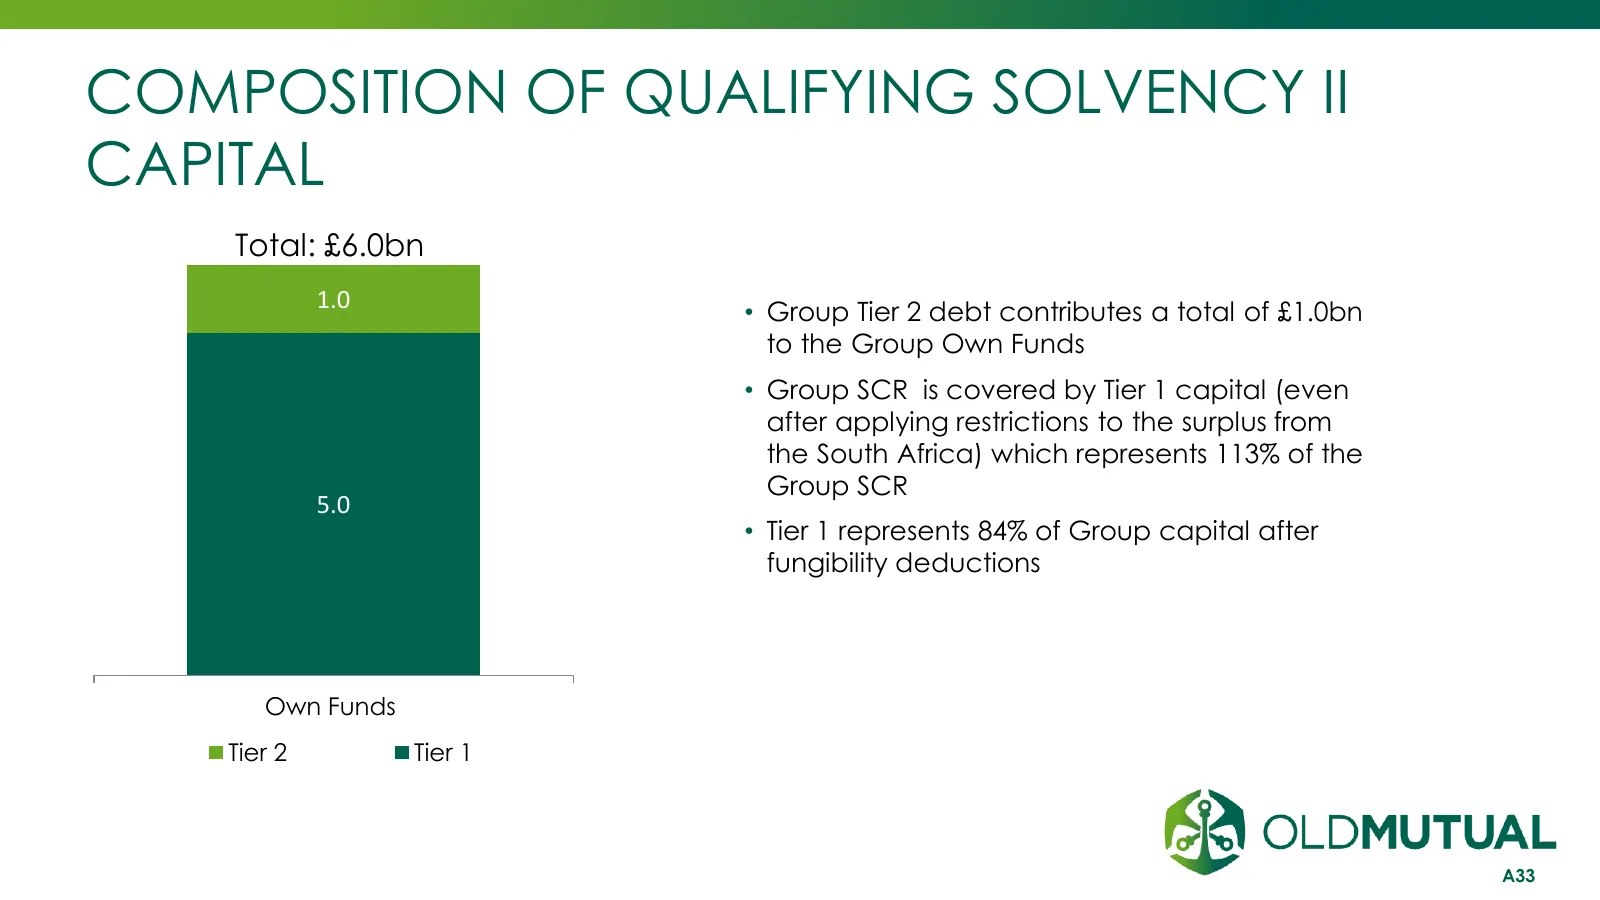
COMPOSITION OF QUALIFYING SOLVENCY II CAPITAL Total: £6.0bn 1.0 • Group Tier 2 debt contributes a total of £1.0bn to the Group Own Funds • Group SCR is covered by Tier 1 capital (even after applying restrictions to the surplus from the South Africa) which represents 113% of the Group SCR 5.0 • Tier
Slide 34: Composition of Solvency Capital Requirements
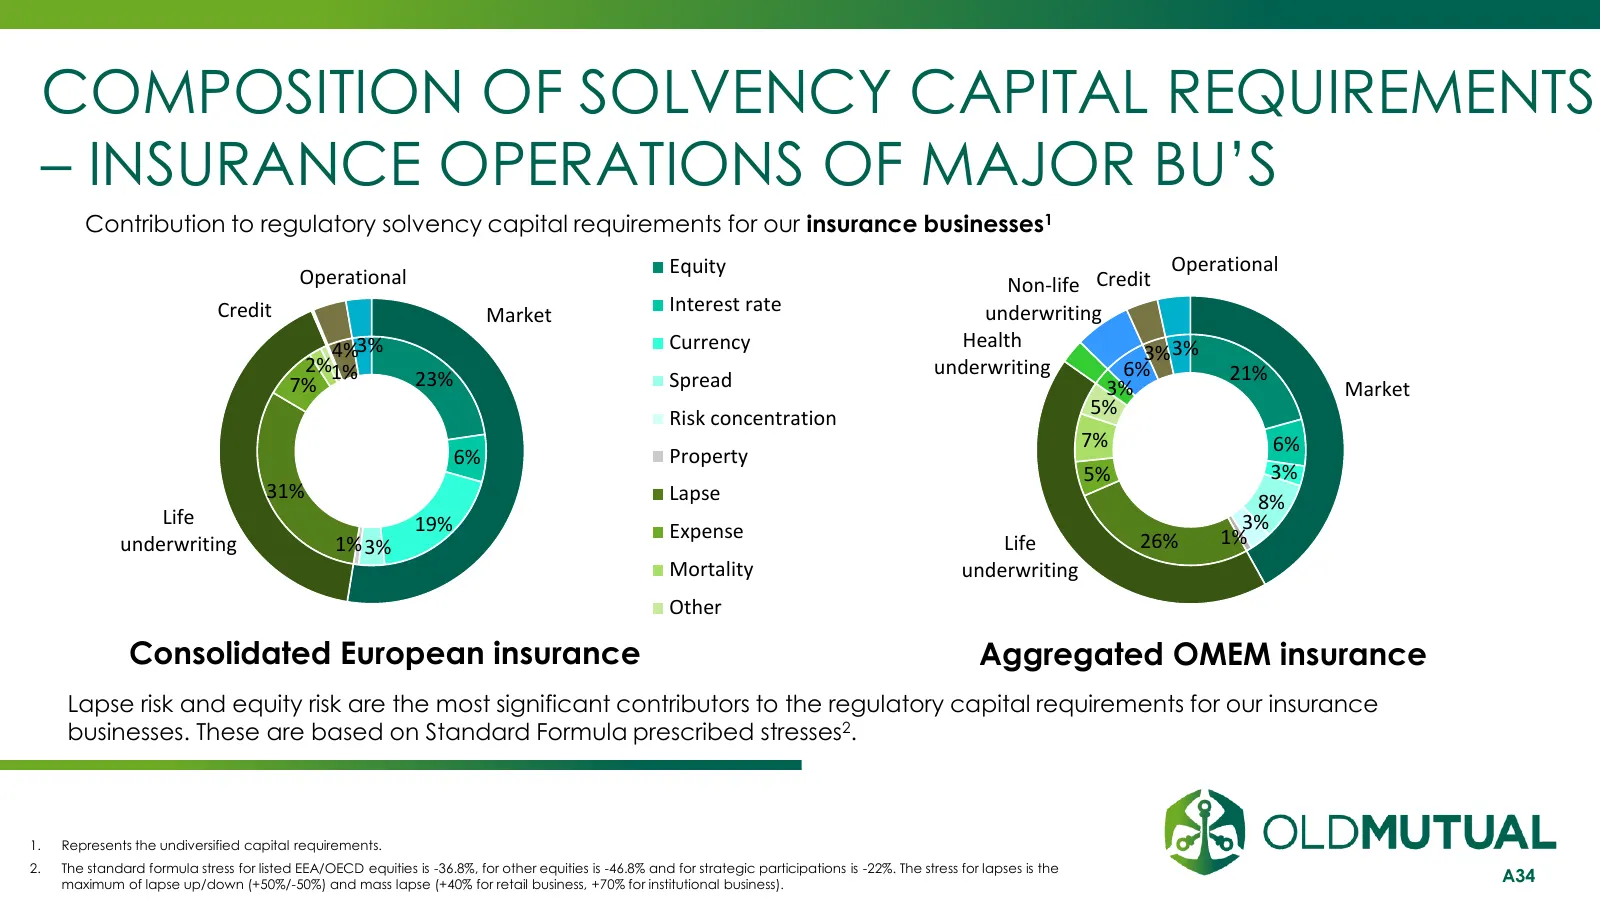
COMPOSITION OF SOLVENCY CAPITAL REQUIREMENTS – INSURANCE OPERATIONS OF MAJOR BU’S Contribution to regulatory solvency capital requirements for our insurance businesses1 Equity Operational Operational Non-life Credit Credit Interest rate underwriting Market 4%3% Currency Health 3% 3% 2%1% underwritin
Slide 35: Future Regulatory Developments
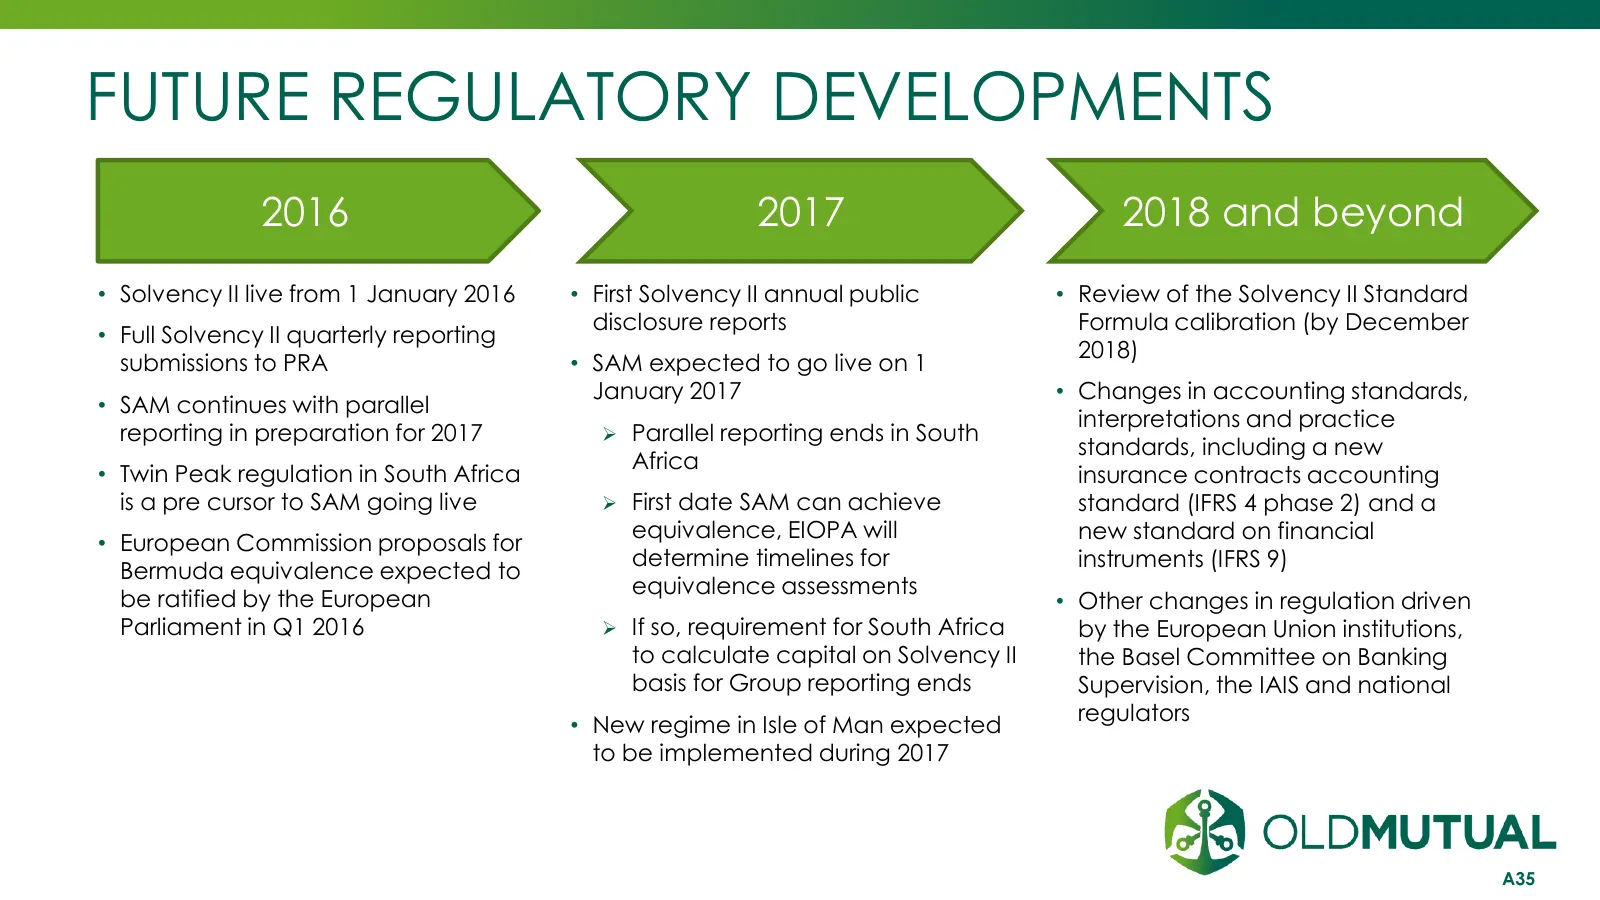
FUTURE REGULATORY DEVELOPMENTS 2016 2017 2018 and beyond • Solvency II live from 1 January 2016 • First Solvency II annual public • Review of the Solvency II Standard disclosure reports Formula calibration (by December • Full Solvency II quarterly reporting 2018) submissions to PRA • SAM expected to
Slide 36: Stress and Scenario Testing
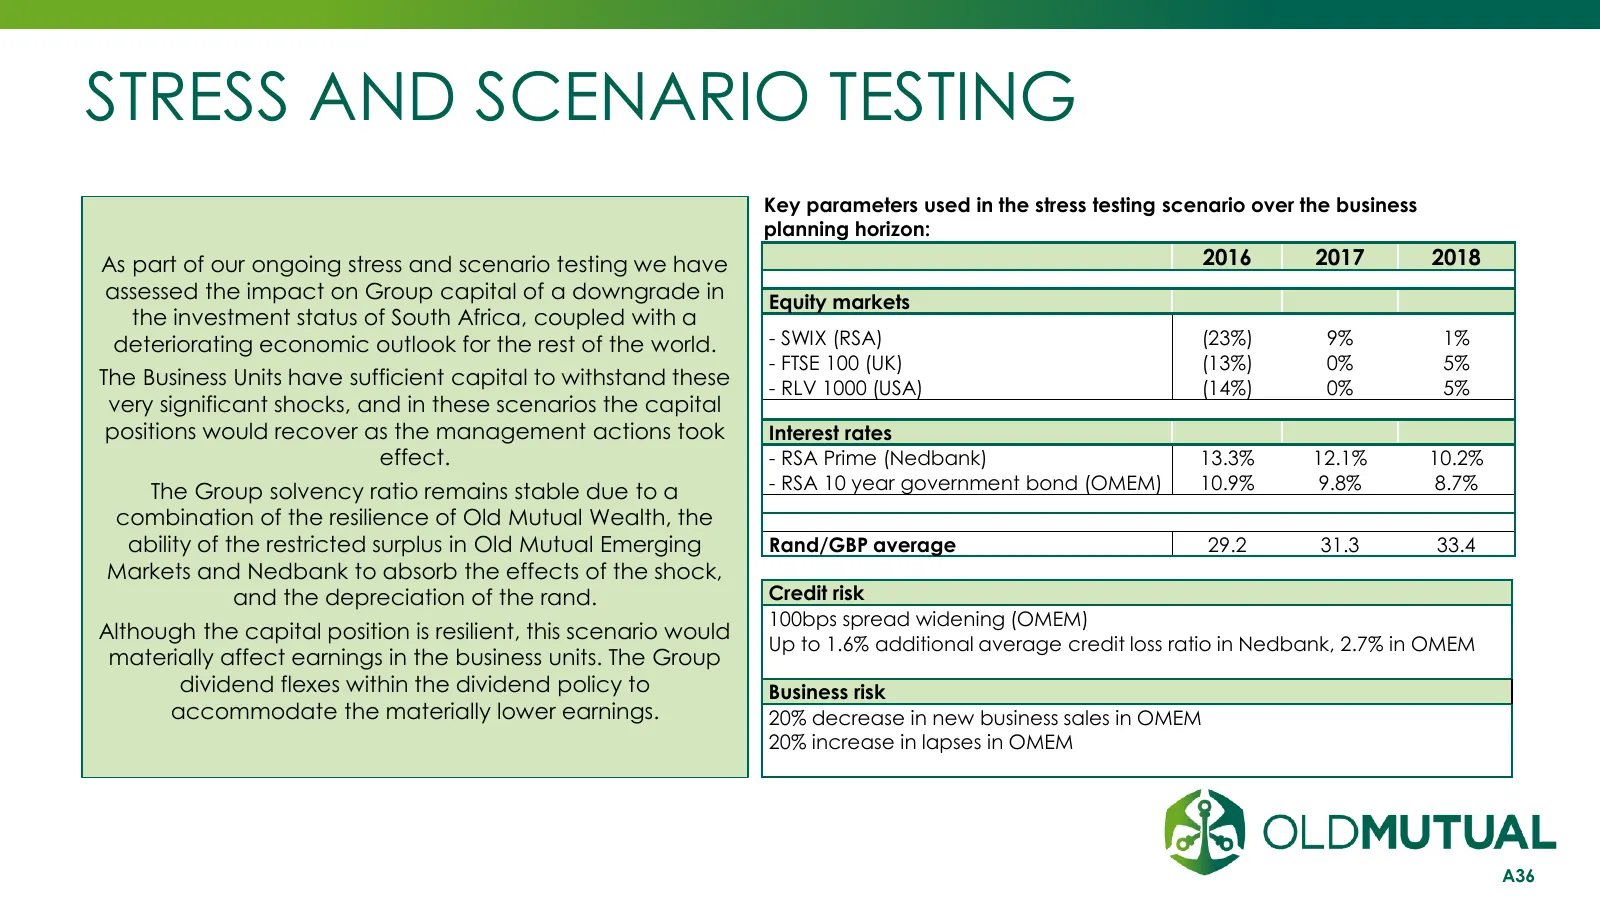
STRESS AND SCENARIO TESTING Key parameters used in the stress testing scenario over the business planning horizon: As part of our ongoing stress and scenario testing we have 2016 2017 2018 assessed the impact on Group capital of a downgrade in Equity markets the investment status of South Africa, co
Slide 37: Appendix 5: Business Units
APPENDIX 5 BUSINESS UNITS INVESTMENT | SAVINGS | INSURANCE | BANKING
Slide 38: Old Mutual Emerging Markets
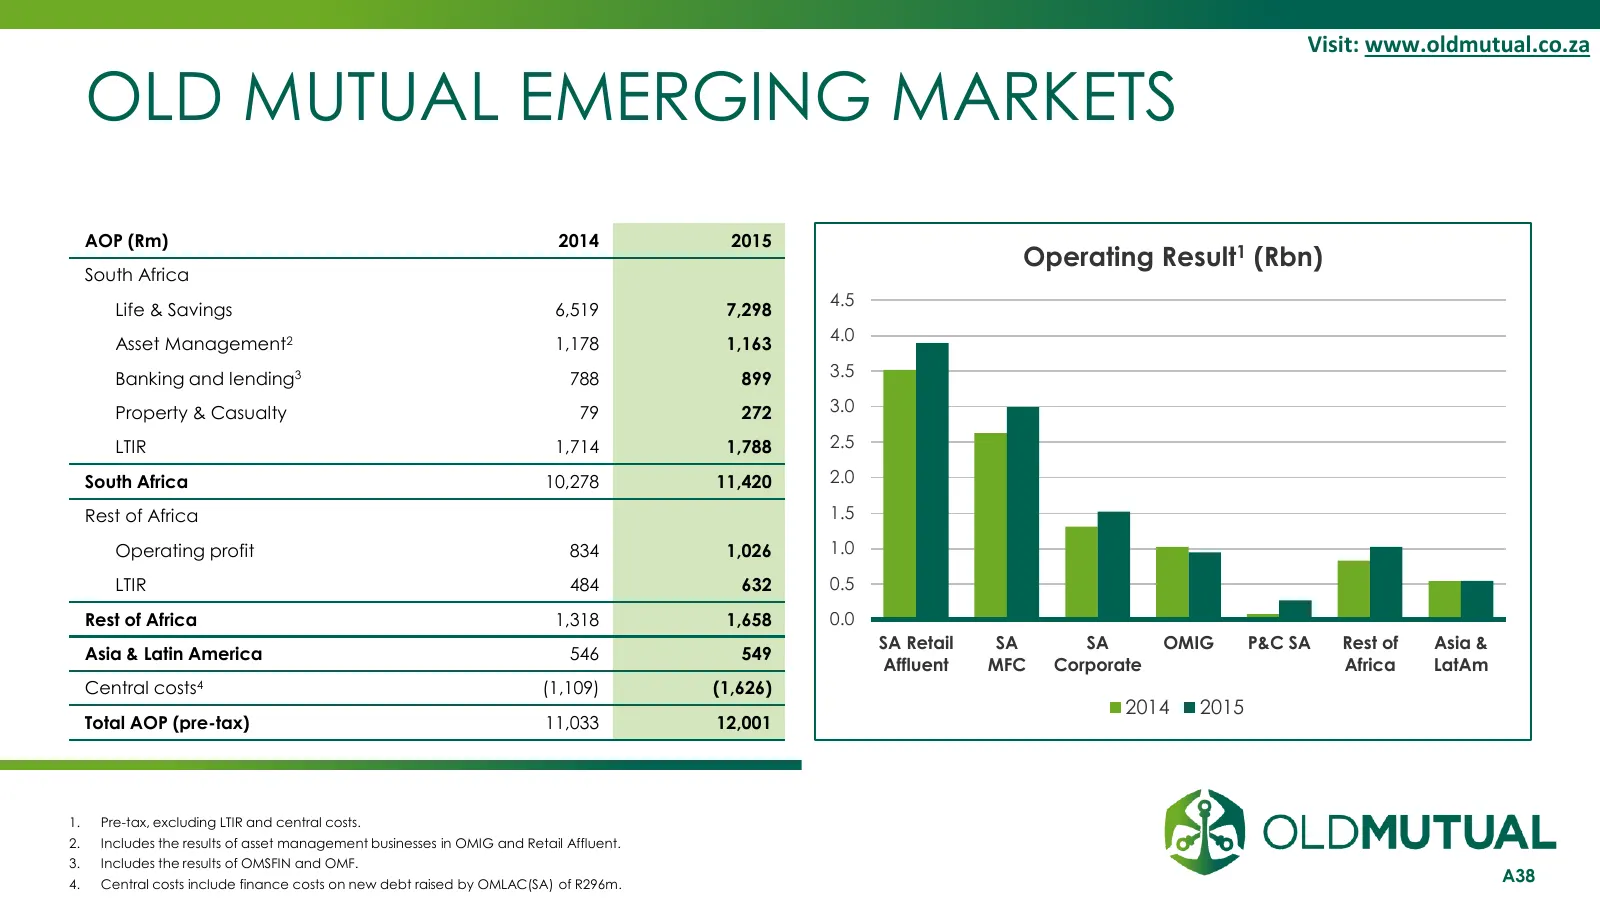
Visit: www.oldmutual.co.za OLD MUTUAL EMERGING MARKETS AOP (Rm) 2014 2015 Operating Result1 (Rbn) South Africa 4.5 Life & Savings 6,519 7,298 Asset Management2 1,178 1,163 4.0 Banking and lending3 788 899 3.5 Property & Casualty 79 272 3.0 LTIR 1,714 1,788 2.5 South Africa 10,278 11,420 2.0 Rest of
Slide 39: OMEM: Life APE Sales by Segment and Product
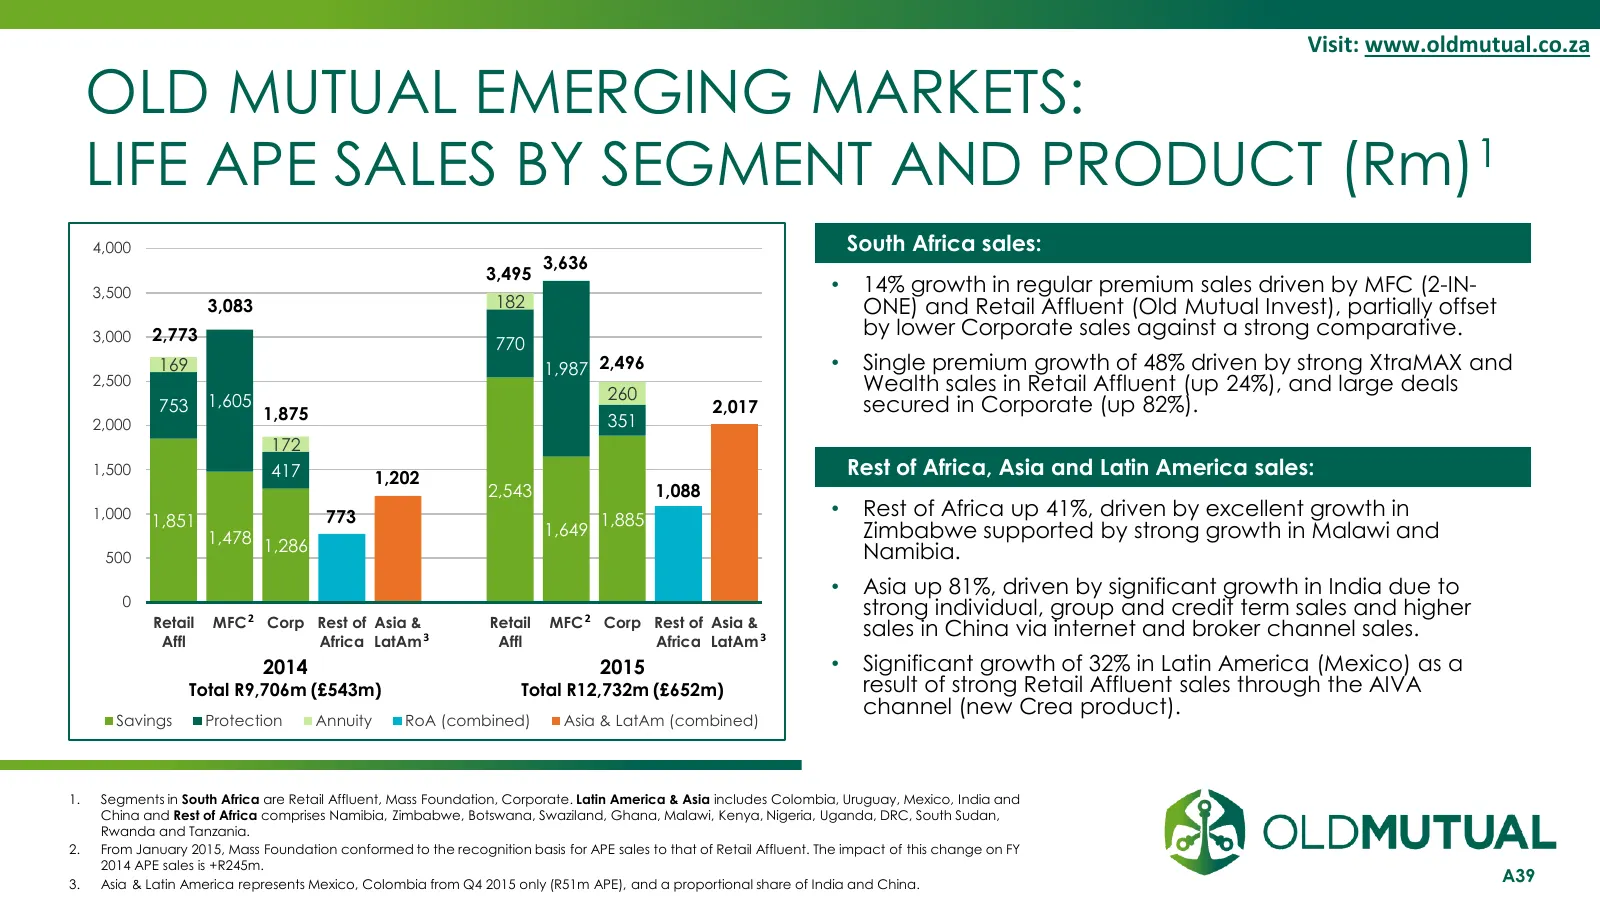
Visit: www.oldmutual.co.za OLD MUTUAL EMERGING MARKETS: LIFE APE SALES BY SEGMENT AND PRODUCT (Rm)1 4,000 South Africa sales: 3,636 3,495 3,500 • 14% growth in regular premium sales driven by MFC (2-IN- 3,083 182 ONE) and Retail Affluent (Old Mutual Invest), partially offset 3,000 2,773 by lower Cor
Slide 40: OMEM: Retail Affluent – Aggregate Sales Growth
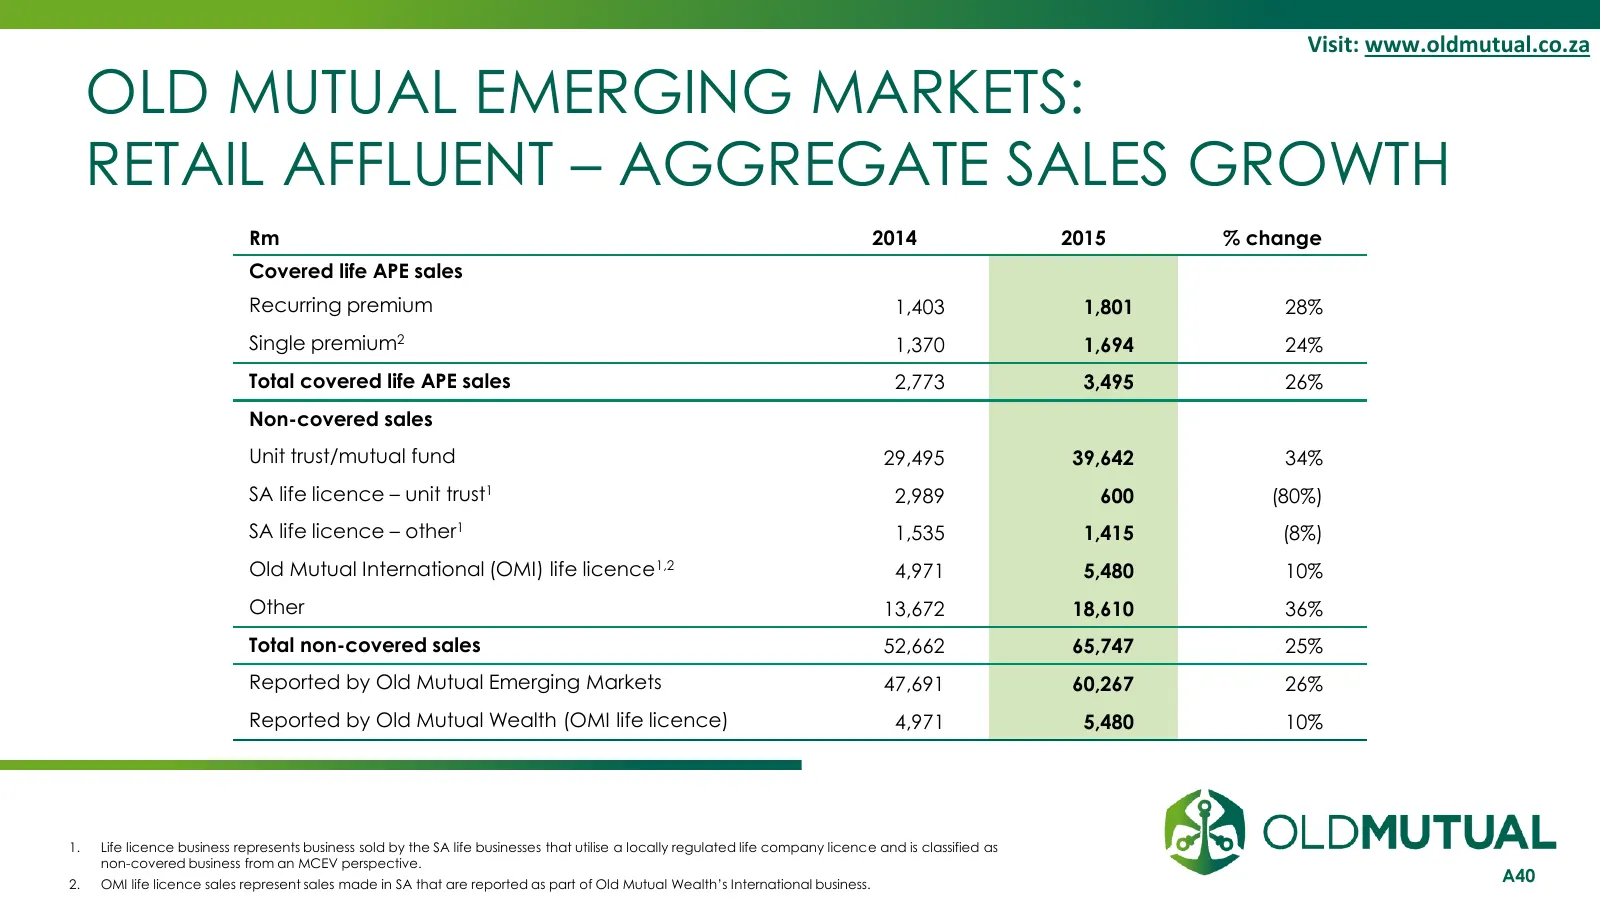
Visit: www.oldmutual.co.za OLD MUTUAL EMERGING MARKETS: RETAIL AFFLUENT – AGGREGATE SALES GROWTH Rm 2014 2015 % change Covered life APE sales Recurring premium 1,403 1,801 28% Single premium2 1,370 1,694 24% Total covered life APE sales 2,773 3,495 26% Non-covered sales Unit trust/mutual fund 29,495
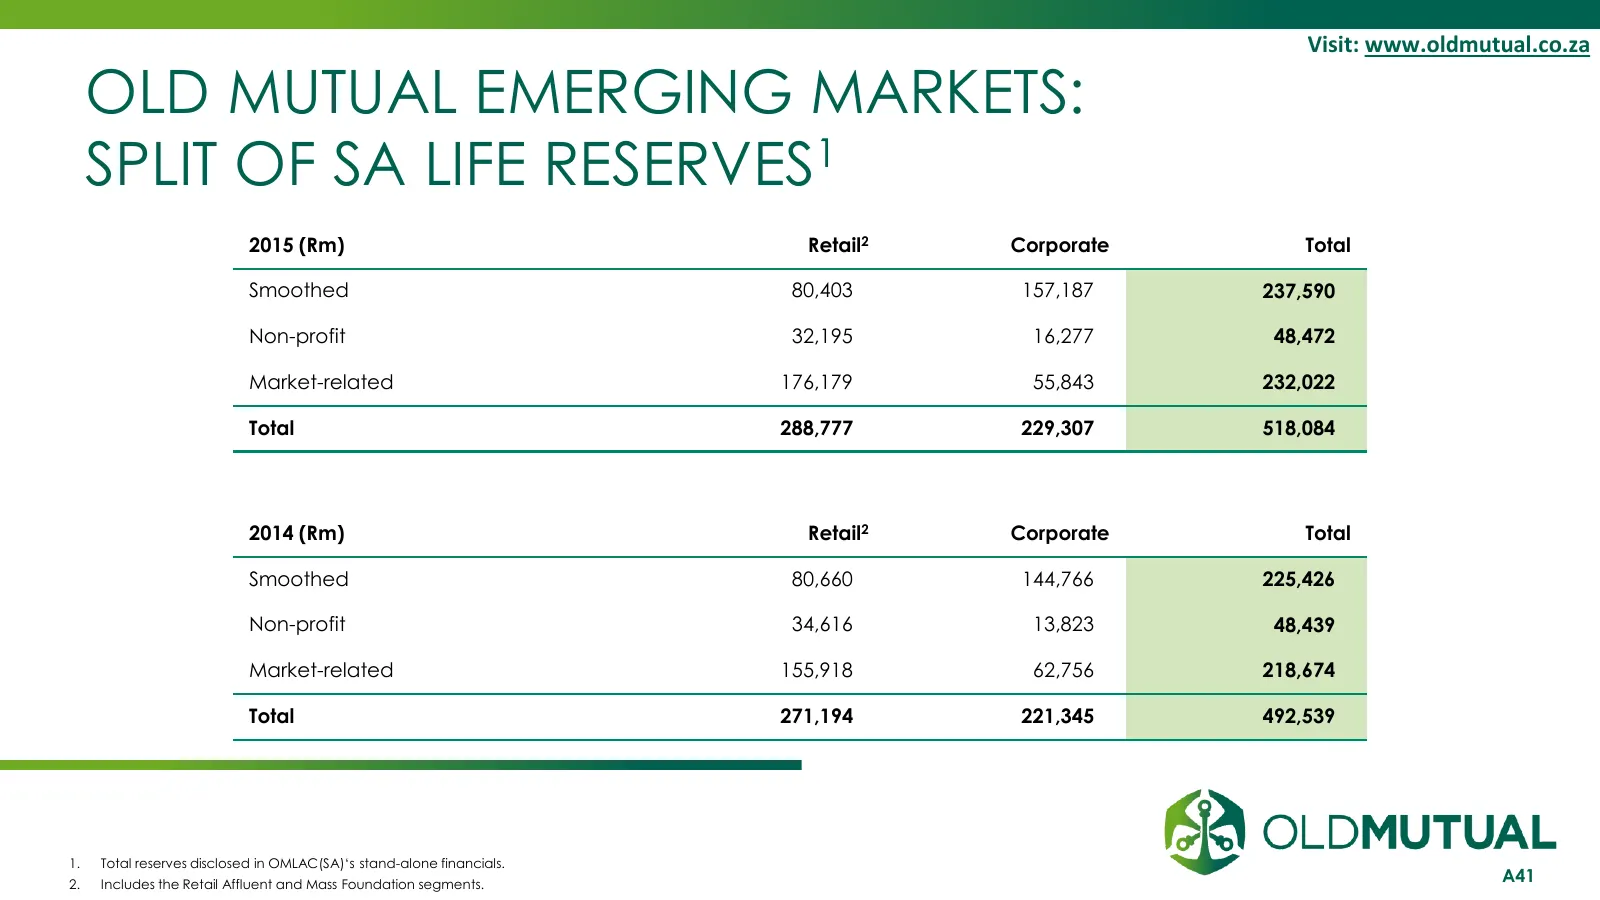
Slide 41: OMEM: Split of SA Life Reserves
Visit: www.oldmutual.co.za OLD MUTUAL EMERGING MARKETS: SPLIT OF SA LIFE RESERVES1 2015 (Rm) Retail2 Corporate Total Smoothed 80,403 157,187 237,590 Non-profit 32,195 16,277 48,472 Market-related 176,179 55,843 232,022 Total 288,777 229,307 518,084 2014 (Rm) Retail2 Corporate Total Smoothed 80,660 1
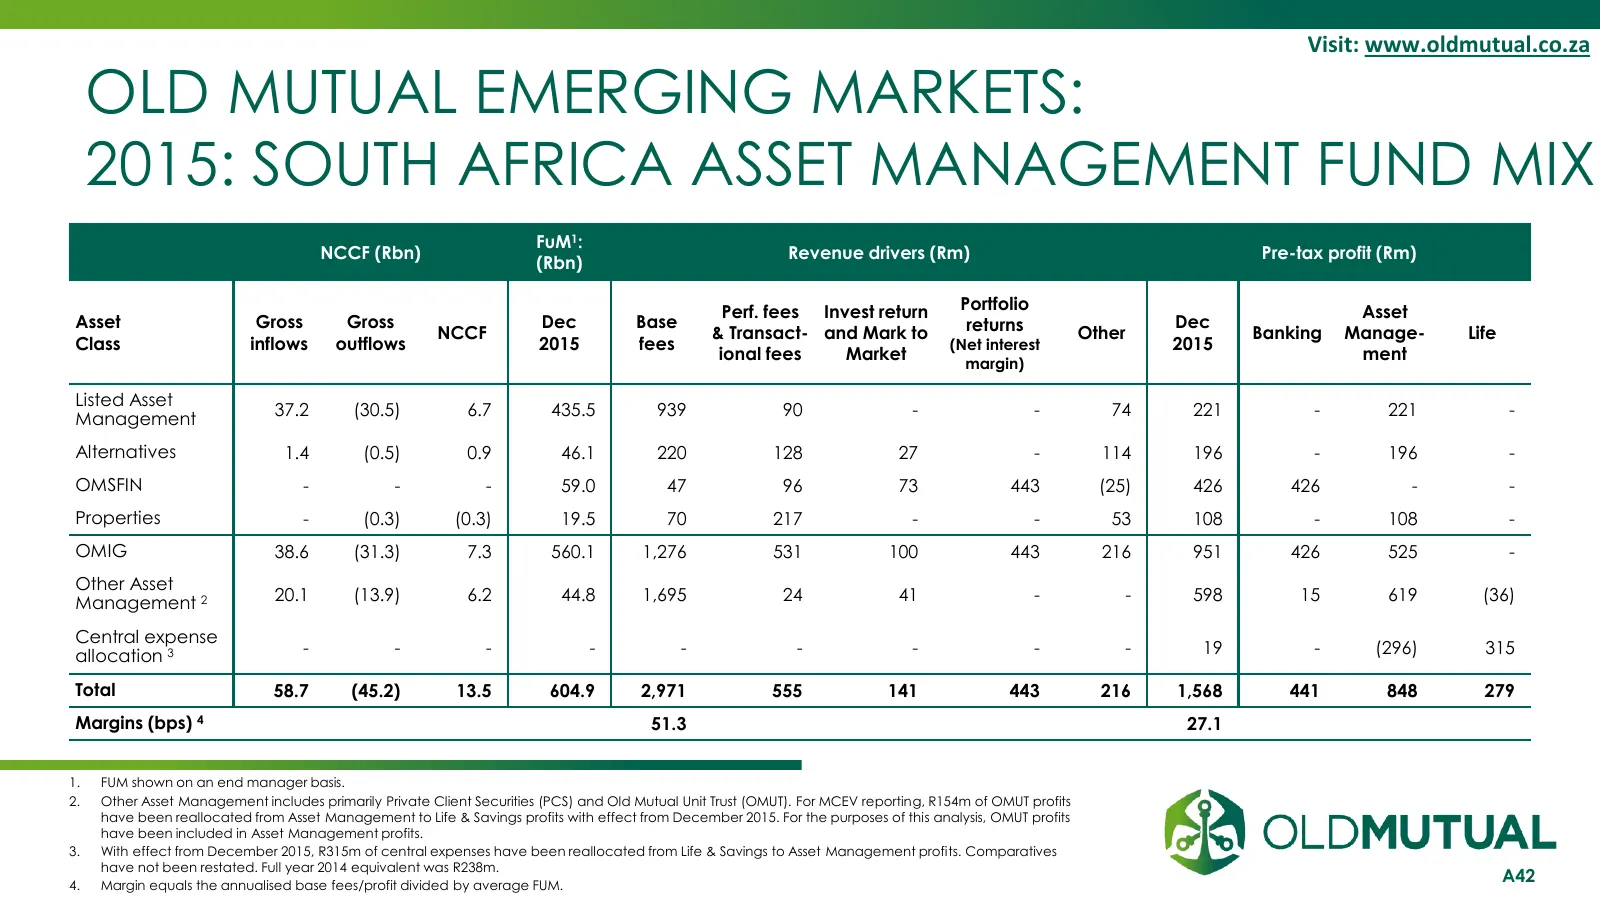
Slide 42: OMEM 2015: South Africa Asset Management Fund Mix
Visit: www.oldmutual.co.za OLD MUTUAL EMERGING MARKETS: 2015: SOUTH AFRICA ASSET MANAGEMENT FUND MIX FuM1: NCCF (Rbn) Revenue drivers (Rm) Pre-tax profit (Rm) (Rbn) Perf. fees Invest return Portfolio Asset Asset Gross Gross Dec Base returns Dec NCCF & Transact- and Mark to Other Banking Manage- Life
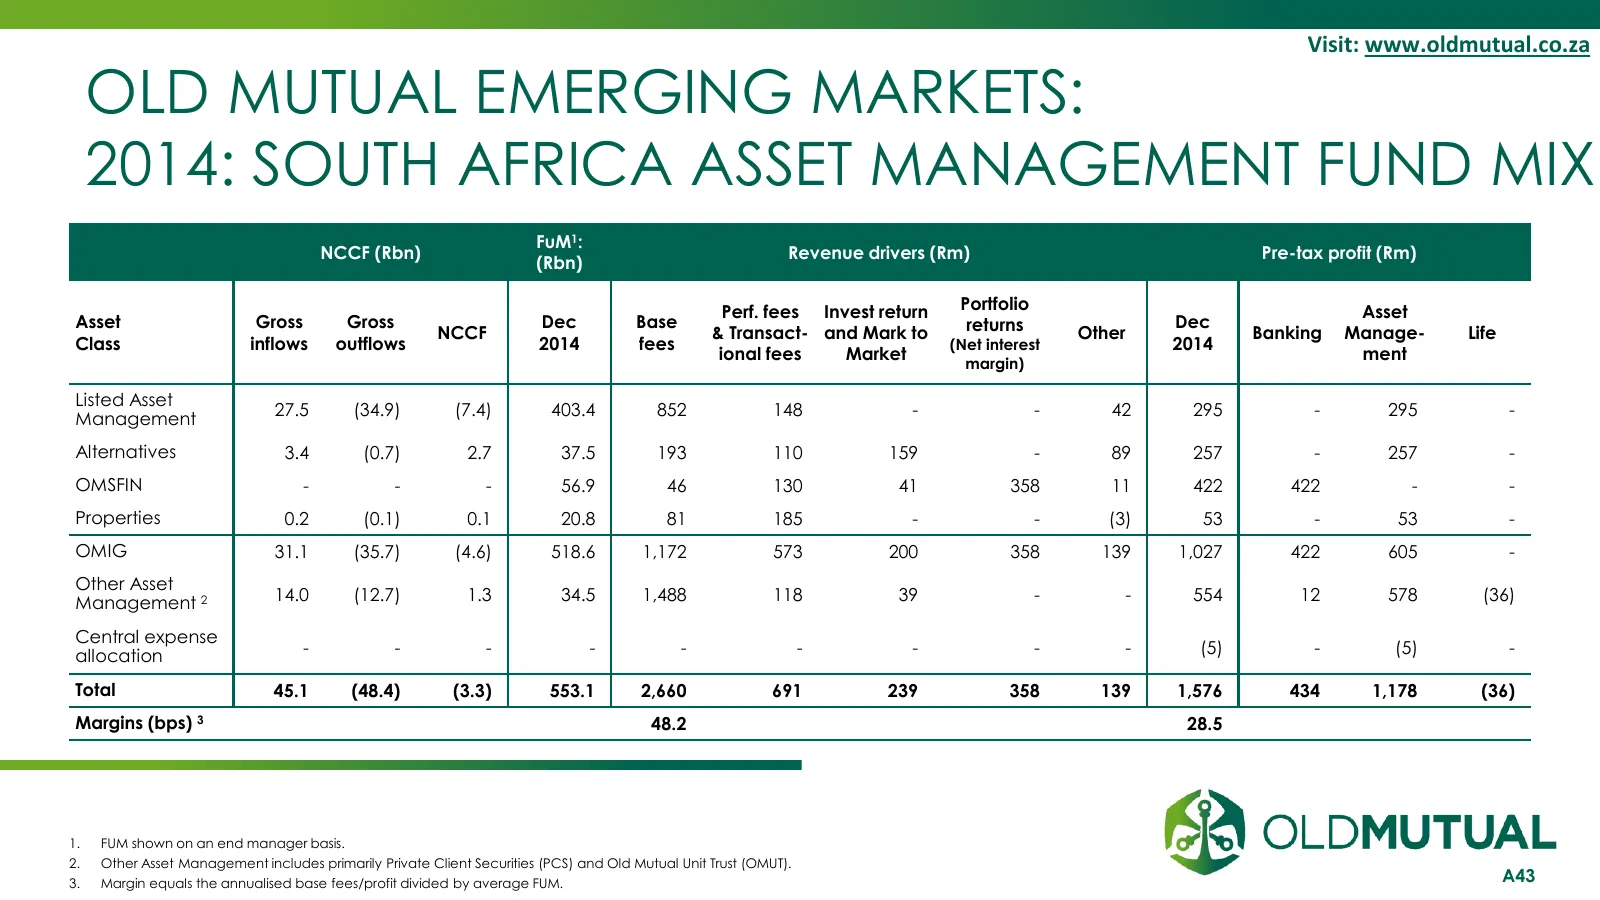
Slide 43: OMEM 2014: South Africa Asset Management Fund Mix
Visit: www.oldmutual.co.za OLD MUTUAL EMERGING MARKETS: 2014: SOUTH AFRICA ASSET MANAGEMENT FUND MIX FuM1: NCCF (Rbn) Revenue drivers (Rm) Pre-tax profit (Rm) (Rbn) Perf. fees Invest return Portfolio Asset Asset Gross Gross Dec Base returns Dec NCCF & Transact- and Mark to Other Banking Manage- Life
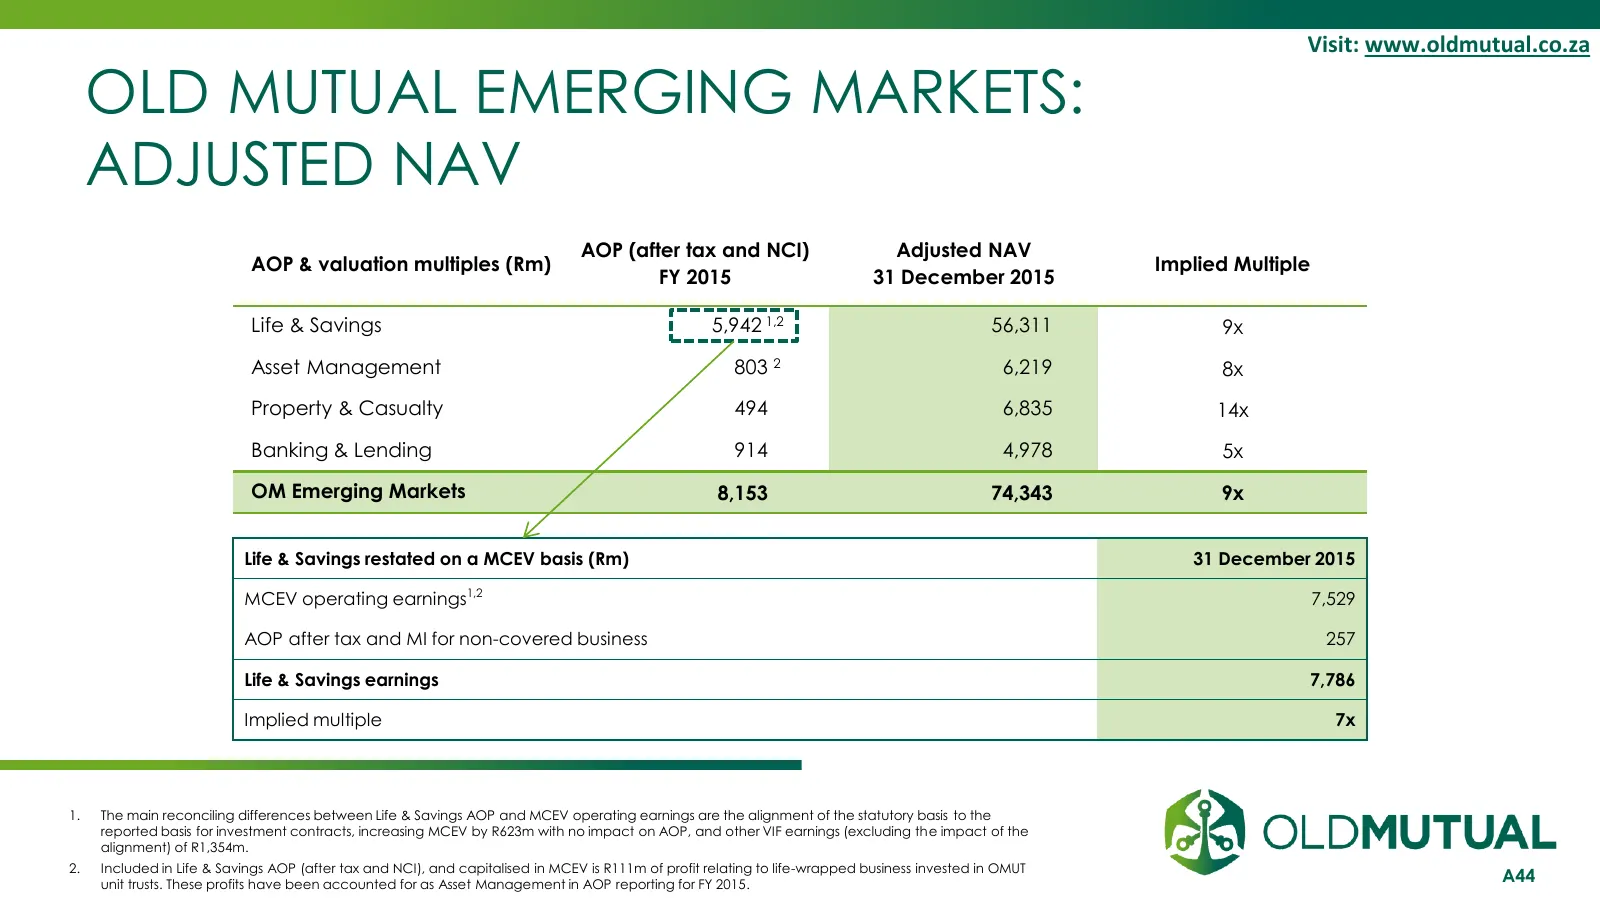
Slide 44: OMEM: Adjusted NAV
Visit: www.oldmutual.co.za OLD MUTUAL EMERGING MARKETS: ADJUSTED NAV AOP (after tax and NCI) Adjusted NAV AOP & valuation multiples (Rm) Implied Multiple FY 2015 31 December 2015 Life & Savings 5,942.1,2 56,311 9x Asset Management 803 2 6,219 8x Property & Casualty 494 6,835 14x Banking & Lending 91
Slide 45: OMEM: Adjusted NAV
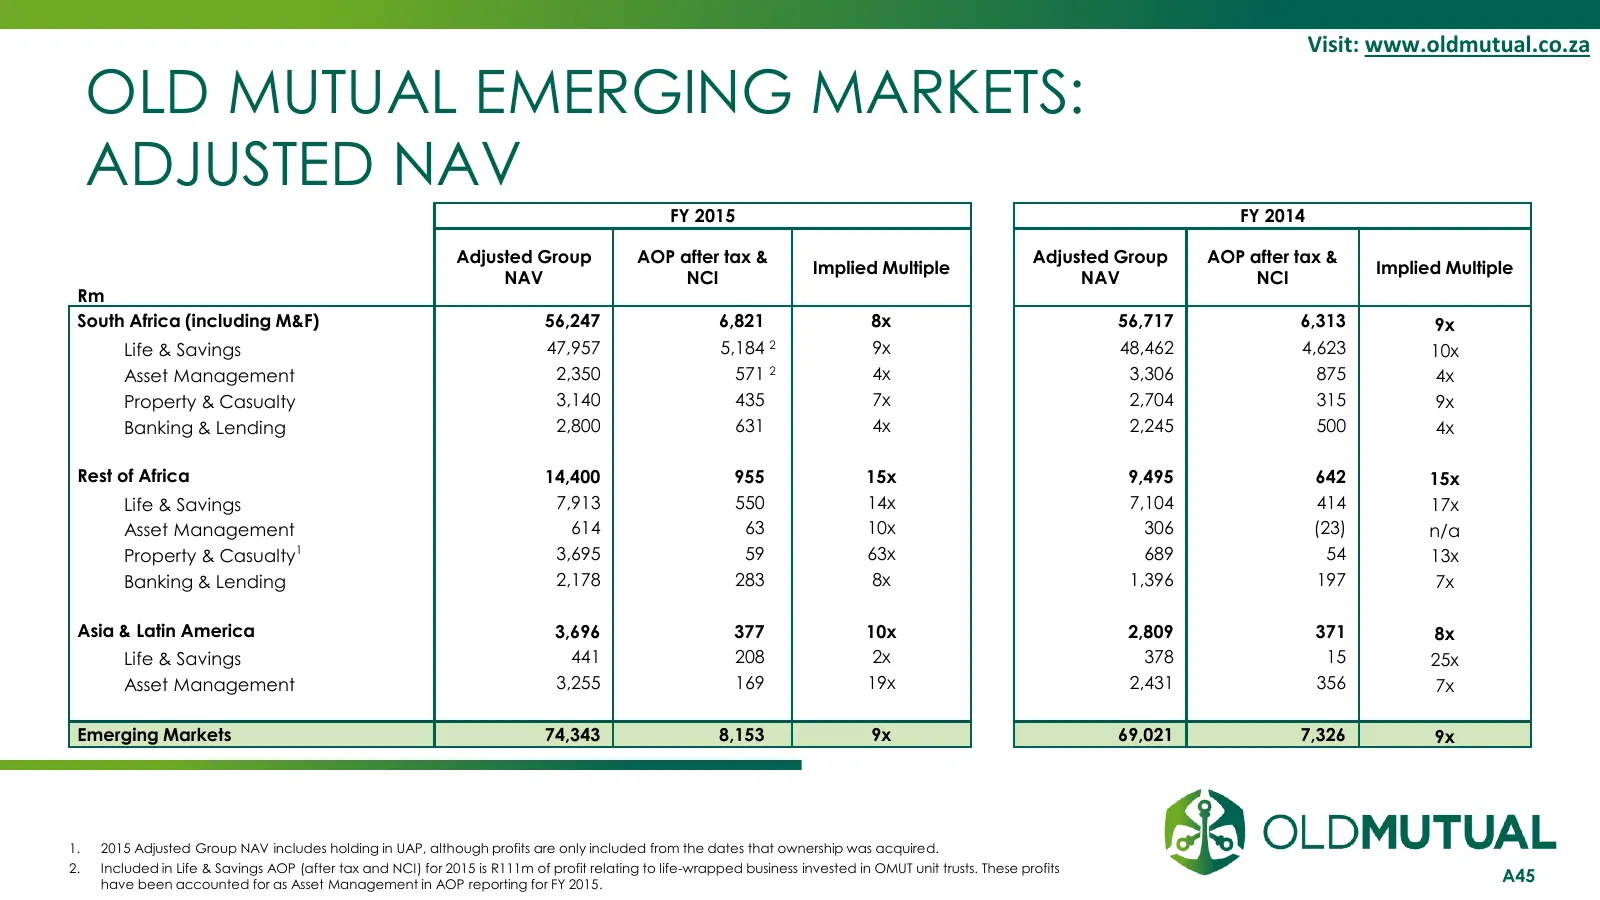
Visit: www.oldmutual.co.za OLD MUTUAL EMERGING MARKETS: ADJUSTED NAV FY 2015 FY 2014 Adjusted Group AOP after tax & Adjusted Group AOP after tax & Implied Multiple Implied Multiple NAV NCI NAV NCI Rm South Africa (including M&F) 56,247 6,821 8x 56,717 6,313 9x Life & Savings 47,957 5,184 2 9x 48,462
Slide 46: OMEM: Property & Casualty
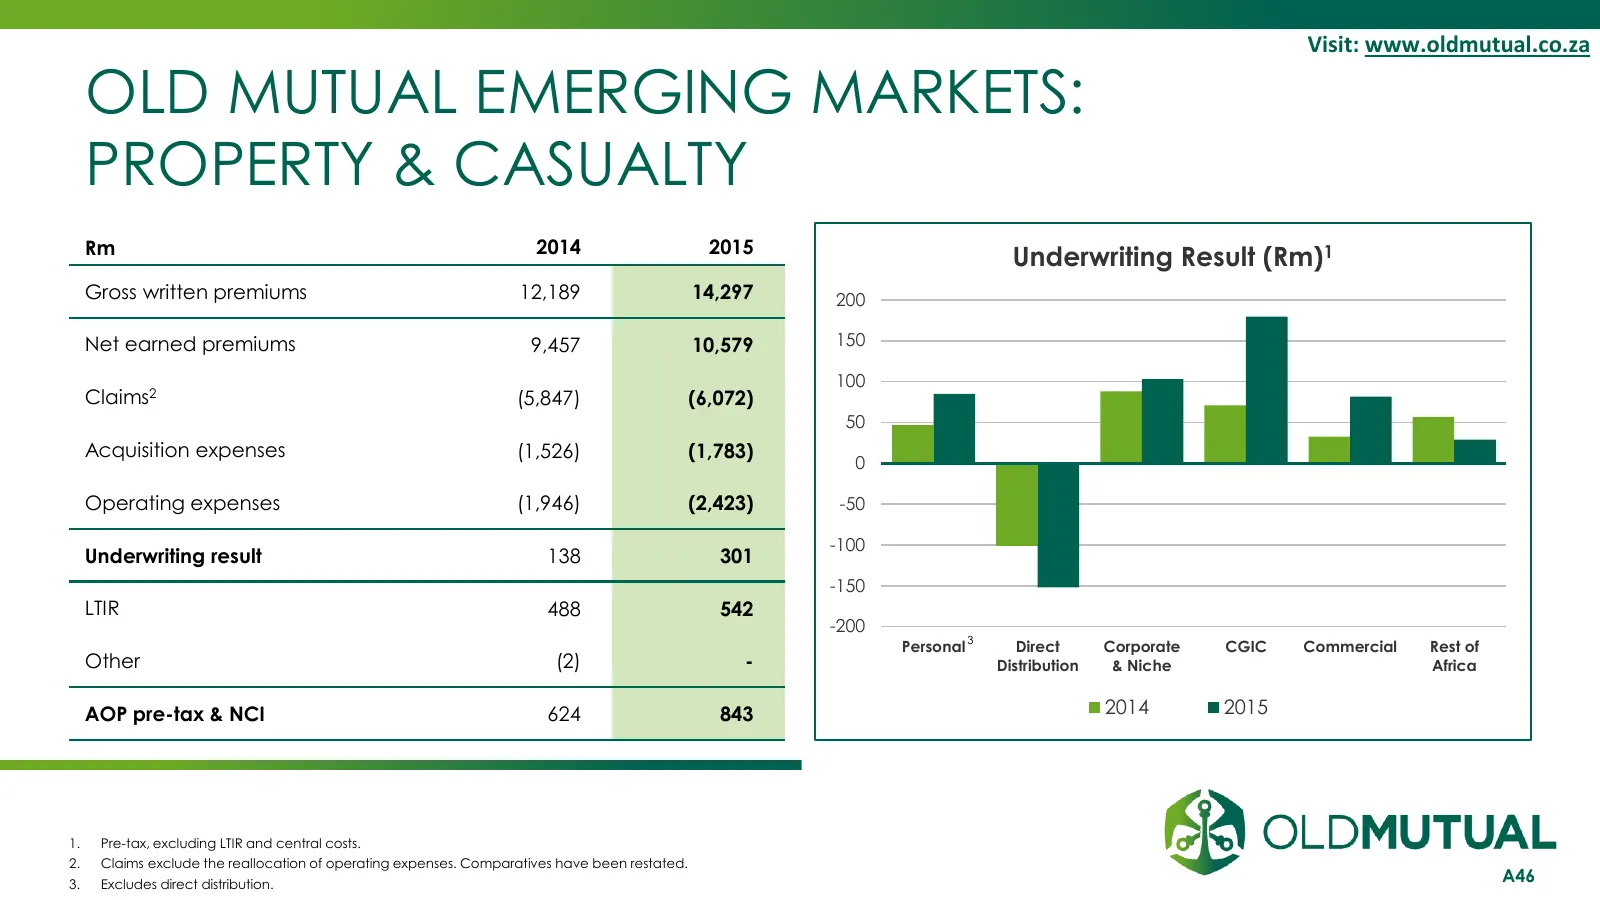
Visit: www.oldmutual.co.za OLD MUTUAL EMERGING MARKETS: PROPERTY & CASUALTY Rm 2014 2015 Underwriting Result (Rm)1 Gross written premiums 12,189 14,297 200 Net earned premiums 9,457 10,579 150 100 Claims2 (5,847) (6,072) 50 Acquisition expenses (1,526) (1,783) 0 Operating expenses (1,946) (2,423) -5
Slide 47: OMEM: Property & Casualty – Claims Analysis
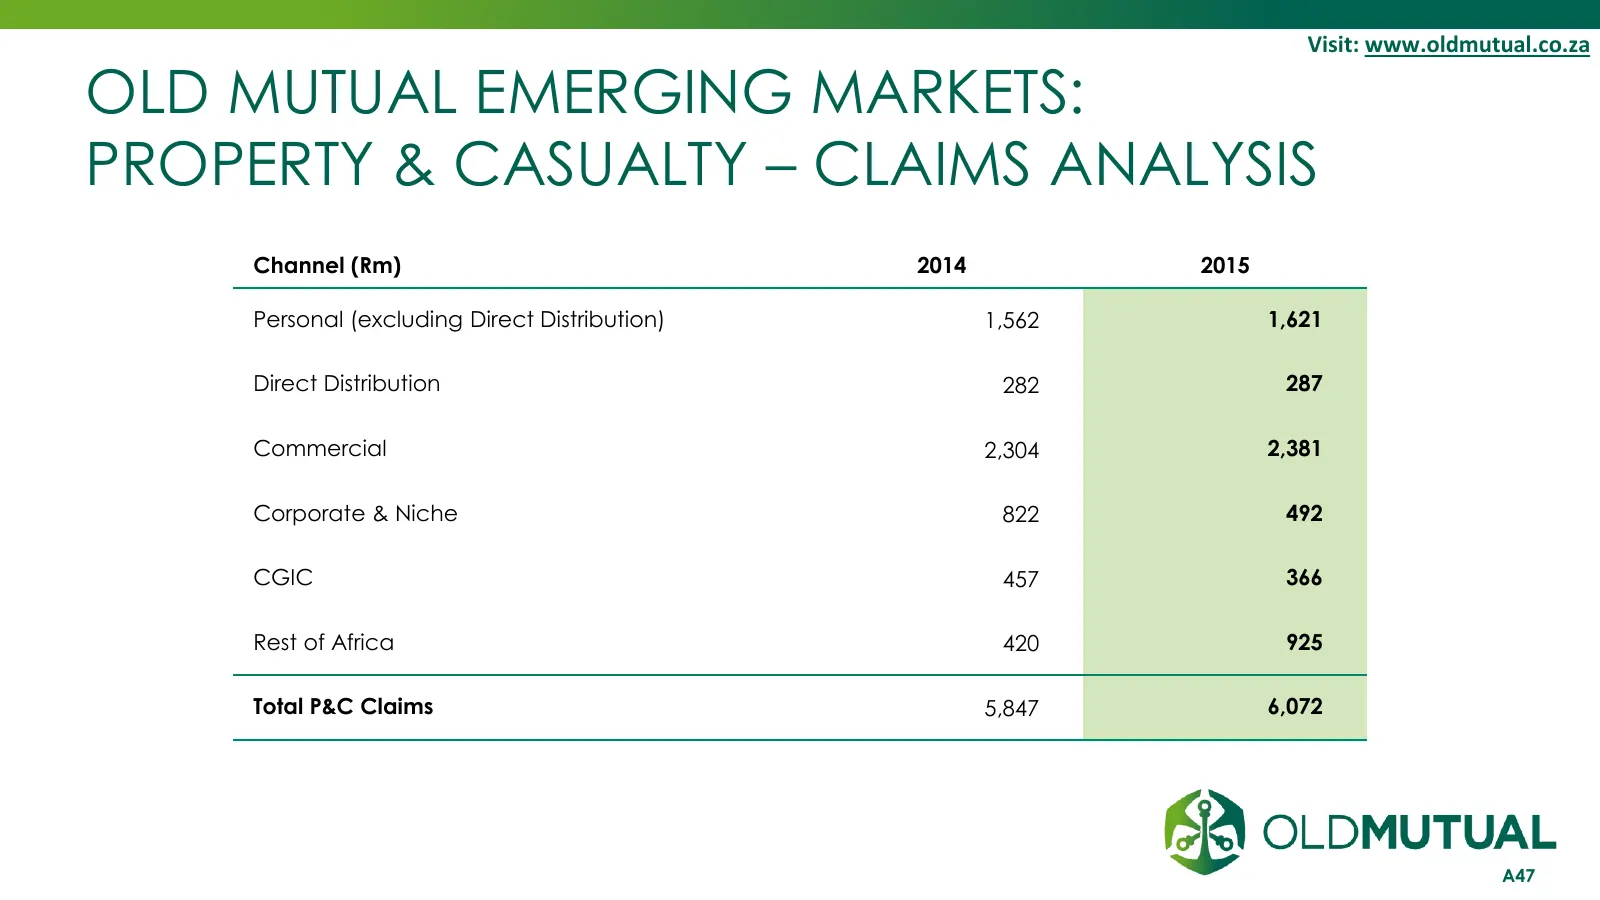
Visit: www.oldmutual.co.za OLD MUTUAL EMERGING MARKETS: PROPERTY & CASUALTY – CLAIMS ANALYSIS Channel (Rm) 2014 2015 Personal (excluding Direct Distribution) 1,562 1,621 Direct Distribution 282 287 Commercial 2,304 2,381 Corporate & Niche 822 492 CGIC 457 366 Rest of Africa 420 925 Total P&C Claims
Slide 48: OMEM: East Africa Expansion - Update on UAP
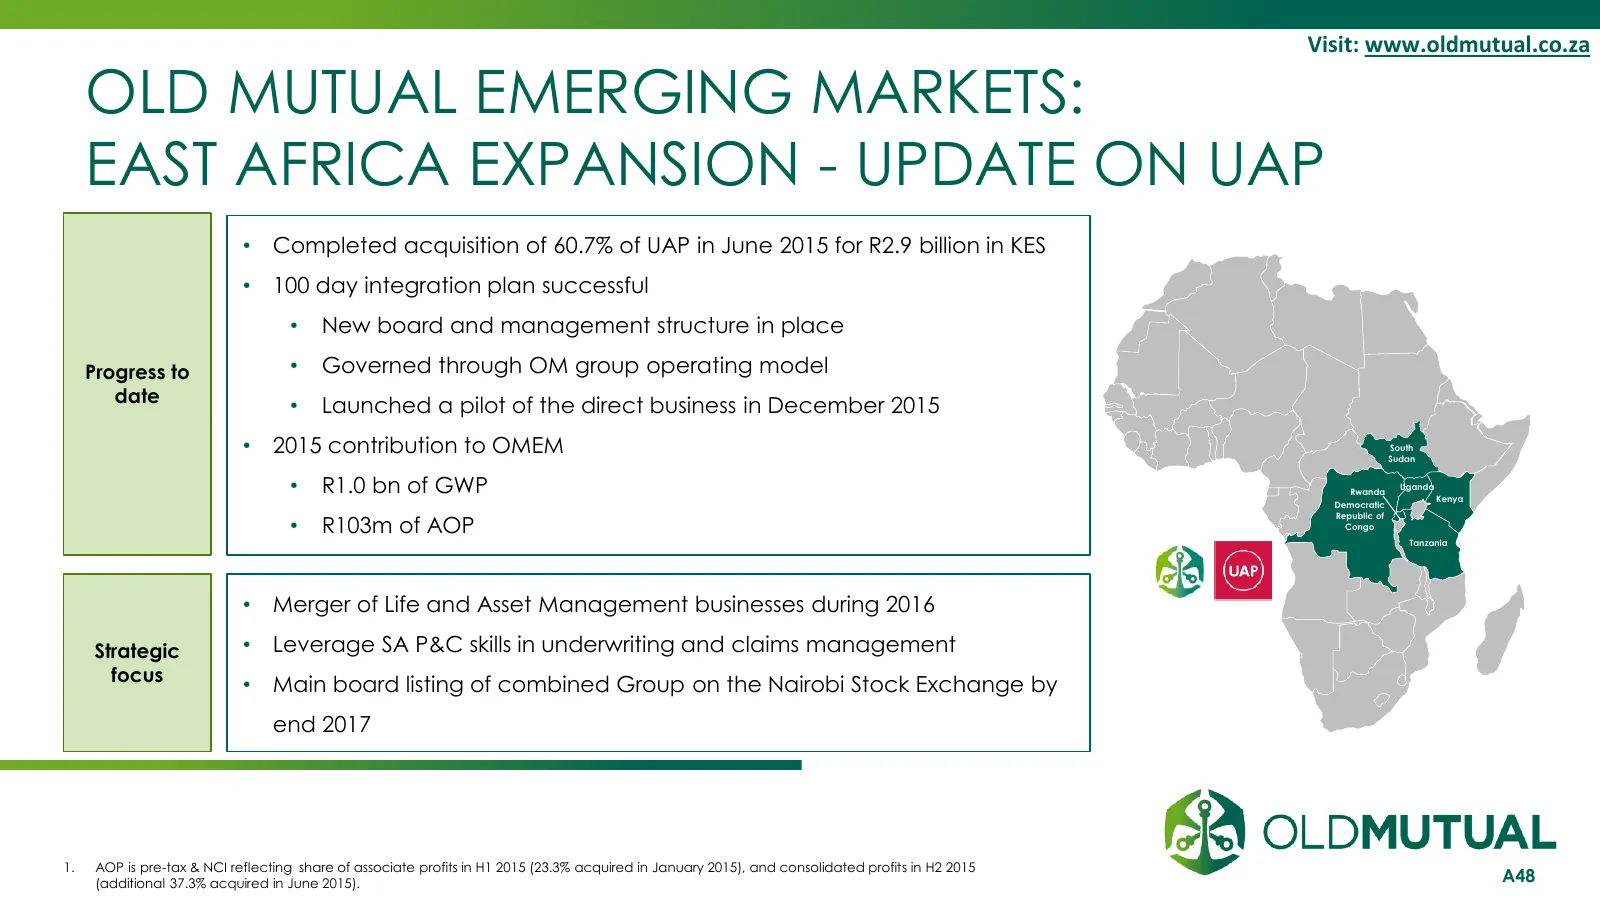
Visit: www.oldmutual.co.za OLD MUTUAL EMERGING MARKETS: EAST AFRICA EXPANSION - UPDATE ON UAP • Completed acquisition of 60.7% of UAP in June 2015 for R2.9 billion in KES • 100 day integration plan successful • New board and management structure in place Progress to • Governed through OM group opera
Slide 49: Nedbank
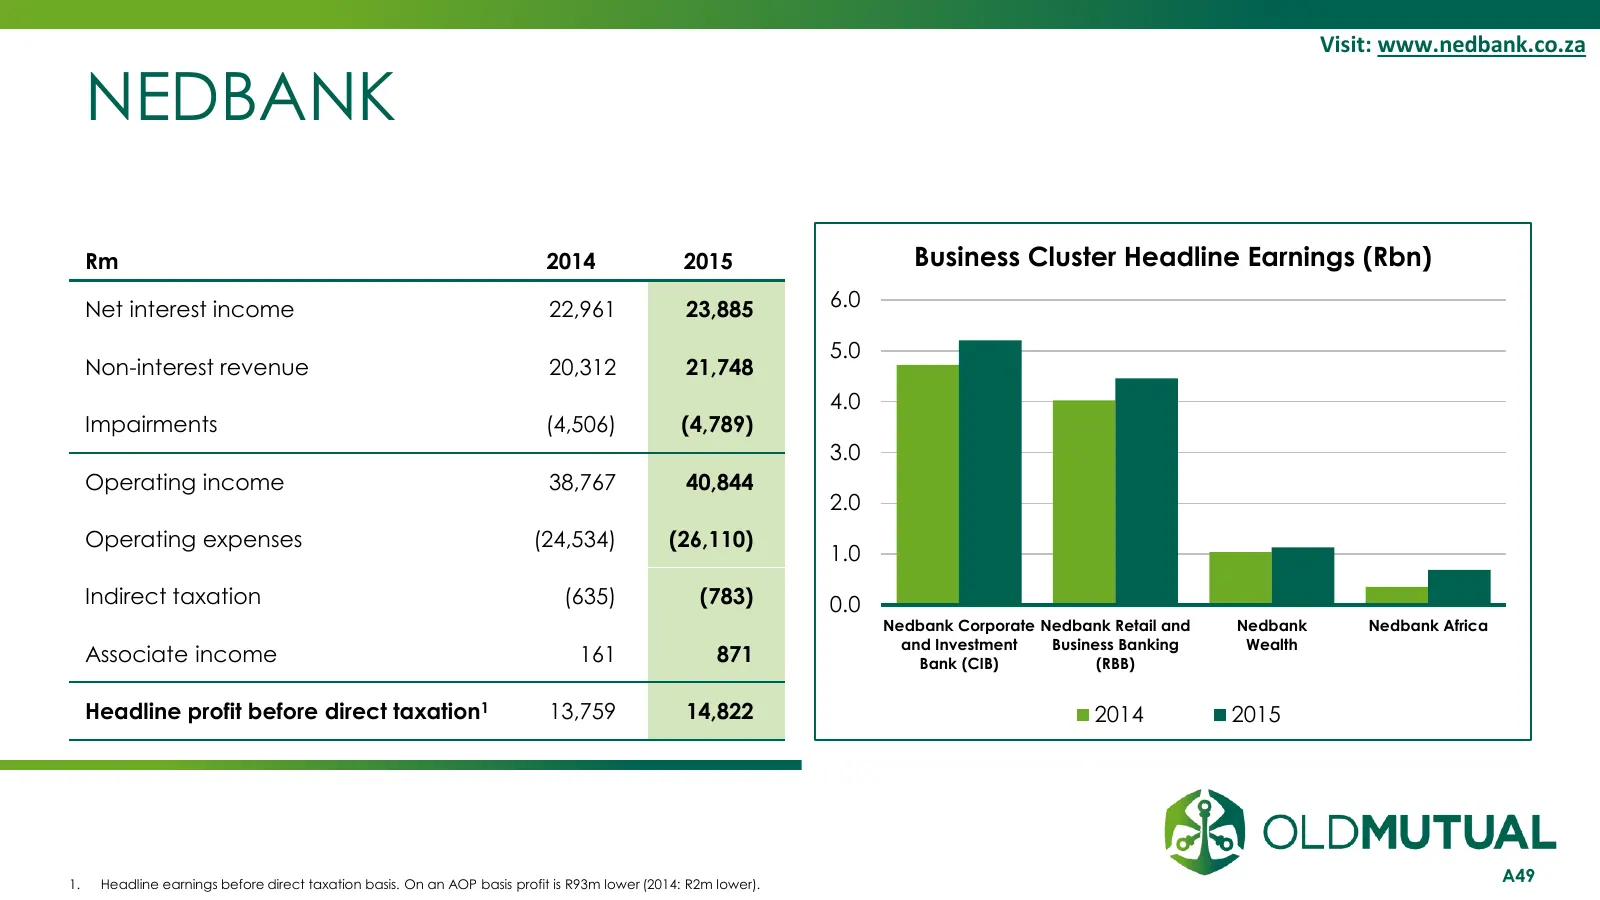
Visit: www.nedbank.co.za NEDBANK Rm 2014 2015 Business Cluster Headline Earnings (Rbn) Net interest income 22,961 23,885 6.0 5.0 Non-interest revenue 20,312 21,748 4.0 Impairments (4,506) (4,789) 3.0 Operating income 38,767 40,844 2.0 Operating expenses (24,534) (26,110) 1.0 Indirect taxation (635)
Slide 50: Nedbank Targets
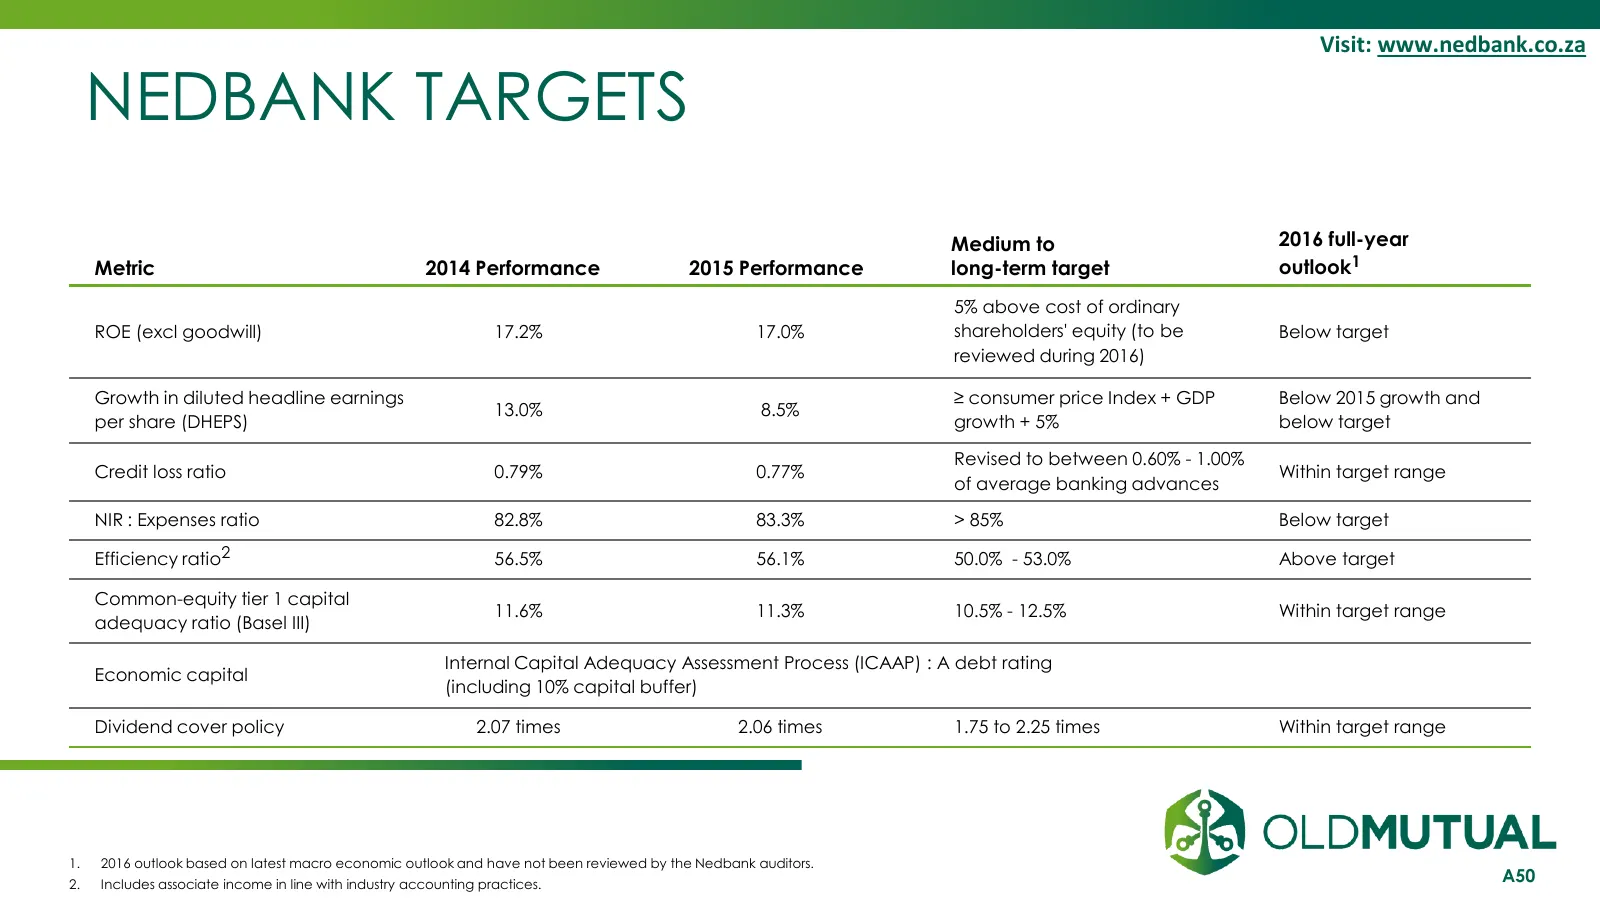
Visit: www.nedbank.co.za NEDBANK TARGETS Medium to 2016 full-year Metric 2014 Performance 2015 Performance long-term target outlook1 5% above cost of ordinary ROE (excl goodwill) 17.2% 17.0% shareholders' equity (to be Below target reviewed during 2016) Growth in diluted headline earnings ≥ consumer
Slide 51: Old Mutual Wealth
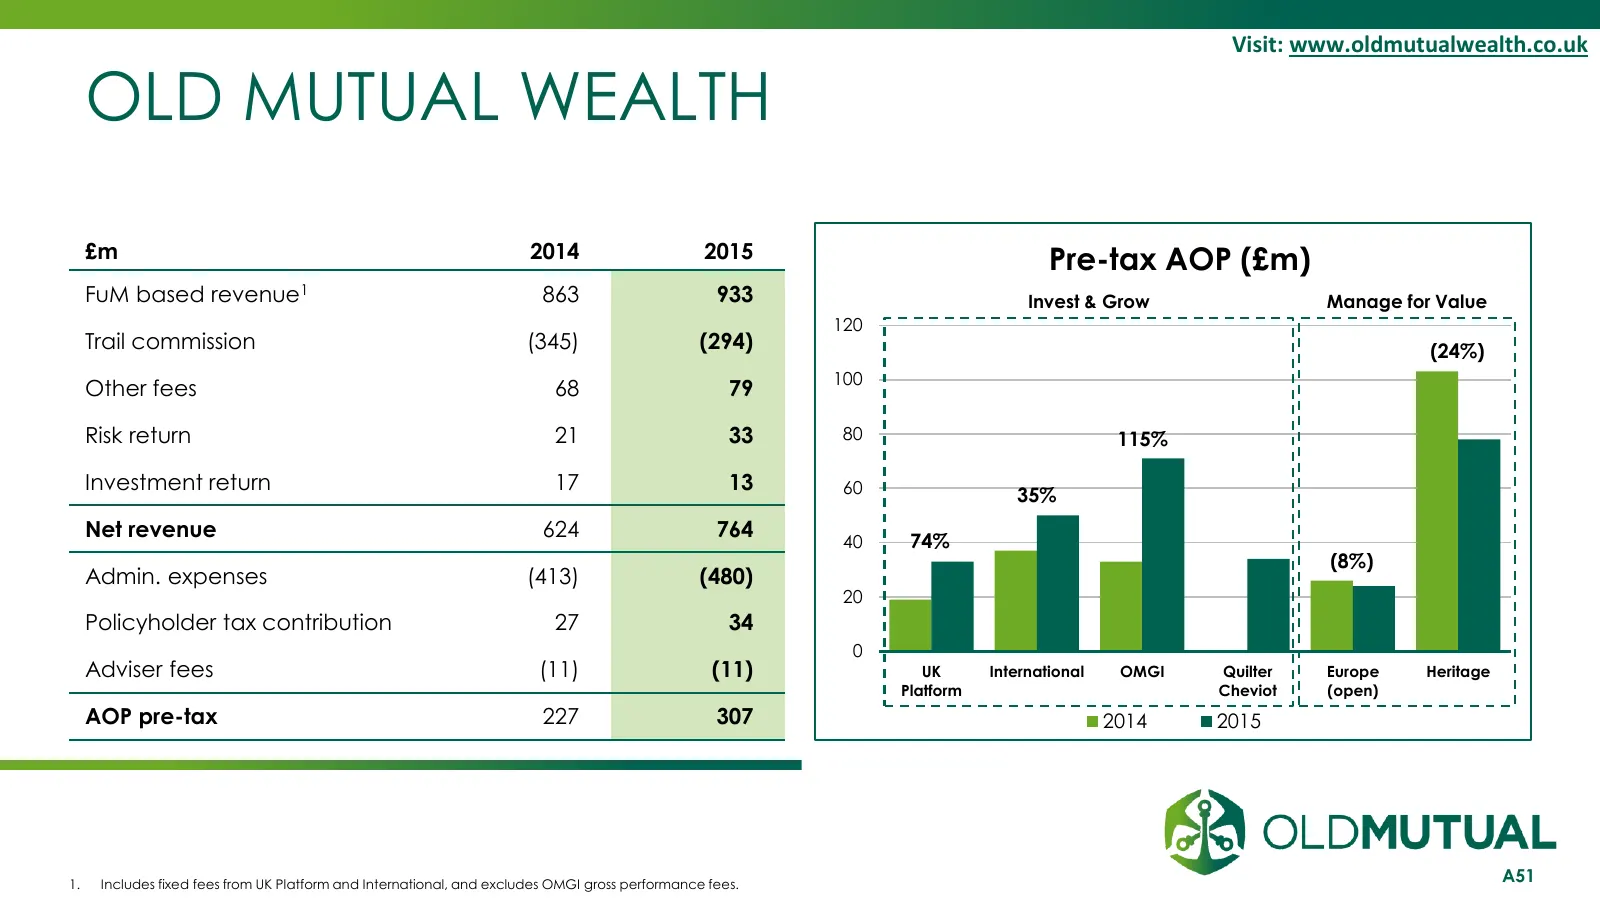
Visit: www.oldmutualwealth.co.uk OLD MUTUAL WEALTH £m 2014 2015 Pre-tax AOP (£m) FuM based revenue1 863 933 Invest & Grow Manage for Value 120 Trail commission (345) (294) (24%) 100 Other fees 68 79 Risk return 21 33 80 115% Investment return 17 13 60 35% Net revenue 624 764 40 74% (8%) Admin. expen
Slide 52: Old Mutual Wealth: Invest & Grow – Economies of Scale
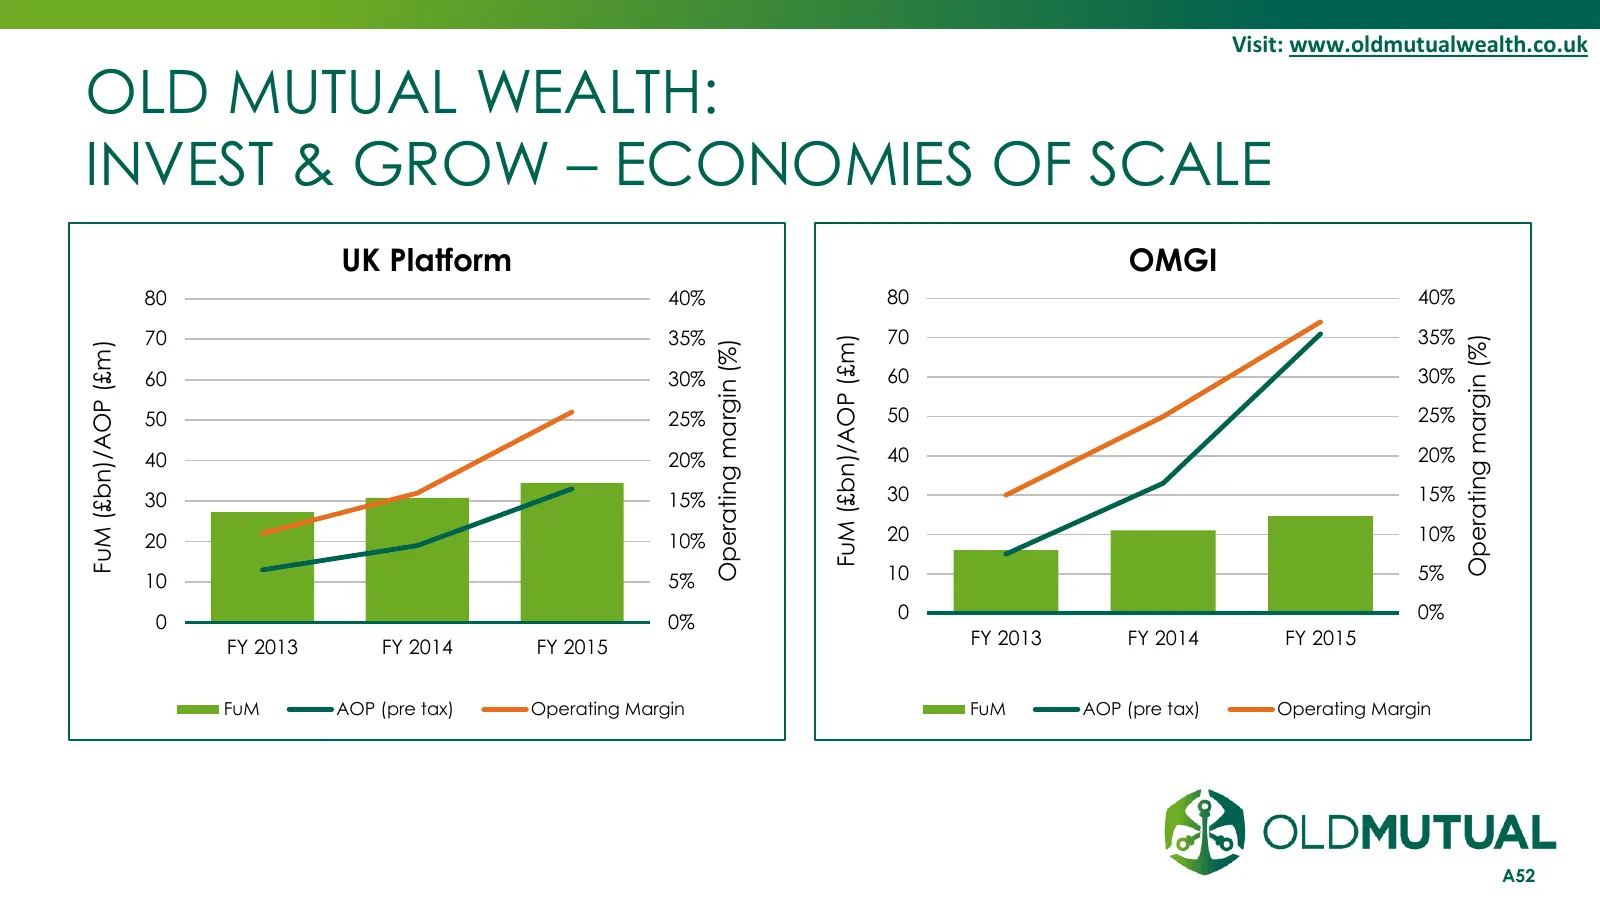
Visit: www.oldmutualwealth.co.uk OLD MUTUAL WEALTH: INVEST & GROW – ECONOMIES OF SCALE UK Platform OMGI 80 40% 80 40% 70 35% 70 35% Operating margin (%) FuM (£bn)/AOP (£m) Operating margin (%) FuM (£bn)/AOP (£m) 60 30% 60 30% 50 25% 50 25% 40 20% 40 20% 30 15% 30 15% 20 10% 20 10% 10 5% 10 5% 0 0% 0
Slide 53: Old Mutual Wealth – Source of Earnings 2015
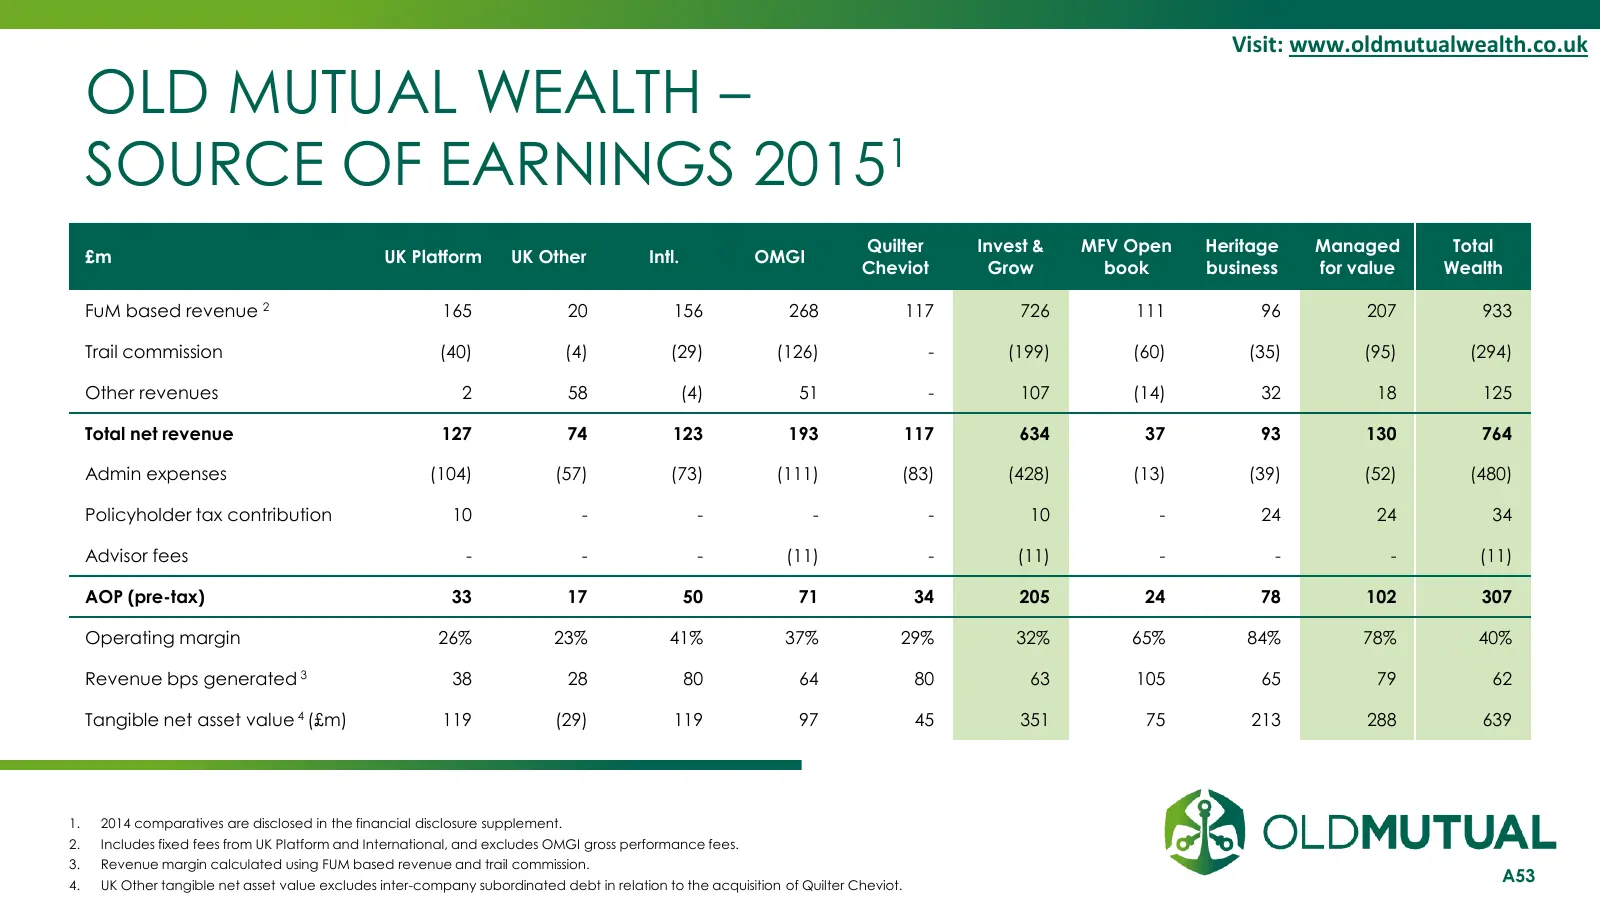
Visit: www.oldmutualwealth.co.uk OLD MUTUAL WEALTH – SOURCE OF EARNINGS 20151 Quilter Invest & MFV Open Heritage Managed Total £m UK Platform UK Other Intl. OMGI Cheviot Grow book business for value Wealth FuM based revenue 2 165 20 156 268 117 726 111 96 207 933 Trail commission (40) (4) (29) (126)
Slide 54: Old Mutual Wealth – UK Heritage Valuation
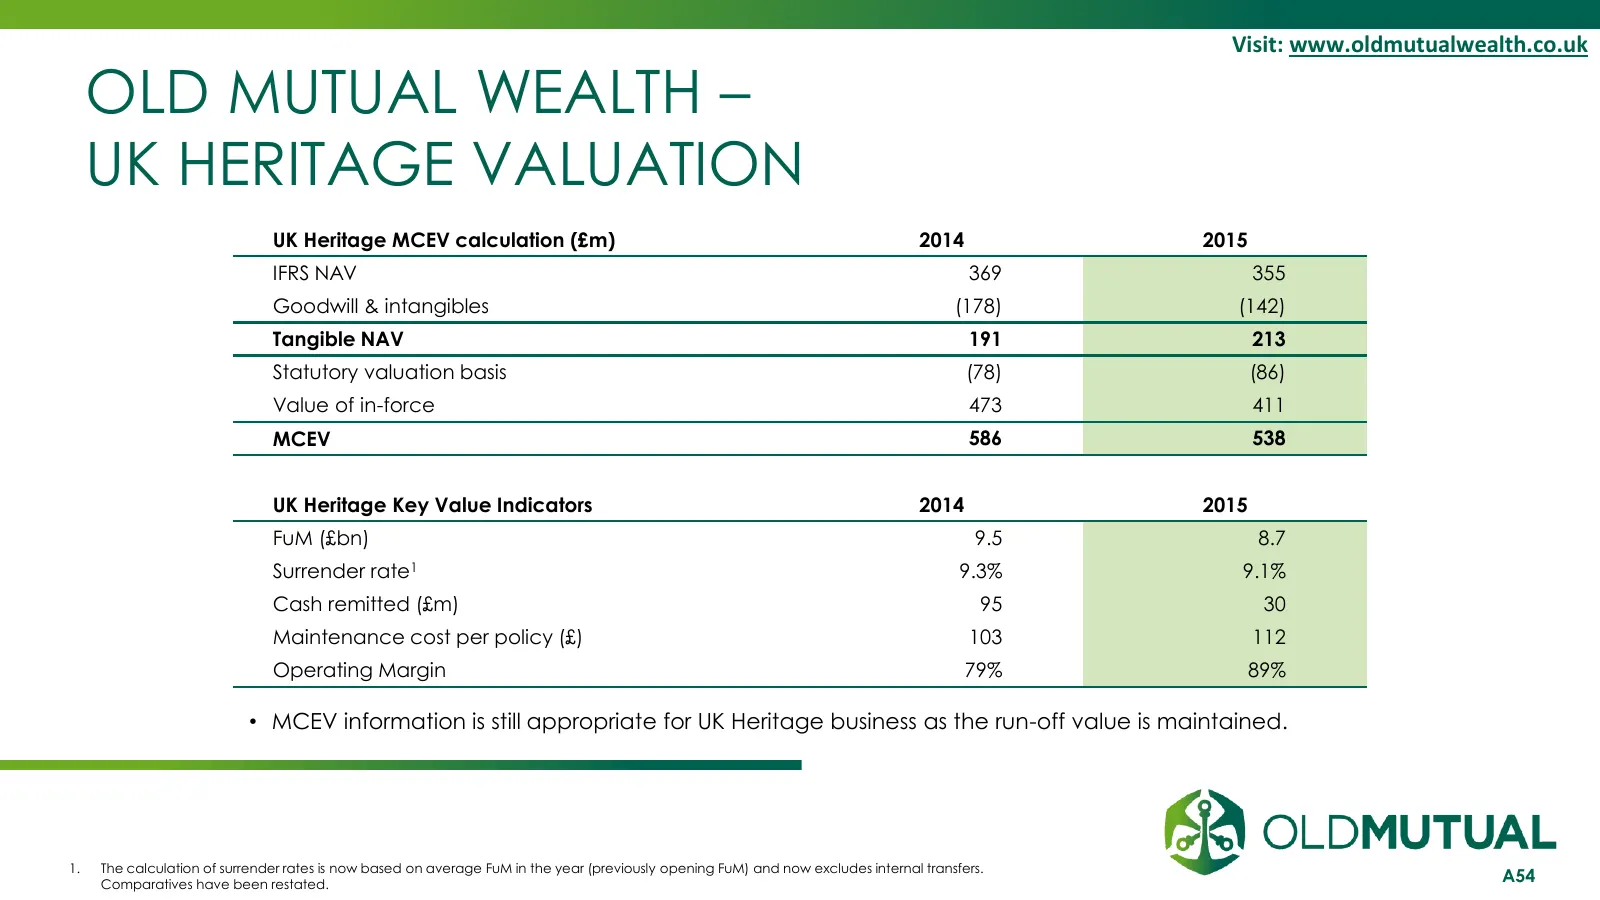
Visit: www.oldmutualwealth.co.uk OLD MUTUAL WEALTH – UK HERITAGE VALUATION UK Heritage MCEV calculation (£m) 2014 2015 IFRS NAV 369 355 Goodwill & intangibles (178) (142) Tangible NAV 191 213 Statutory valuation basis (78) (86) Value of in-force 473 411 MCEV 586 538 UK Heritage Key Value Indicators
Slide 55: Old Mutual Wealth Adjusted NAV
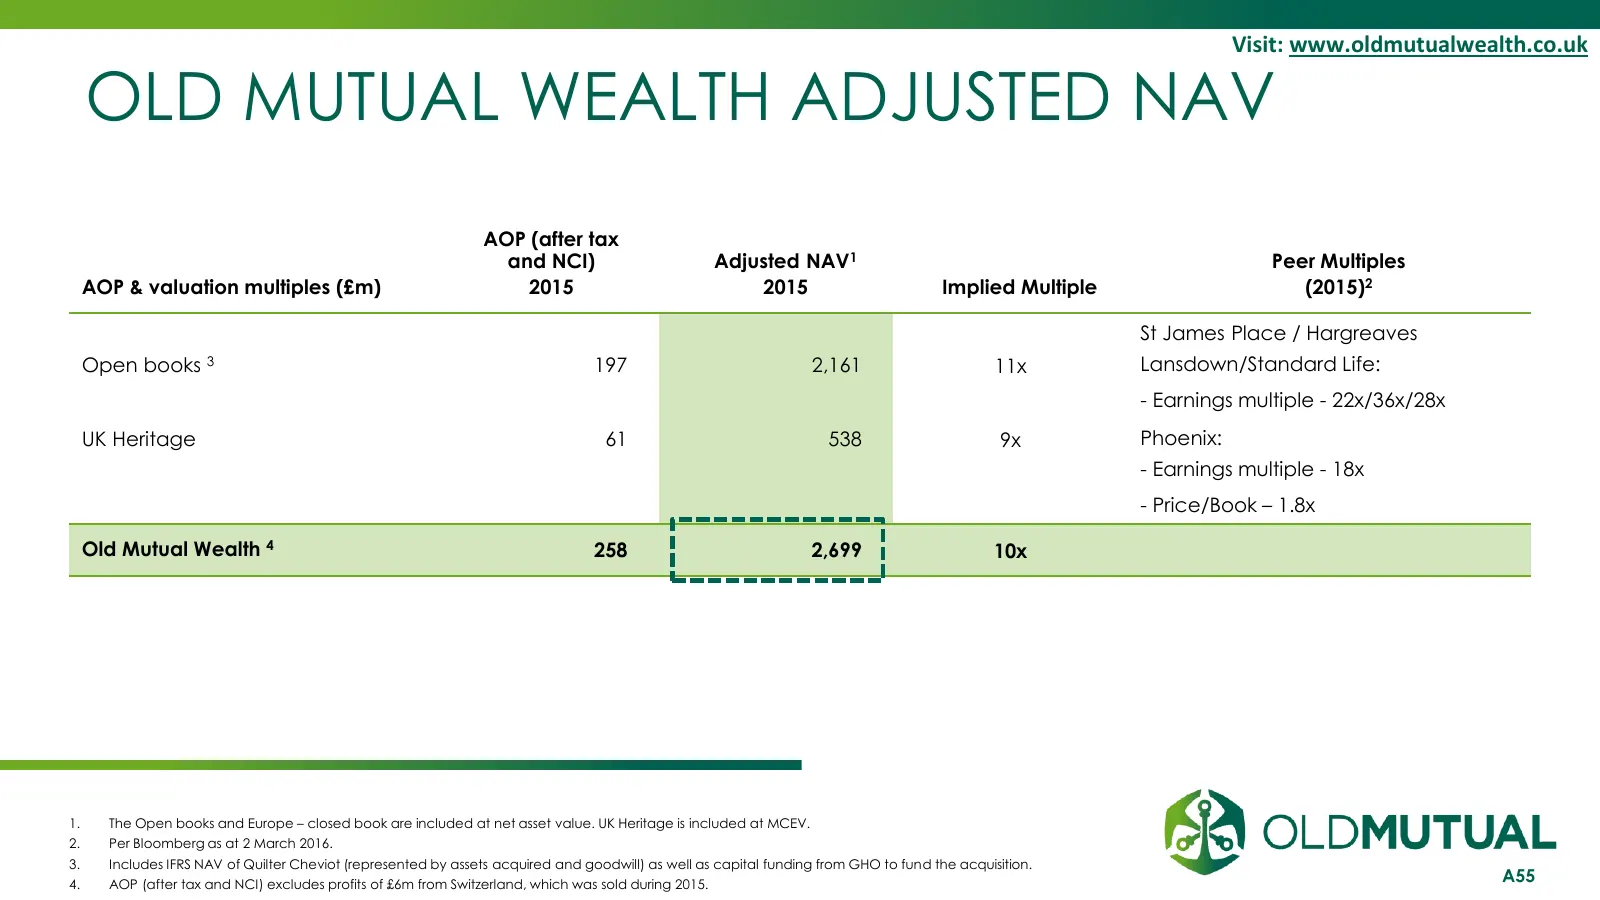
Visit: www.oldmutualwealth.co.uk OLD MUTUAL WEALTH ADJUSTED NAV AOP (after tax and NCI) Adjusted NAV1 Peer Multiples AOP & valuation multiples (£m) 2015 2015 Implied Multiple (2015)2 St James Place / Hargreaves Open books 3 197 2,161 11x Lansdown/Standard Life: - Earnings multiple - 22x/36x/28x UK H
Slide 56: OMAM – Adjusted Operating Profit
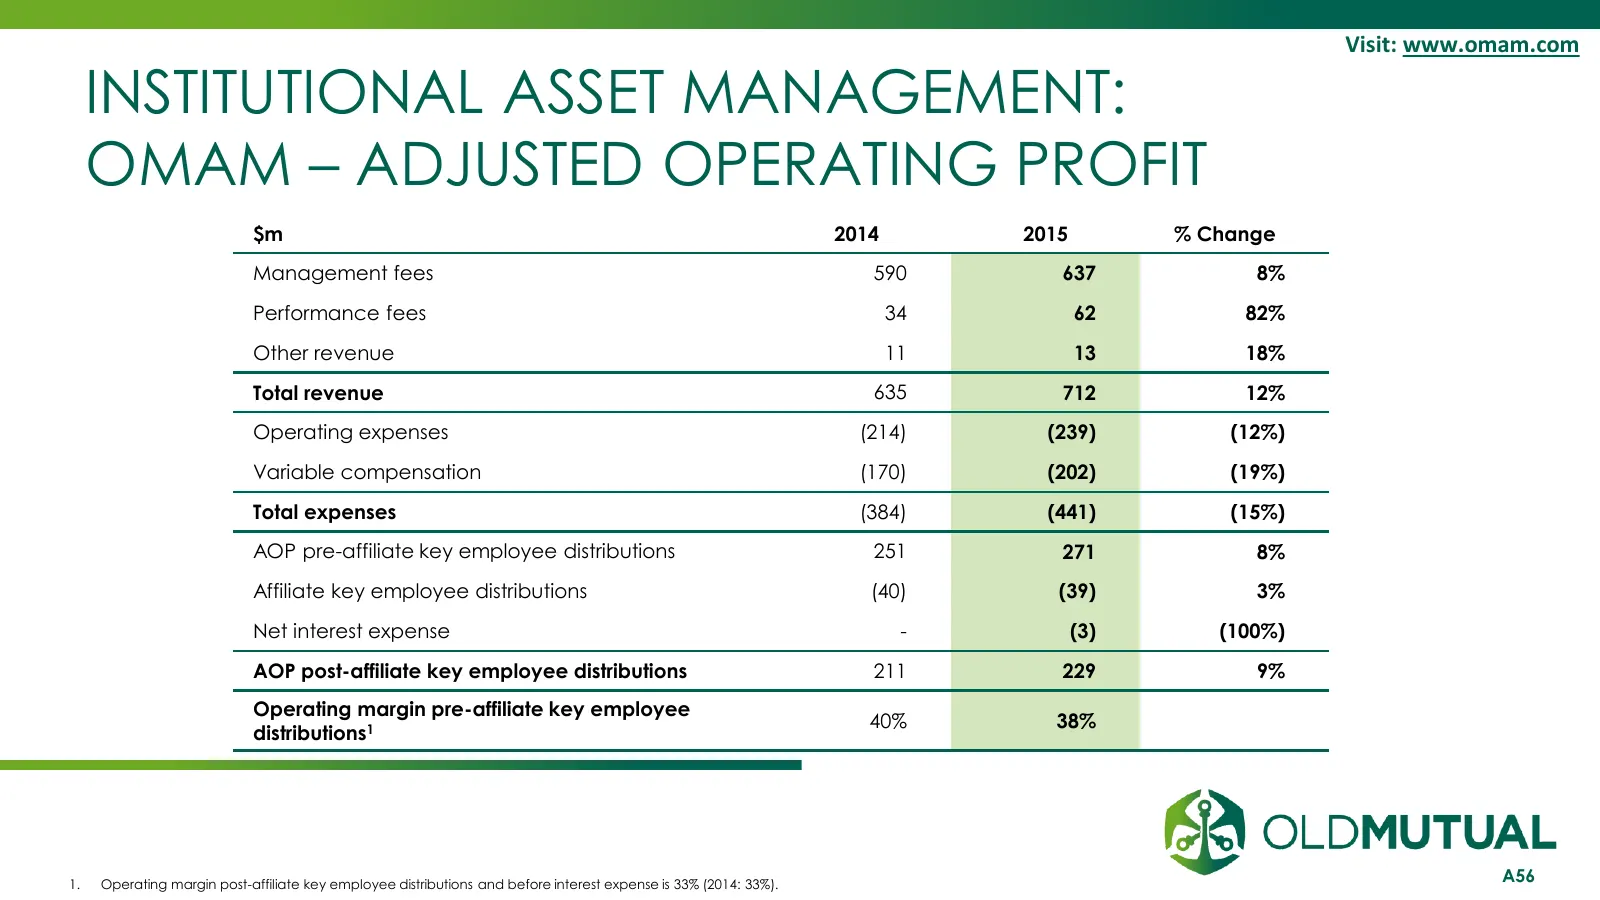
Visit: www.omam.com INSTITUTIONAL ASSET MANAGEMENT: OMAM – ADJUSTED OPERATING PROFIT $m 2014 2015 % Change Management fees 590 637 8% Performance fees 34 62 82% Other revenue 11 13 18% Total revenue 635 712 12% Operating expenses (214) (239) (12%) Variable compensation (170) (202) (19%) Total expens
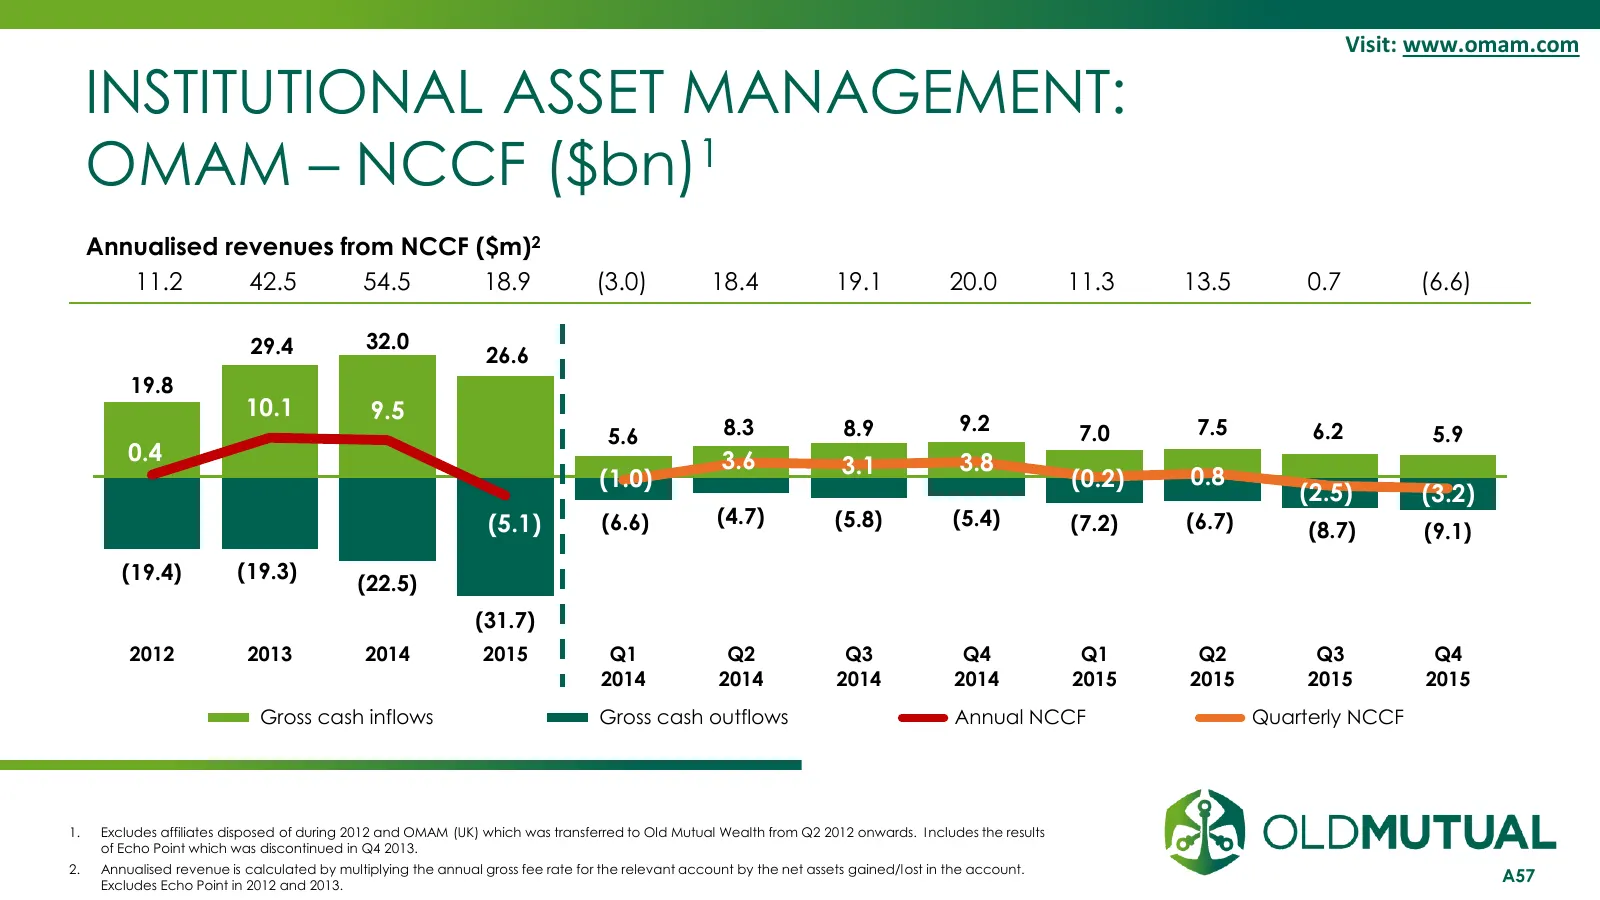
Slide 57: OMAM – NCCF ($bn)
Visit: www.omam.com INSTITUTIONAL ASSET MANAGEMENT: OMAM – NCCF ($bn)1 Annualised revenues from NCCF ($m)2 11.2 42.5 54.5 18.9 (3.0) 18.4 19.1 20.0 11.3 13.5 0.7 (6.6) 29.4 32.0 26.6 19.8 10.1 9.5 8.3 8.9 9.2 7.0 7.5 6.2 5.9 5.6 0.4 3.6 3.8 3.1 0.8 (1.0) (0.2) (2.5) (3.2) (5.1) (6.6) (4.7) (5.8) (5.
Source: Internet Archive copy of oldmutual.com
More decks from Old Mutual Ltd.
 FY2025 Earnings Presentation46 slides · Oct 12, 2026
 Q2 2026 Earnings Presentation48 slides · Sep 8, 2026
 H1 2025 Earnings Presentation45 slides · Sep 10, 2025
 FY2024 Earnings Presentation40 slides · Mar 18, 2025
 FY2023 Earnings Presentation39 slides · Mar 27, 2024
 H1 2024 Earnings Presentation33 slides · 2024