Dynegy — 33rd Annual Howard Weil Energy Conference 2005
34 slides from Dynegy's conference presentation, Apr 4, 2005
Slide 1: 33rd Annual Howard Weil Energy Conference
Exhibit 99.2 Investor Peter (713) 33rd Annual J. 507-6466 Wilt, Relations: Howard Vice ir@dynegy.com President Weil Energy Norelle Conference V. Lundy, New Director Orleans Hillarie April C.4,Bloxom, 2005 Analyst
Slide 2: Forward Looking Statements
FORWARD This these Management Dynegy’s expressly any Non-GAAP We of 2 1934, non-GAAP use forward-looking presentation statements, the asqualified actual non-GAAP amended, Financial LOOKING cautions measures future including contains bystatements including Measures: that these results financial to ST
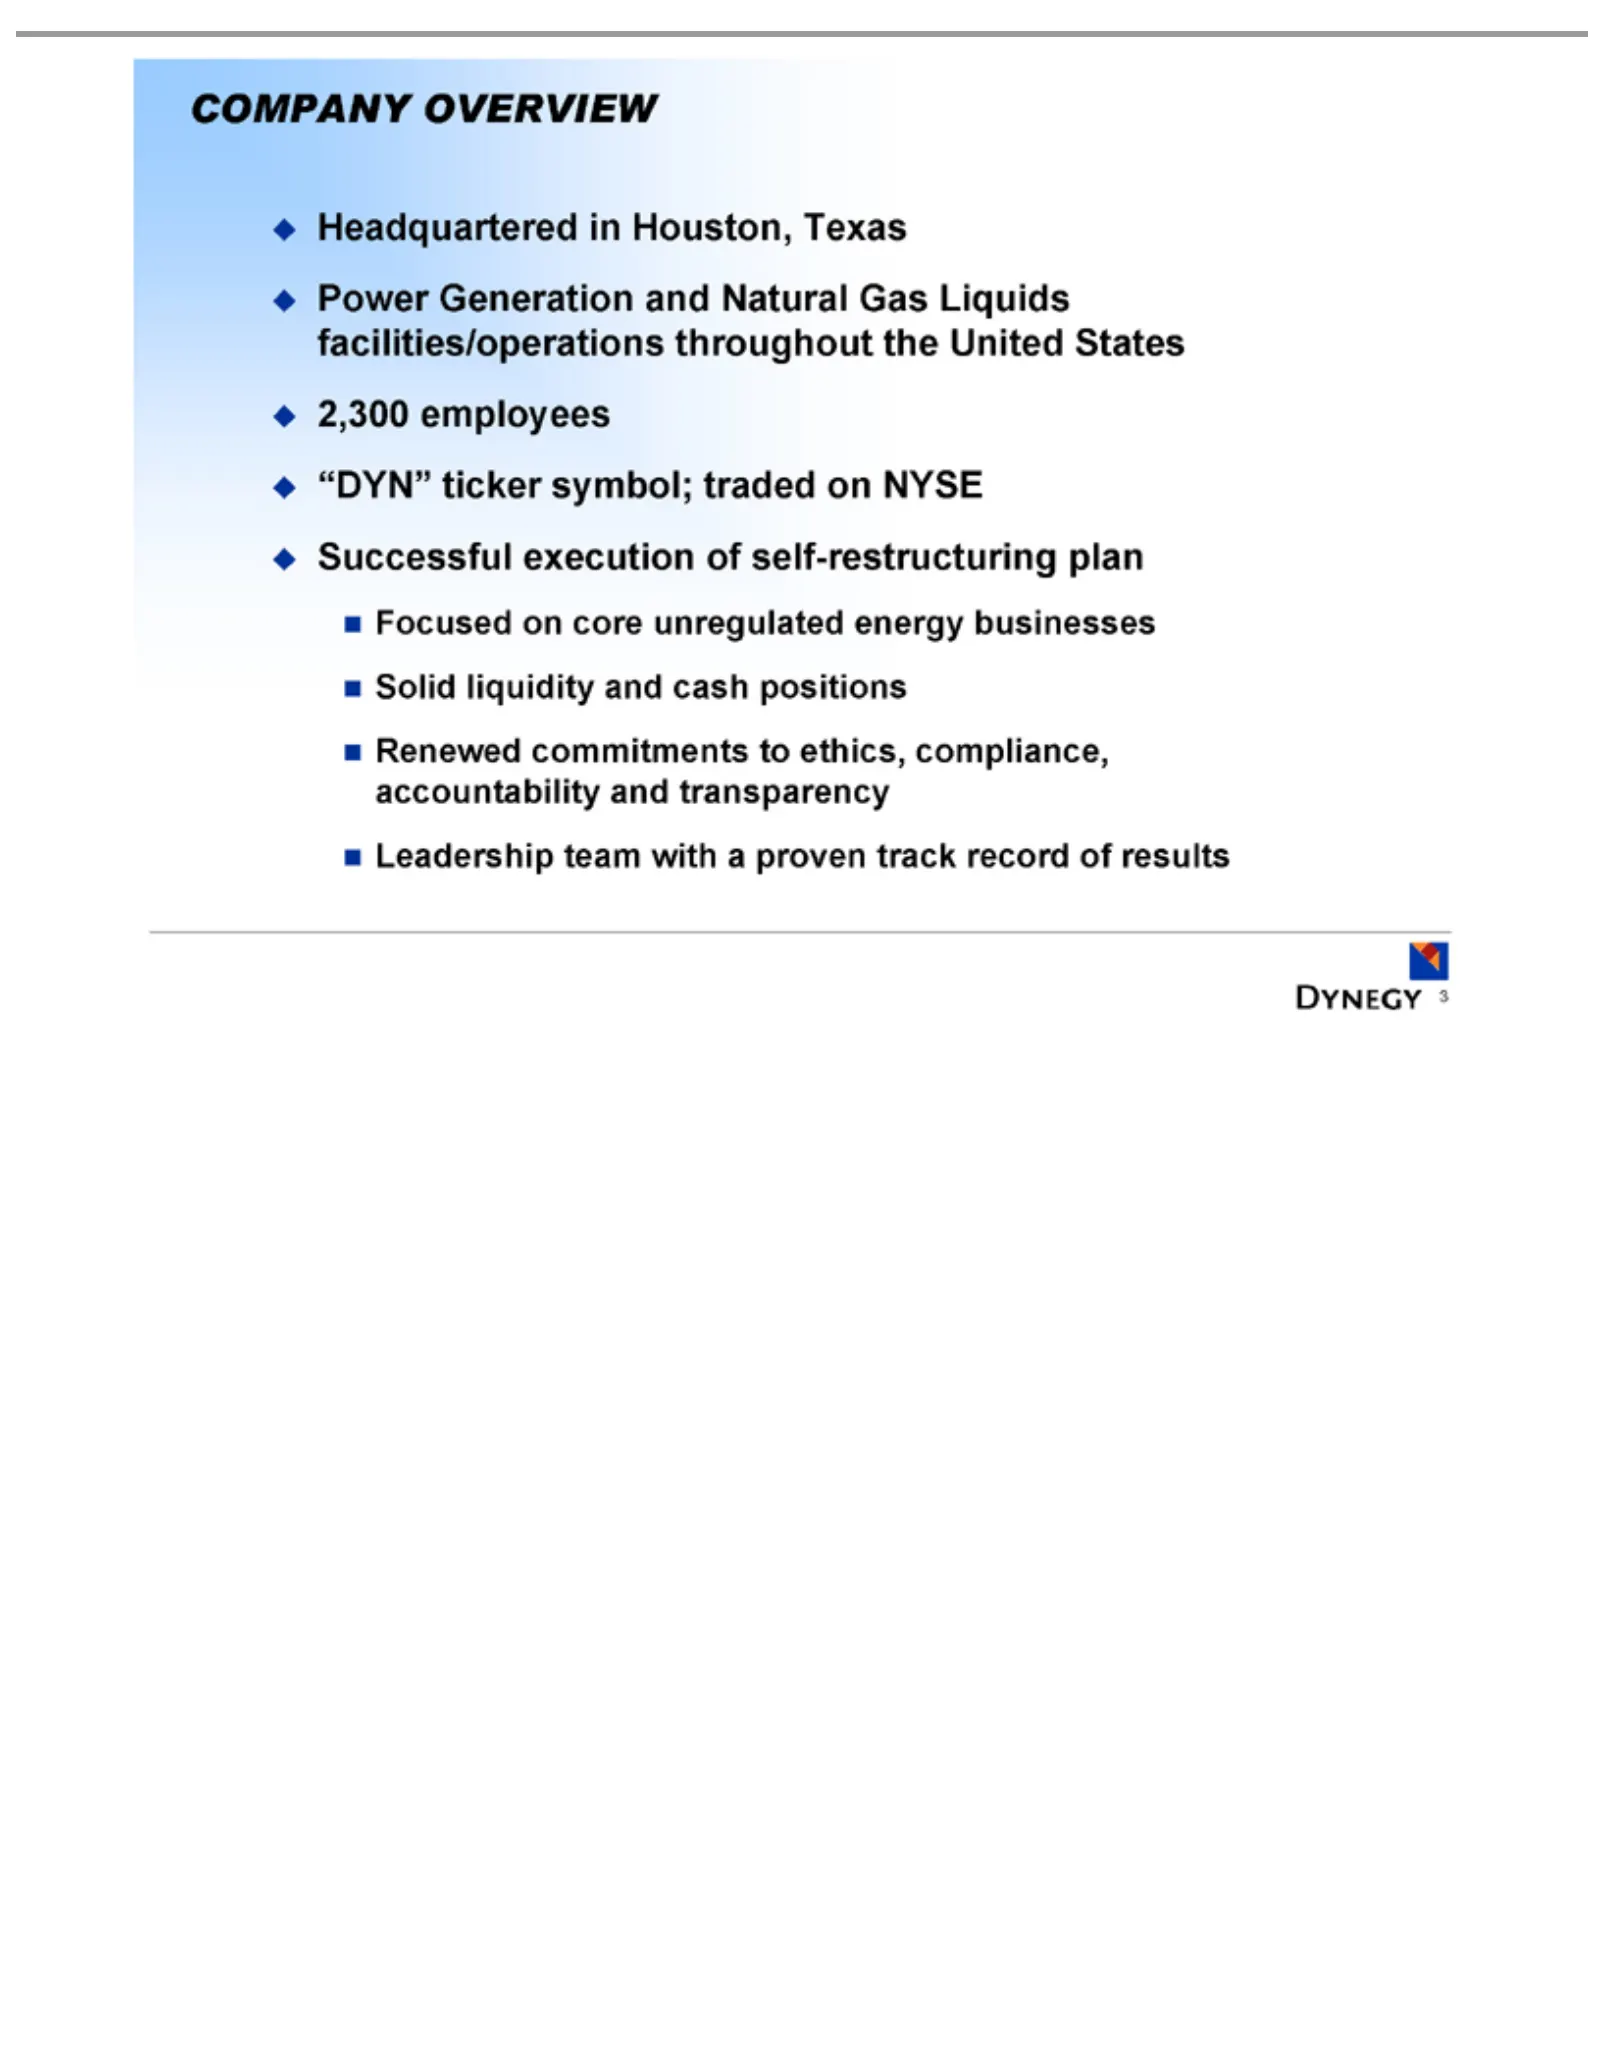
Slide 3: Company Overview
COMPANY Headquartered Power Successful Focused record 3 of Generation on results execution core OVERVIEW inunregulated Houston, andofNatural self-restructuring Texas energy Gas Liquids businesses plan facilities/operations Solid liquidity and throughout cash positions the United Renewed Statescommit
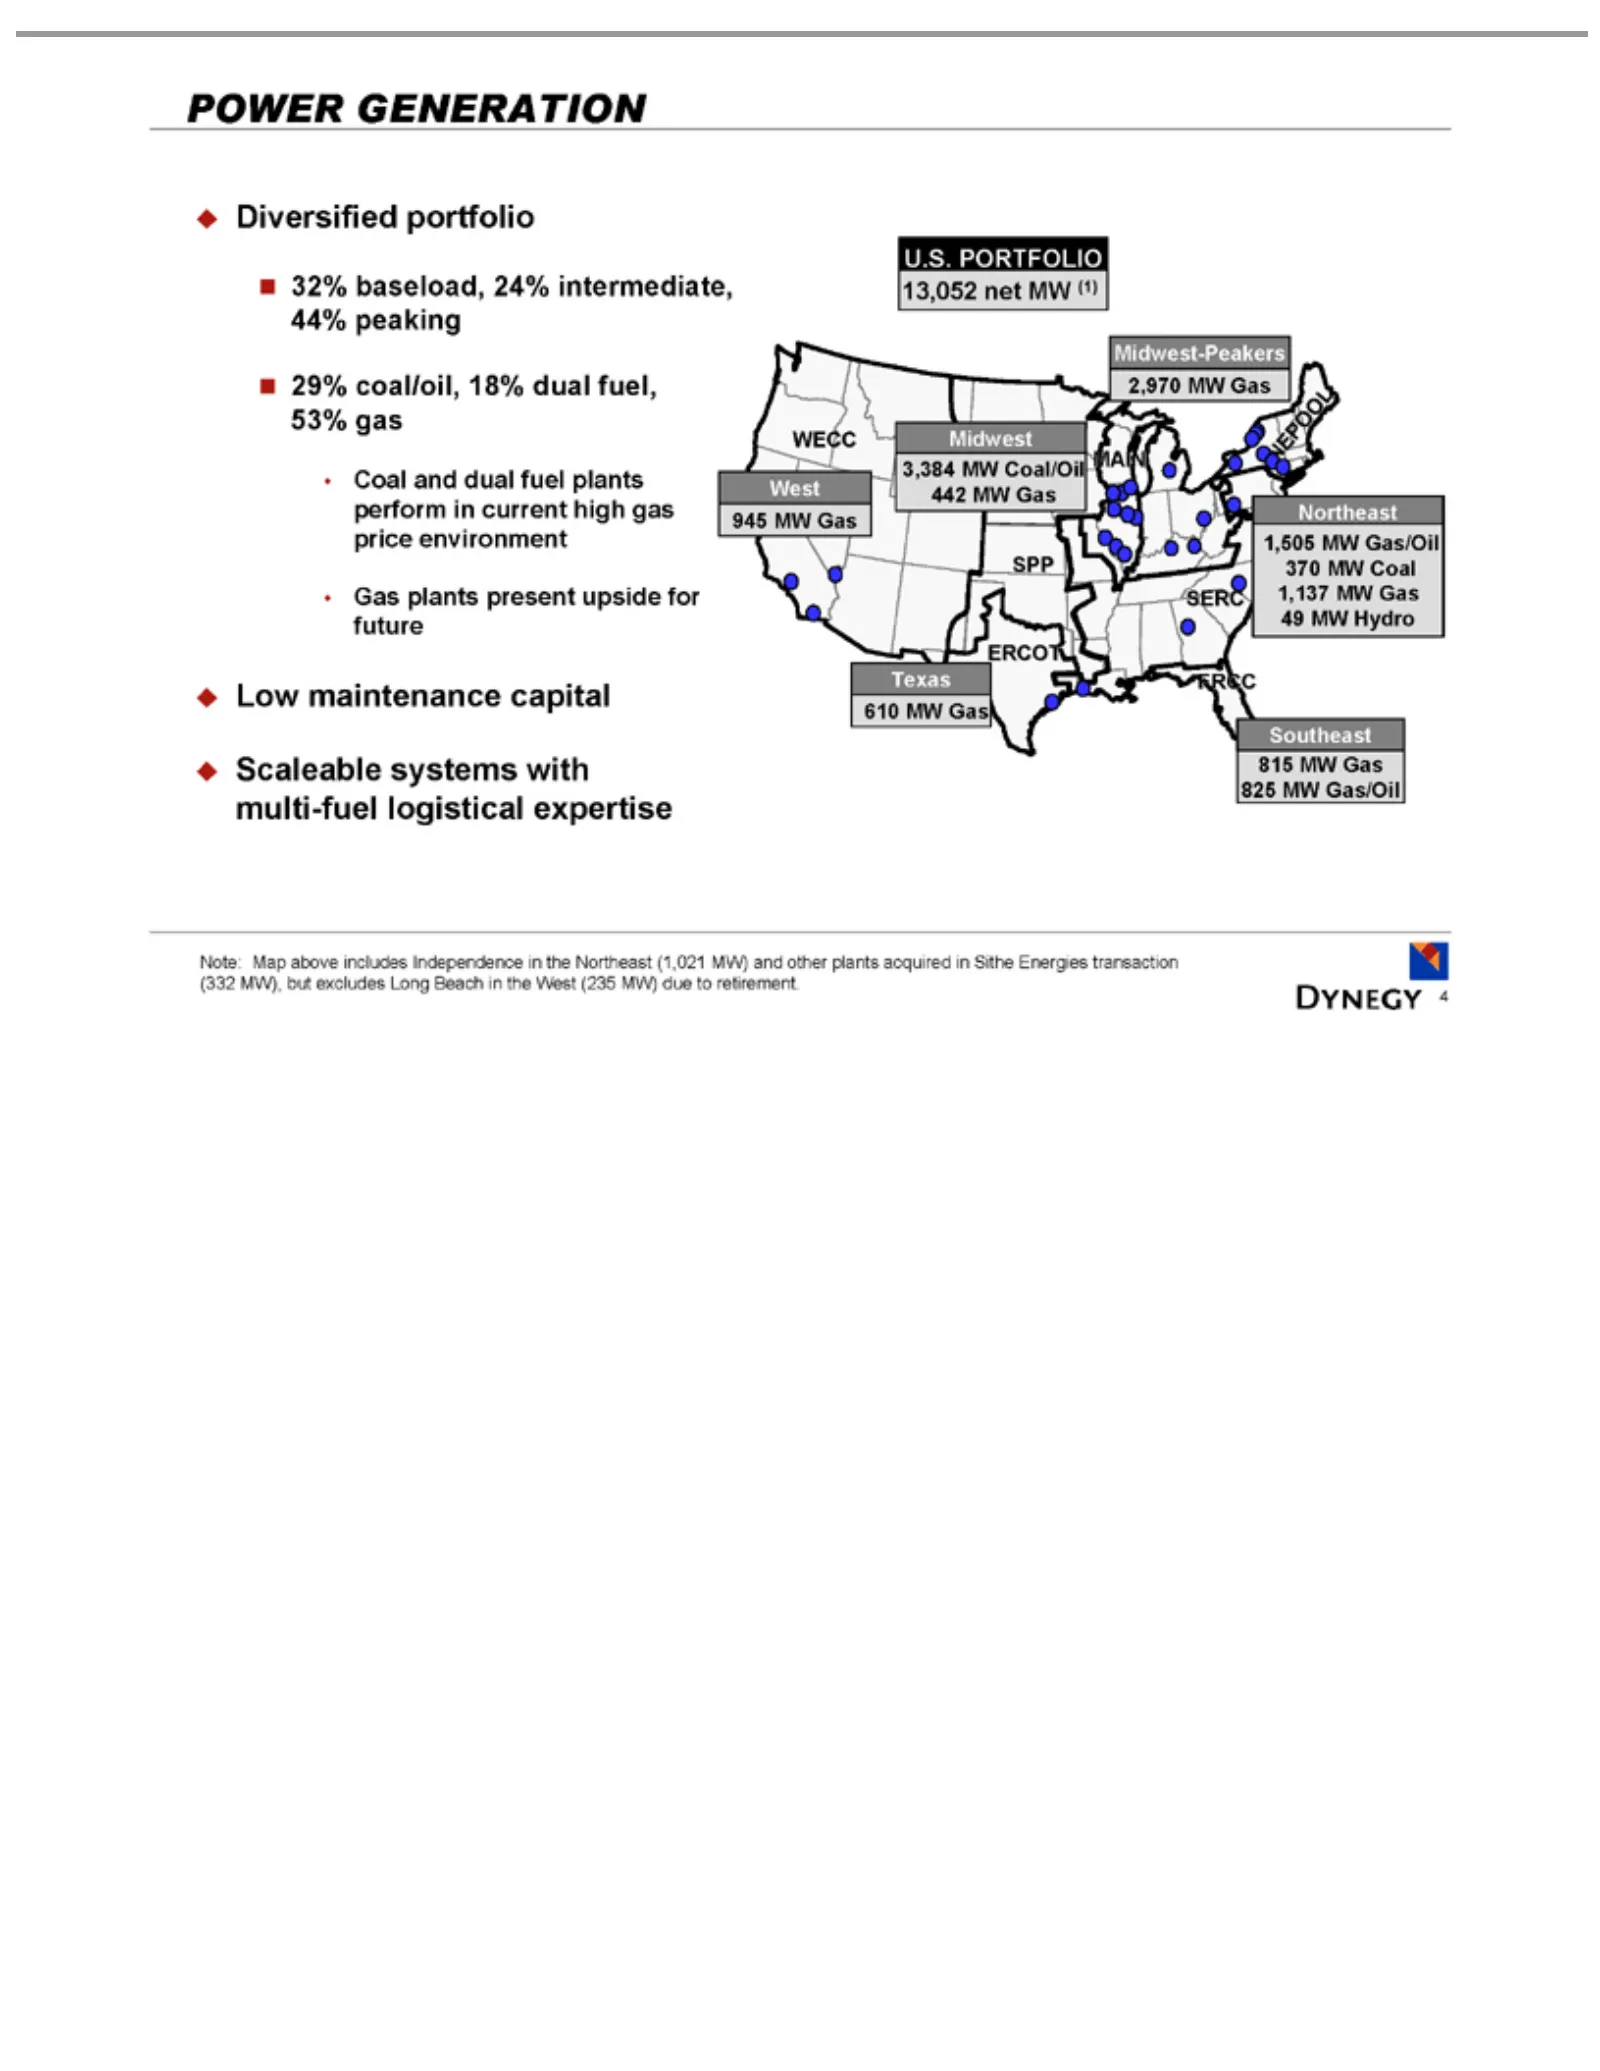
Slide 4: Power Generation Portfolio
POWER Diversified 32% 29% Coal Gas Low Scaleable U.S. West WECC Midwest Texas ERCOT SPP Midwest-Peakers Northeast NEPOOL Southeast FRCC SERC Note: 4 retirement. plants PORTFOLIO maintenance baseload, coal/oil, and 945 Map 610GENERATION 3,384 dual MW systems 1,505 815 MW present above portfolio 18% f
Slide 5: Natural Gas Liquids
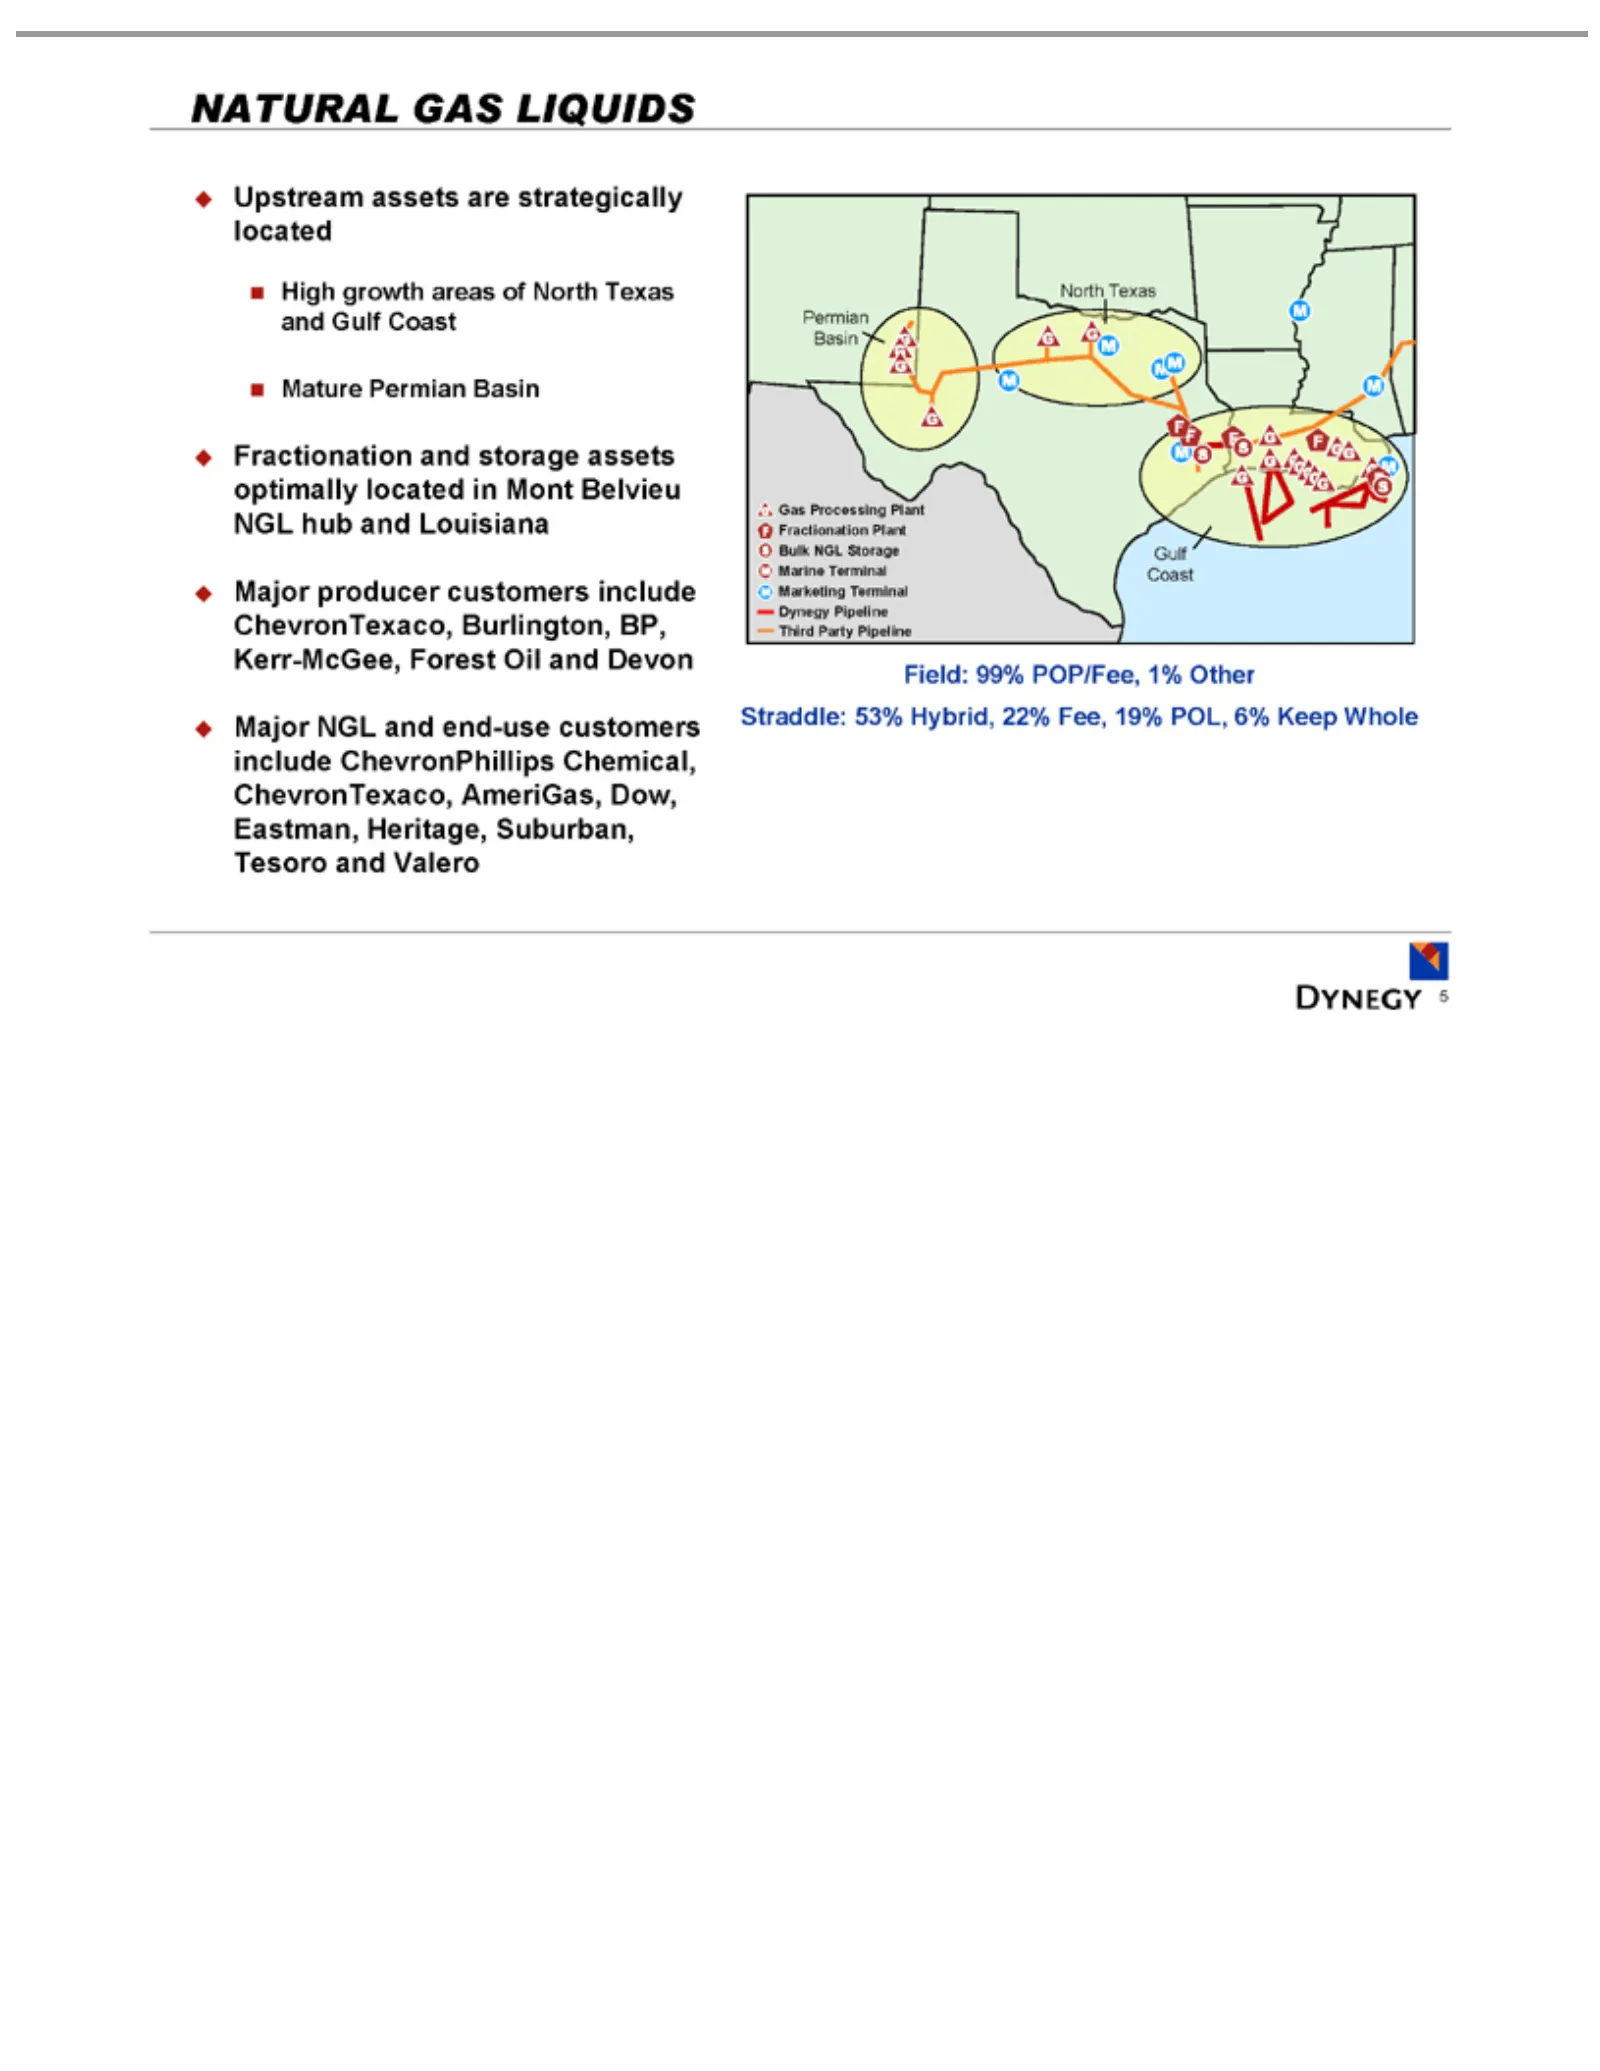
NATURAL Upstream High Mature Fractionation Major Permian North Gulf Gas Field: Straddle: 5 Processing Coast growth Texas 99% producer NGL Permian Basin 53% assets POP/Fee, GAS and areas and Hybrid, Plant customers end-use Basin are LIQUIDS storage ofstrategically Fractionation North 1% 22% customers
Slide 6: Strategic Chapter 11 Self-Restructuring and Alternatives
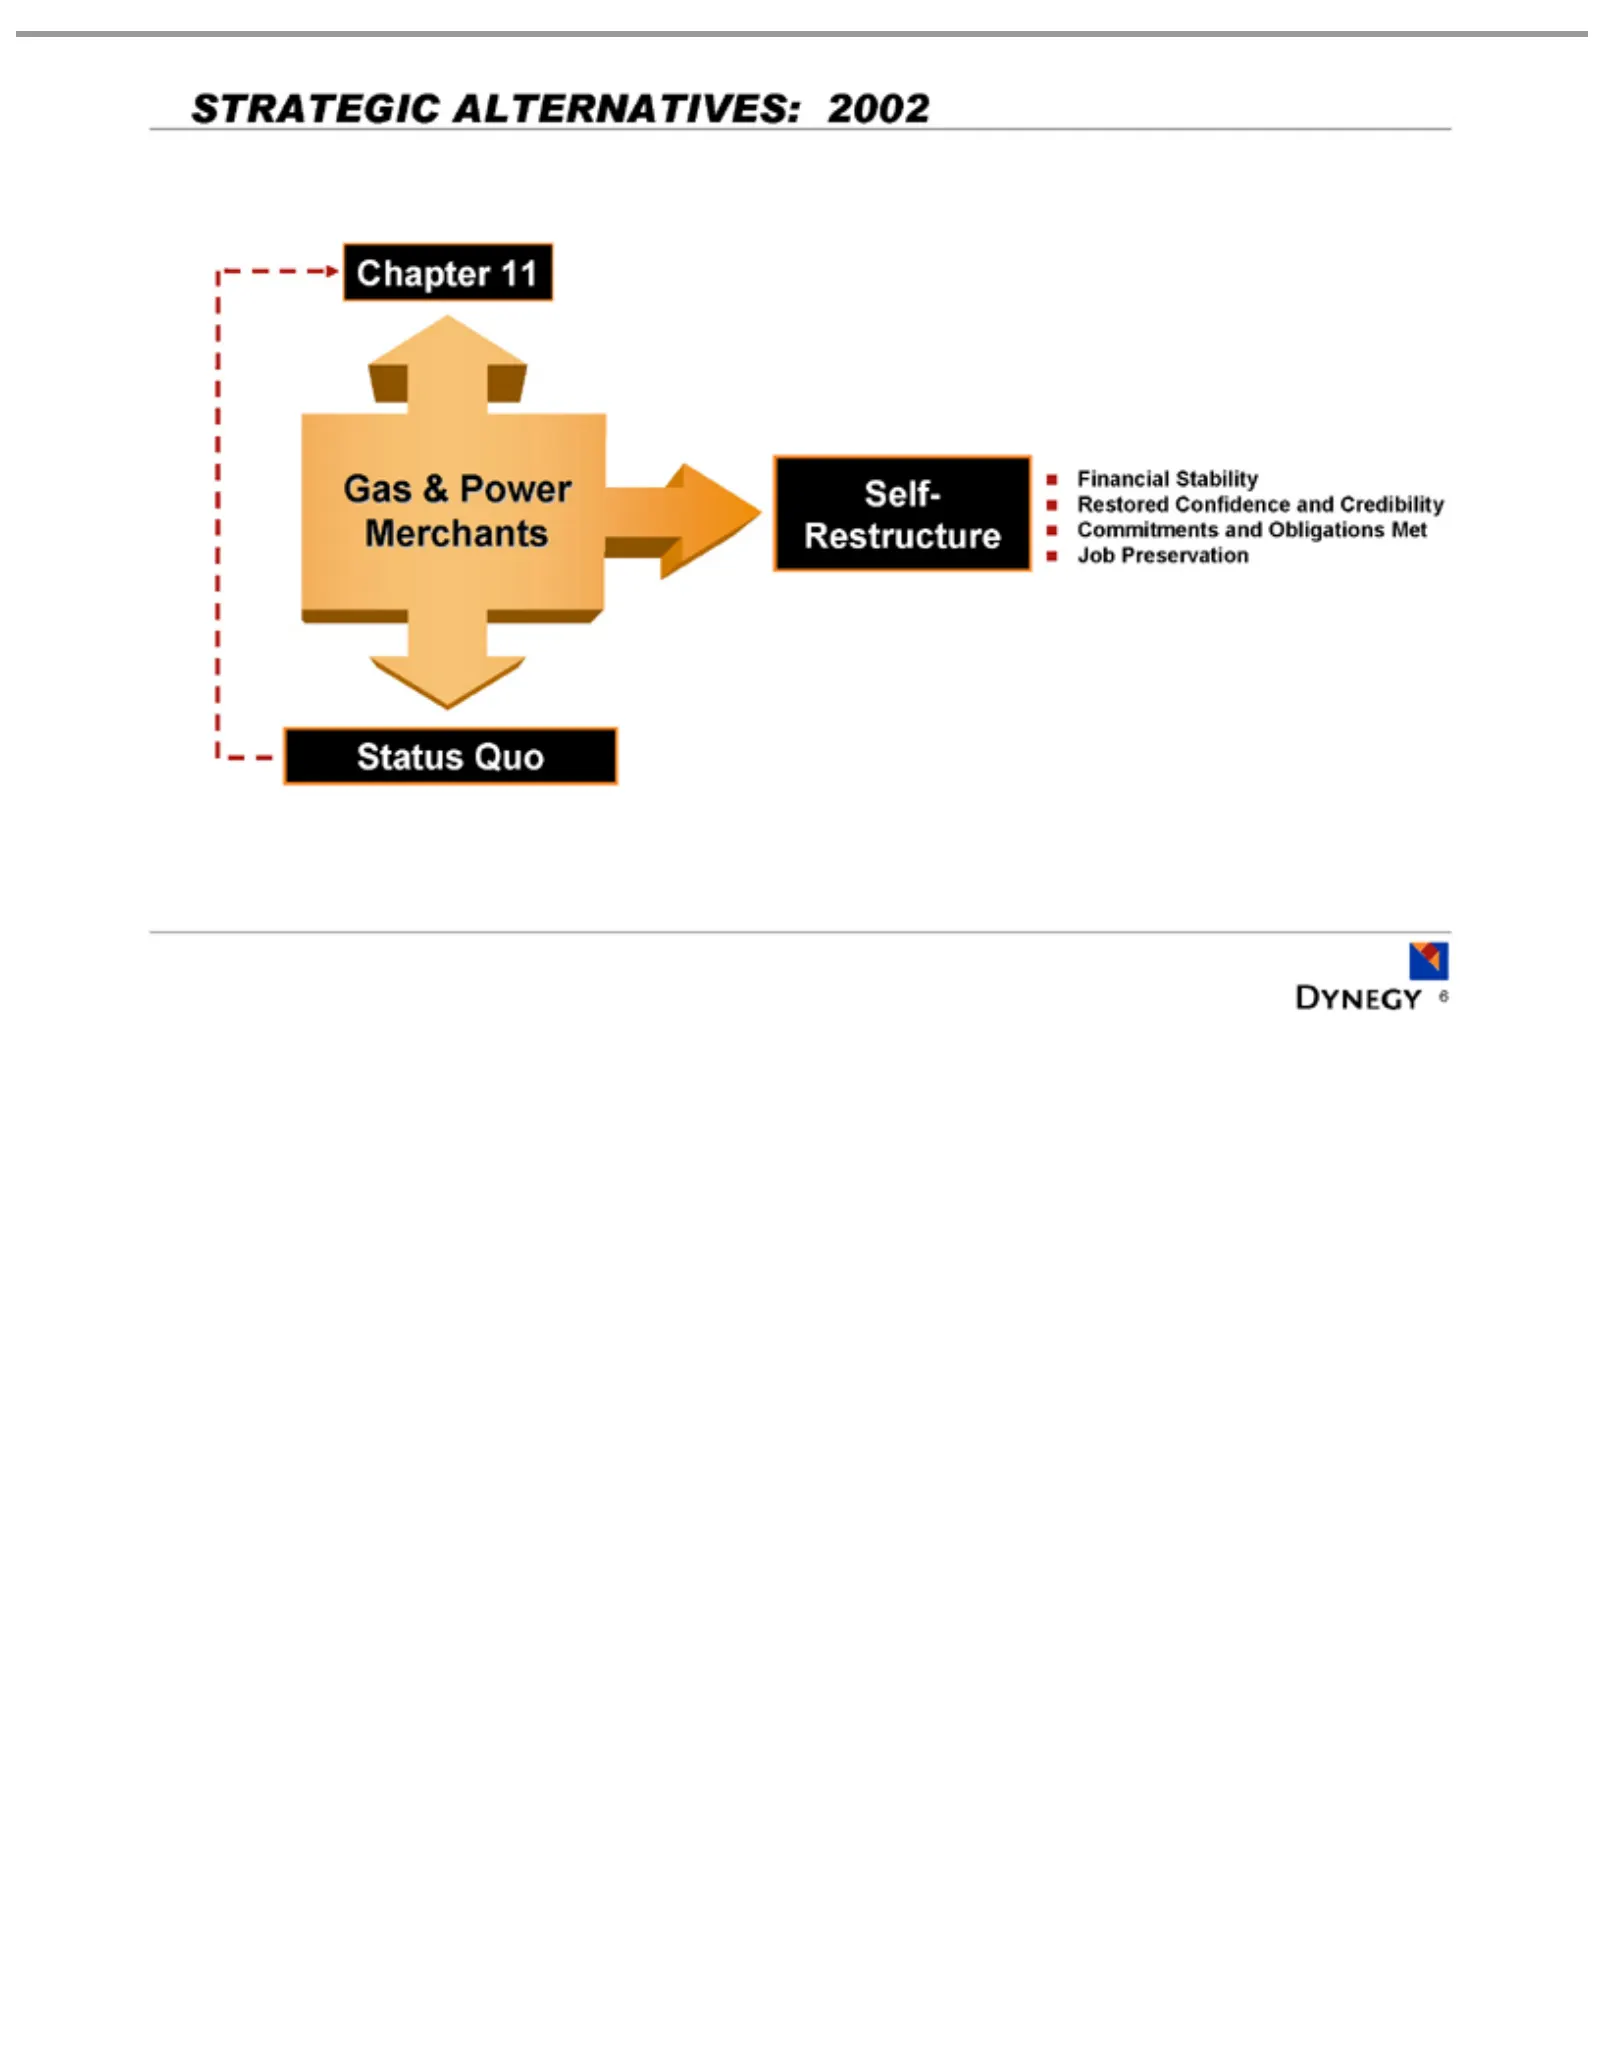
STRATEGIC Chapter Gas Status Financial Self-Restructure Restored 6 & Quo Power 11Confidence Stability ALTERNATIVES: Merchants and Credibility 2002Commitments and Obligations Met Job Preservation
Slide 7: Operating Results: A New Era Phase 1
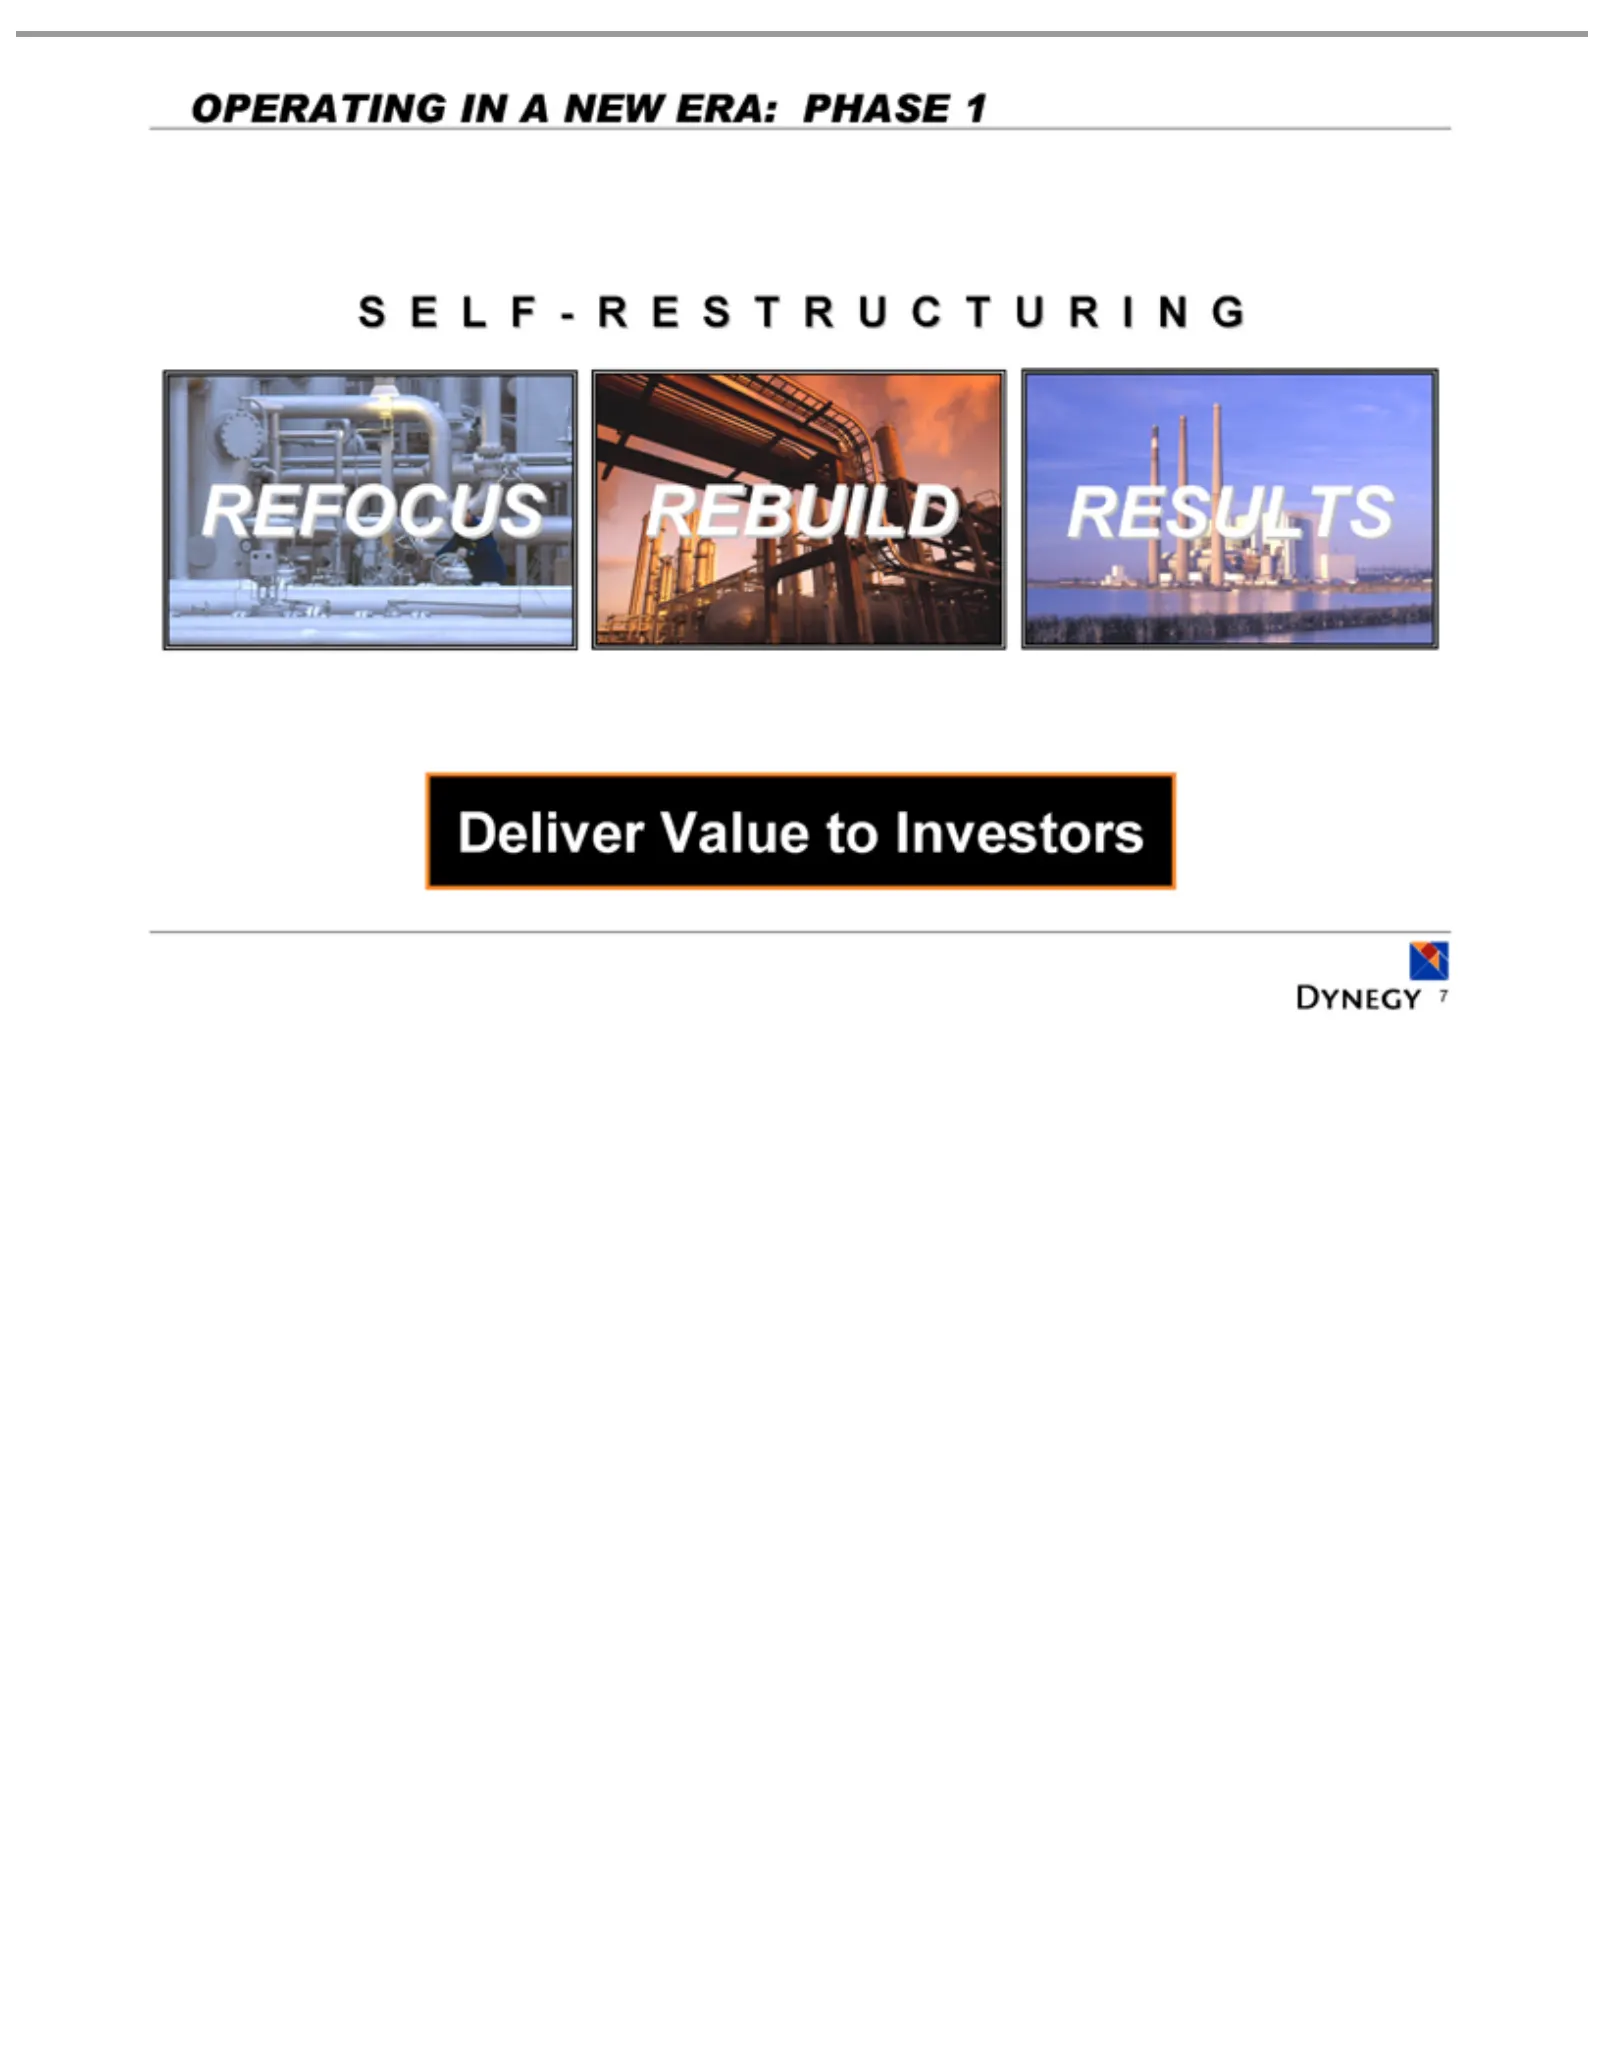
OPERATING SELF Deliver RESULTS REBUILD REFOCUS 7 - RESTRUCTURING Value to INInvestors A NEW ERA: PHASE 1
Slide 8: Strategic Refocus: Protect Value
Protect value STRATEGIC Refocus Cooperate Credibility 8 employees fully and ofTrust: with the company through investigations; The Right shared Things principles address to Do and andresolve goals expeditiously
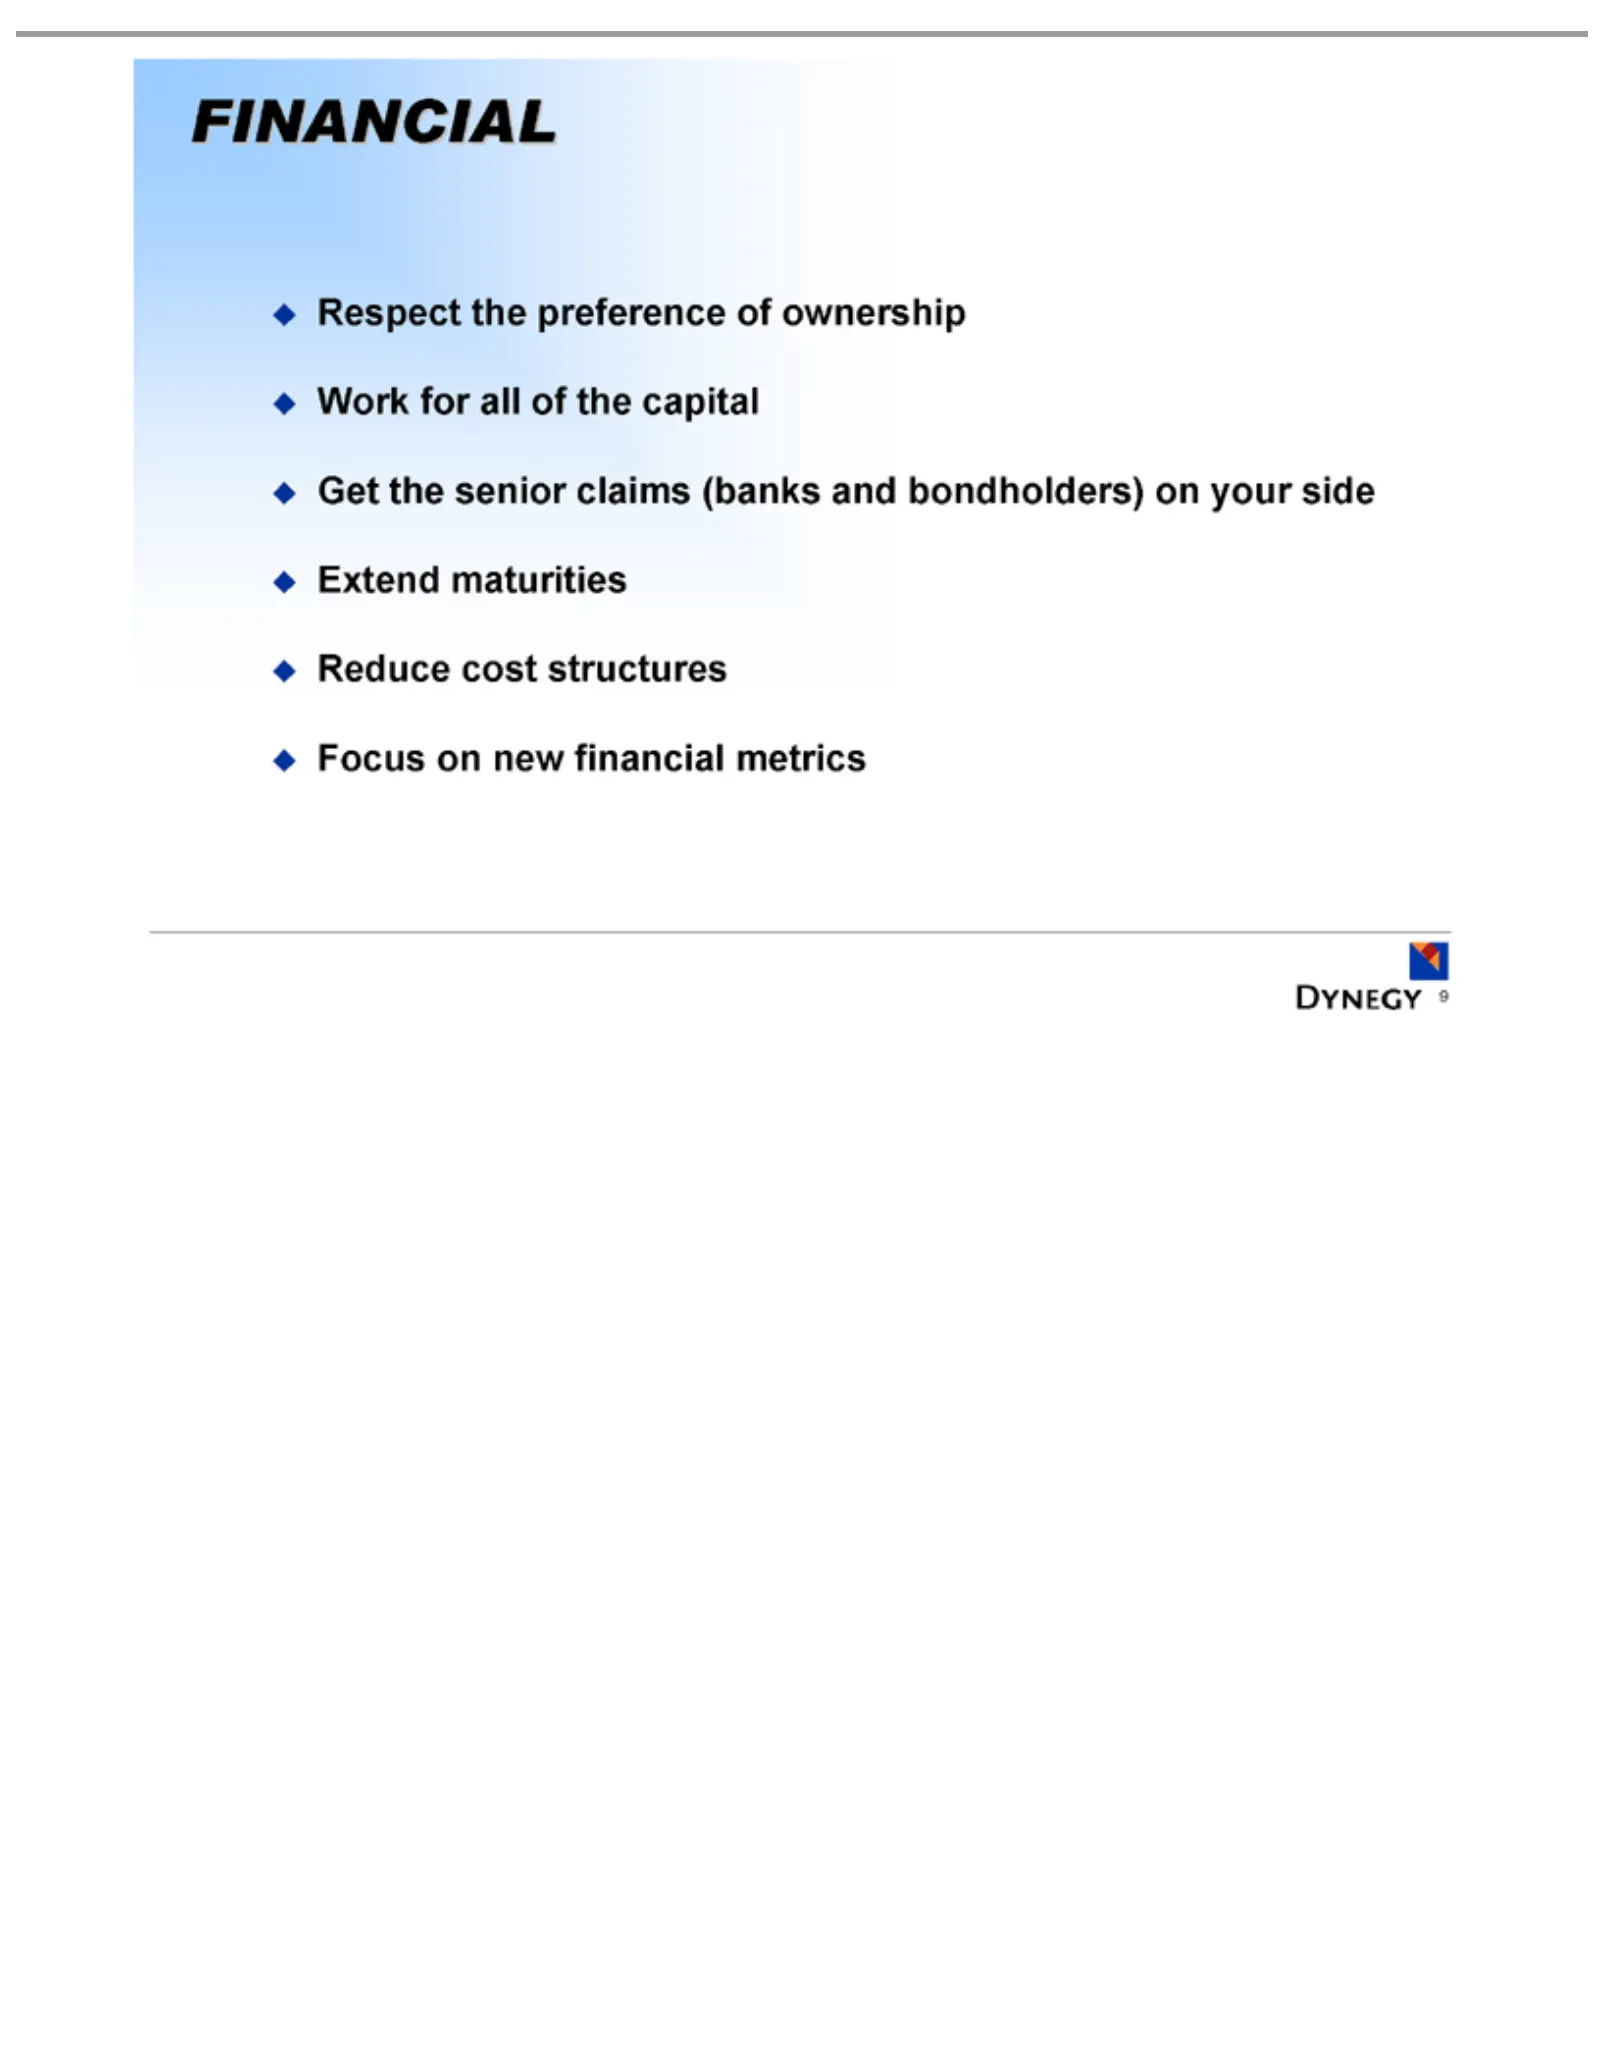
Slide 9: Financial Restructuring
Respect FINANCIAL Work Get 9 theforsenior the allpreference ofclaims the capital (banks of ownership and bondholders) on your side Extend maturities Reduce cost structures Focus on new financial metrics
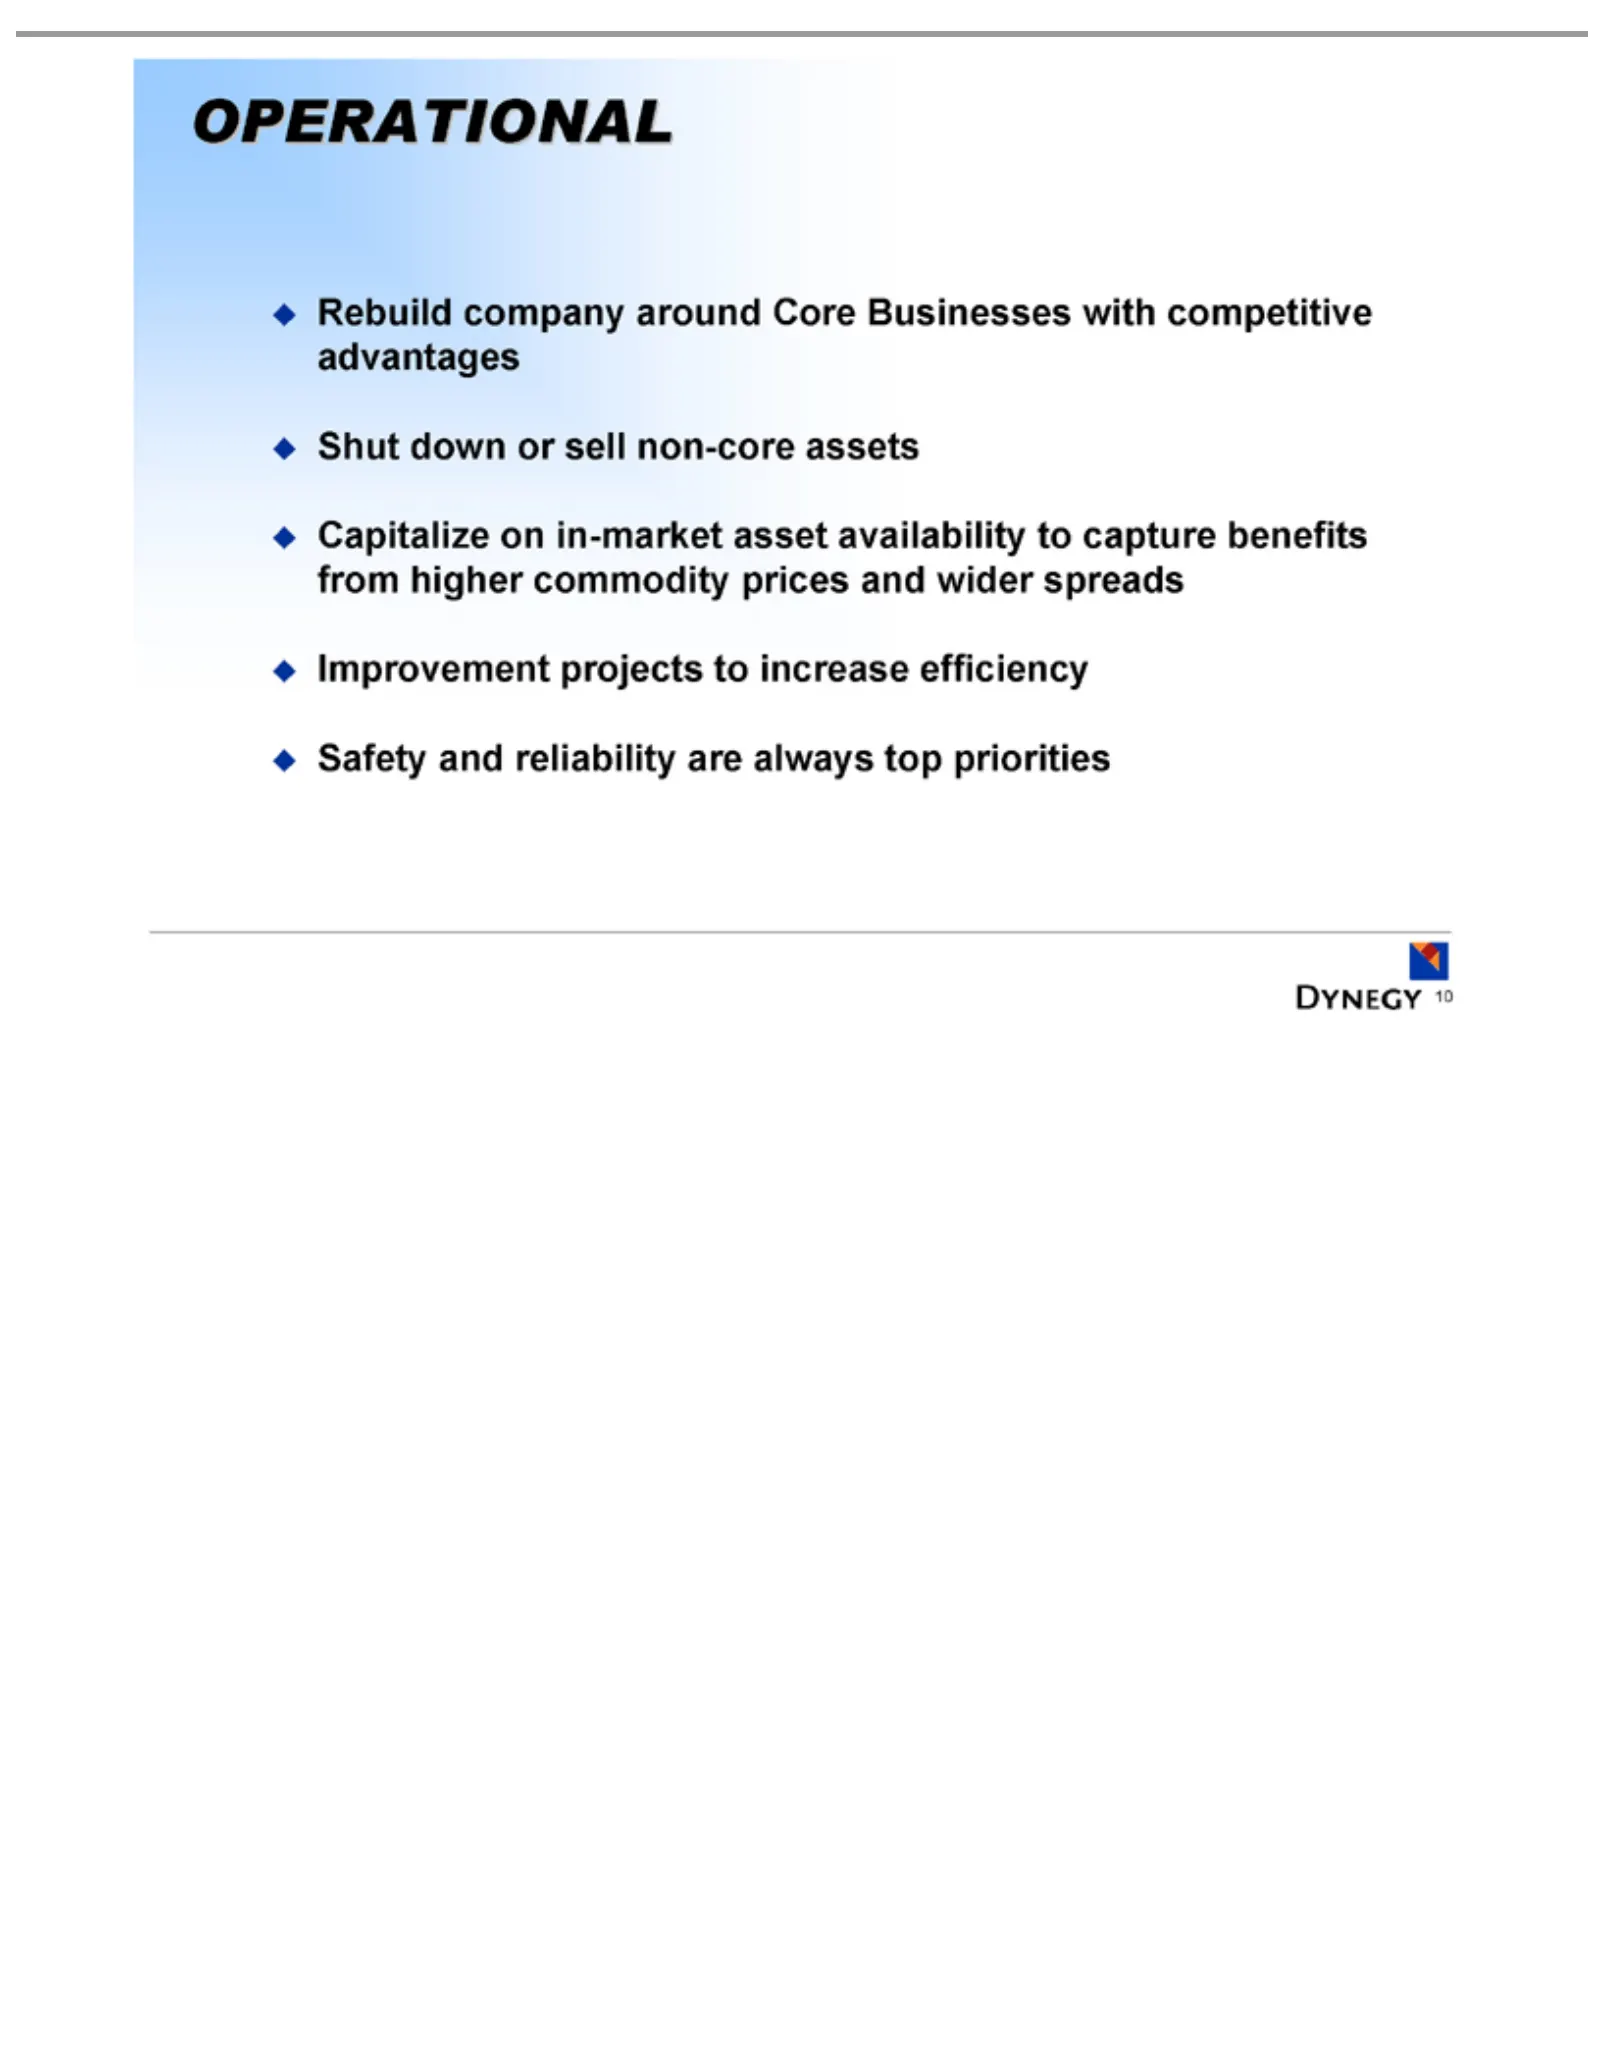
Slide 10: Operational Improvement
Rebuild OPERATIONAL Shut Capitalize Improvement Safety 10 down and company on reliability or in-market projects sell non-core around are toasset increase always Core assets availability Businesses top efficiency priorities towith capture competitive benefits advantages from higher commodity prices a
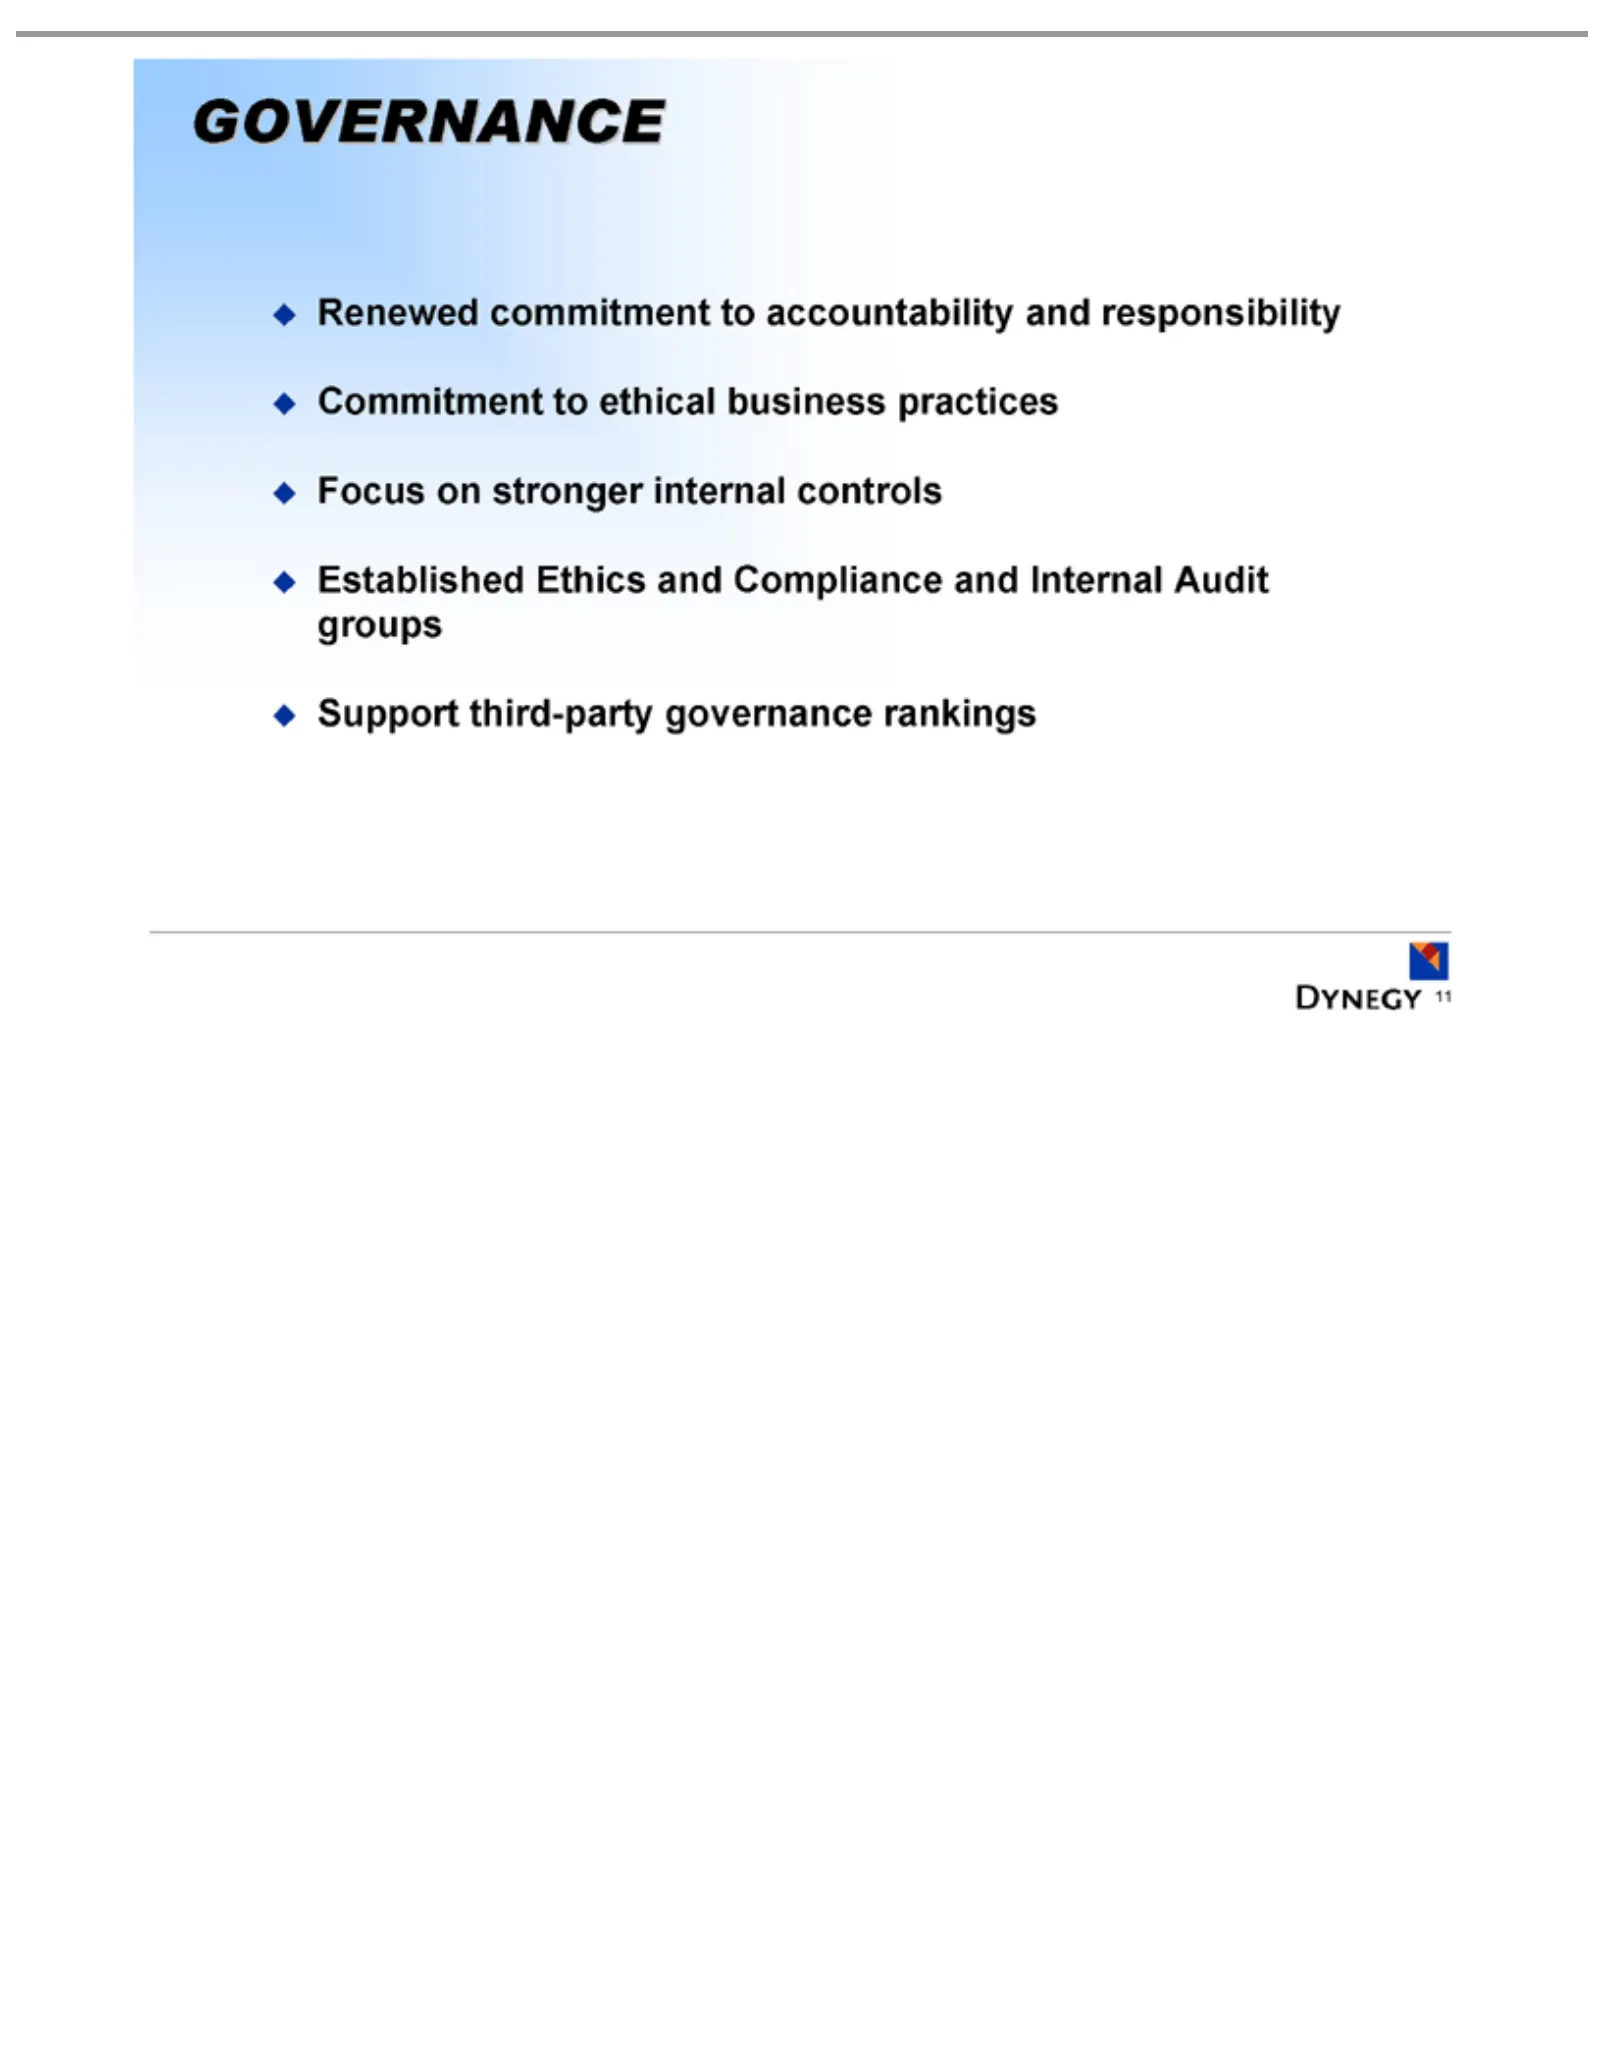
Slide 11: Renewed Governance
Renewedthird-party GOVERNANCE Established Support 11 commitment Ethics and governance to Compliance accountability rankings and Internal and responsibility Audit groups Commitment to ethical business practices Focus on stronger internal controls
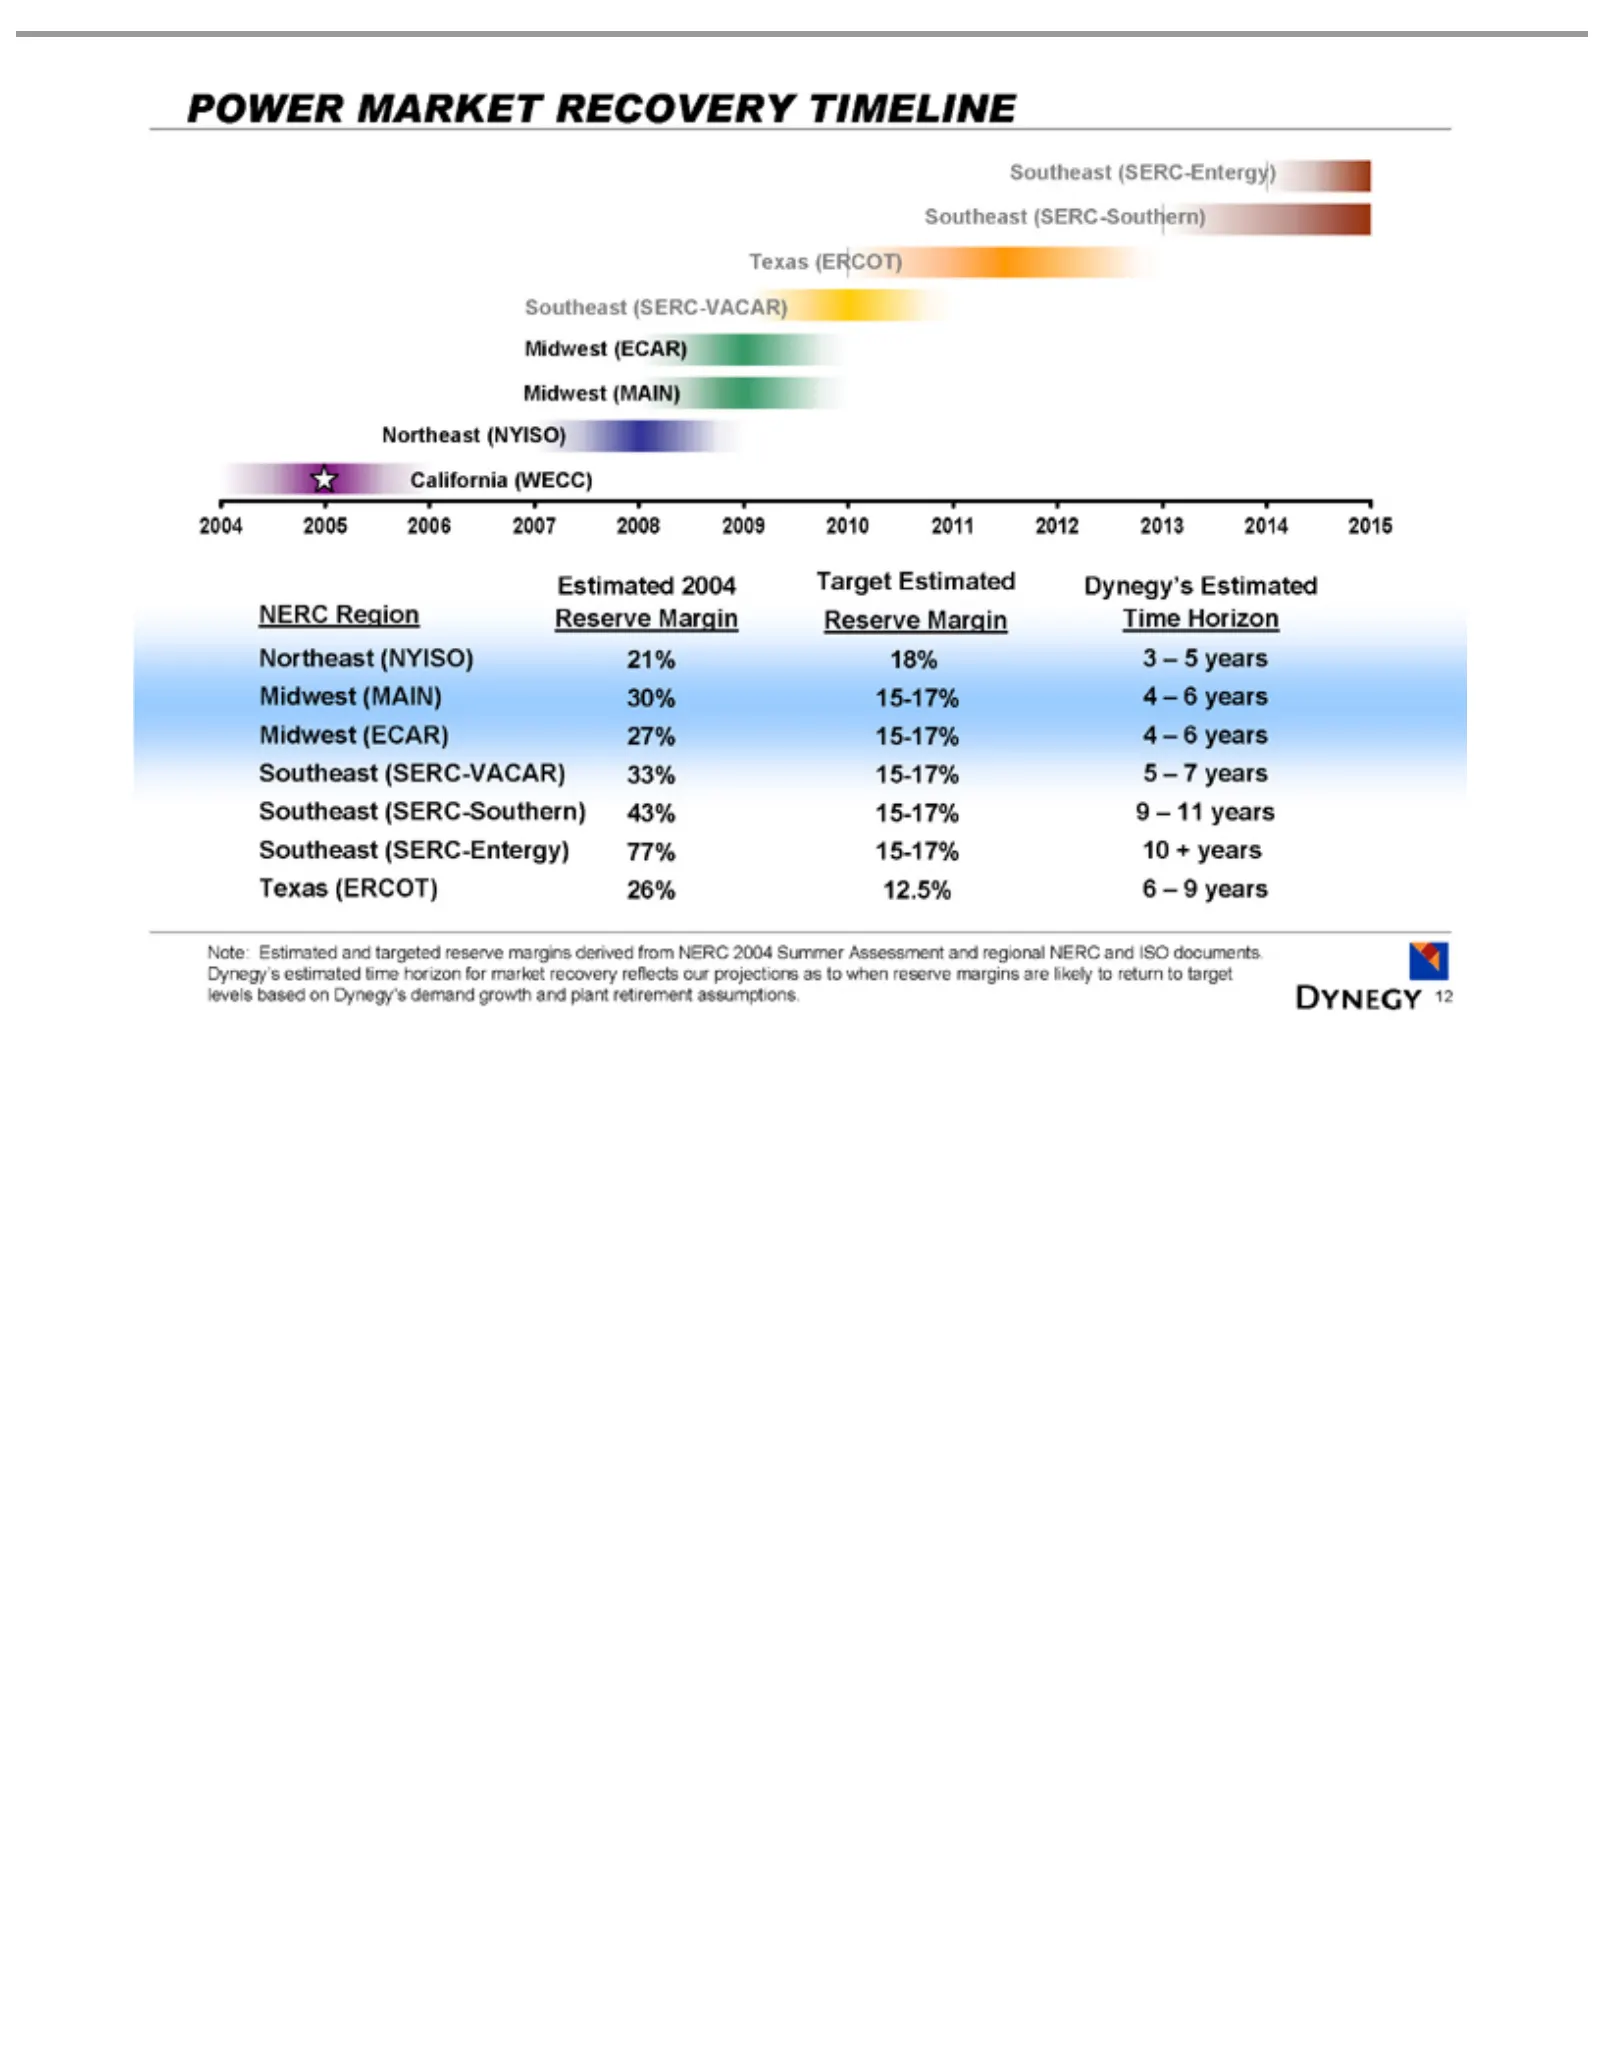
Slide 12: Power Market Recovery Timeline
POWER California 2004 Estimated NERC Northeast Midwest Southeast Texas Note: our 12 projections 2005 Estimated (ERCOT) Region MARKET (MAIN) (ECAR) (NYISO) (SERC-VACAR) (SERC-Southern) (SERC-Entergy) 2004 (WECC) 2006Reserve as Target and 2007 26% 30% 27% to21% RECOVERY when targeted 12.5% 2008 Estima
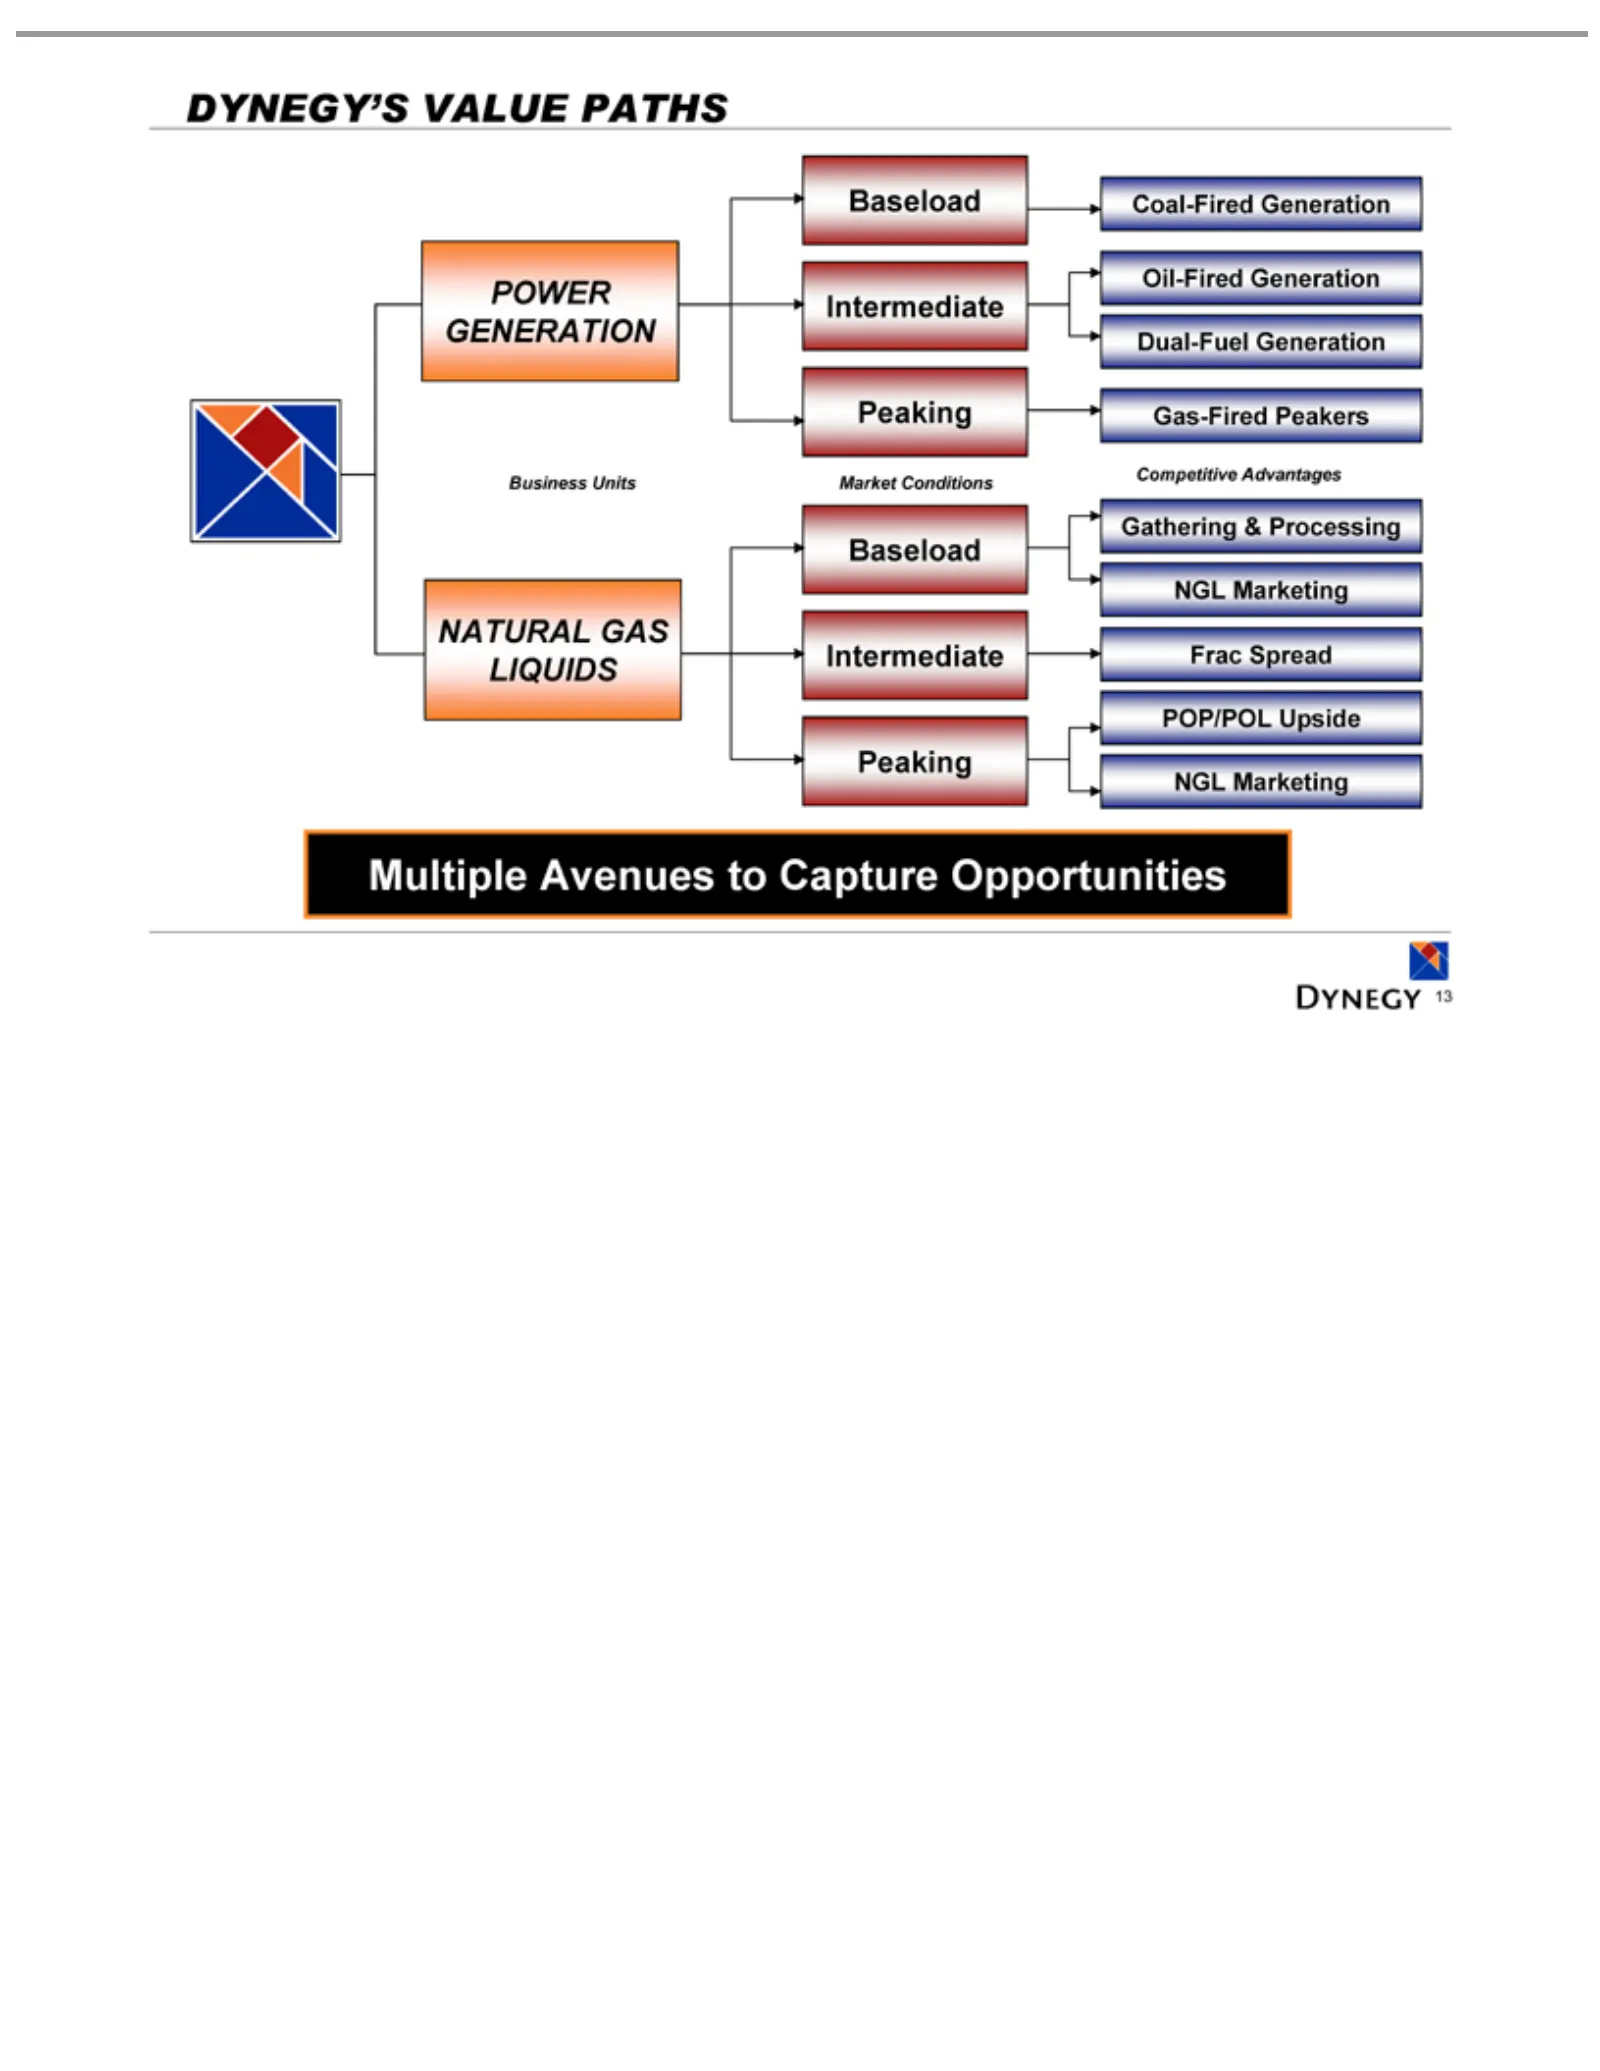
Slide 13: Dynegy's Value Paths
DYNEGY’S POWER Business NATURAL Market LIQUIDS Coal-Fired Peaking Intermediate Baseload Oil-Fired Dual-Fuel Gas-Fired Competitive Gathering Frac POP/POL NGL Multiple 13 Spread Marketing Conditions Avenues GENERATION Units Generation Upside & Peakers Generation Generation GAS Advantages Processing VA
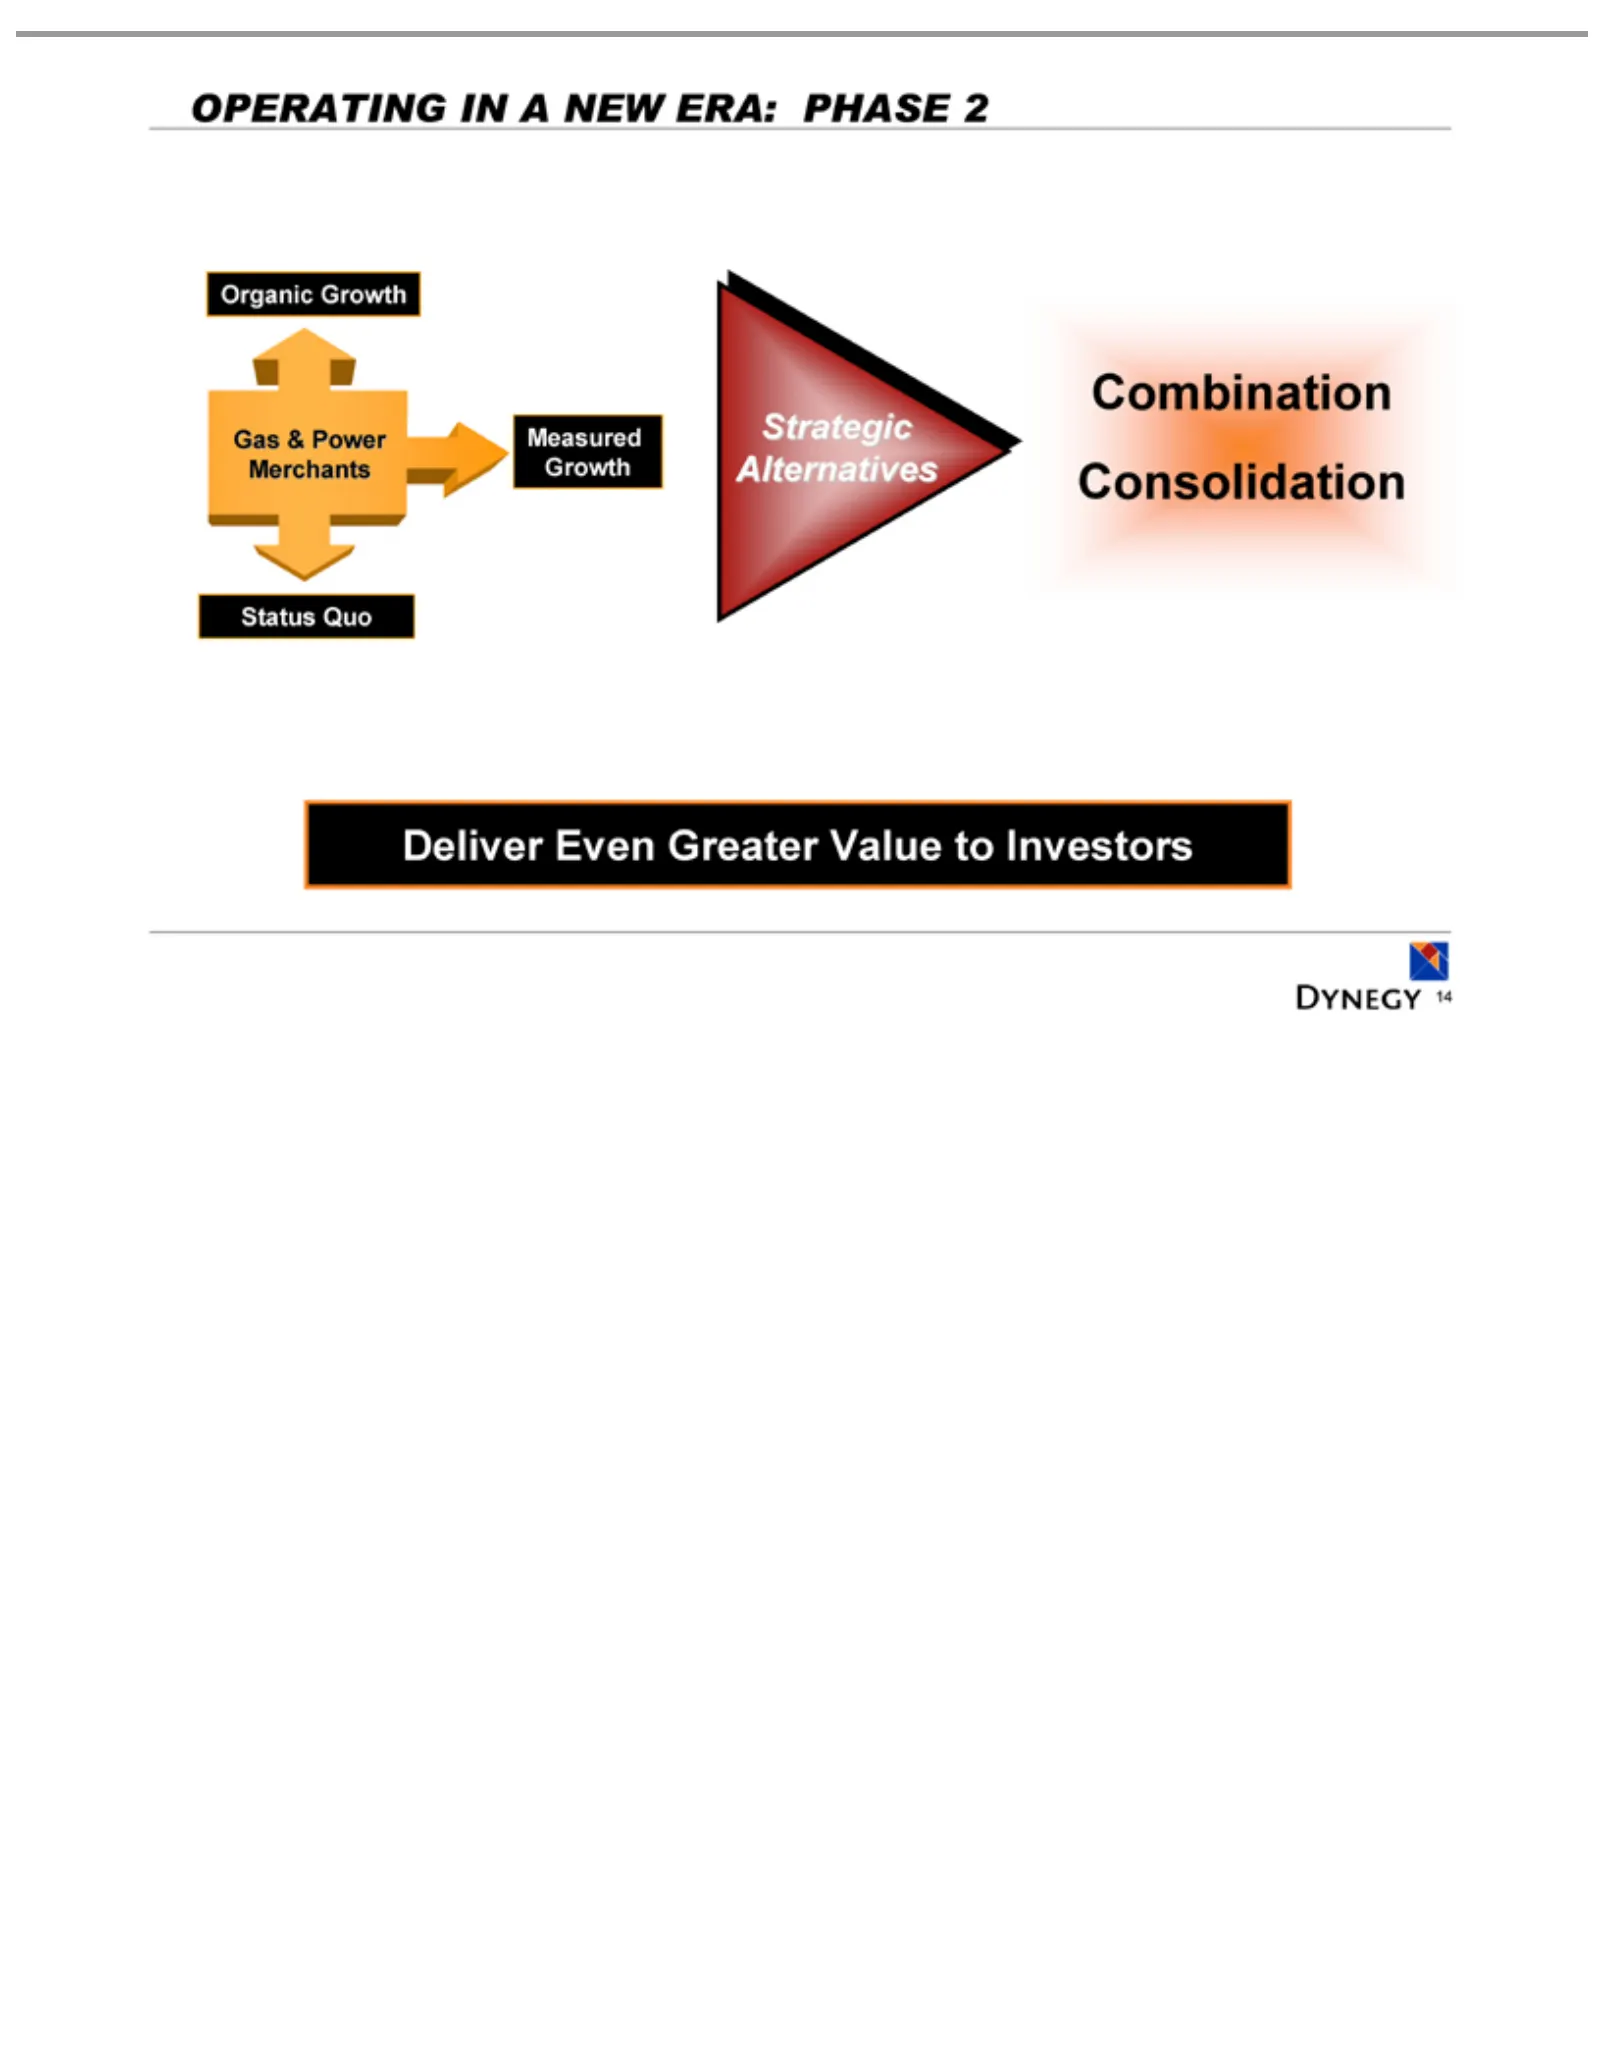
Slide 14: Operating Results: A New Era Phase 2
OPERATING Organic Gas Status Measured Strategic Combination Deliver 14 & Quo Power Even Growth Alternatives Growth Consolidation Greater Merchants IN A NEWValue ERA: to Investors PHASE 2
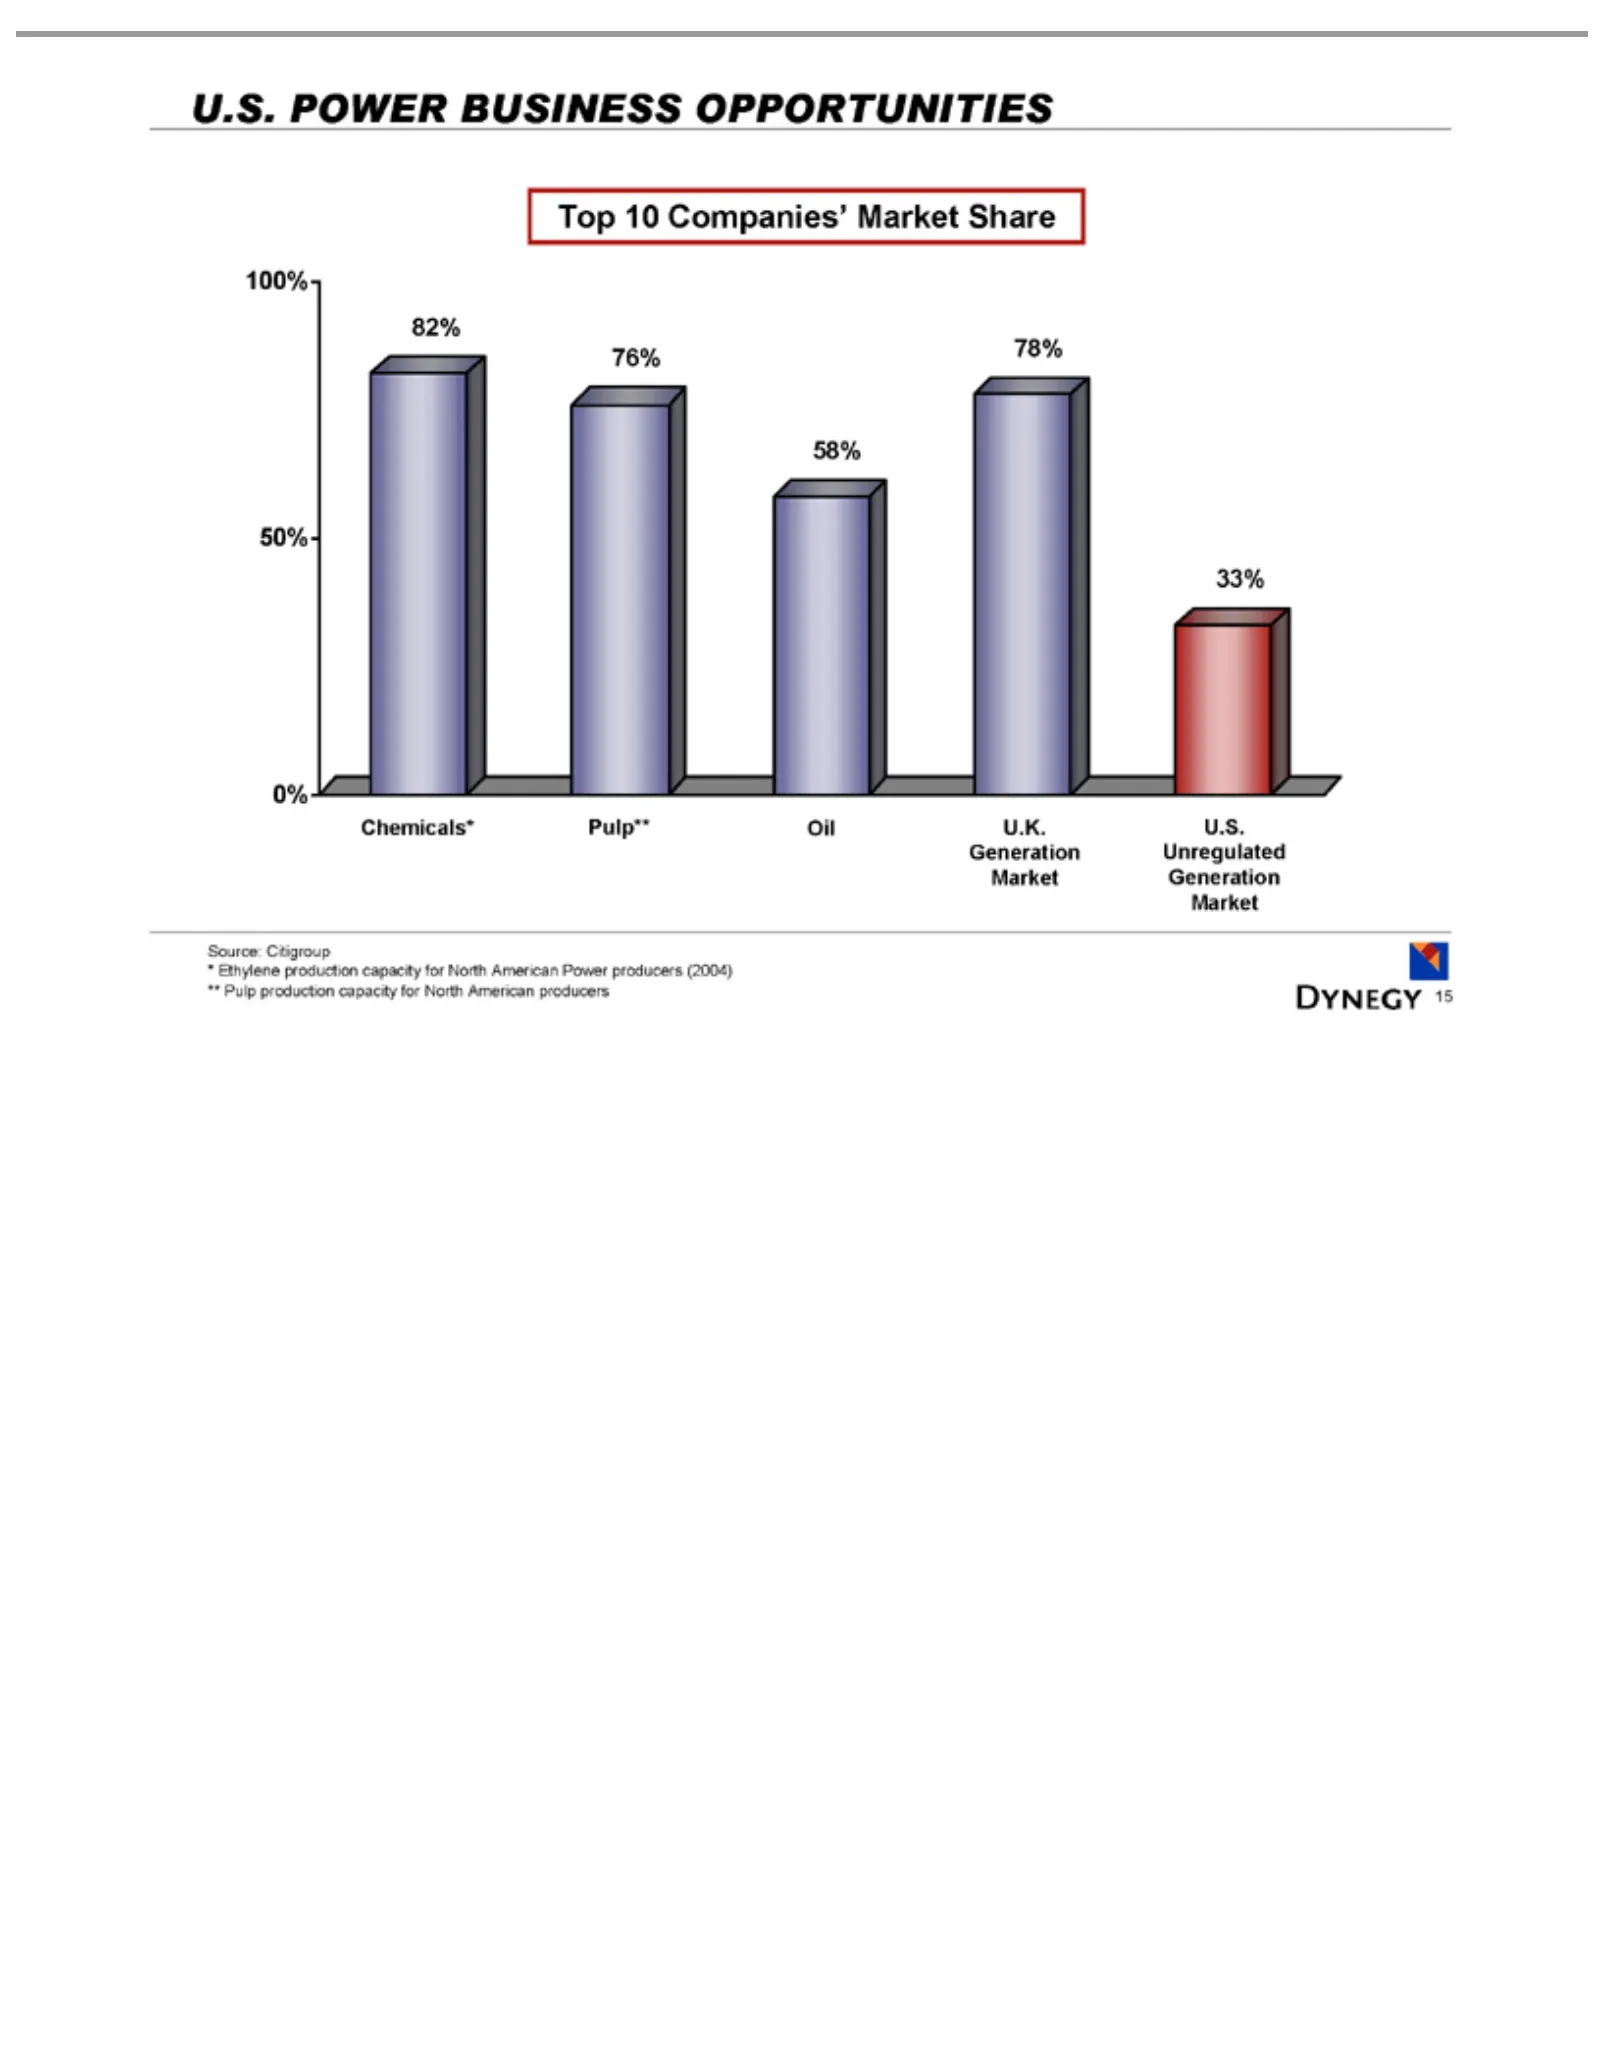
Slide 15: U.S. Power Business Opportunities
U.S. Top 100% Chemicals* 33% 78% 58% 76% 82% Source: * 15Ethylene 10 POWER 50% Companies’ Citigroup production 0% Pulp** BUSINESS Market Oilcapacity U.K. OPPORTUNITIES Share U.S. forGeneration North American Unregulated Power producers Market Generation (2004) **Market Pulp production capacity for N
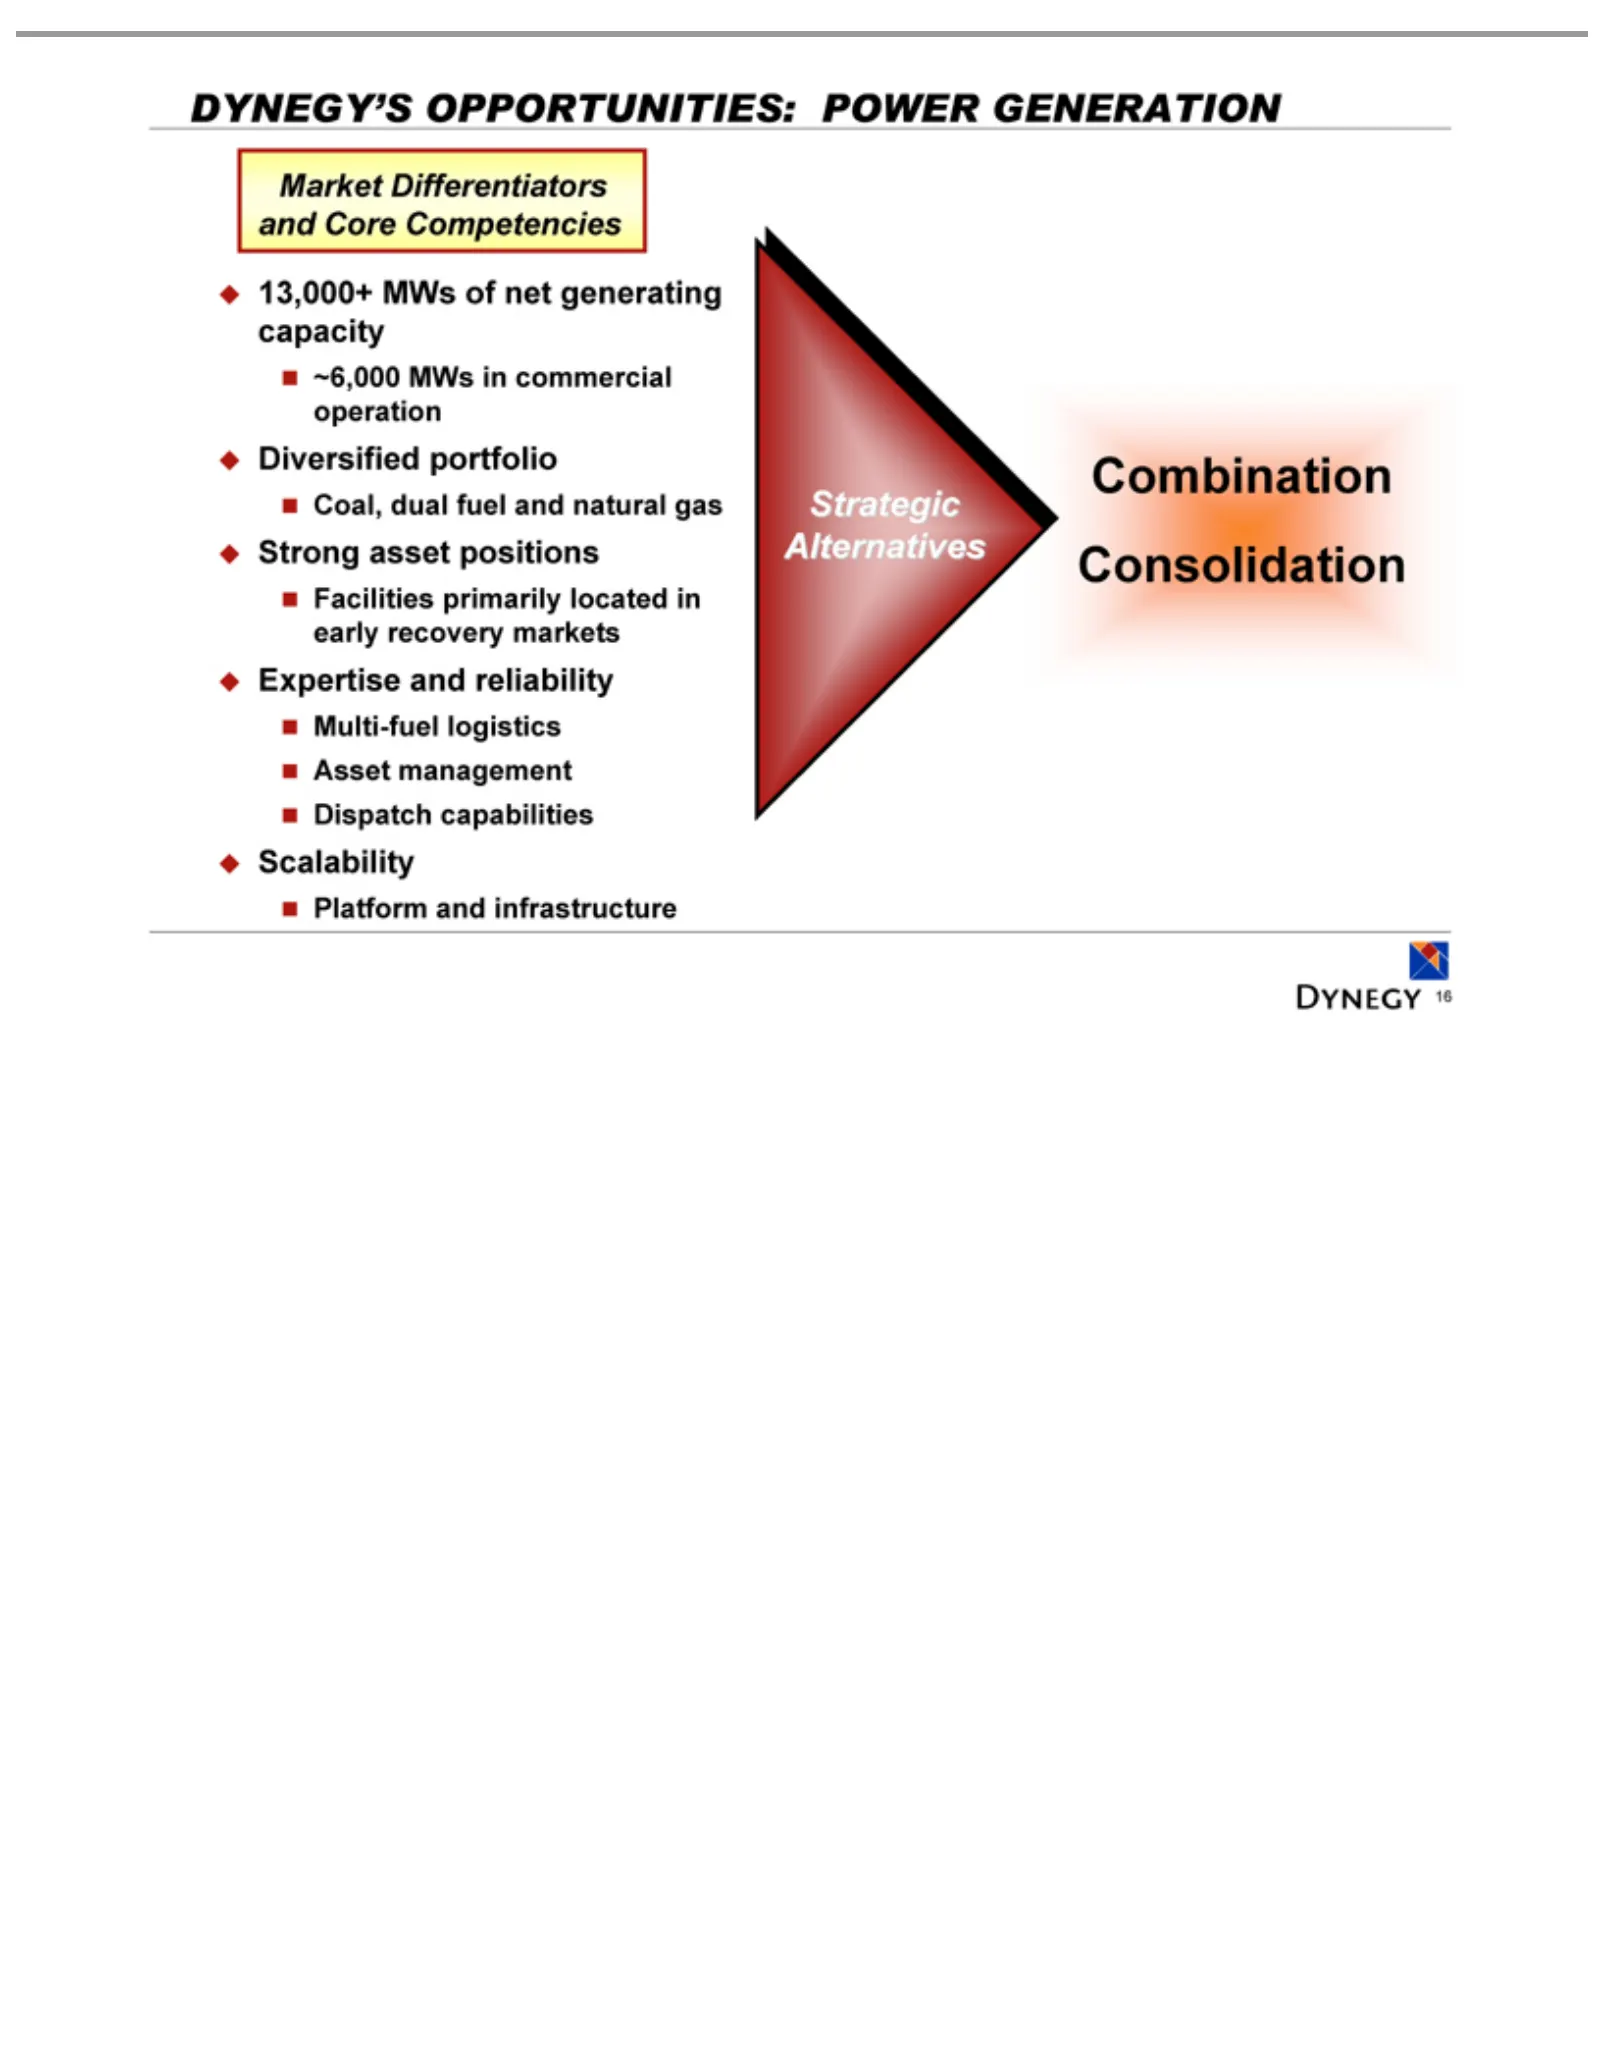
Slide 16: Dynegy's Power Generation Opportunities
DYNEGY’S Market 13,000+ ~6,000 Diversified Coal, Strong Facilities Expertise Multi-fuel Platform Scalability Strategic Combination 16 dual asset MWs Differentiators MWs Alternatives and primarily and logistics fuel portfolio positions OPPORTUNITIES: infrastructure Consolidation in reliability of and
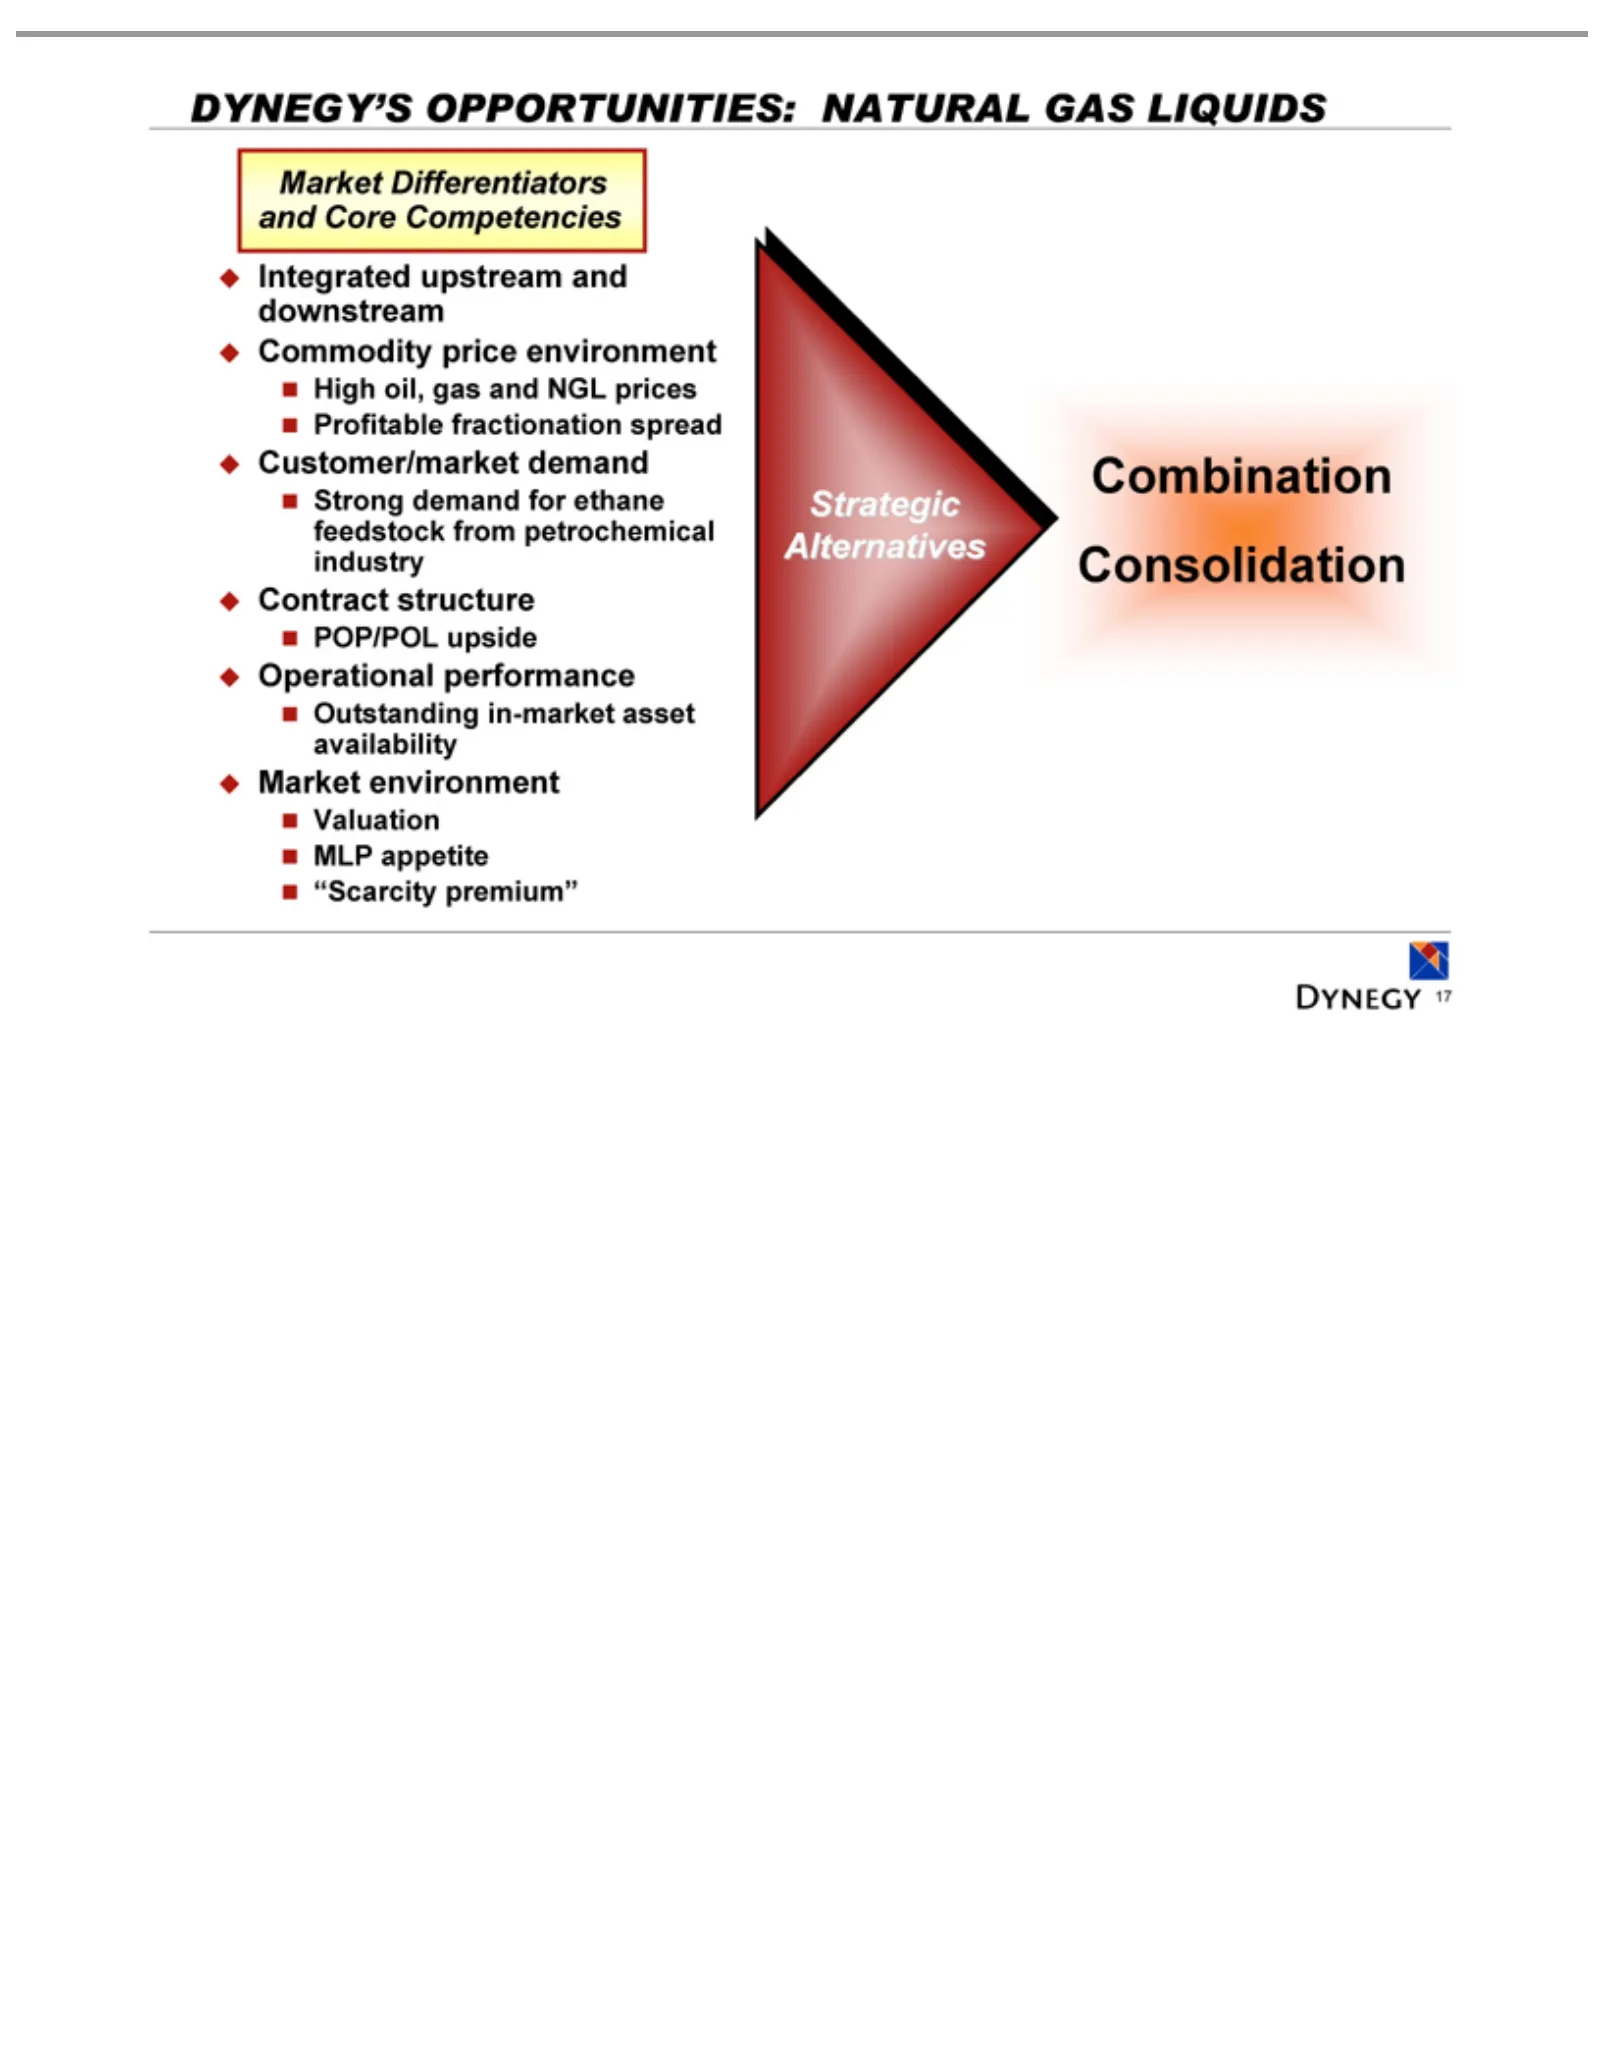
Slide 17: Dynegy's Natural Gas Liquids Opportunities
DYNEGY’S Integrated High Customer/market Strong Contract POP/POL Operational Outstanding Market Valuation Strategic Combination 17 oil, demand Differentiators environment structure Alternatives gas MLP upside upstream performance in-market OPPORTUNITIES: and Consolidation for appetite NGL demand eth
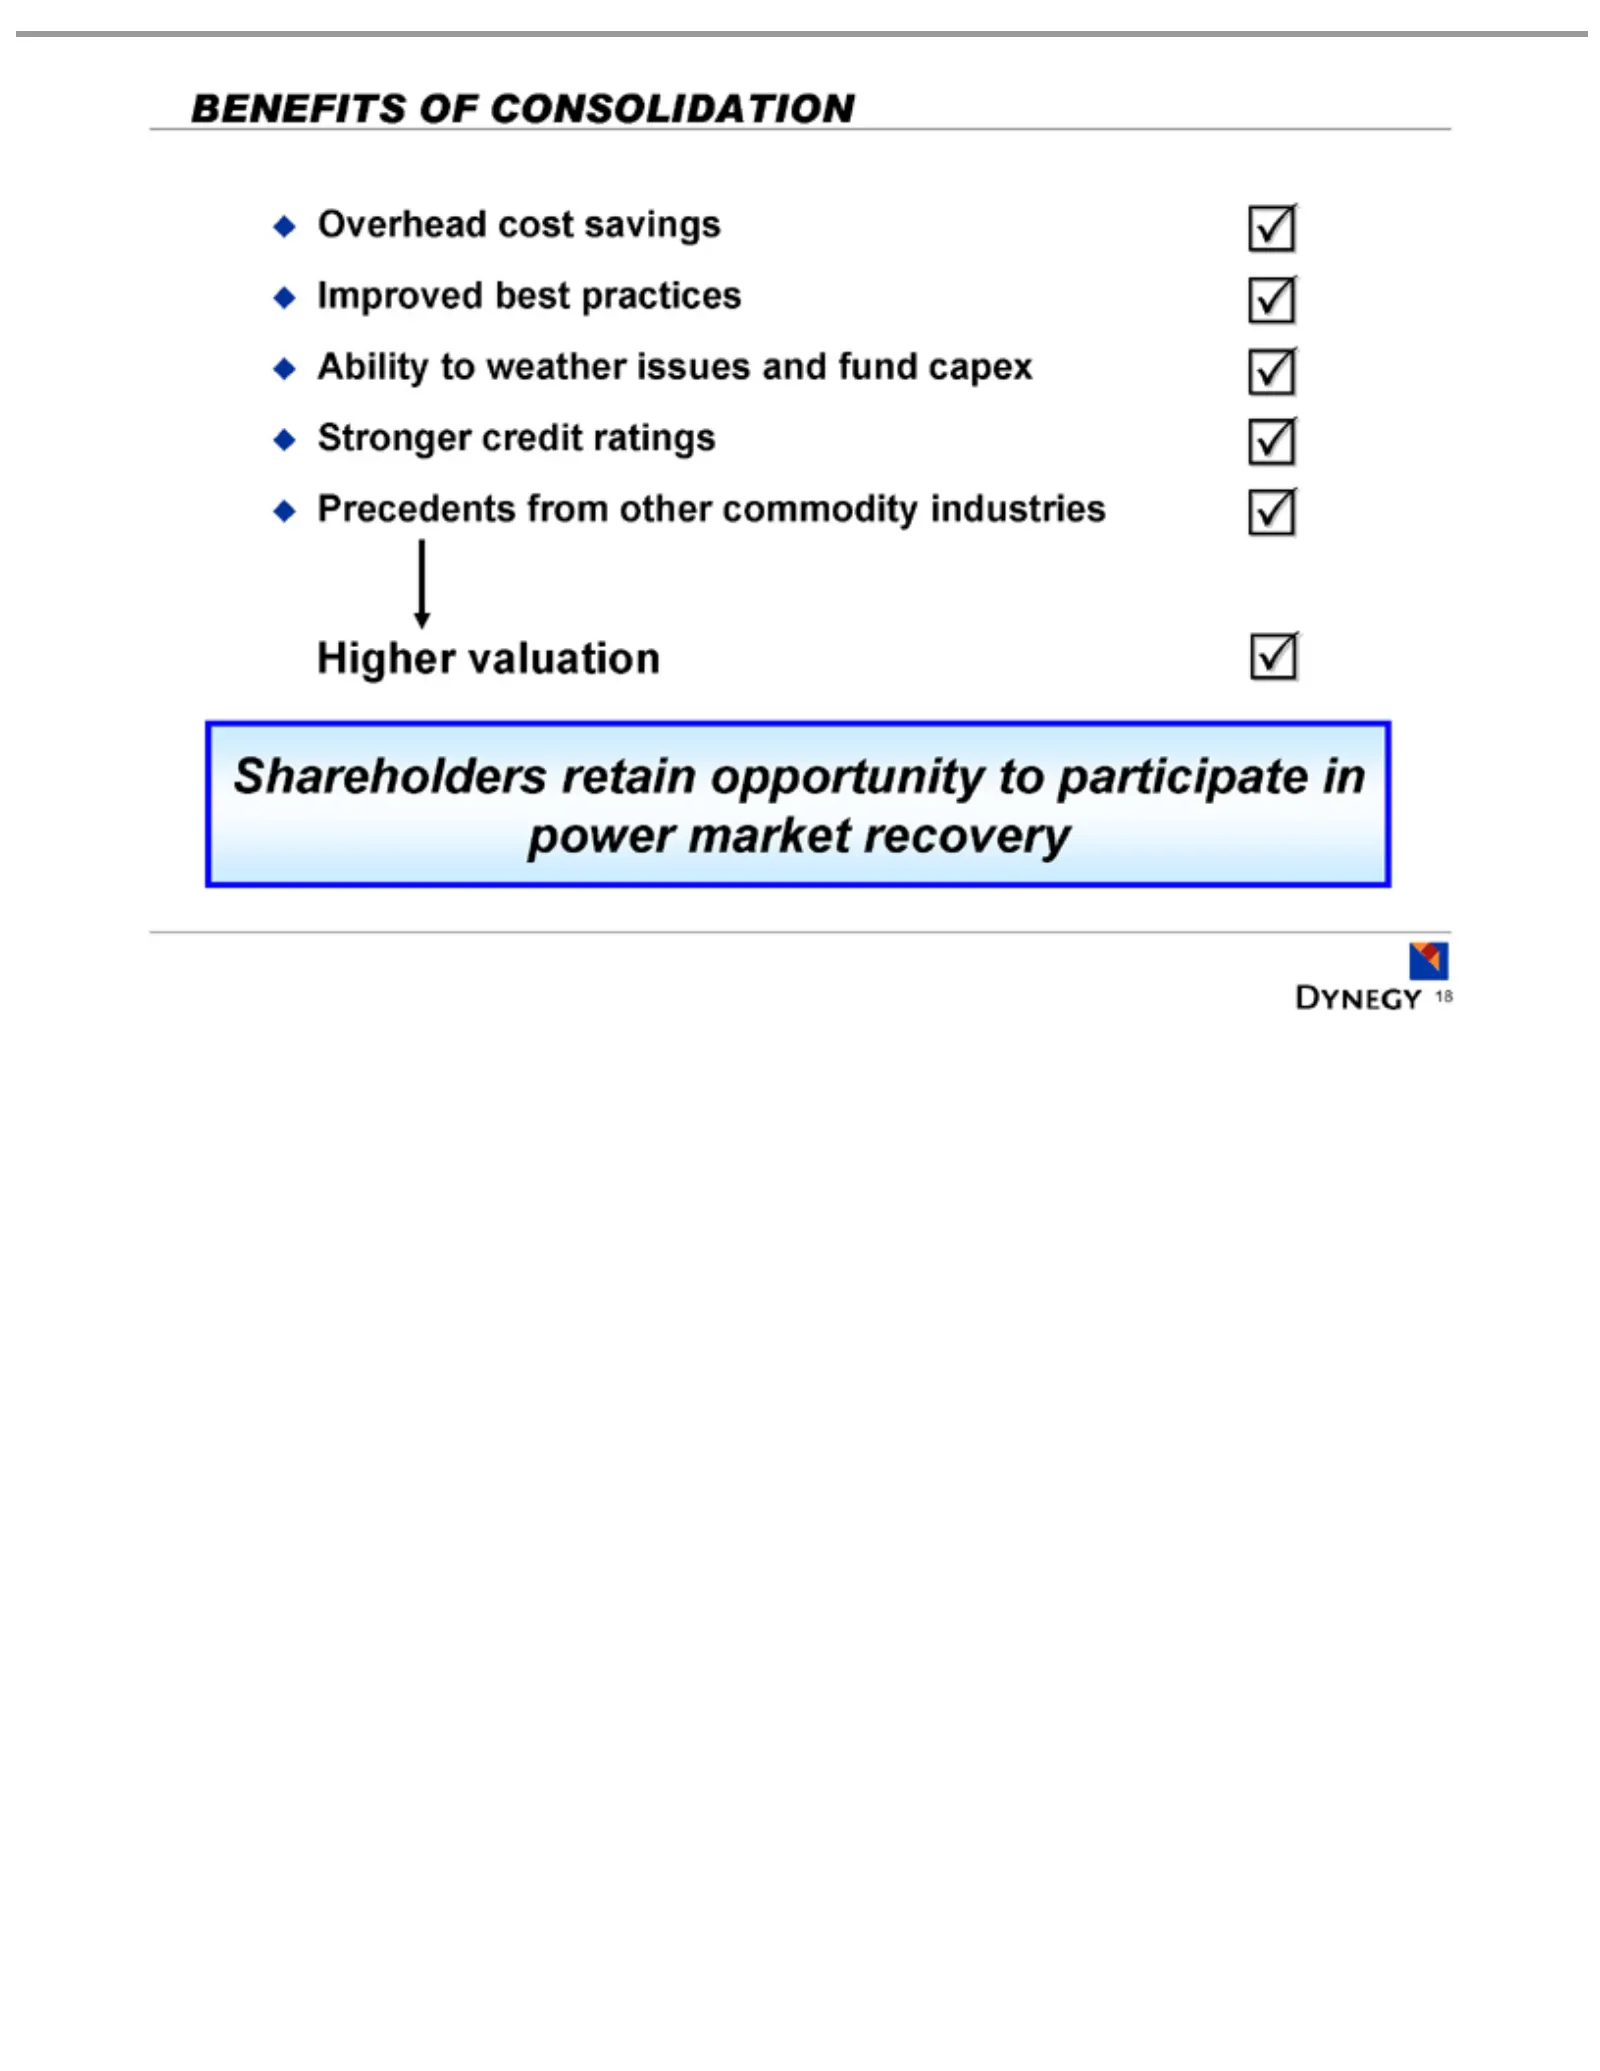
Slide 18: Benefits of Consolidation
BENEFITS Overhead Ability Higher Shareholders 18 valuation to weather cost OF retain savings CONSOLIDATION issues opportunity Improved and fund tobest participate capex practices Stronger in power creditmarket ratingsrecovery Precedents from other commodity industries
Slide 19: Appendix
APPENDIX
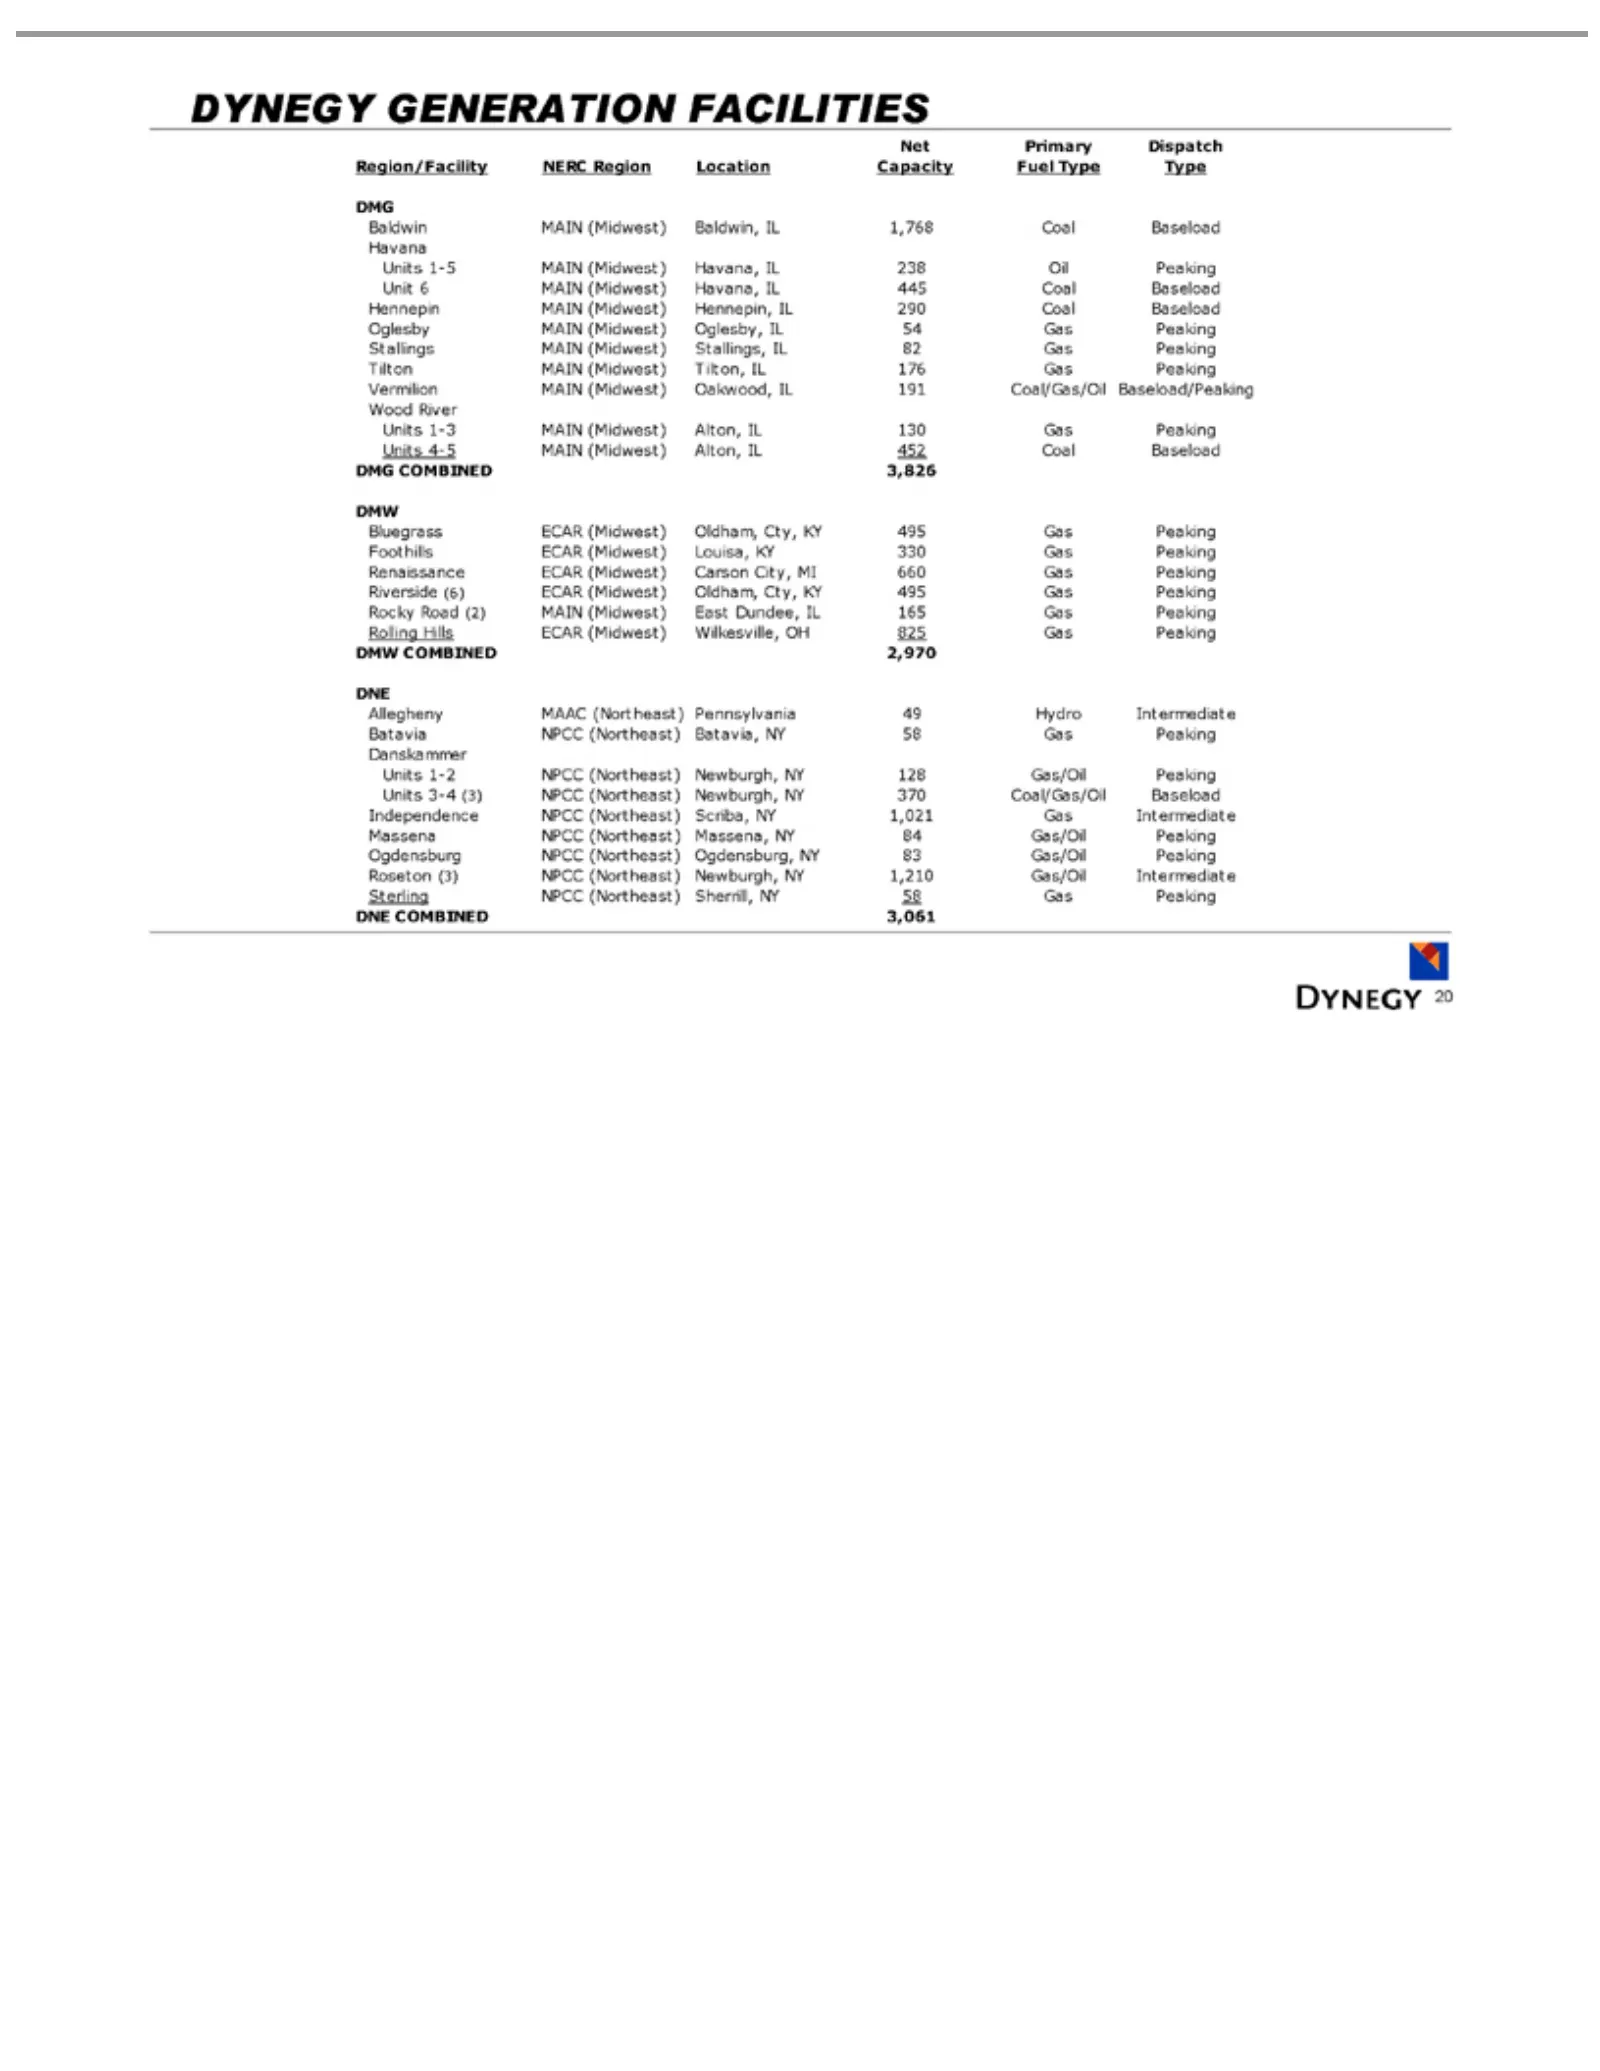
Slide 20: Dynegy Generation Facilities
DYNEGY Net Region/Facility Baldwin Havana Unit Hennepin Oglesby Stallings Tilton Vermilion Wood DMG Bluegrass Foothills Renaissance Riverside Rocky Rolling DMW Allegheny Batavia Danskammer Units Independence Massena Ogdensburg Roseton Sterling DNE 20 Primary 6COMBINED 1-5 1-3 4-5 1-2 3-4 COMBINED Ri
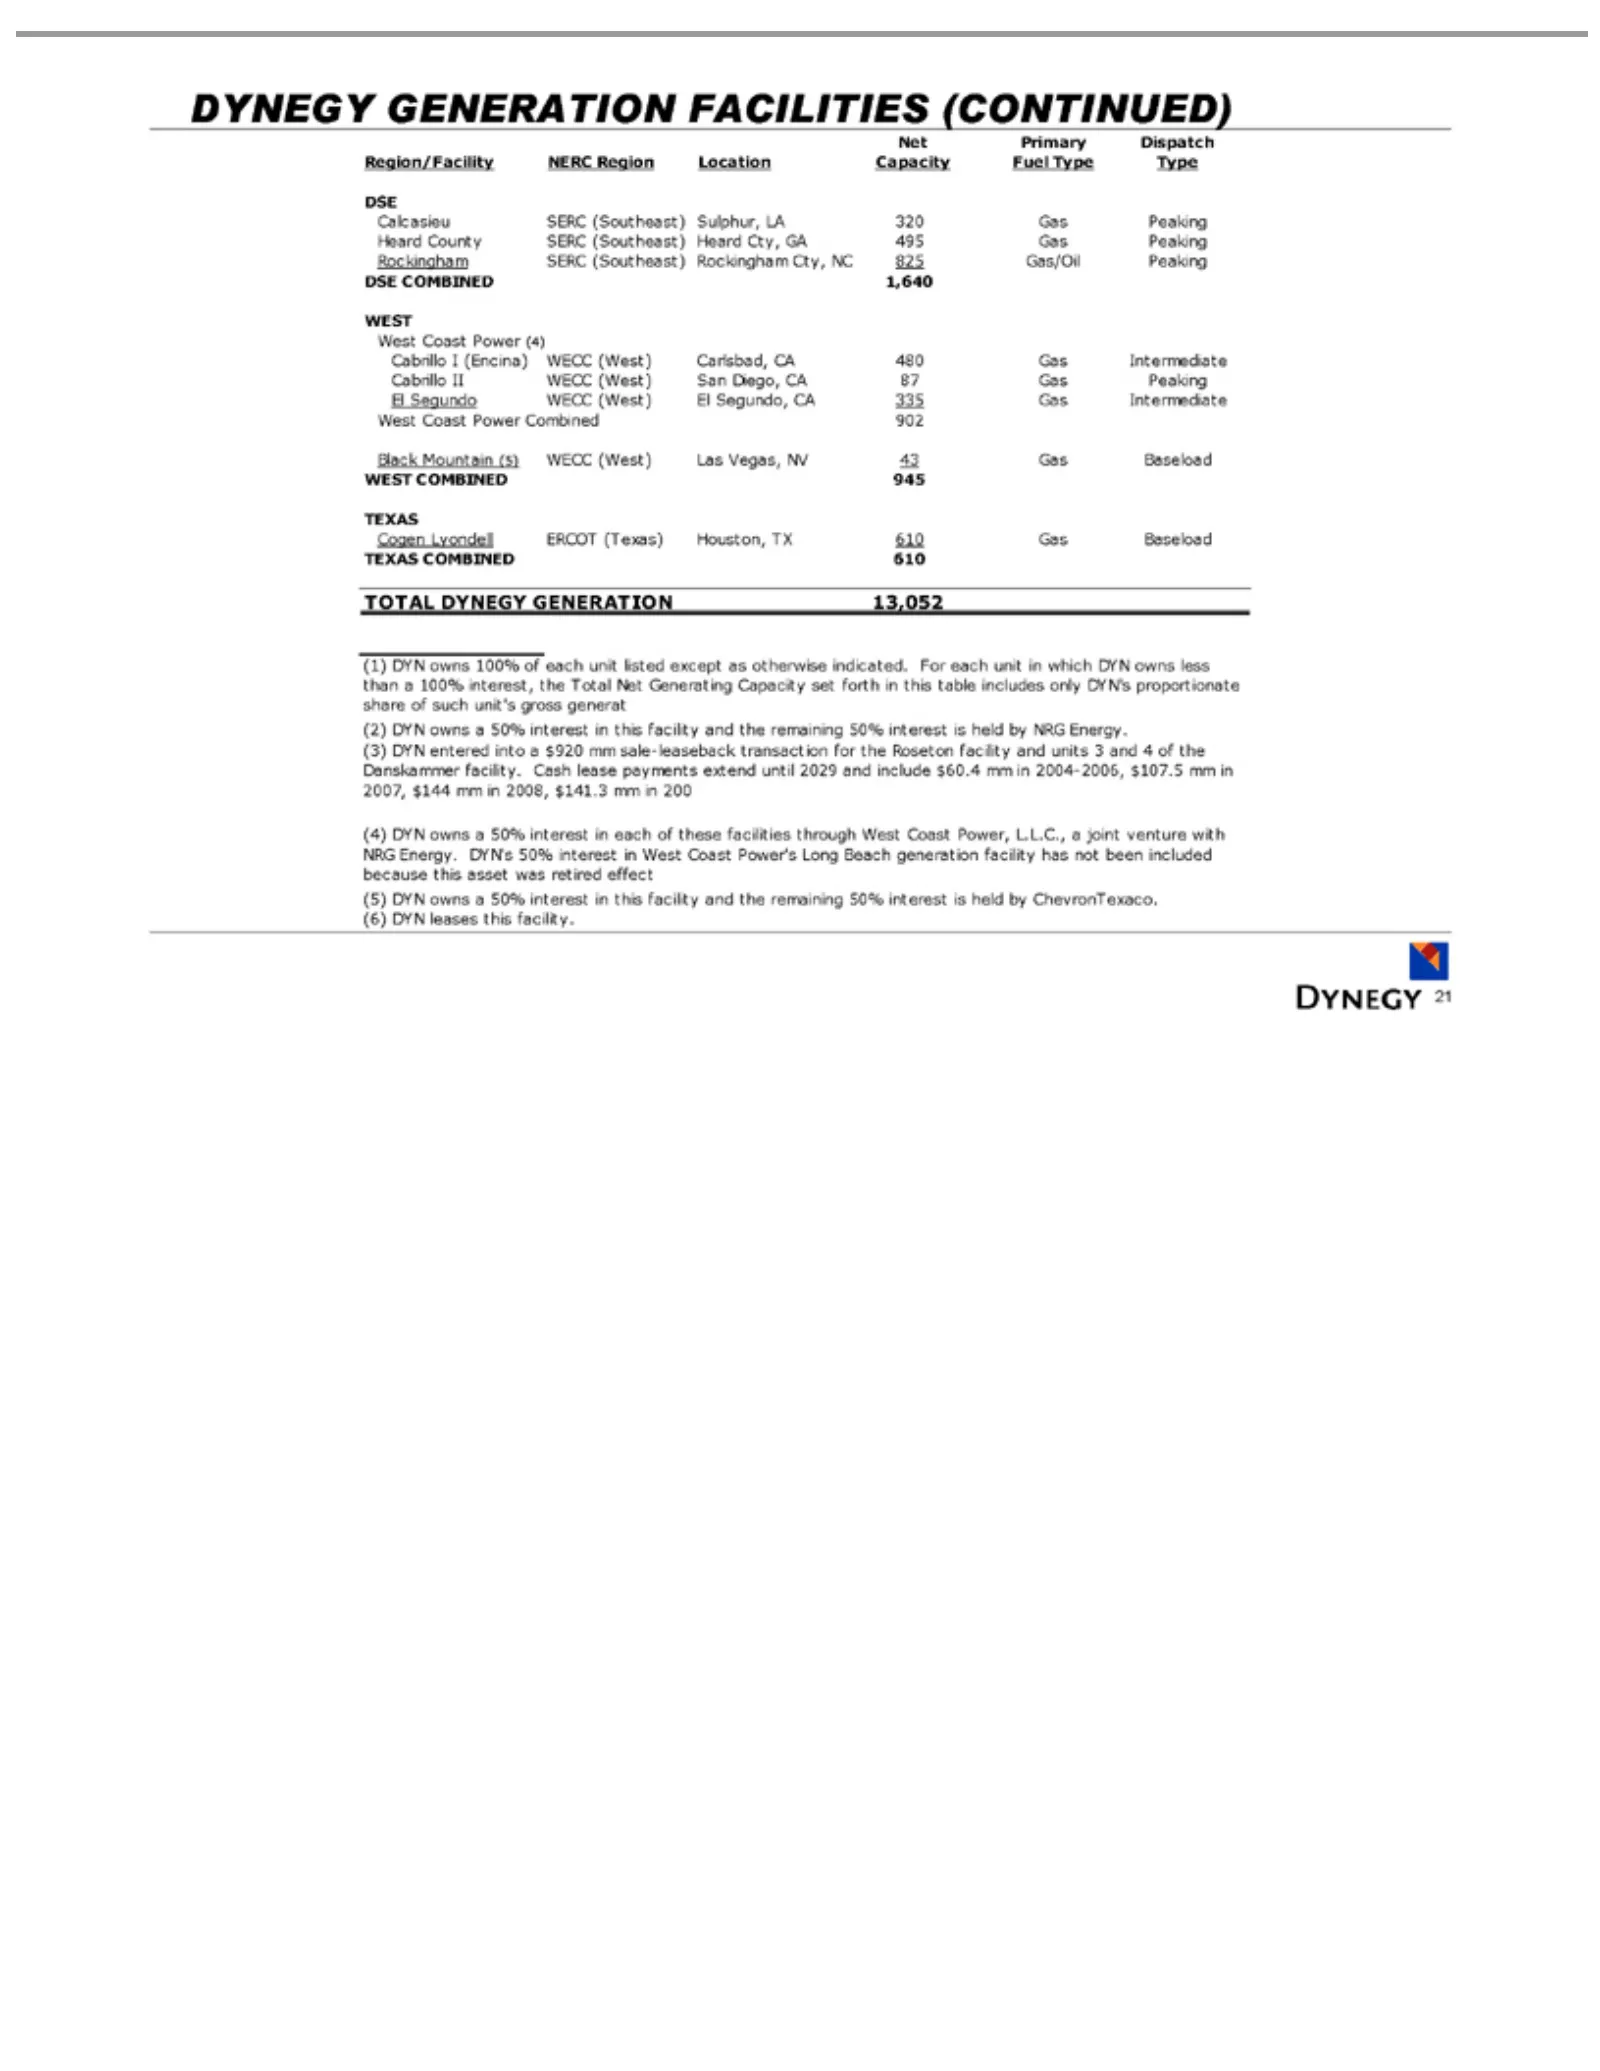
Slide 21: Dynegy Generation Facilities (Continued)
DYNEGY Net Region/Facility Calcasieu Heard Rockingham DSE Cabrillo El West Black WEST Cogen TEXAS TOTAL (1) only (3) 2004-2006, (4) facility (6) 21 Segundo DYN Primary DYN’s COMBINED Coast Mountain County Lyondell COMBINED has DYNEGY COMBINED Ileases II entered owns (Encina) SERC WECC GENERATION not
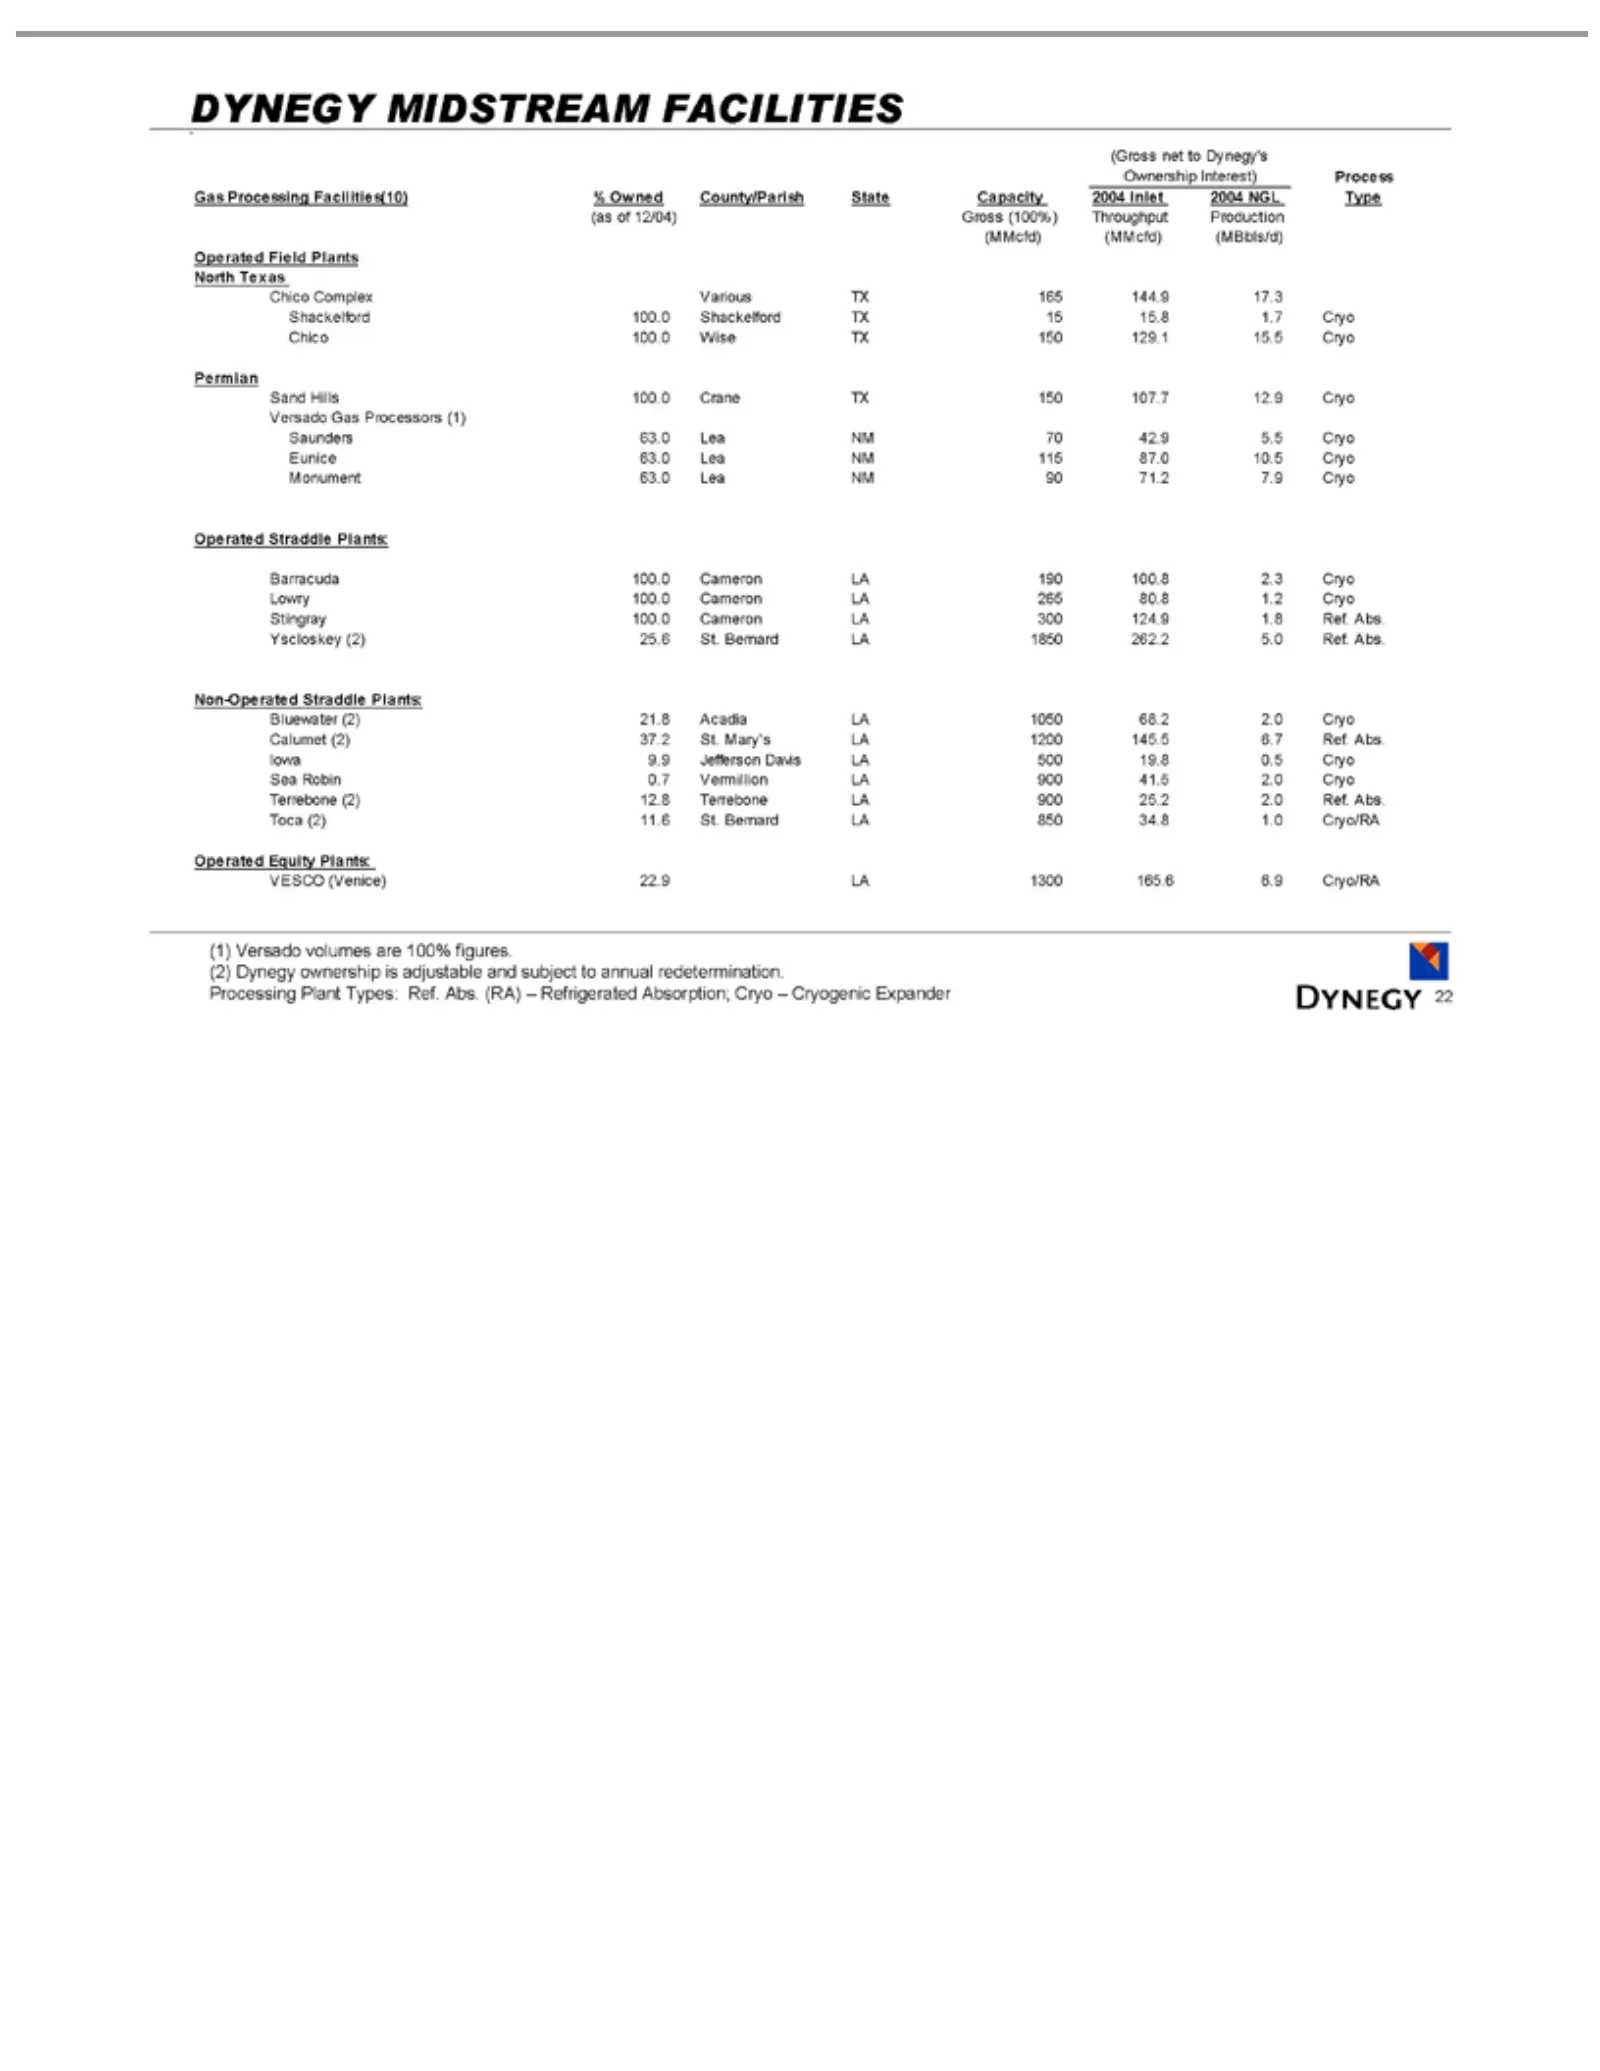
Slide 22: Dynegy Midstream Facilities
DYNEGY (Gross Ownership Gas (as (MMcfd) North Shackelford Chico Sand Permian Versado Saunders Eunice Monument Barracuda Lowry Stingray Yscloskey Non-Operated Bluewater Calumet Iowa Sea Terrebone Toca Operated VESCO (1) (2) Processing 22 Versado Dynegy of Robin Processing (2) 9.9 Hills 12/04) Texas C
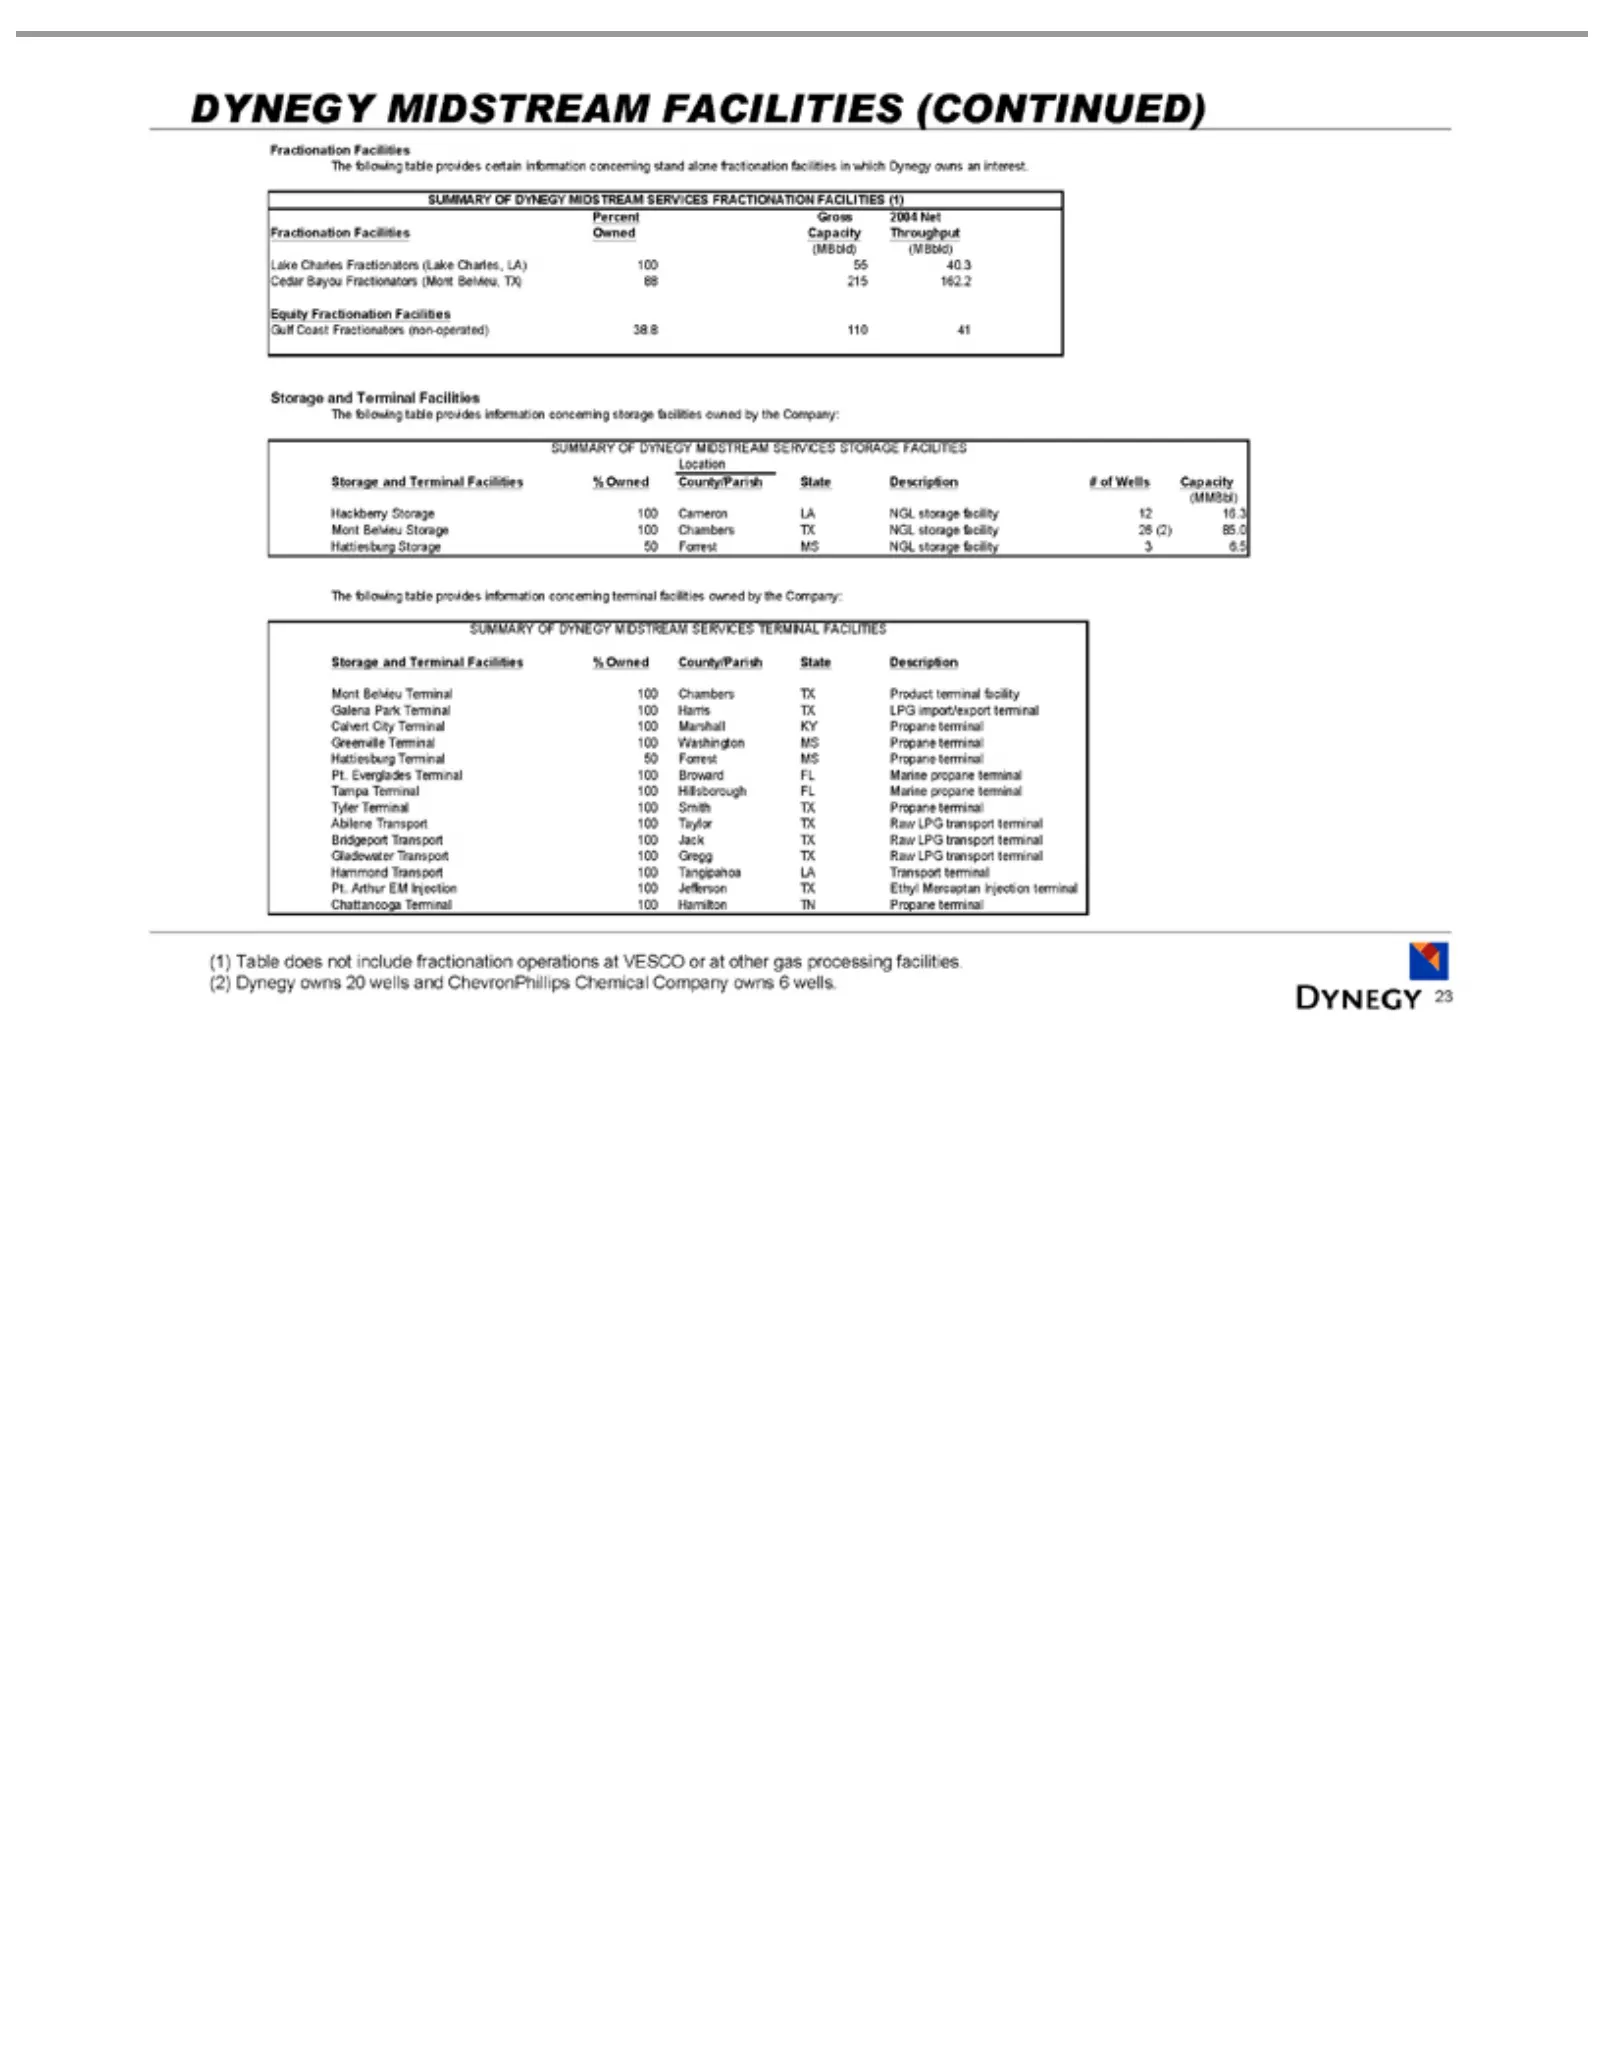
Slide 23: Summary of Dynegy Midstream Facilities
DYNEGY Percent Fractionation (MBbld) Lake Cedar Equity Gulf Location Hackberry (MMBbl) The SUMMARY Storage Mont Galena Calvert Greenville Hattiesburg Tampa Tyler Abilene Bridgeport Gladewater Hammond Pt. Chattanooga (1) 23 Arthur Everglades Table following Coast Charles Terminal Belvieu Bayou Fracti
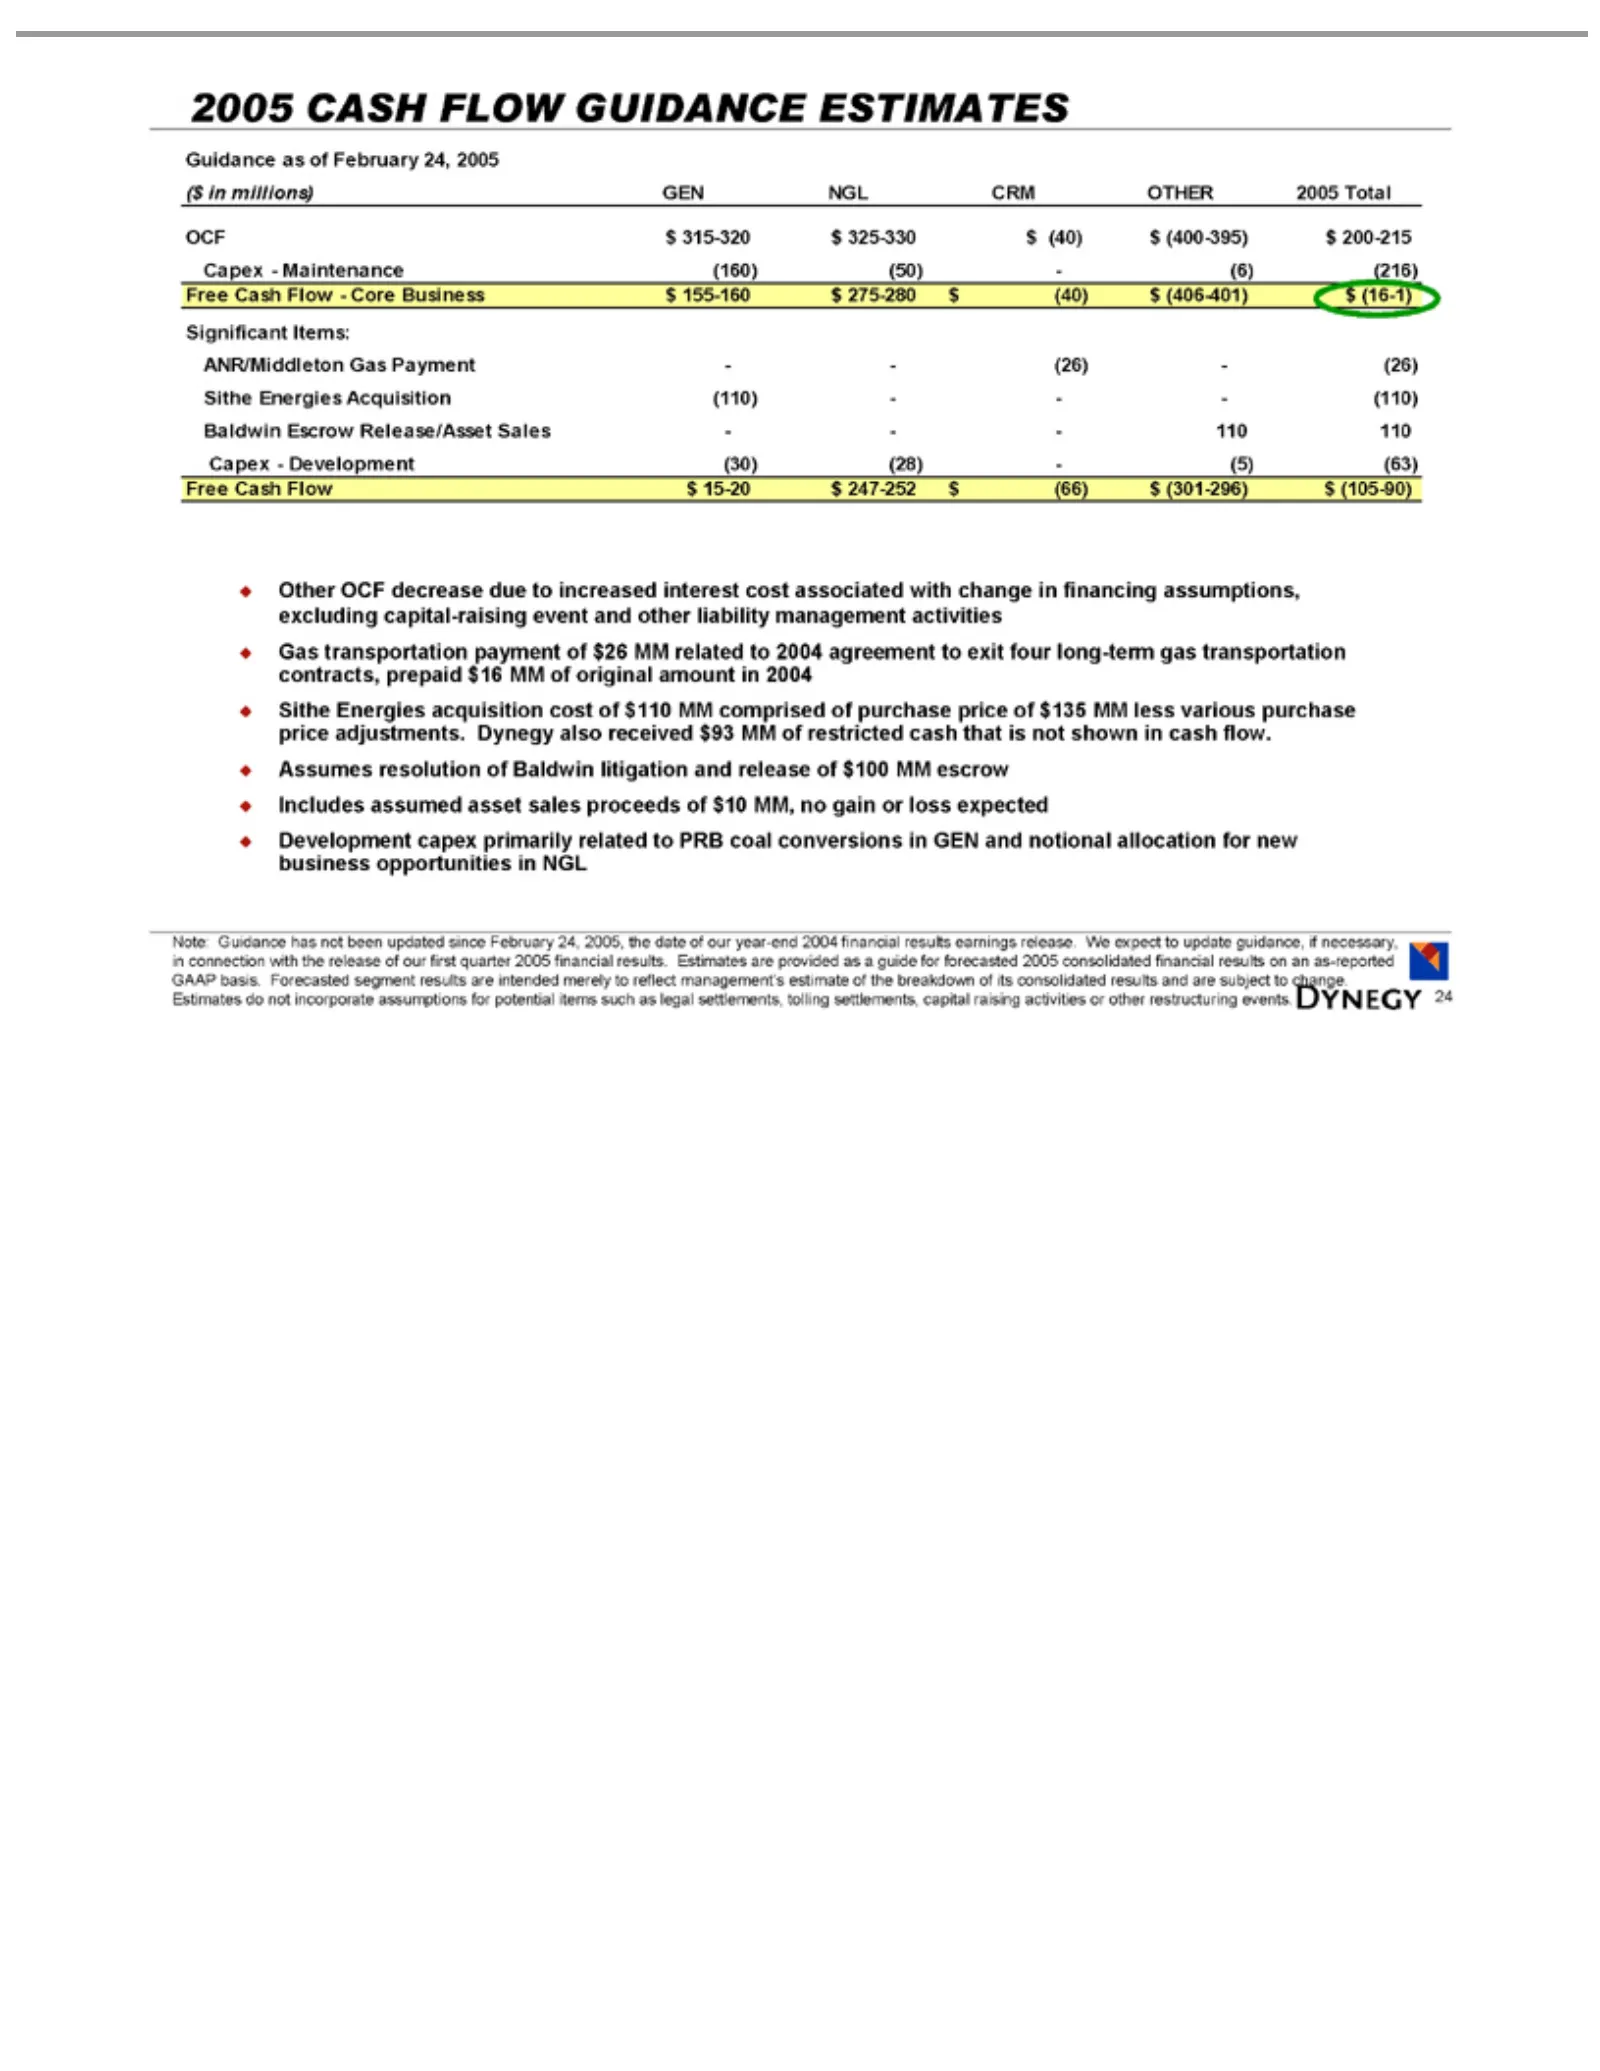
Slide 24: 2005 Cash Flow Guidance
2005 Guidance ($in OCF Significant ANR/Middleton Sithe Baldwin Capex Free Other payment of Assumes Development Note: release intended settlements, 24 purchase millions) Cash $315-320 CASH Energies Guidance OCF -ofDevelopment Maintenance Escrow of merely resolution as our Flow Items: decrease $26 pri
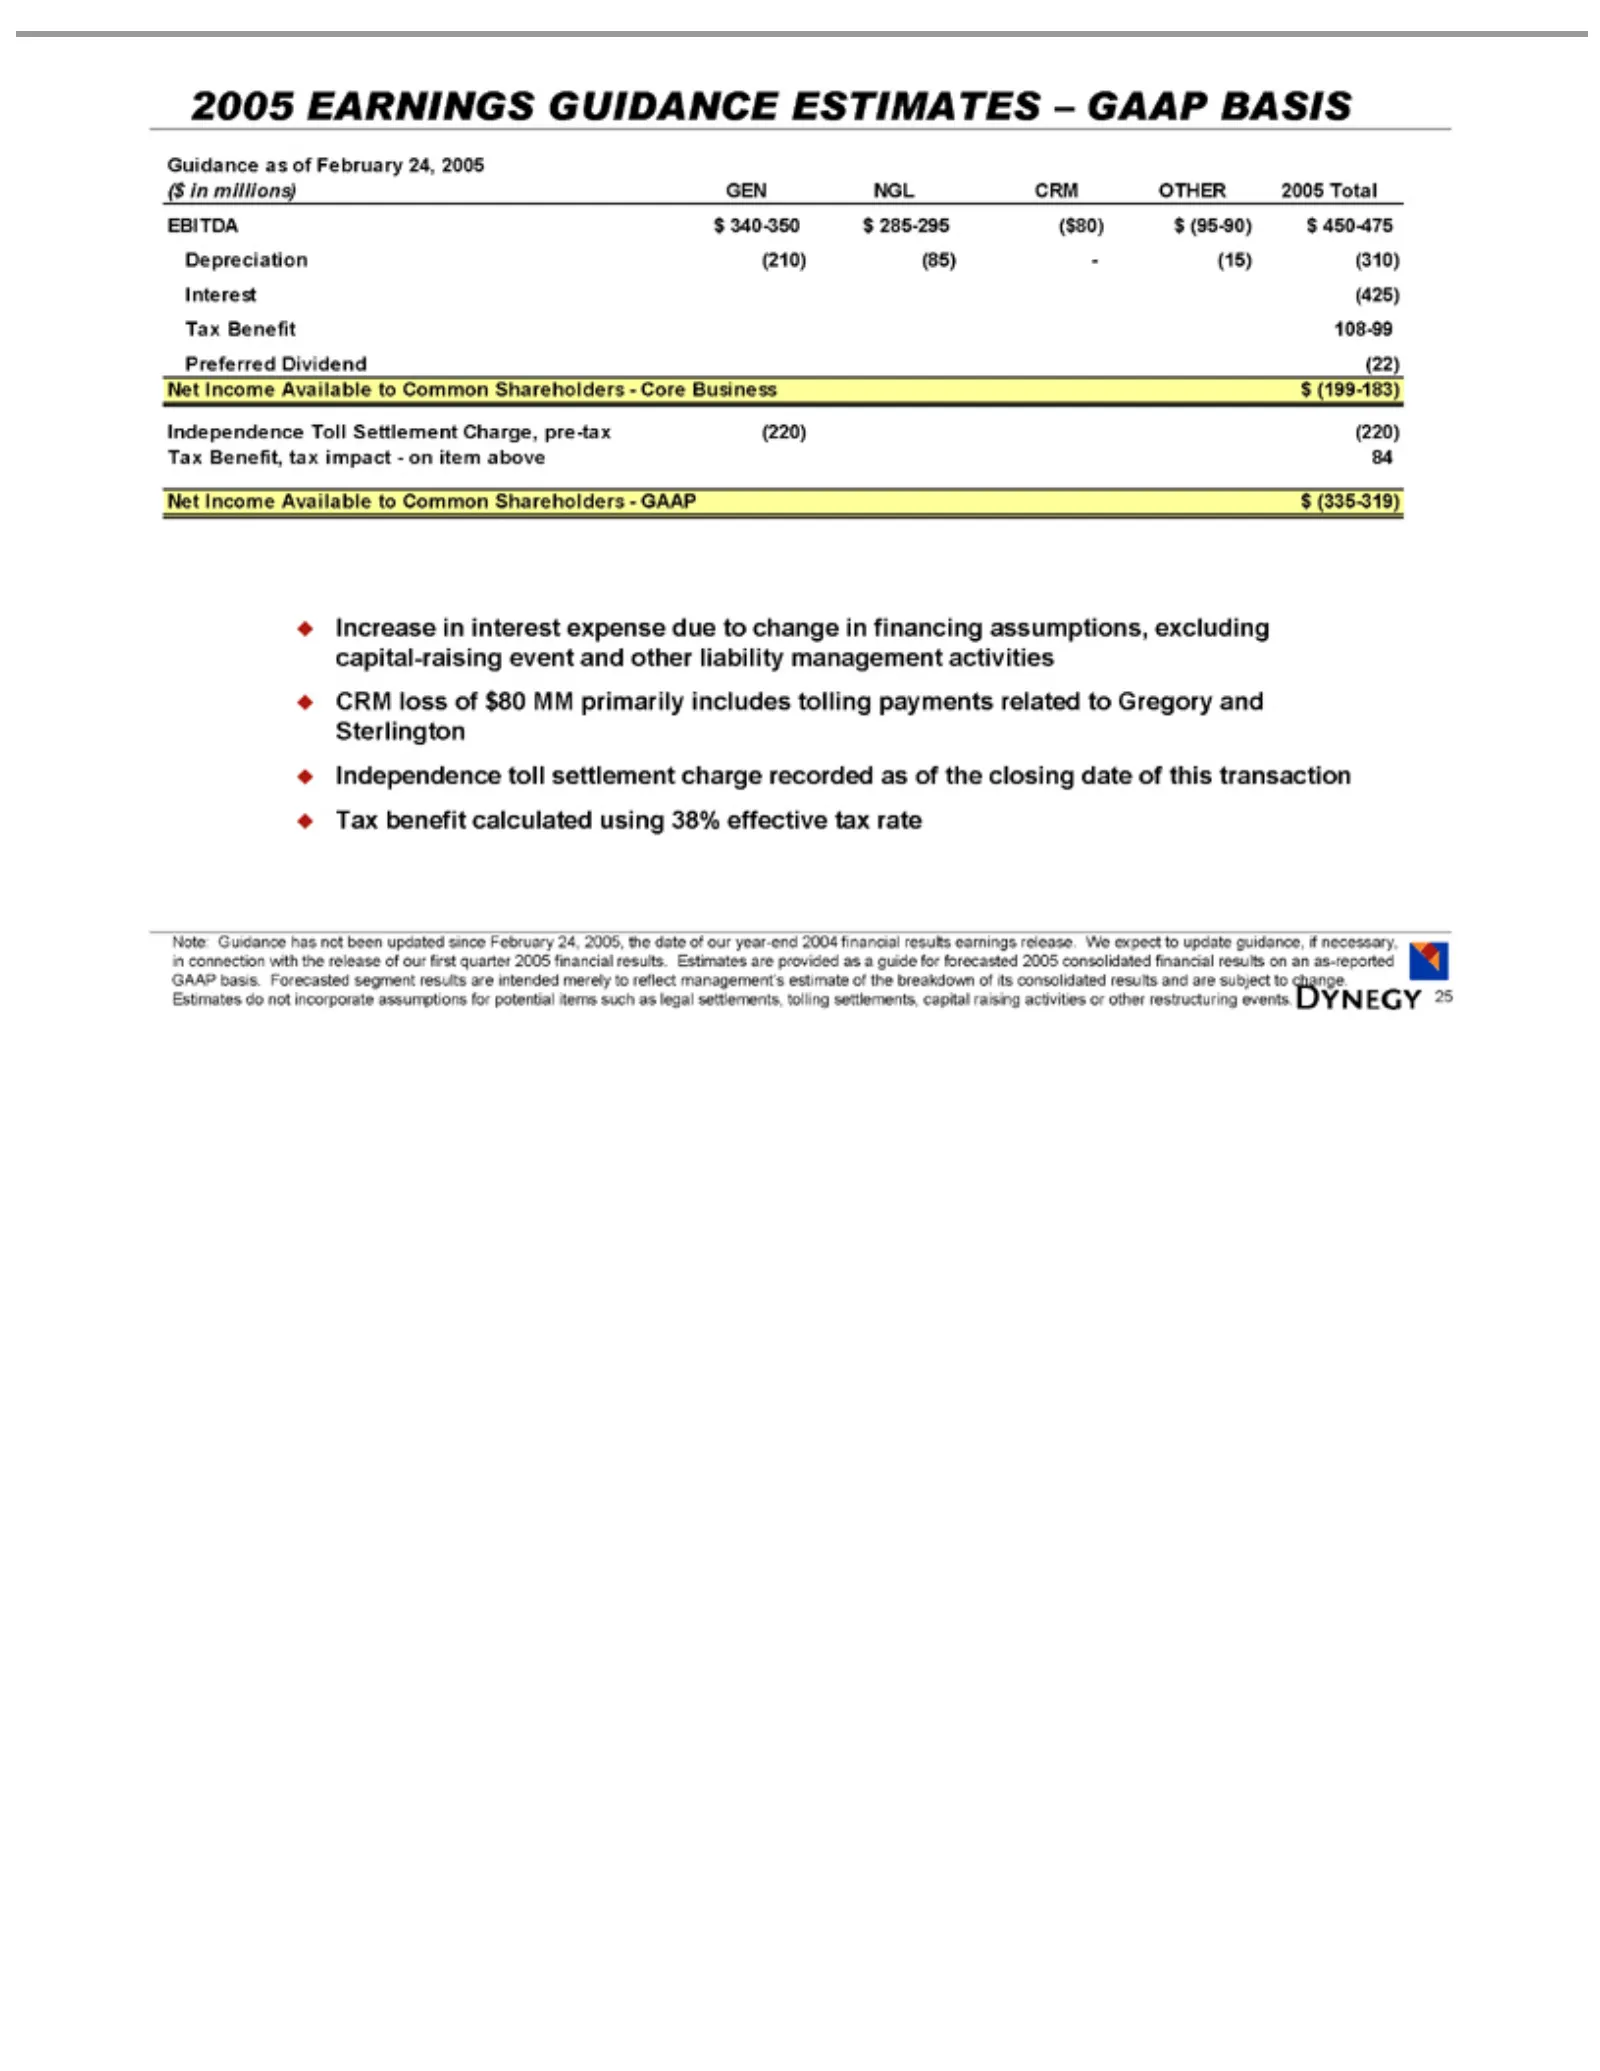
Slide 25: 2005 Income Guidance
2005Income Guidance ($in EBITDA Depreciation Interest Preferred Independence Tax Net Increase payments Note: release intended settlements, 25 Benefit Benefit, millions) EARNINGS Guidance of (425) in merely $340-350 Dividend as related our interest Available 108-99 tolling of tax (210) first GEN Toll
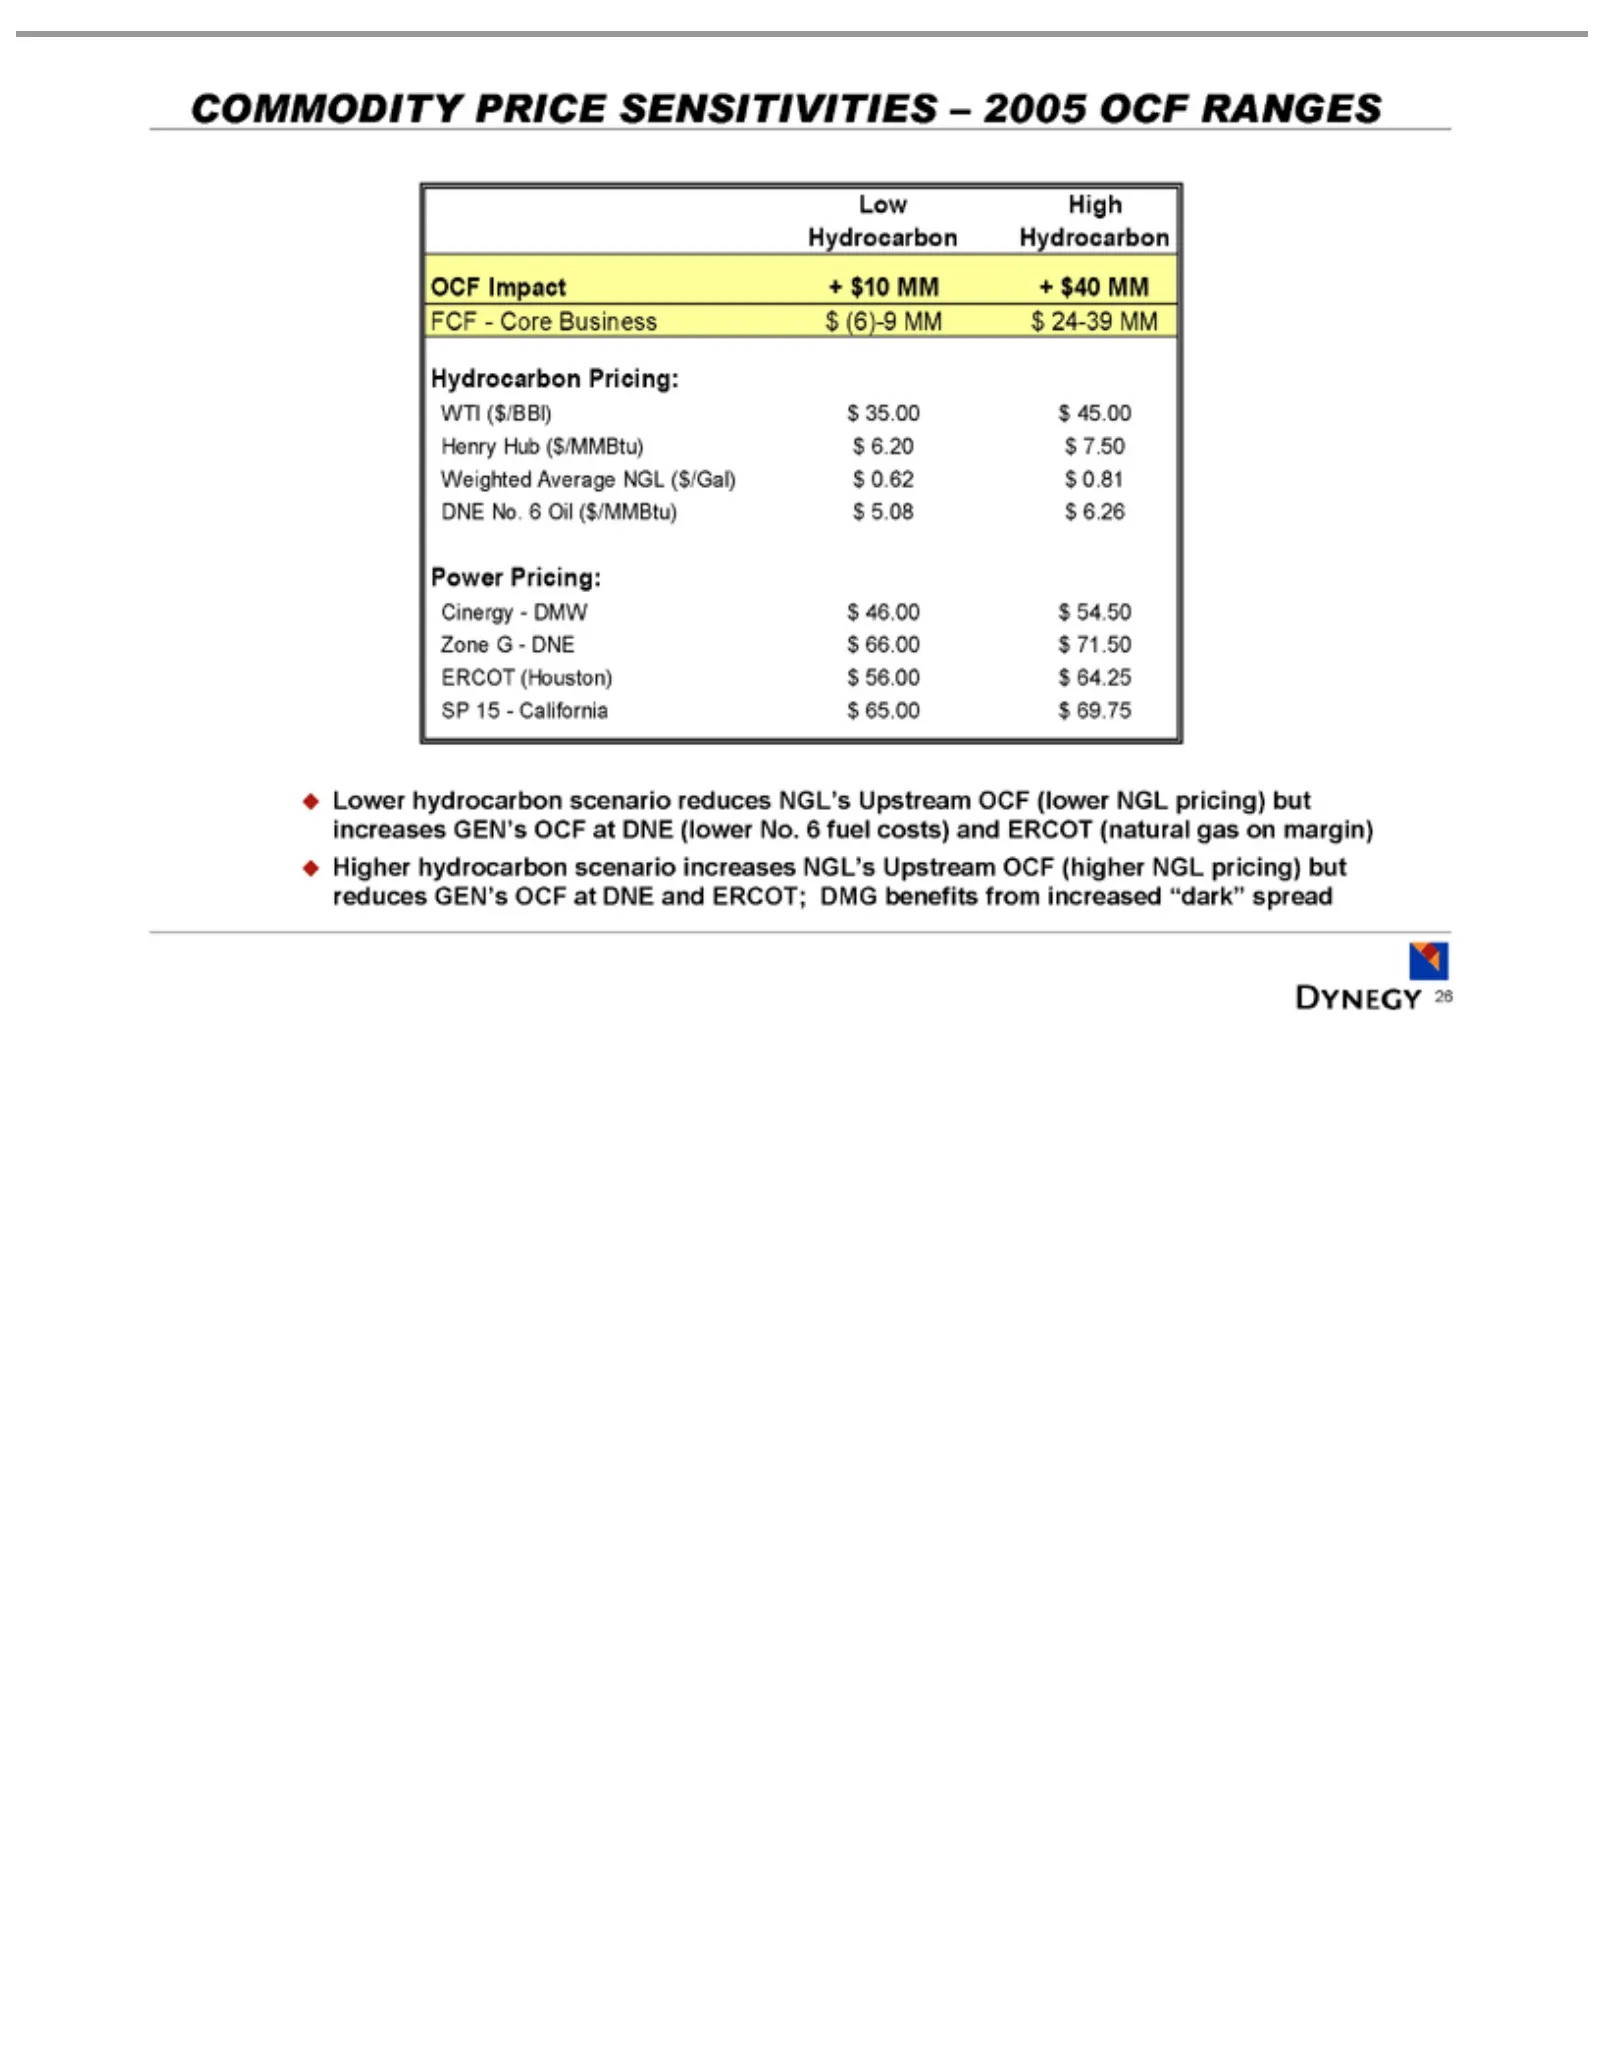
Slide 26: Commodity Price Sensitivities
COMMODITY Low OCF FCF Hydrocarbon WTI Henry Weighted DNE Power Cinergy Zone ERCOT SP Lower scenario 26 15-Hydrocarbon ($/BBl) Impact G No. -Core Hub Pricing: hydrocarbon California --(Houston) increases DNE Average 6DMW ($/MMBtu) Oil Business +$35.00 Pricing: $10 $66.00 ($/MMBtu) PRICE $46.00 $65.00
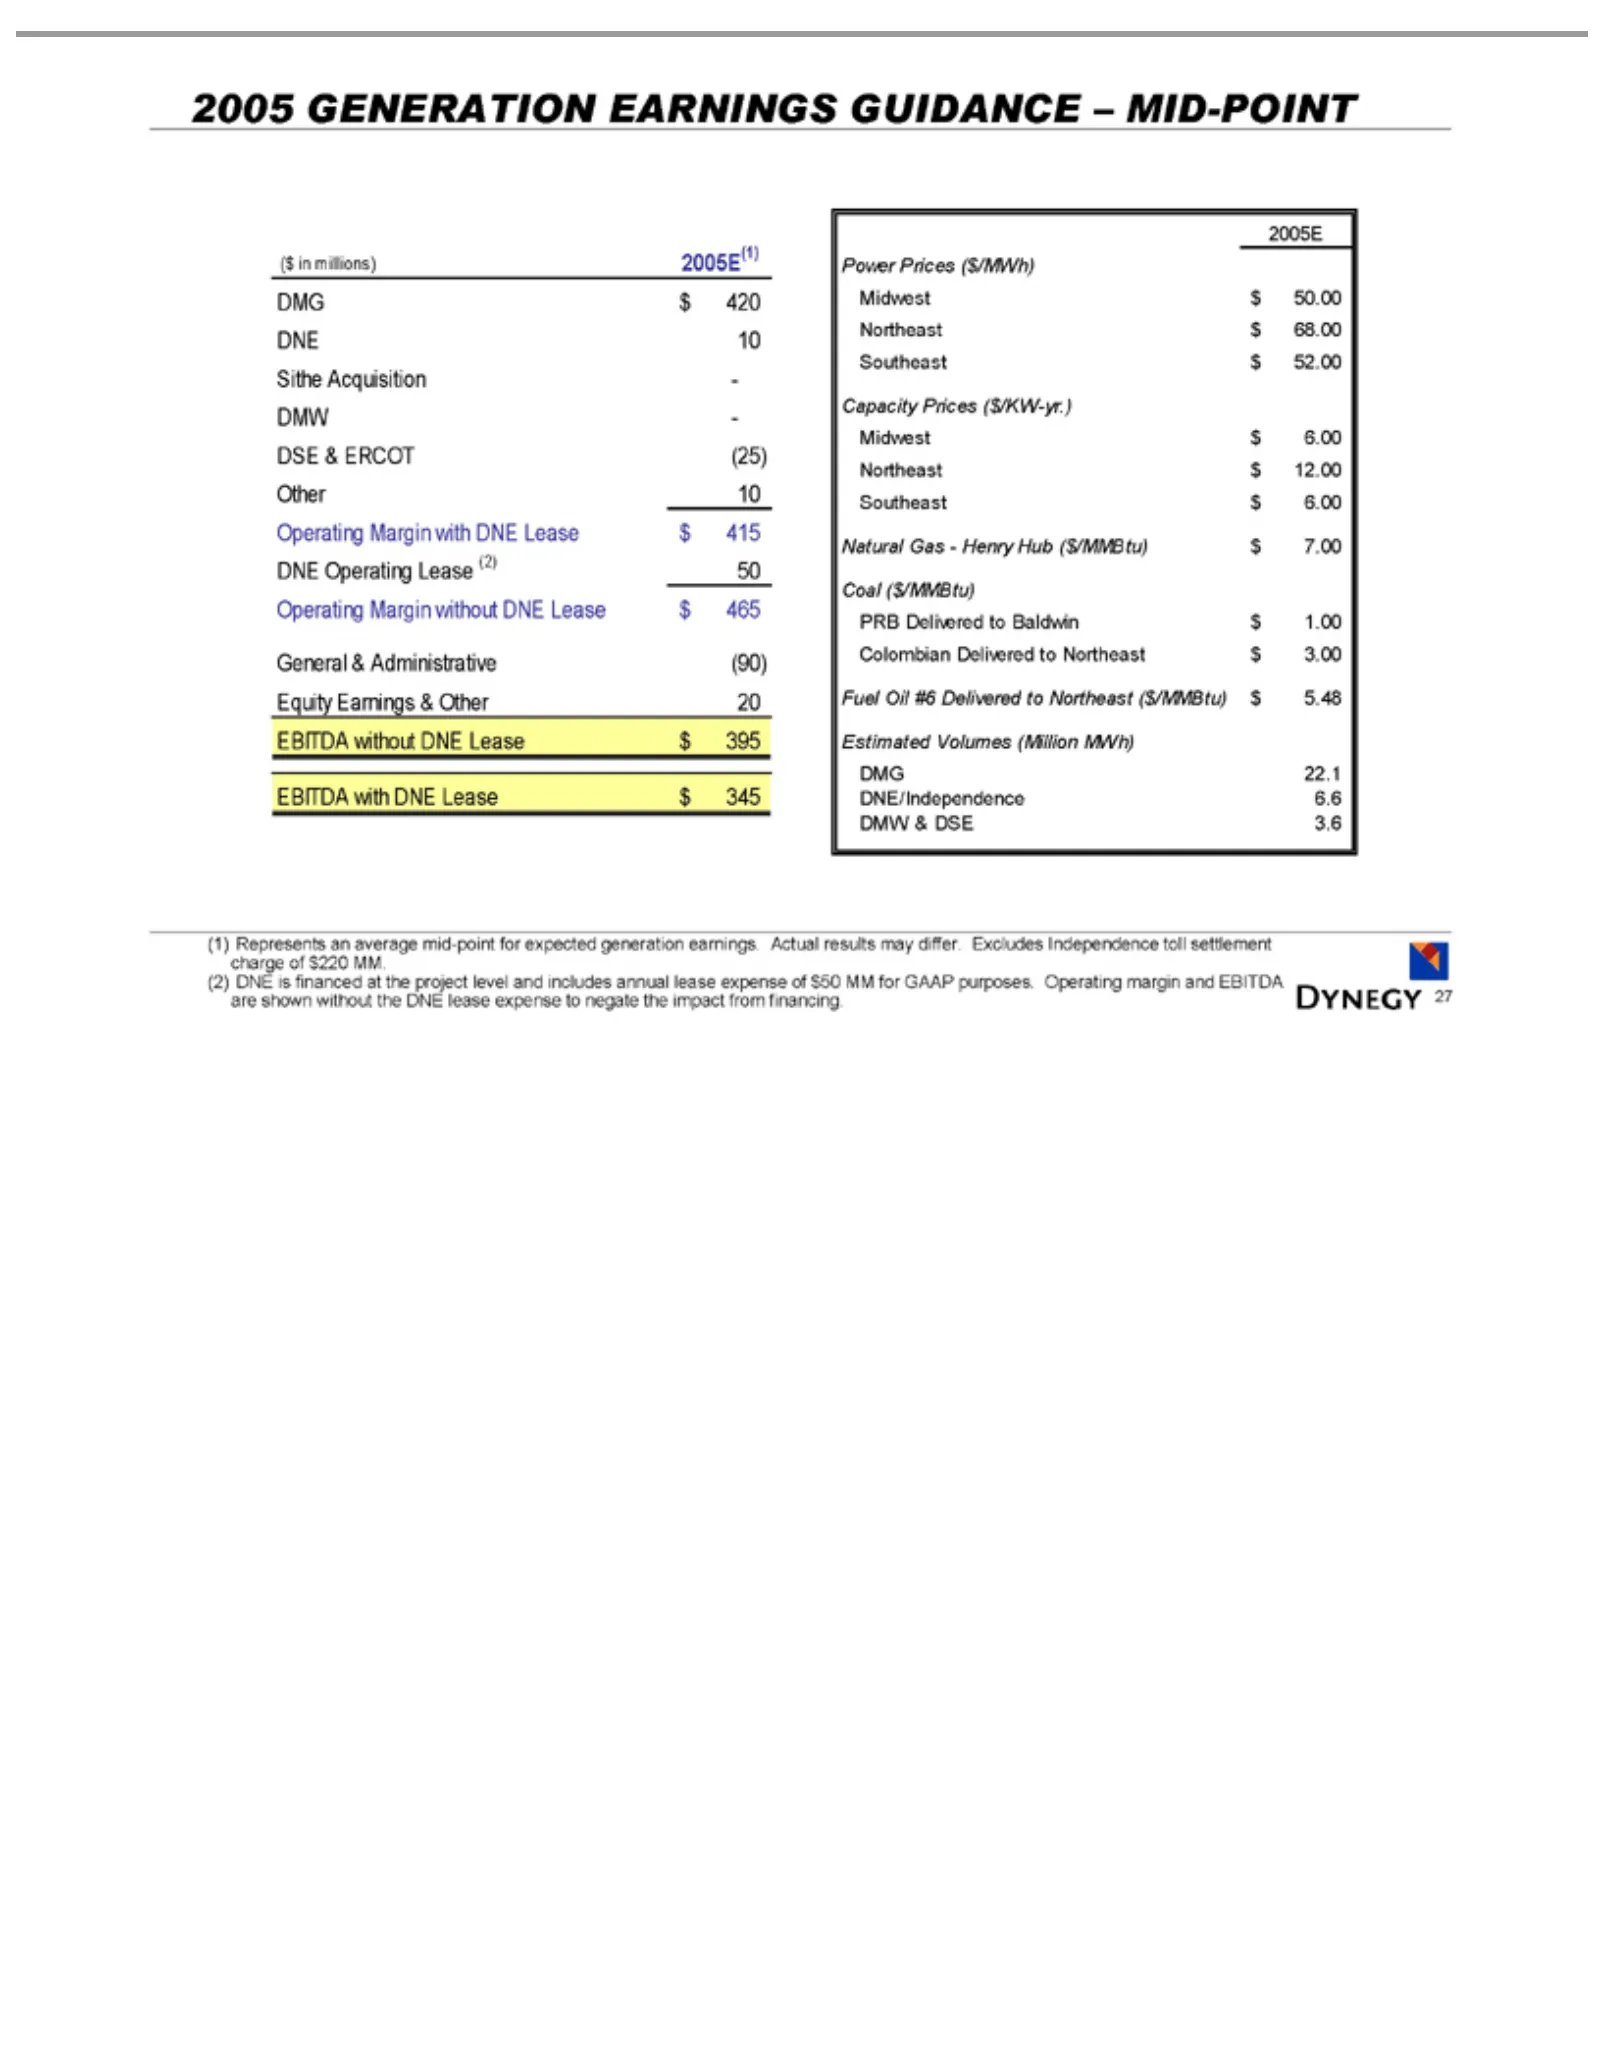
Slide 27: 2005 Power Generation Earnings Guidance
2005 ($in Sithe DSE Other DNE Operating General Equity EBITDA Power 2005E Capacity Midwest Northeast Southeast Natural Coal PRB Colombian Fuel Estimated DMG DNE/Independence DMW (1) (2) impact 27 Represents DNE millions) Oil ($/MMBtu) & Delivered GENERATION Acquisition 10 Operating 10 $& 22.1 -Price
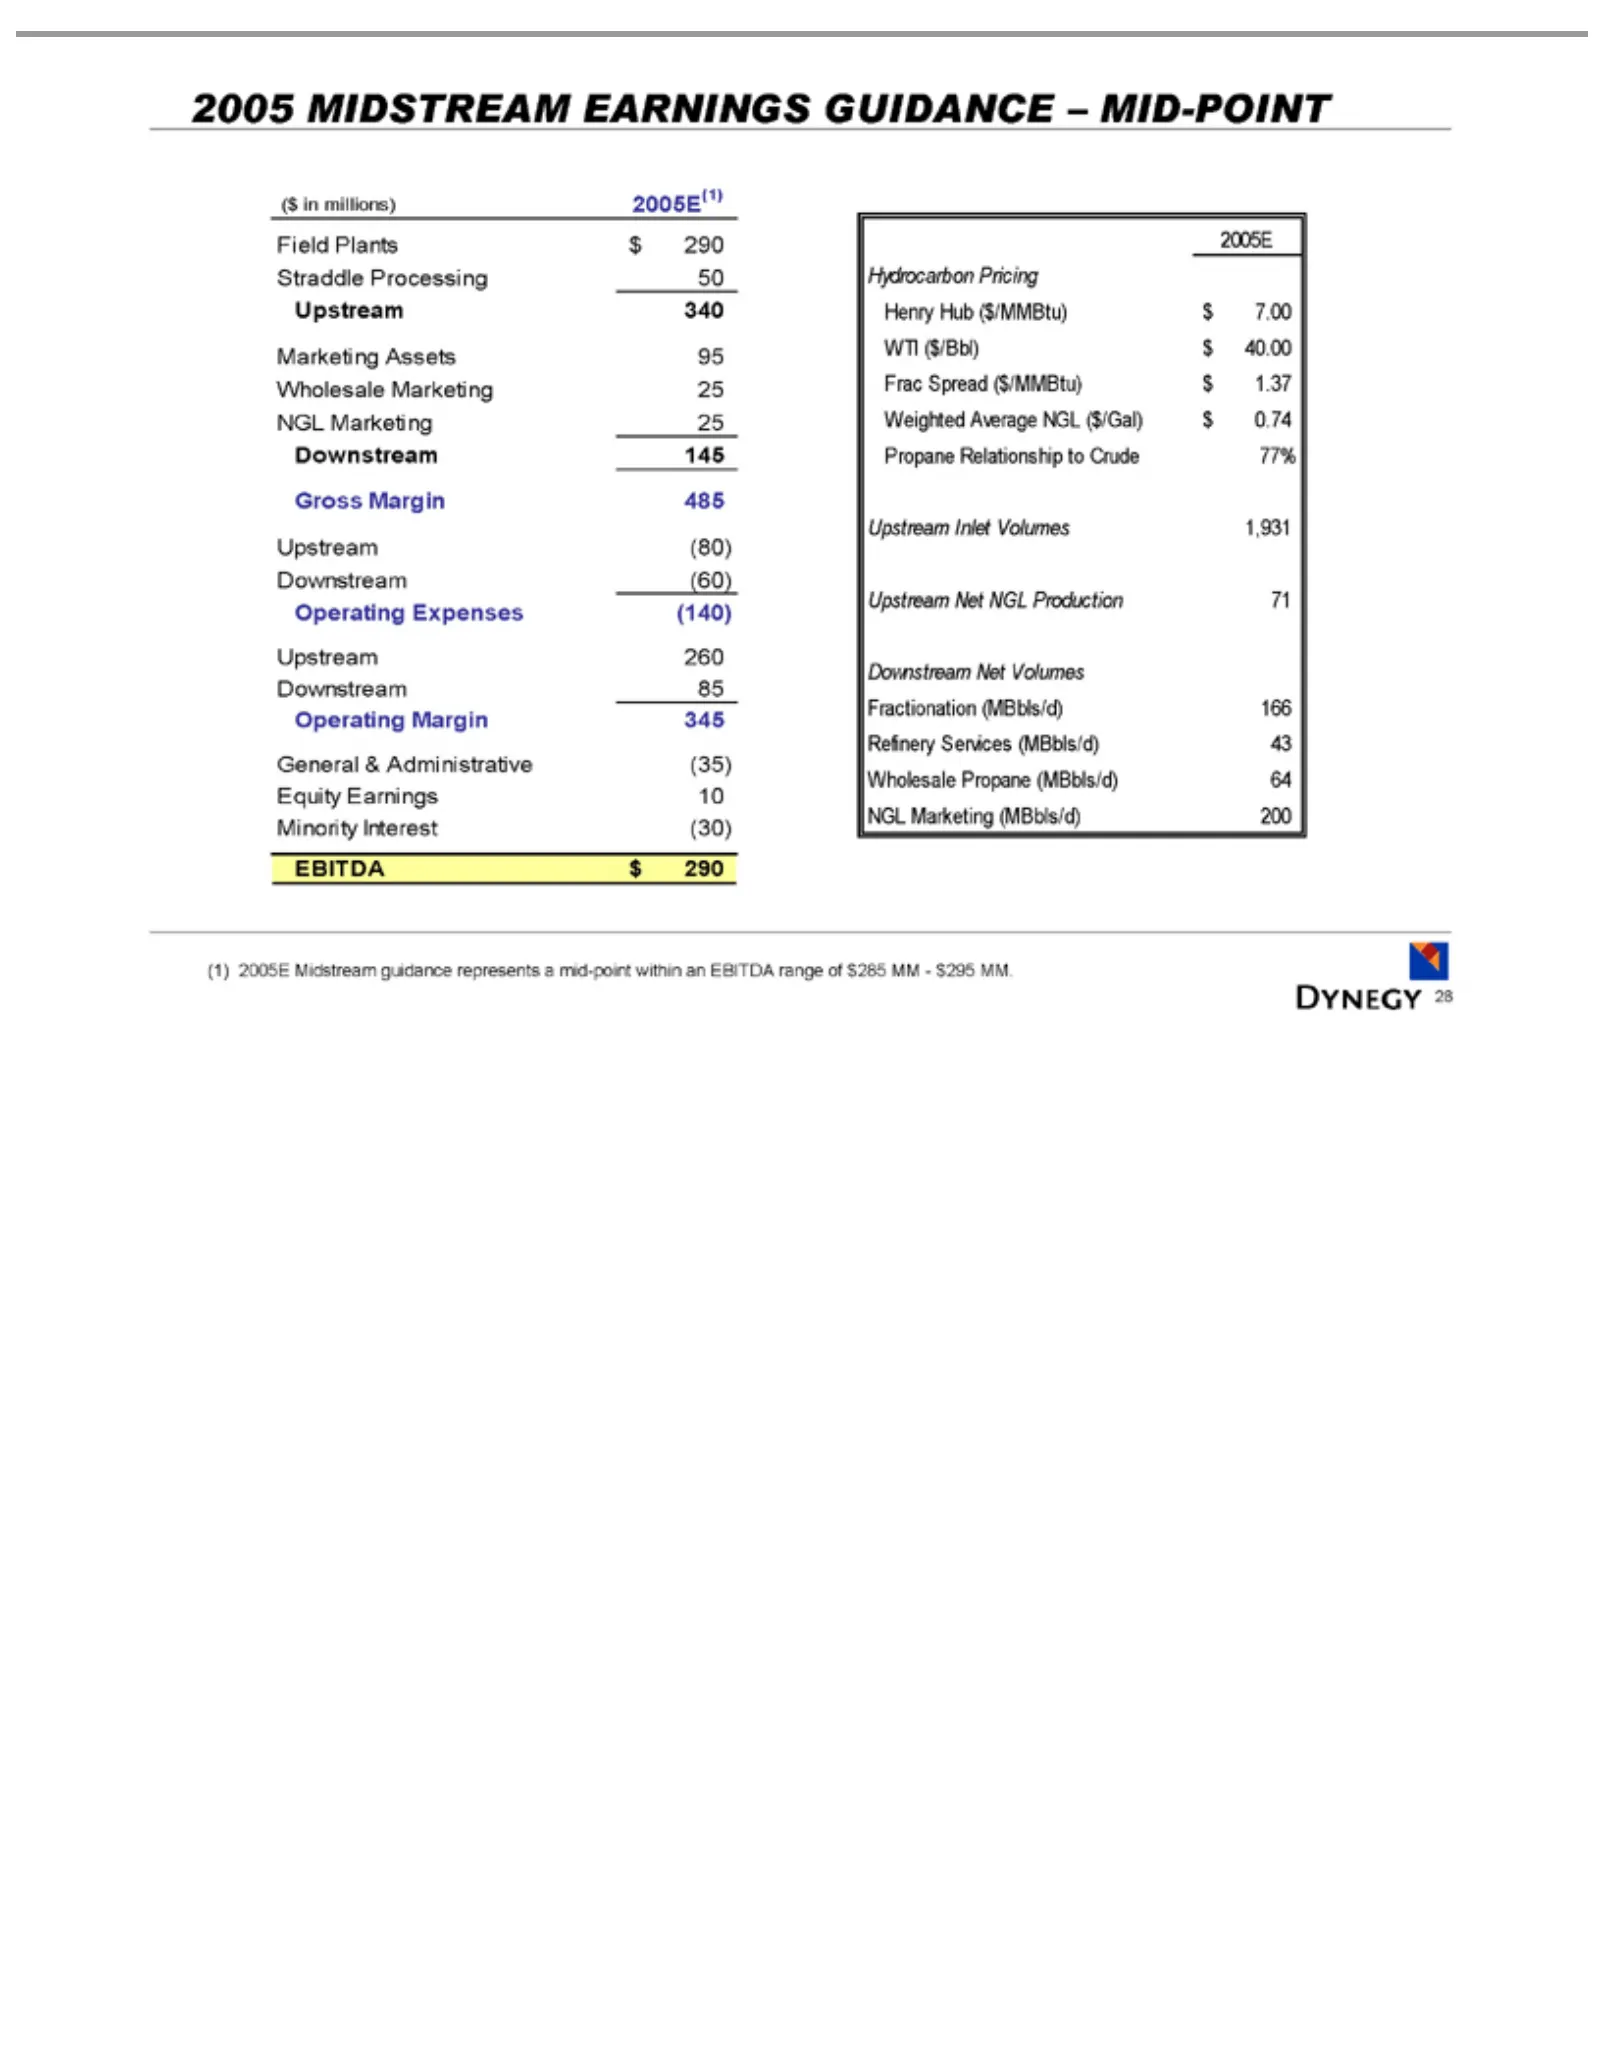
Slide 28: 2005 Midstream Earnings Guidance
2005 ($ Field Straddle Marketing Gross Operating General Equity Minority EBITDA Hydrocarbon 2005E Henry WTI Frac Weighted Propane Upstream Downstream Fractionation Refinery Wholesale NGL (1) 28 in2005E Spread millions) ($/Bbl) MIDSTREAM Marketing Plants Margin Hub Earnings & Relationship Processing
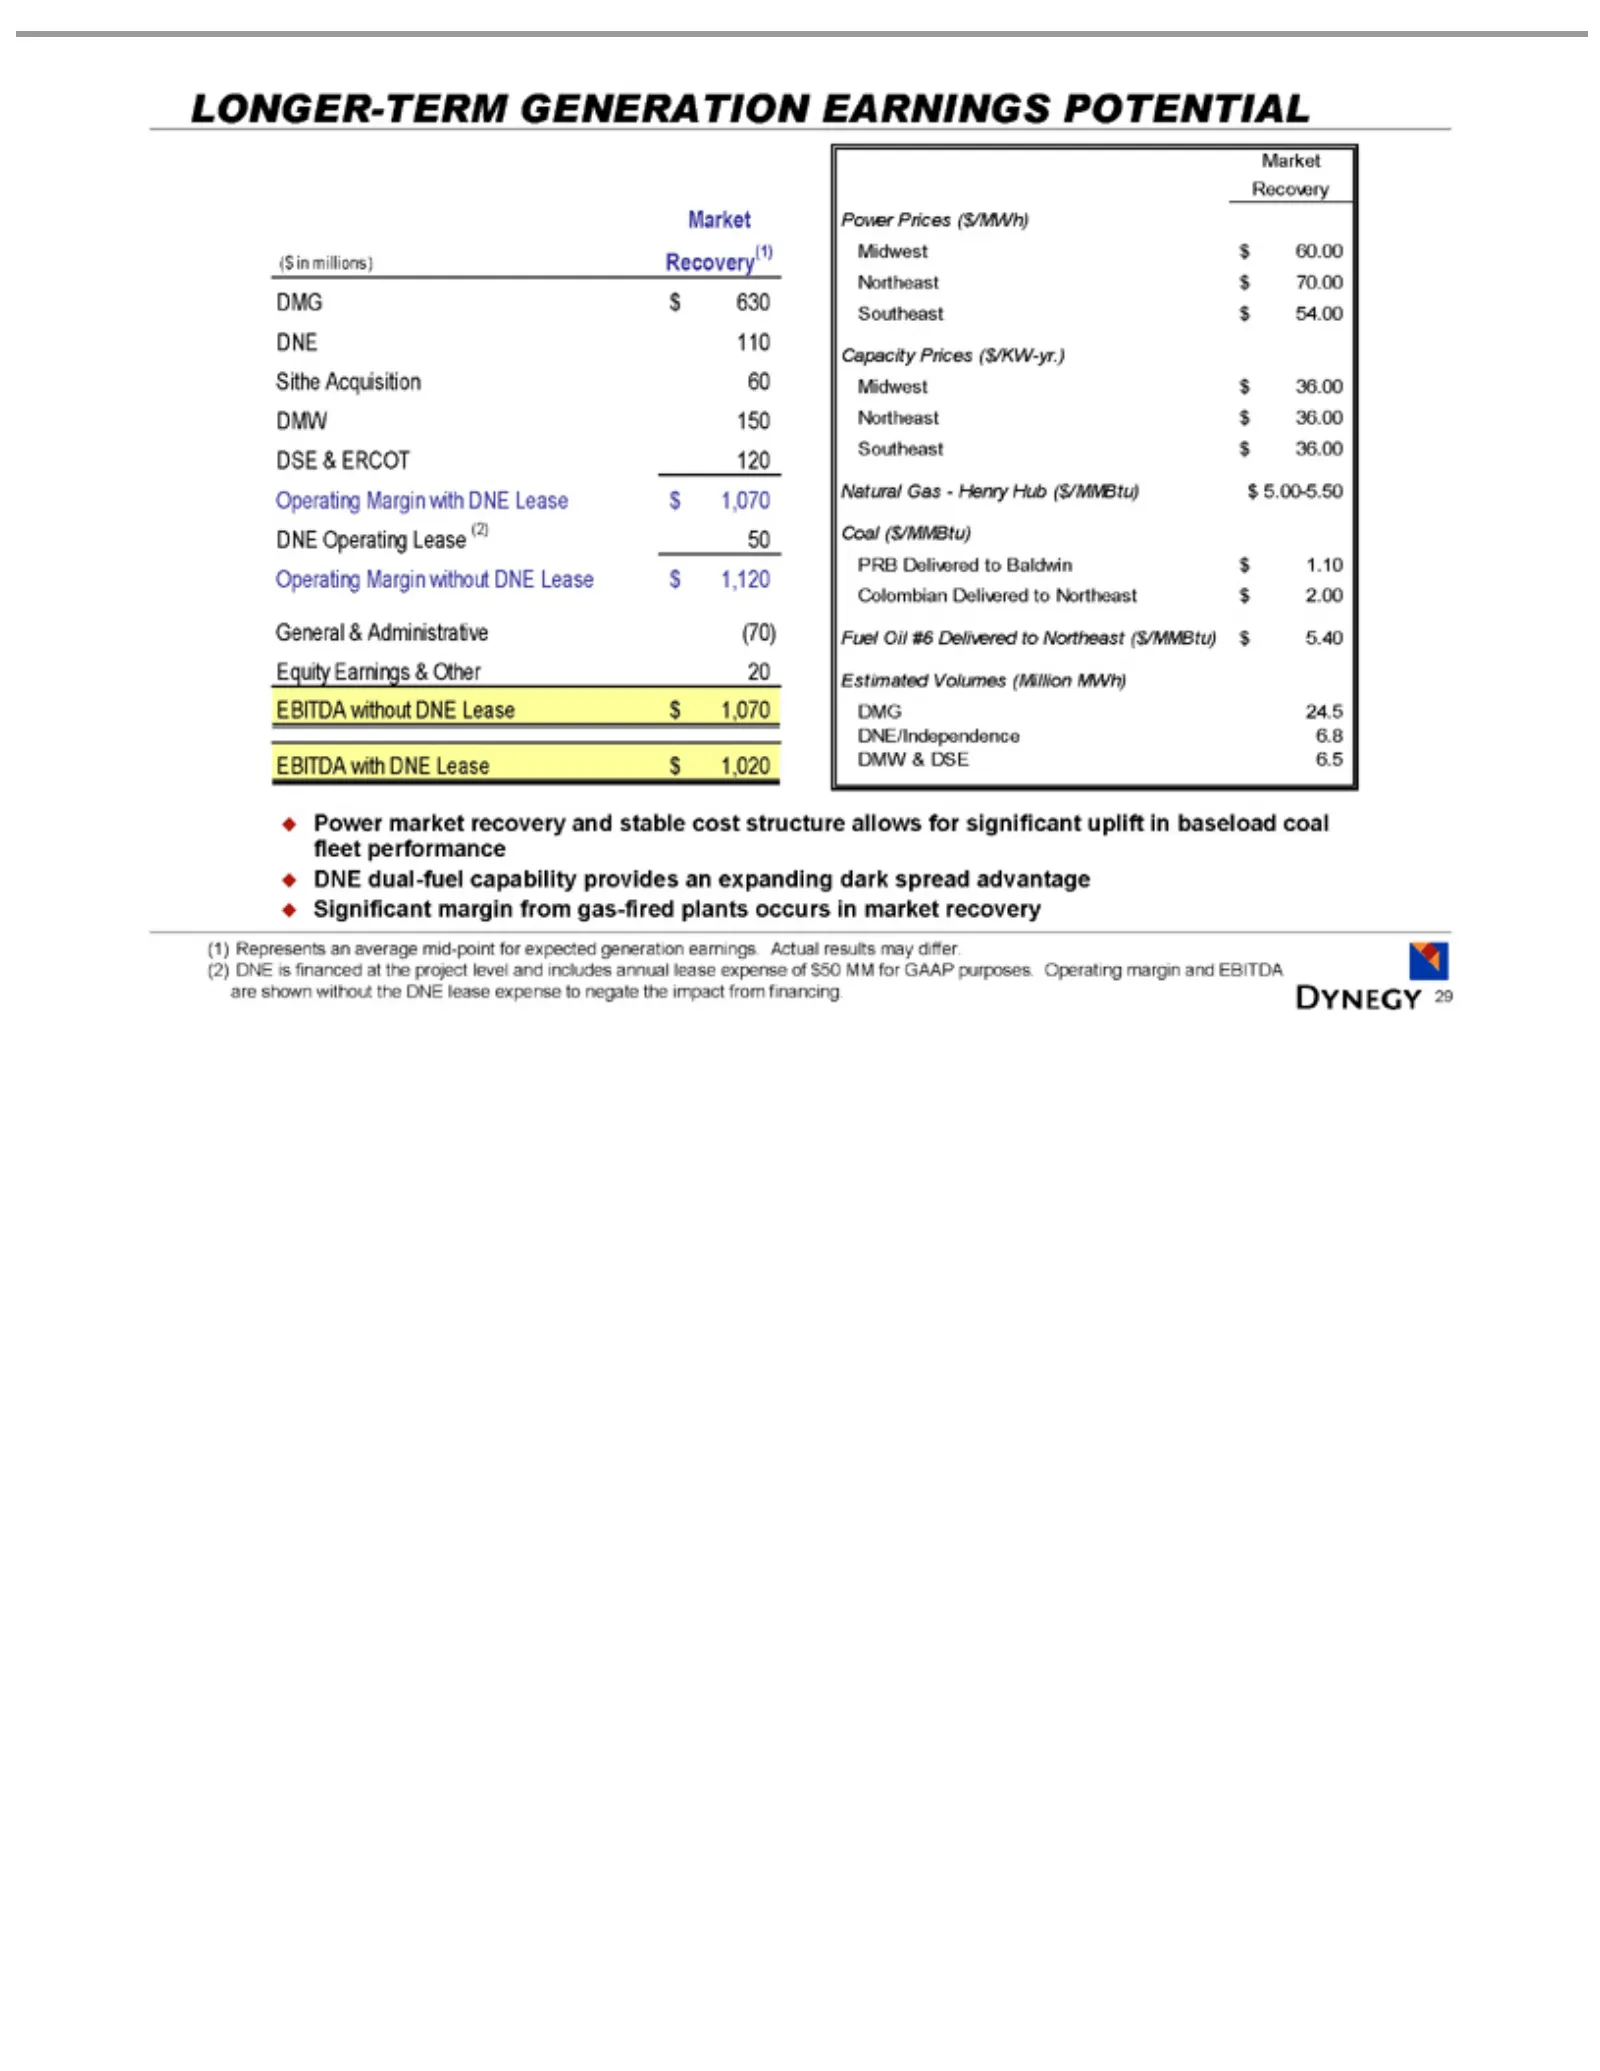
Slide 29: Longer-Term Power Generation Earnings Potential
LONGER-TERM ($ Sithe DSE DNE Operating General Equity EBITDA Market Capacity Midwest Northeast Southeast Natural Coal PRB Colombian Fuel Estimated DMG DNE/Independence DMW Power margin (1) (2) impact 29 inDNE Represents Oil millions) ($/MMBtu) & Delivered Acquisition 110 Operating $& 24.5 150 Prices
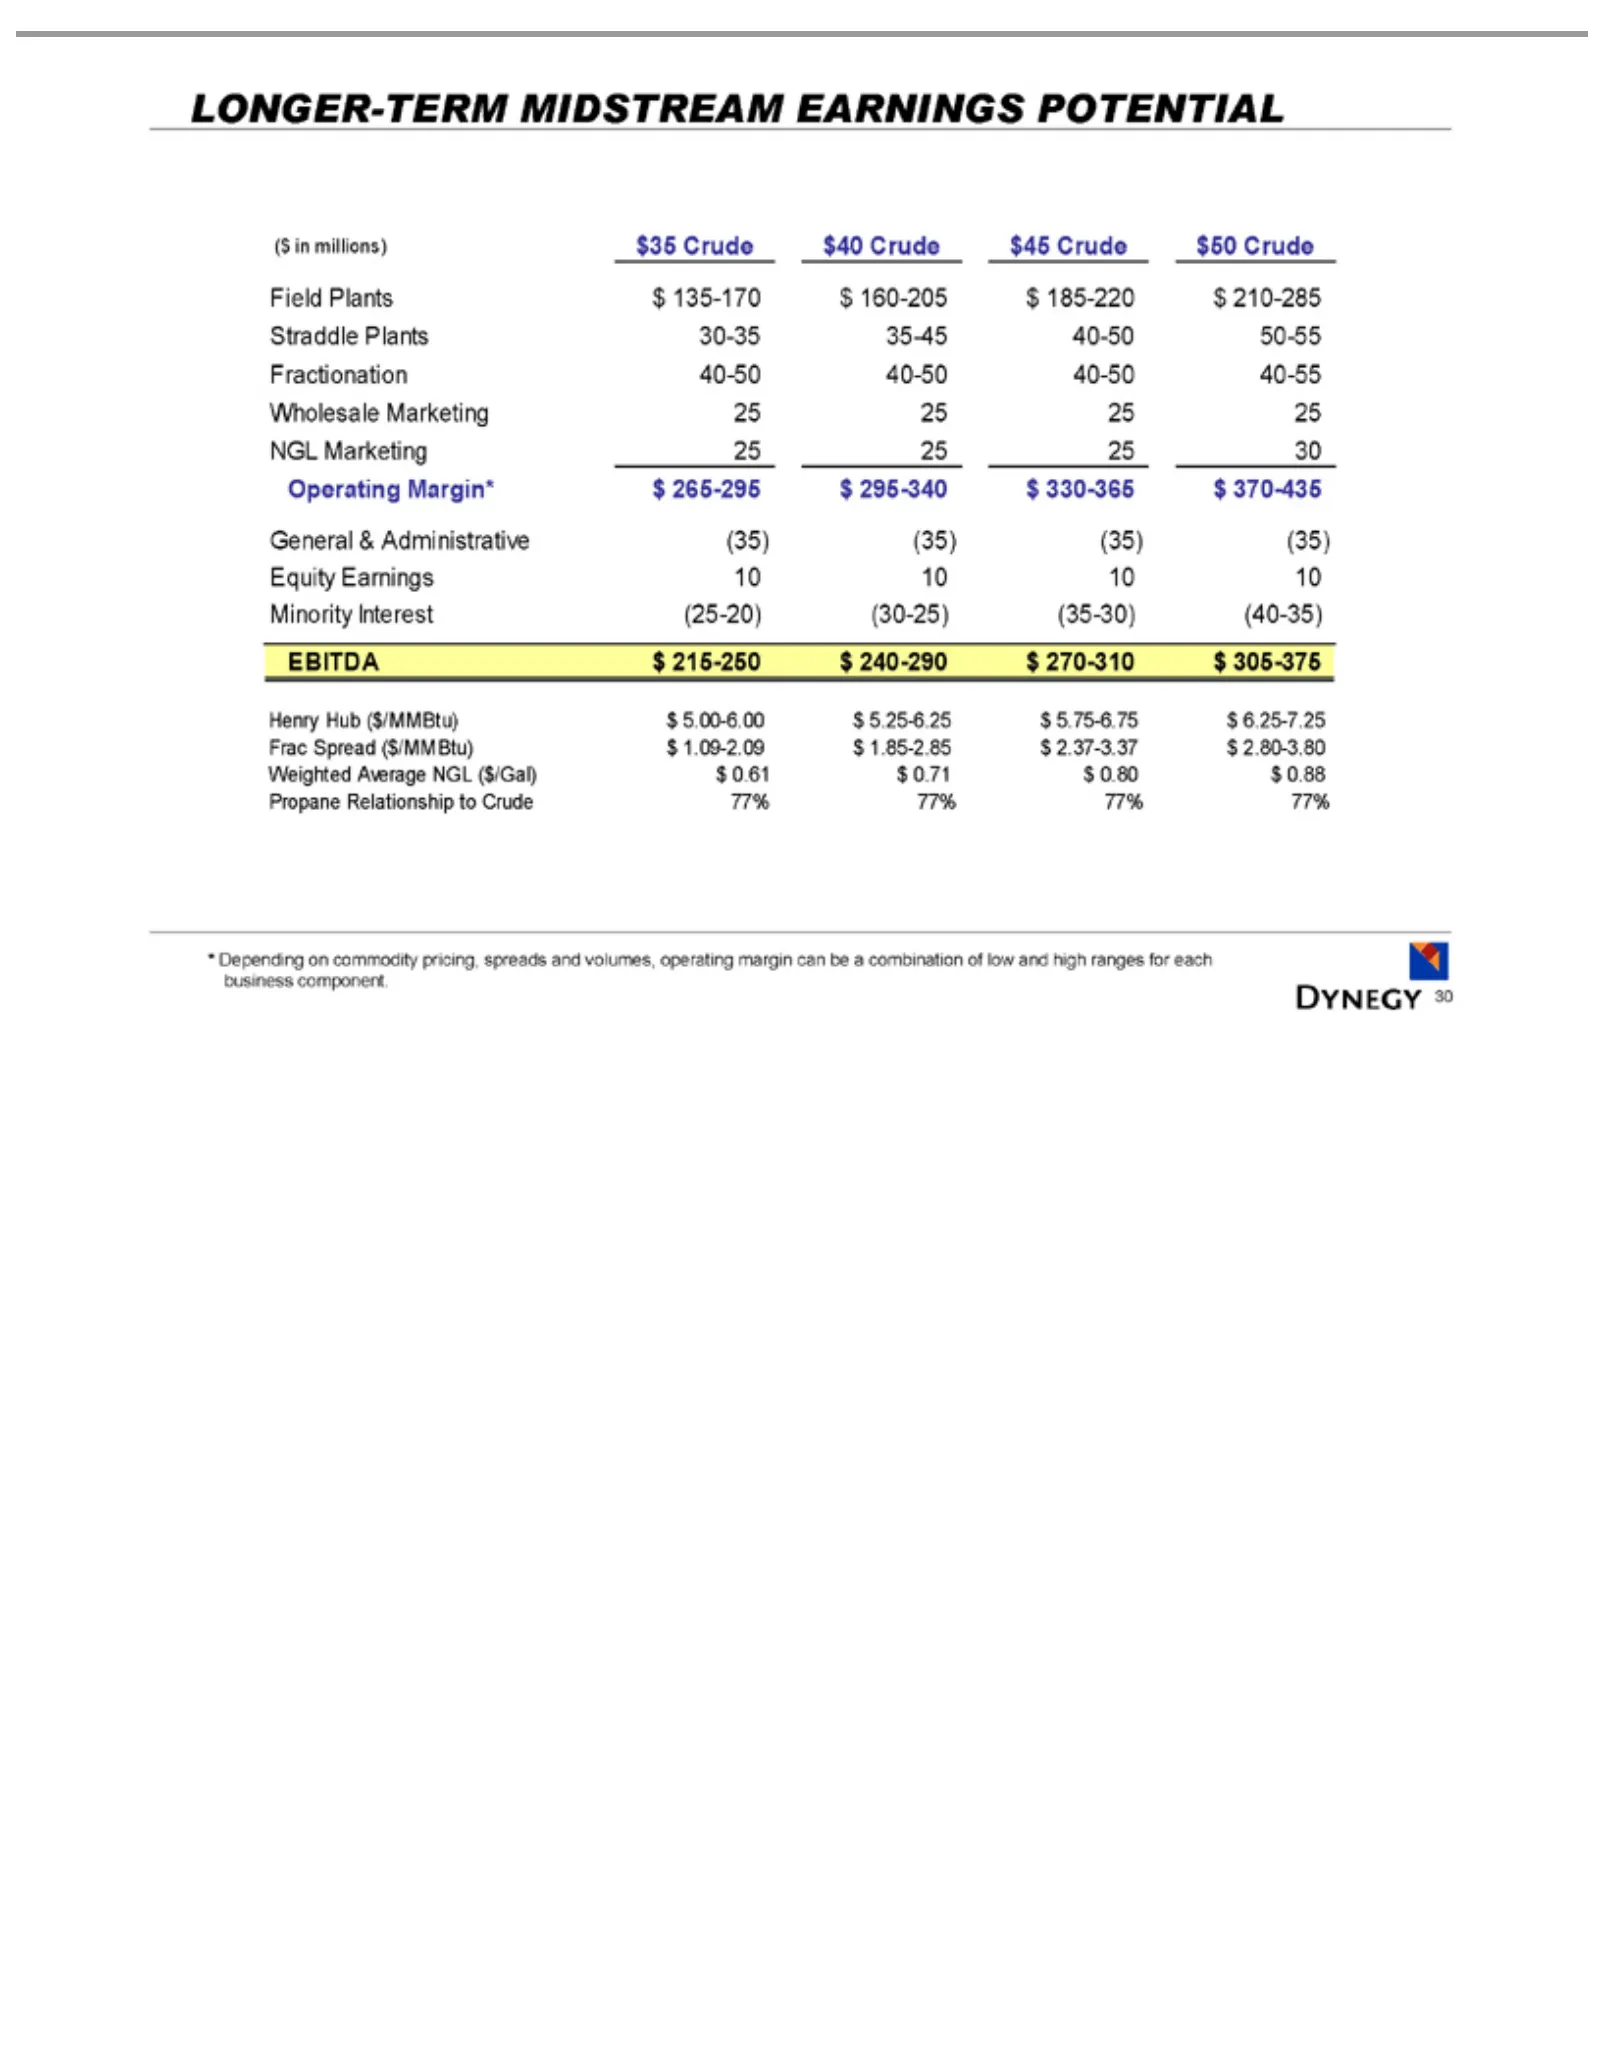
Slide 30: Longer-Term Midstream Earnings Potential
LONGER-TERM ($ Field Straddle Fractionation Wholesale NGL Operating General Equity Minority EBITDA Henry Frac Weighted Propane * 30Depending in Spread millions) Marketing Plants Hub Earnings & Relationship Plants Interest $215-250 Average Margin* Administrative Marketing ($/MMBtu) $135-170 ($/MMBtu)
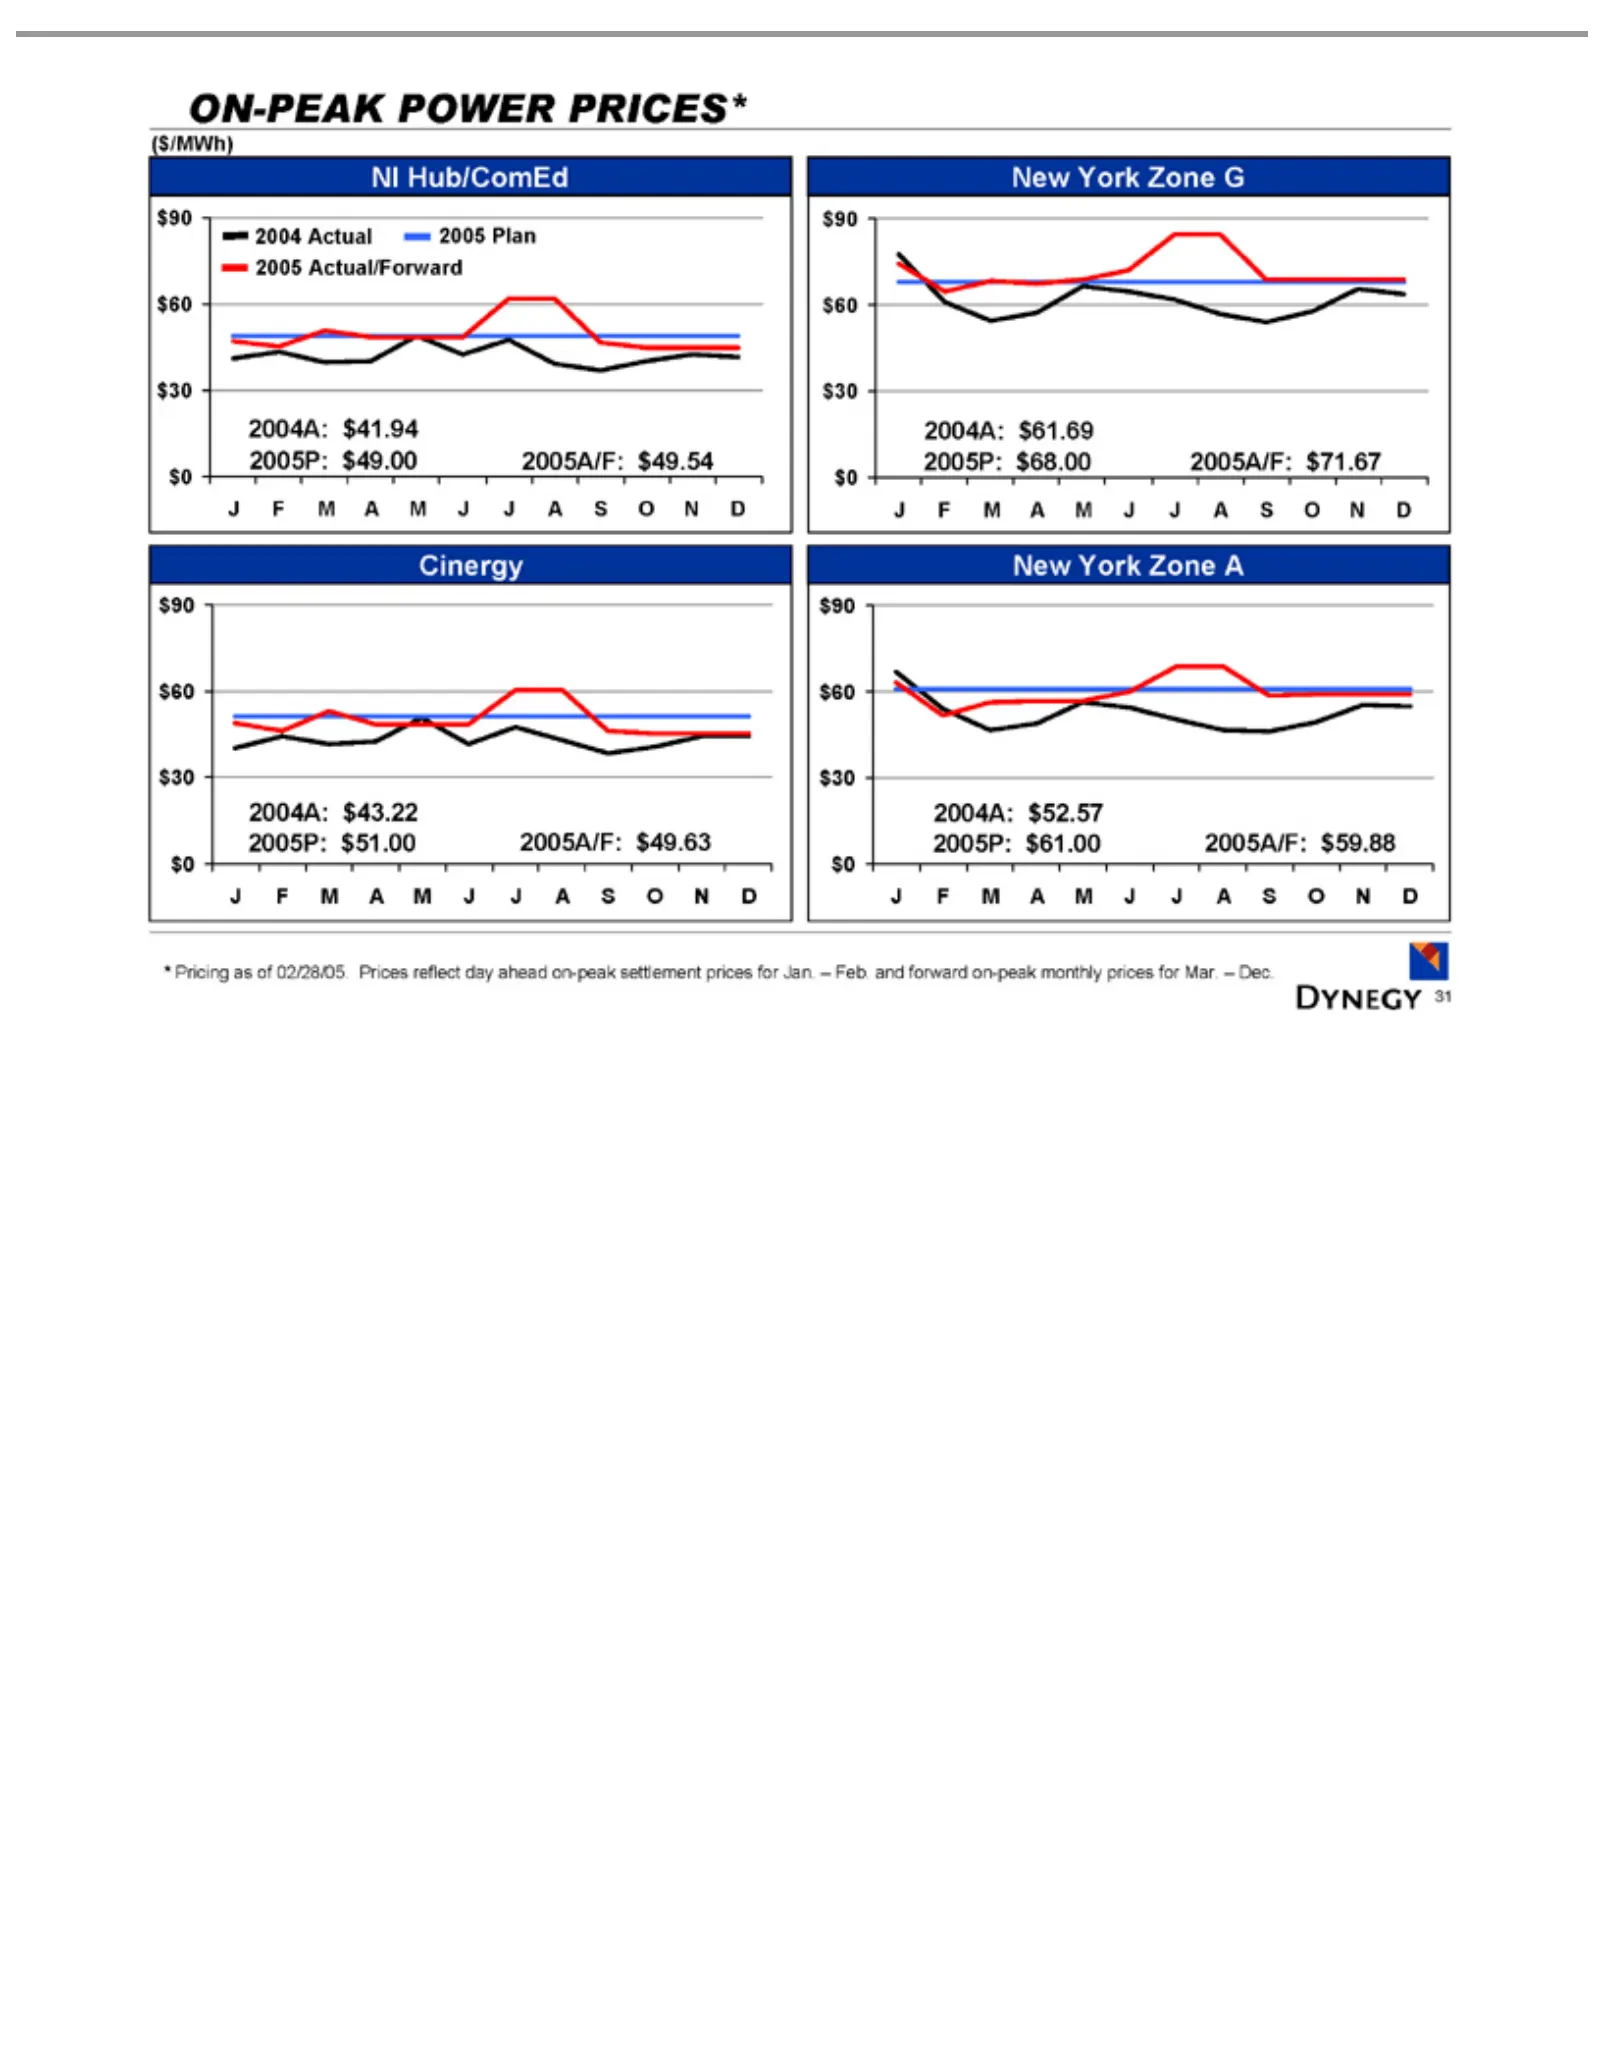
Slide 31: On-Peak Power Prices
ON-PEAK NI ($/MWh) 2004 Cinergy $0 $30 $60 New $90 2004A: J2005P: * 31FPricing Hub/ComEd M$60 York Actual A$61.00 $49.00 $51.00 $68.00 $41.94 $43.22 $61.69 $52.57 M $90 $30 $3 asZone JPOWER $0 of 2005 J$0A02/28/05. 2005A/F: A G $90 S Plan O $60 PRICES* N 2005 DPrices $30 $49.54 $49.63 $71.67 $59.88
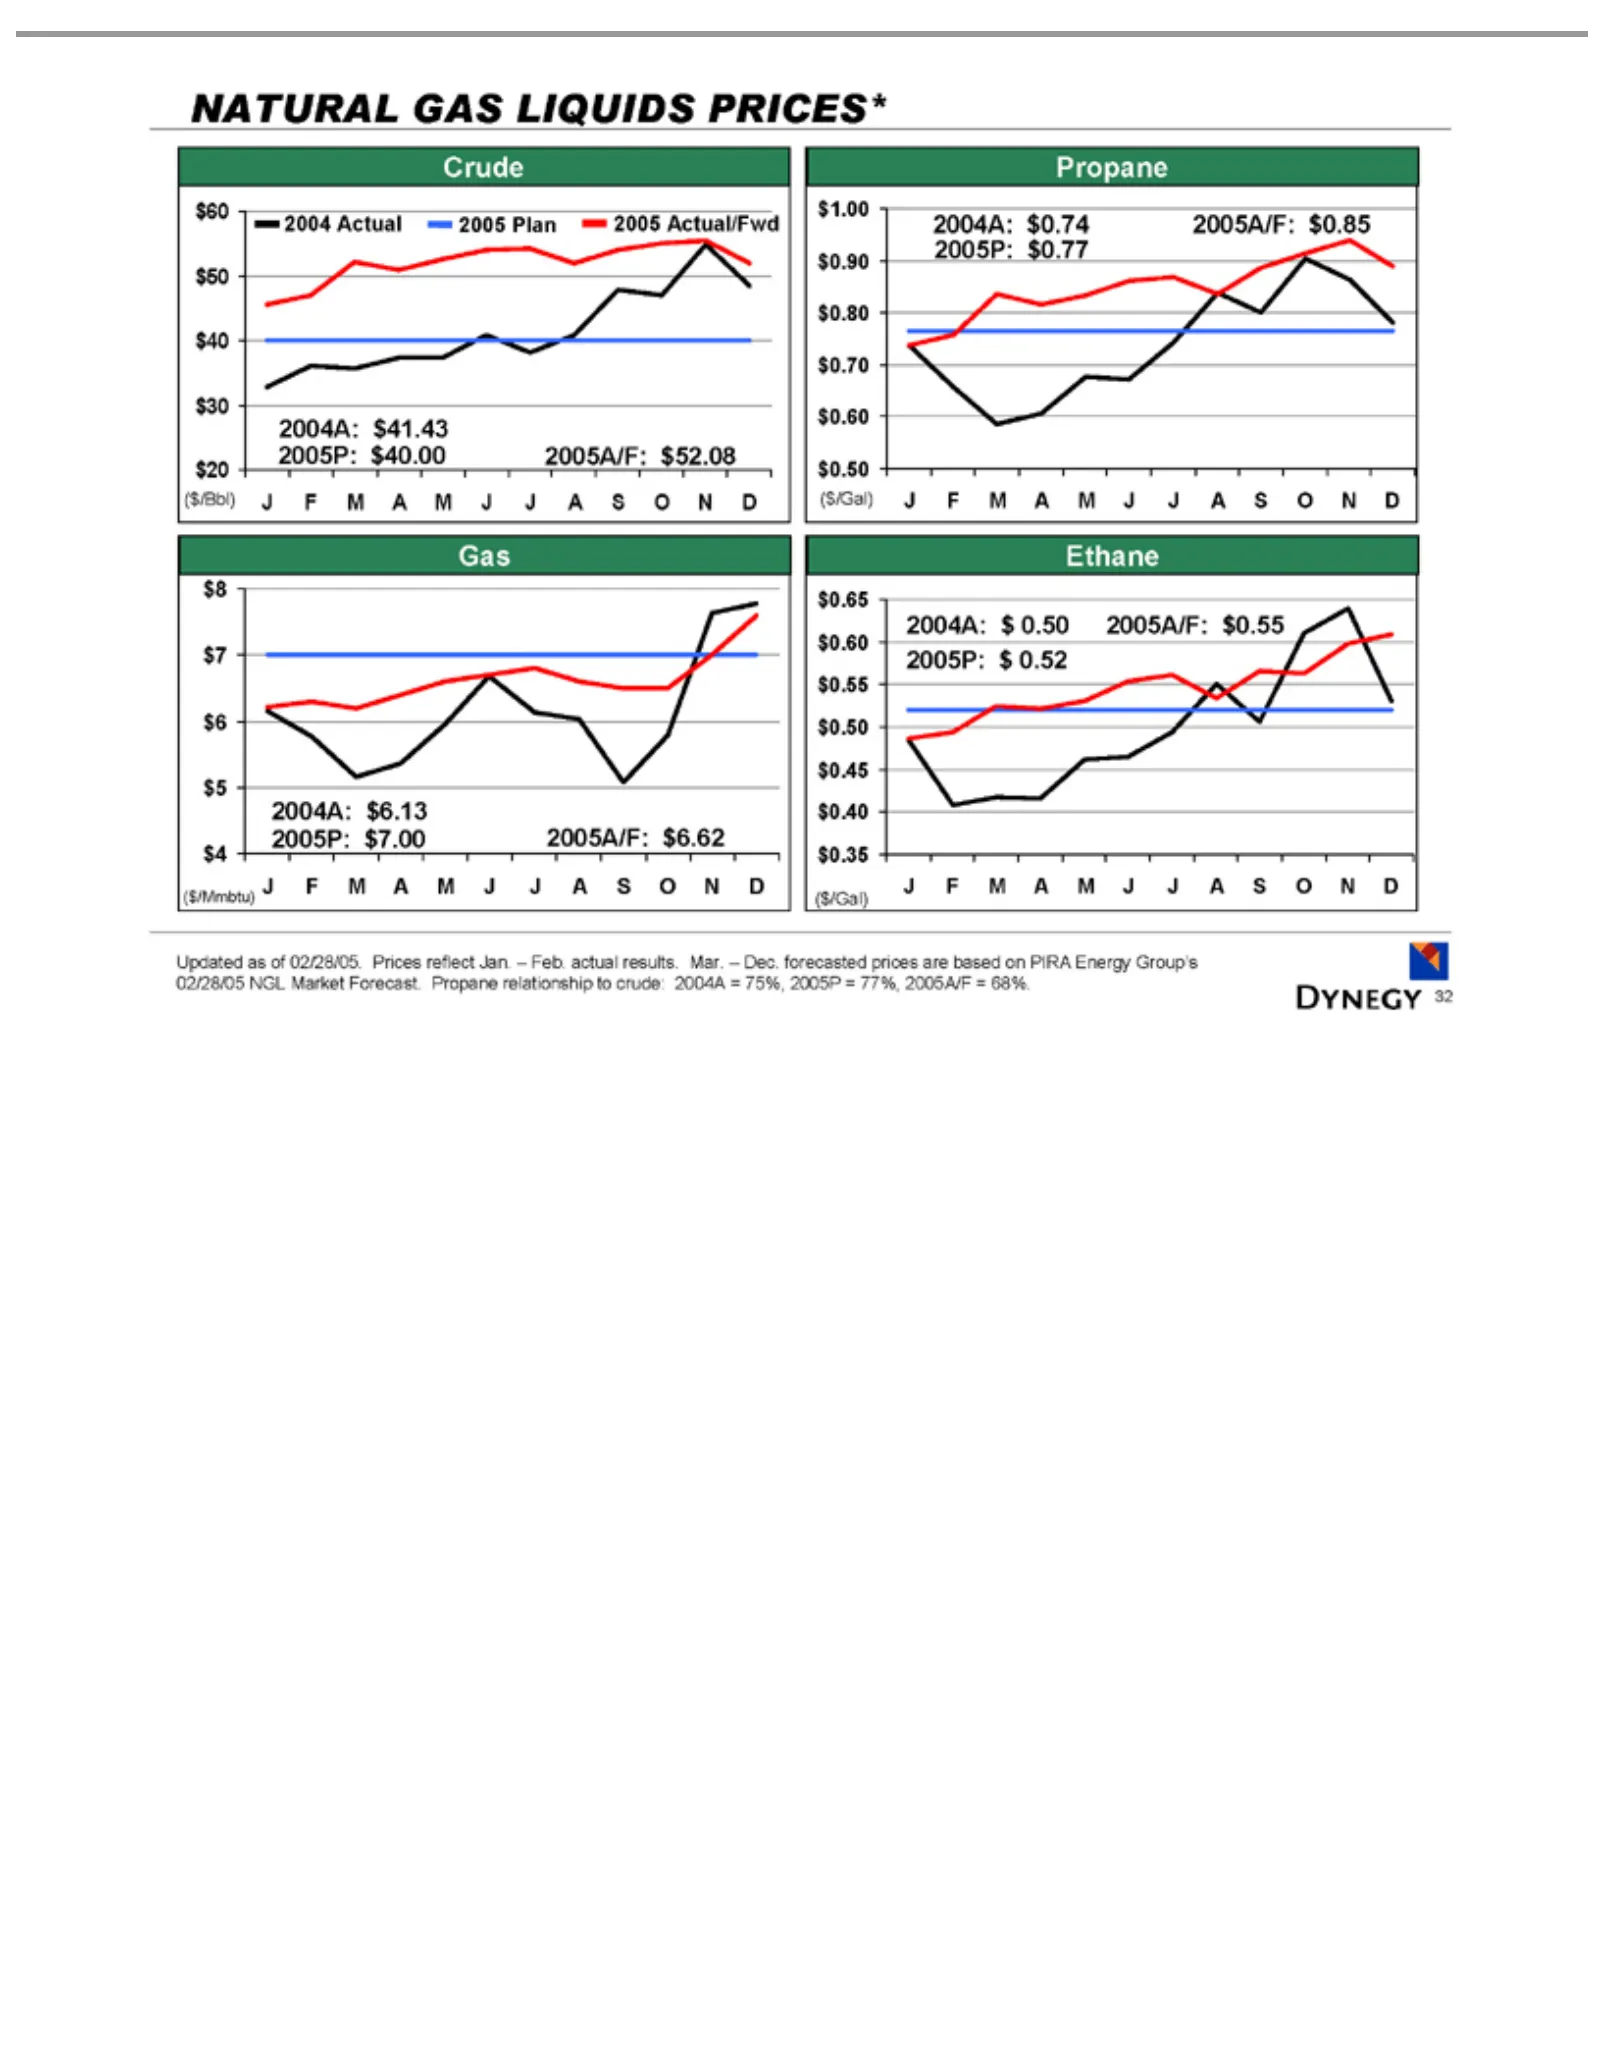
Slide 32: Natural Gas and Liquids Prices
NATURAL Crude 2004 ($/Bbl) $20 2005 Gas ($/Mmbtu) $4 2005P: Propane Ethane $0.60 $0.45 $0.50 2004A: ($/Gal) J$0.35 Updated 2004A 32 FM $8 Actual Actual/Fwd Plan $0.55 $0.40 A $60 =$0.65 $7 $40.00 $7.00 $41.43 $6.13 $0.74 $0.50 M $1.00 as 75%, $6 $50 Jof GAS J$5 2005A/F: 2005A/F: 02/28/05. A$0.90 200
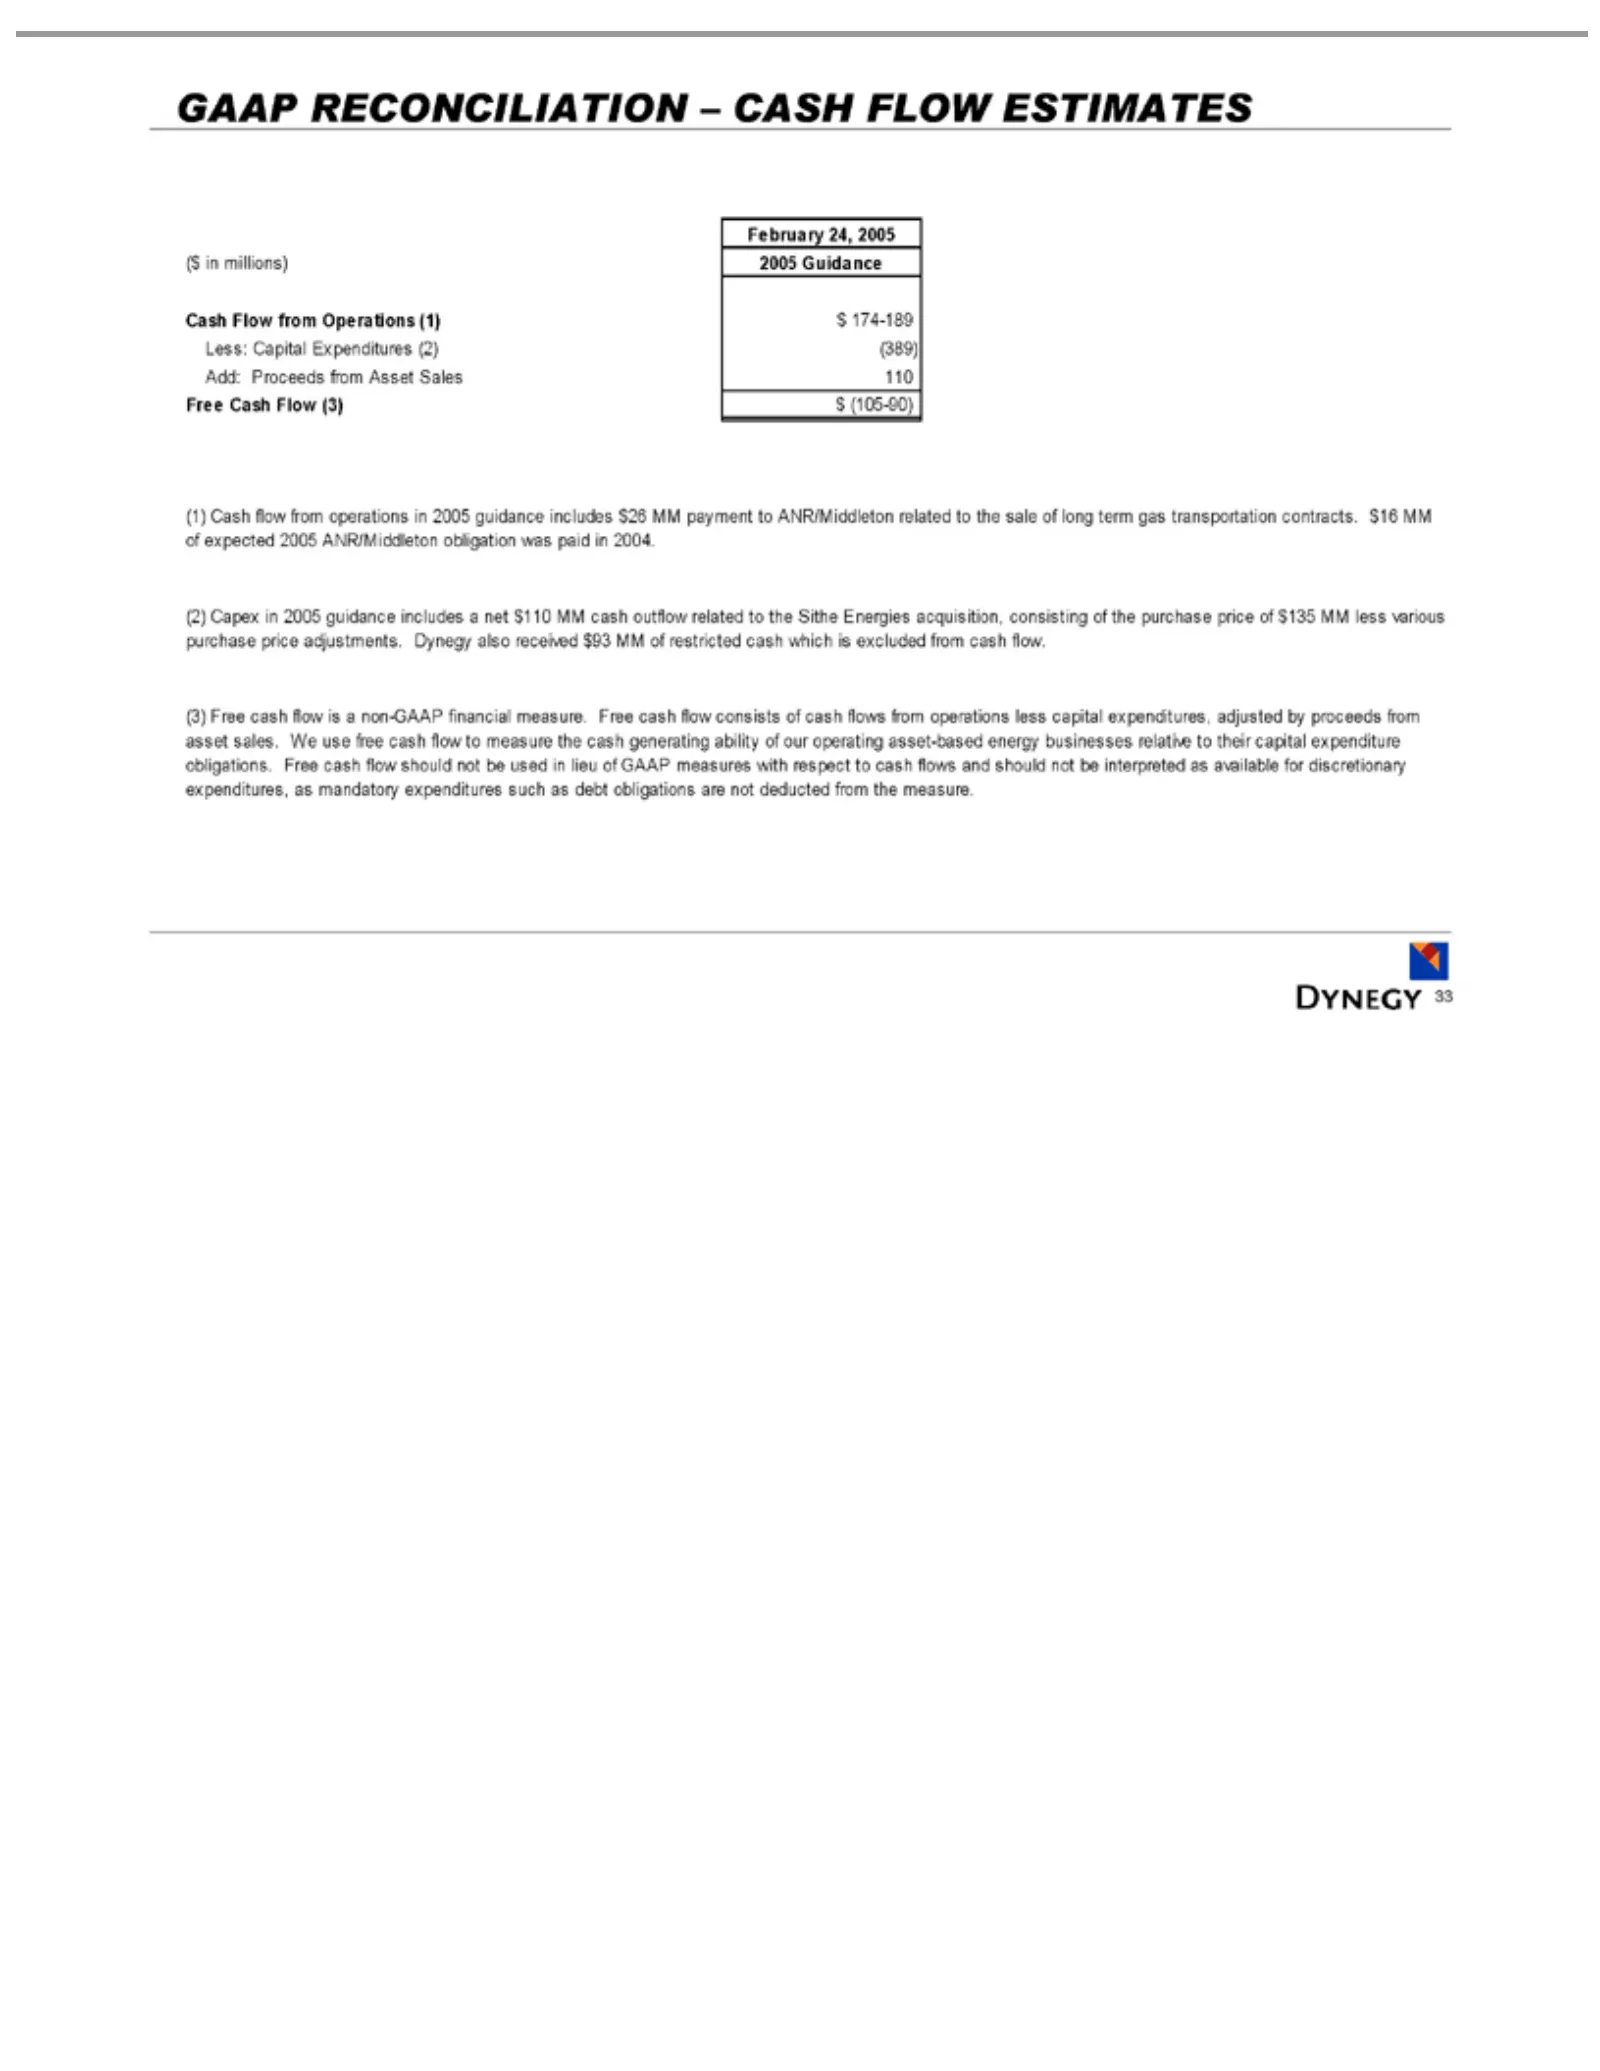
Slide 33: GAAP Reconciliation: Cash Flow Estimates
GAAP February ($in Cash Less: Add: Free (1) obligation (2) Dynegy (3) measure respect 33 Cash Capex Free millions) Cash Proceeds Flow Capital RECONCILIATION toalso cash the flow 24, cash in Flow was from cash 2005 received 2005 flow Expenditures 2005 from from paid flows (3) Operations generating gu
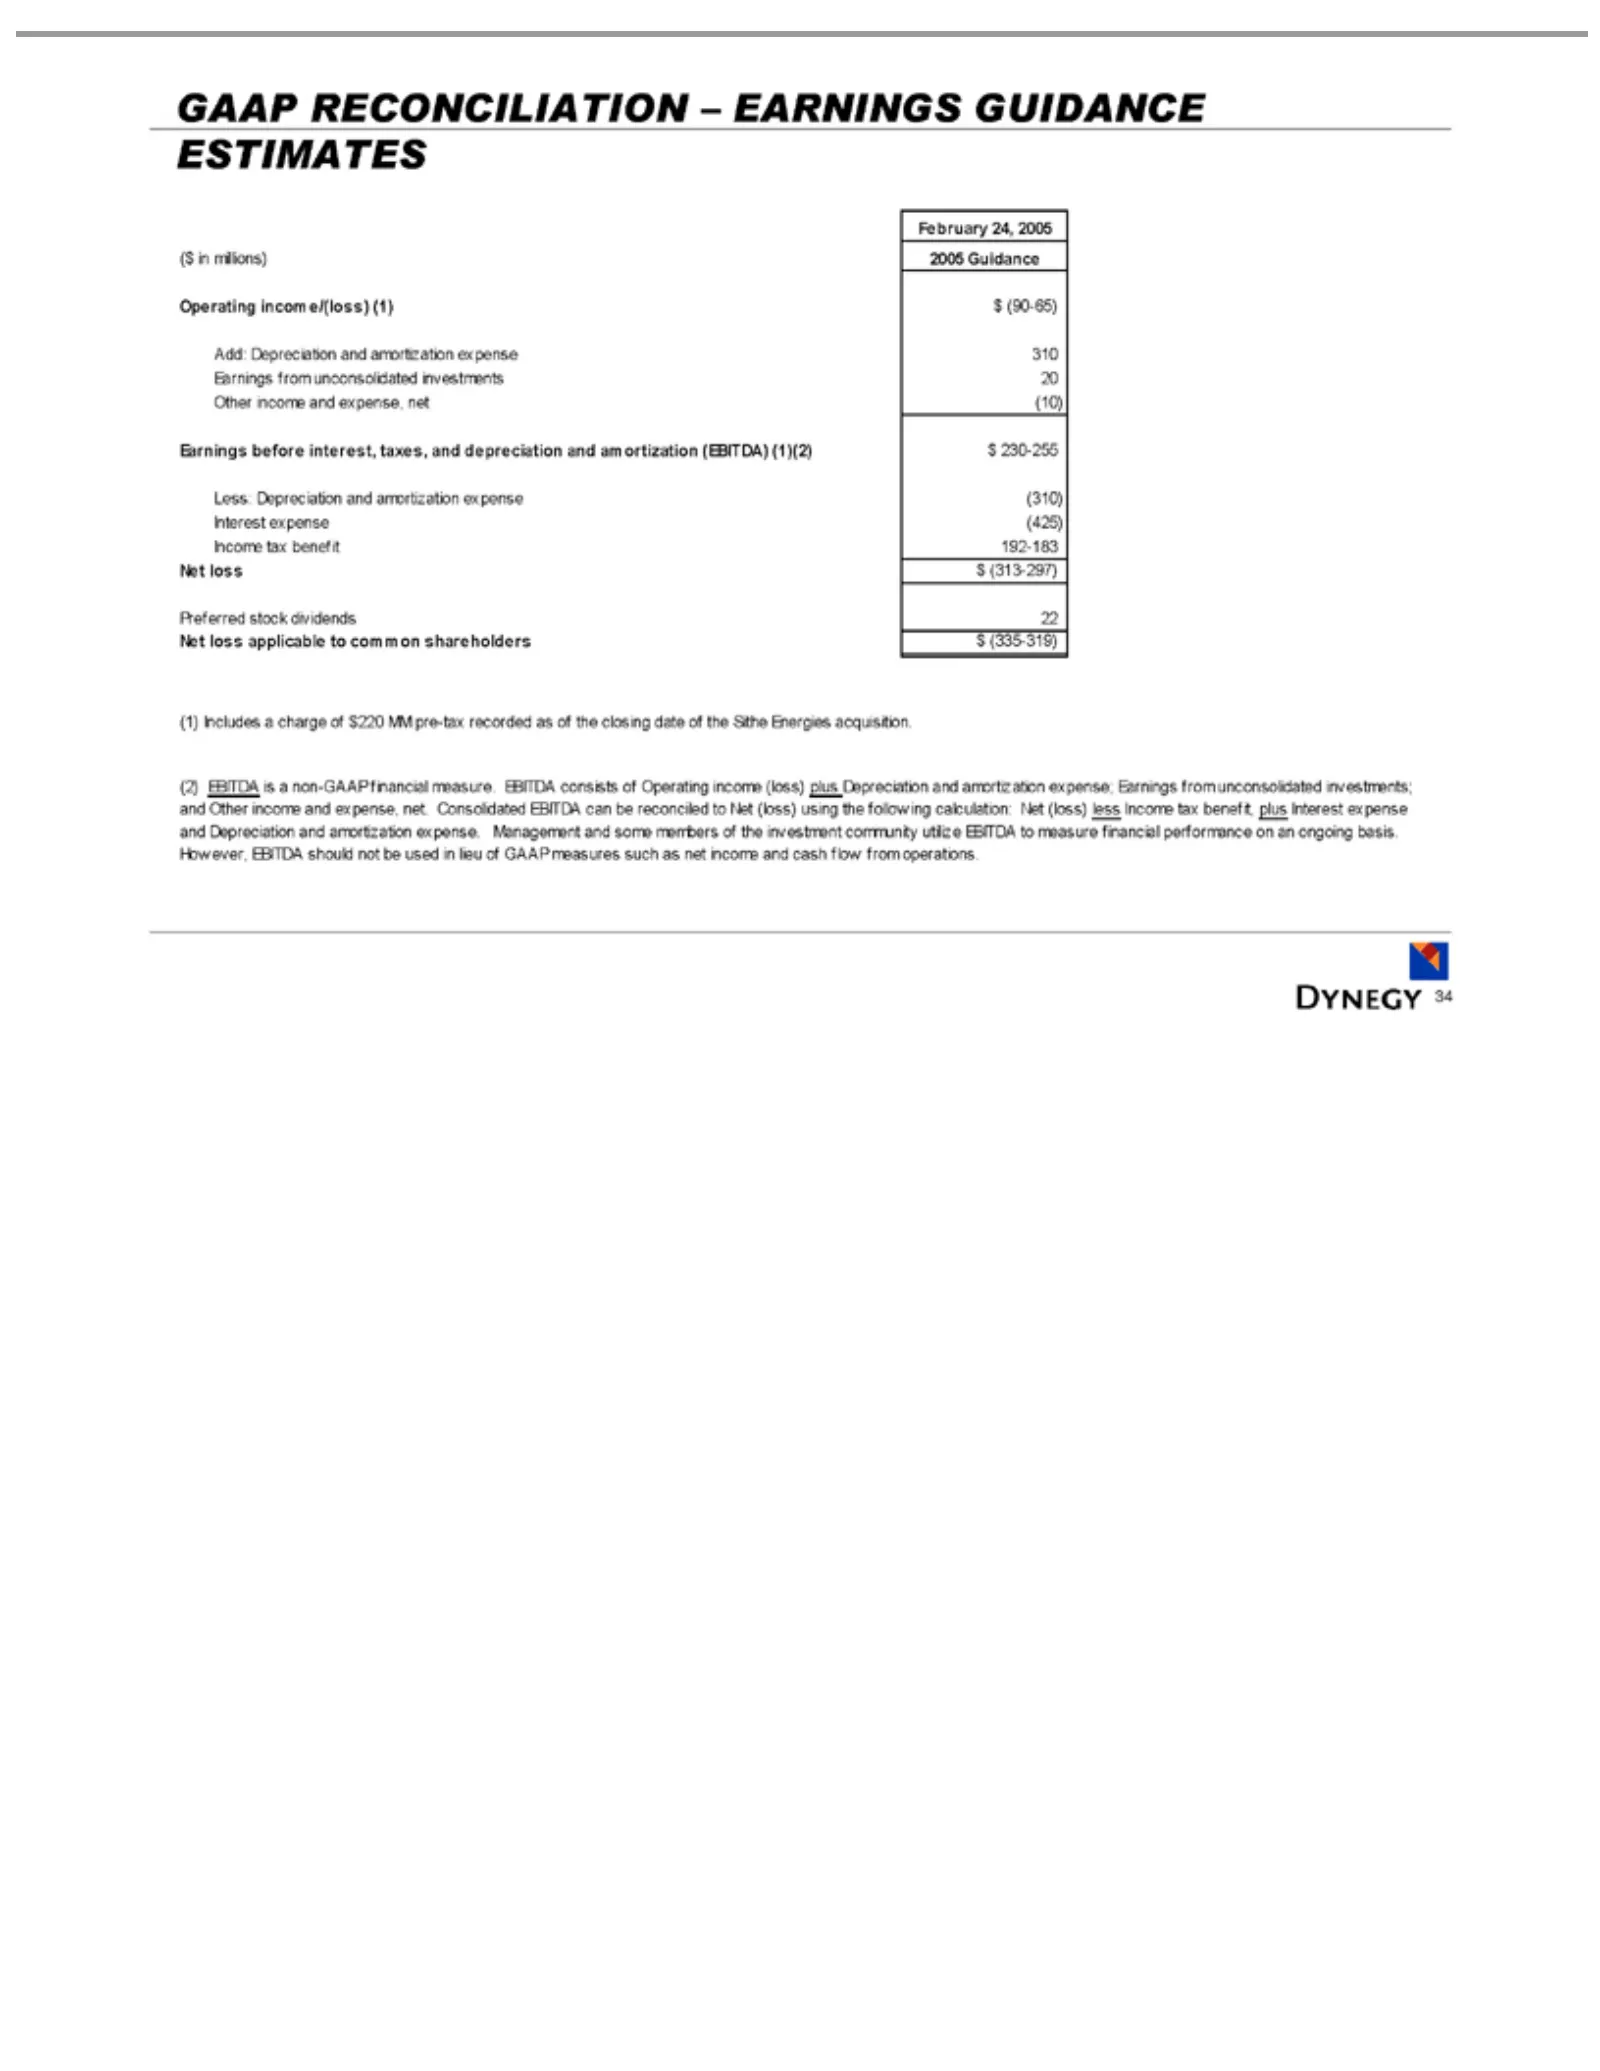
Slide 34: GAAP Reconciliation: Earnings Guidance Estimates
GAAP February ($in Operating Add: Other Earnings Less: Interest Income Preferred Net (1) (2) income (loss) performance 34 Includes EBITDA loss millions) Depreciation Depreciation less income RECONCILIATION and expense tax $(313-297) applicable from before 24, stock Income income/(loss) benefit expen
Source: SEC EDGAR · 8-K filed Apr 4, 2005
More decks from Dynegy Inc
 FY2017 Earnings Presentation30 slides · Feb 26, 2018
 Debt Investor Presentation (December 2017)10 slides · Dec 11, 2017
 Merger or Acquisition (October 2017)28 slides · Oct 31, 2017
 Debt Investor Presentation (October 2016)44 slides · Oct 3, 2016
 IPO Roadshow (June 2016)17 slides · Jun 15, 2016
 Investor Day (April 2014)94 slides · Apr 11, 2014