Timken Company (the) · NYSE:TKR
Timken Company (the) — The Timken Company — Investor Day (June 2014)
134 slides from Timken Company (the)'s investor day presentation, Jun 19, 2014
Slide 1: Timken Investor Day
Timken Investor Day June 19, 2014
Slide 2: Forward-Looking Statements
FORWARD-LOOKING STATEMENTS Certain statements in this presentation (including statements regarding the company's forecasts, estimates and expectations) that are not historical in nature are "forward-looking" statements within the meaning of the Private Securities Litigation Reform Act of 1995. In pa
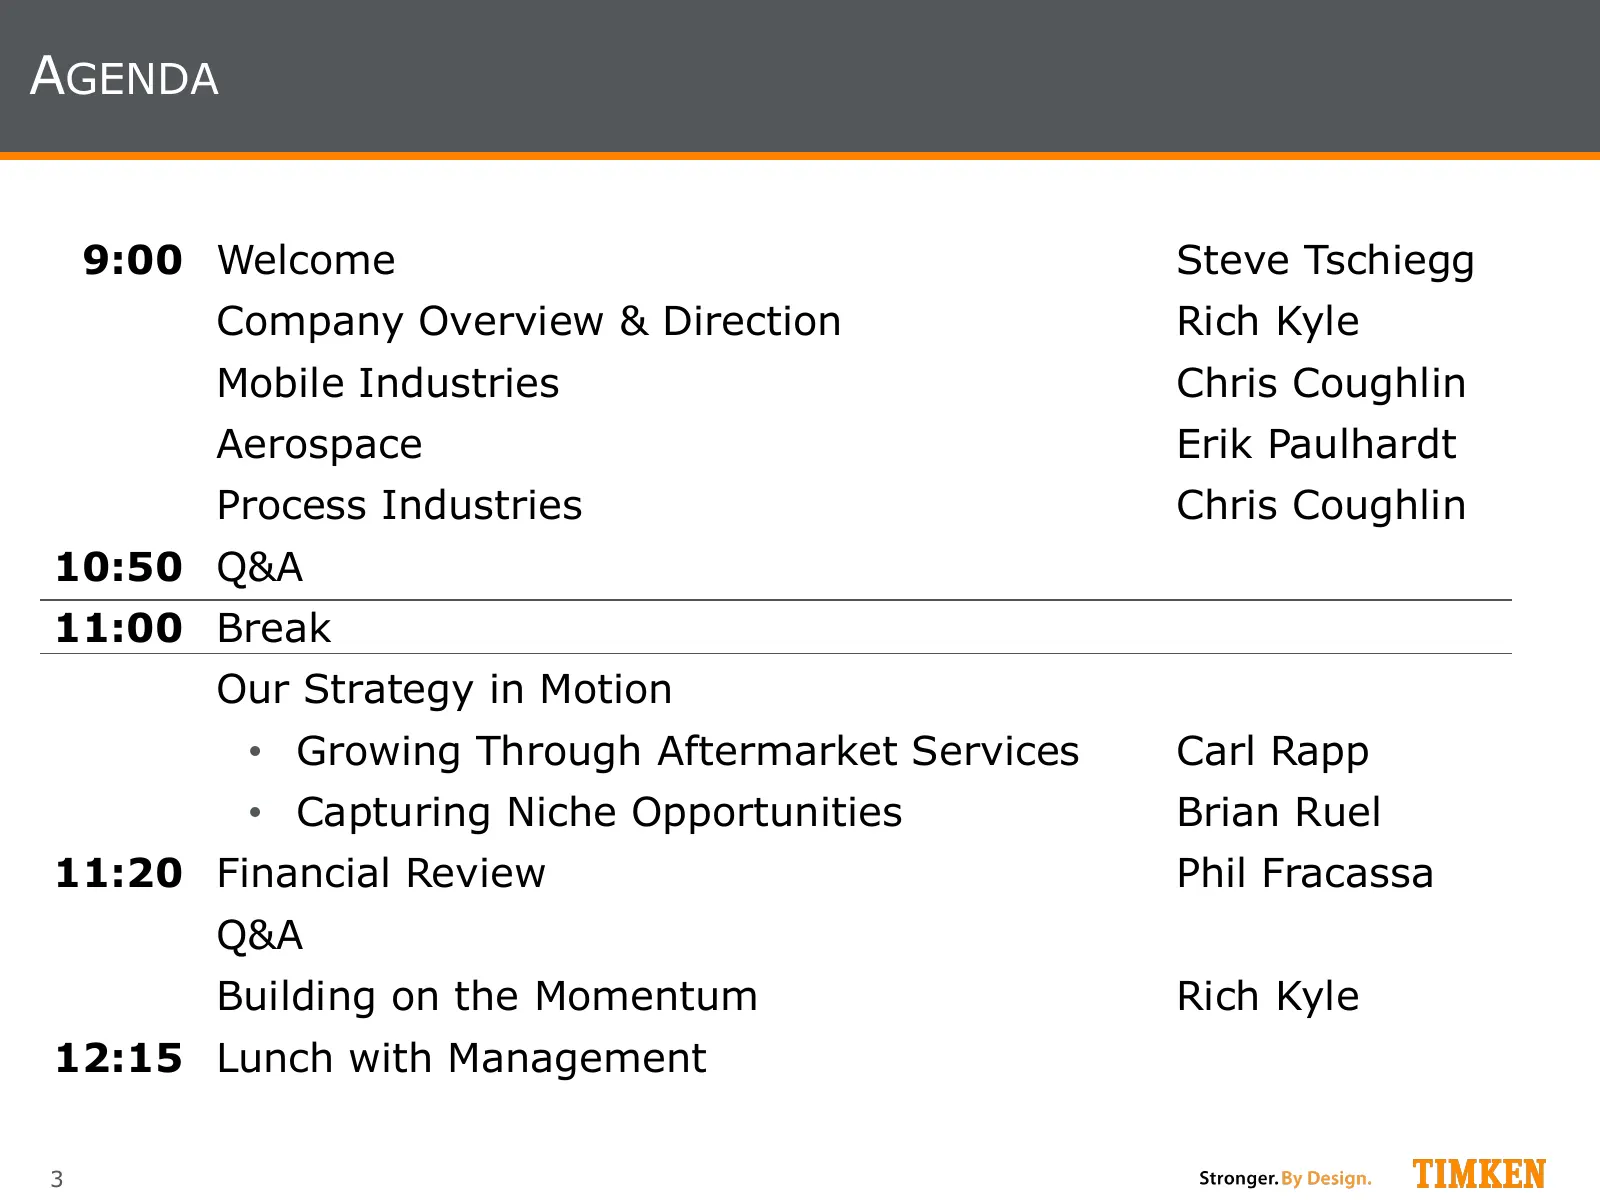
Slide 3: Agenda
AGENDA 9:00 Welcome Steve Tschiegg Company Overview & Direction Rich Kyle Mobile Industries Chris Coughlin Aerospace Erik Paulhardt Process Industries Chris Coughlin 10:50 Q&A 11:00 Break Our Strategy in Motion • Growing Through Aftermarket Services Carl Rapp • Capturing Niche Opportunities Brian Ru
Slide 4: Company Overview and Direction
Company Overview and Direction Rich Kyle, President and CEO
Slide 5: Timken at a Glance | Pro Forma
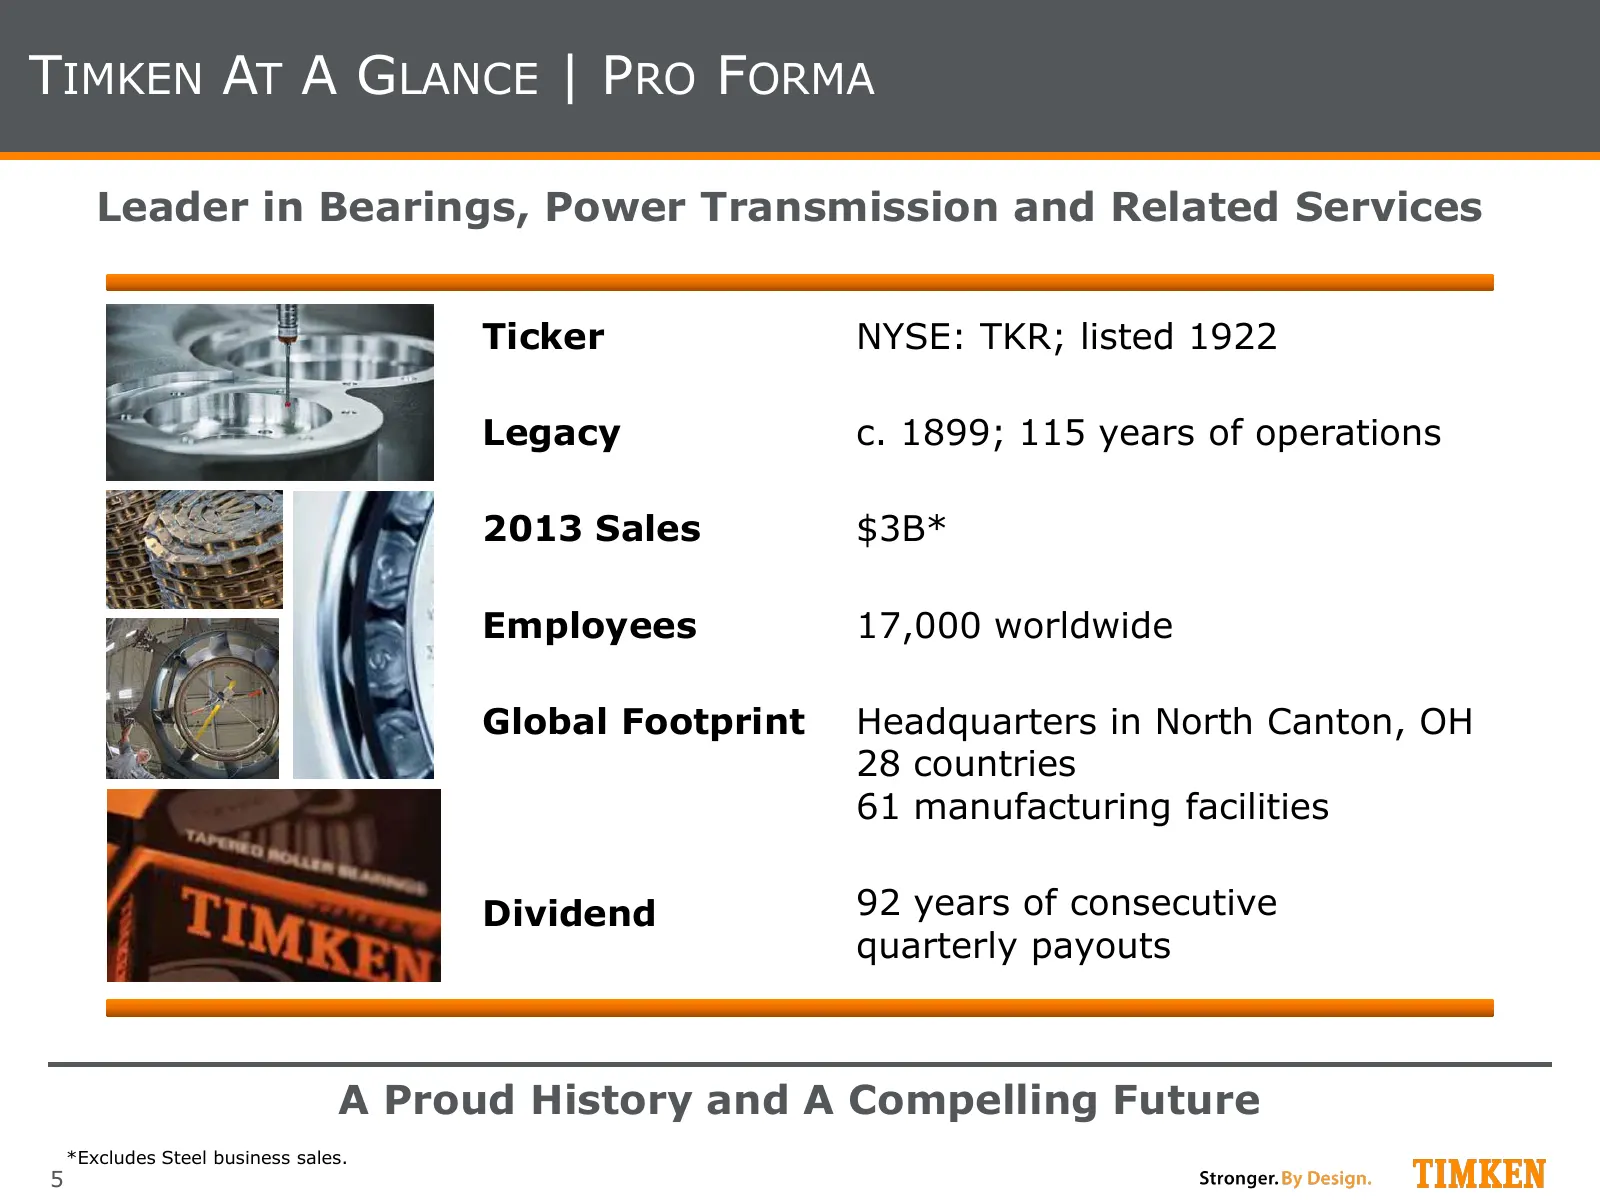
TIMKEN AT A GLANCE | PRO FORMA Leader in Bearings, Power Transmission and Related Services Ticker NYSE: TKR; listed 1922 Legacy c. 1899; 115 years of operations 2013 Sales $3B* Employees 17,000 worldwide Global Footprint Headquarters in North Canton, OH 28 countries 61 manufacturing facilities Divid
Slide 6: What You'll Hear Today
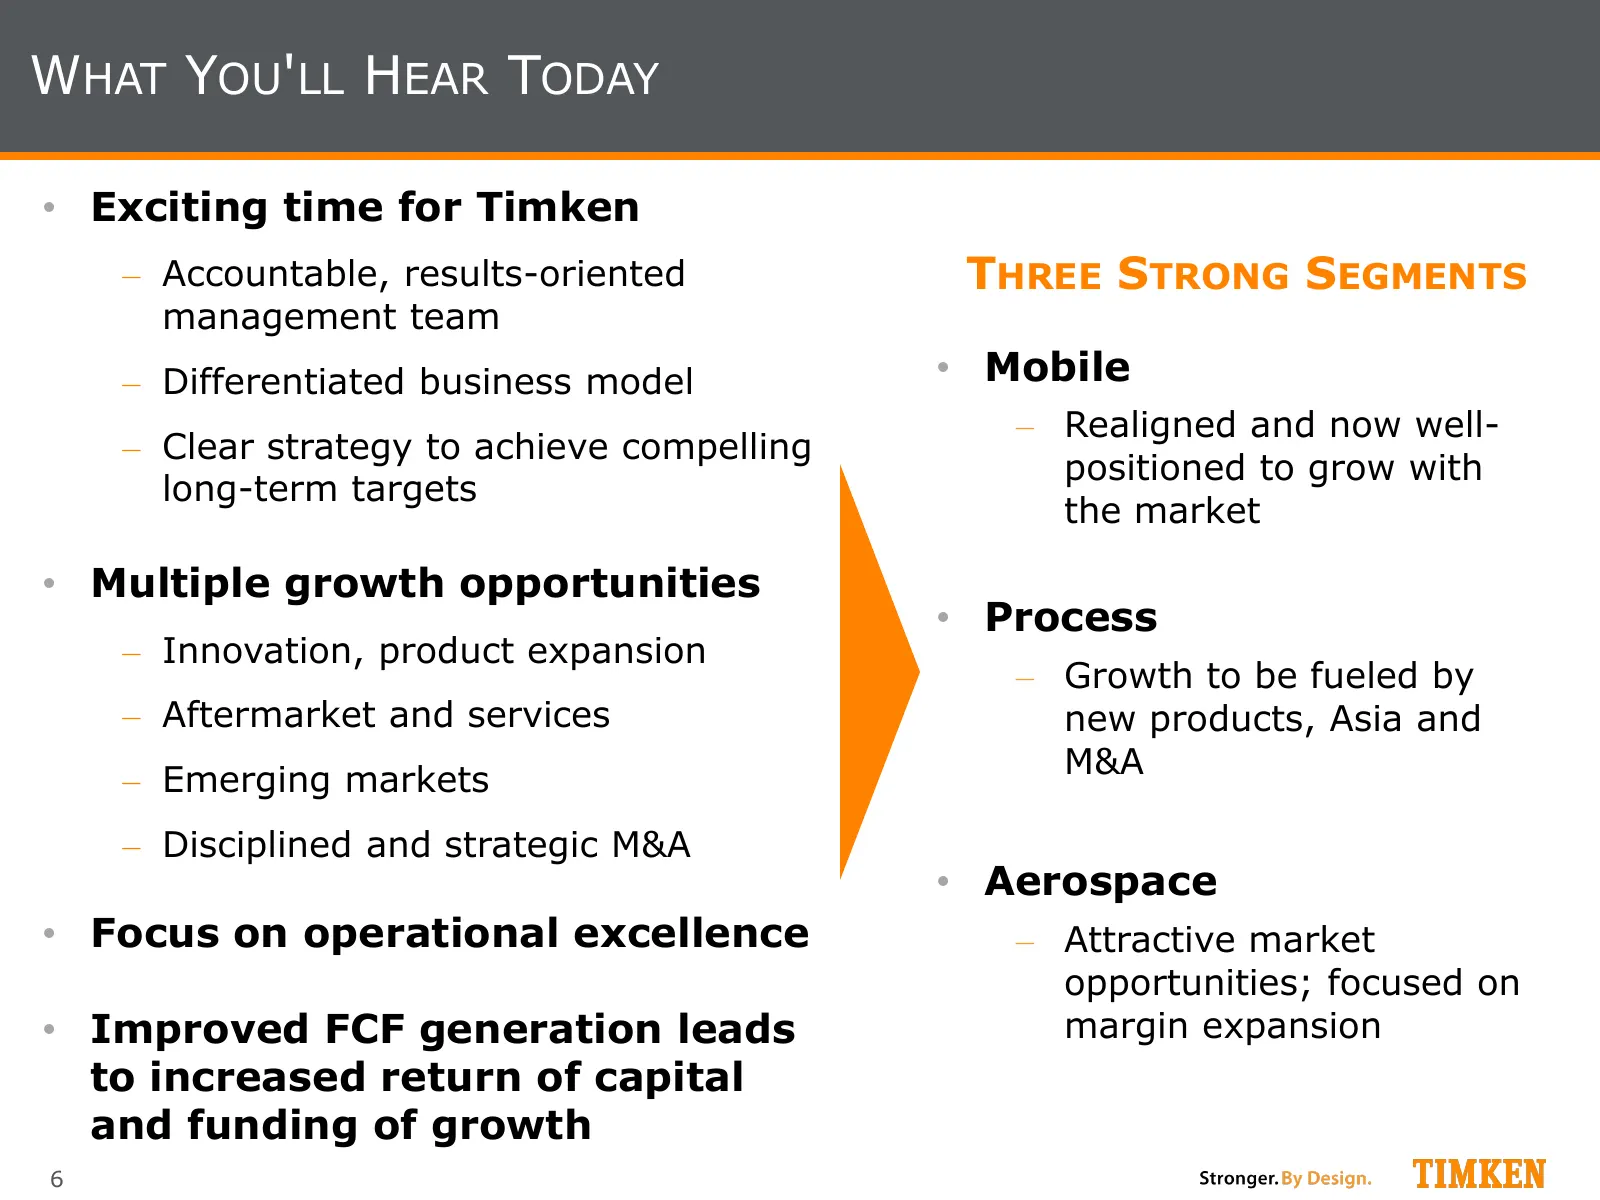
WHAT YOU'LL HEAR TODAY • Exciting time for Timken ‒ Accountable, results-oriented THREE STRONG SEGMENTS management team ‒ Differentiated business model • Mobile ‒ Realigned and now well- ‒ Clear strategy to achieve compelling positioned to grow with long-term targets the market • Multiple growth opp
Slide 7: Experienced Business Leaders
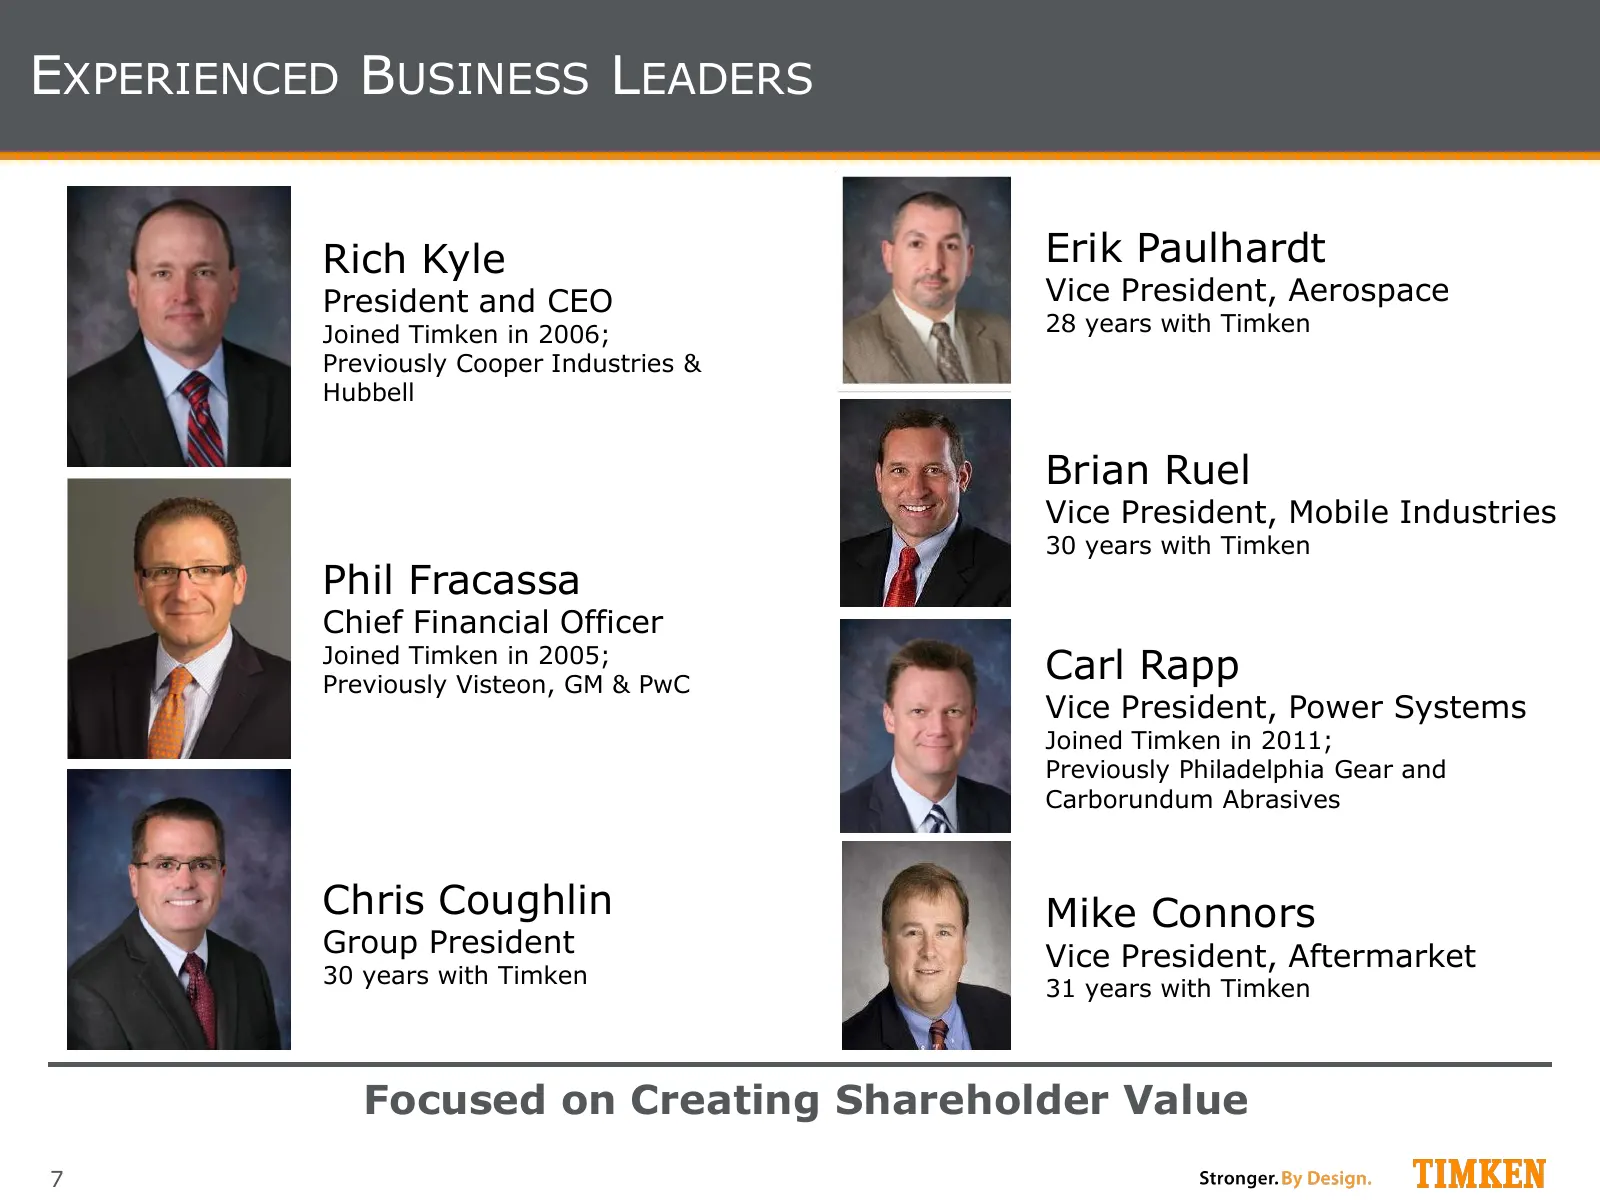
EXPERIENCED BUSINESS LEADERS Rich Kyle Erik Paulhardt President and CEO Vice President, Aerospace Joined Timken in 2006; 28 years with Timken Previously Cooper Industries & Hubbell Brian Ruel Vice President, Mobile Industries 30 years with Timken Phil Phil Fracassa Fracassa Chief Financial & Vice Pr
Slide 8: The Timken Transformation 2007-2014
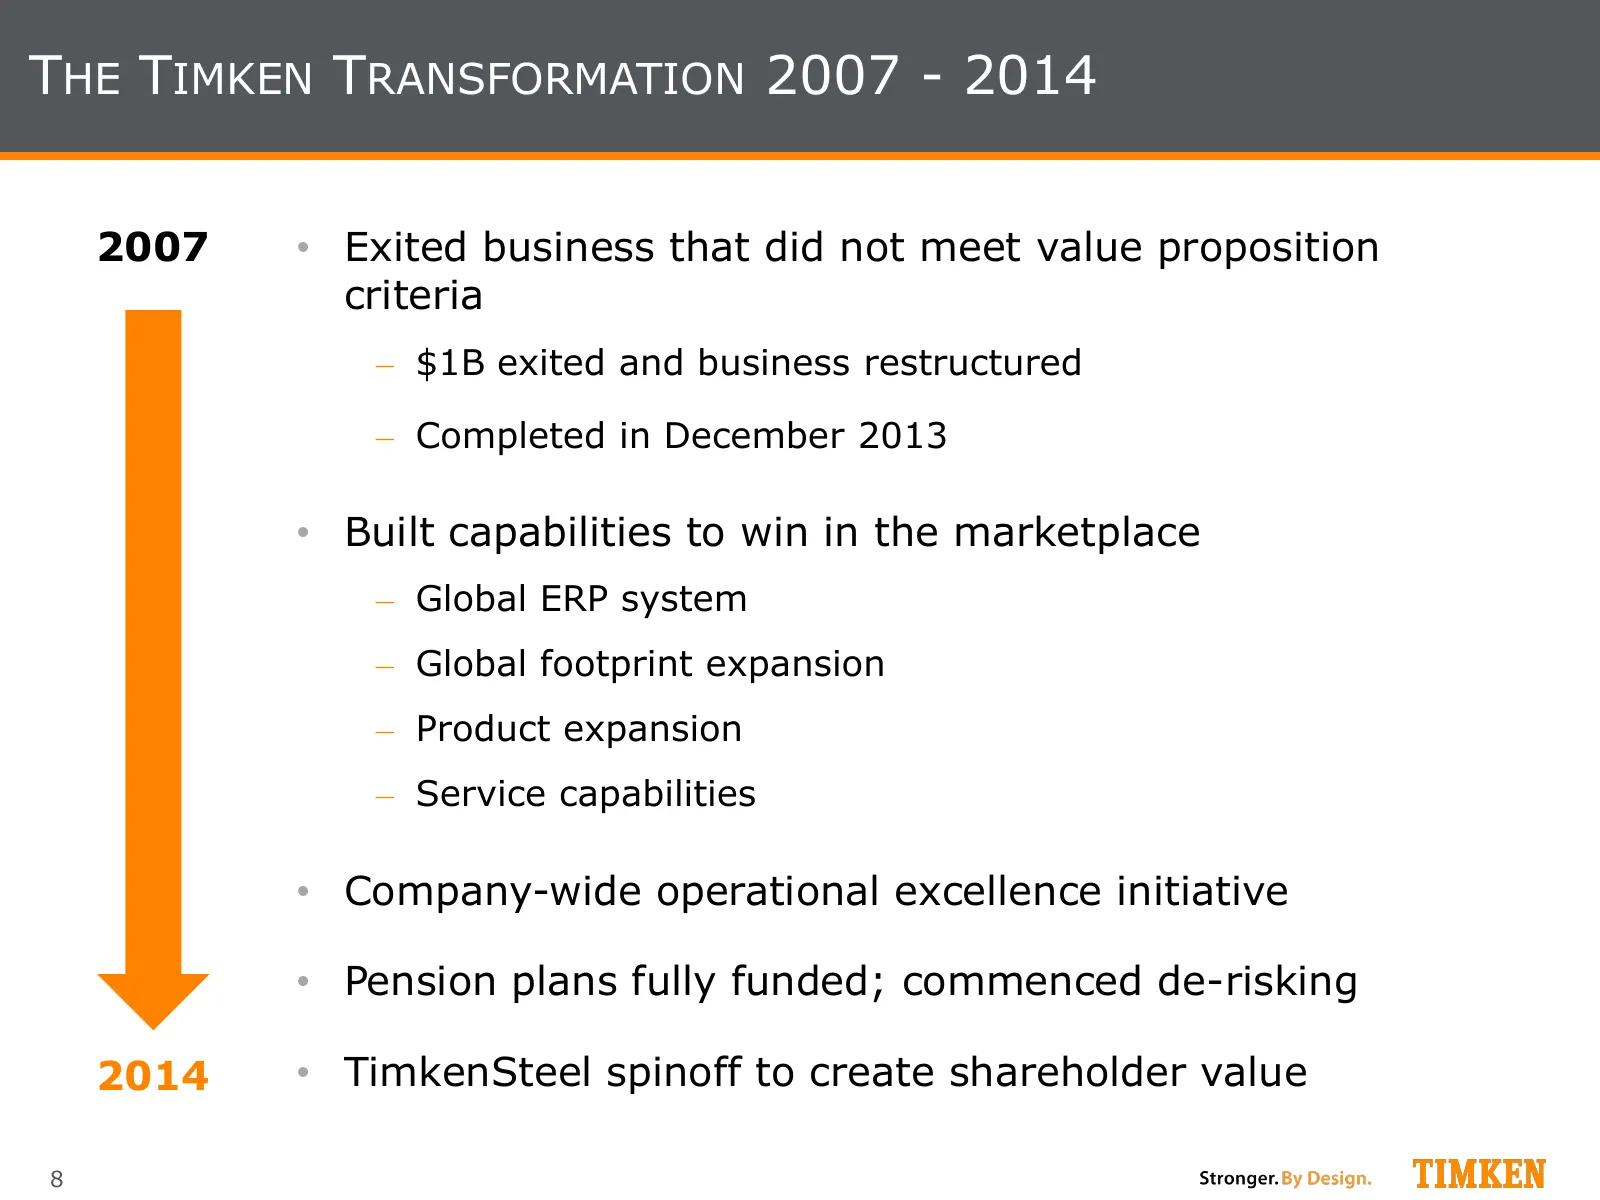
THE TIMKEN TRANSFORMATION 2007 - 2014 2007 • Exited business that did not meet value proposition criteria ‒ $1B exited and business restructured ‒ Completed in December 2013 • Built capabilities to win in the marketplace ‒ Global ERP system ‒ Global footprint expansion ‒ Product expansion ‒ Service
Slide 9: Timken Improved Financial Performance (Ex. Steel)
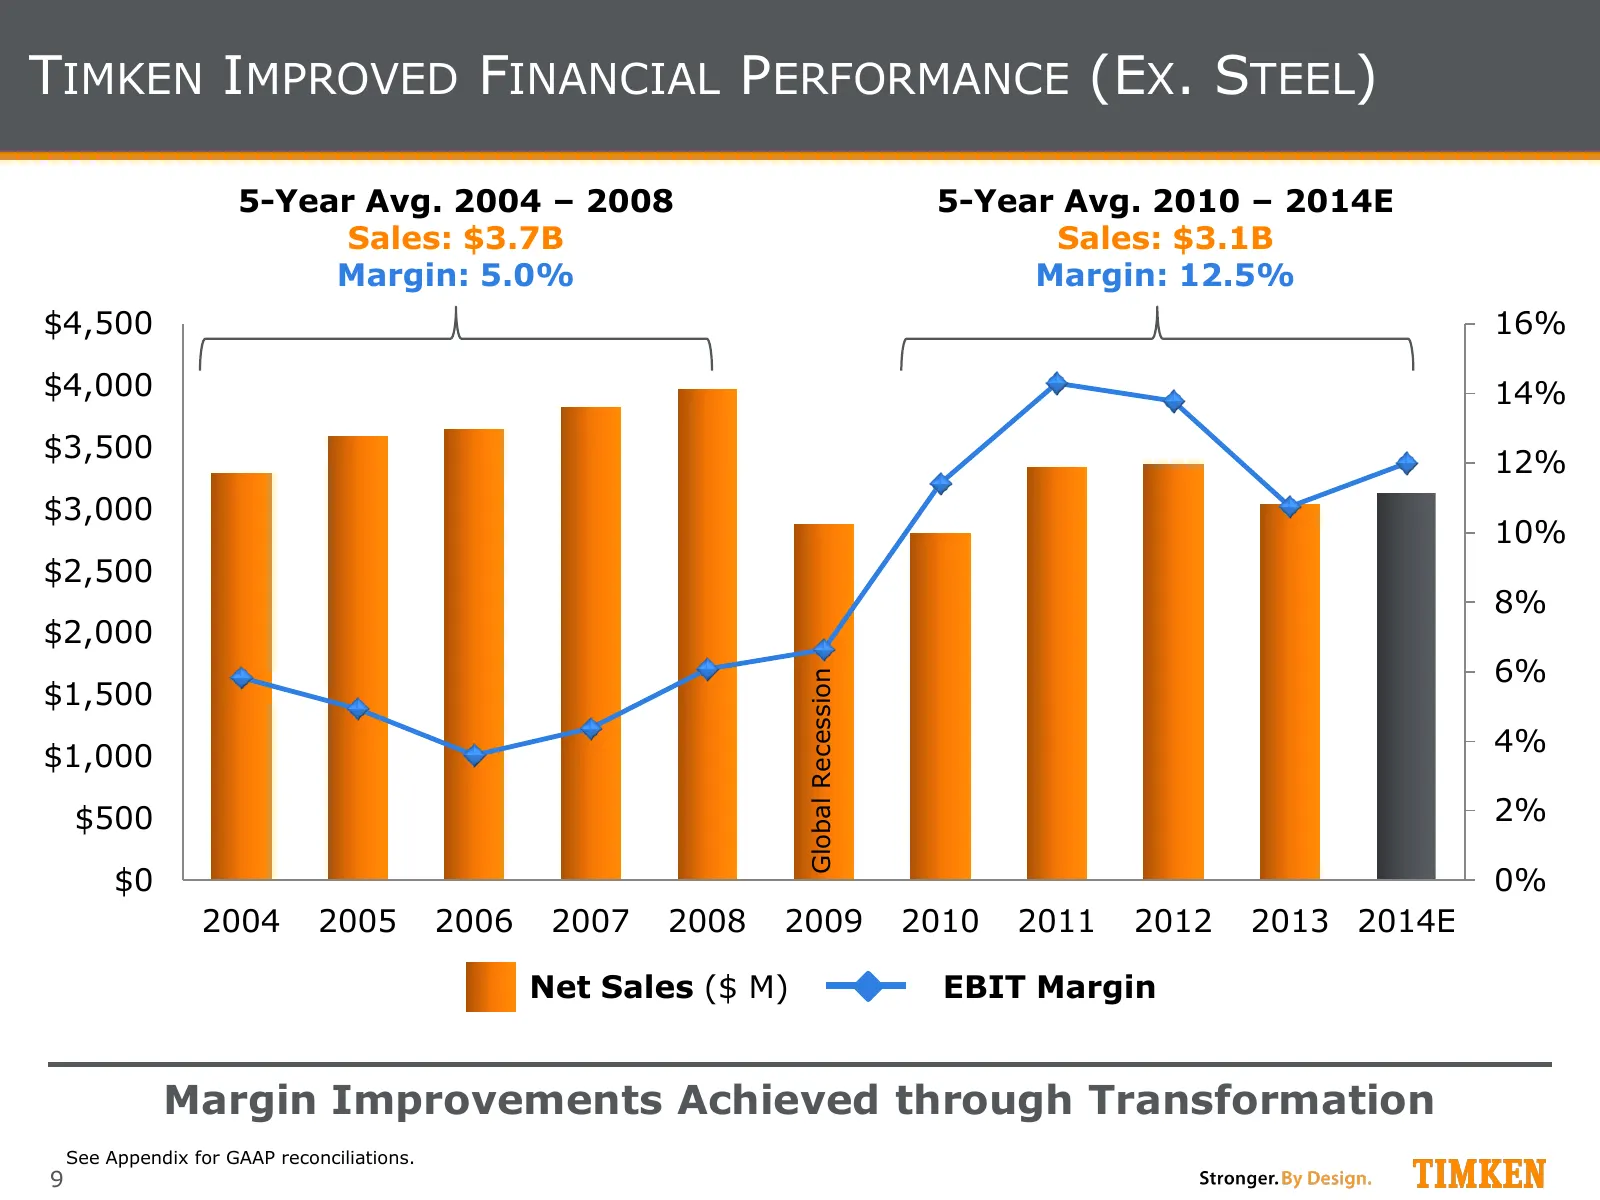
TIMKEN IMPROVED FINANCIAL PERFORMANCE (EX. STEEL) 5-Year Avg. 2004 – 2008 5-Year Avg. 2010 – 2014E Sales: $3.7B Sales: $3.1B Margin: 5.0% Margin: 12.5% $4,500 16% $4,000 14% $3,500 12% $3,000 10% $2,500 8% $2,000 6% Global Recession $1,500 $1,000 4% $500 2% $0 0% 2004 2005 2006 2007 2008 2009 2010 2
Slide 10: Timken Overview
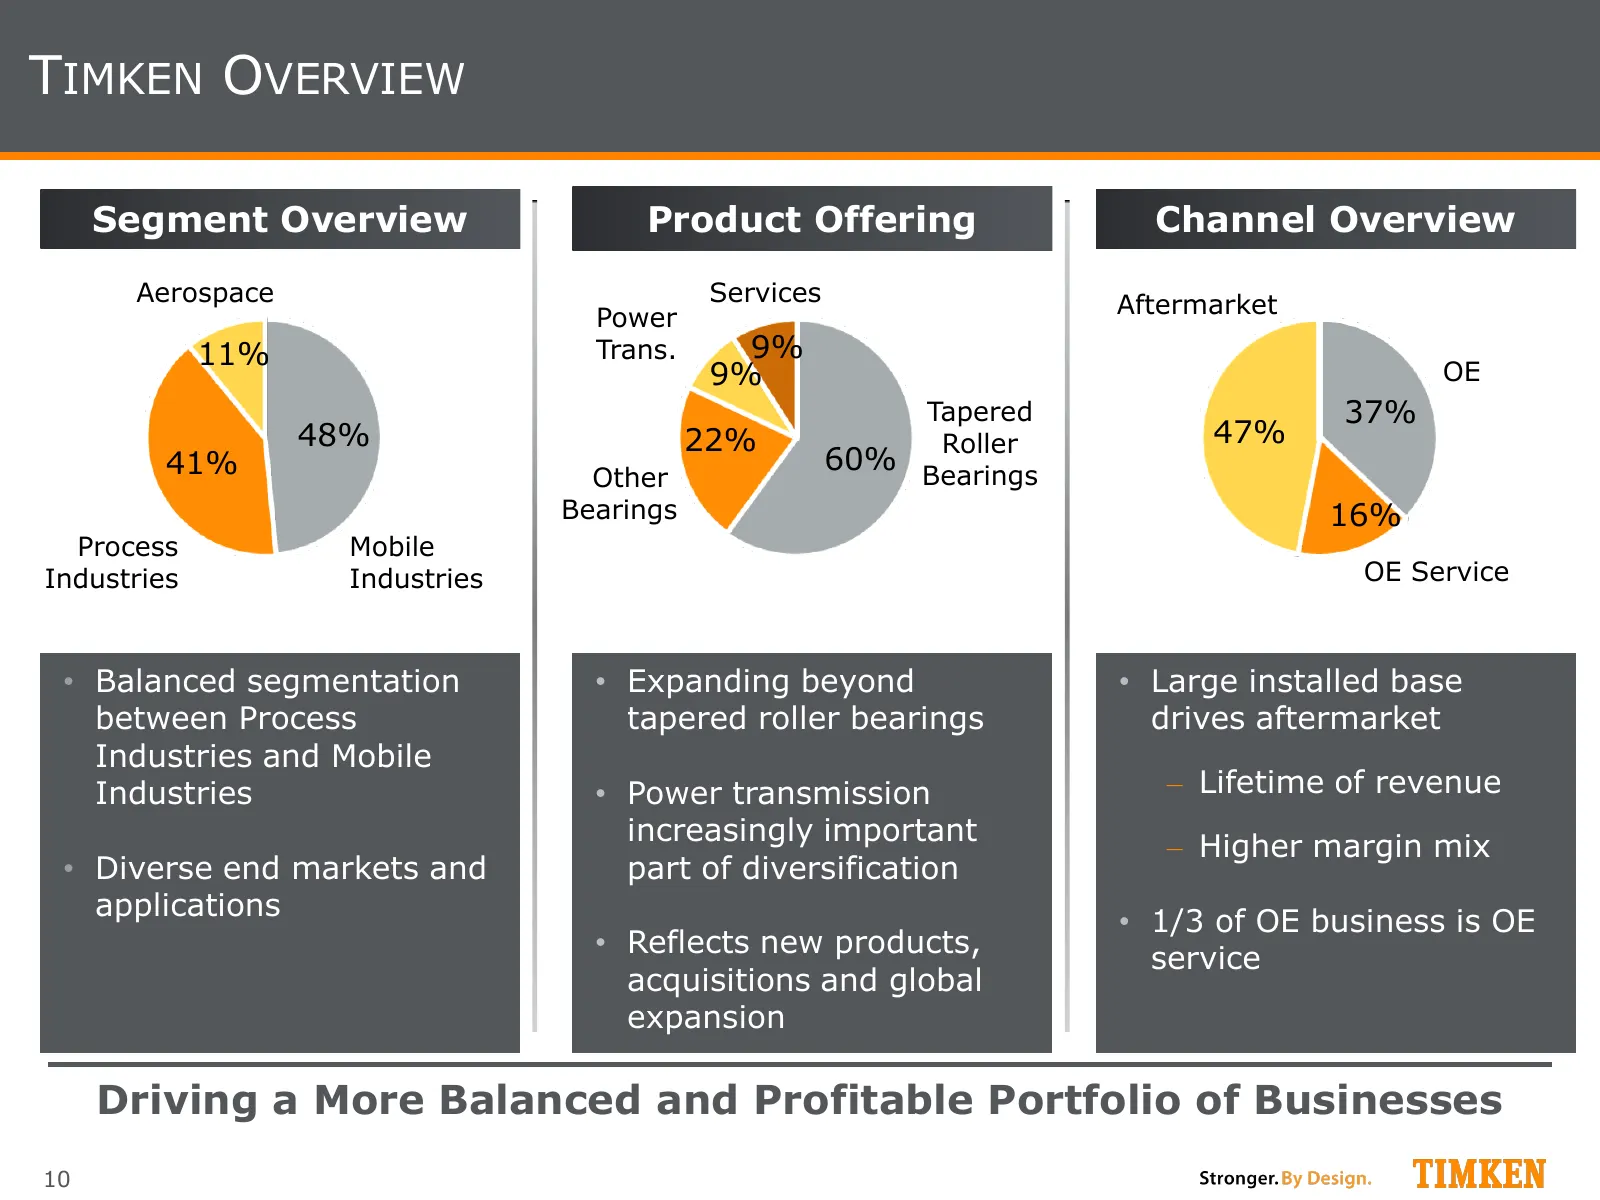
TIMKEN OVERVIEW Segment Overview Product Offering Channel Overview Aerospace Services Aftermarket Power 11% Trans. 9% 9% OE Tapered 37% 48% 22% Roller 47% 41% 60% Bearings Other Bearings 16% Process Mobile Industries Industries OE Service • Balanced segmentation • Expanding beyond • Large installed
Slide 11: Operating in 28 Countries Across the Globe
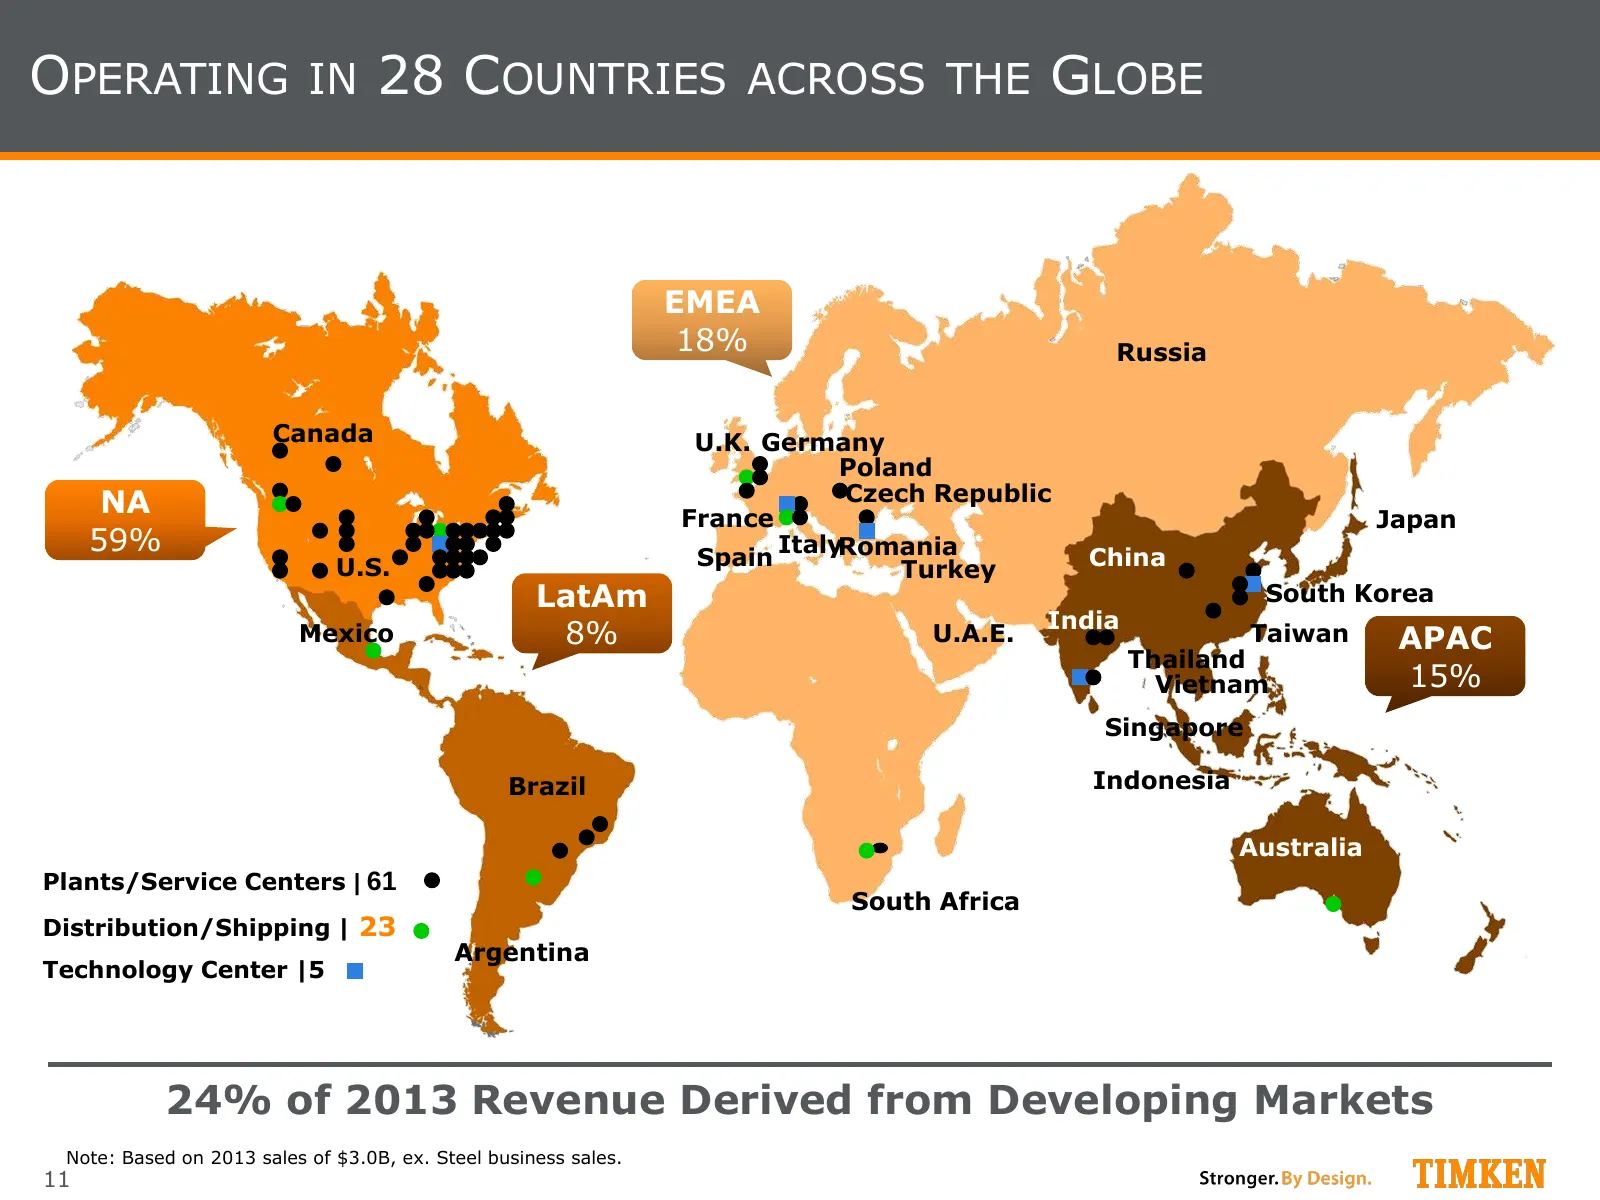
OPERATING IN 28 COUNTRIES ACROSS THE GLOBE EMEA 18% Russia Canada U.K. Germany Poland NA Czech Republic France Japan 59% Spain ItalyRomania China U.S. Turkey LatAm South Korea India Mexico 8% U.A.E. Taiwan APAC Thailand Vietnam 15% Singapore Brazil Indonesia Australia Plants/Service Centers | 61 Sou
Slide 12: Multi-Level Diversification
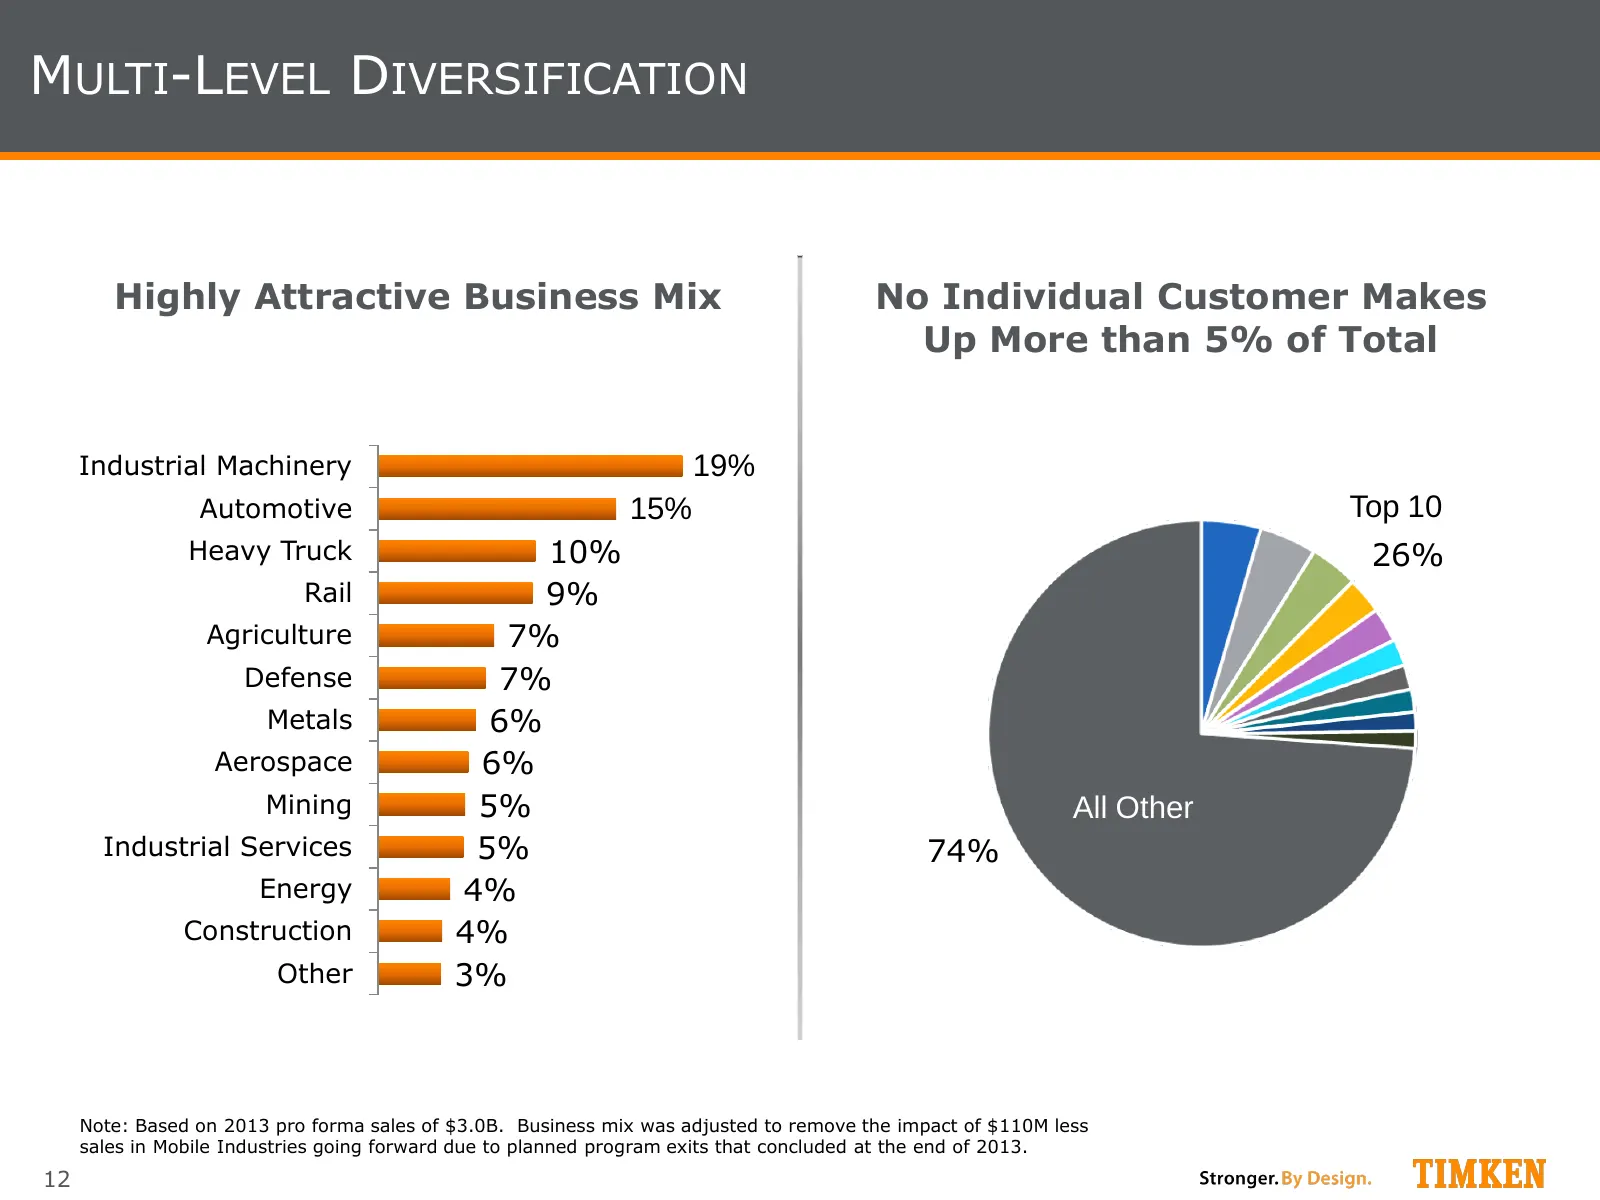
MULTI-LEVEL DIVERSIFICATION Highly Attractive Business Mix No Individual Customer Makes Up More than 5% of Total Industrial Machinery 19% Automotive 15% Top 10 Heavy Truck 10% 26% Rail 9% Agriculture 7% Defense 7% Metals 6% Aerospace 6% Mining 5% All Other Industrial Services 5% 74% Energy 4% Constr
Slide 13: Global Bearing Industry: $55B
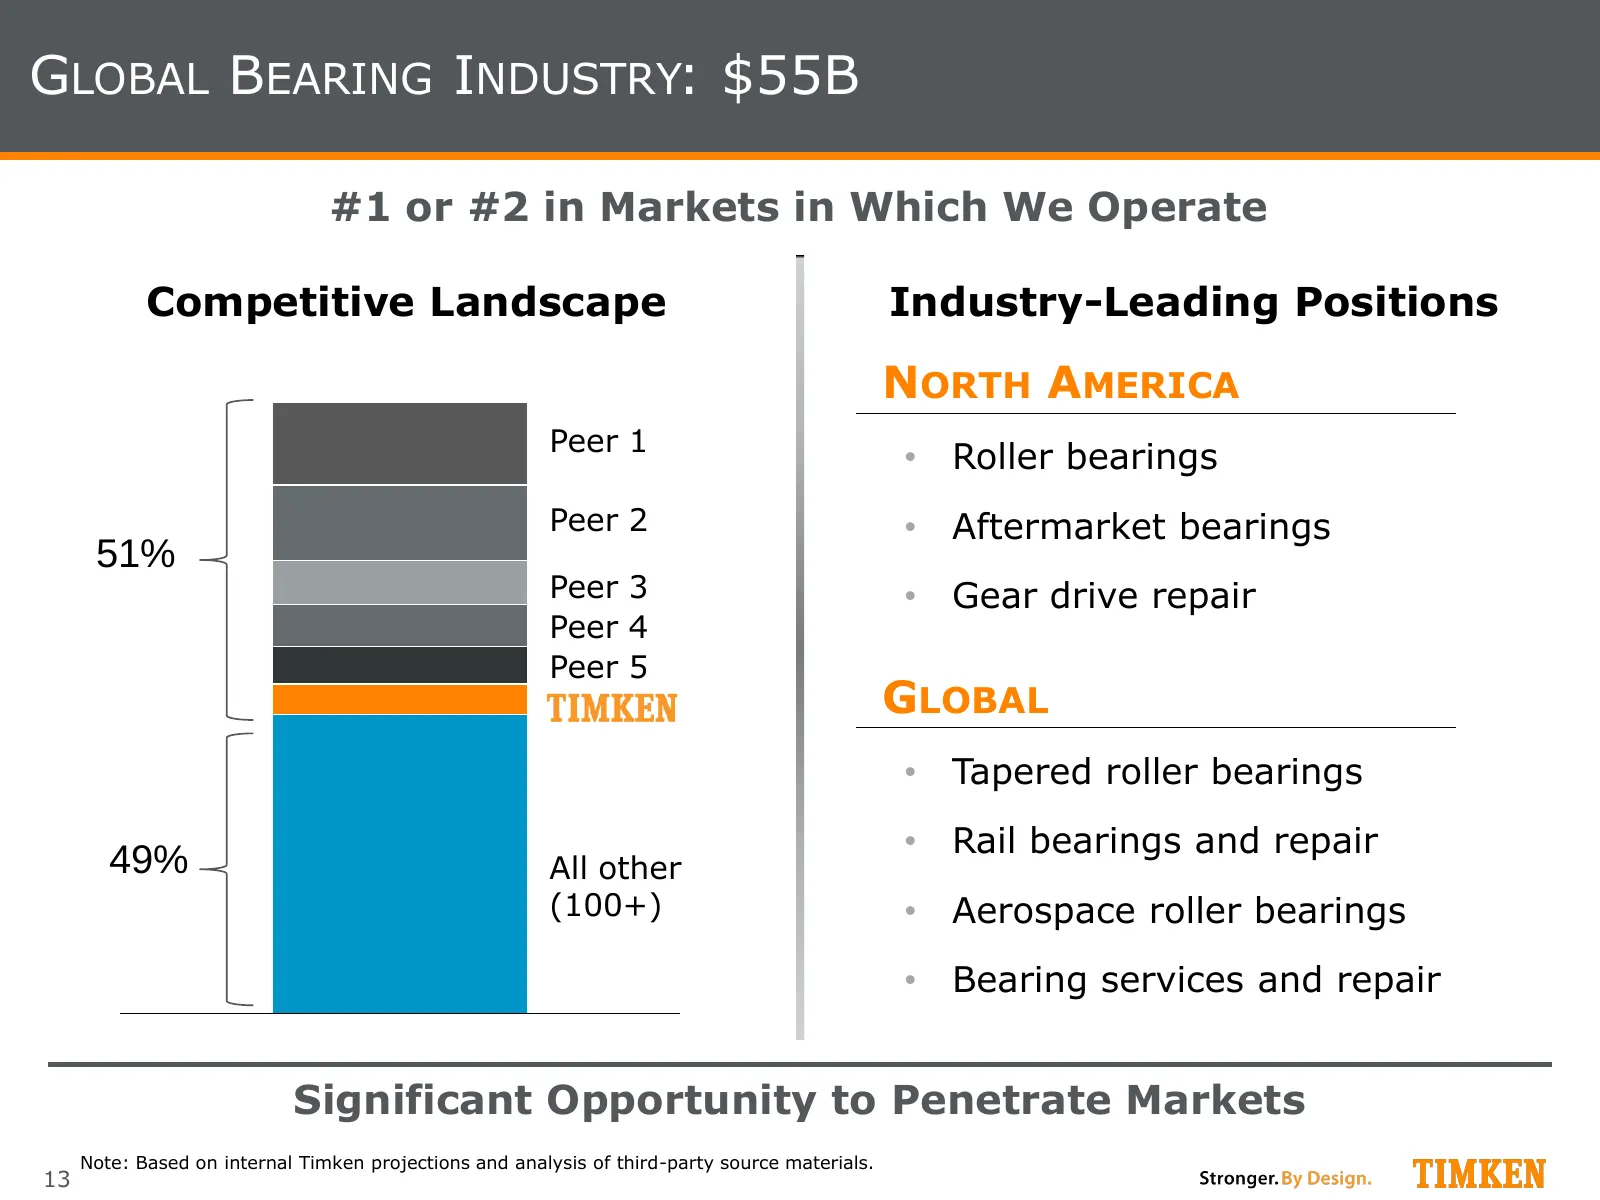
GLOBAL BEARING INDUSTRY: $55B #1 or #2 in Markets in Which We Operate Competitive Landscape Industry-Leading Positions NORTH AMERICA Peer 1 • Roller bearings Peer 2 • Aftermarket bearings 51% Peer 3 • Gear drive repair Peer 4 Peer 5 GLOBAL • Tapered roller bearings • Rail bearings and repair 49% All
Slide 14: The Growth Plan: What You Can Expect
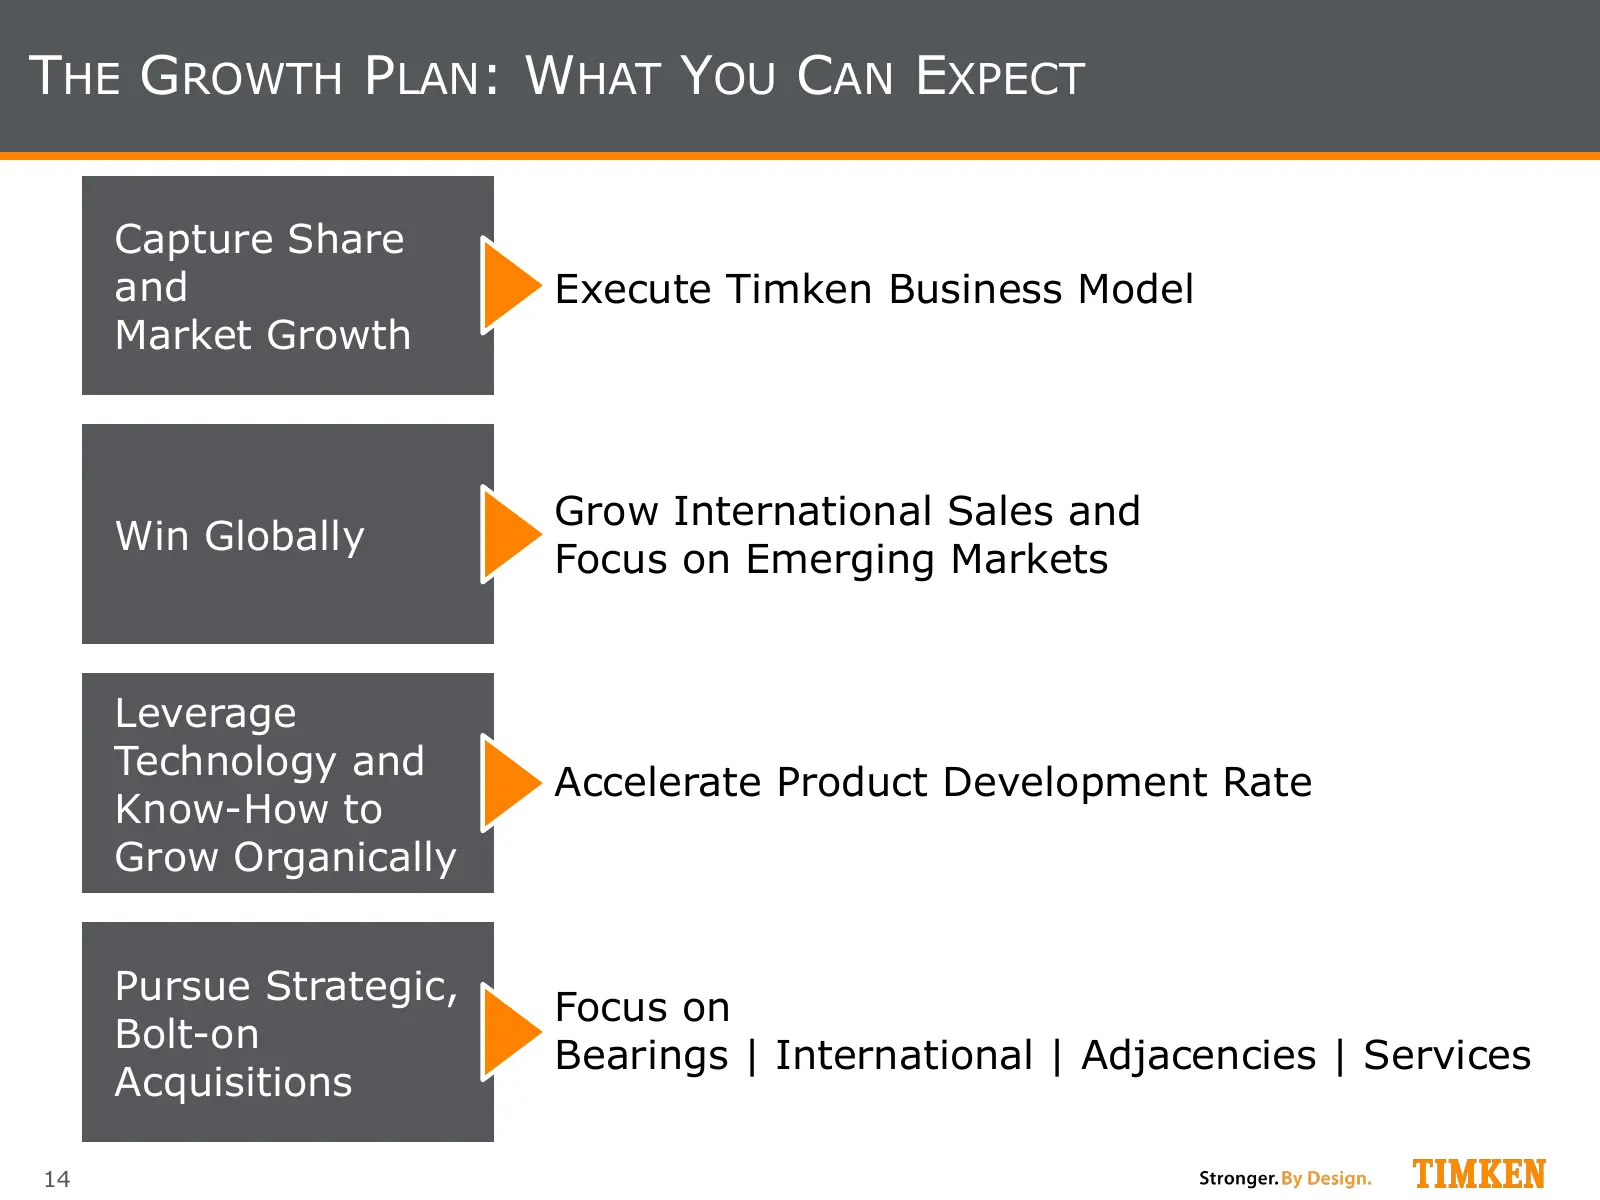
THE GROWTH PLAN: WHAT YOU CAN EXPECT Capture Share and Execute Timken Business Model Market Growth Grow International Sales and Win Globally Focus on Emerging Markets Leverage Technology and Accelerate Product Development Rate Know-How to Grow Organically Pursue Strategic, Focus on Bolt-on Bearings
Slide 15: The Timken Business Model
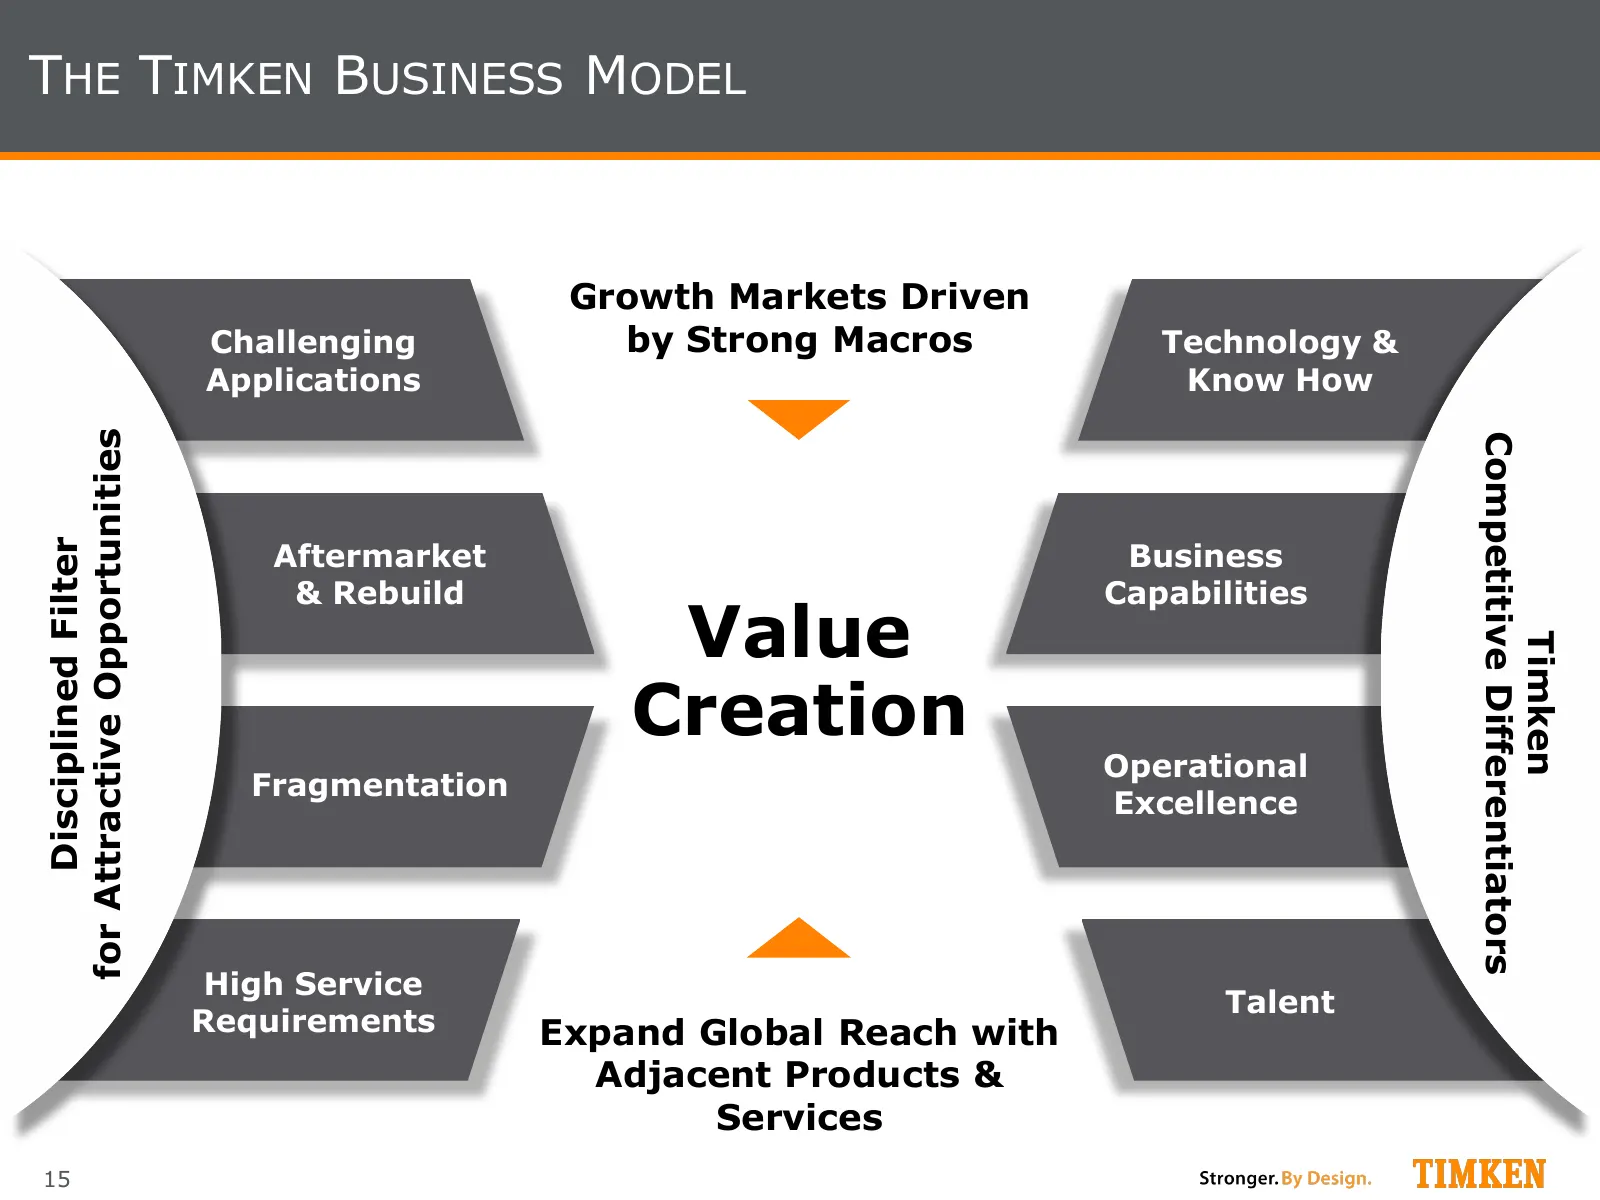
THE TIMKEN BUSINESS MODEL Growth Markets Driven Challenging by Strong Macros Technology & Applications Know How for Attractive Opportunities Competitive Differentiators Aftermarket Business Disciplined Filter & Rebuild Capabilities Value Timken Creation Operational Fragmentation Excellence High Serv
Slide 16: Business Model: Challenging Applications
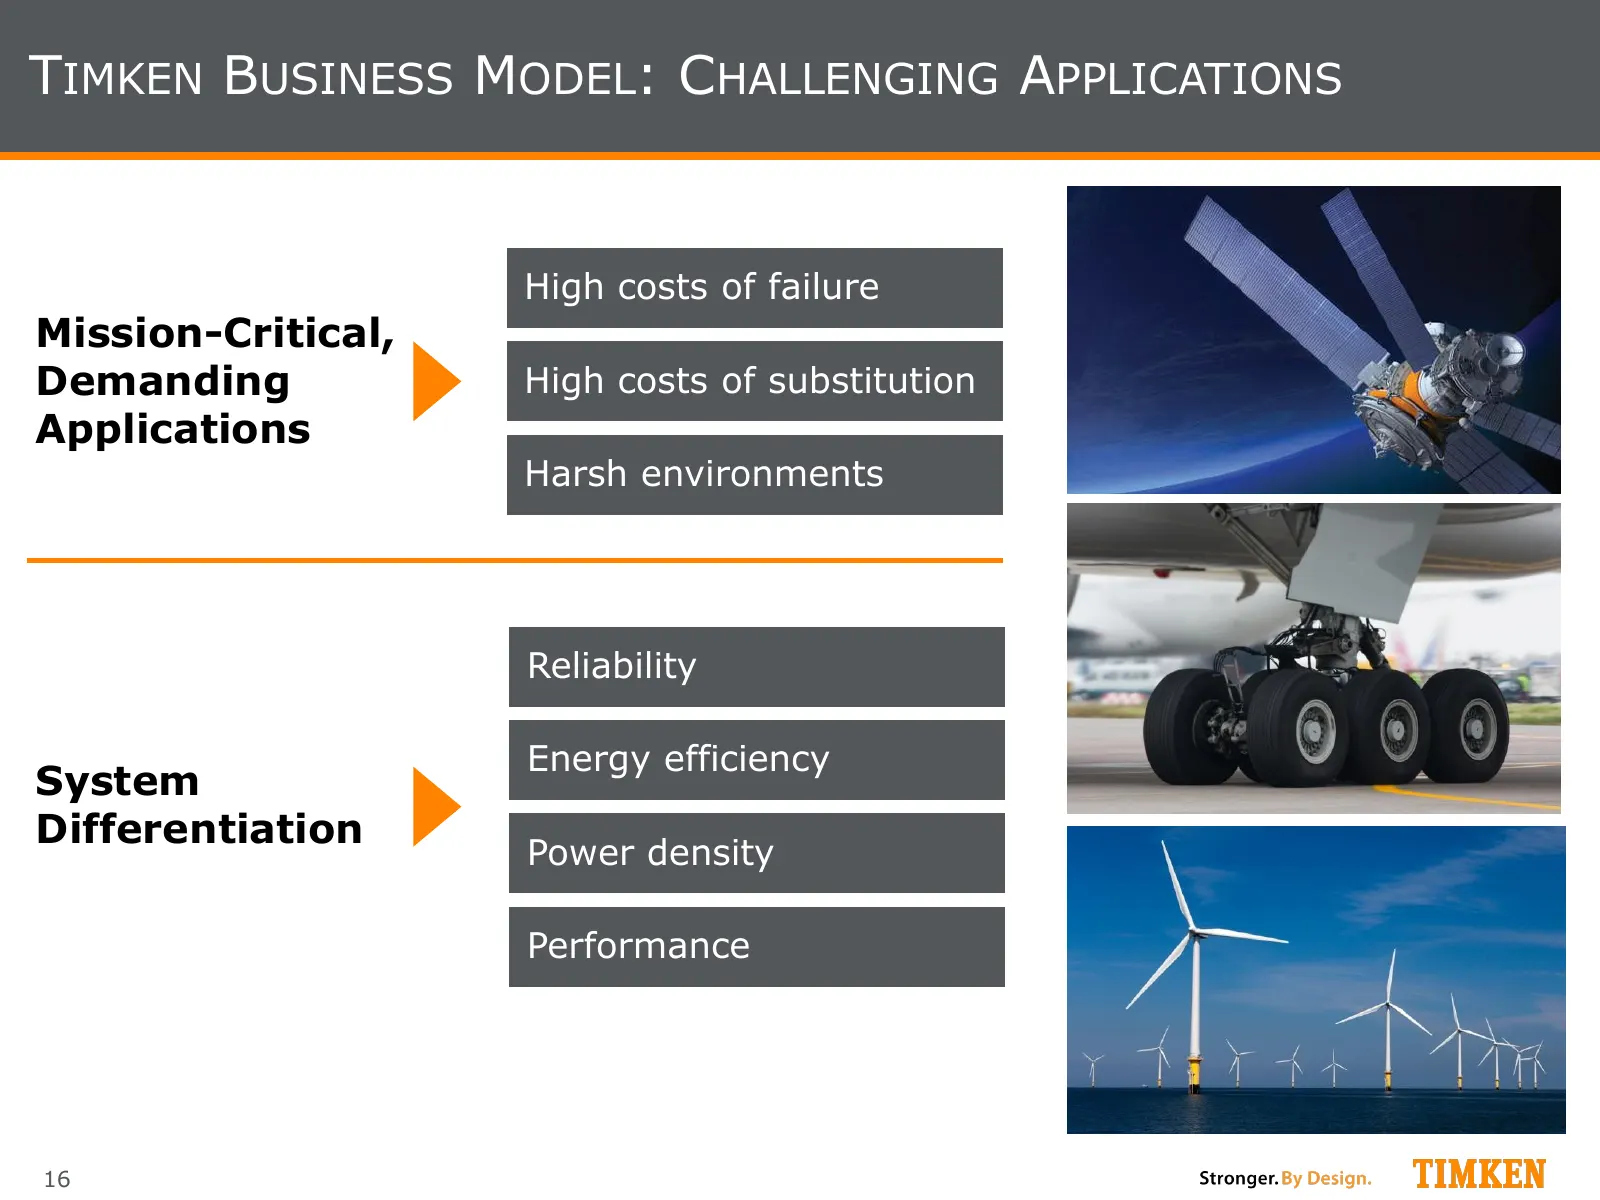
TIMKEN BUSINESS MODEL: CHALLENGING APPLICATIONS High costs of failure Mission-Critical, Demanding High costs of substitution Image of satellite Applications Harsh environments Reliability Energy efficiency System Differentiation Power density Performance 16
Slide 17: Business Model: Aftermarket & Rebuild
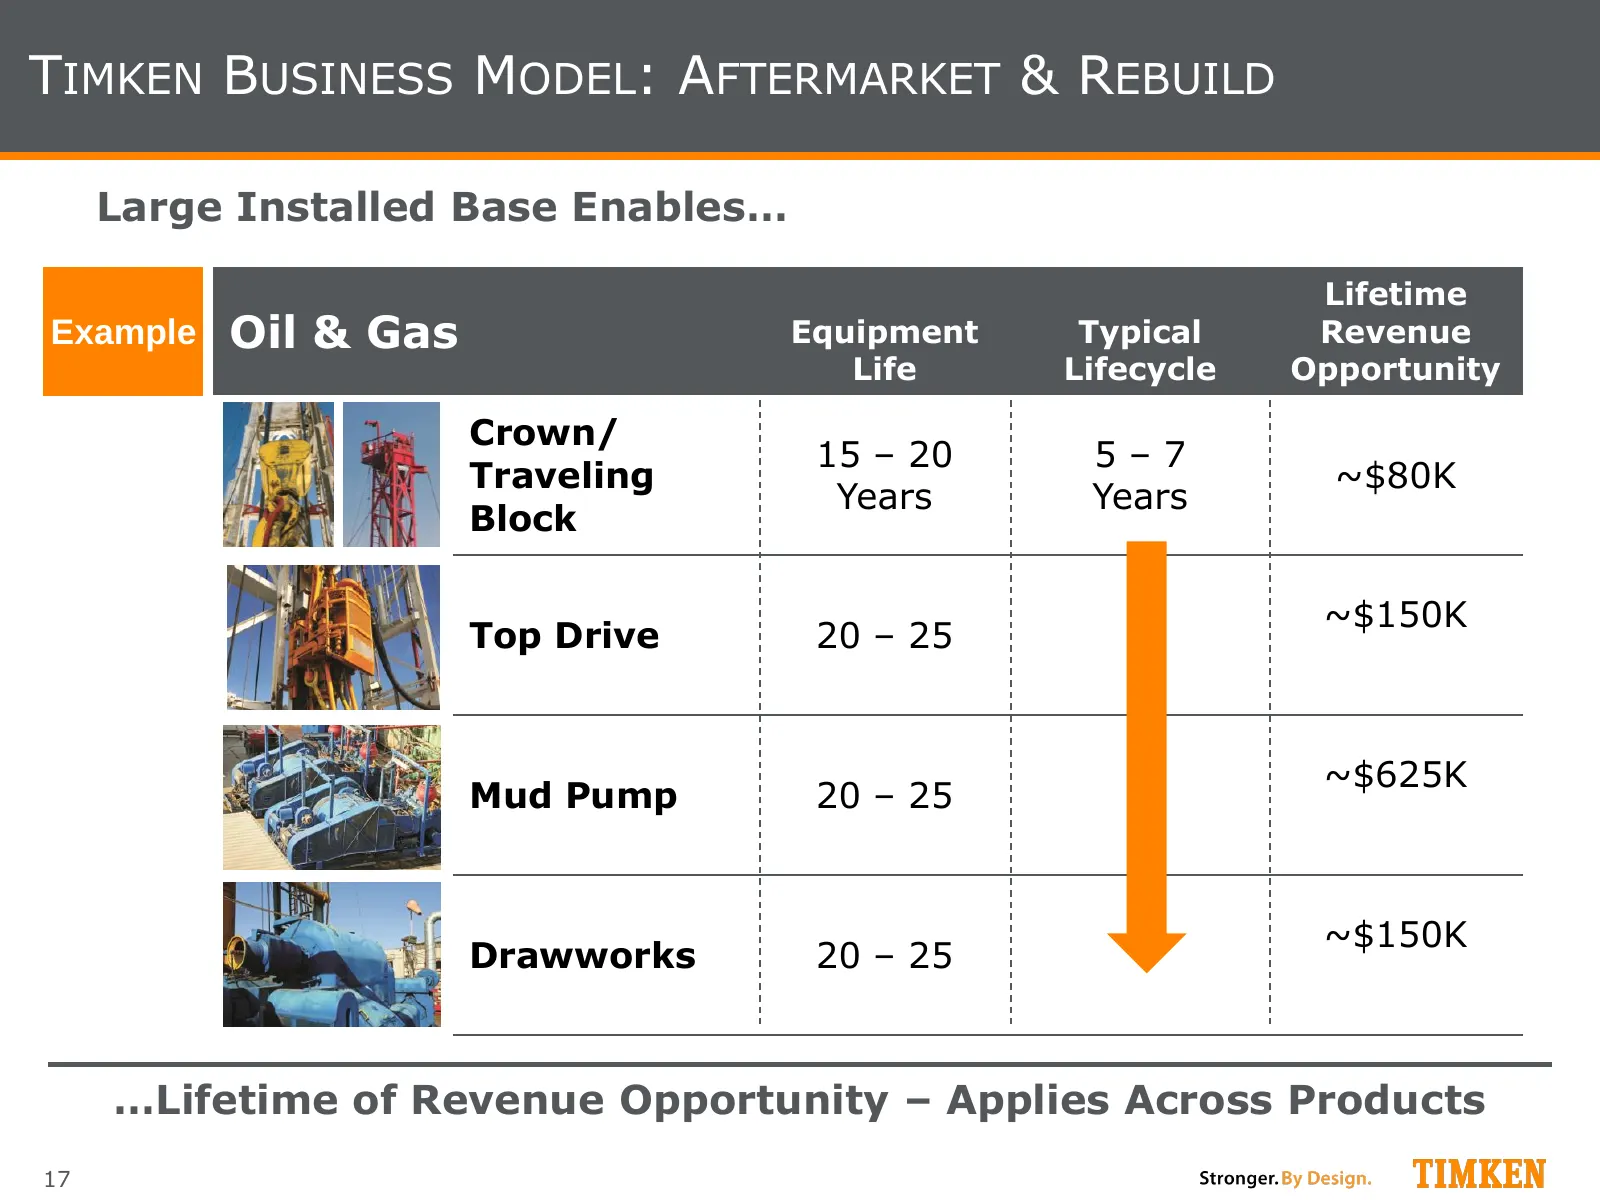
TIMKEN BUSINESS MODEL: AFTERMARKET & REBUILD Large Installed Base Enables… Lifetime Example Oil & Gas Equipment Typical Revenue Life Lifecycle Opportunity Crown/ 15 – 20 5–7 Traveling ~$80K Years Years Block ~$150K Top Drive 20 – 25 ~$625K Mud Pump 20 – 25 ~$150K Drawworks 20 – 25 …Lifetime of Reven
Slide 18: Business Model: High Service Requirements
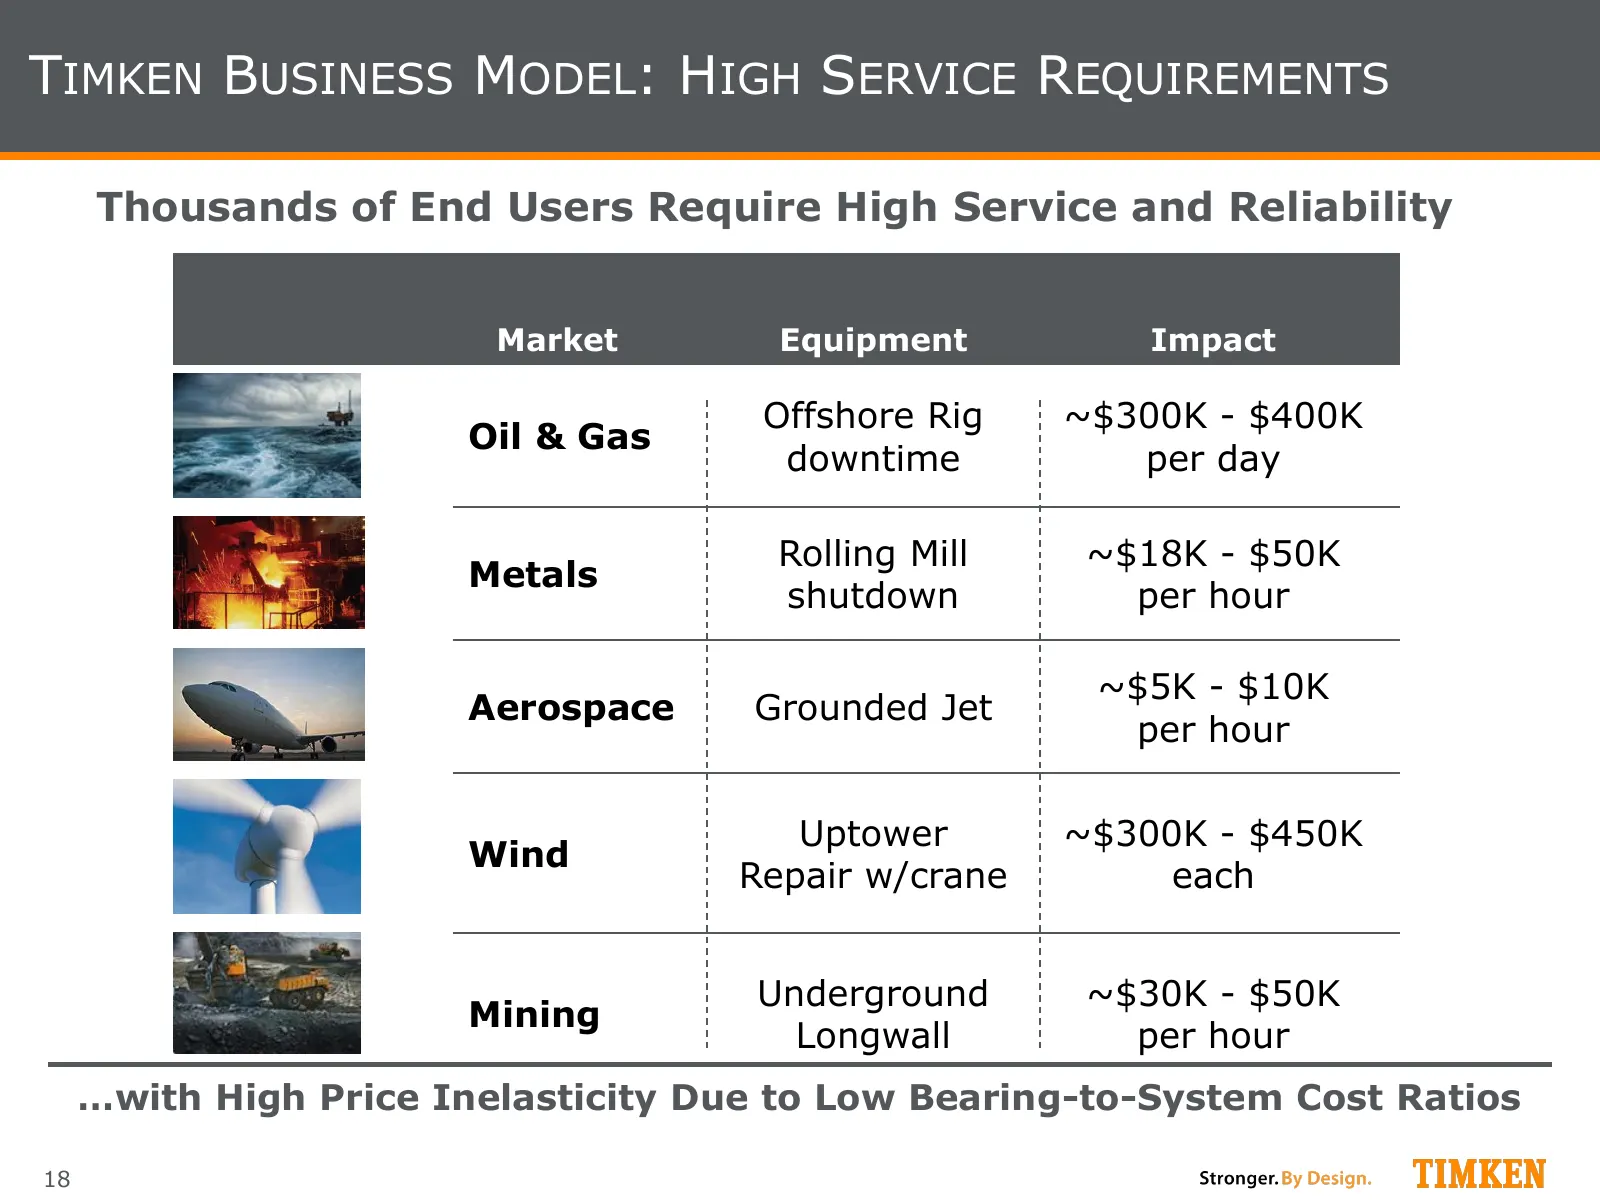
TIMKEN BUSINESS MODEL: HIGH SERVICE REQUIREMENTS Thousands of End Users Require High Service and Reliability Market Equipment Impact Offshore Rig ~$300K - $400K Oil & Gas downtime per day Rolling Mill ~$18K - $50K Metals shutdown per hour ~$5K - $10K Aerospace Grounded Jet per hour Uptower ~$300K -
Slide 19: Focus on Markets with Strong Macro Fundamentals
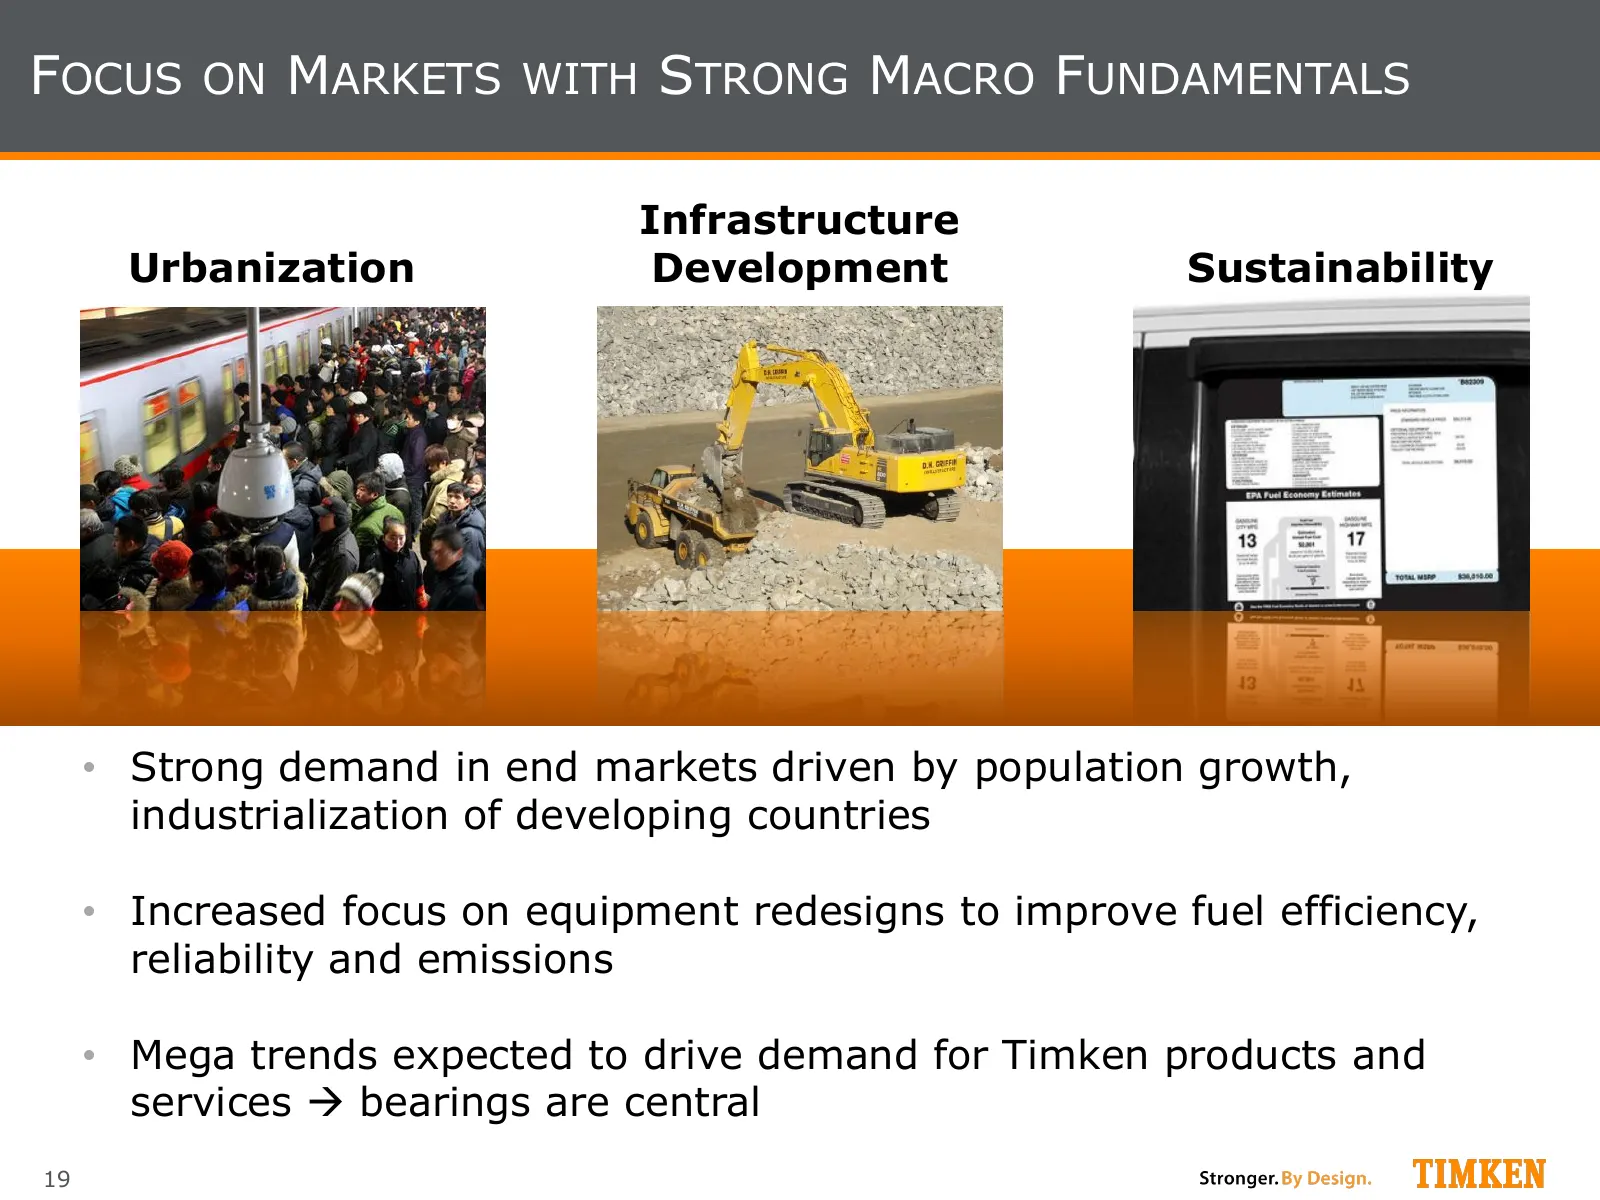
FOCUS ON MARKETS WITH STRONG MACRO FUNDAMENTALS Infrastructure Urbanization Development Sustainability • Strong demand in end markets driven by population growth, industrialization of developing countries • Increased focus on equipment redesigns to improve fuel efficiency, reliability and emissions
Slide 20: Total Addressable Market
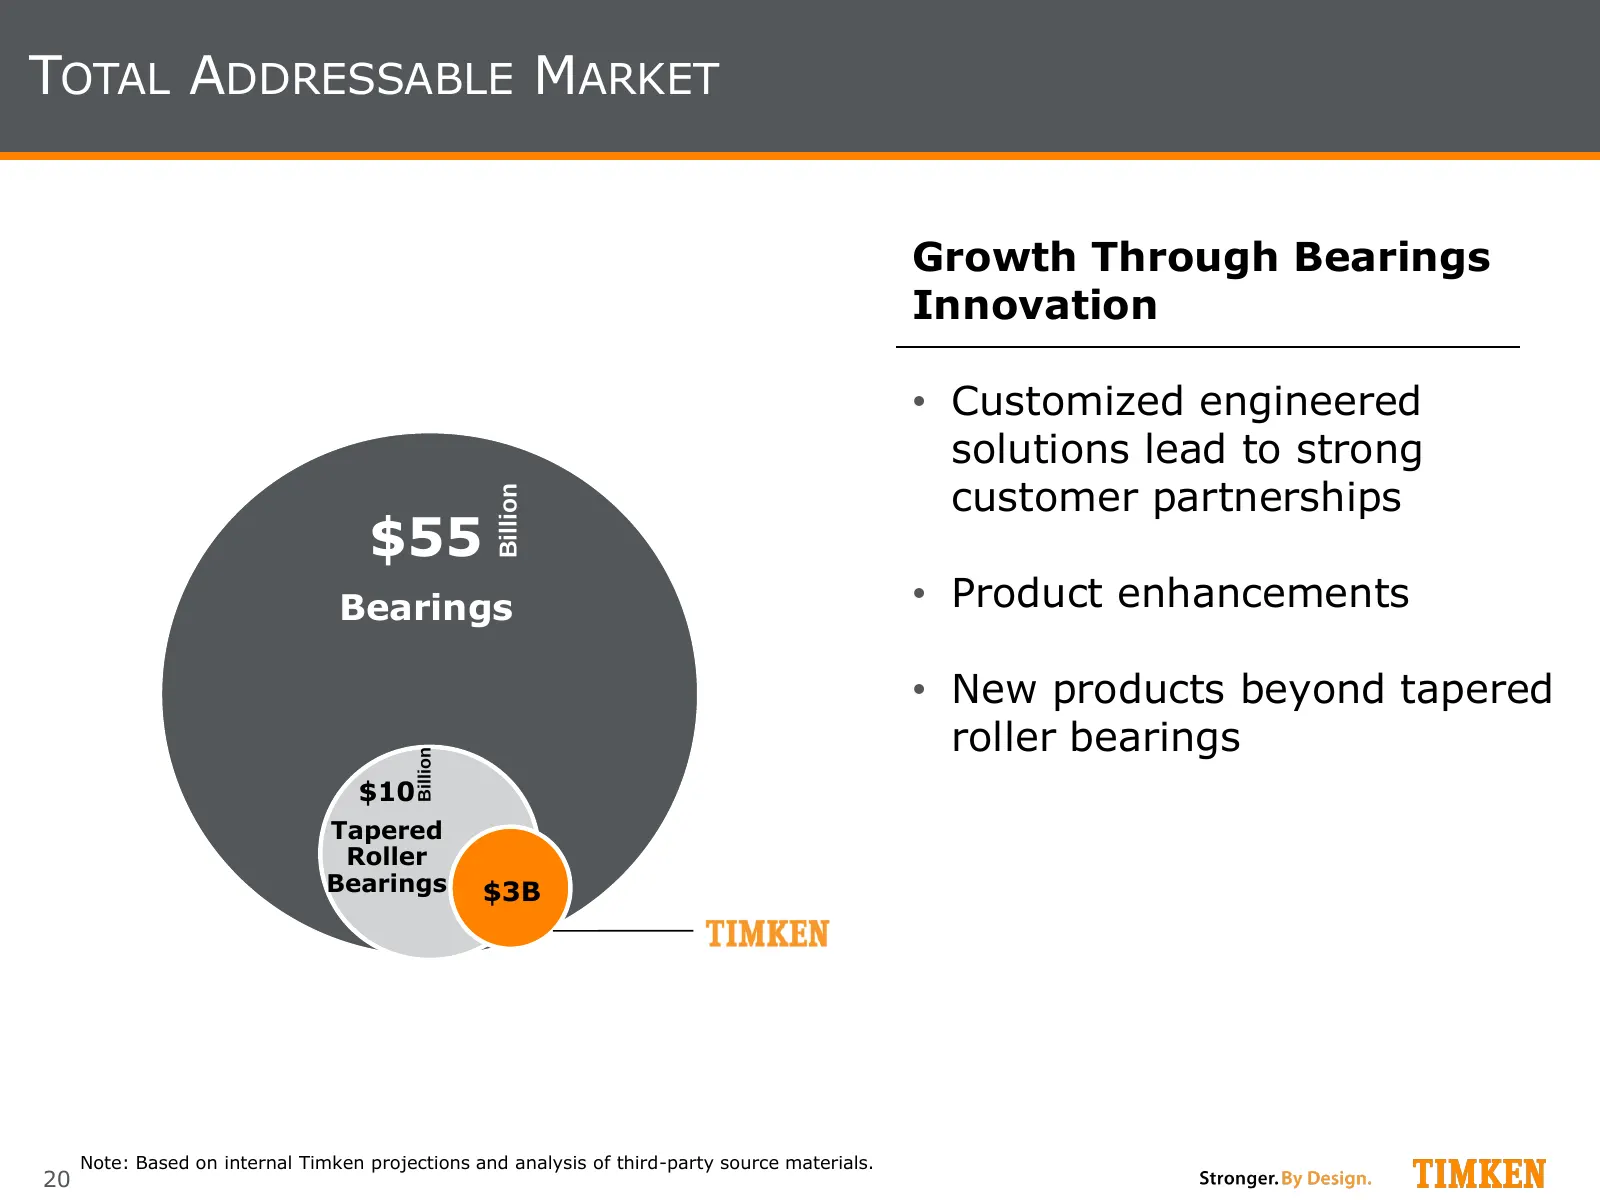
TOTAL ADDRESSABLE MARKET Growth Through Bearings Innovation • Customized engineered solutions lead to strong Billion customer partnerships $55 Bearings • Product enhancements • New products beyond tapered roller bearings Billion $10 Tapered Roller Bearings $3B Note: Based on internal Timken projecti
Slide 21: Total Addressable Market
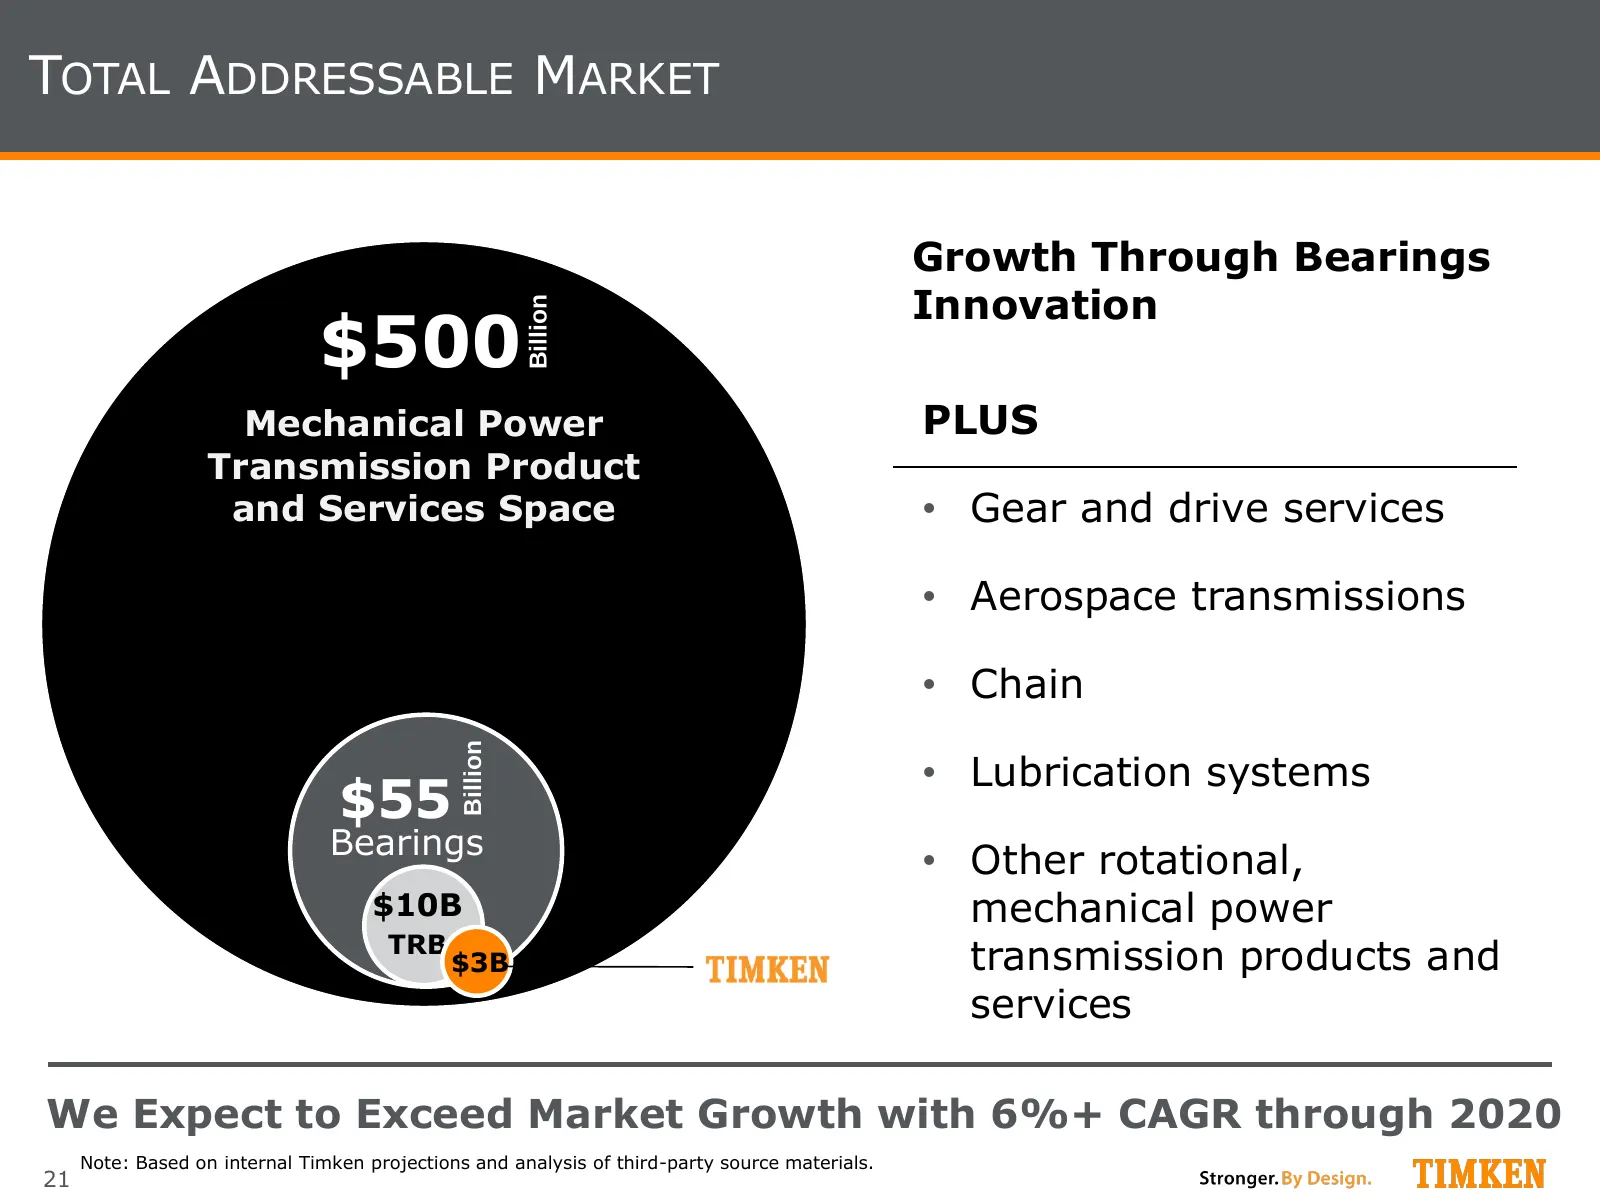
TOTAL ADDRESSABLE MARKET Growth Through Bearings Innovation Billion $500 Mechanical Power PLUS Transmission Product and Services Space • Gear and drive services • Aerospace transmissions • Chain Billion • Lubrication systems $55 Bearings • Other rotational, $10B mechanical power TRB $3B transmission
Slide 22: Expanding the Product Reach
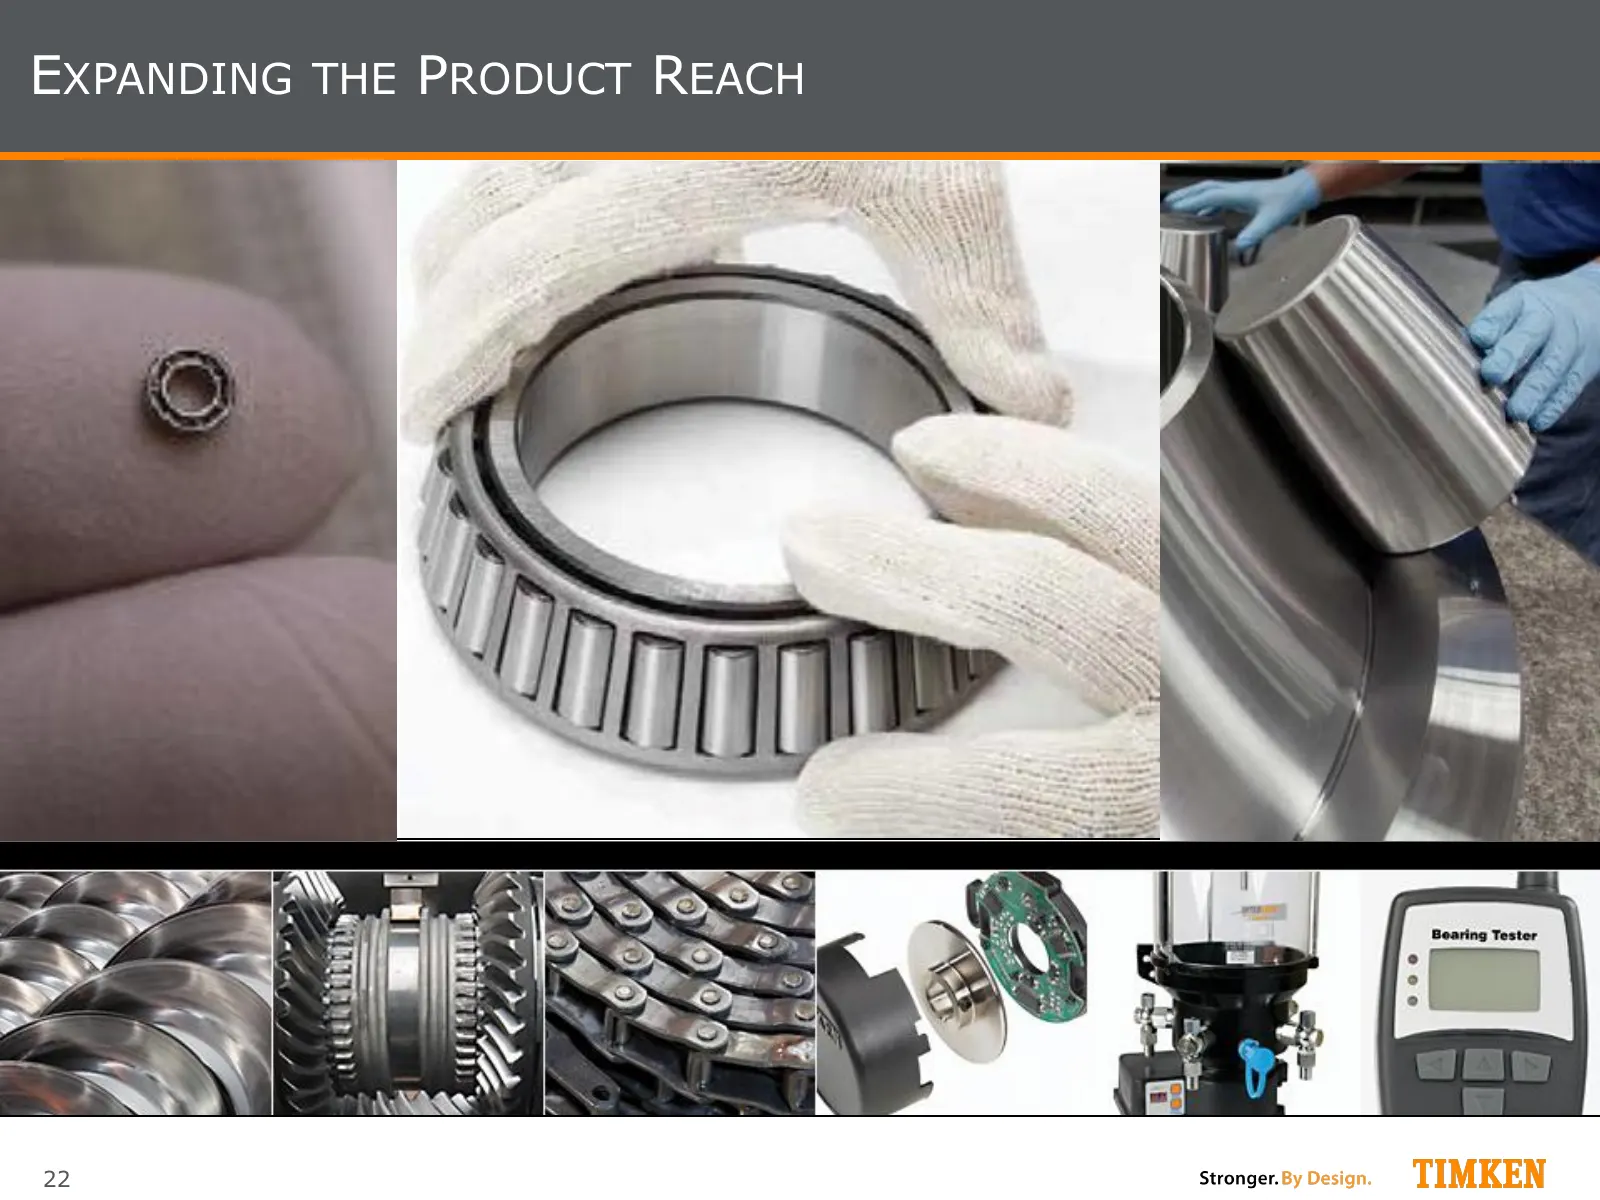
EXPANDING THE PRODUCT REACH 22
Slide 23: Business Model: Operational Excellence
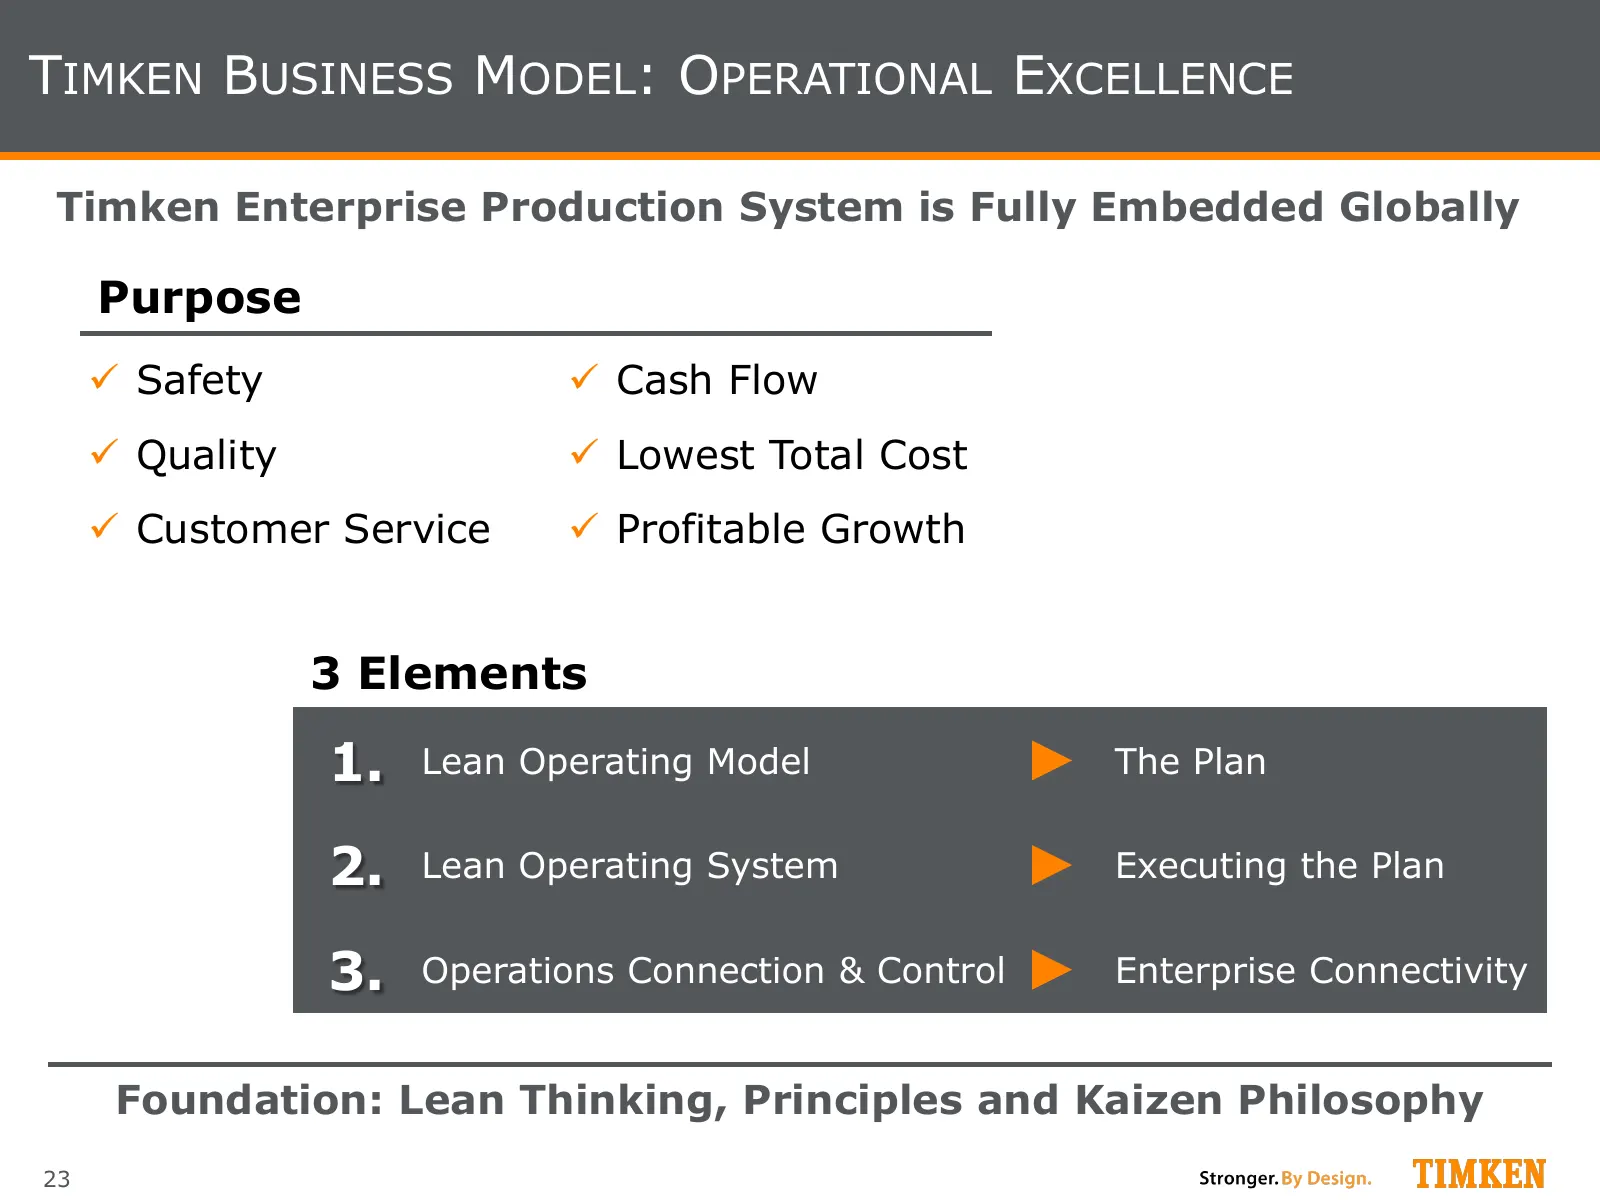
TIMKEN BUSINESS MODEL: OPERATIONAL EXCELLENCE Timken Enterprise Production System is Fully Embedded Globally Purpose Safety Cash Flow Quality Lowest Total Cost Customer Service Profitable Growth 3 Elements 1. Lean Operating Model The Plan 2. Lean Operating System Executing the Plan 3. Op
Slide 24: Business Model: Operational Excellence
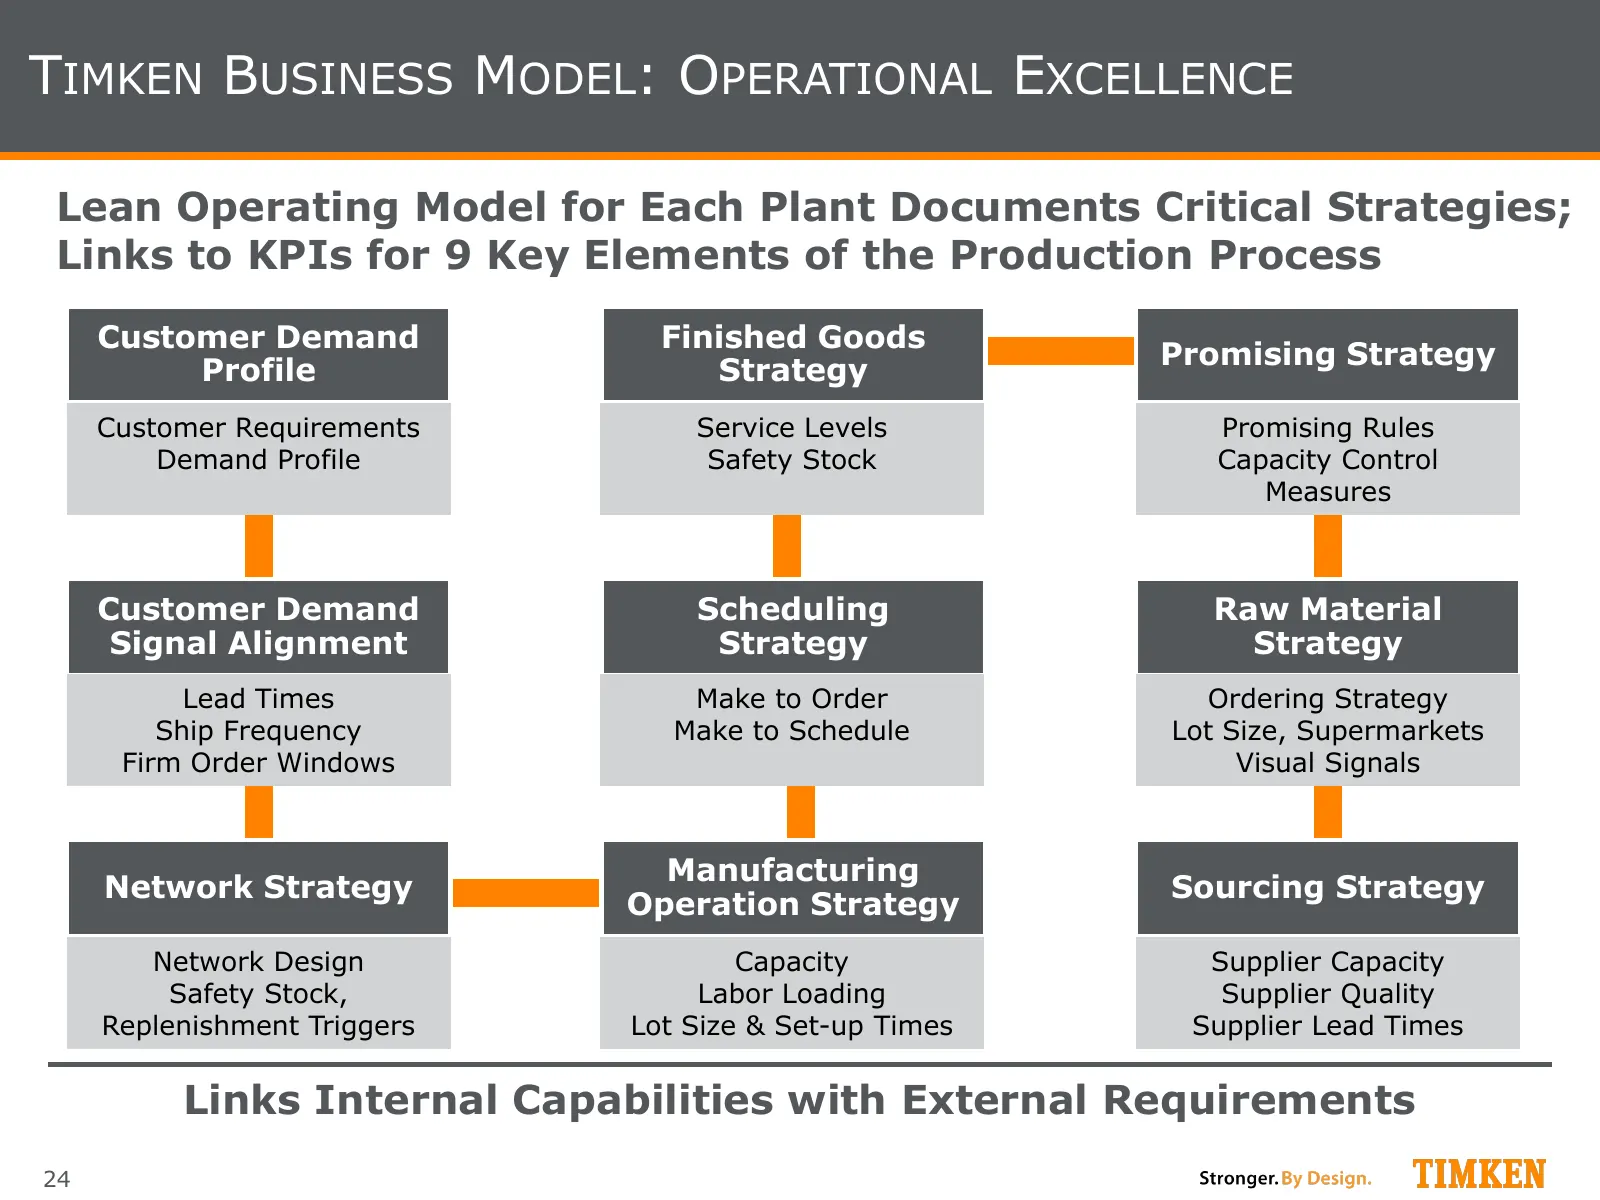
TIMKEN BUSINESS MODEL: OPERATIONAL EXCELLENCE Lean Operating Model for Each Plant Documents Critical Strategies; Links to KPIs for 9 Key Elements of the Production Process Customer Demand Finished Goods Promising Strategy Profile Strategy Customer Requirements Service Levels Promising Rules Demand P
Slide 25: Business Model: High Service Levels
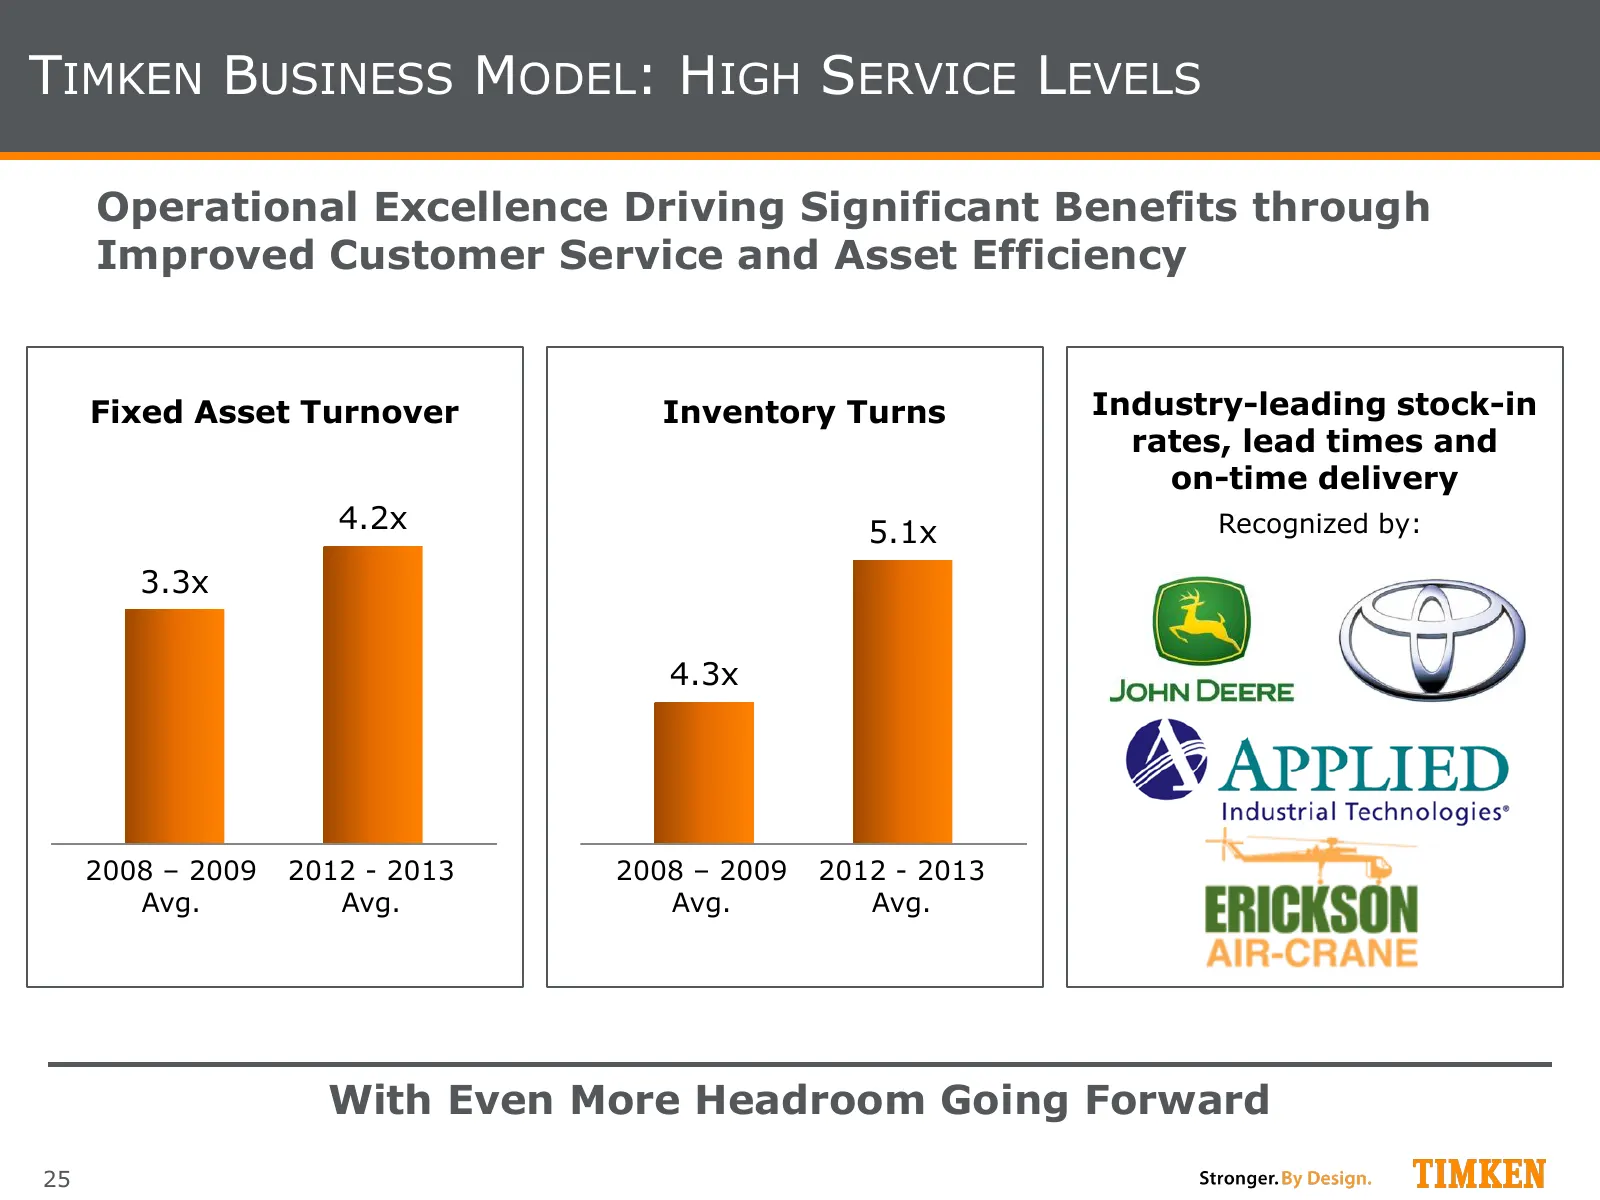
TIMKEN BUSINESS MODEL: HIGH SERVICE LEVELS Operational Excellence Driving Significant Benefits through Improved Customer Service and Asset Efficiency Fixed Asset Turnover Inventory Turns Industry-leading stock-in rates, lead times and on-time delivery 4.2x 5.1x Recognized by: 3.3x 4.3x 2008 – 2009 2
Slide 26: Building on the Momentum: Foundation
TIMKEN: BUILDING ON THE MOMENTUM Recognized industry leader for technology, quality and people Foundation 26
Slide 27: Building on the Momentum: Transformation
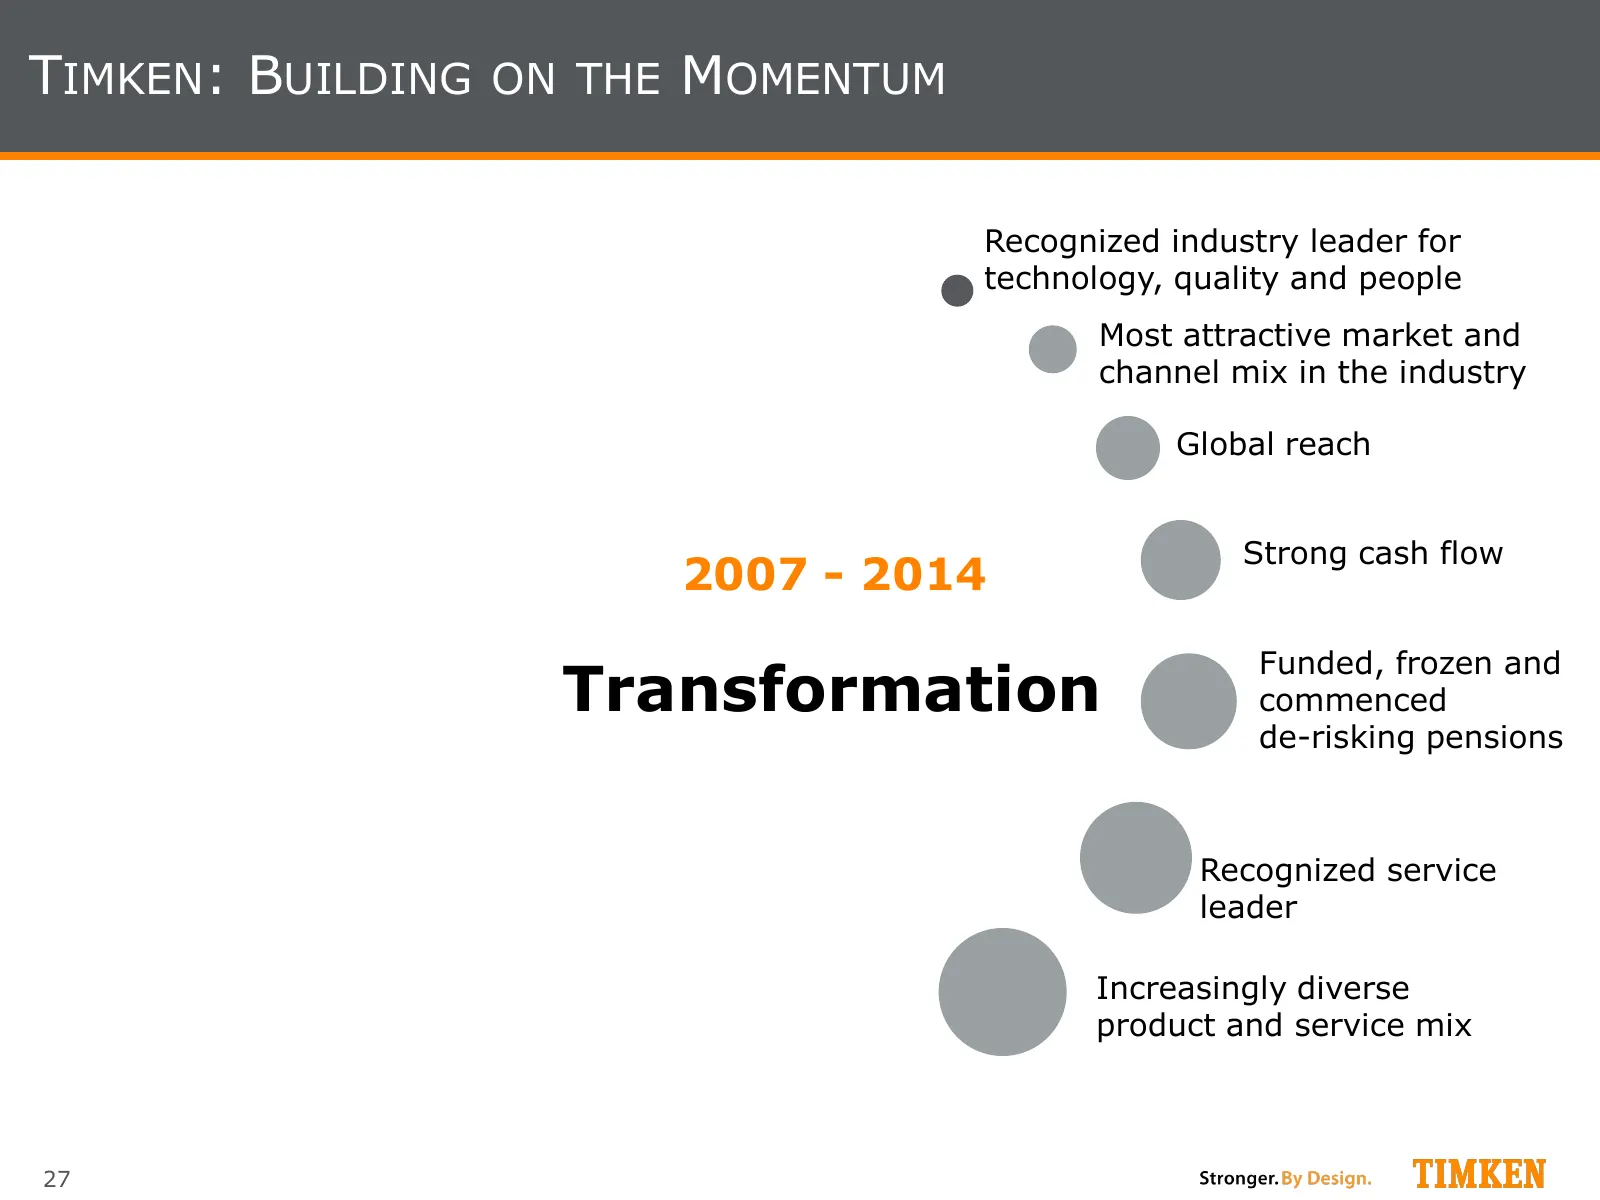
TIMKEN: BUILDING ON THE MOMENTUM Recognized industry leader for technology, quality and people Most attractive market and channel mix in the industry Global reach Strong cash flow 2007 - 2014 Funded, frozen and Transformation commenced de-risking pensions Recognized service leader Increasingly diver
Slide 28: Building on the Momentum: Acceleration
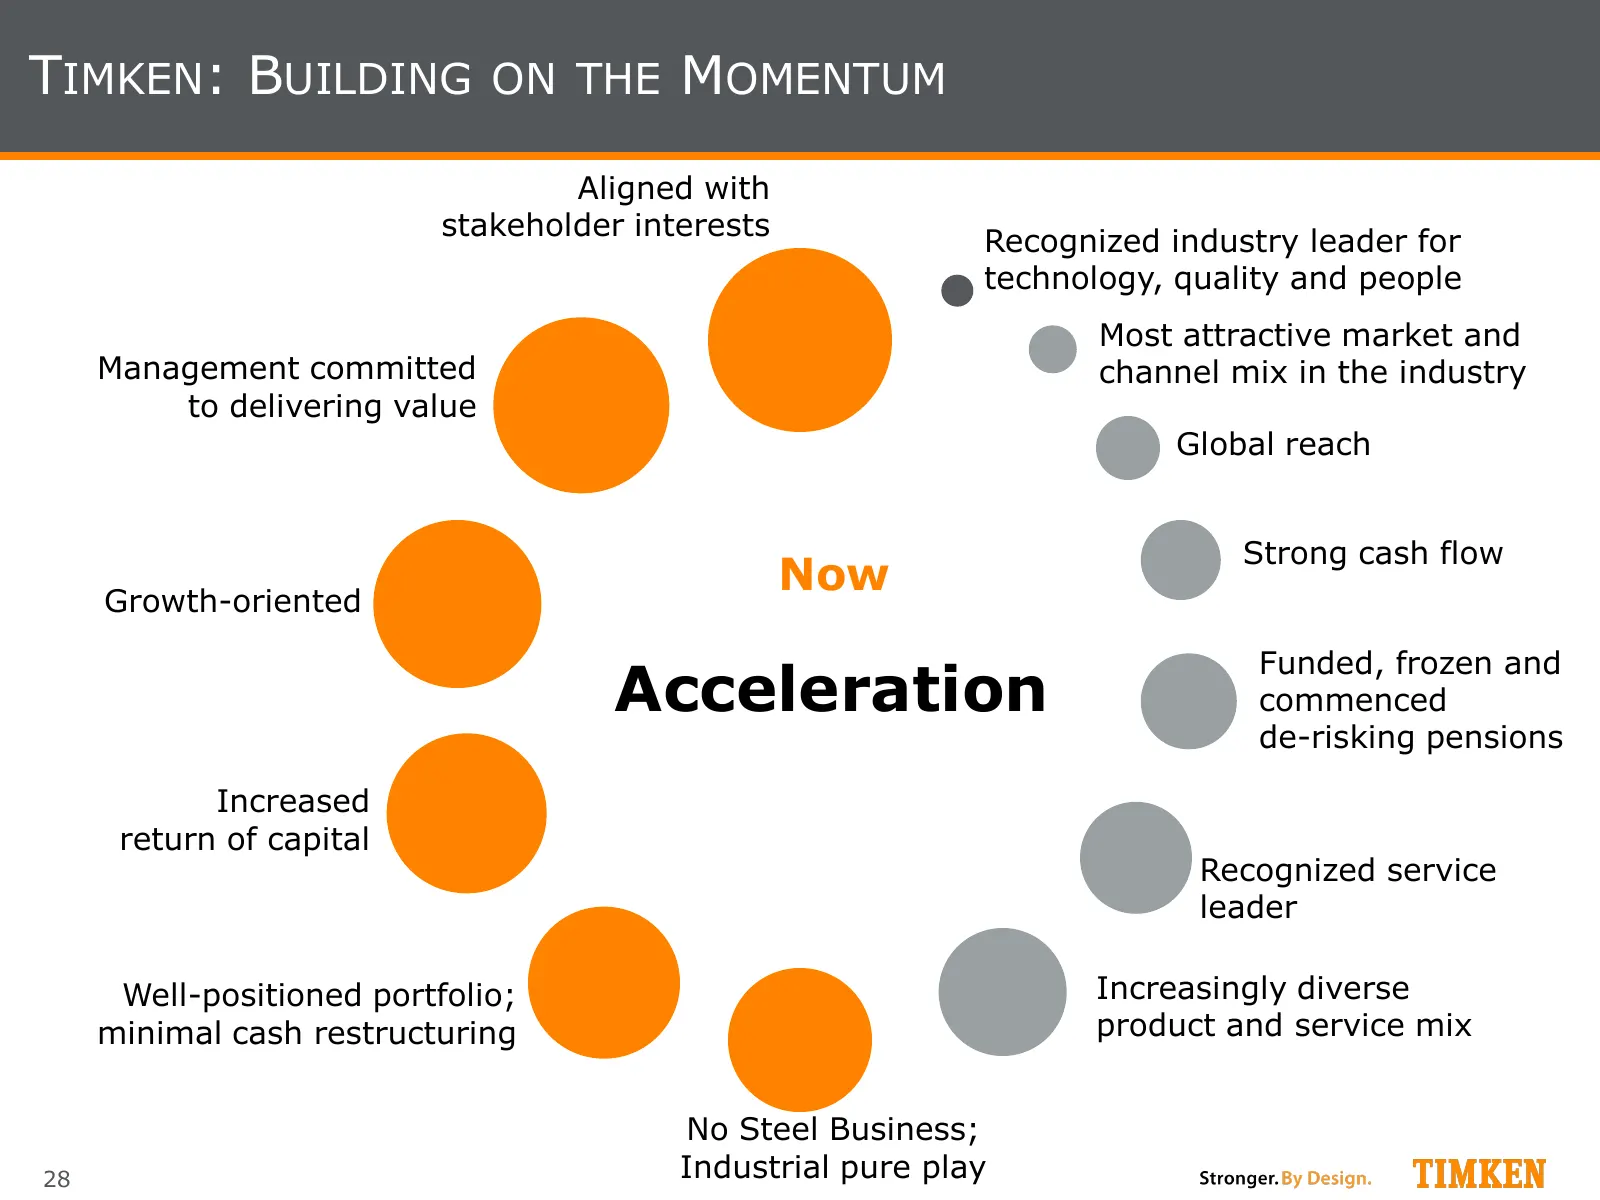
TIMKEN: BUILDING ON THE MOMENTUM Aligned with stakeholder interests Recognized industry leader for technology, quality and people Most attractive market and Management committed channel mix in the industry to delivering value Global reach Strong cash flow Growth-oriented Now Funded, frozen and Accel
Slide 29: Summary
SUMMARY Timken: What You Can Expect • Leverage the Timken Business Model to Accelerate Attractive Organic Growth Rates ‒ Expand our reach through organic product and geographic expansion ‒ Add complementary products and services through acquisitions that fit the business model and meet financial cri
Slide 30: Mobile Industries
Mobile Industries Chris Coughlin, Group President
Slide 31: Key Messages
KEY MESSAGES • Last few years have repositioned Mobile Industries ‒ Reshaping/strategic repositioning of Light Vehicle and Heavy Truck ‒ Concurrent cyclical downdraft in Heavy Truck ‒ Mining slowdown has impacted Off-Highway and Rail • Significant progress made during 2008 – 2013 period ‒ Proactive
Slide 32: Overview
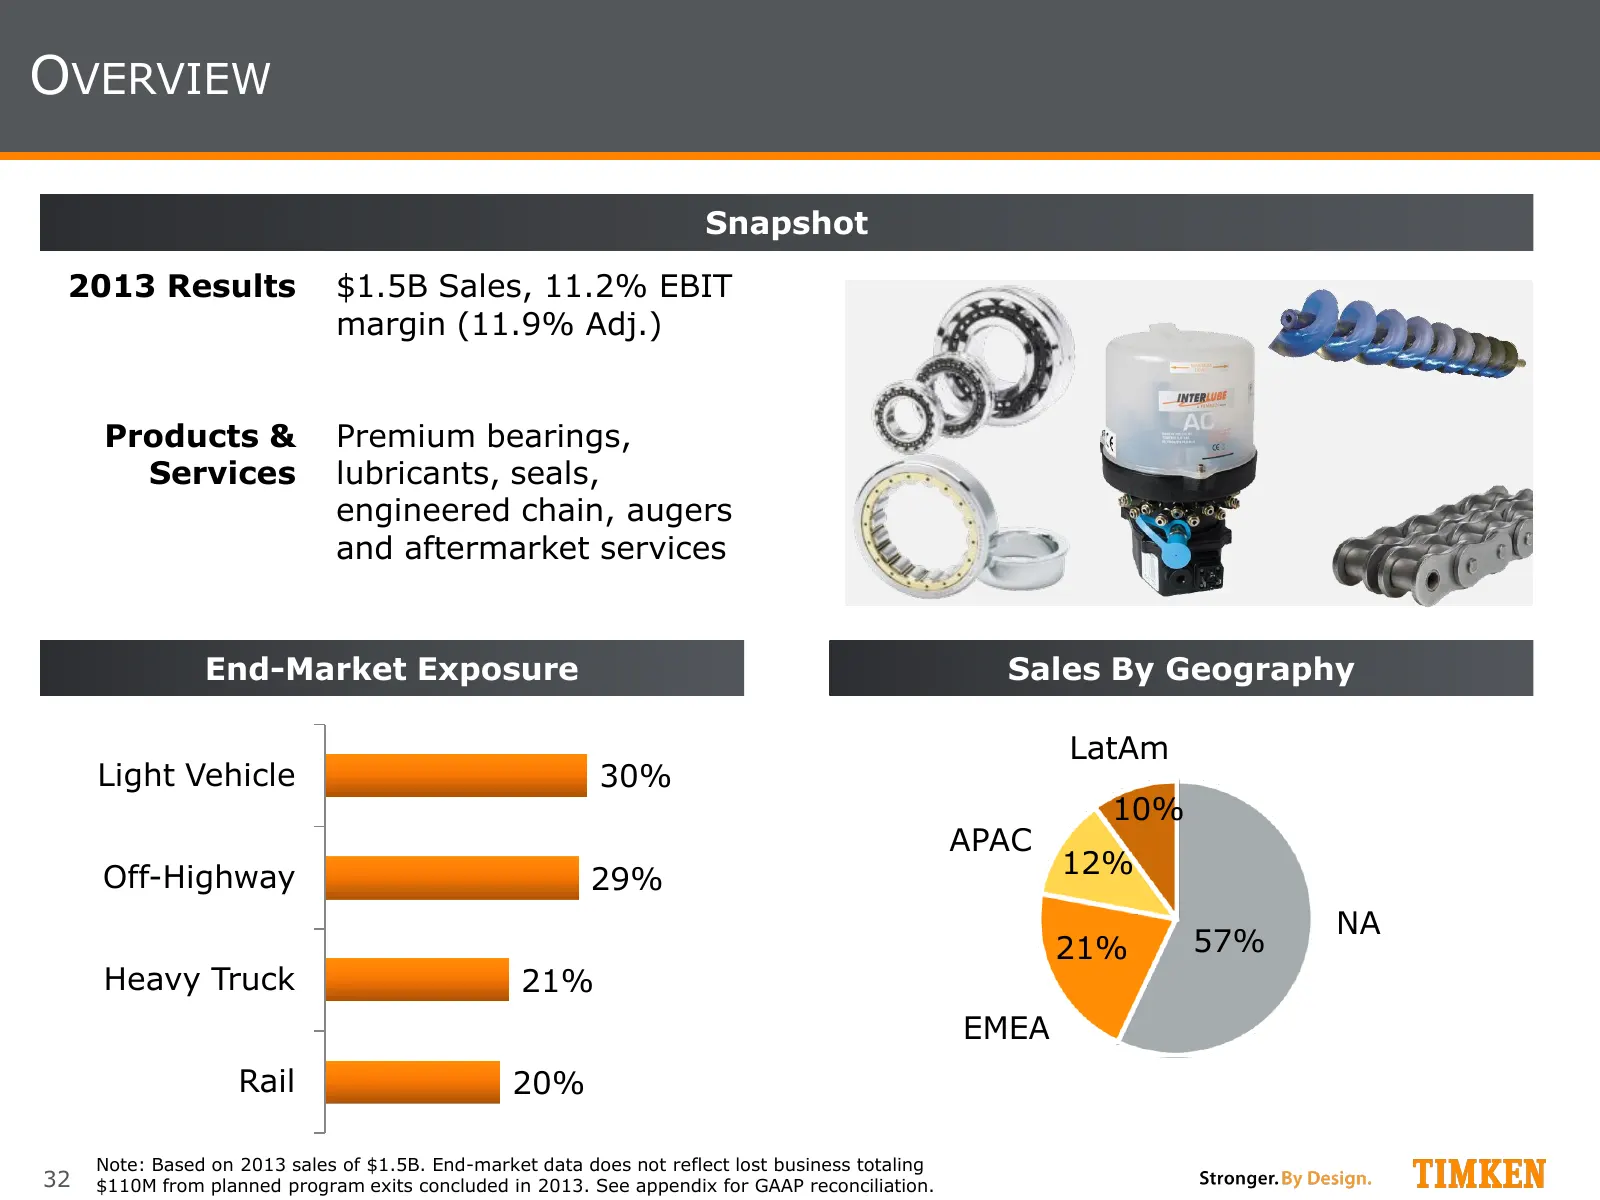
OVERVIEW Snapshot 2013 Results $1.5B Sales, 11.2% EBIT margin (11.9% Adj.) Products & Premium bearings, Services lubricants, seals, engineered chain, augers and aftermarket services End-Market Exposure Sales By Geography LatAm Light Vehicle 30% 10% APAC Off-Highway 29% 12% NA 21% 57% Heavy Truck 21%
Slide 33: Diverse Markets and Applications
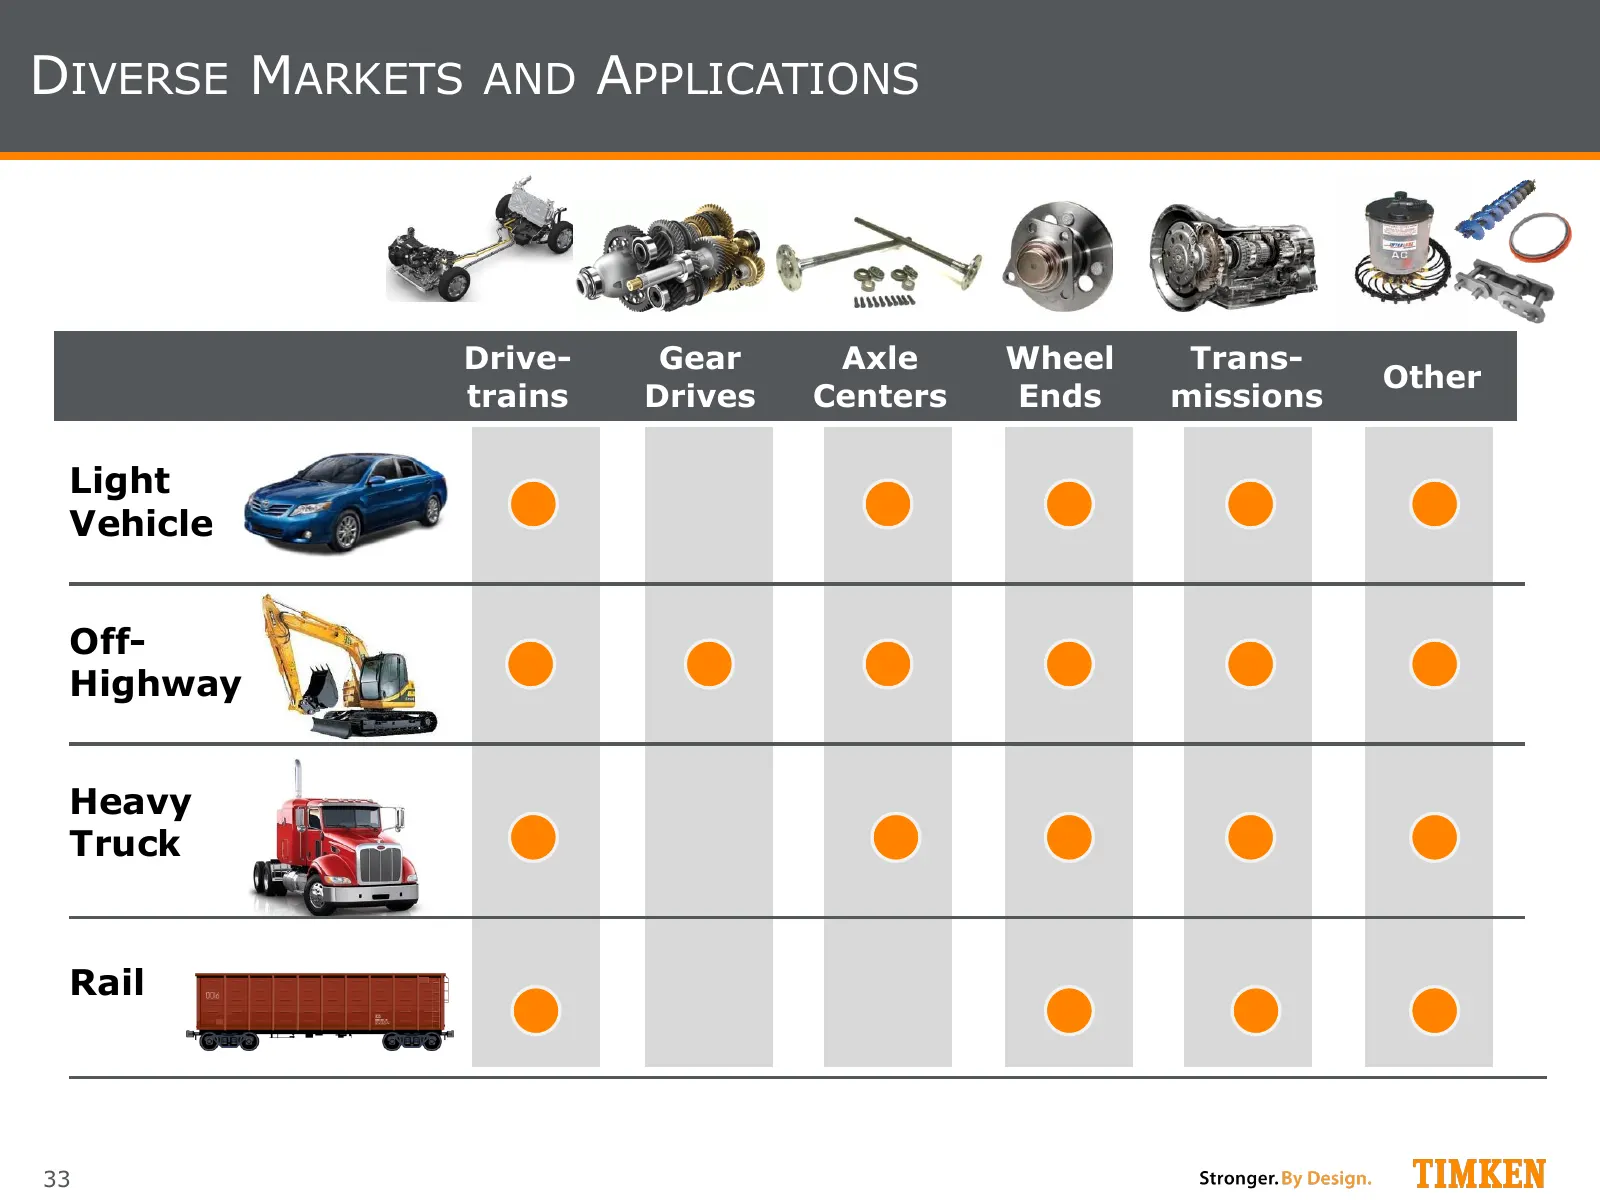
DIVERSE MARKETS AND APPLICATIONS Drive- Gear Axle Wheel Trans- Other trains Drives Centers Ends missions Light Vehicle Off- Highway Heavy Truck Rail 33
Slide 34: Mobile Industries Portfolio Context: 2008-2013
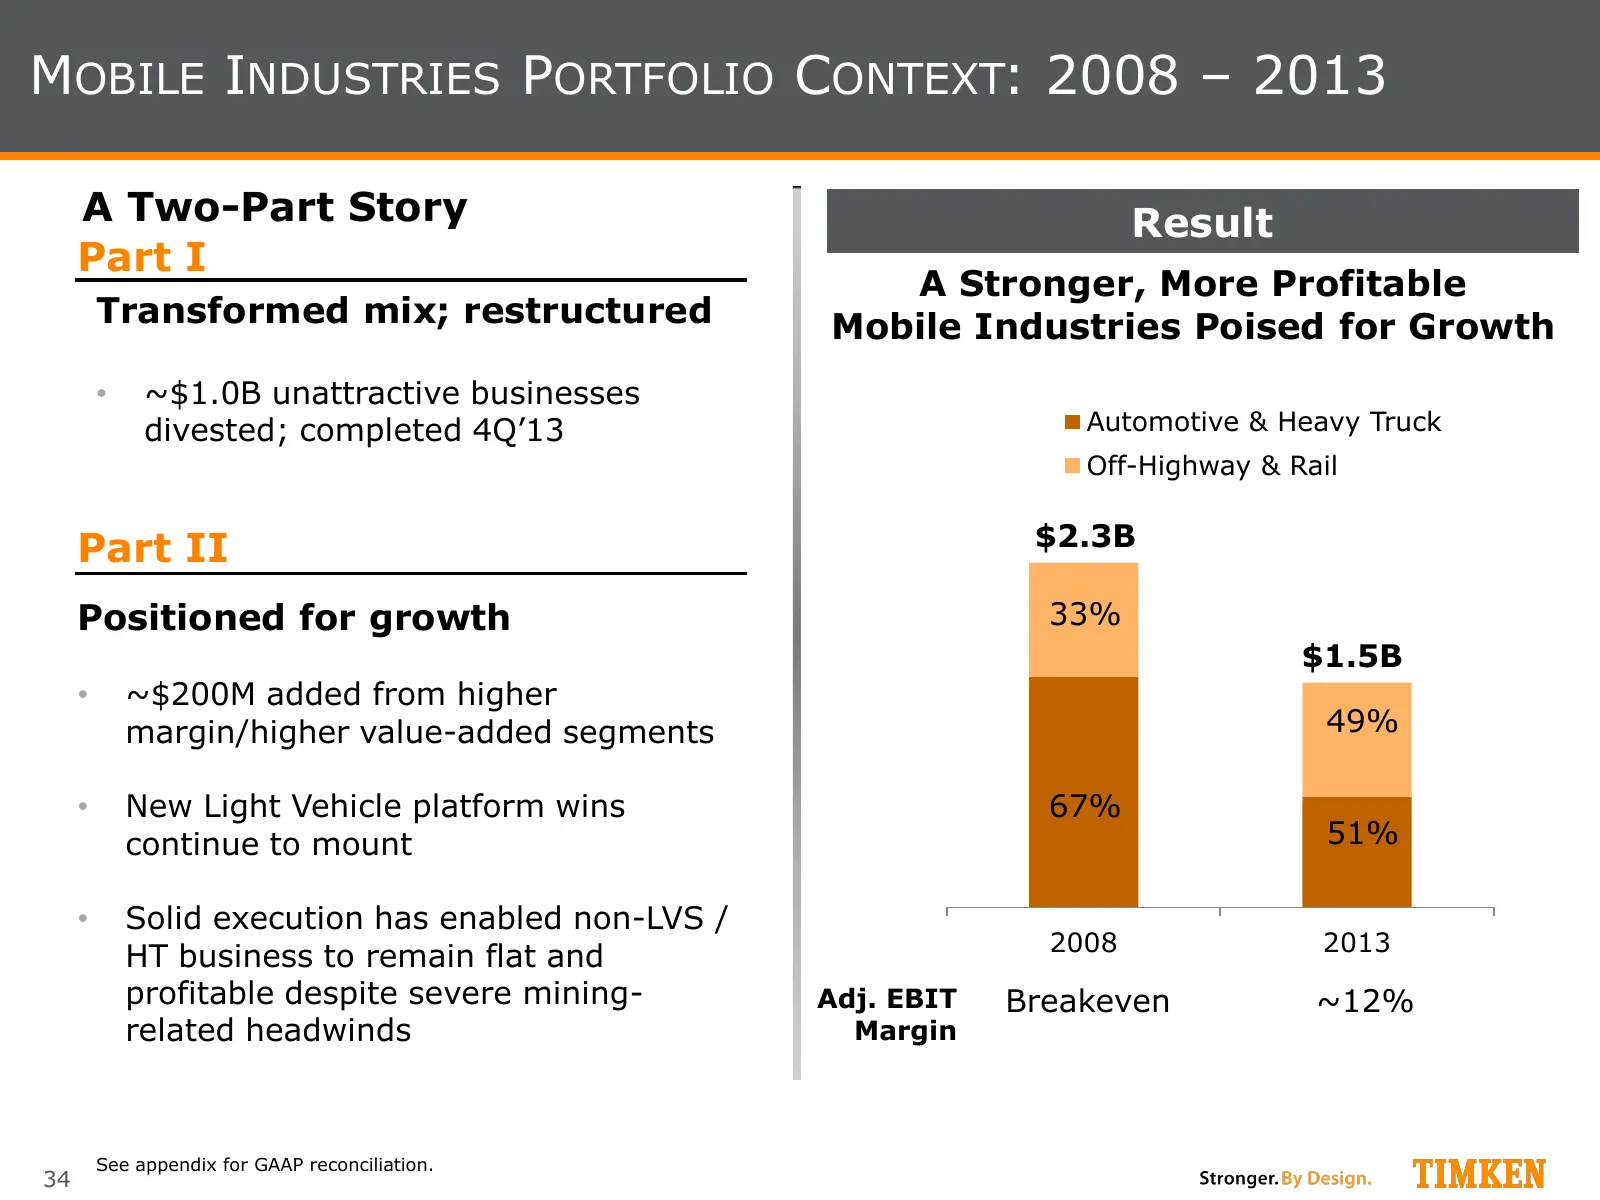
MOBILE INDUSTRIES PORTFOLIO CONTEXT: 2008 – 2013 A Two-Part Story Result Part I A Stronger, More Profitable Transformed mix; restructured Mobile Industries Poised for Growth • ~$1.0B unattractive businesses divested; completed 4Q’13 Automotive & Heavy Truck Off-Highway & Rail Part II $2.3B Positione
Slide 35: Long-Term Growth Drivers
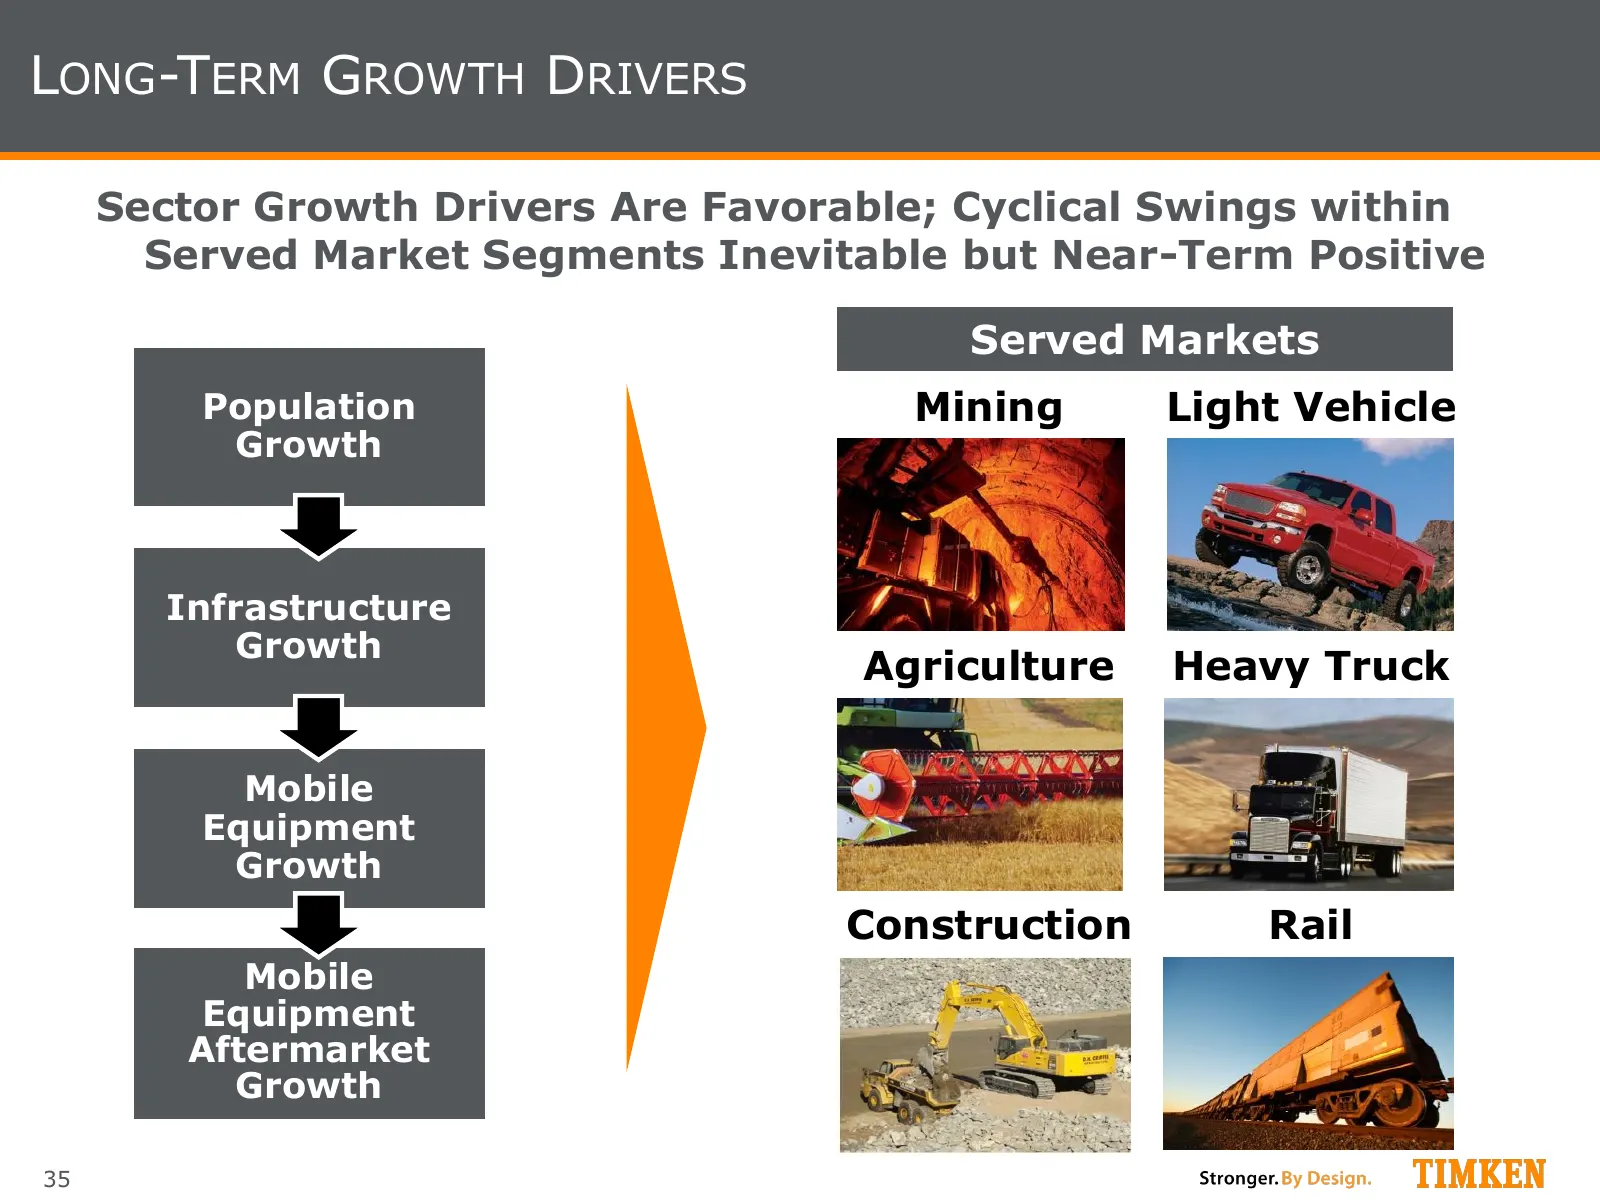
LONG-TERM GROWTH DRIVERS Sector Growth Drivers Are Favorable; Cyclical Swings within Served Market Segments Inevitable but Near-Term Positive Served Markets Population Mining Light Vehicle Growth Infrastructure Growth Agriculture Heavy Truck Mobile Equipment Growth Construction Rail Mobile Equipment
Slide 36: Mobile Industries Operating Model
MOBILE INDUSTRIES OPERATING MODEL Mobile Industries Operating Model Provides Foundation for Future Growth, Profitability • Continuously assess evolving needs of OEMs and end users in demanding mobile equipment and vehicle markets • Selectively develop highly engineered power transmission products an
Slide 37: Off-Highway
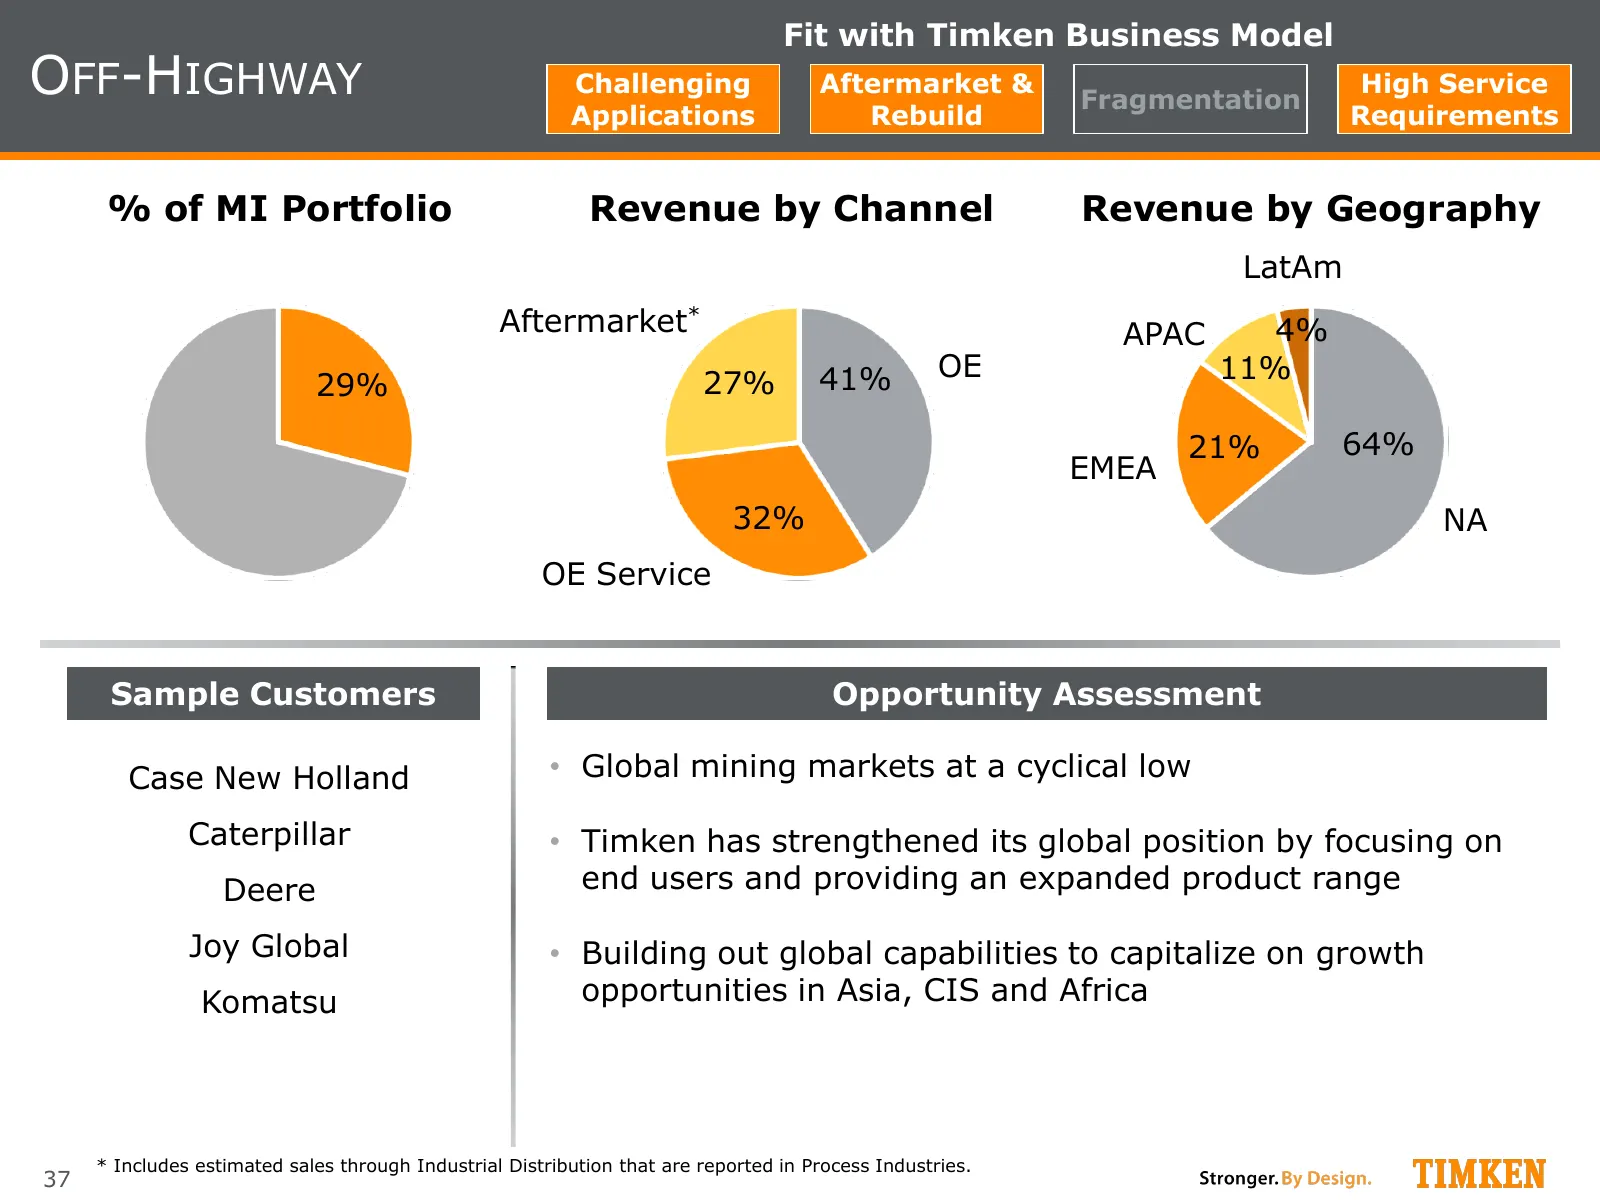
Fit with Timken Business Model OFF-HIGHWAY Challenging Aftermarket & Fragmentation High Service Applications Rebuild Requirements % of MI Portfolio Revenue by Channel Revenue by Geography LatAm Aftermarket* APAC 4% 41% OE 11% 29% 27% 21% 64% EMEA 32% NA OE Service Sample Customers Opportunity Assess
Slide 38: Light Vehicle
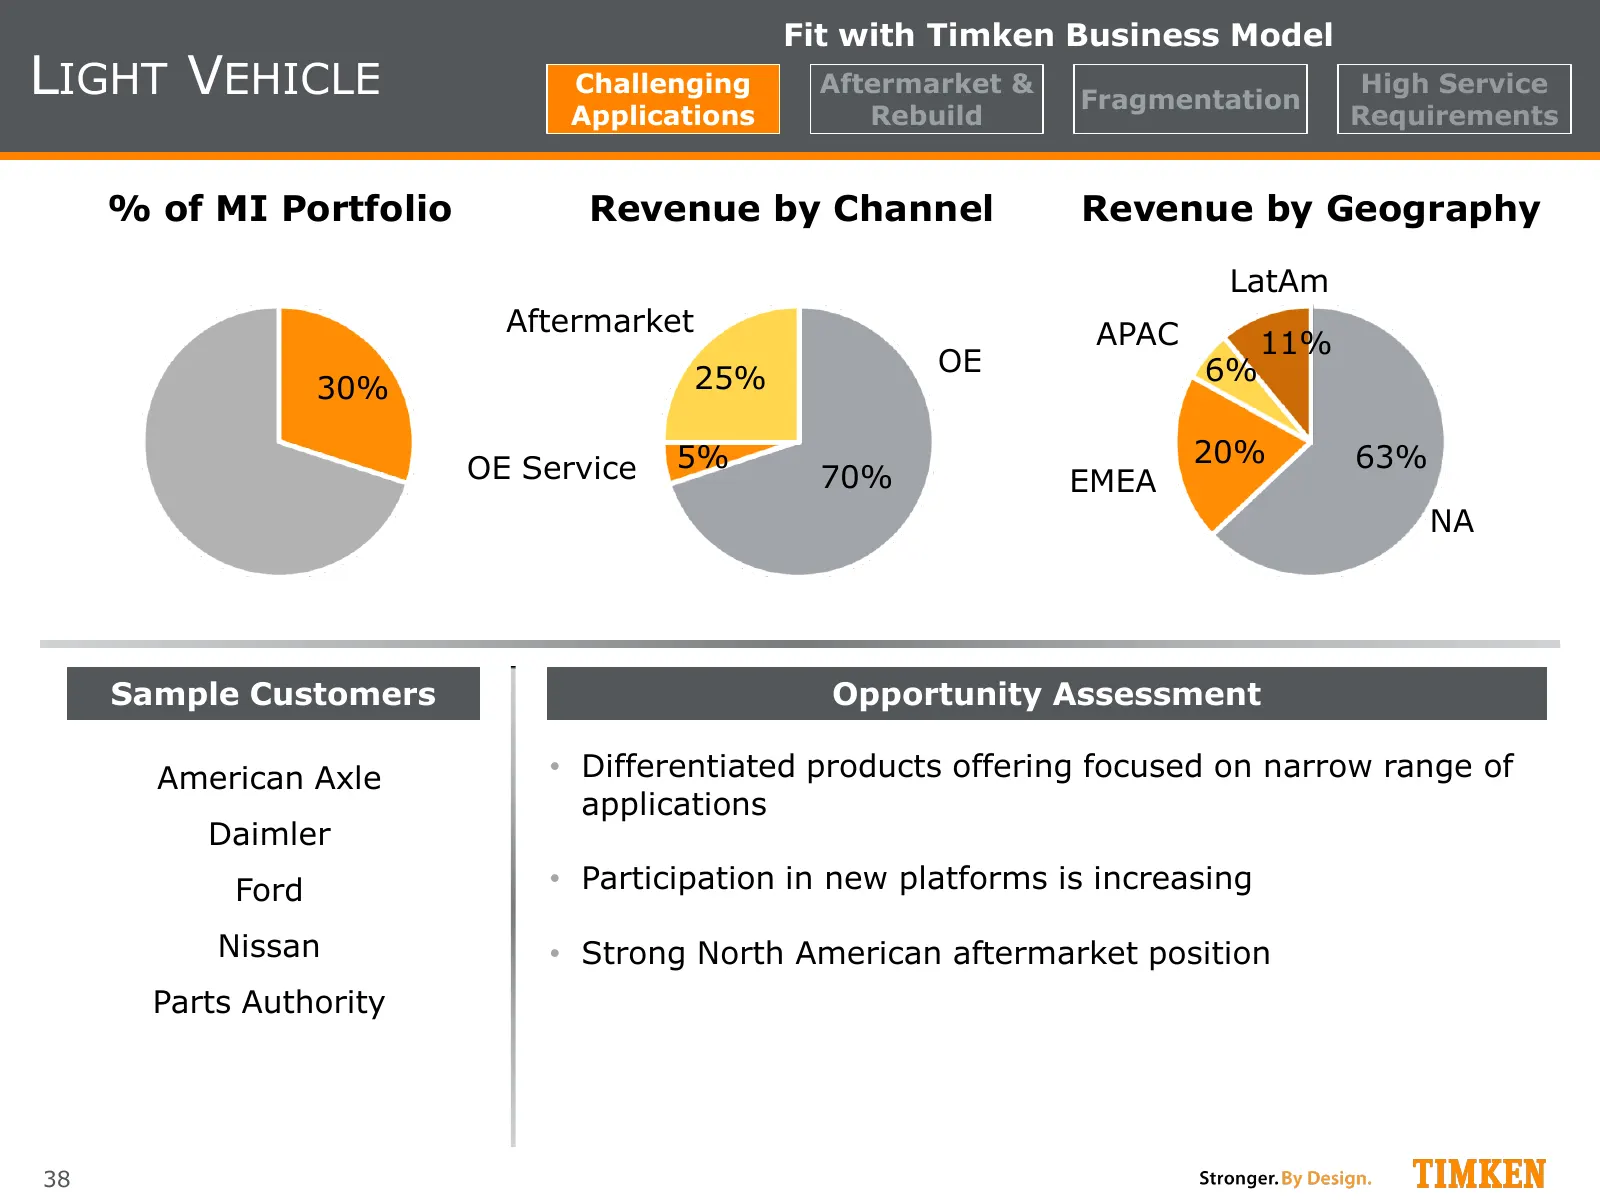
Fit with Timken Business Model LIGHT VEHICLE Challenging Aftermarket & Fragmentation High Service Applications Rebuild Requirements % of MI Portfolio Revenue by Channel Revenue by Geography LatAm Aftermarket APAC 11% OE 6% 30% 25% 5% 20% 63% OE Service 70% EMEA NA Sample Customers Opportunity Assess
Slide 39: Heavy Truck
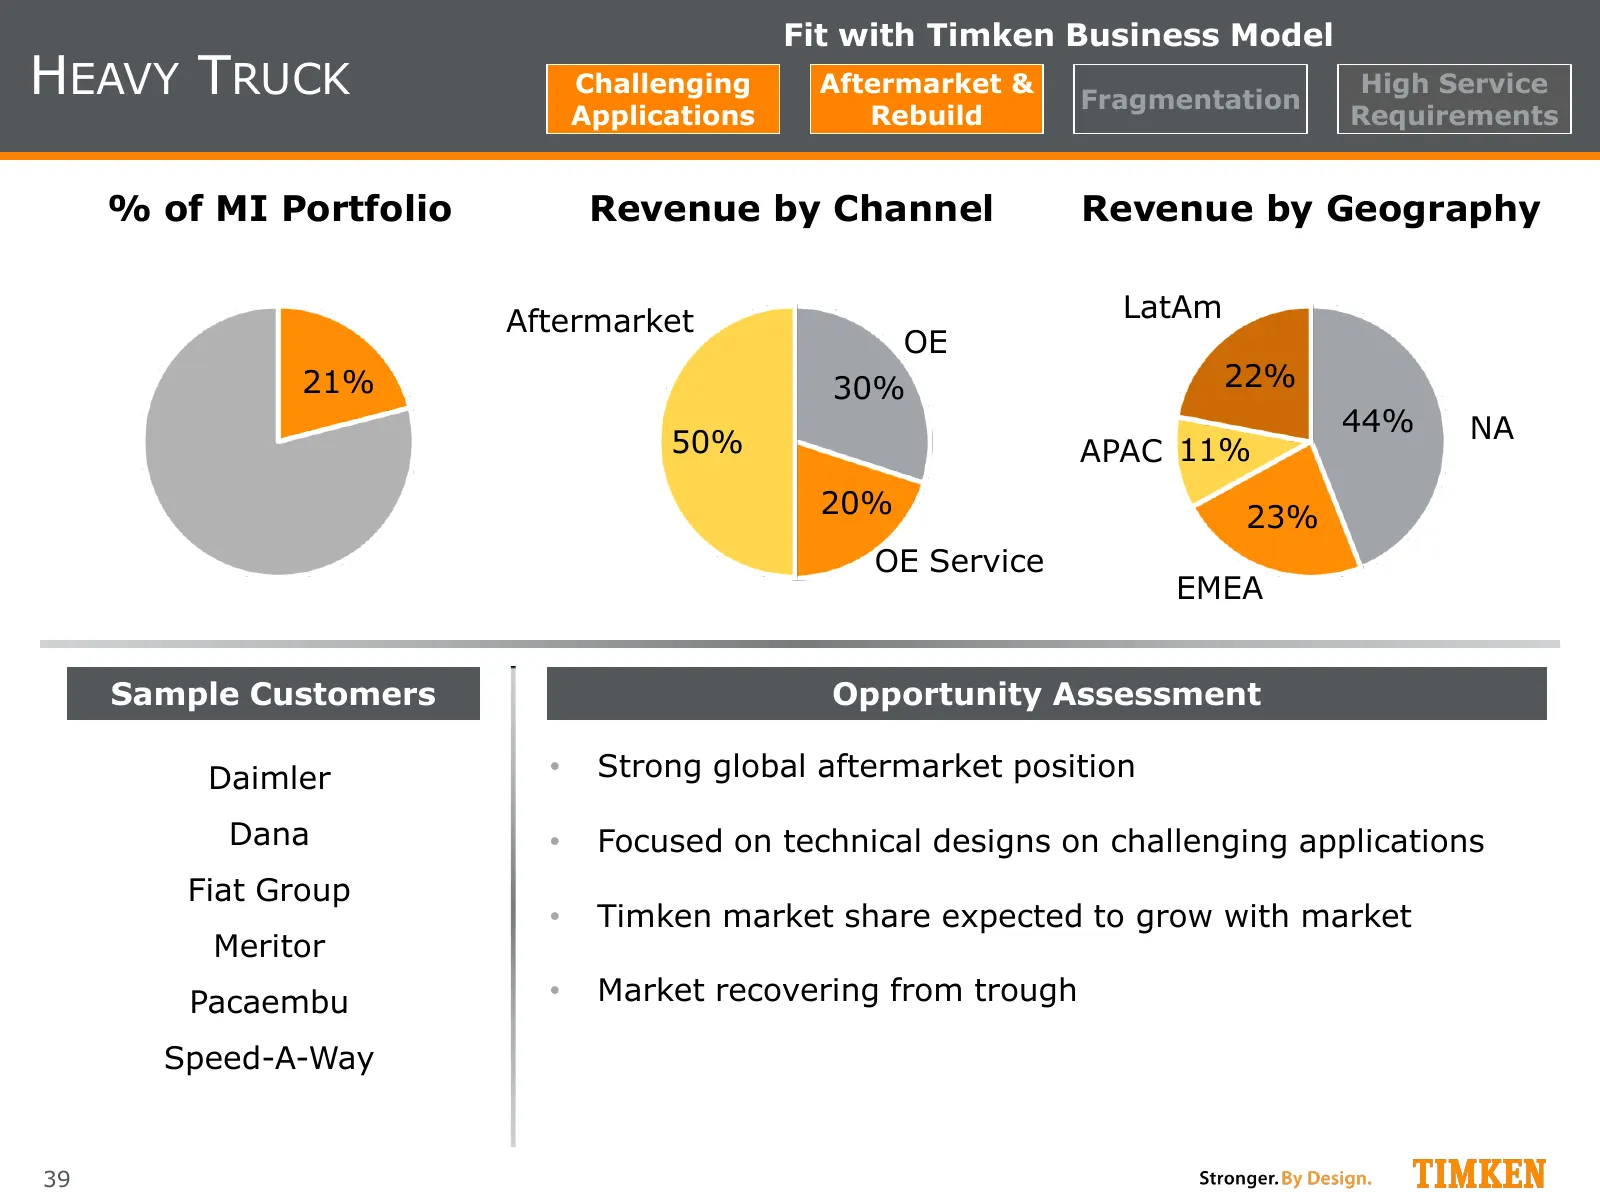
Fit with Timken Business Model HEAVY TRUCK Challenging Aftermarket & Fragmentation High Service Applications Rebuild Requirements % of MI Portfolio Revenue by Channel Revenue by Geography Aftermarket LatAm OE 21% 30% 22% 44% NA 50% APAC 11% 20% 23% OE Service EMEA Sample Customers Opportunity Assess
Slide 40: Rail
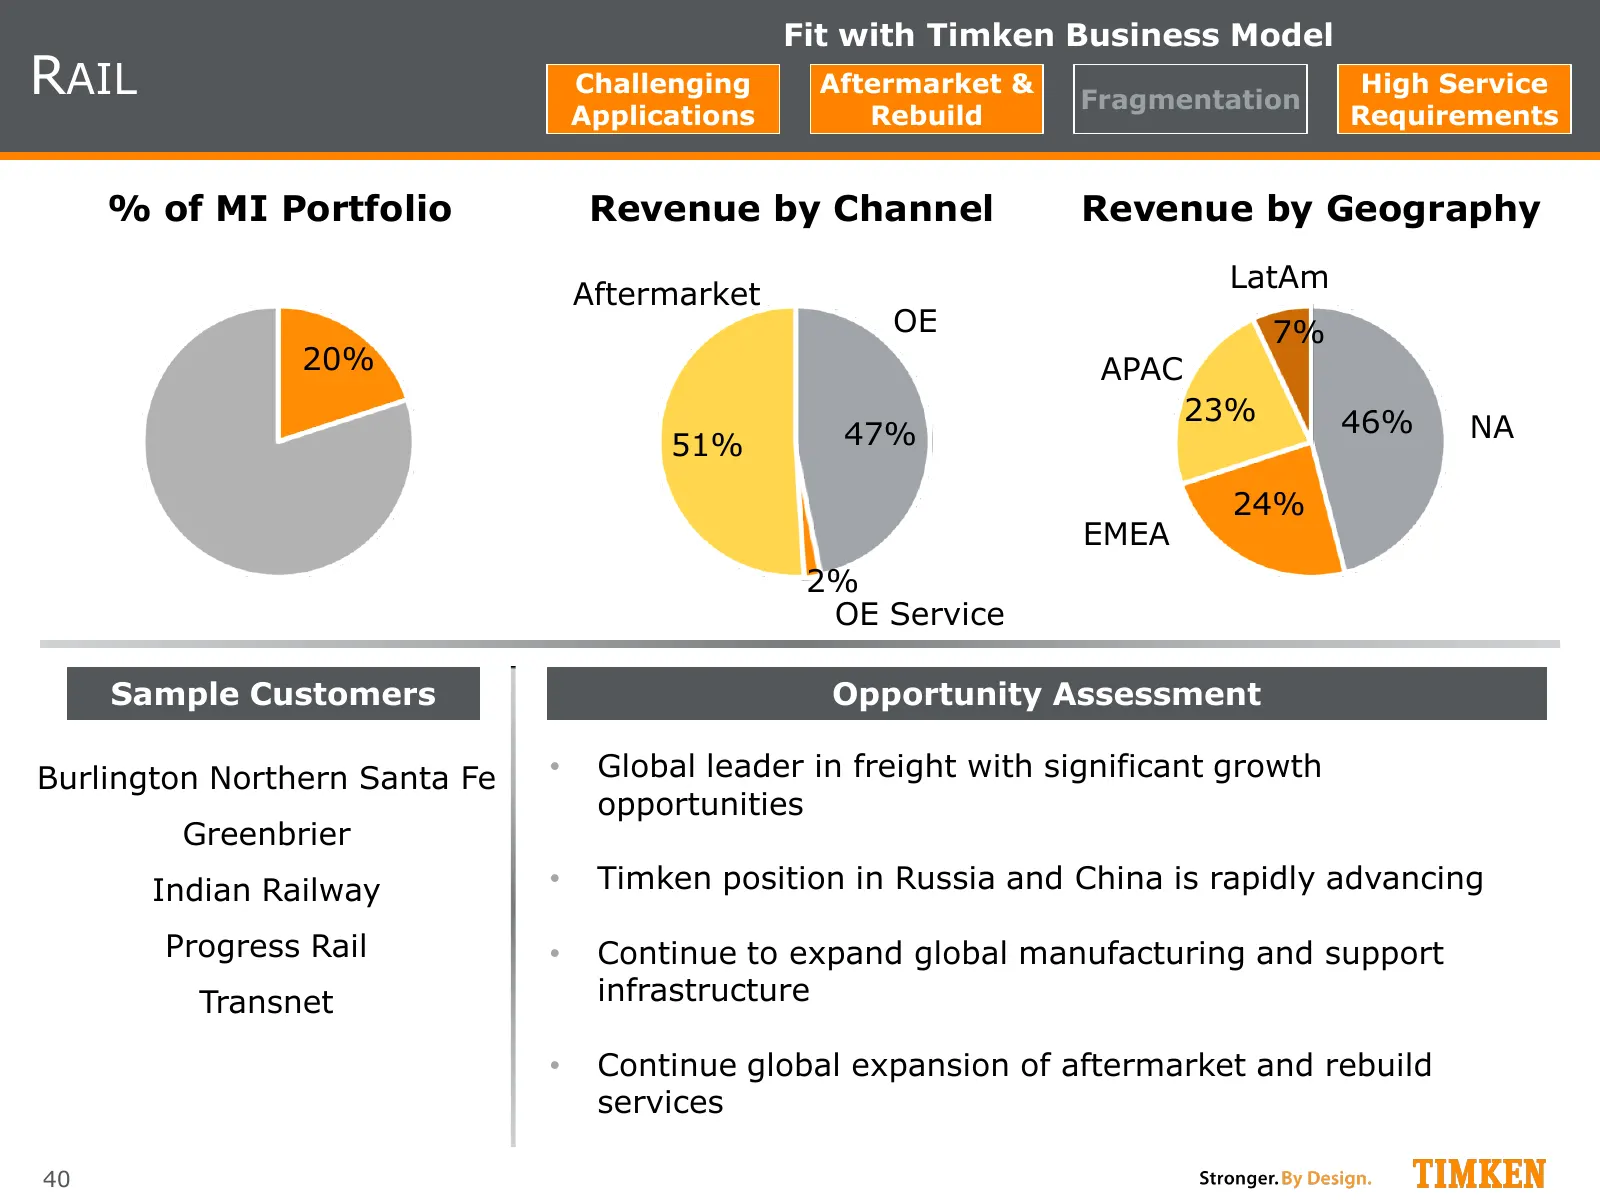
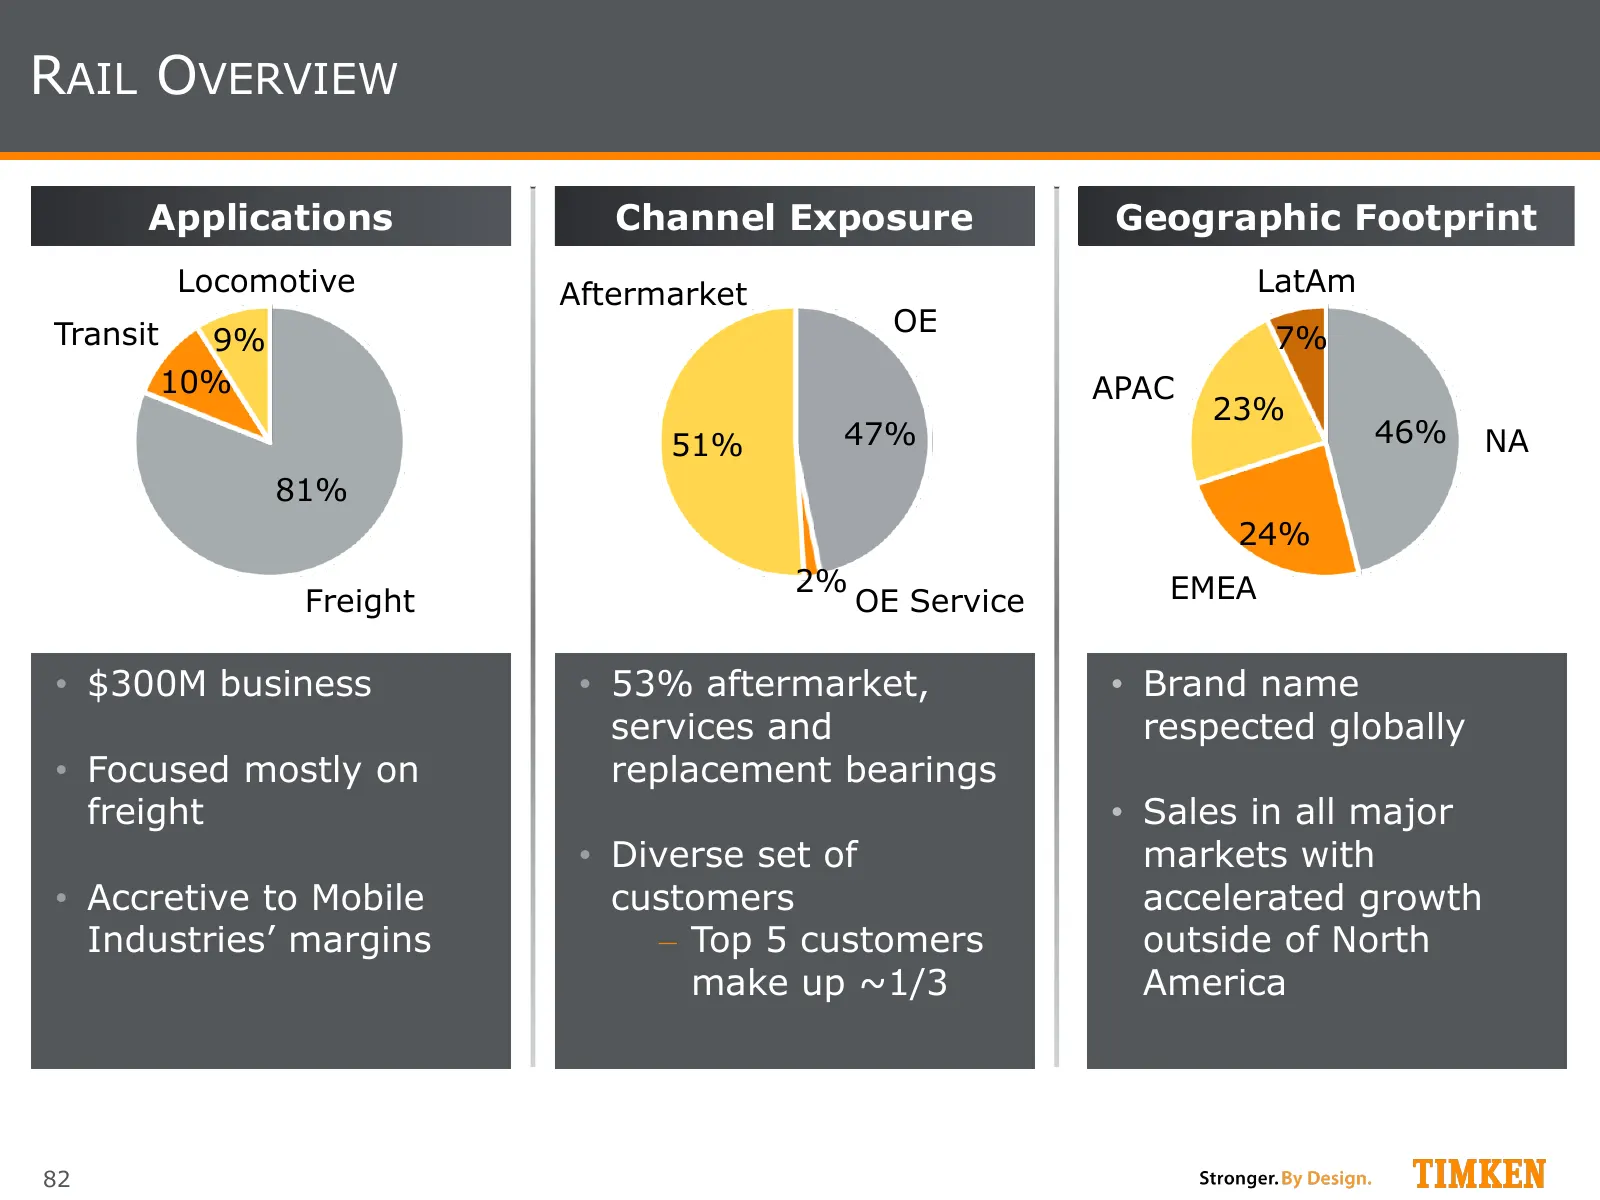
Fit with Timken Business Model RAIL Challenging Aftermarket & Fragmentation High Service Applications Rebuild Requirements % of MI Portfolio Revenue by Channel Revenue by Geography LatAm Aftermarket OE 7% 20% APAC 23% 46% 47% NA 51% 24% EMEA 2% OE Service Sample Customers Opportunity Assessment Burl
Slide 41: Mobile Industries Outlook
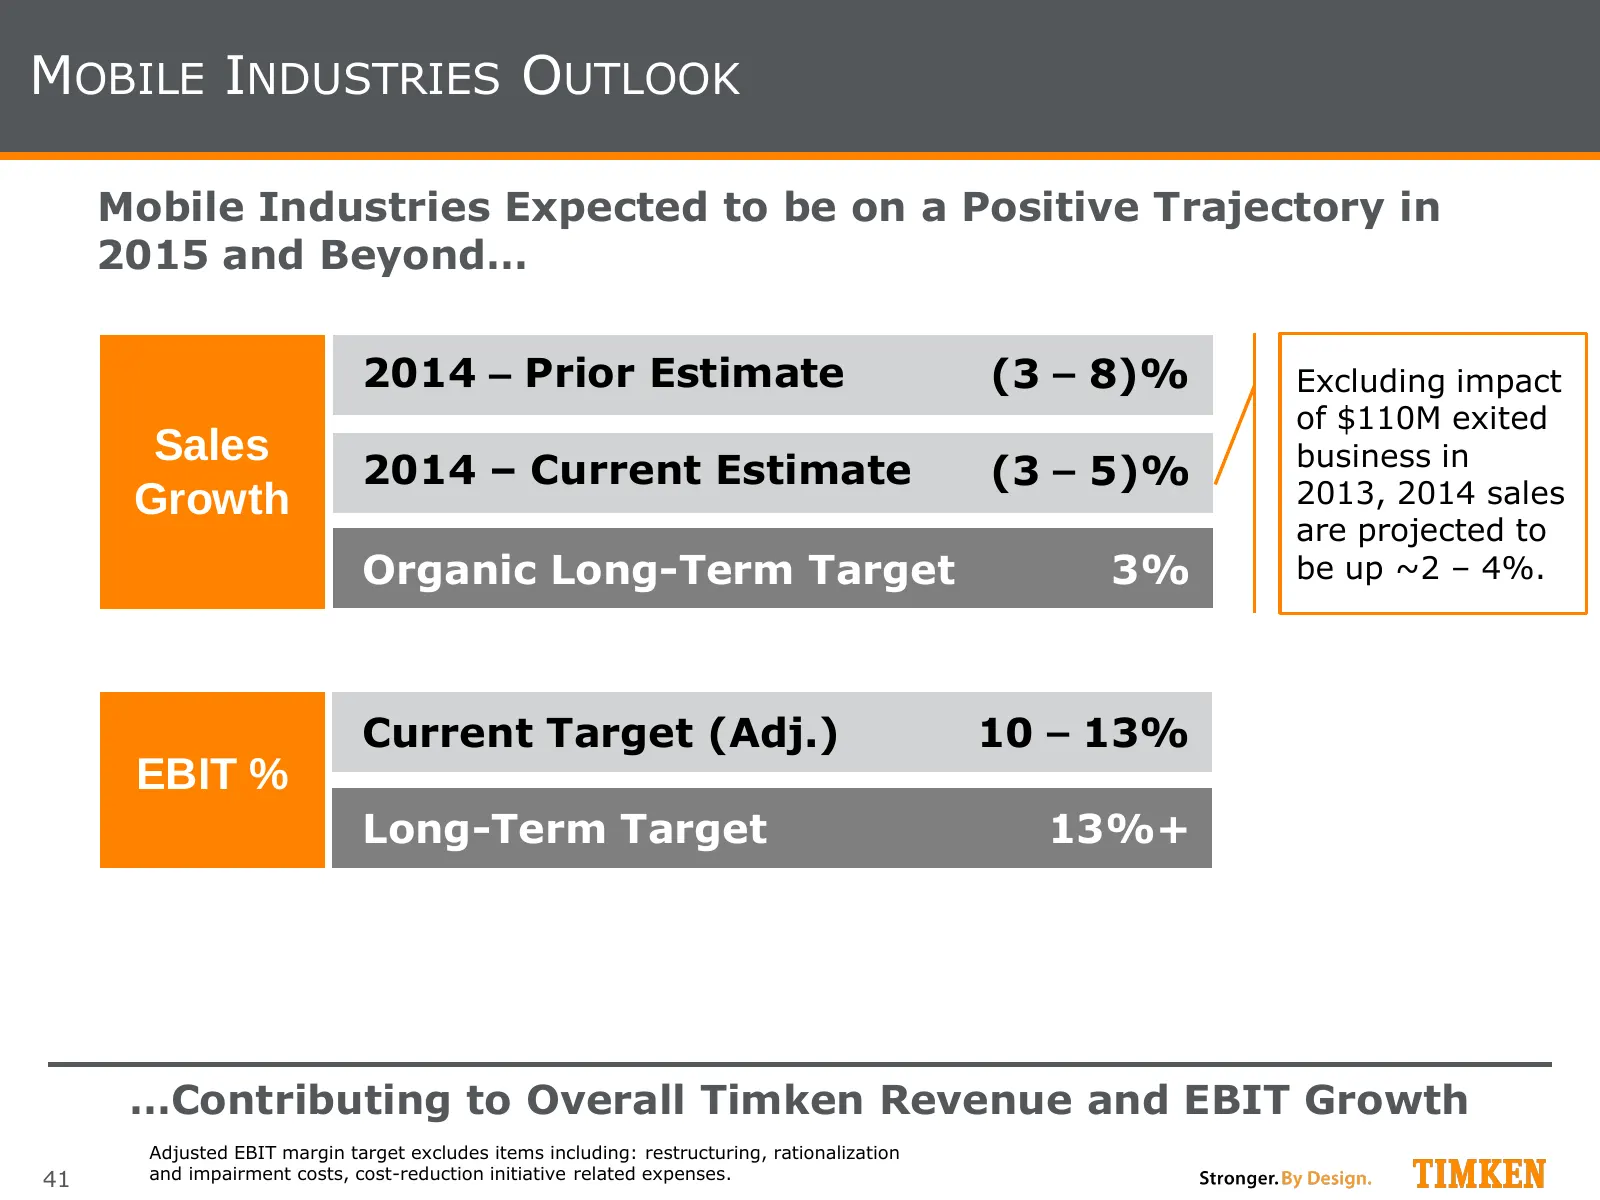
MOBILE INDUSTRIES OUTLOOK Mobile Industries Expected to be on a Positive Trajectory in 2015 and Beyond… 2014 – Prior Estimate (3 – 8)% Excluding impact of $110M exited Sales business in 2014 – Current Estimate (3 – 5)% 2013, 2014 sales Growth are projected to Organic Long-Term Target 3% be up ~2 – 4
Slide 42: Summary
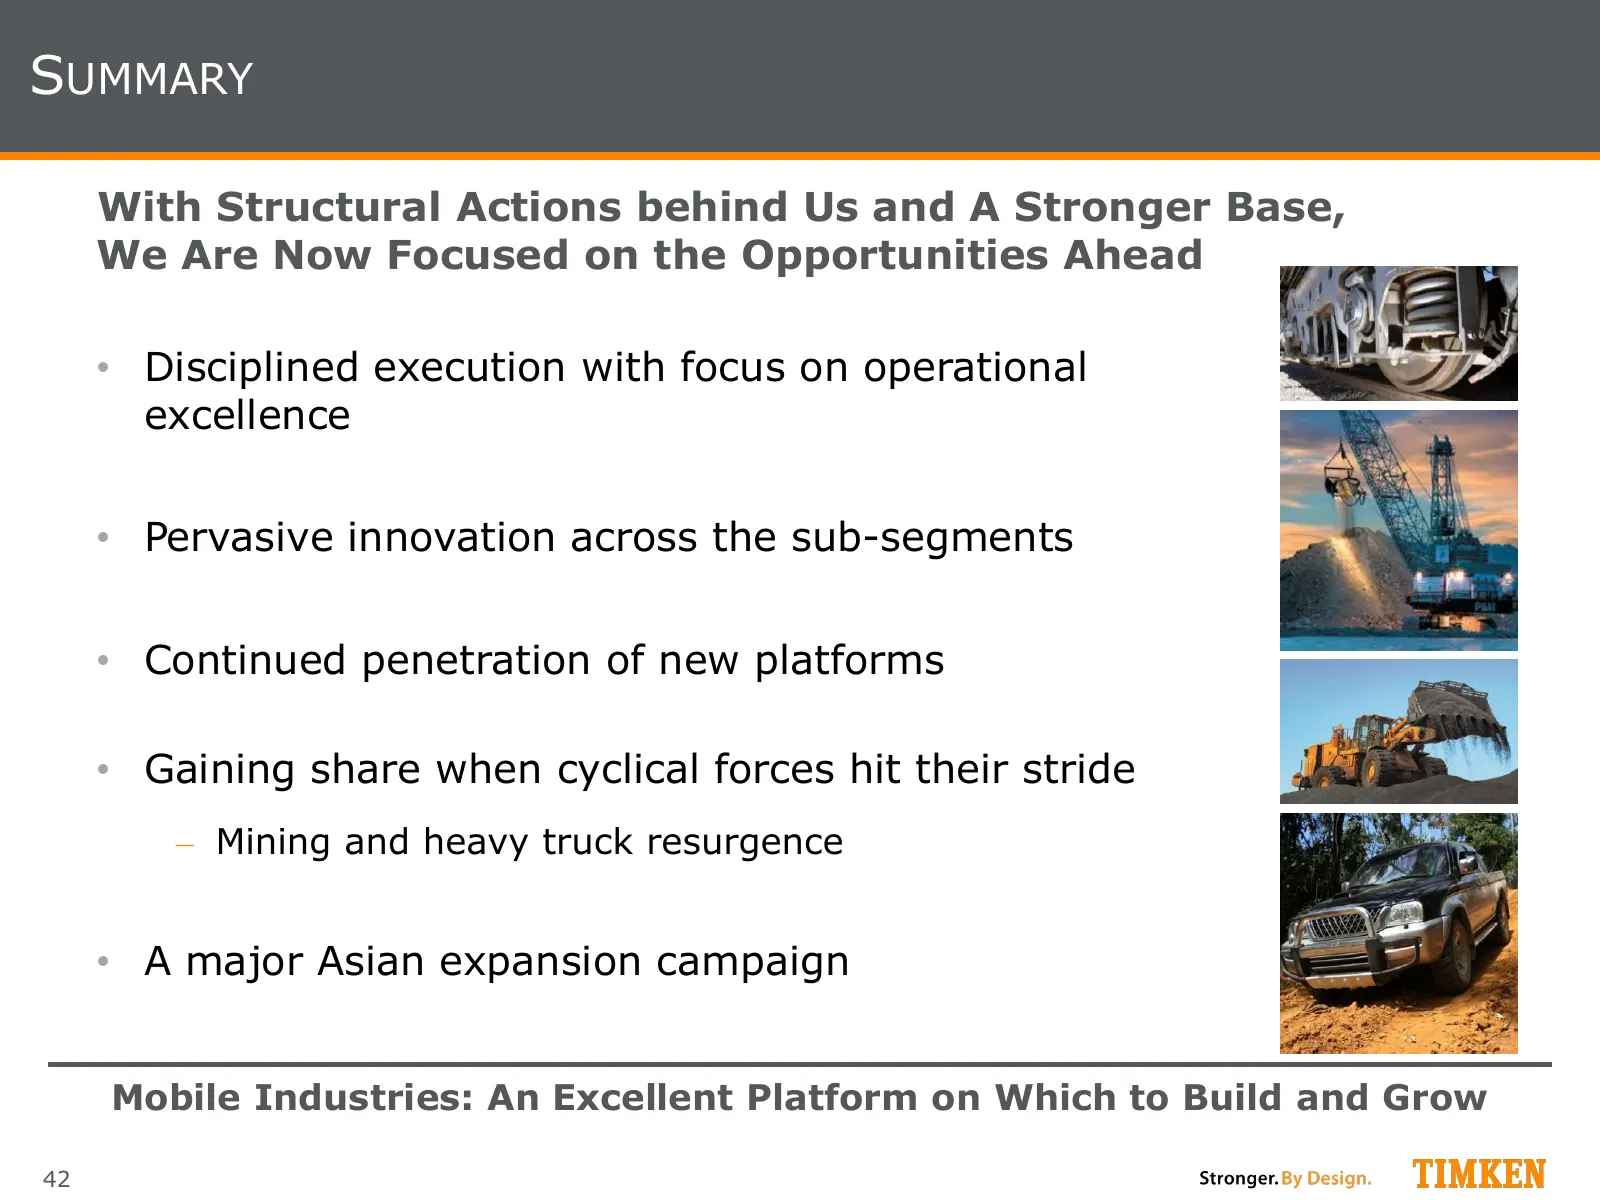
SUMMARY With Structural Actions behind Us and A Stronger Base, We Are Now Focused on the Opportunities Ahead • Disciplined execution with focus on operational excellence • Pervasive innovation across the sub-segments • Continued penetration of new platforms • Gaining share when cyclical forces hit t
Slide 43: Aerospace
Aerospace Erik Paulhardt, Vice President
Slide 44: Key Messages
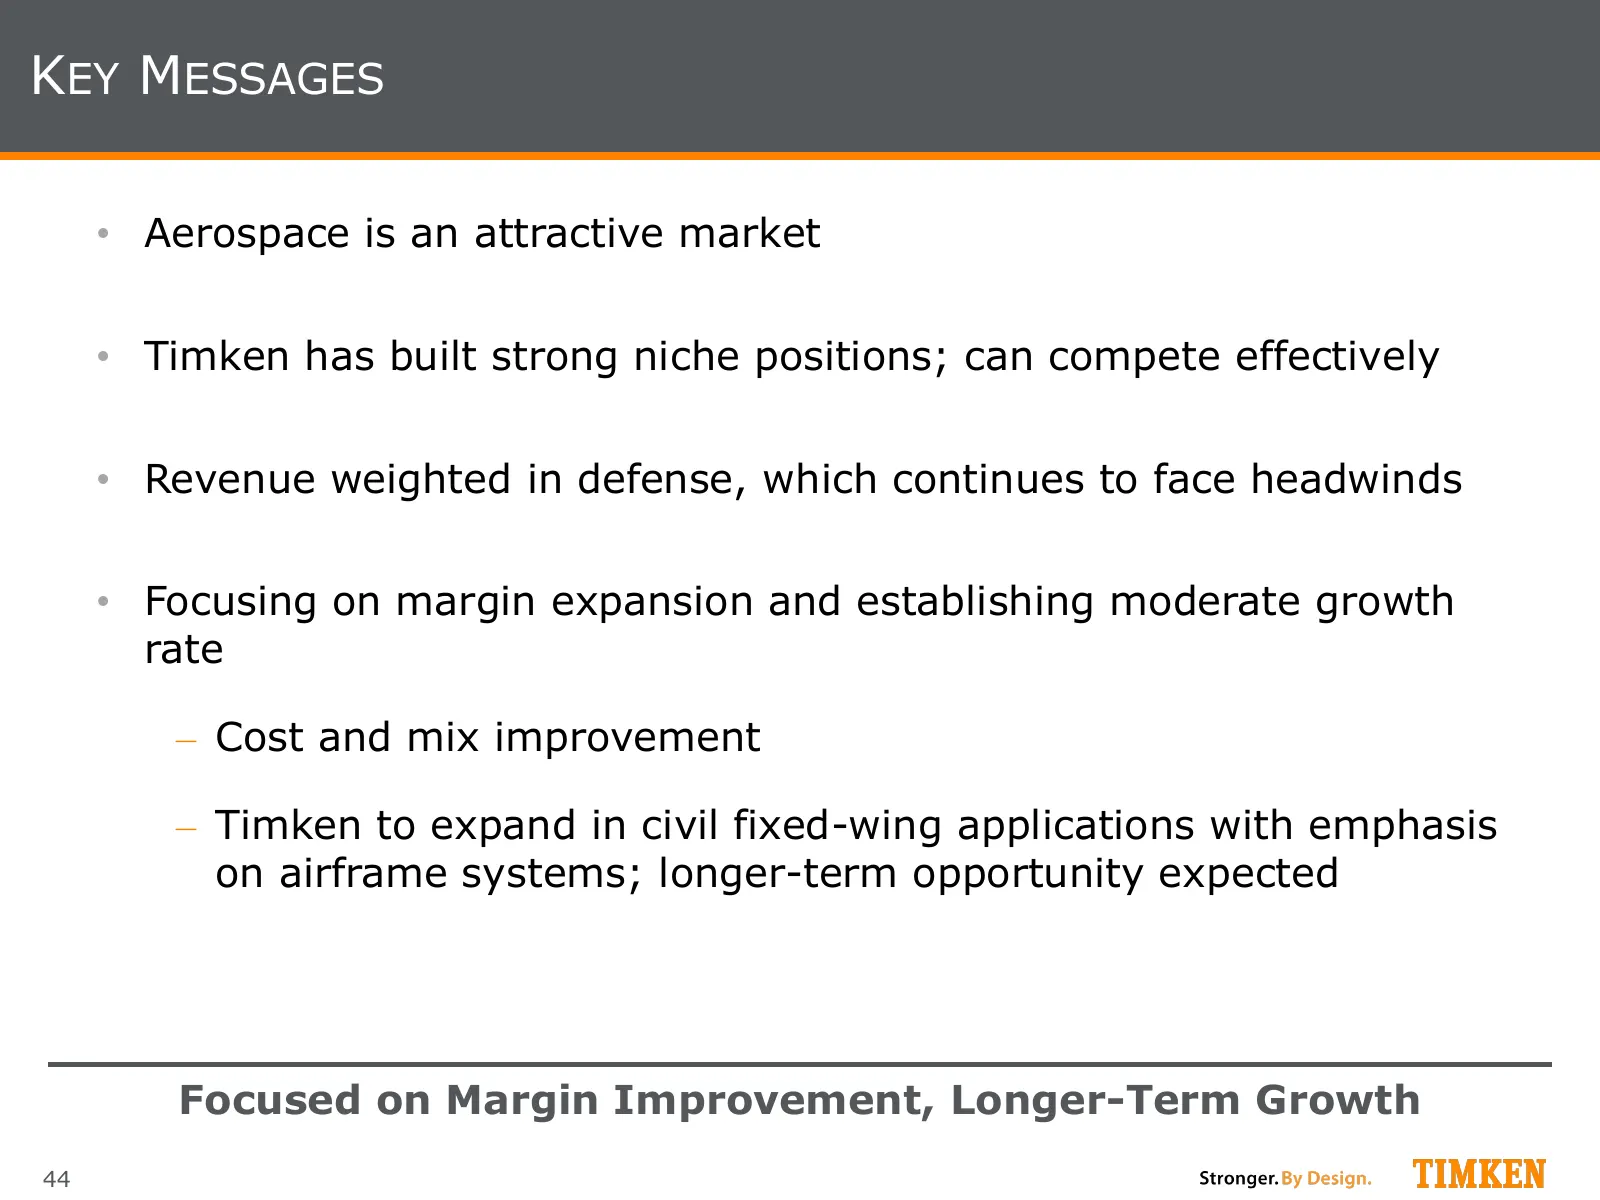
KEY MESSAGES • Aerospace is an attractive market • Timken has built strong niche positions; can compete effectively • Revenue weighted in defense, which continues to face headwinds • Focusing on margin expansion and establishing moderate growth rate ‒ Cost and mix improvement ‒ Timken to expand in c
Slide 45: Timken Business Model
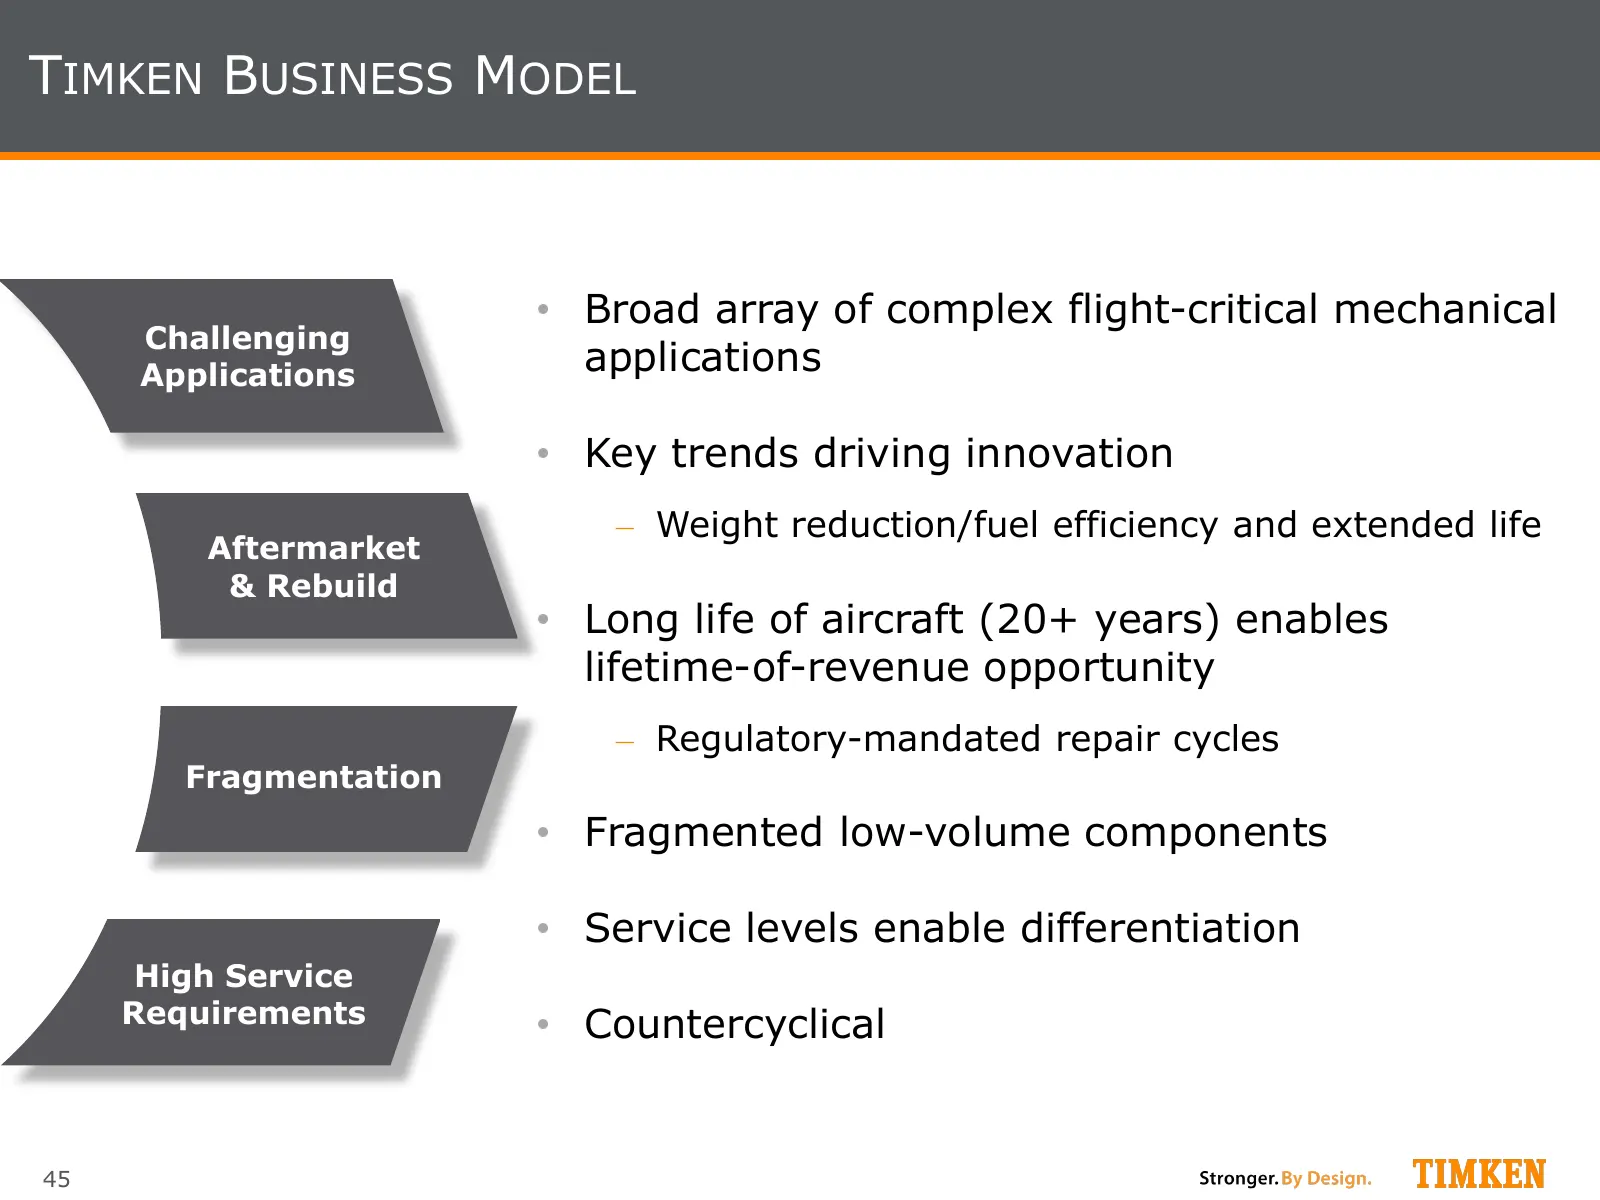
TIMKEN BUSINESS MODEL • Broad array of complex flight-critical mechanical Challenging Applications applications • Key trends driving innovation ‒ Weight reduction/fuel efficiency and extended life Aftermarket & Rebuild • Long life of aircraft (20+ years) enables lifetime-of-revenue opportunity ‒ Reg
Slide 46: Aerospace Overview
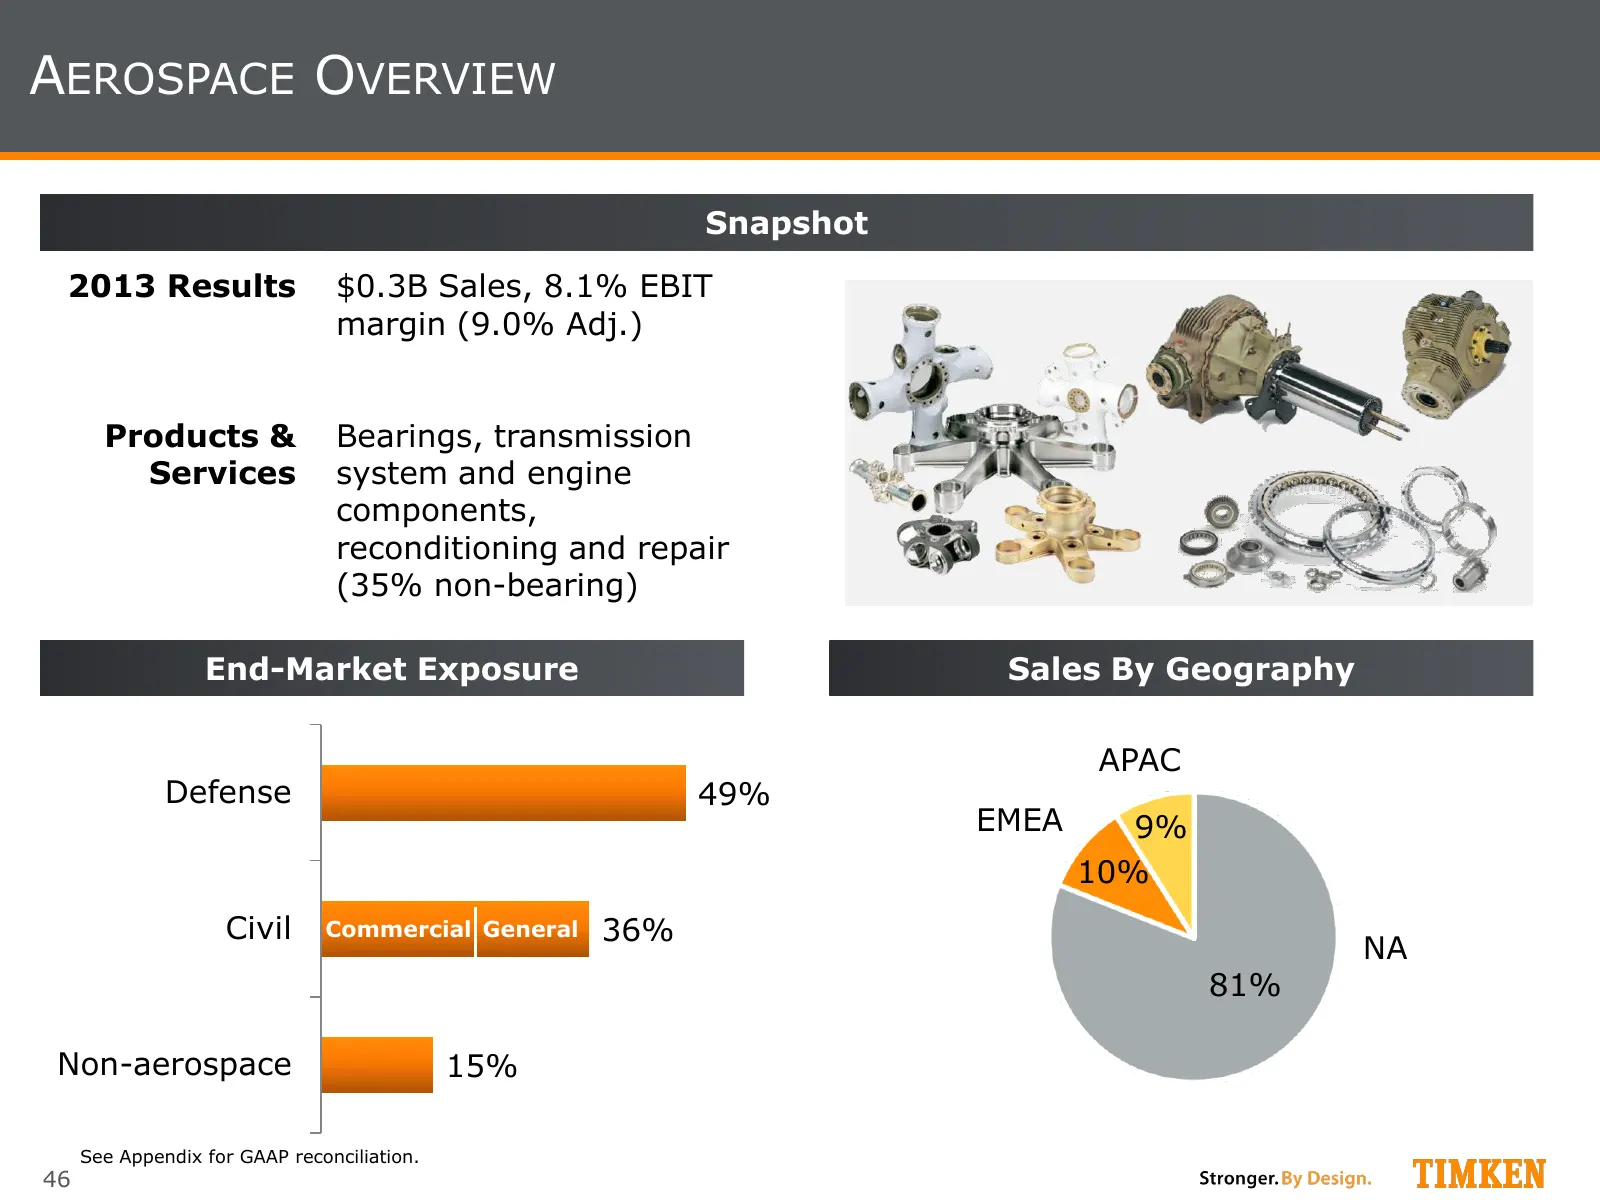
AEROSPACE OVERVIEW Snapshot 2013 Results $0.3B Sales, 8.1% EBIT margin (9.0% Adj.) Products & Bearings, transmission Services system and engine components, reconditioning and repair (35% non-bearing) End-Market Exposure Sales By Geography APAC Defense 49% EMEA 9% 10% Civil Commercial General 36% NA
Slide 47: Markets Served
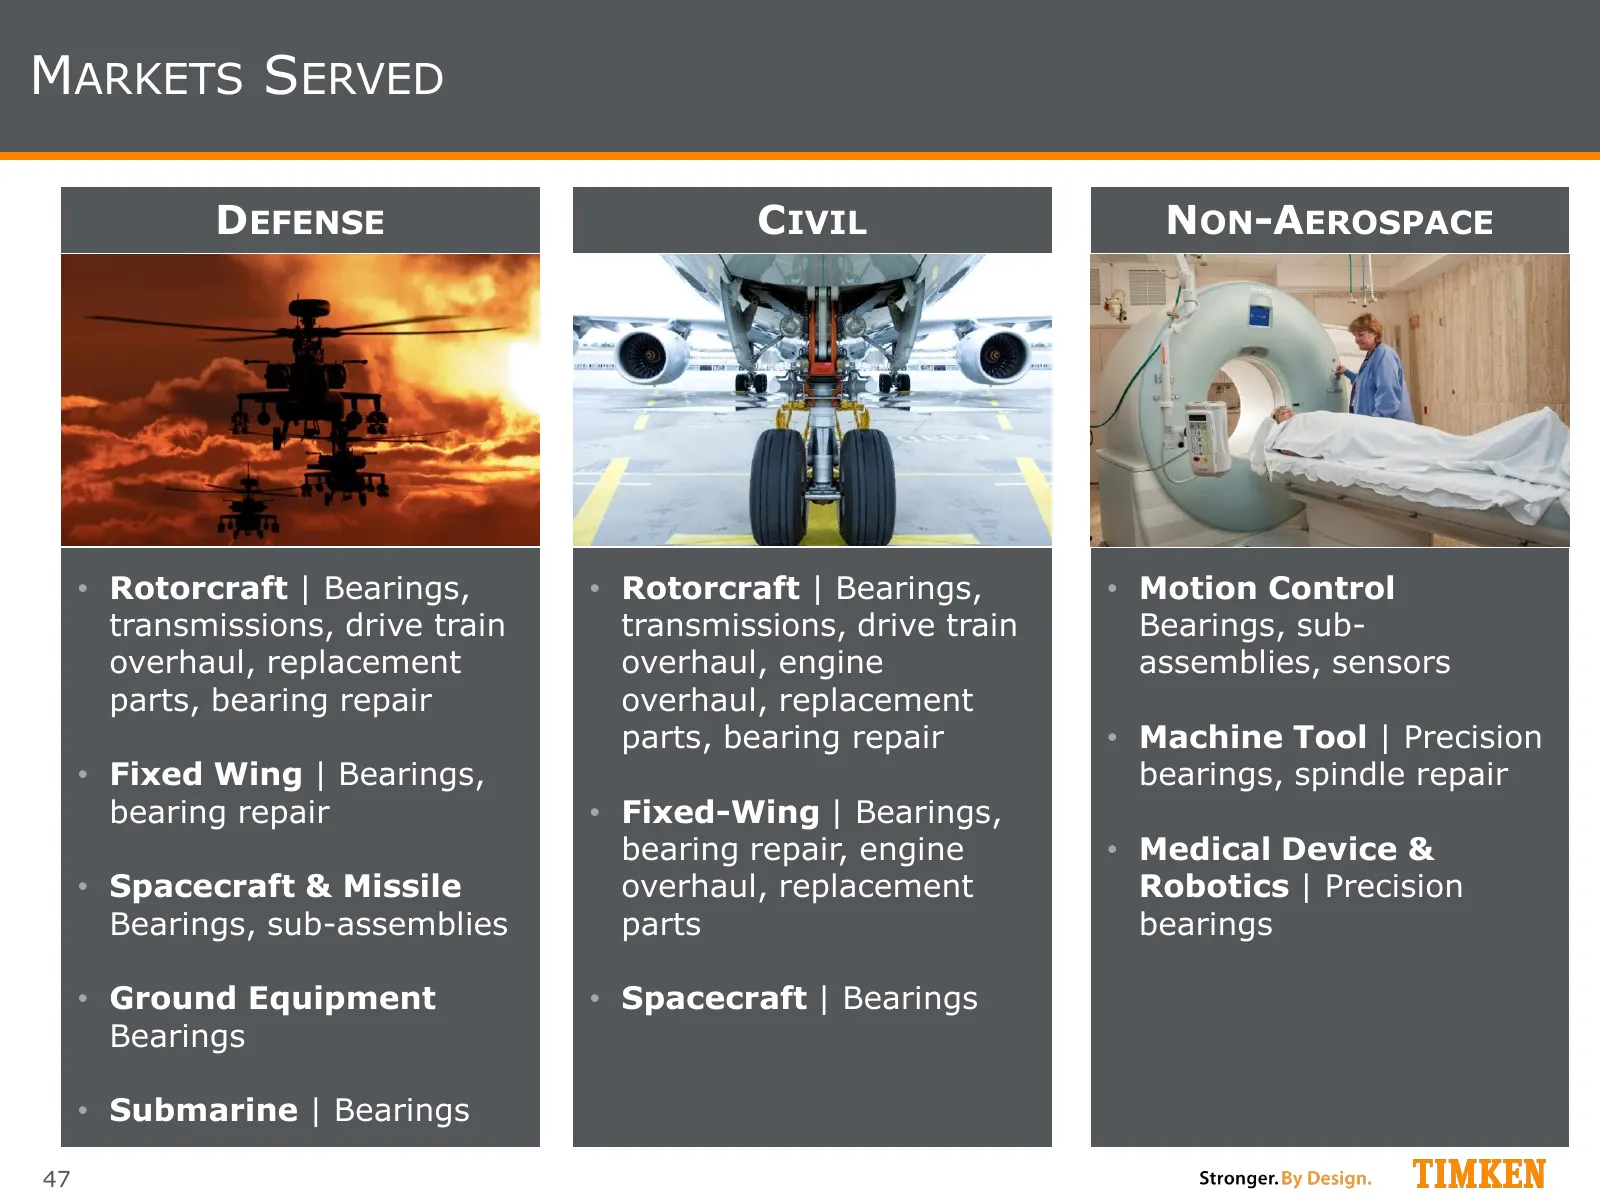
MARKETS SERVED DEFENSE CIVIL NON-AEROSPACE • Rotorcraft | Bearings, • Rotorcraft | Bearings, • Motion Control transmissions, drive train transmissions, drive train Bearings, sub- overhaul, replacement overhaul, engine assemblies, sensors parts, bearing repair overhaul, replacement parts, bearing rep
Slide 48: Rotorcraft Presence
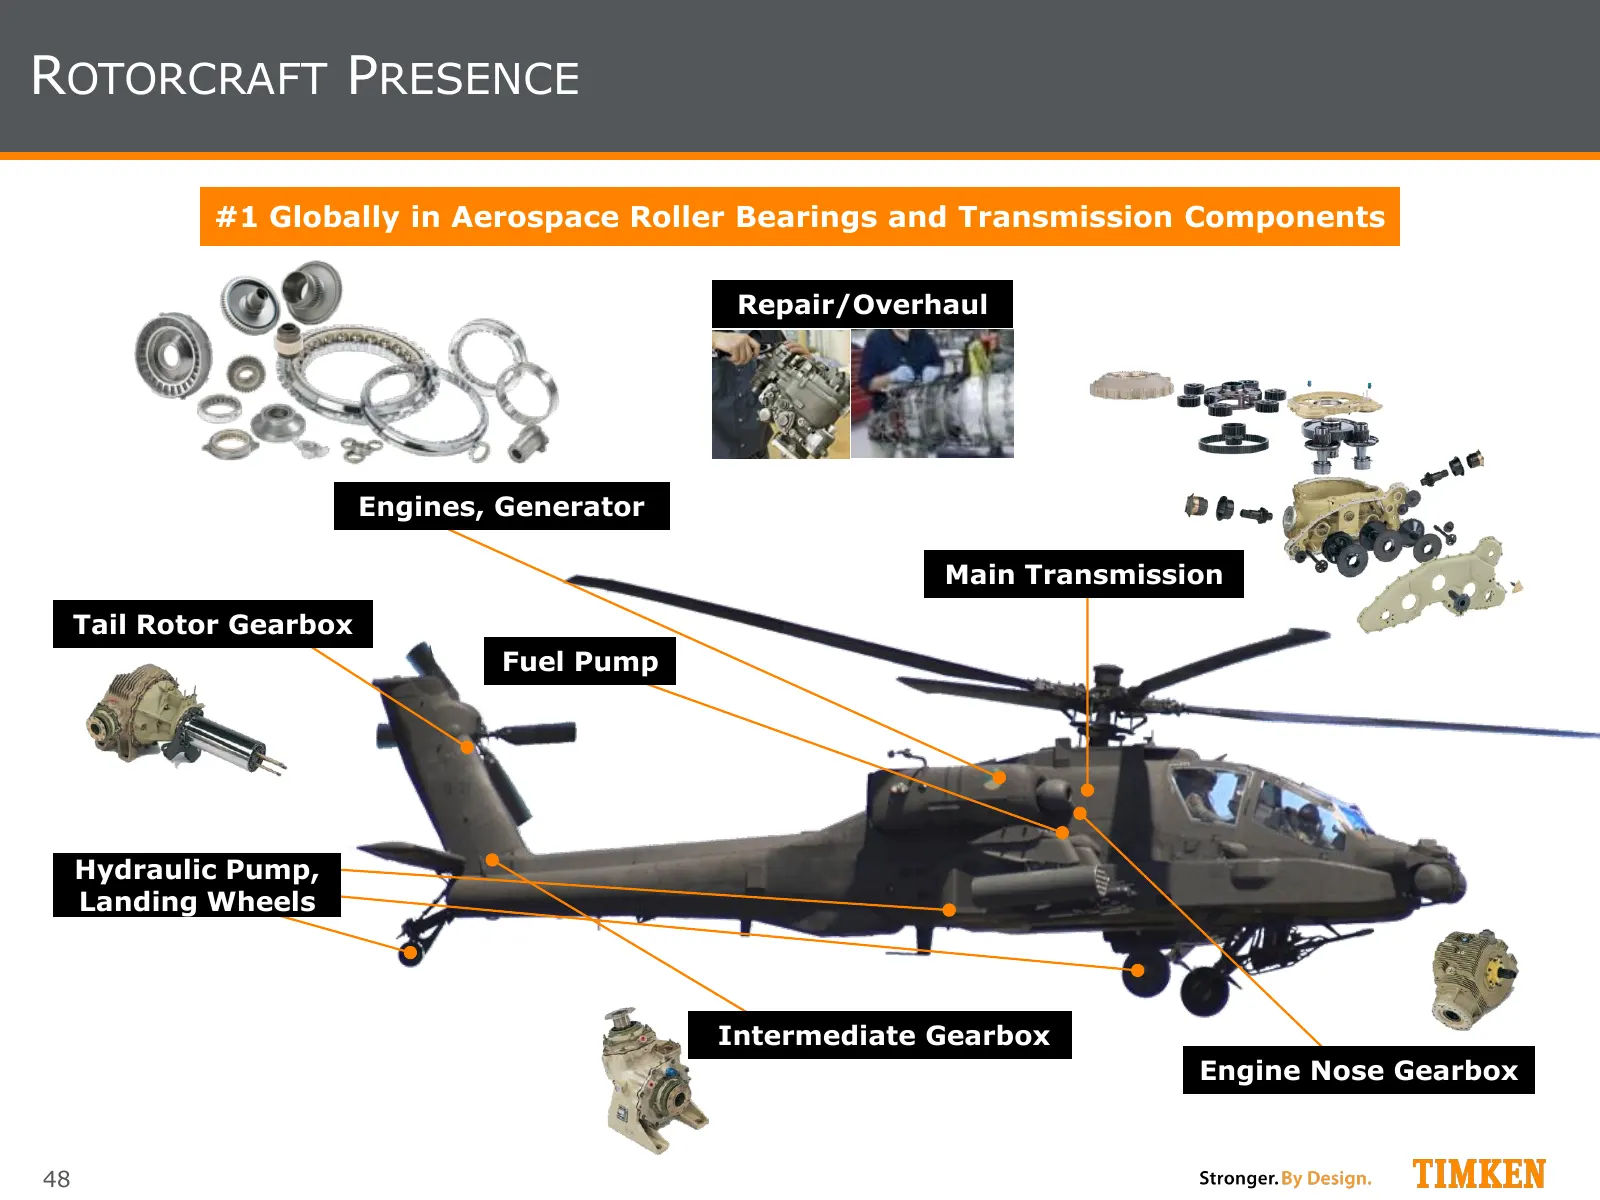
ROTORCRAFT PRESENCE #1 Globally in Aerospace Roller Bearings and Transmission Components Repair/Overhaul Engines, Generator Main Transmission Tail Rotor Gearbox Fuel Pump Hydraulic Pump, Landing Wheels Intermediate Gearbox Engine Nose Gearbox 48
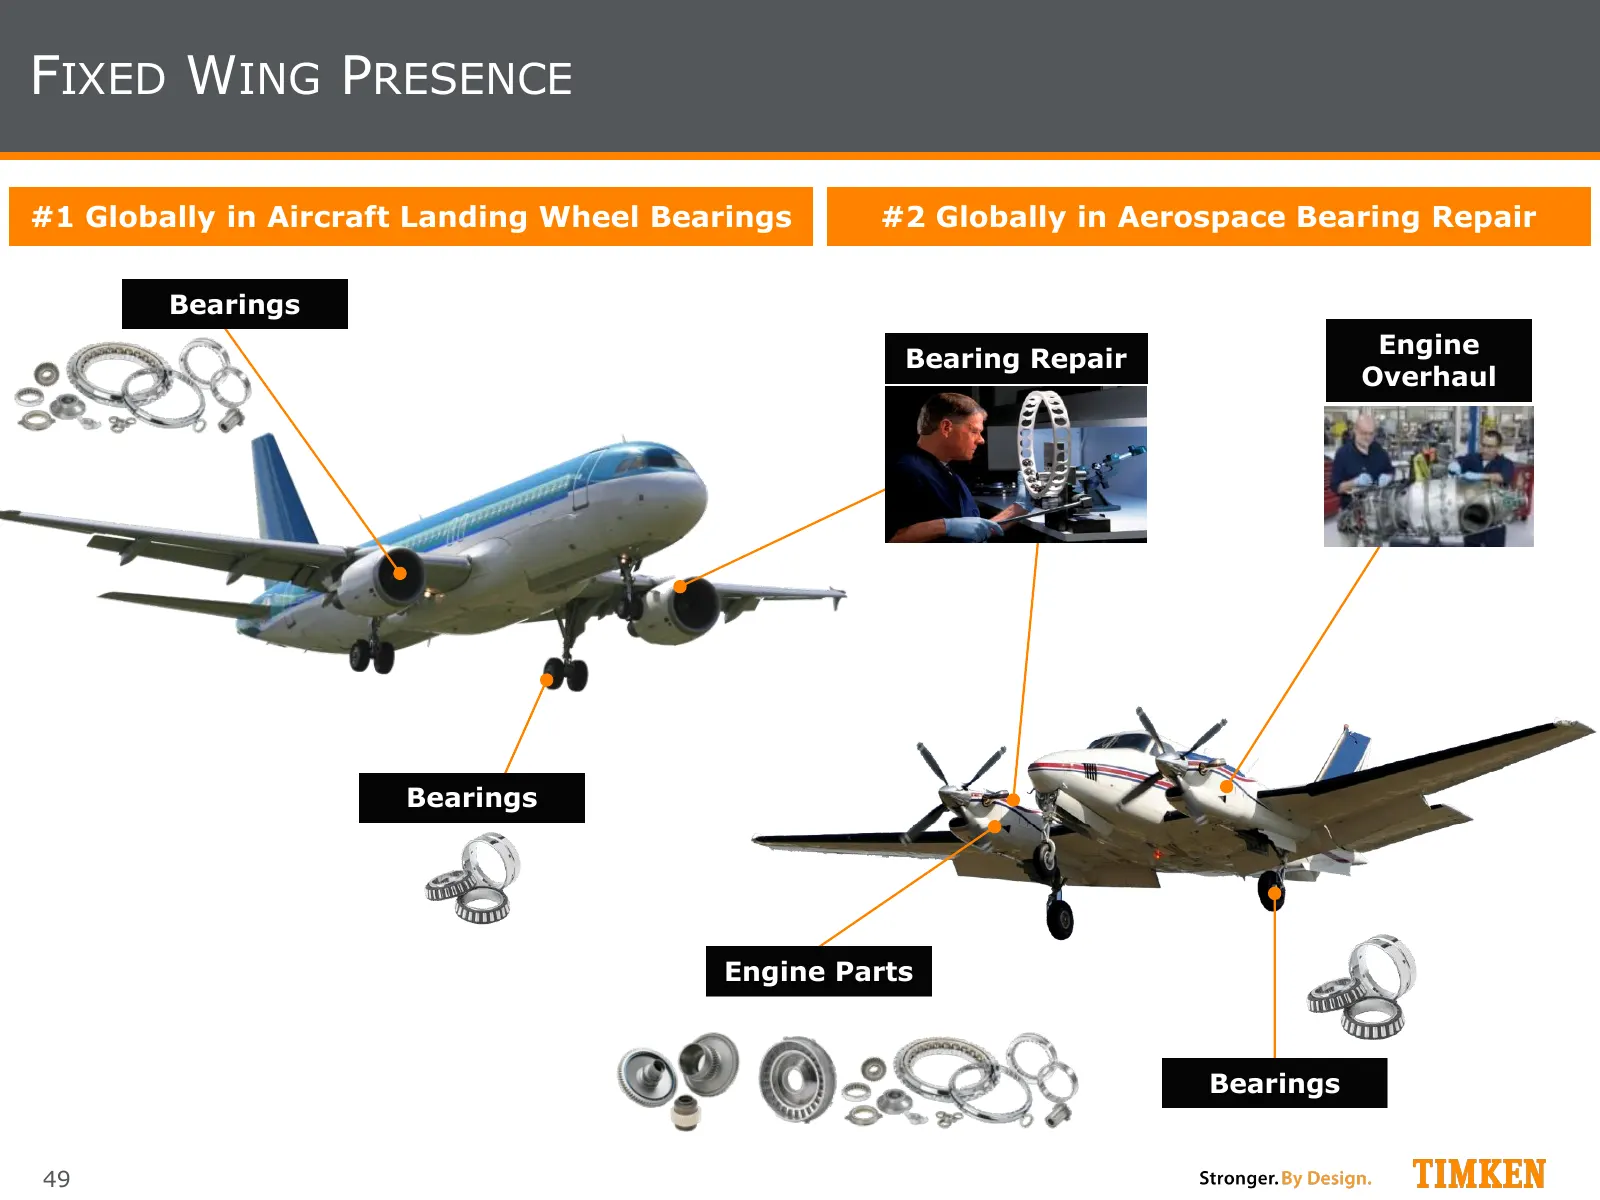
Slide 49: Fixed Wing Presence
FIXED WING PRESENCE #1 Globally in Aircraft Landing Wheel Bearings #2 Globally in Aerospace Bearing Repair Bearings Engine Bearing Repair Overhaul Bearings Engine Parts Bearings 49
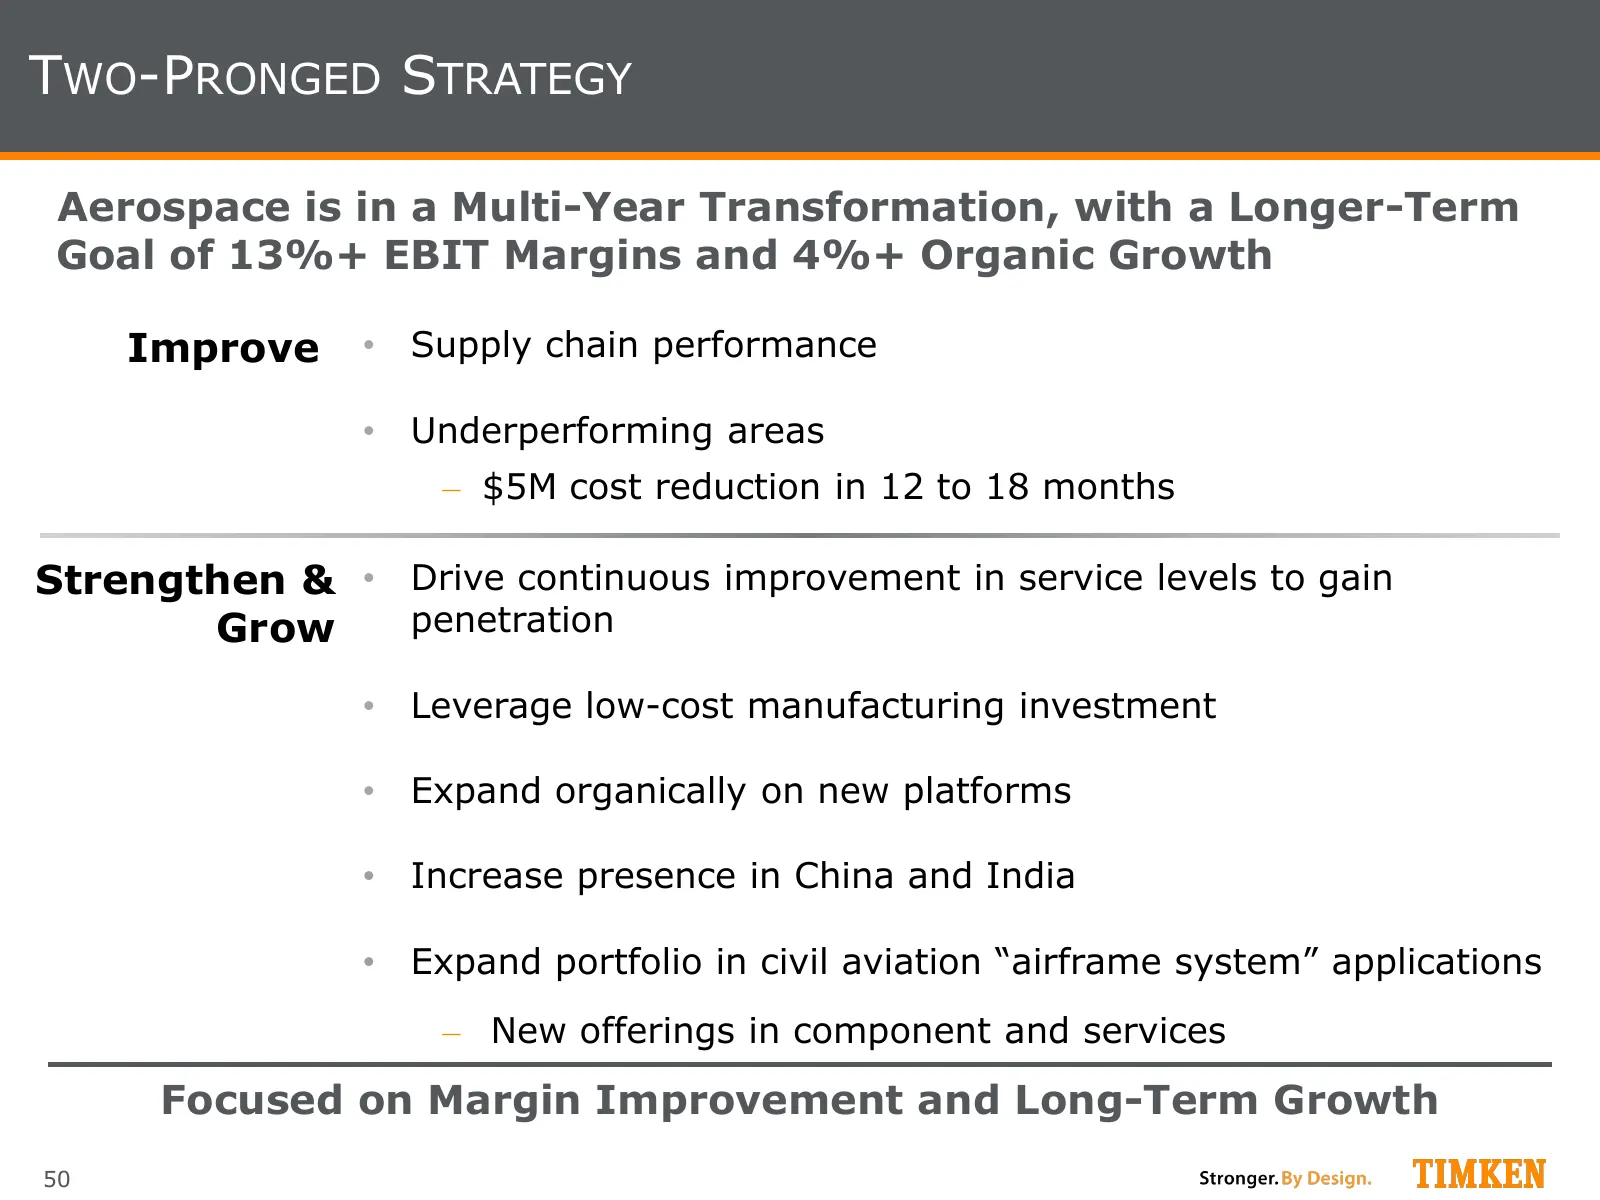
Slide 50: Two-Pronged Strategy
TWO-PRONGED STRATEGY Aerospace is in a Multi-Year Transformation, with a Longer-Term Goal of 13%+ EBIT Margins and 4%+ Organic Growth Improve • Supply chain performance • Underperforming areas ‒ $5M cost reduction in 12 to 18 months Strengthen & • Drive continuous improvement in service levels to ga
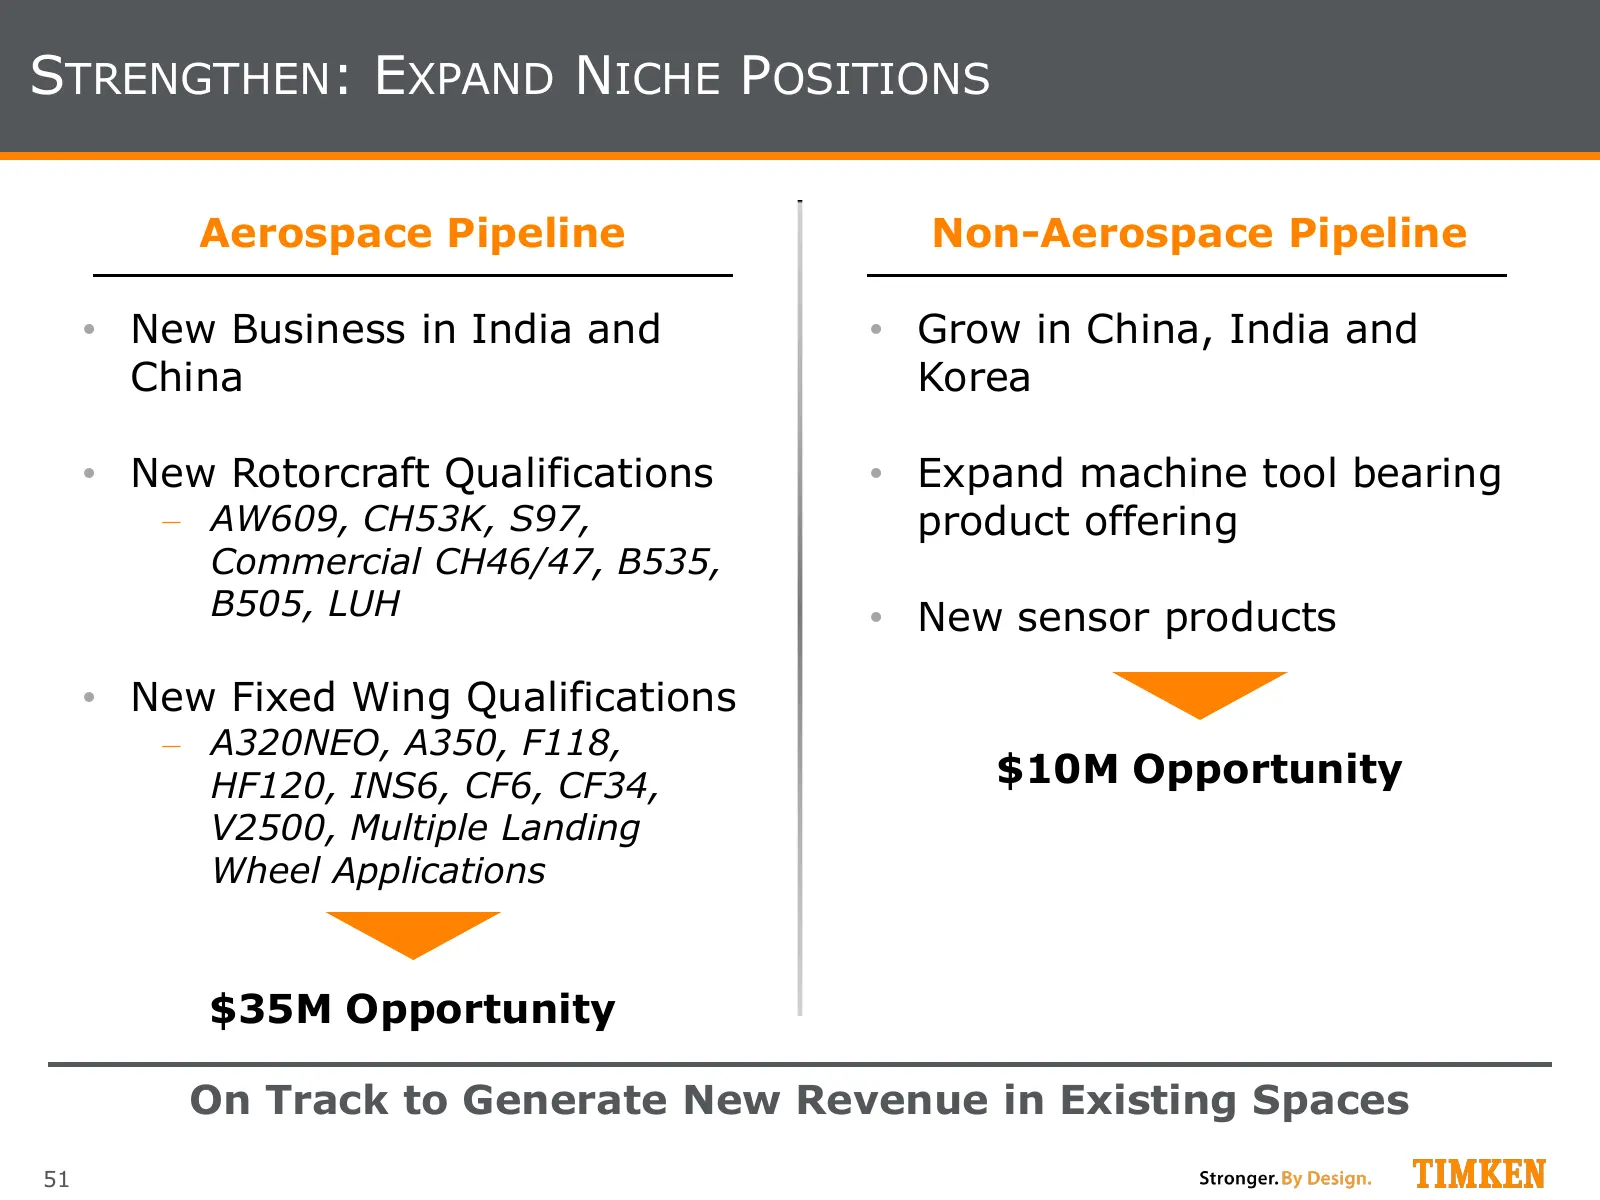
Slide 51: Strengthen: Expand Niche Positions
STRENGTHEN: EXPAND NICHE POSITIONS Aerospace Pipeline Non-Aerospace Pipeline • New Business in India and • Grow in China, India and China Korea • New Rotorcraft Qualifications • Expand machine tool bearing ‒ AW609, CH53K, S97, product offering Commercial CH46/47, B535, B505, LUH • New sensor product
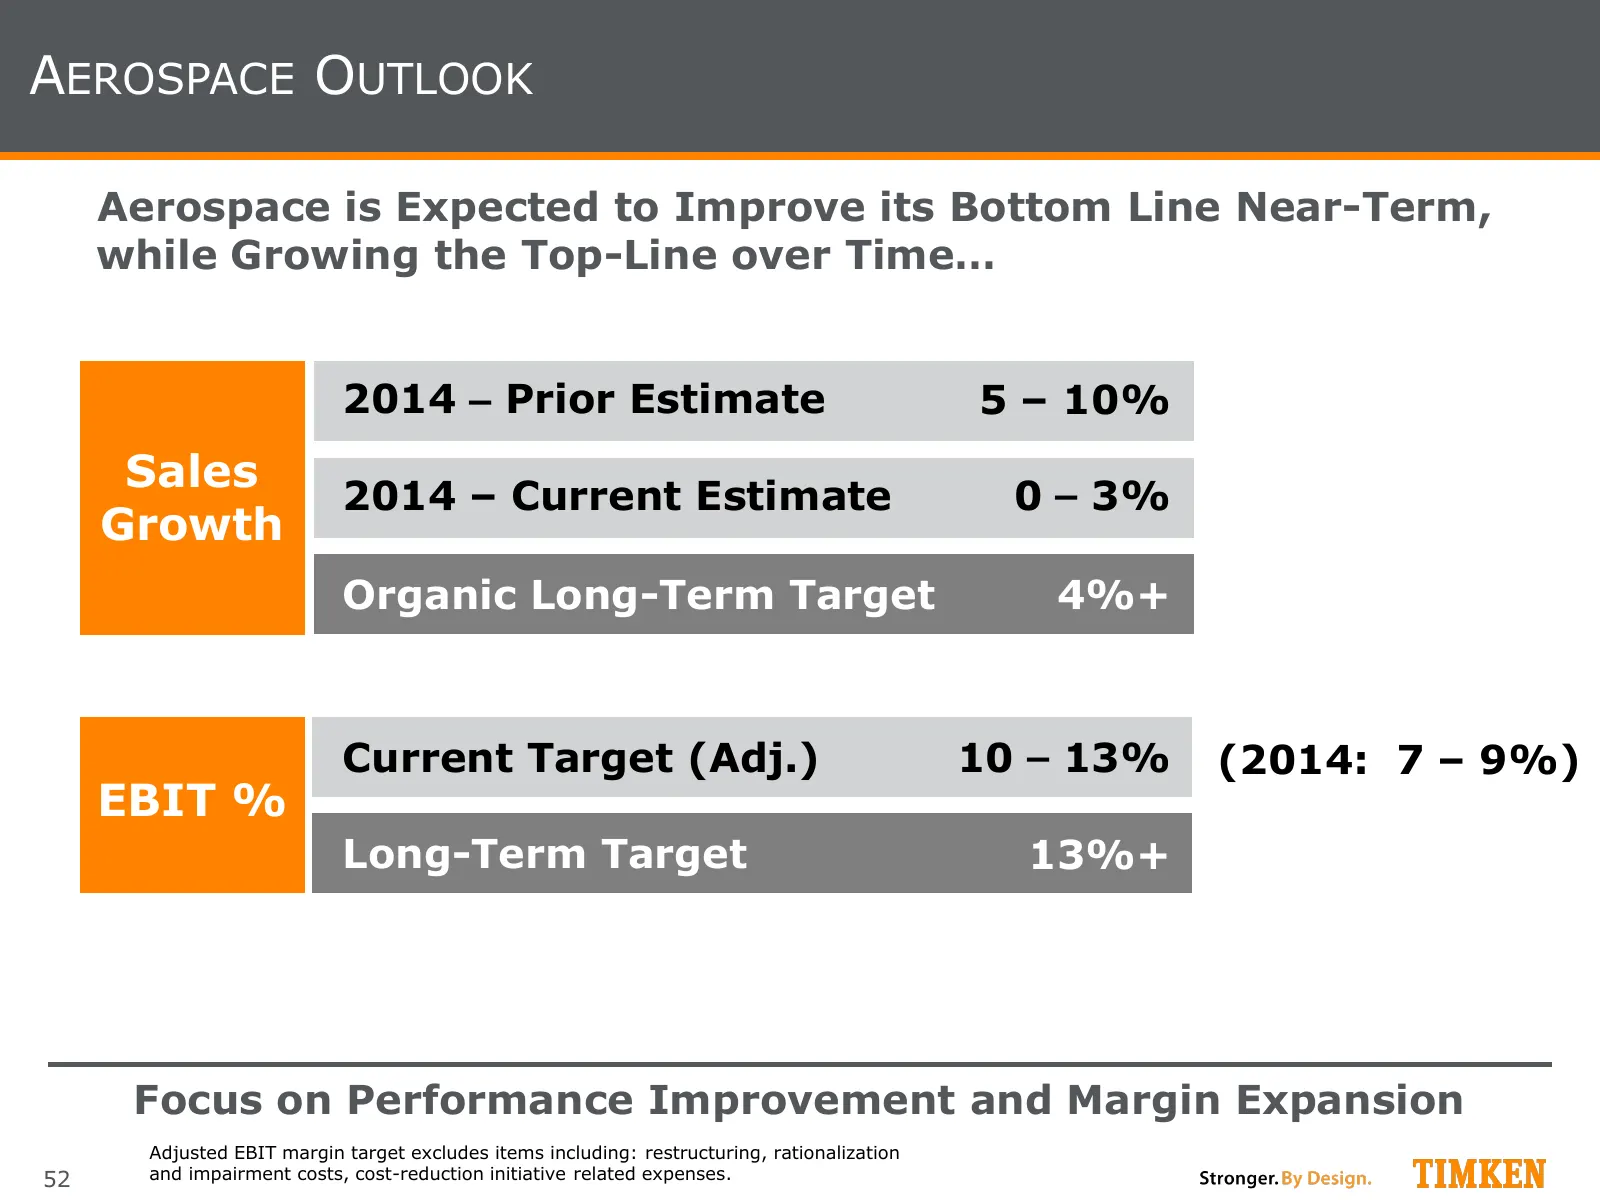
Slide 52: Aerospace Outlook
AEROSPACE OUTLOOK Aerospace is Expected to Improve its Bottom Line Near-Term, while Growing the Top-Line over Time… 2014 – Prior Estimate 5 – 10% Sales 2014 – Current Estimate 0 – 3% Growth Organic Long-Term Target 4%+ Current Target (Adj.) 10 – 13% (2014: 7 – 9%) EBIT % Long-Term Target 13%+ Focus
Slide 53: Summary
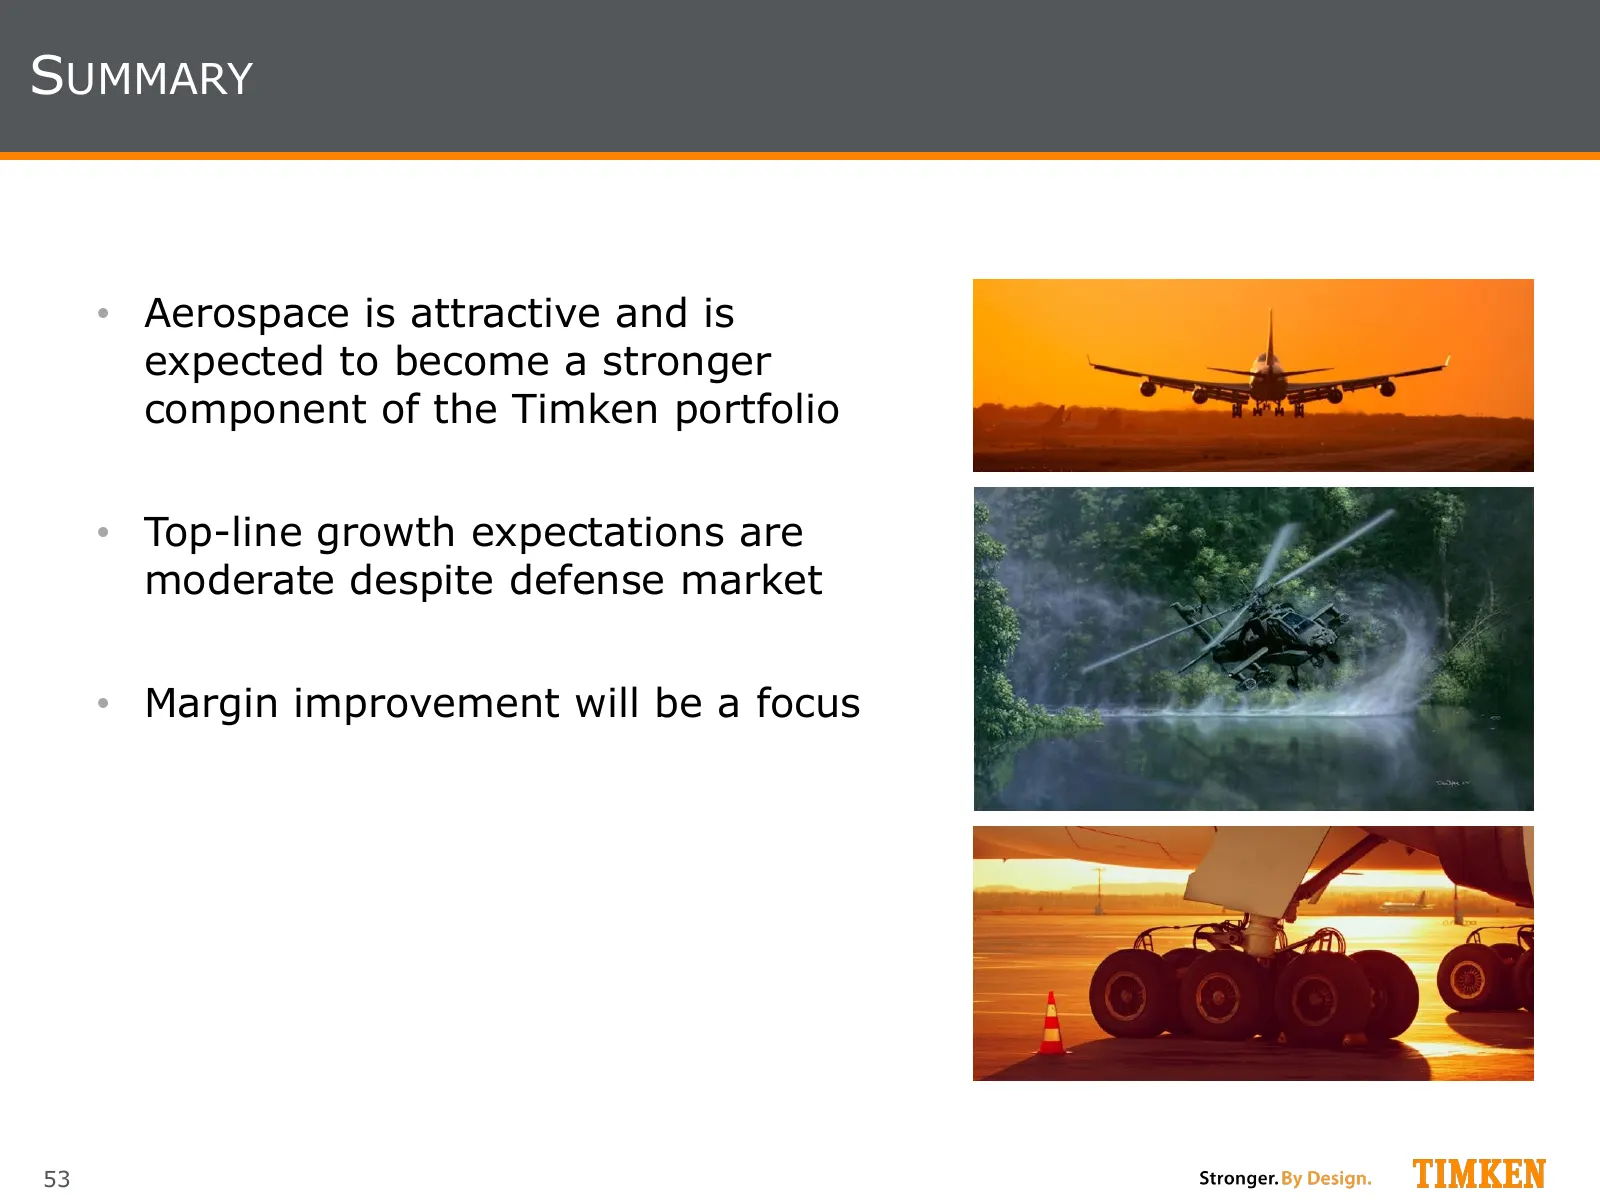
SUMMARY • Aerospace is attractive and is expected to become a stronger component of the Timken portfolio • Top-line growth expectations are moderate despite defense market • Margin improvement will be a focus 53
Slide 54: Process Industries
Process Industries Chris Coughlin, Group President
Slide 55: Key Messages
KEY MESSAGES • Process Industries is a large, high-margin global business with a strong track record and exciting potential ‒ The right markets: Excellent growth characteristics with vast market expansion potential; highly fragmented ‒ The right products: Differentiated, high value-added with signif
Slide 56: Process Industries Overview
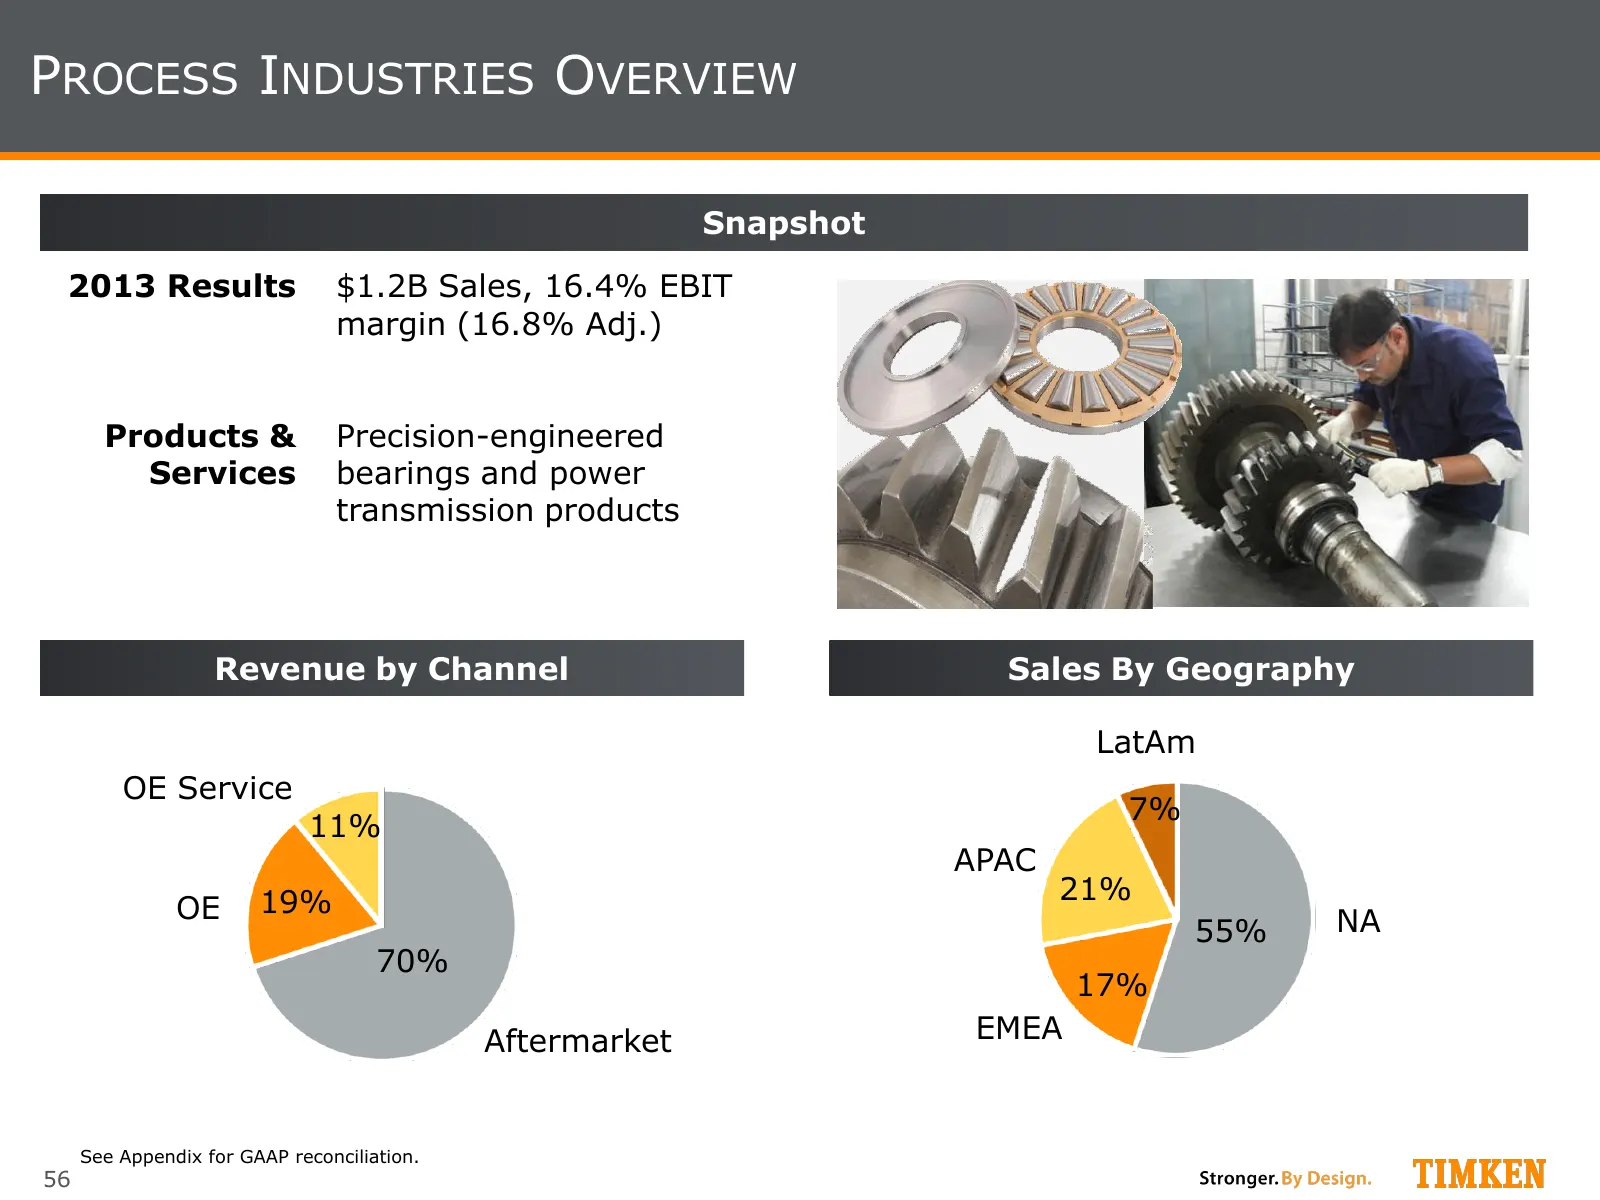
PROCESS INDUSTRIES OVERVIEW Snapshot 2013 Results $1.2B Sales, 16.4% EBIT margin (16.8% Adj.) Products & Precision-engineered Services bearings and power transmission products Revenue by Channel Sales By Geography LatAm OE Service 7% 11% APAC 19% 21% OE NA 55% 70% 17% Aftermarket EMEA See Appendix f
Slide 57: Diverse Markets Served
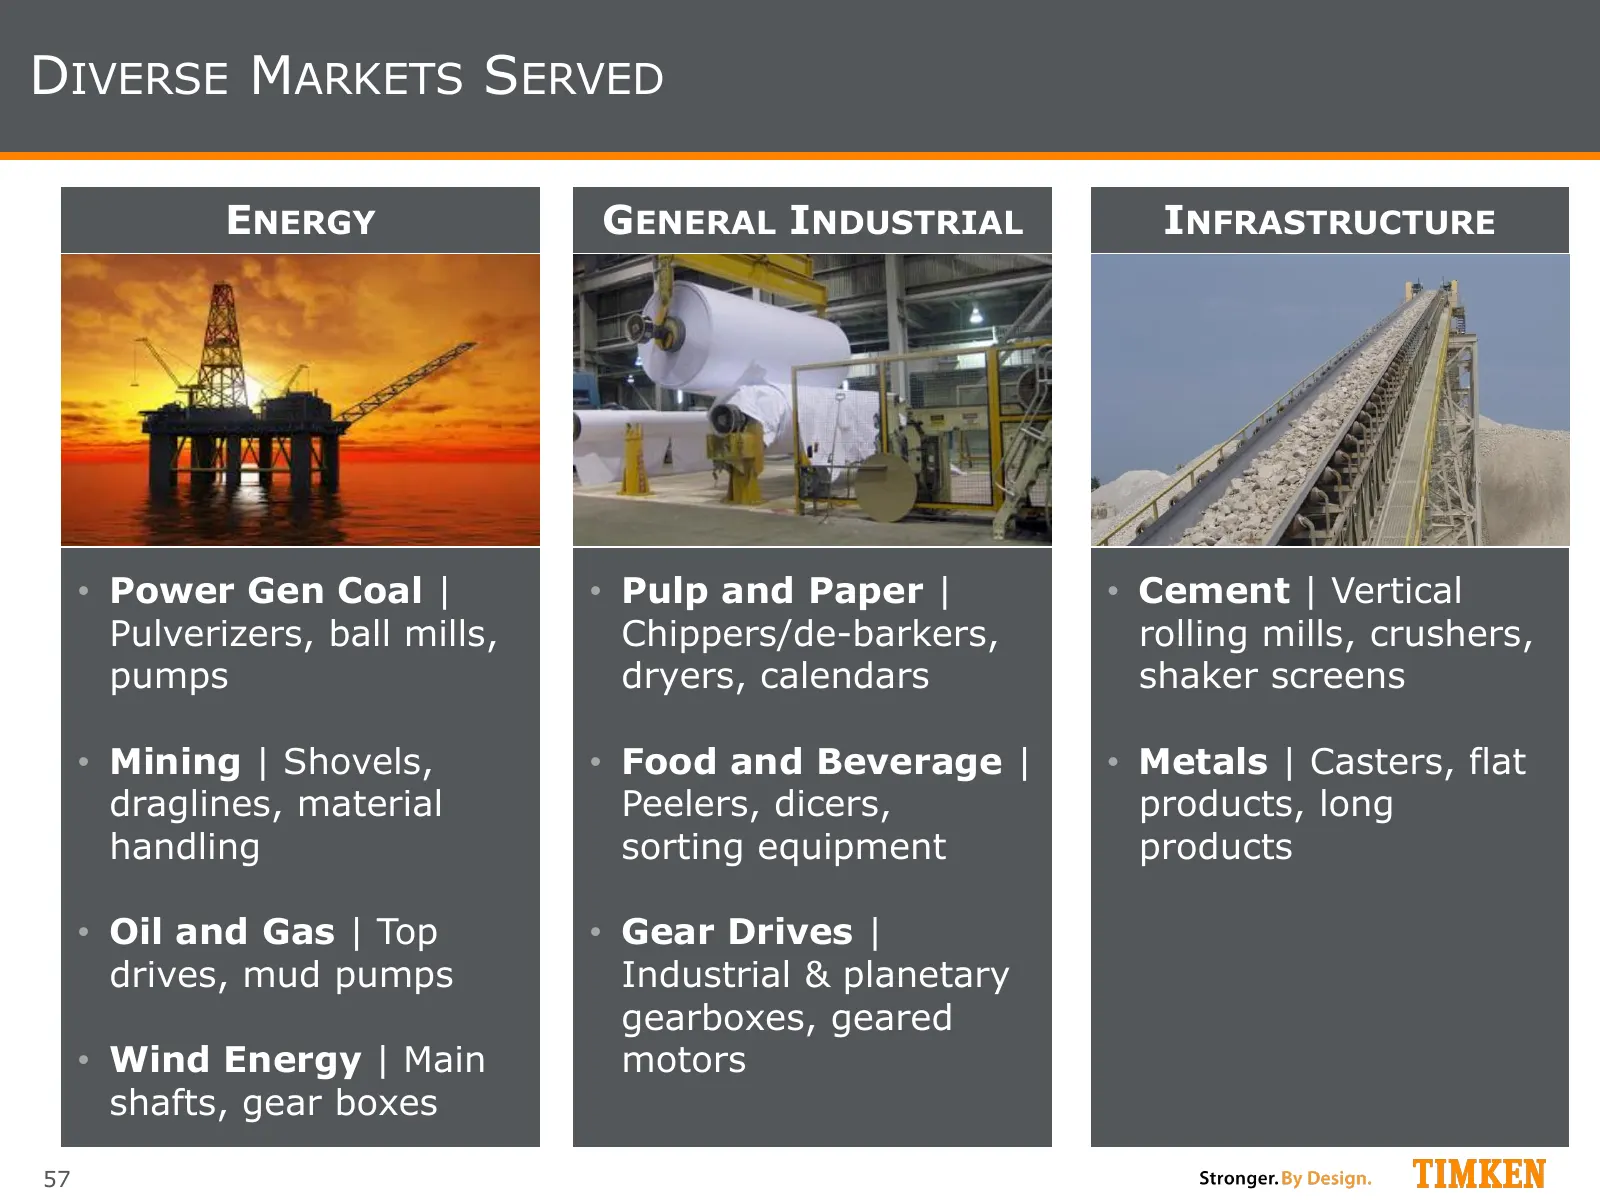
DIVERSE MARKETS SERVED ENERGY GENERAL INDUSTRIAL INFRASTRUCTURE • Power Gen Coal | • Pulp and Paper | • Cement | Vertical Pulverizers, ball mills, Chippers/de-barkers, rolling mills, crushers, pumps dryers, calendars shaker screens • Mining | Shovels, • Food and Beverage | • Metals | Casters, flat d
Slide 58: Process Industries Operating Model
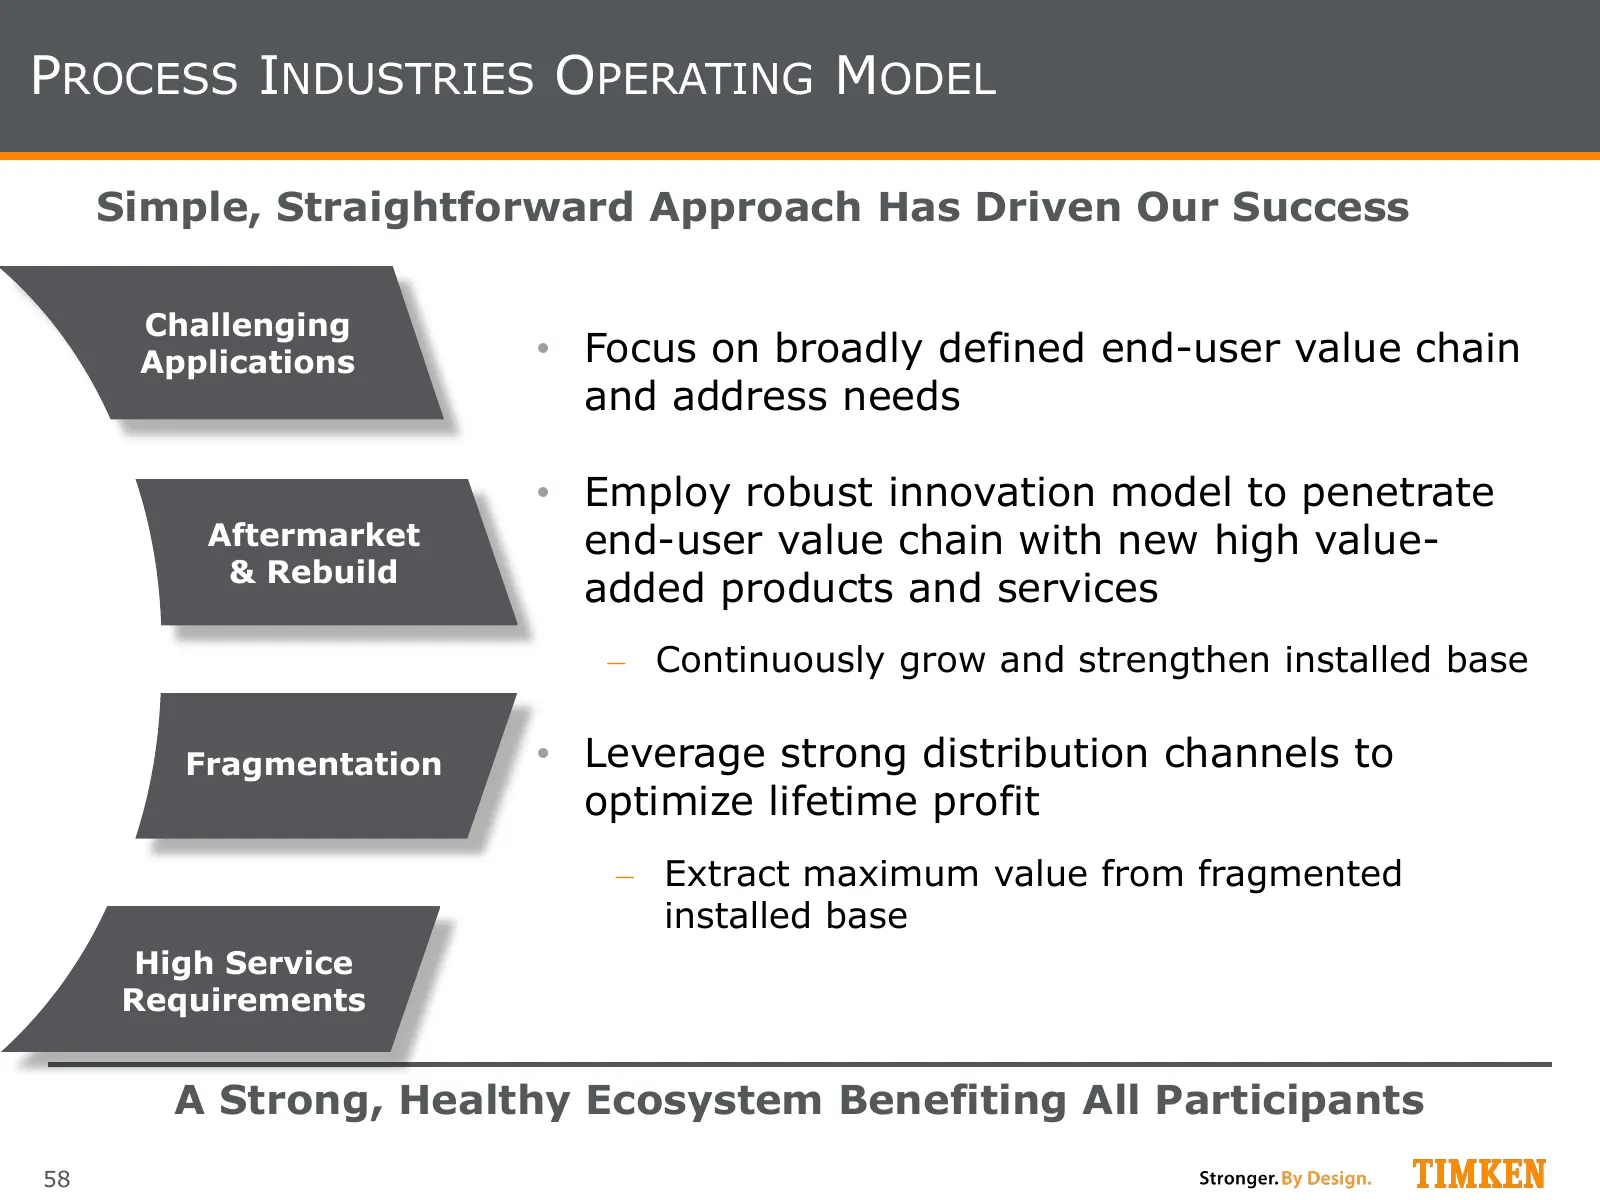
PROCESS INDUSTRIES OPERATING MODEL Simple, Straightforward Approach Has Driven Our Success Challenging Applications • Focus on broadly defined end-user value chain and address needs • Employ robust innovation model to penetrate Aftermarket end-user value chain with new high value- & Rebuild added pr
Slide 59: Timken Go-to-Market Model
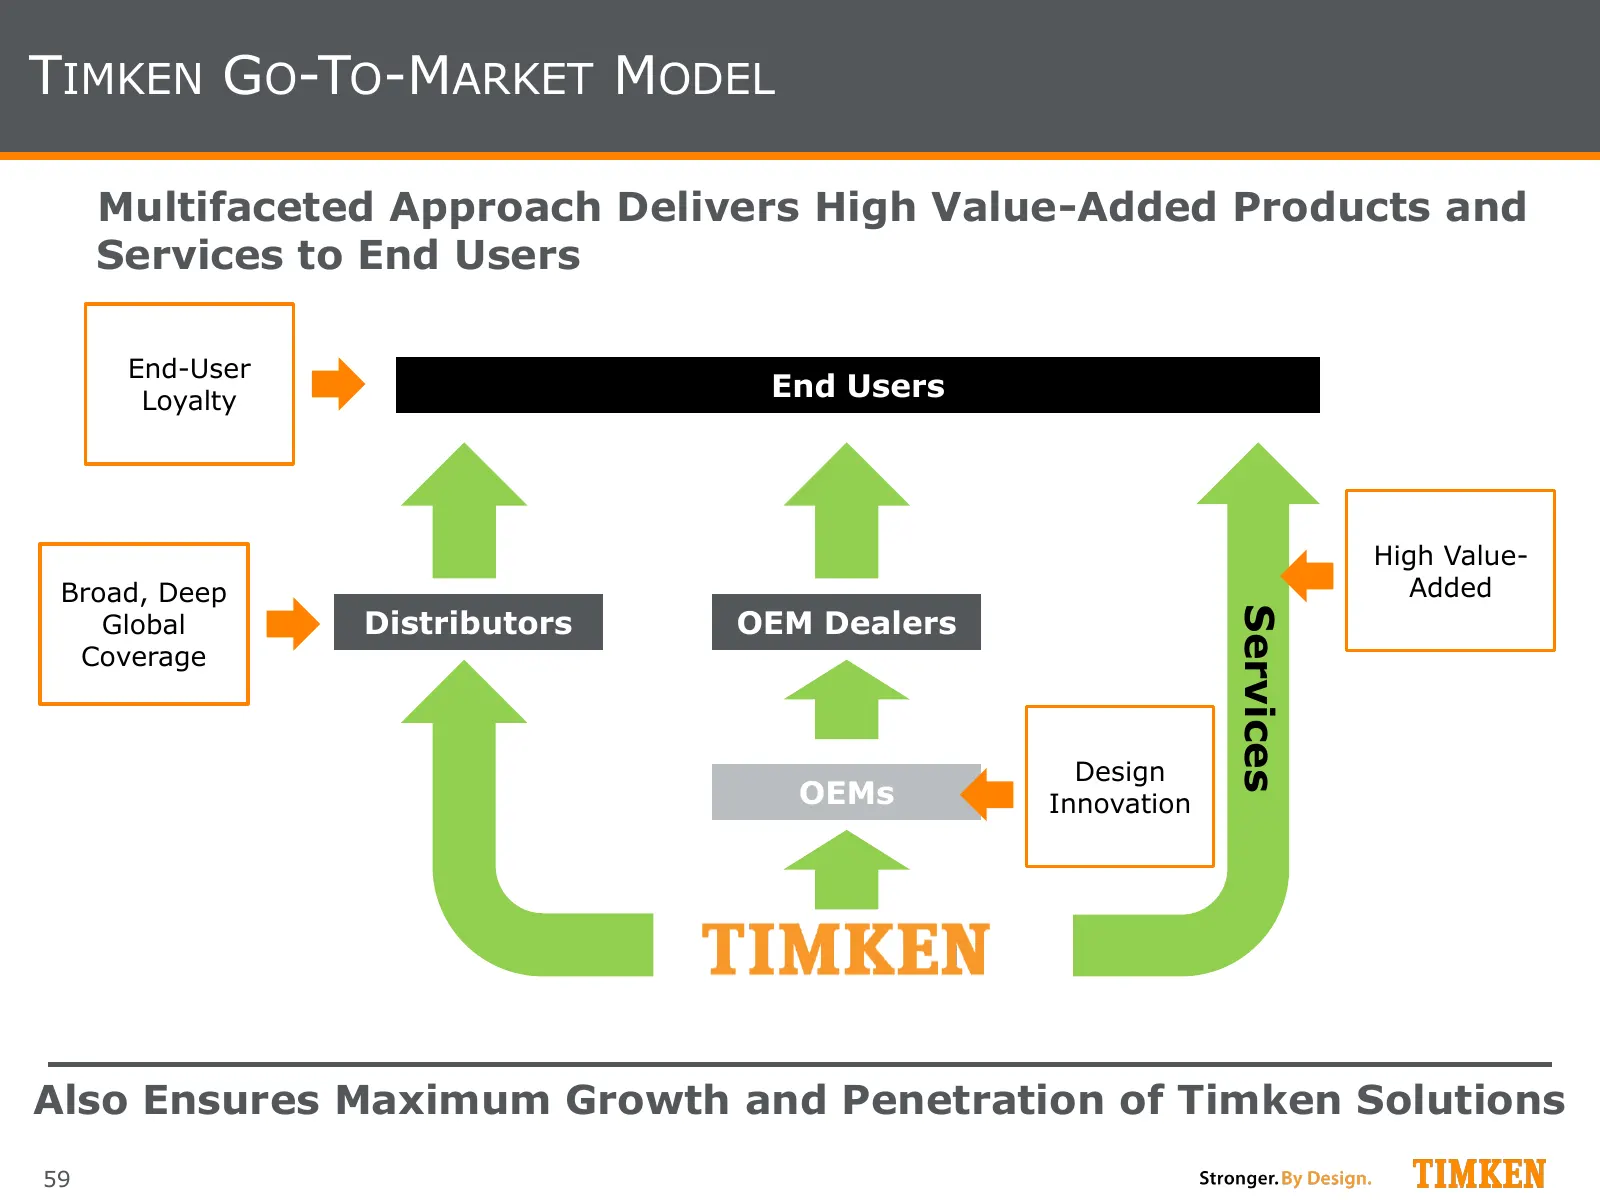
TIMKEN GO-TO-MARKET MODEL Multifaceted Approach Delivers High Value-Added Products and Services to End Users End-User Loyalty End Users High Value- Broad, Deep Added Distributors OEM Dealers Services Global Coverage Design OEMs Innovation Also Ensures Maximum Growth and Penetration of Timken Solutio
Slide 60: Product Innovation
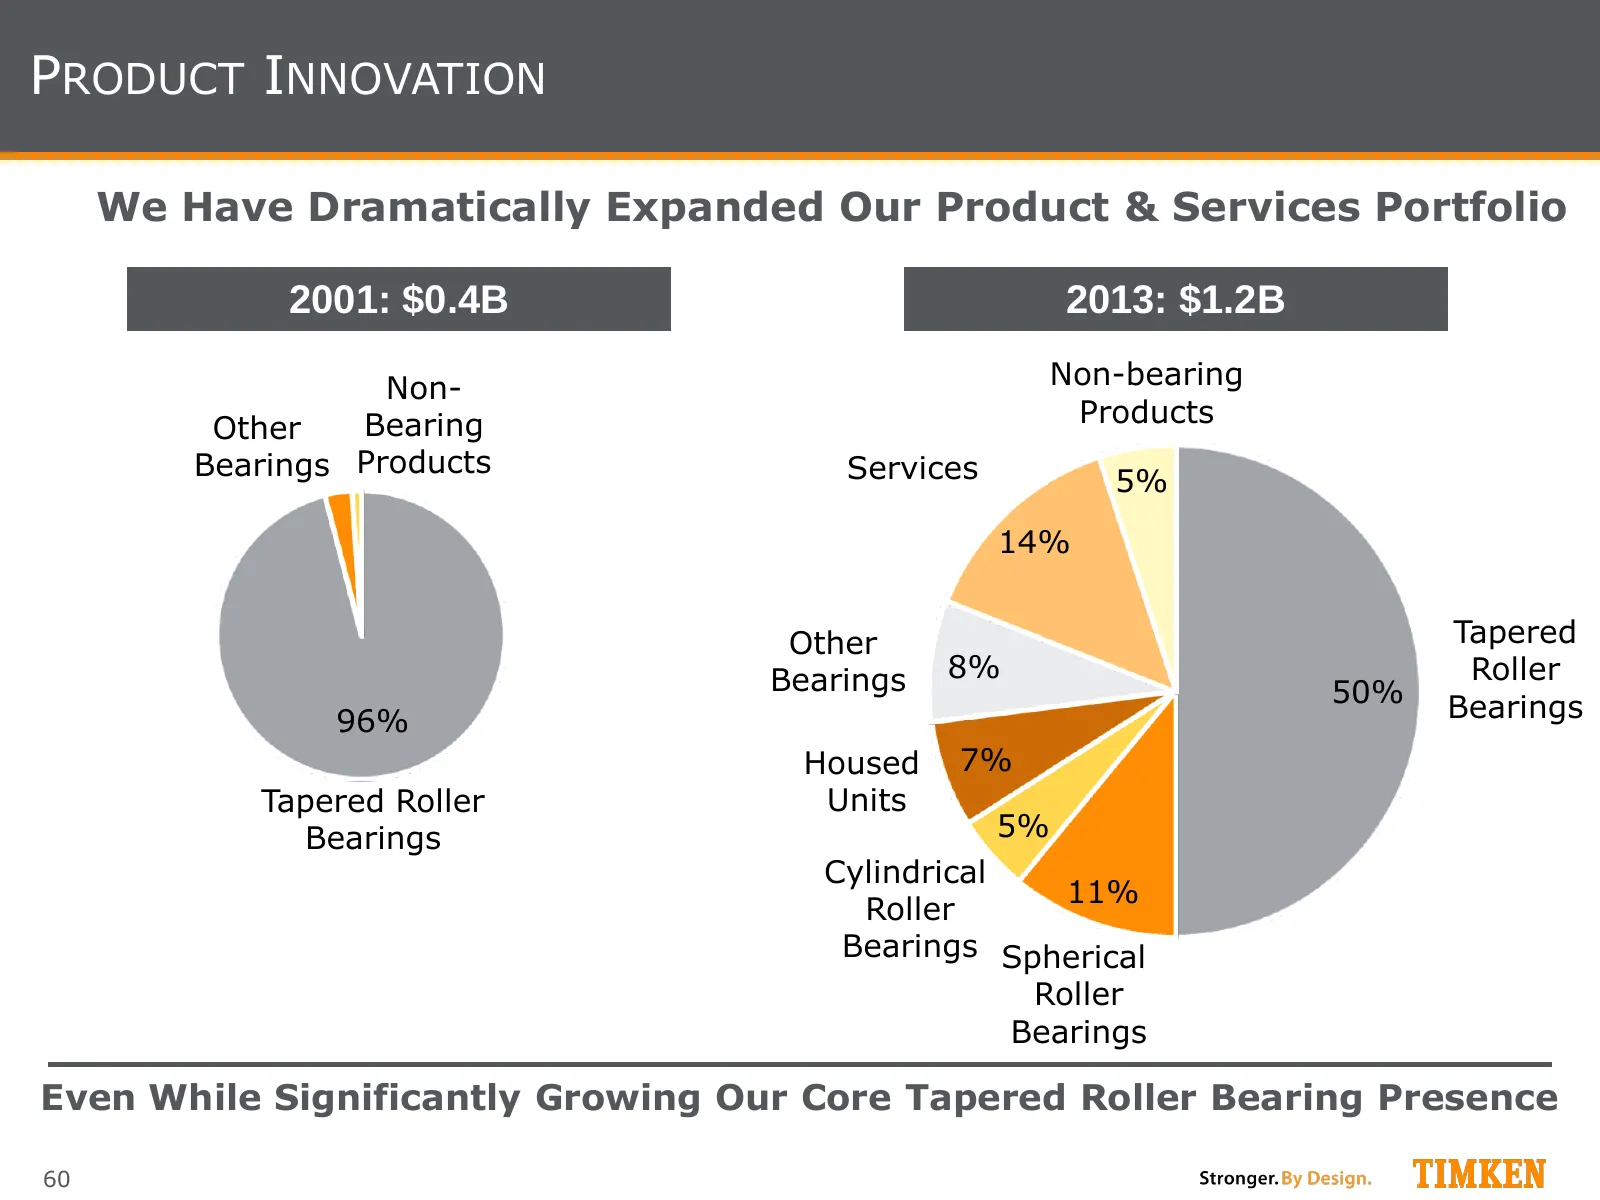
PRODUCT INNOVATION We Have Dramatically Expanded Our Product & Services Portfolio 2001: $0.4B 2013: $1.2B Non- Non-bearing Bearing Products Other Bearings Products Services 5% 14% Other Tapered Bearings 8% Roller 50% Bearings 96% Housed 7% Tapered Roller Units Bearings 5% Cylindrical 11% Roller Bear
Slide 61: Top-Line Revenue Is Growing
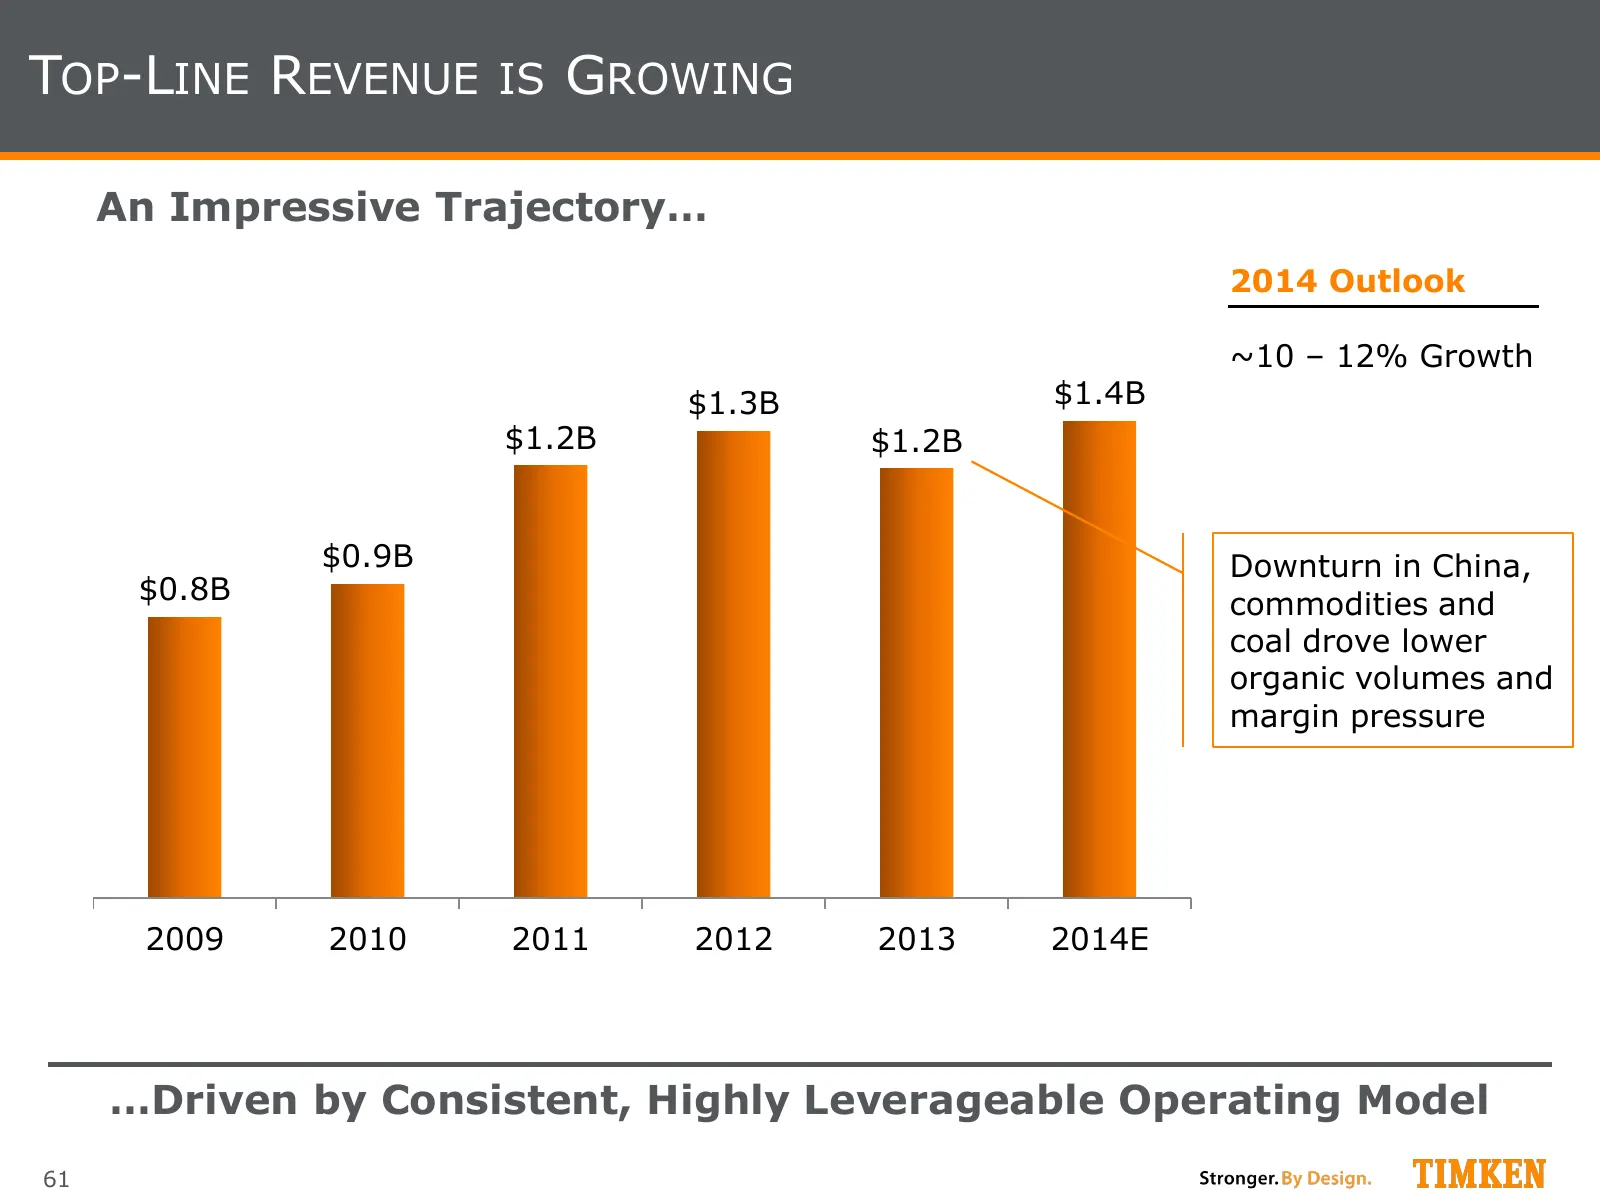
TOP-LINE REVENUE IS GROWING An Impressive Trajectory… 2014 Outlook ~10 – 12% Growth $1.3B $1.4B $1.2B $1.2B $0.9B Downturn in China, $0.8B commodities and coal drove lower organic volumes and margin pressure 2009 2010 2011 2012 2013 2014E …Driven by Consistent, Highly Leverageable Operating Model 61
Slide 62: Bearings Market
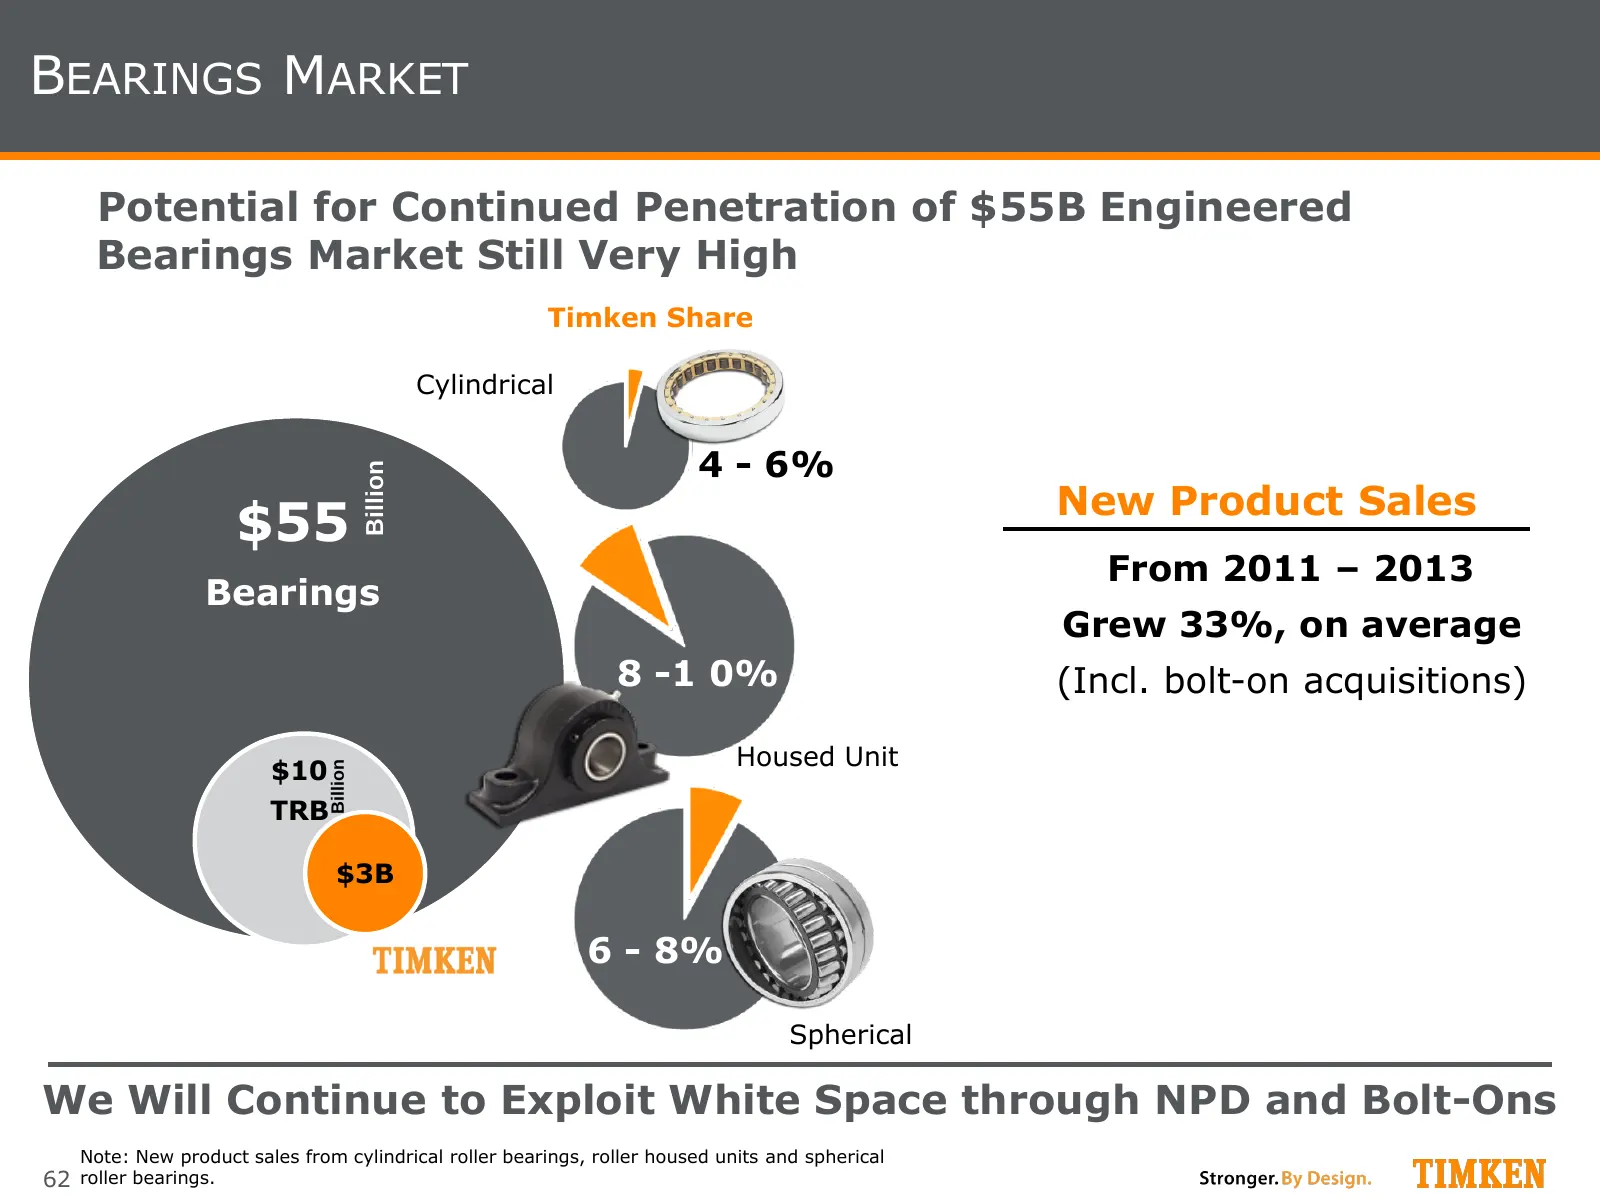
BEARINGS MARKET Potential for Continued Penetration of $55B Engineered Bearings Market Still Very High Timken Share Cylindrical 4 - 6% Billion Billion New Product Sales $55 $55 From 2011 – 2013 Bearings Bearings Grew 33%, on average 8 -1 0% (Incl. bolt-on acquisitions) $10 Housed Unit Billion TRB $3
Slide 63: Market Expansion
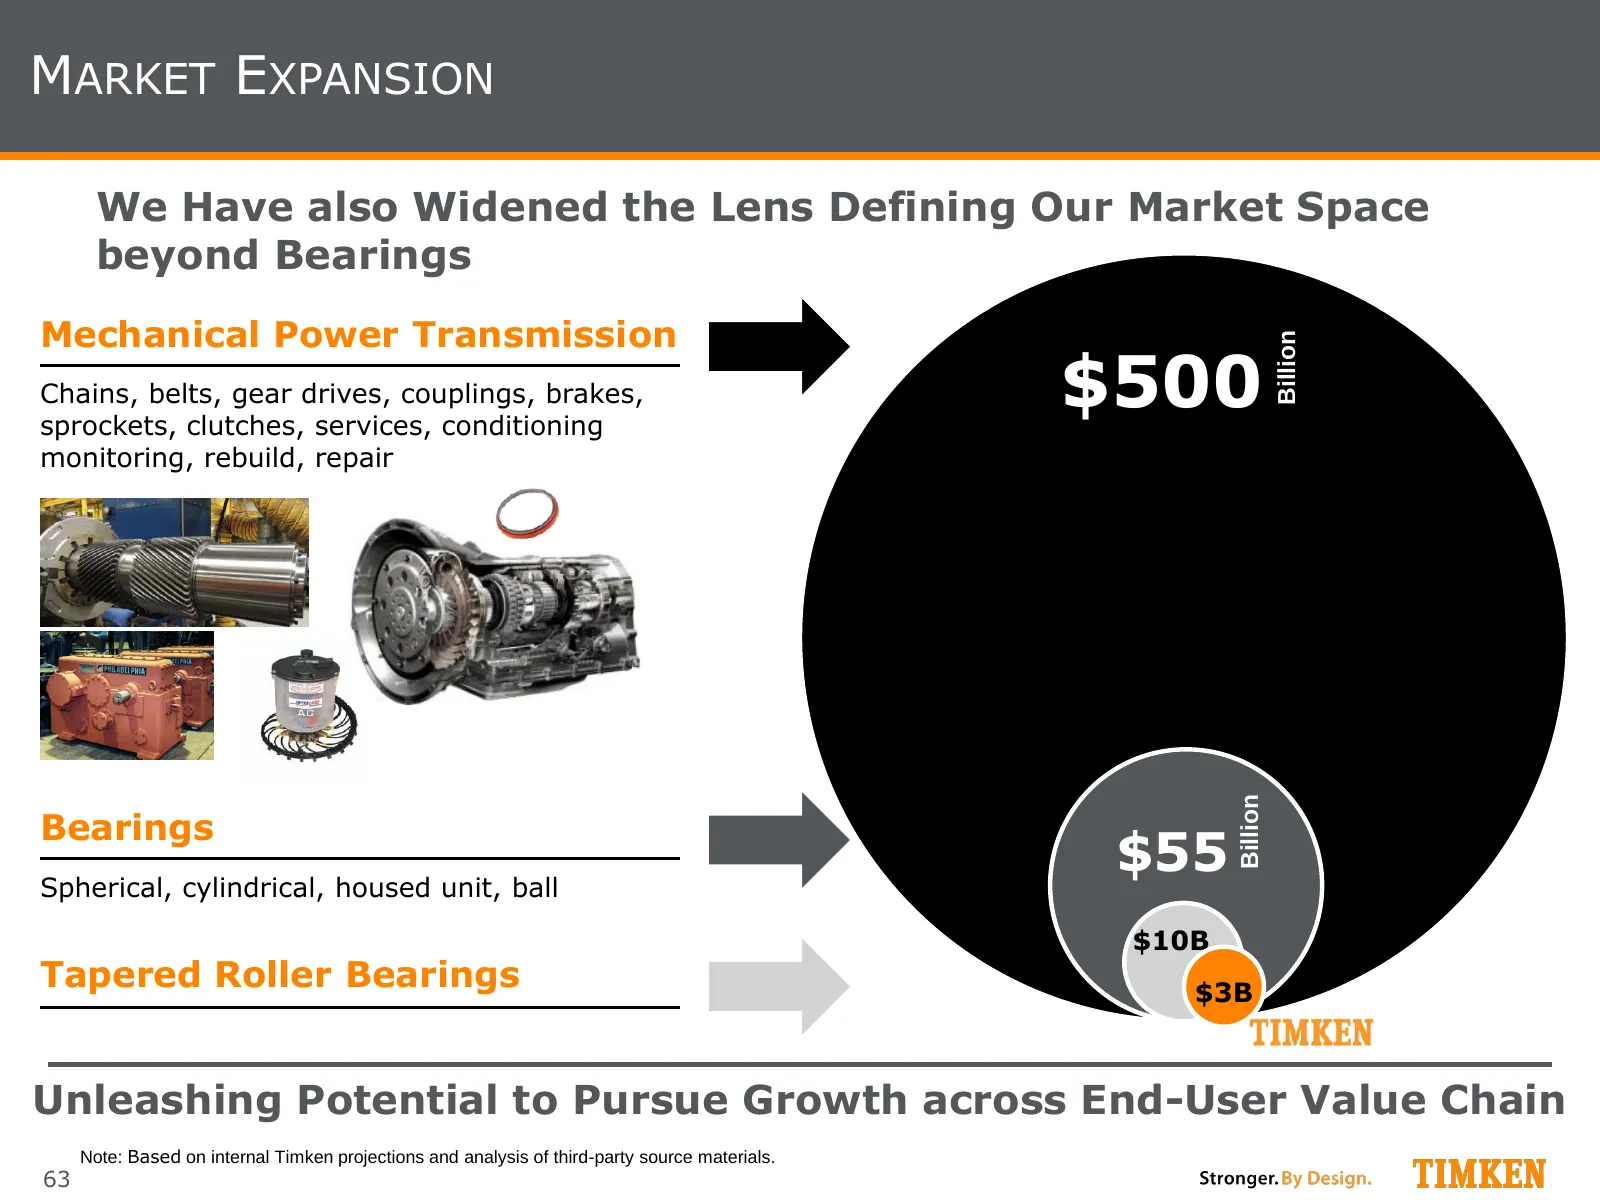
MARKET EXPANSION We Have also Widened the Lens Defining Our Market Space beyond Bearings Mechanical Power Transmission Billion Chains, belts, gear drives, couplings, brakes, sprockets, clutches, services, conditioning $500 monitoring, rebuild, repair Billion Bearings Spherical, cylindrical, housed u
Slide 64: Strategy - A Look Forward
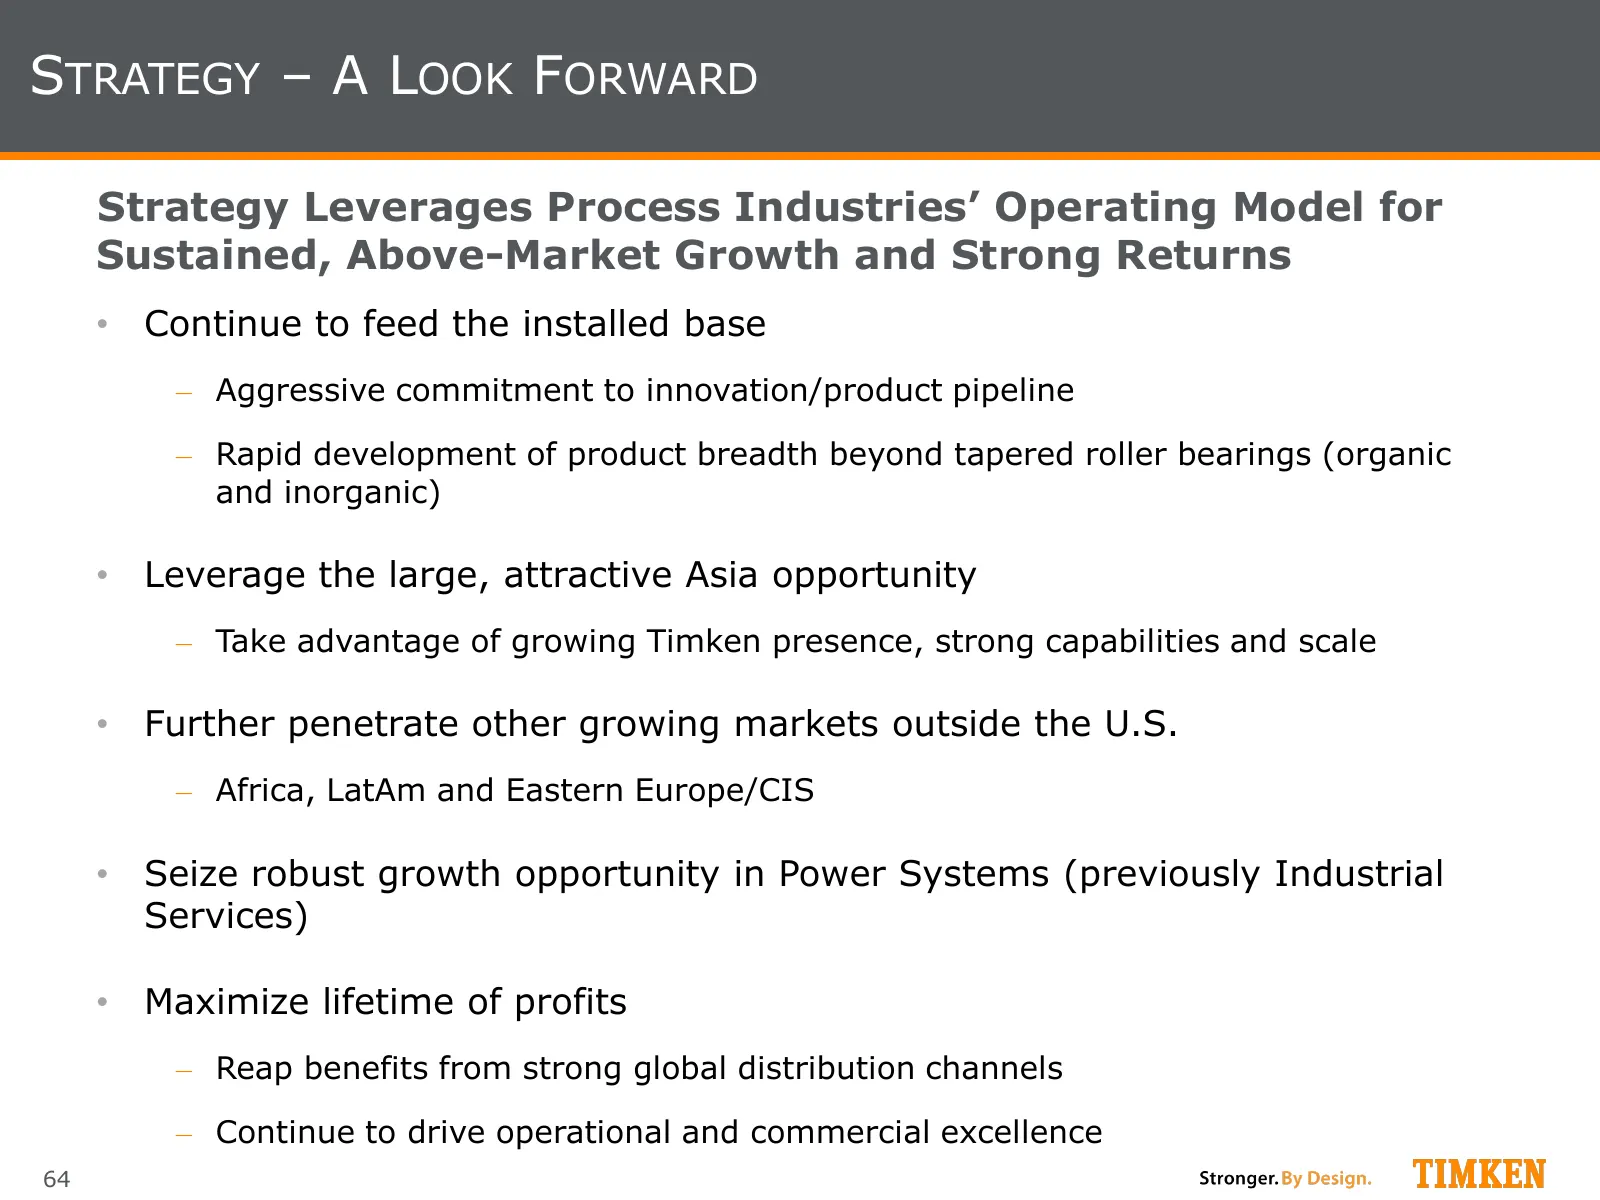
STRATEGY – A LOOK FORWARD Strategy Leverages Process Industries’ Operating Model for Sustained, Above-Market Growth and Strong Returns • Continue to feed the installed base ‒ Aggressive commitment to innovation/product pipeline ‒ Rapid development of product breadth beyond tapered roller bearings (o
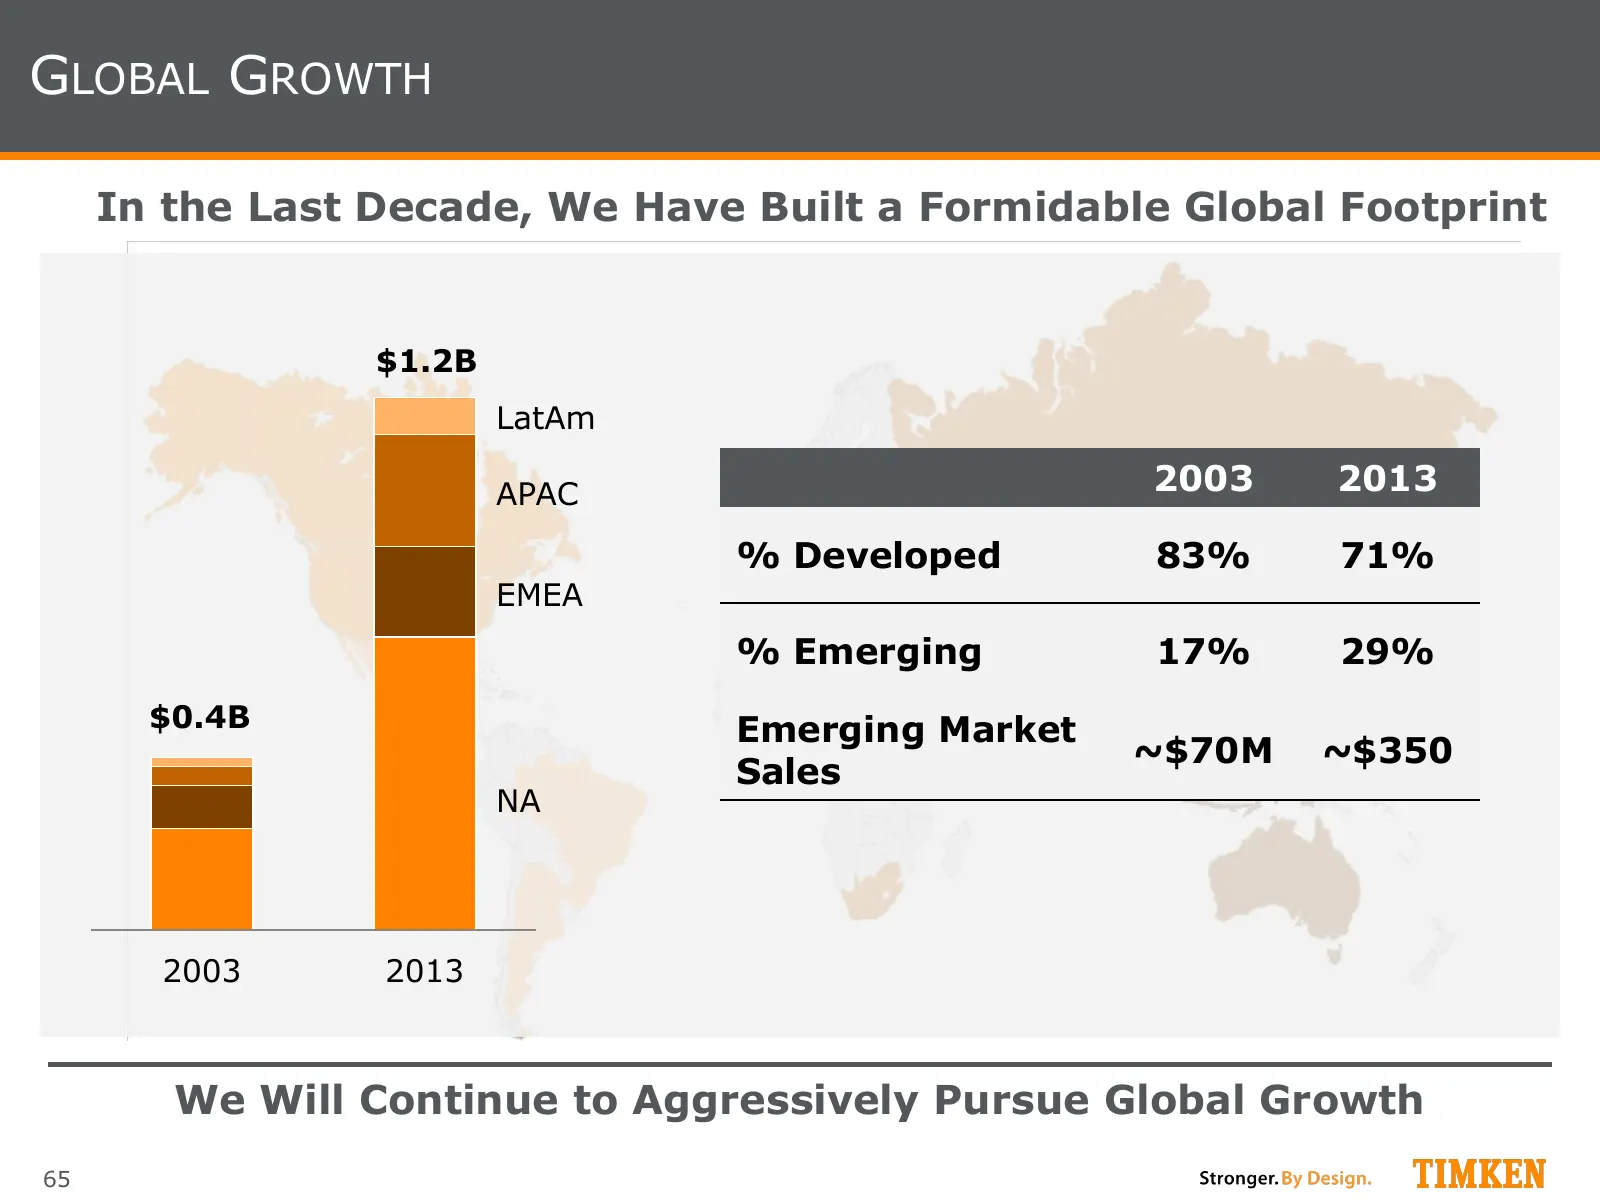
Slide 65: Global Growth
GLOBAL GROWTH In the Last Decade, We Have Built a Formidable Global Footprint $1.2B LatAm APAC 2003 2013 % Developed 83% 71% EMEA % Emerging 17% 29% $0.4B Emerging Market ~$70M ~$350 Sales NA 2003 2013 We Will Continue to Aggressively Pursue Global Growth 65
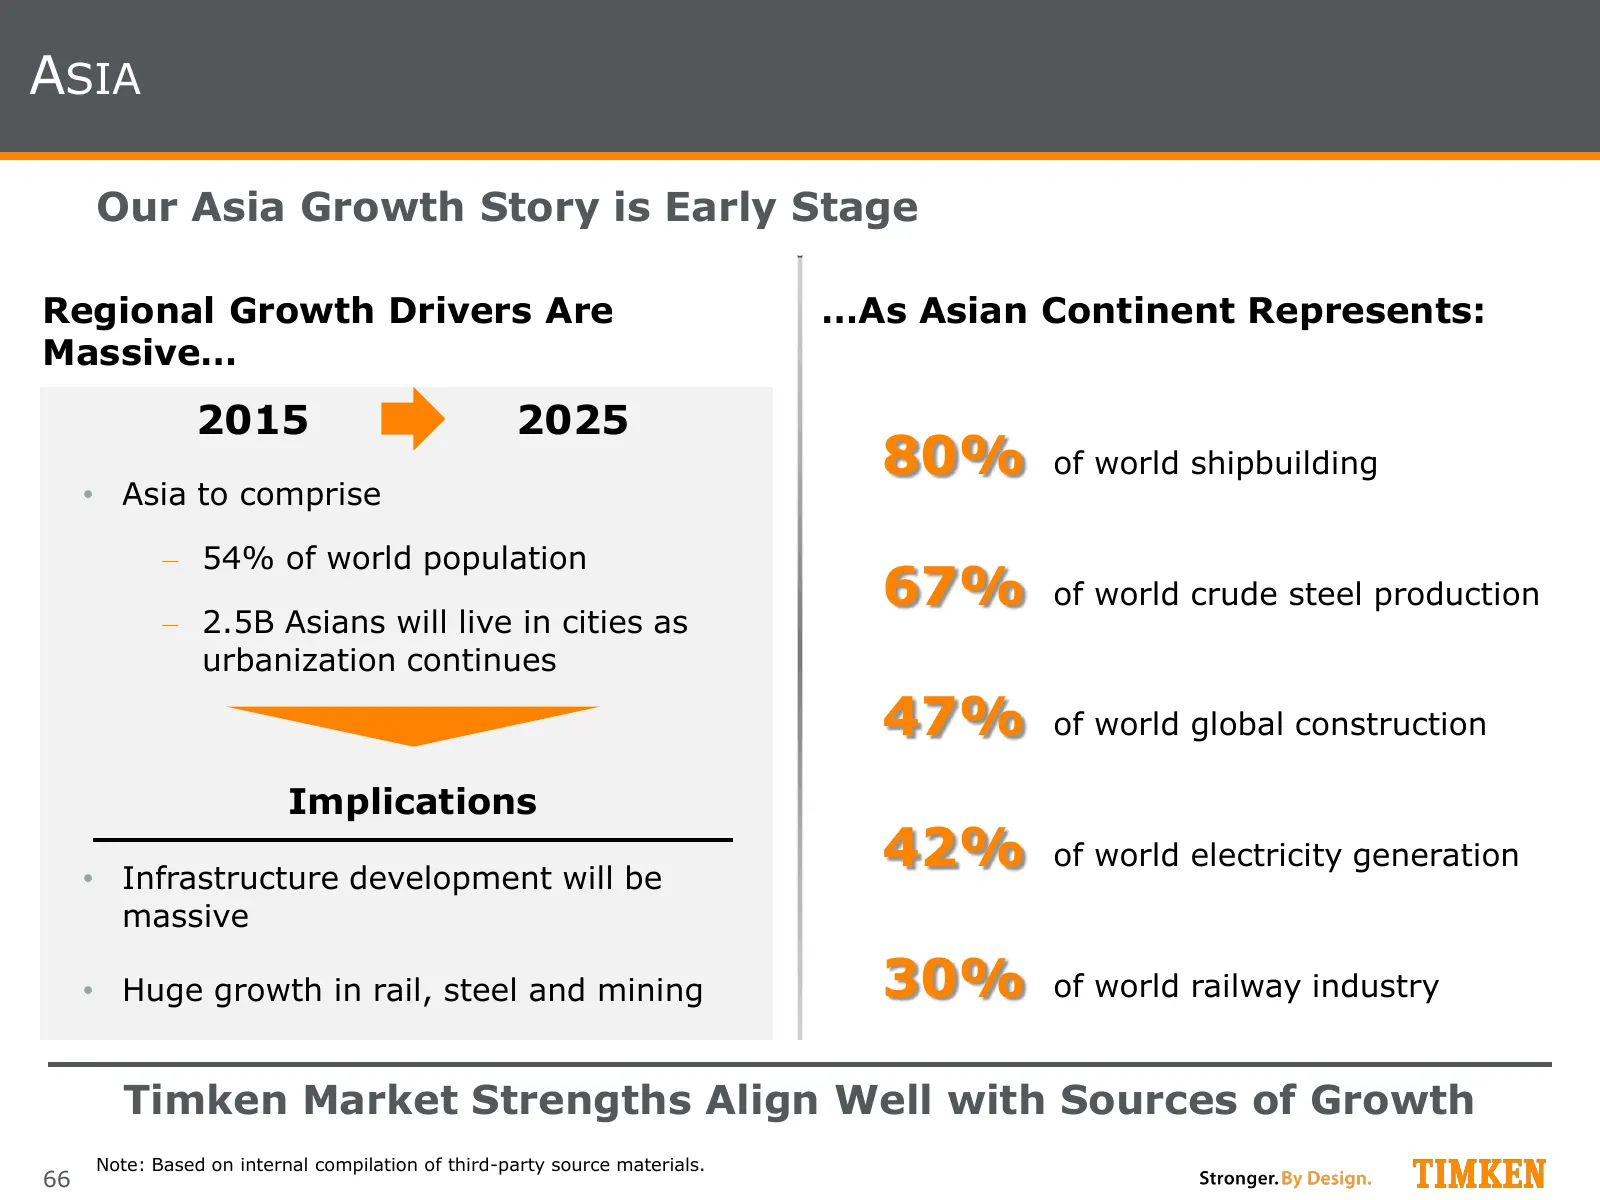
Slide 66: Asia
ASIA Our Asia Growth Story is Early Stage Regional Growth Drivers Are …As Asian Continent Represents: Massive… 2015 2025 80% of world shipbuilding • Asia to comprise ‒ 54% of world population 67% of world crude steel production ‒ 2.5B Asians will live in cities as urbanization continues 47% of world
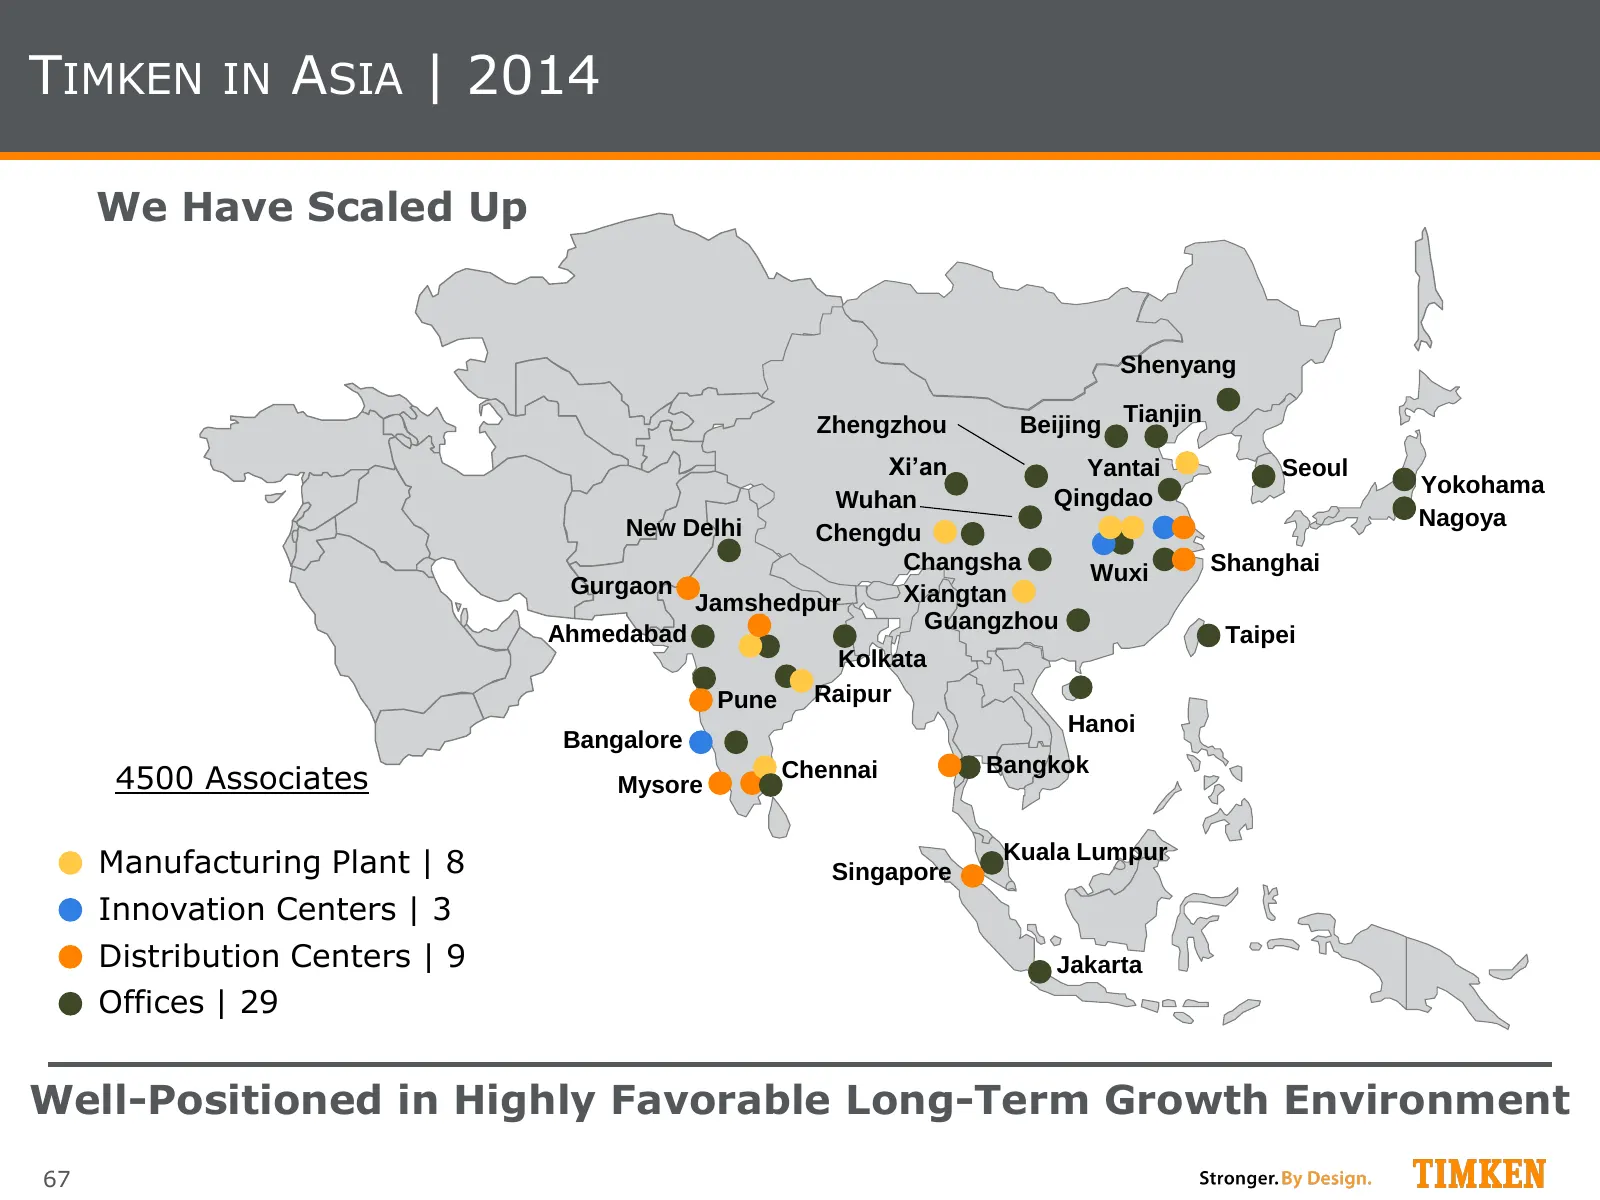
Slide 67: Timken in Asia | 2014
TIMKEN IN ASIA | 2014 We Have Scaled Up Shenyang Zhengzhou Beijing Tianjin Xi’an Yantai Seoul Yokohama Wuhan Qingdao New Delhi Nagoya Chengdu Changsha Wuxi Shanghai Gurgaon Xiangtan Jamshedpur Guangzhou Ahmedabad Taipei Kolkata Pune Raipur Hanoi Bangalore Bangkok 4500 Associates Mysore Chennai Manuf
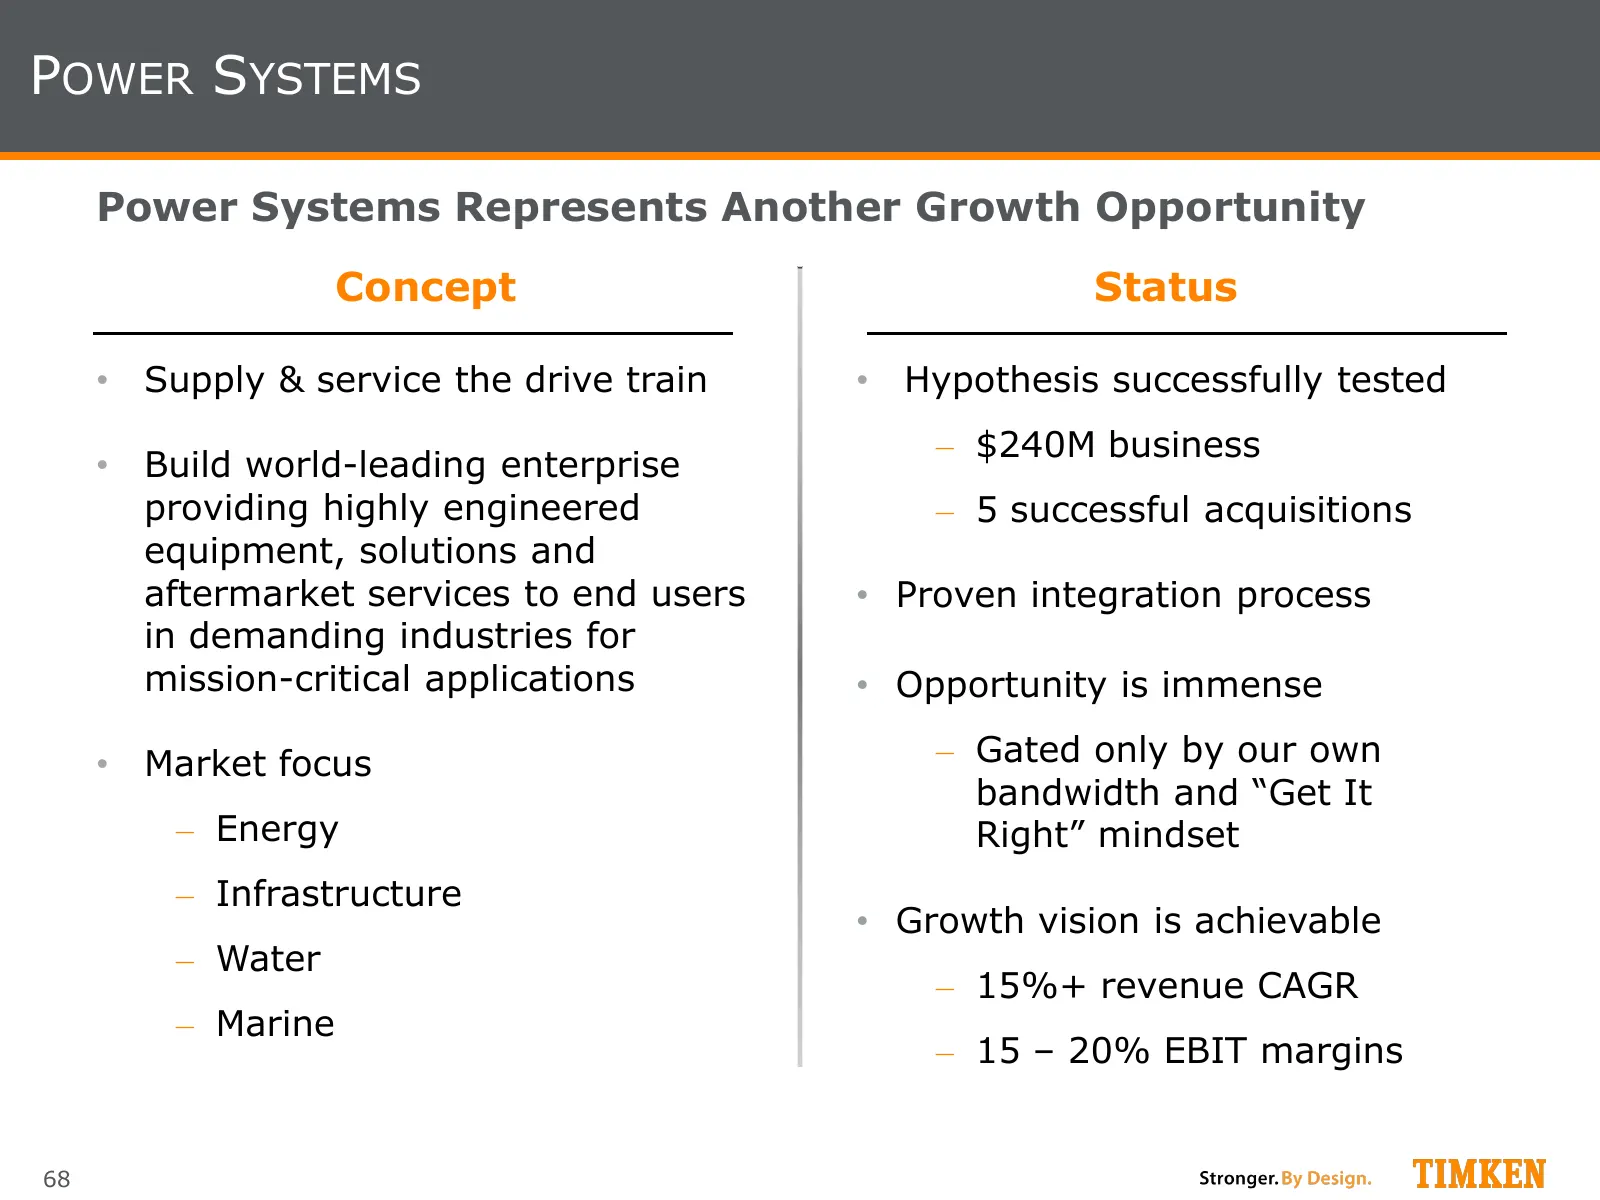
Slide 68: Power Systems
POWER SYSTEMS Power Systems Represents Another Growth Opportunity Concept Status • Supply & service the drive train • Hypothesis successfully tested ‒ $240M business • Build world-leading enterprise providing highly engineered ‒ 5 successful acquisitions equipment, solutions and aftermarket services
Slide 69: Process Industries Outlook
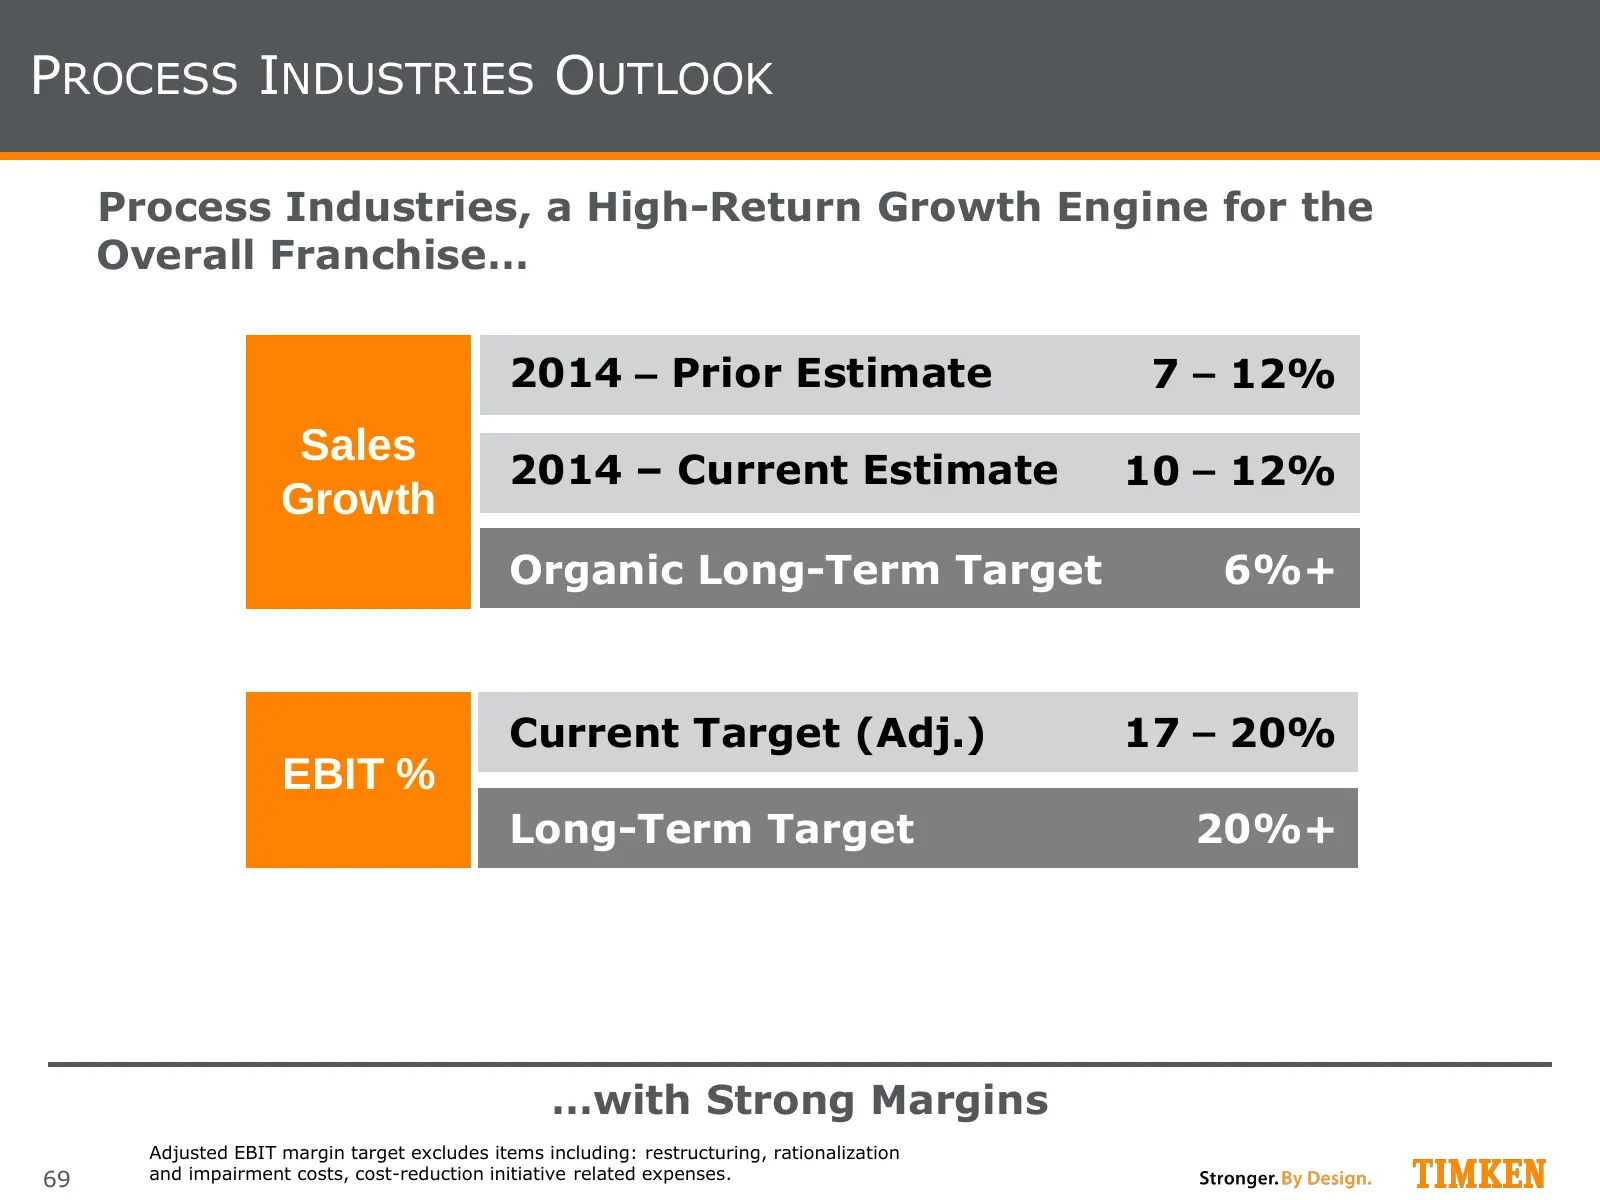
PROCESS INDUSTRIES OUTLOOK Process Industries, a High-Return Growth Engine for the Overall Franchise… 2014 – Prior Estimate 7 – 12% Sales 2014 – Current Estimate 10 – 12% Growth Organic Long-Term Target 6%+ Current Target (Adj.) 17 – 20% EBIT % Long-Term Target 20%+ …with Strong Margins Adjusted EBI
Slide 70: Summary
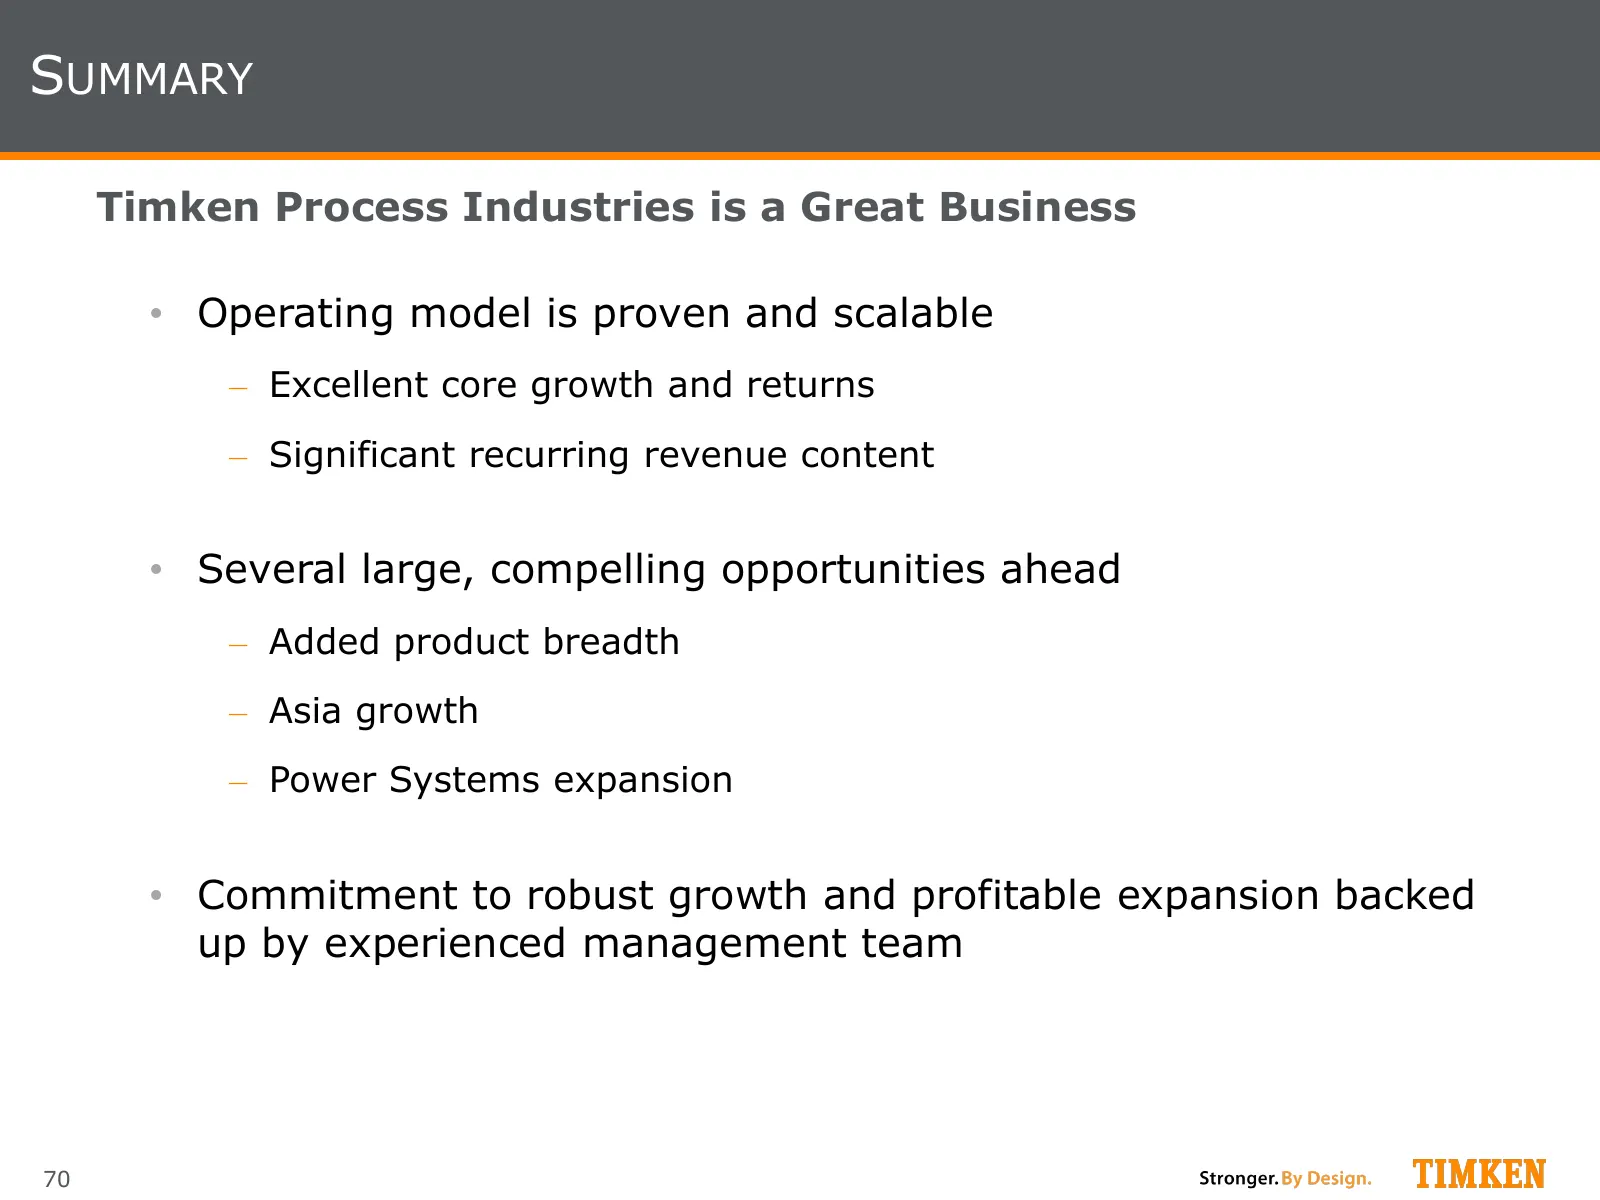
SUMMARY Timken Process Industries is a Great Business • Operating model is proven and scalable ‒ Excellent core growth and returns ‒ Significant recurring revenue content • Several large, compelling opportunities ahead ‒ Added product breadth ‒ Asia growth ‒ Power Systems expansion • Commitment to r
Slide 71: Growing Through Aftermarket Services
Growing Through Aftermarket Services Carl Rapp, Vice President | Power Systems
Slide 72: Power Systems
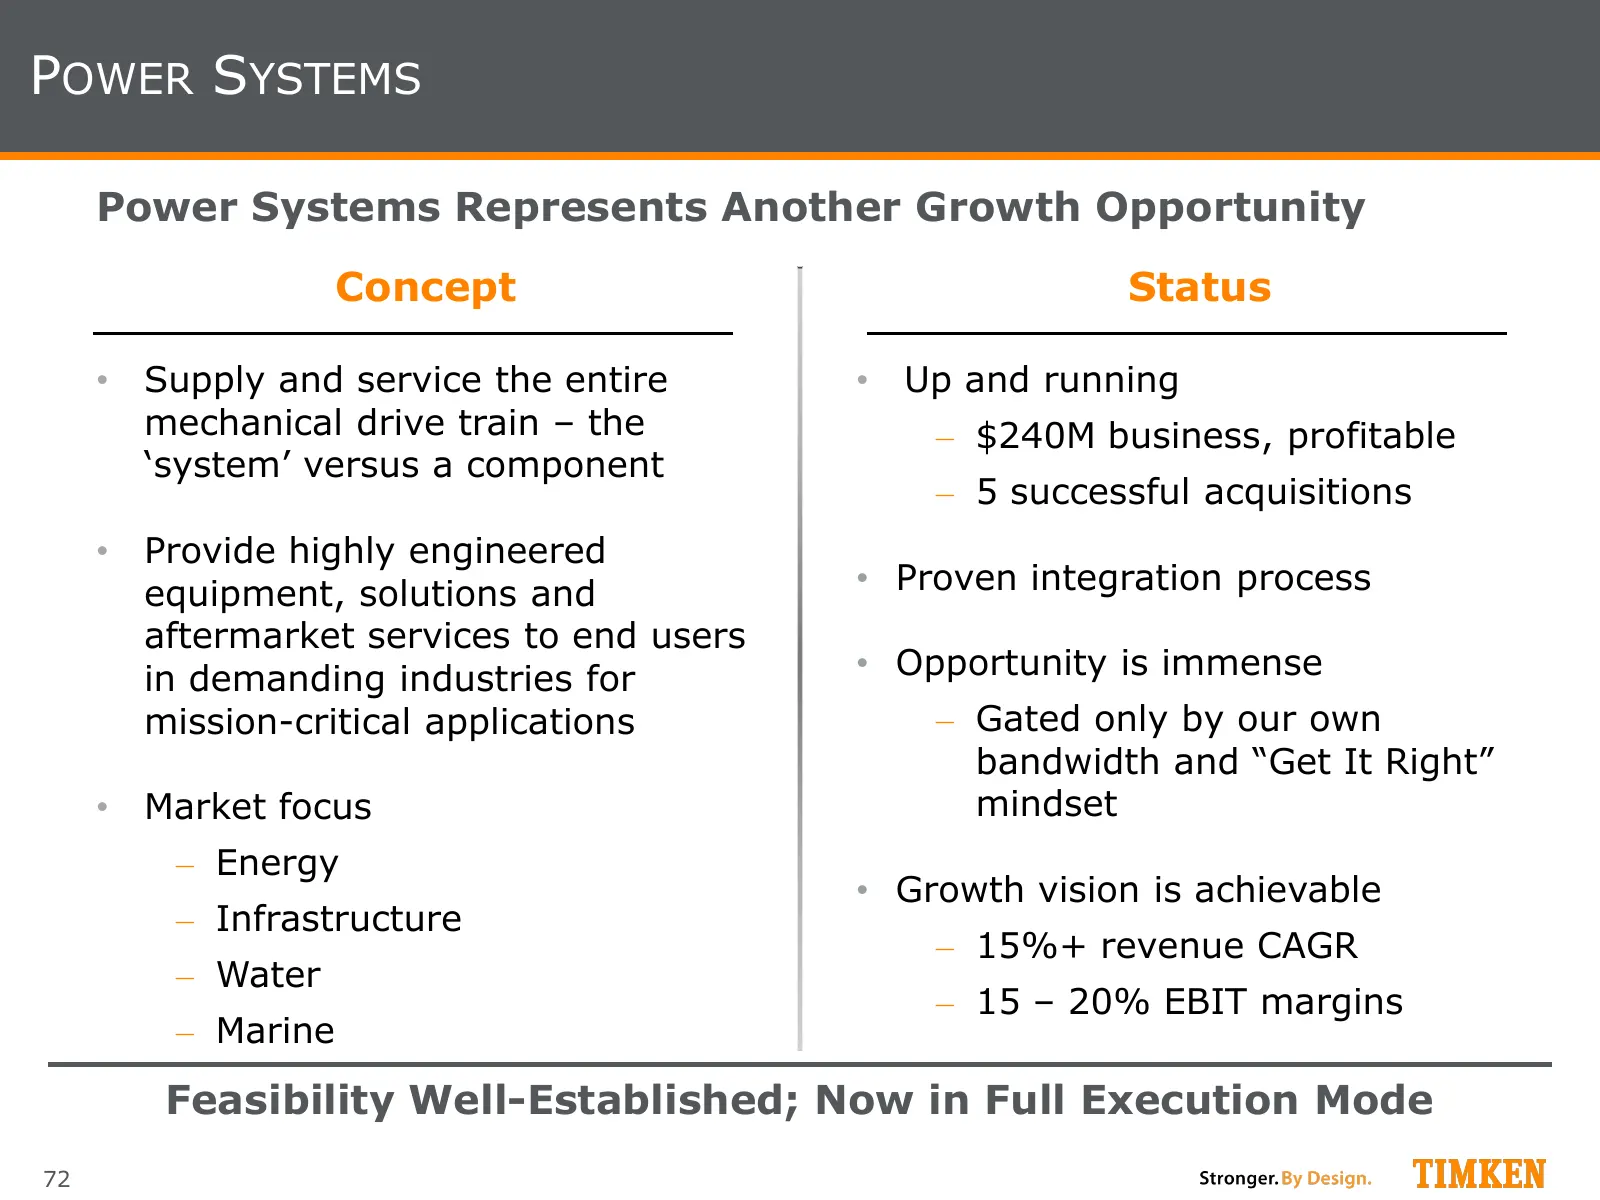
POWER SYSTEMS Power Systems Represents Another Growth Opportunity Concept Status • Supply and service the entire • Up and running mechanical drive train – the ‒ $240M business, profitable ‘system’ versus a component ‒ 5 successful acquisitions • Provide highly engineered equipment, solutions and • P
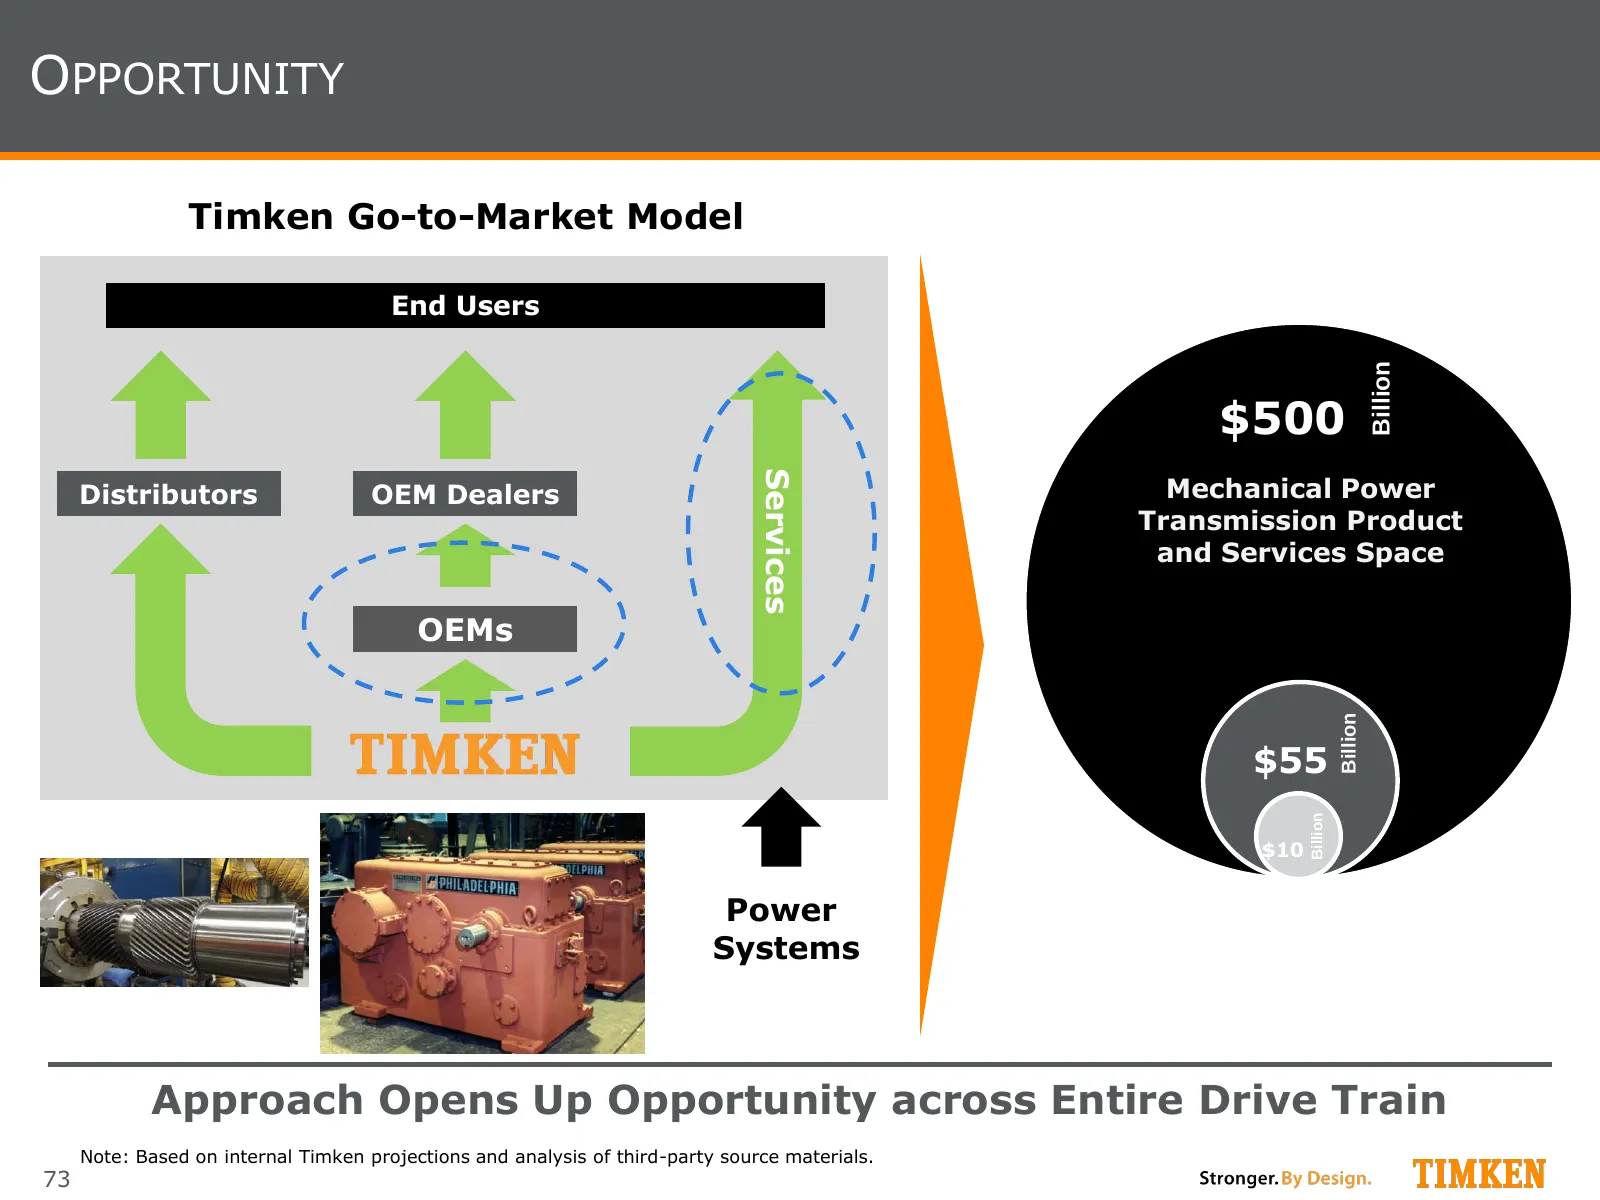
Slide 73: Opportunity: Timken Go-to-Market Model
OPPORTUNITY Timken Go-to-Market Model End Users Billion $500 Services Distributors OEM Dealers Mechanical Power Transmission Product and Services Space OEMs Billion $55 Billion $10 Power Systems Approach Opens Up Opportunity across Entire Drive Train Note: Based on internal Timken projections and an
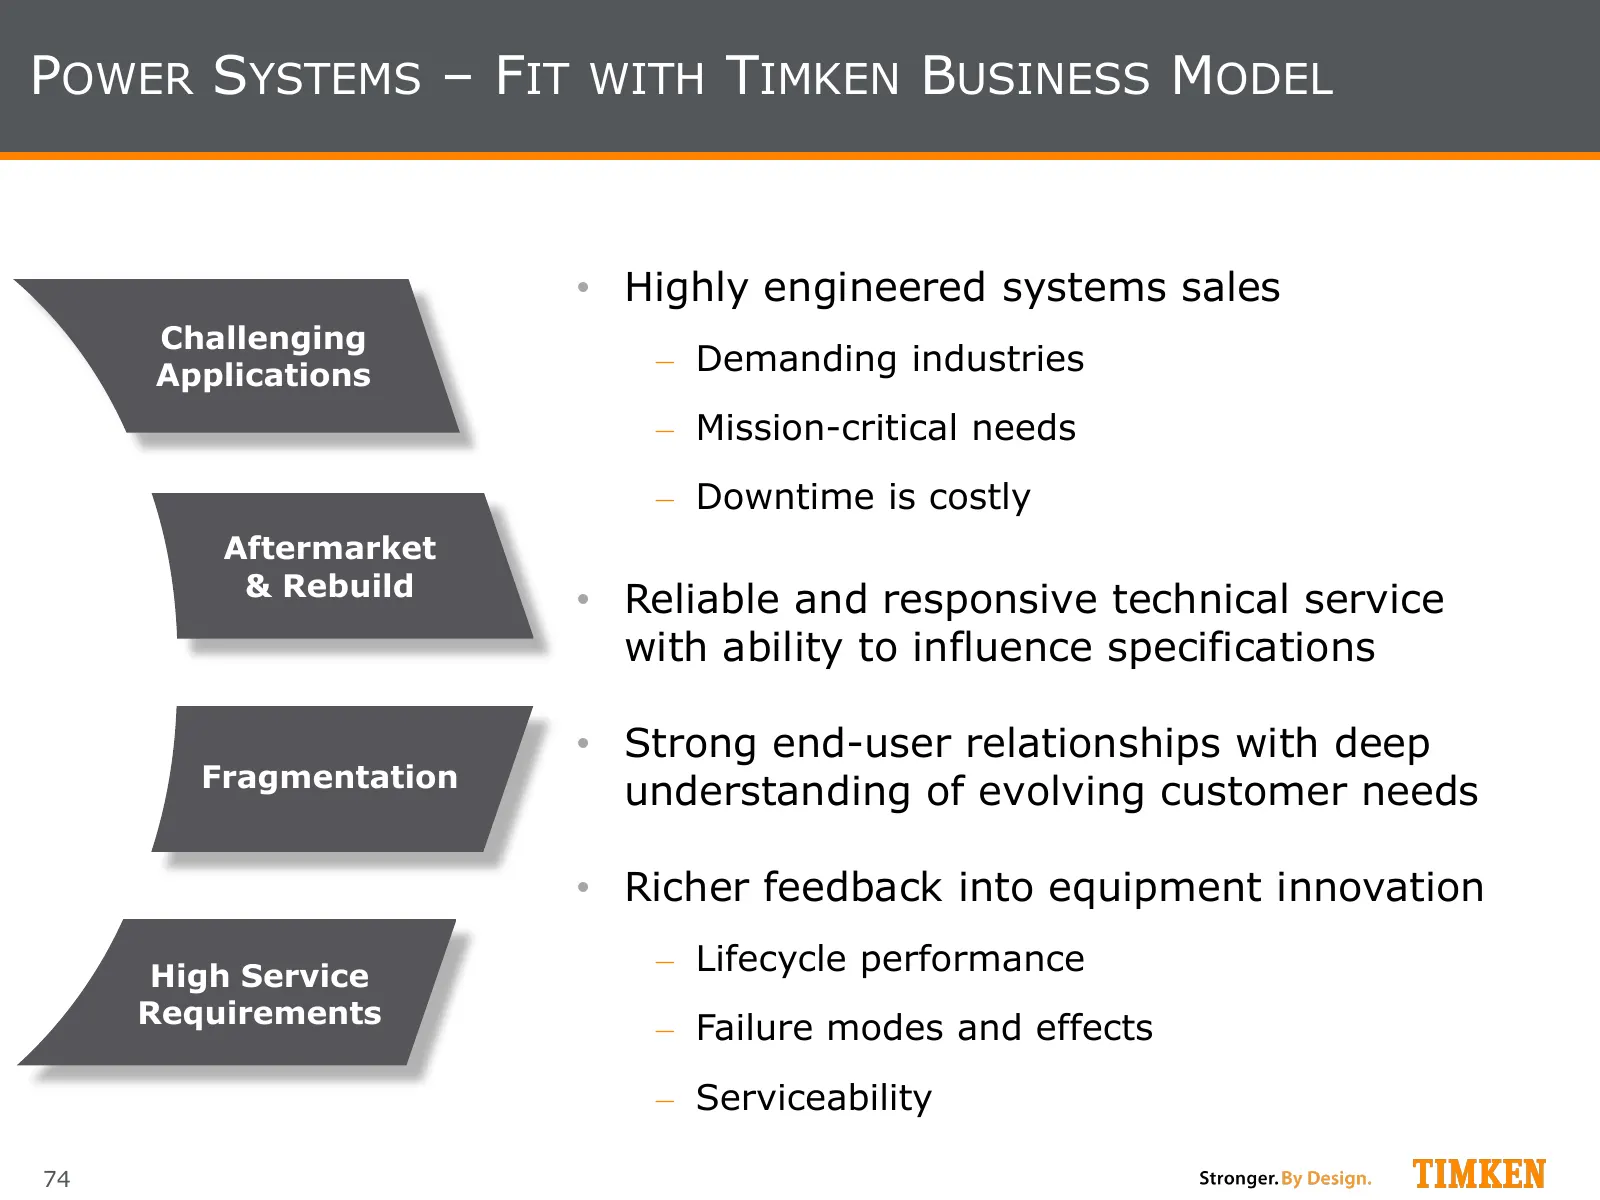
Slide 74: Power Systems - Fit with Timken Business Model
POWER SYSTEMS – FIT WITH TIMKEN BUSINESS MODEL • Highly engineered systems sales Challenging Applications ‒ Demanding industries ‒ Mission-critical needs ‒ Downtime is costly Aftermarket & Rebuild • Reliable and responsive technical service with ability to influence specifications • Strong end-user
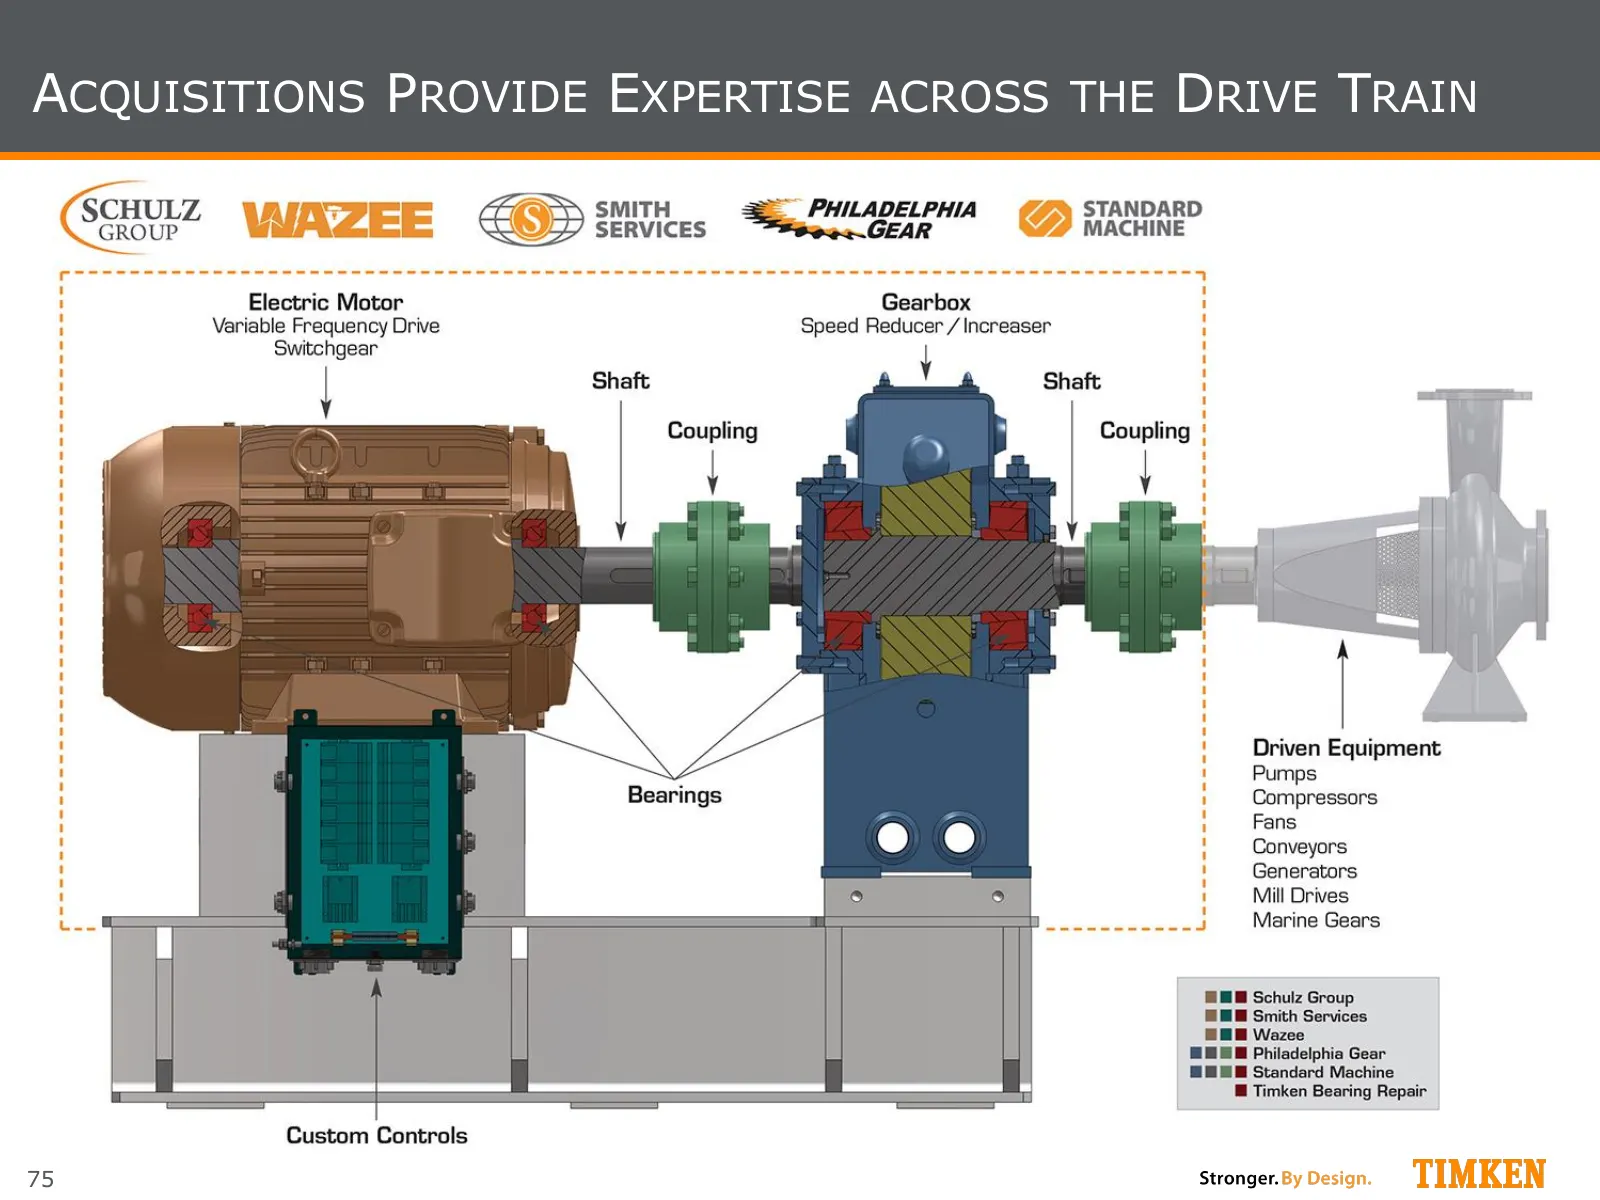
Slide 75: Acquisitions Provide Expertise Across the Drive Train
ACQUISITIONS PROVIDE EXPERTISE ACROSS THE DRIVE TRAIN 75
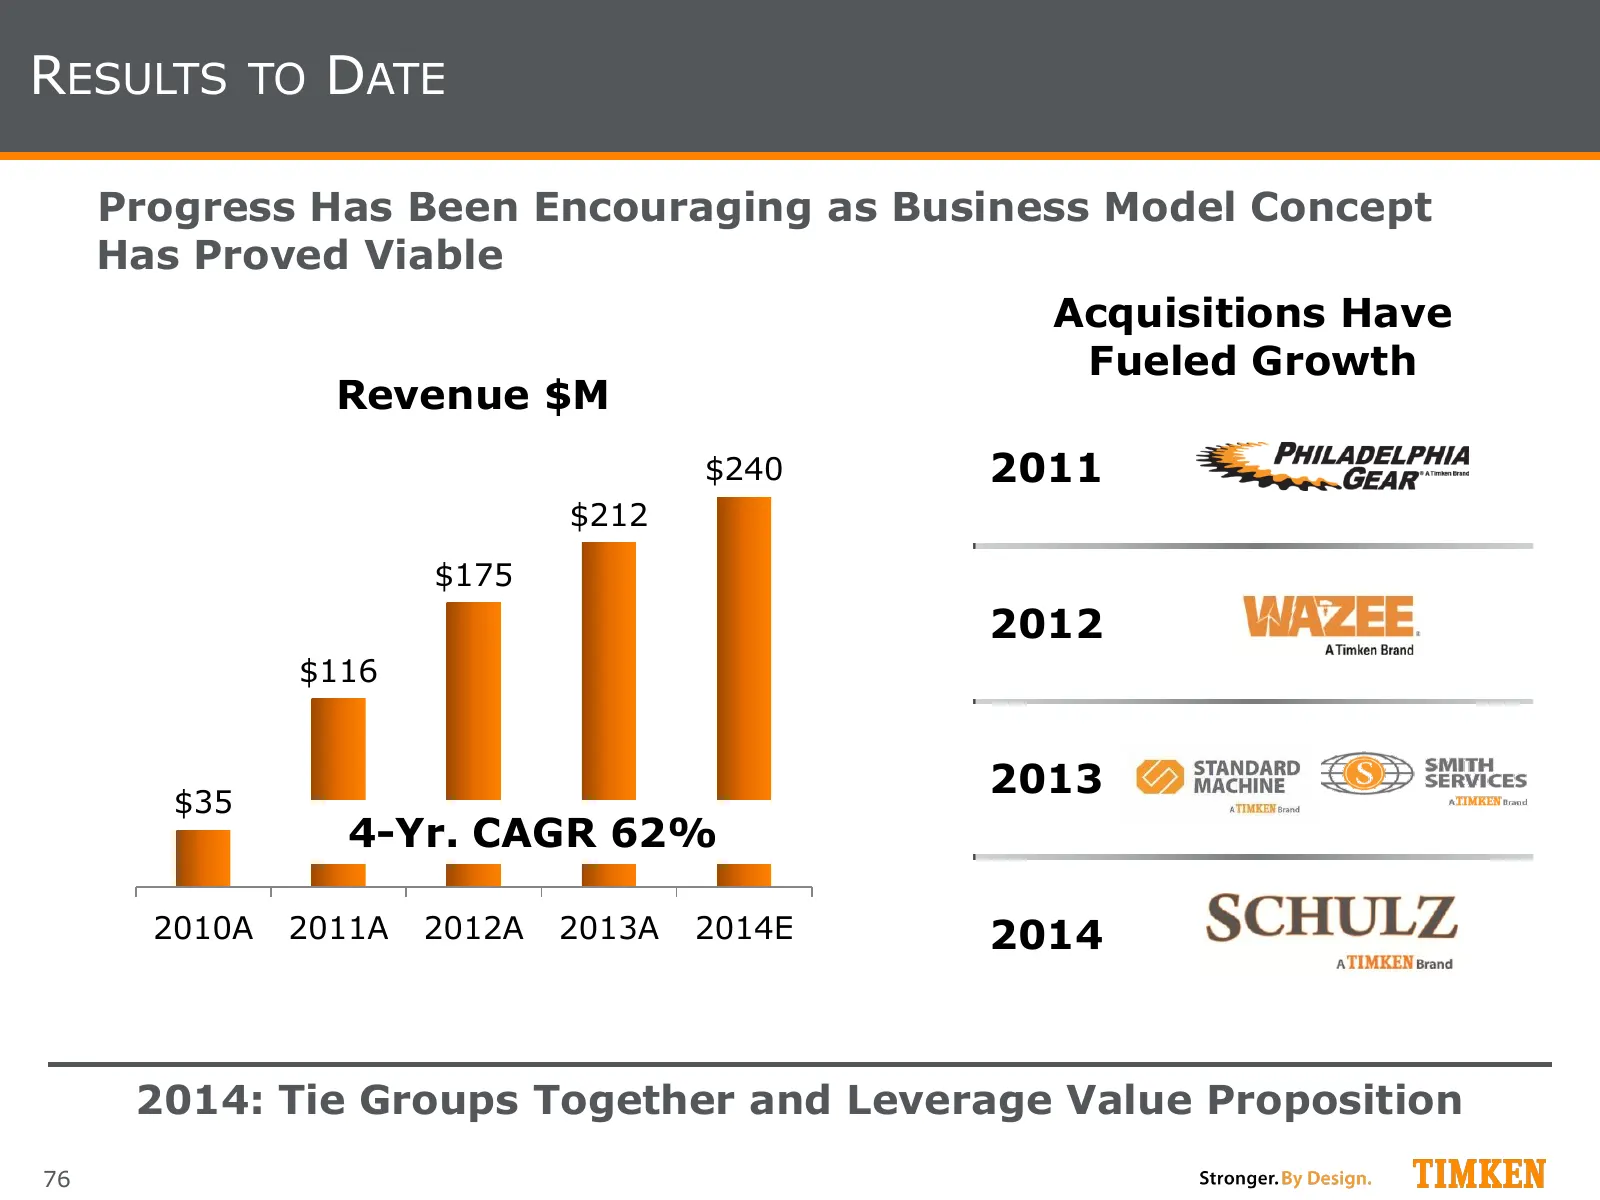
Slide 76: Results to Date
RESULTS TO DATE Progress Has Been Encouraging as Business Model Concept Has Proved Viable Acquisitions Have Fueled Growth Revenue $M $240 2011 $212 $175 2012 $116 $35 2013 4-Yr. CAGR 62% 2010A 2011A 2012A 2013A 2014E 2014 2014: Tie Groups Together and Leverage Value Proposition 76
Slide 77: Geographic Footprint
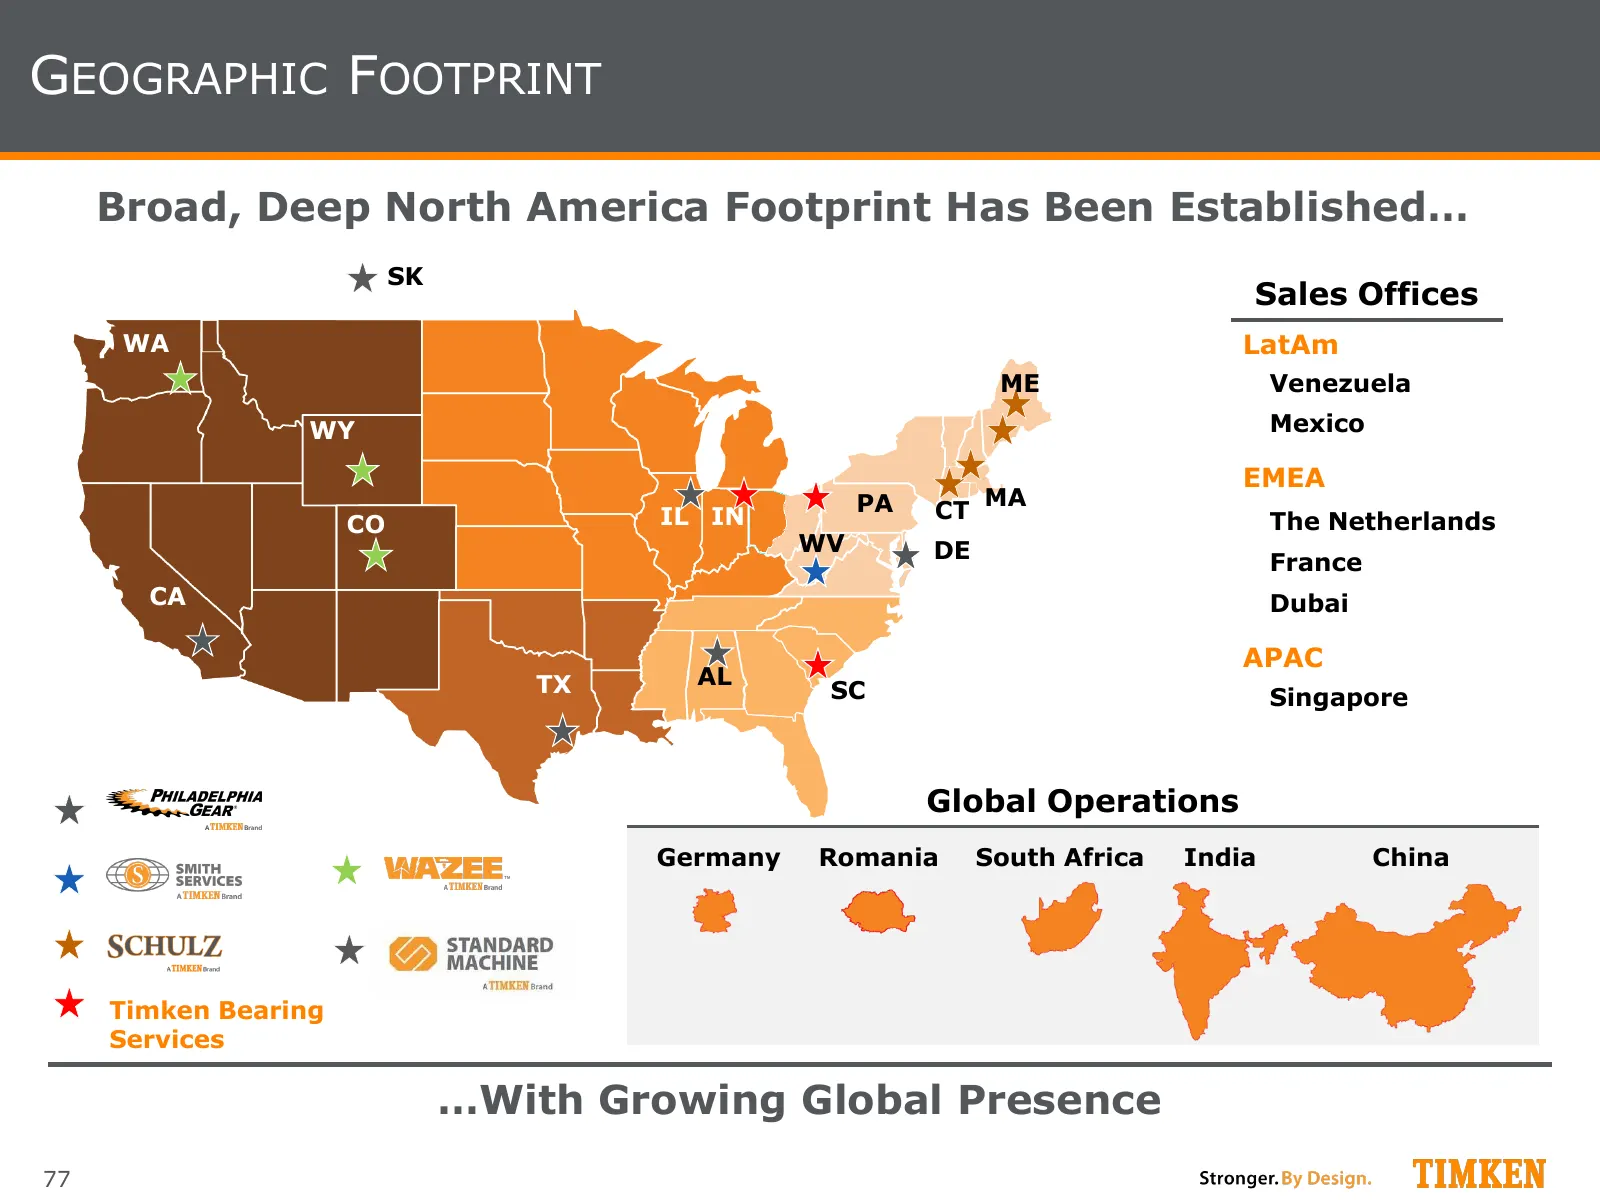
GEOGRAPHIC FOOTPRINT Broad, Deep North America Footprint Has Been Established… SK Sales Offices WA LatAm ME Venezuela WY Mexico EMEA PA MA IL IN CT The Netherlands CO WV DE France CA Dubai APAC TX AL SC Singapore Global Operations Germany Romania South Africa India China Timken Bearing Services …Wit
Slide 78: Growth Strategy
GROWTH STRATEGY Strategy is Simple and Compelling • Supply and service the drive train via direct sales team • Target energy, infrastructure, marine markets and select OEMs • Build a network of ISO-certified gear/motor/bearing service centers ‒ Provide world class local service and customer support
Slide 79: Growth Through Acquisitions
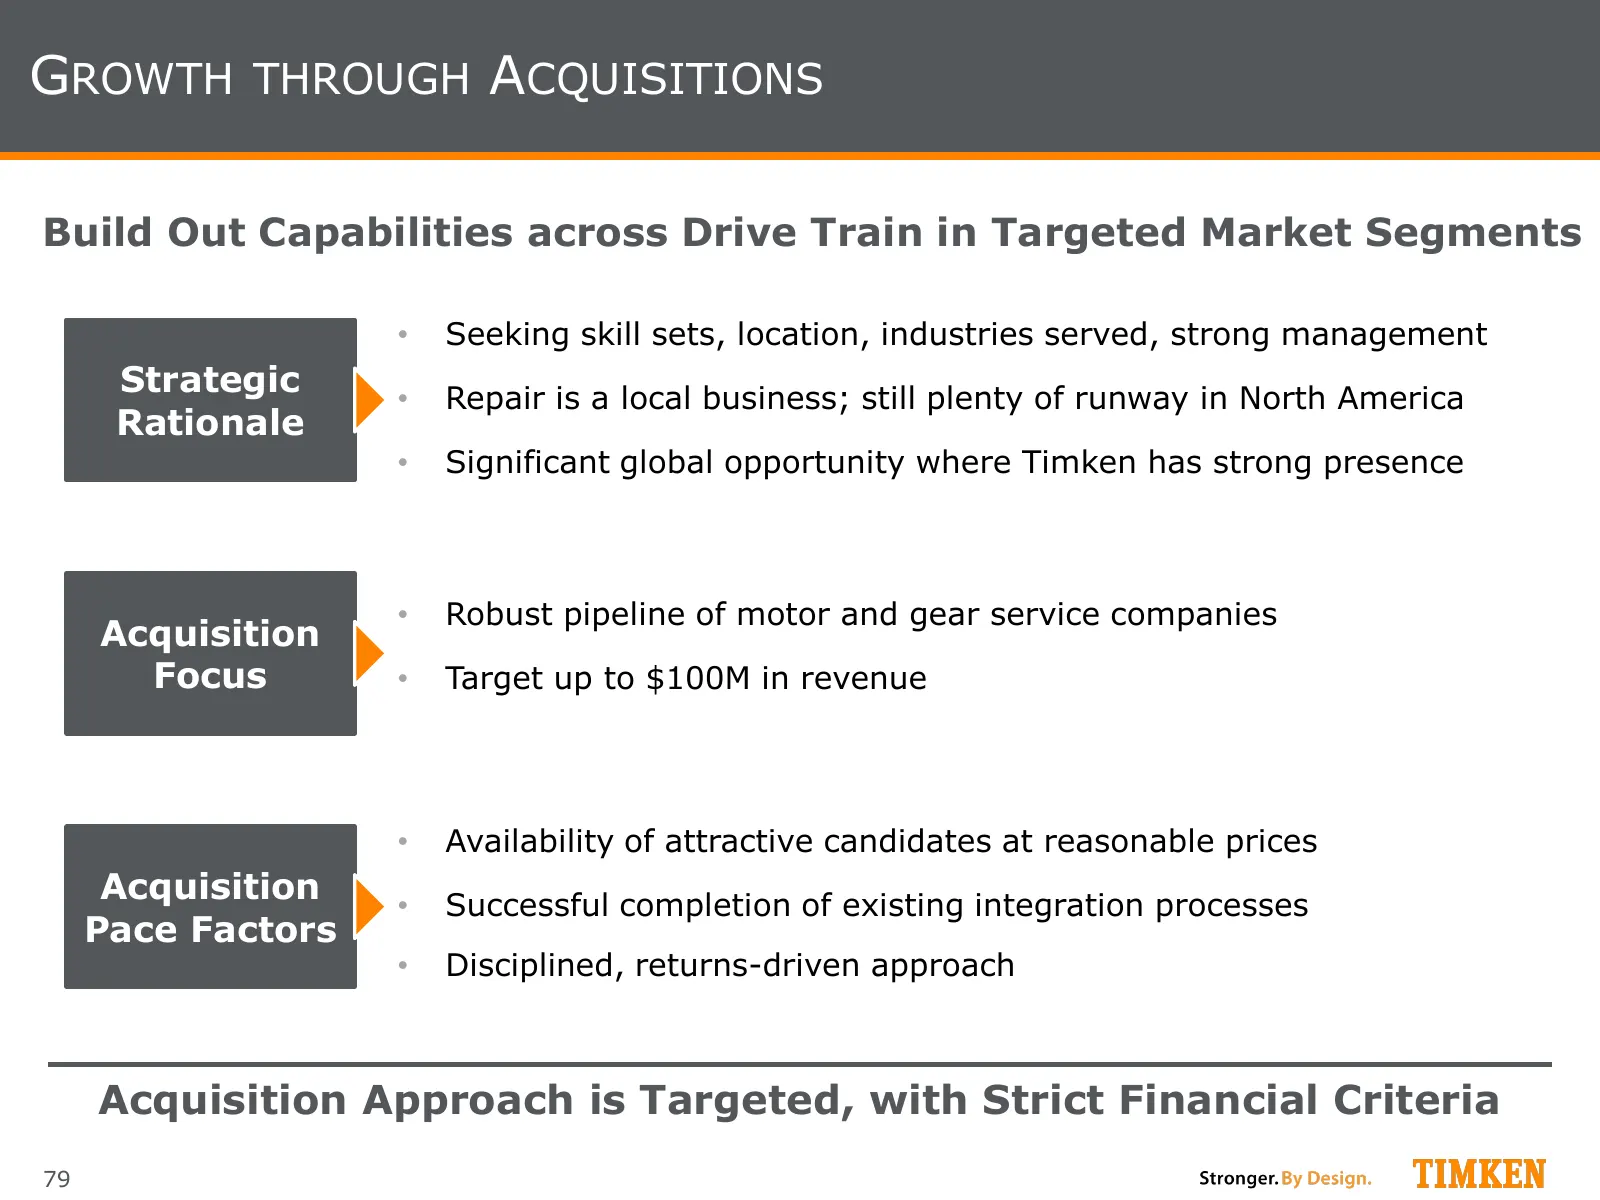
GROWTH THROUGH ACQUISITIONS Build Out Capabilities across Drive Train in Targeted Market Segments • Seeking skill sets, location, industries served, strong management Strategic • Repair is a local business; still plenty of runway in North America Rationale • Significant global opportunity where Timk
Slide 80: Summary
SUMMARY Power Systems: A Critical Growth Driver for Years to Come • Opportunity is significant ‒ Access to larger and attractive market ‒ Early successes are encouraging • Direct pipeline to the customer offers considerable benefits ‒ Evolution from a component supplier to solutions provider elevate
Slide 81: Capturing Niche Opportunities
Capturing Niche Opportunities Brian Ruel, Vice President | Mobile Industries
Slide 82: Rail Overview
RAIL OVERVIEW Applications Channel Exposure Geographic Footprint Locomotive Aftermarket LatAm Transit OE 9% 7% 10% APAC 23% 51% 47% 46% NA 81% 24% 2% EMEA Freight OE Service • $300M business • 53% aftermarket, • Brand name services and respected globally • Focused mostly on replacement bearings frei
Slide 83: Rail - Strong Sector Demand Drivers
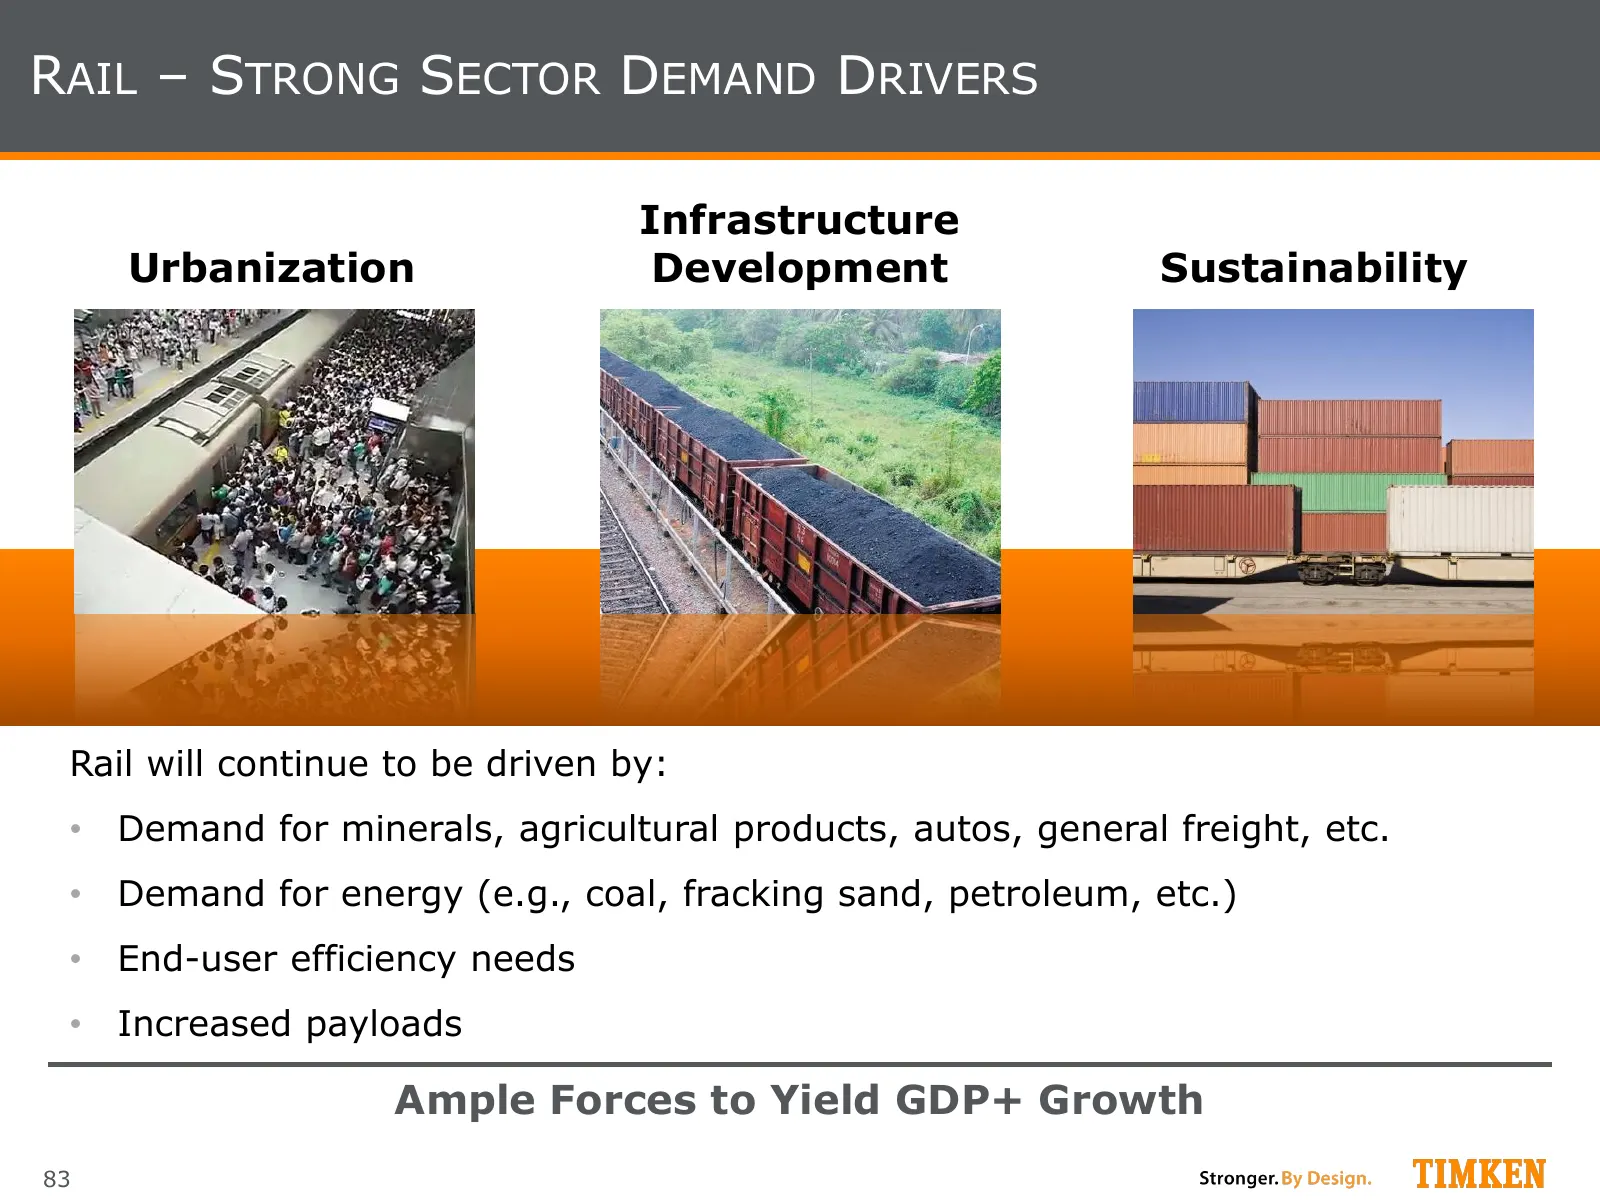
RAIL – STRONG SECTOR DEMAND DRIVERS Infrastructure Urbanization Development Sustainability Rail will continue to be driven by: • Demand for minerals, agricultural products, autos, general freight, etc. • Demand for energy (e.g., coal, fracking sand, petroleum, etc.) • End-user efficiency needs • Inc
Slide 84: Rail - Fit with Timken Business Model
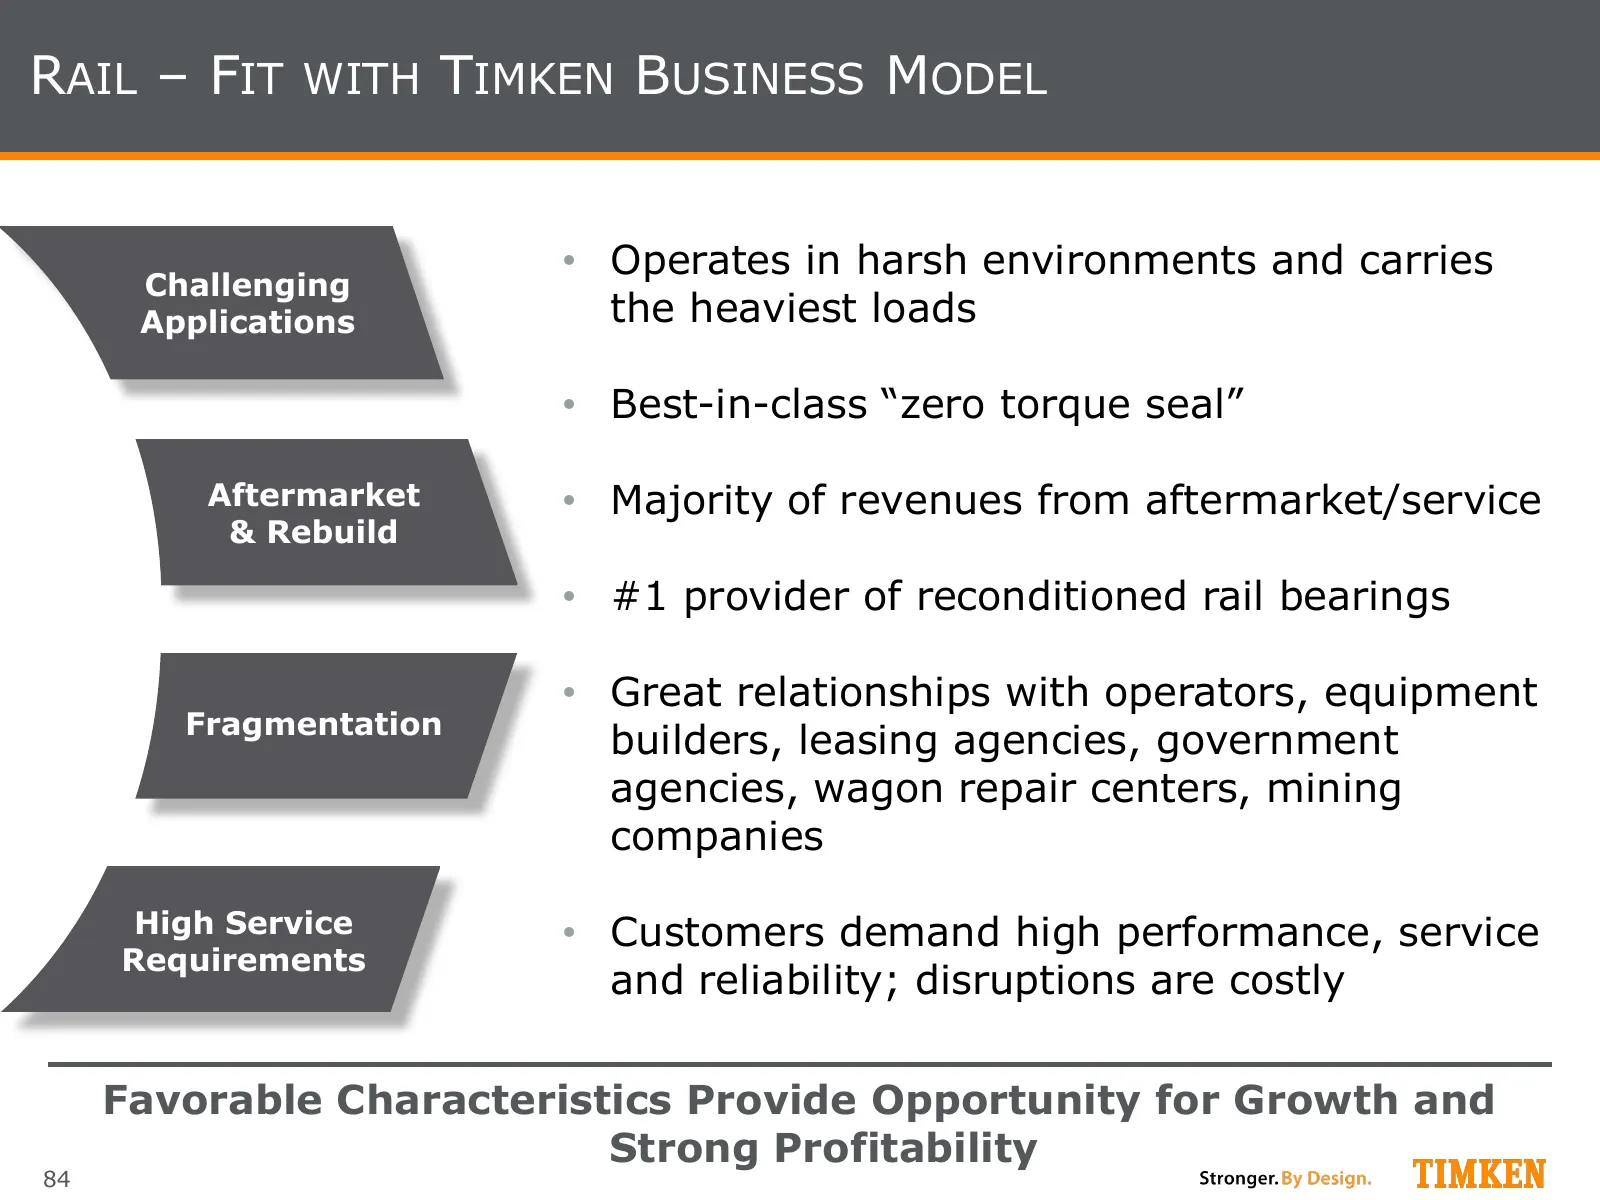
RAIL – FIT WITH TIMKEN BUSINESS MODEL • Operates in harsh environments and carries Challenging Applications the heaviest loads • Best-in-class “zero torque seal” Aftermarket • Majority of revenues from aftermarket/service & Rebuild • #1 provider of reconditioned rail bearings • Great relationships w
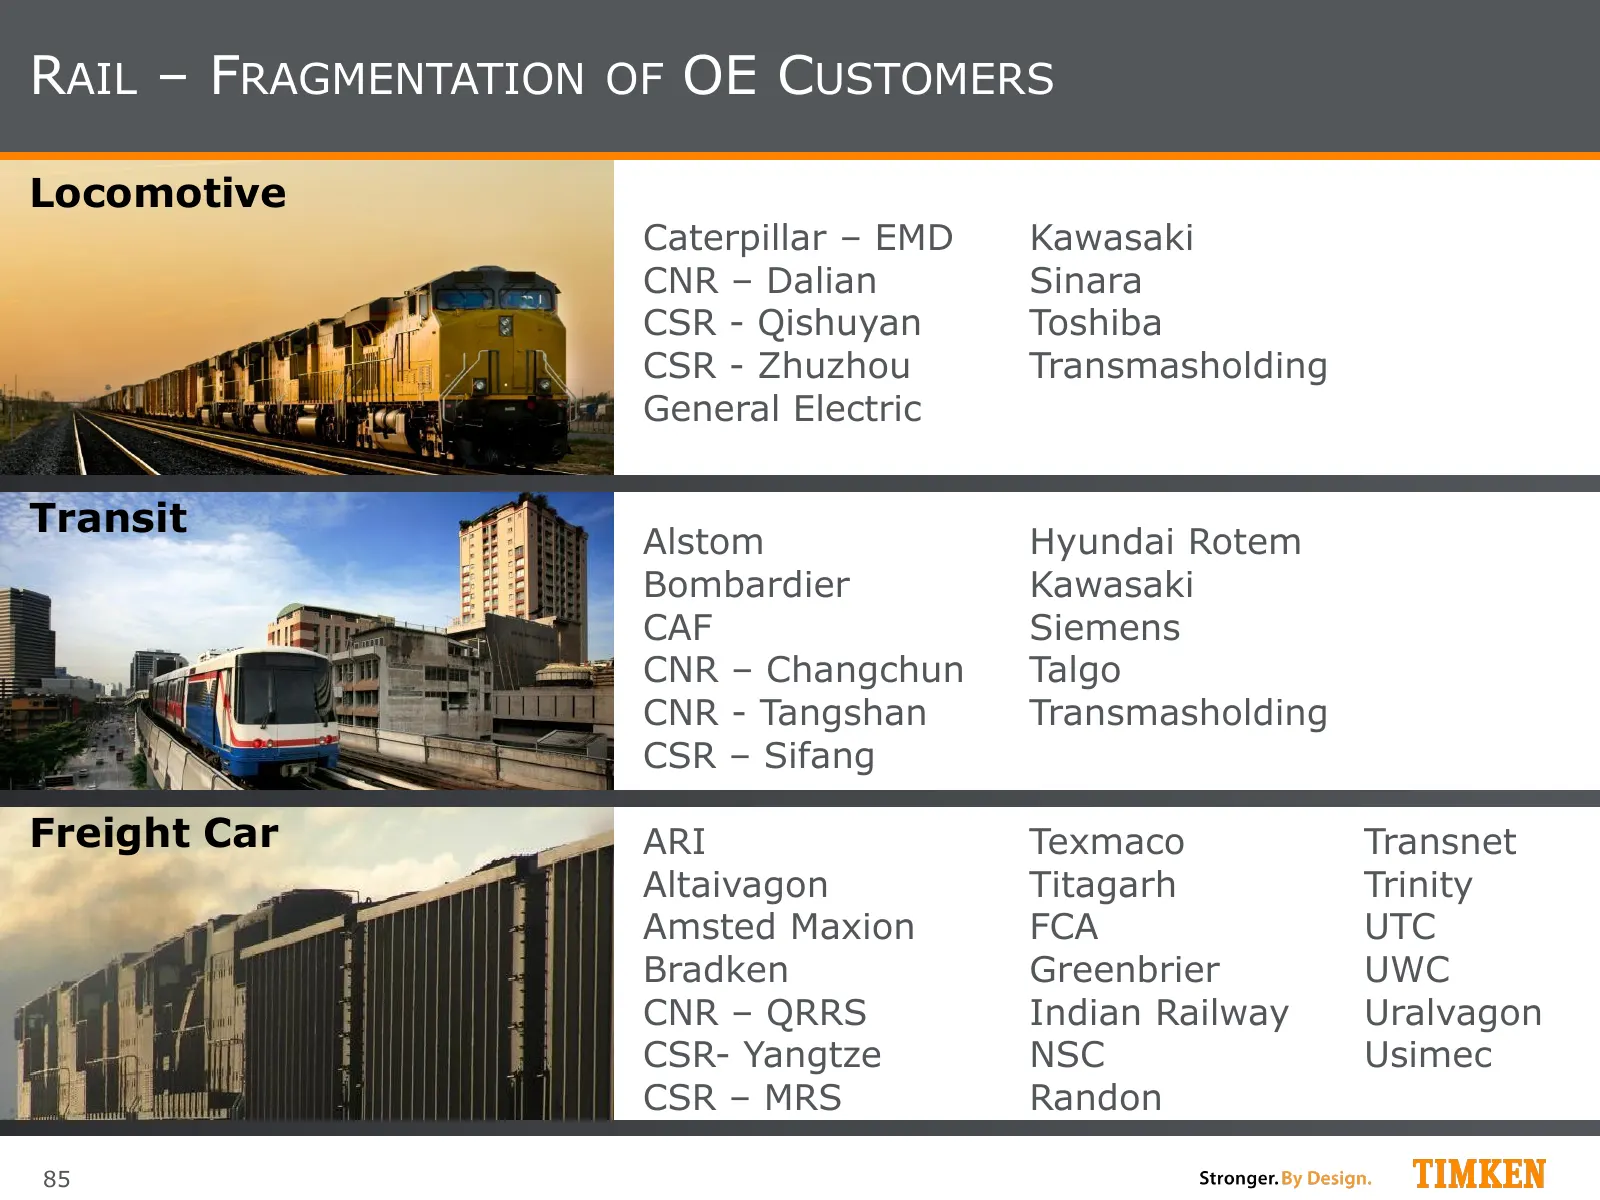
Slide 85: Rail - Fragmentation of OE Customers
RAIL – FRAGMENTATION OF OE CUSTOMERS Locomotive Caterpillar – EMD Kawasaki CNR – Dalian Sinara CSR - Qishuyan Toshiba CSR - Zhuzhou Transmasholding General Electric Transit Alstom Hyundai Rotem Bombardier Kawasaki CAF Siemens CNR – Changchun Talgo CNR - Tangshan Transmasholding CSR – Sifang Freight
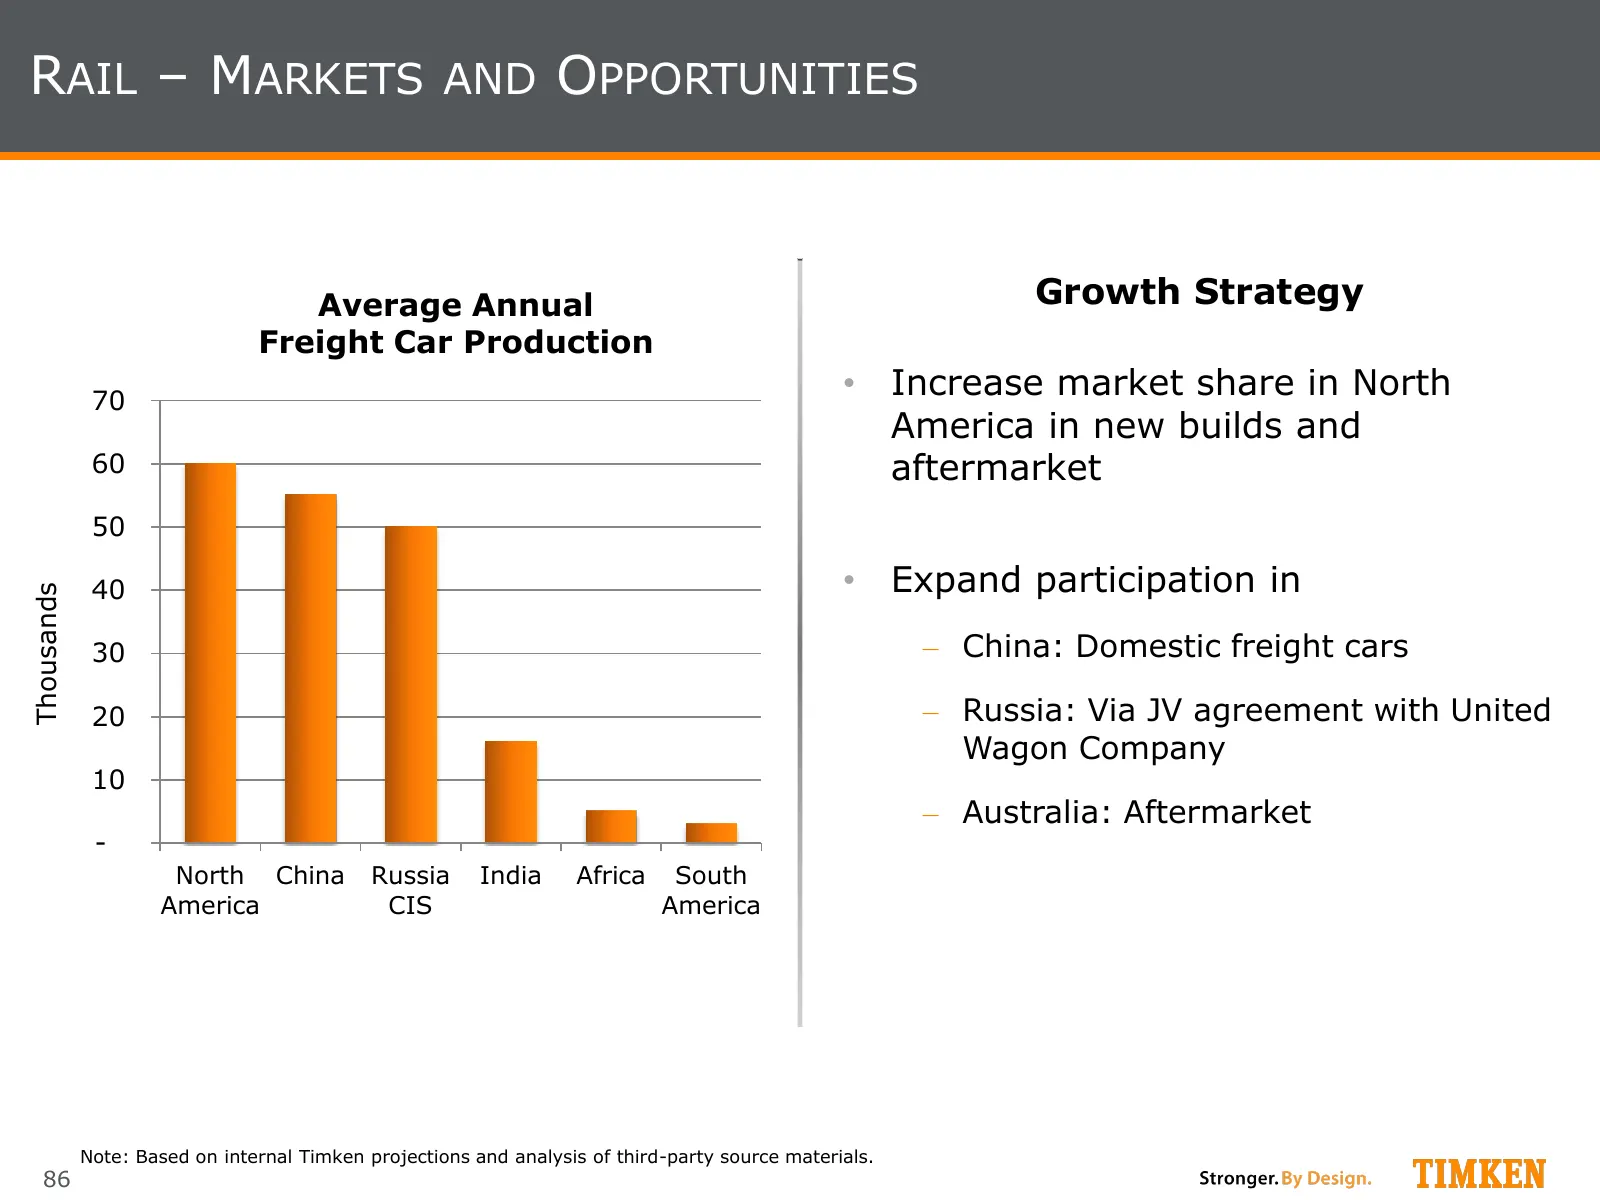
Slide 86: Rail - Markets and Opportunities
RAIL – MARKETS AND OPPORTUNITIES Average Annual Growth Strategy Freight Car Production 70 • Increase market share in North America in new builds and 60 aftermarket 50 40 • Expand participation in Thousands 30 ‒ China: Domestic freight cars 20 ‒ Russia: Via JV agreement with United Wagon Company 10 ‒
Slide 87: Summary
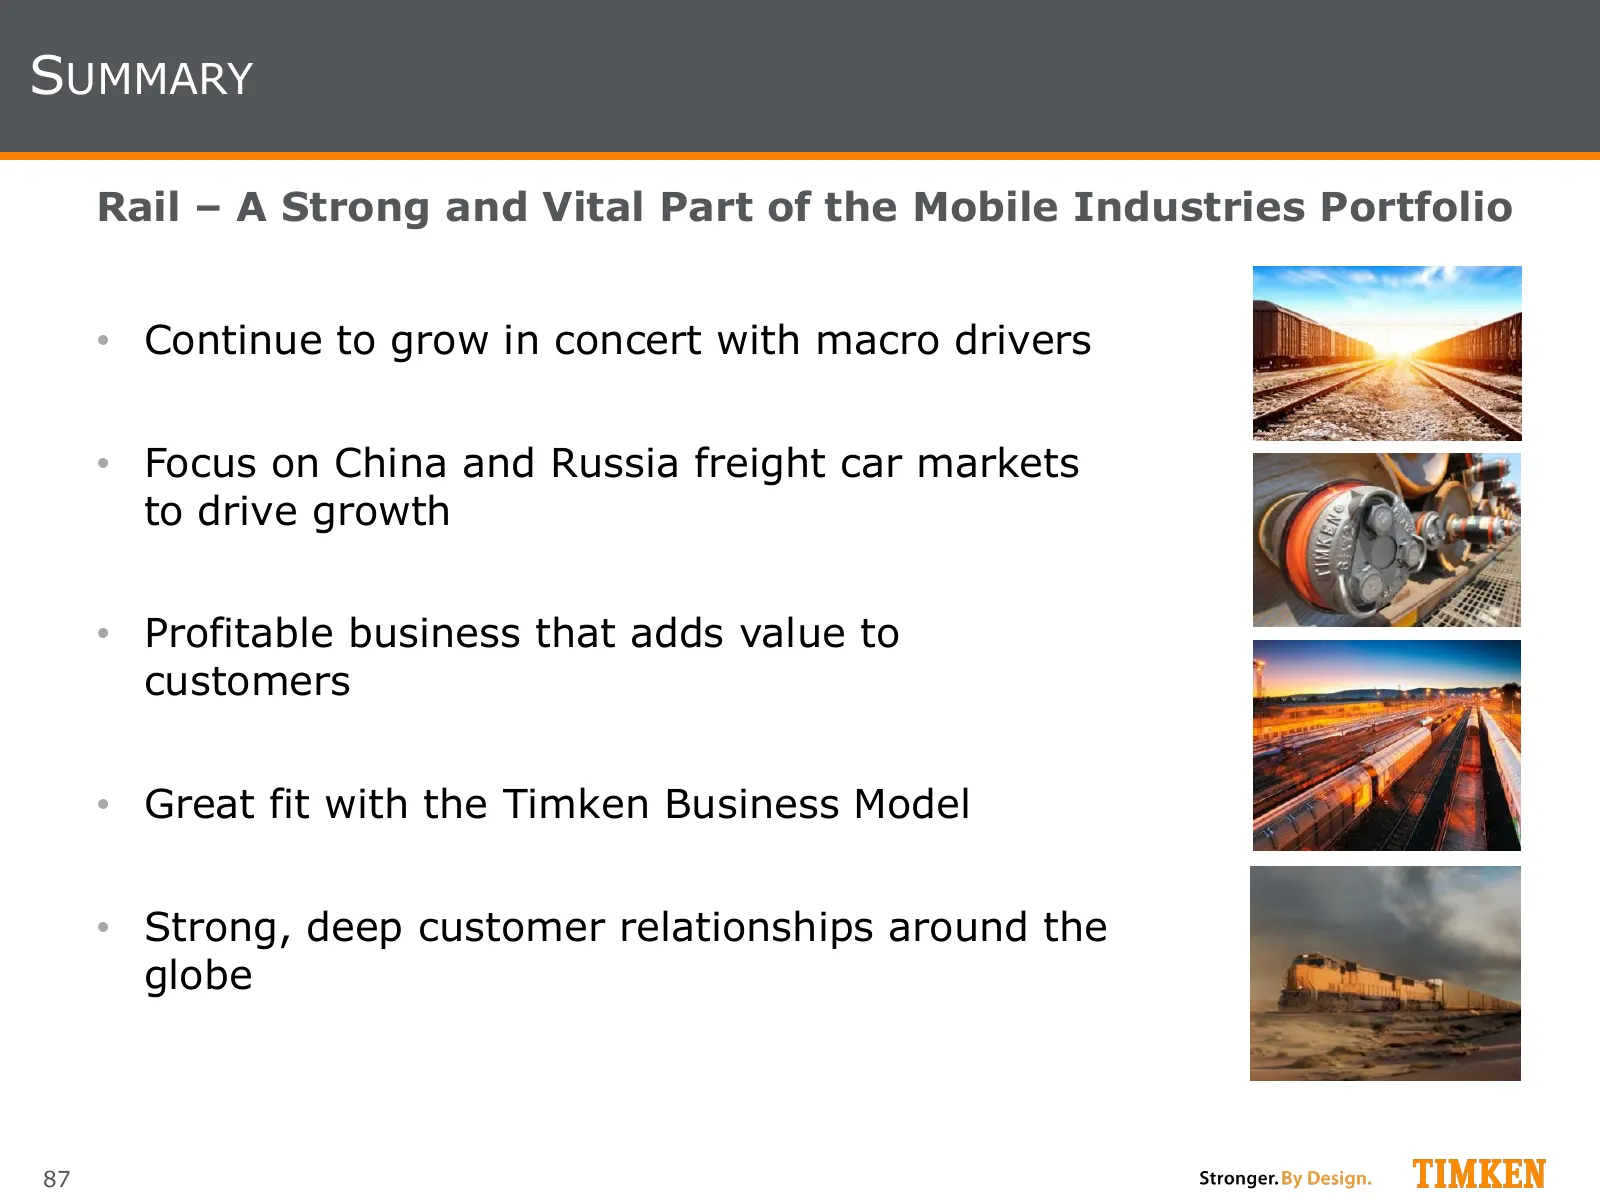
SUMMARY Rail – A Strong and Vital Part of the Mobile Industries Portfolio • Continue to grow in concert with macro drivers • Focus on China and Russia freight car markets to drive growth • Profitable business that adds value to customers • Great fit with the Timken Business Model • Strong, deep cust
Slide 88: Financial Review
Financial Review Phil Fracassa, CFO
Slide 89: Disclaimer
DISCLAIMER This presentation contains certain unaudited pro forma financial data derived from the historical consolidated financial statements and accounting records of the Company that have been adjusted to present the estimated impact from the removal of the TimkenSteel Corporation business from t
Slide 90: What You'll Hear Today
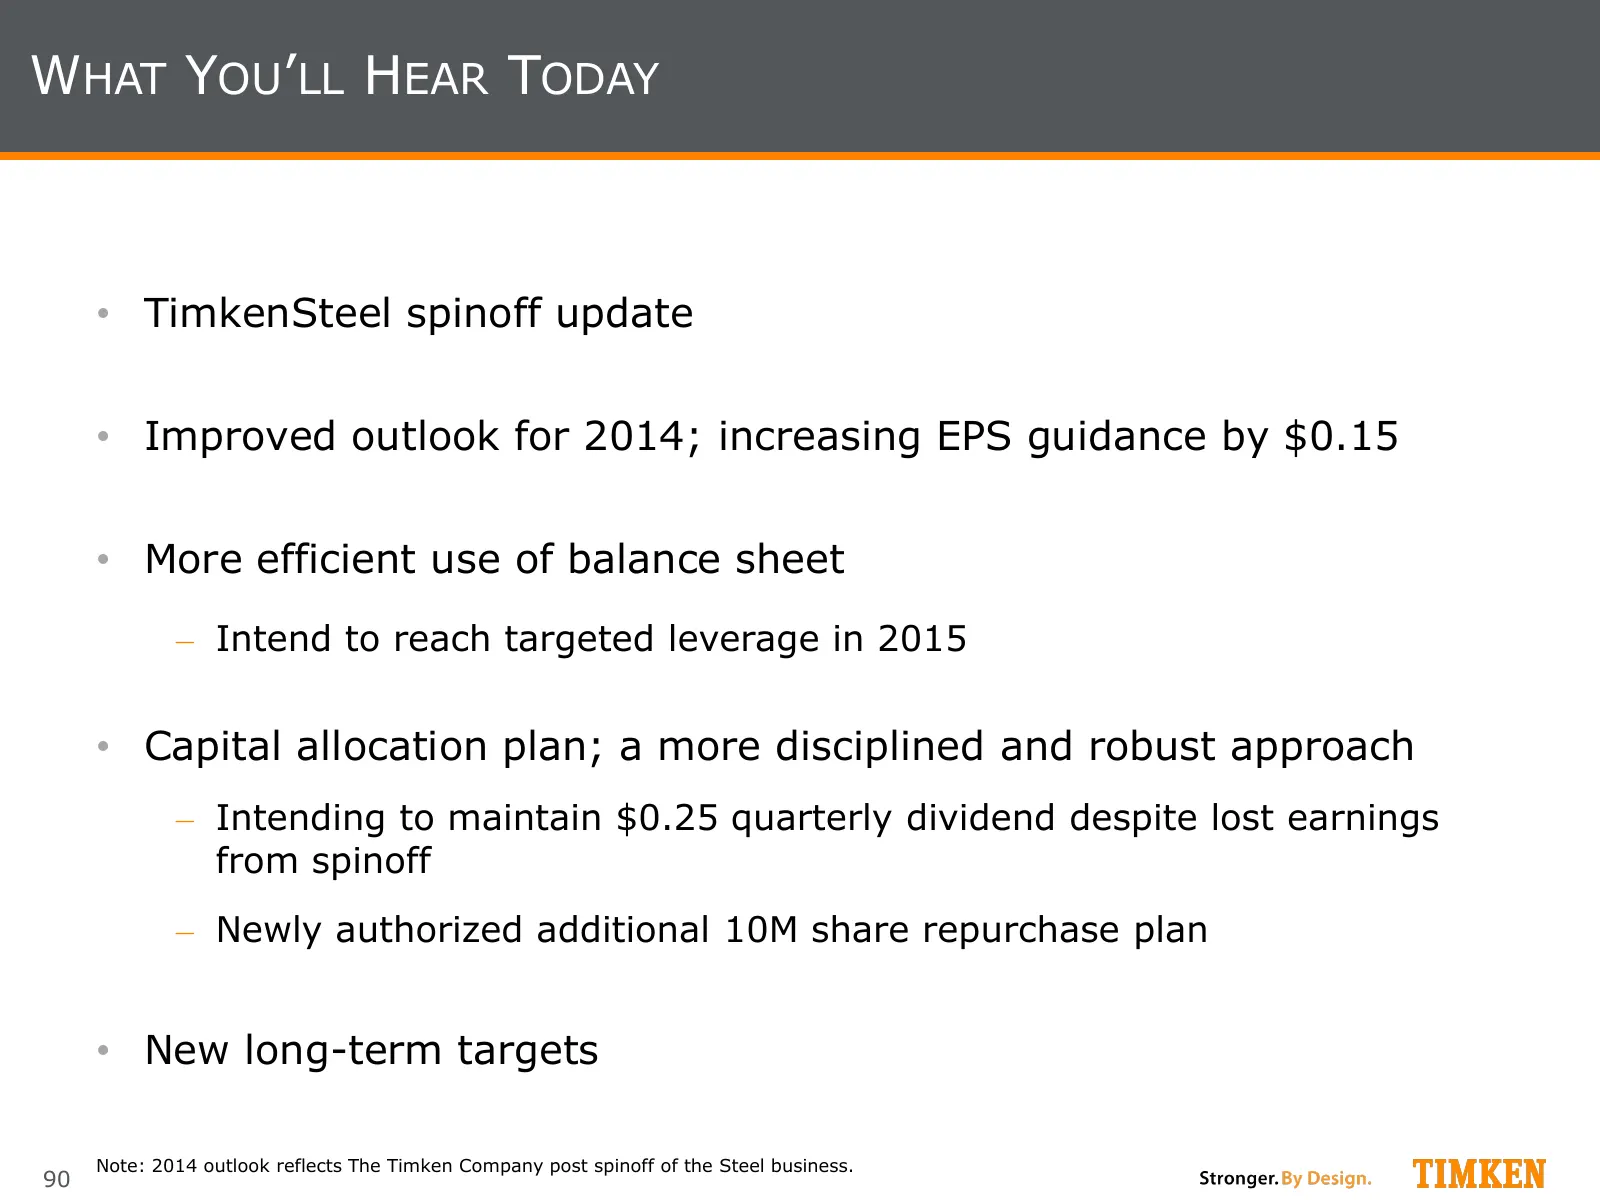
WHAT YOU’LL HEAR TODAY • TimkenSteel spinoff update • Improved outlook for 2014; increasing EPS guidance by $0.15 • More efficient use of balance sheet ‒ Intend to reach targeted leverage in 2015 • Capital allocation plan; a more disciplined and robust approach ‒ Intending to maintain $0.25 quarterl
Slide 91: Steel Spinoff Update
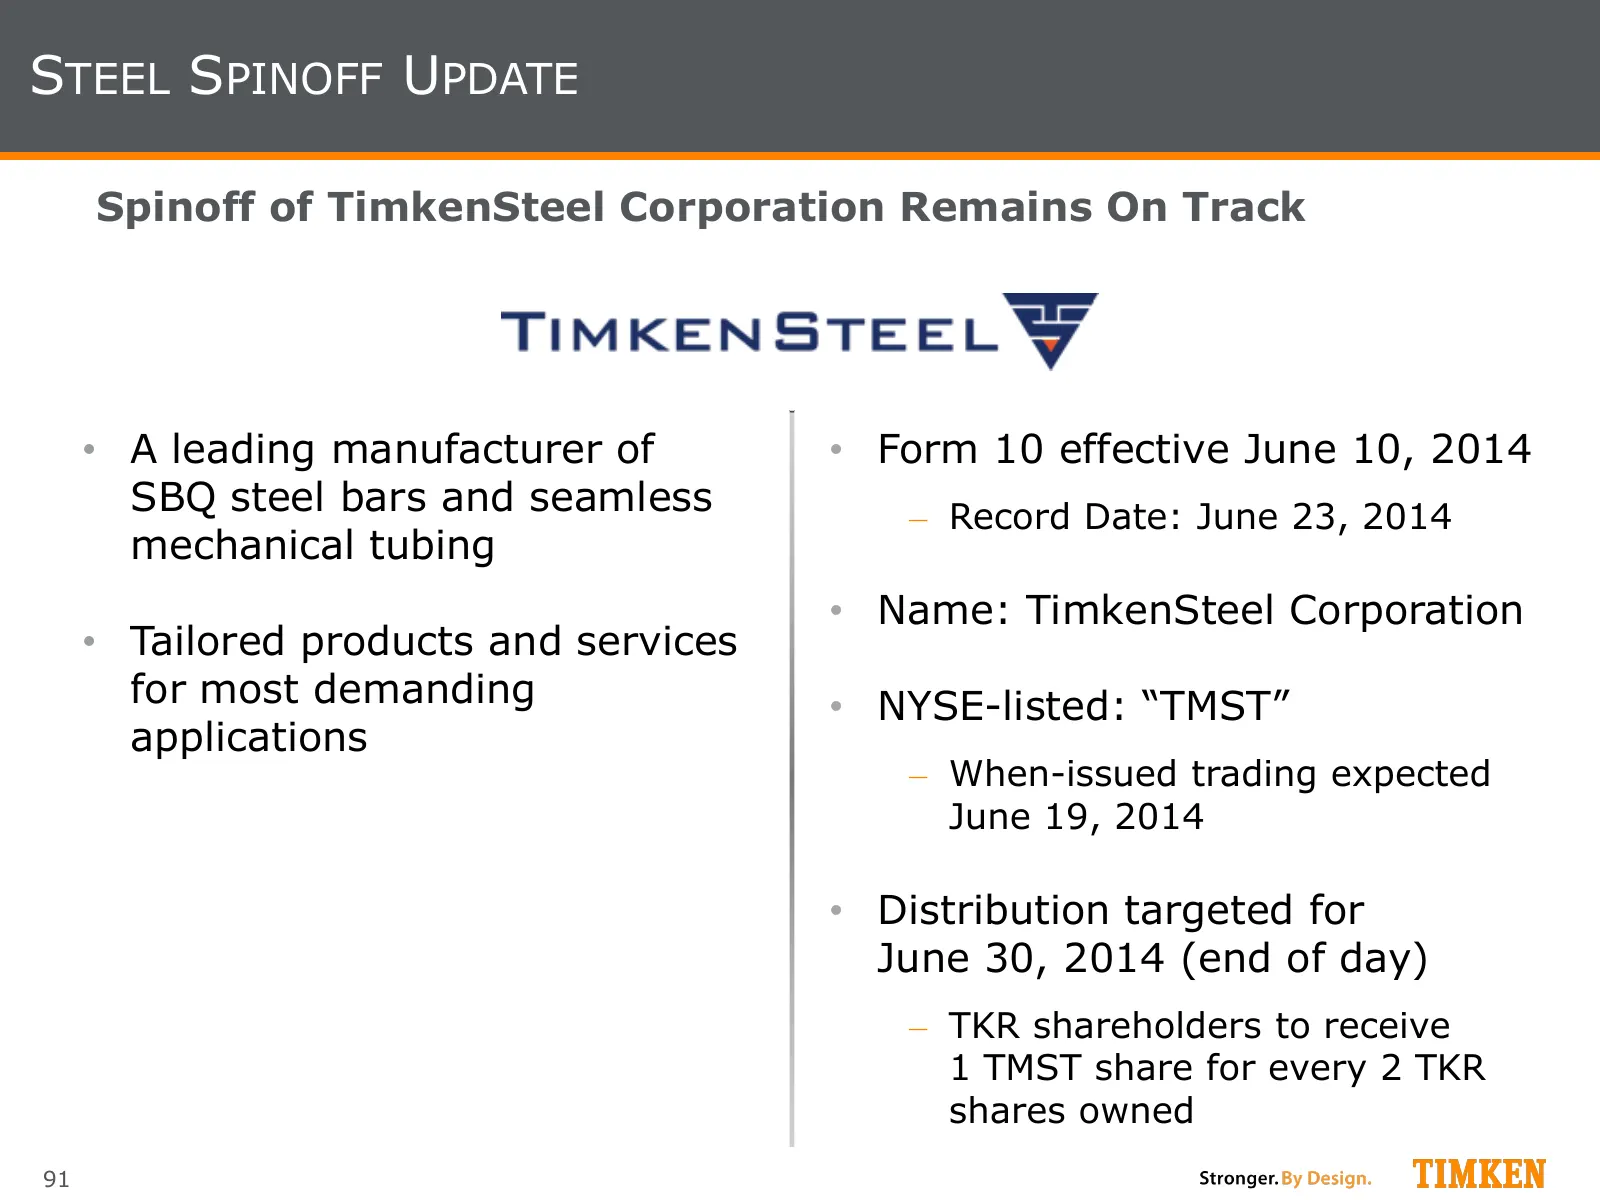
STEEL SPINOFF UPDATE Spinoff of TimkenSteel Corporation Remains On Track • A leading manufacturer of • Form 10 effective June 10, 2014 SBQ steel bars and seamless ‒ Record Date: June 23, 2014 mechanical tubing • Name: TimkenSteel Corporation • Tailored products and services for most demanding • NYSE
Slide 92: 1Q'14 Snapshot - Timken (Ex. Steel)
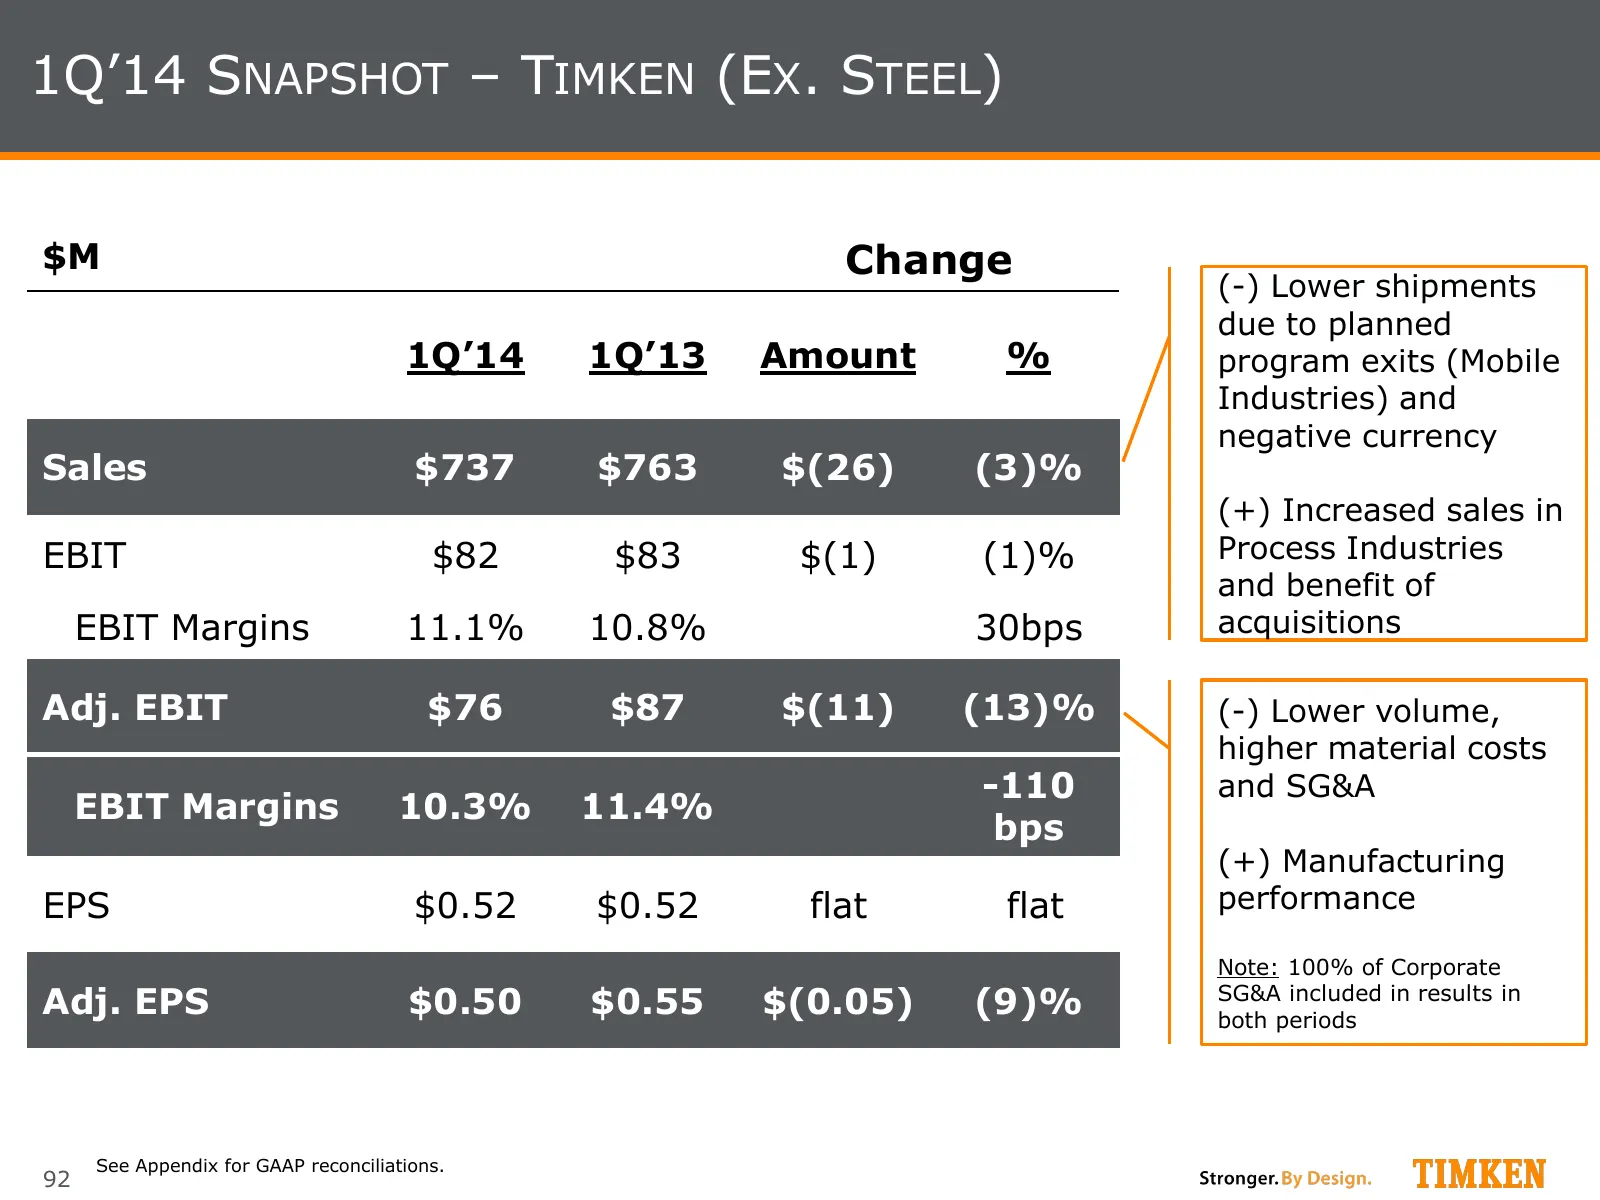
1Q’14 SNAPSHOT – TIMKEN (EX. STEEL) $M Change (-) Lower shipments due to planned 1Q’14 1Q’13 Amount % program exits (Mobile Industries) and negative currency Sales $737 $763 $(26) (3)% (+) Increased sales in EBIT $82 $83 $(1) (1)% Process Industries and benefit of EBIT Margins 11.1% 10.8% 30bps acqu
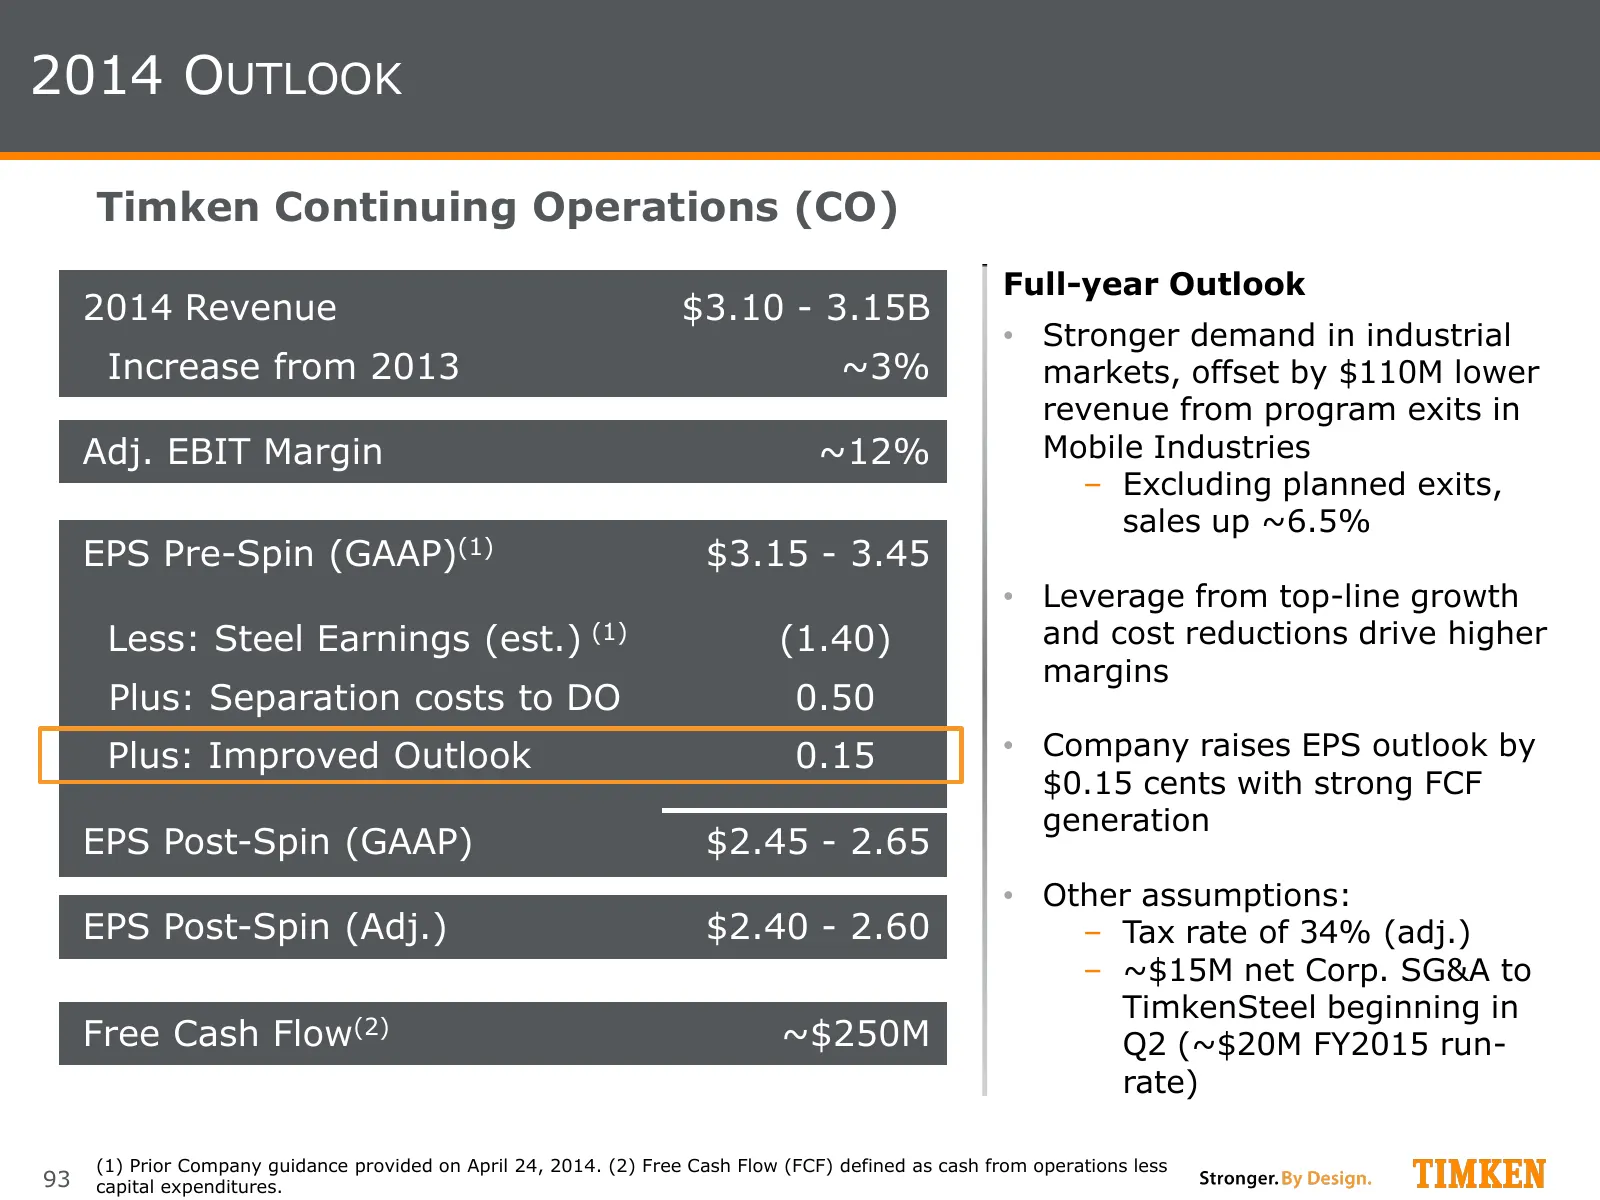
Slide 93: 2014 Outlook
2014 OUTLOOK Timken Continuing Operations (CO) Full-year Outlook 2014 Revenue $3.10 - 3.15B • Stronger demand in industrial Increase from 2013 ~3% markets, offset by $110M lower revenue from program exits in Adj. EBIT Margin ~12% Mobile Industries ‒ Excluding planned exits, sales up ~6.5% EPS Pre-Sp
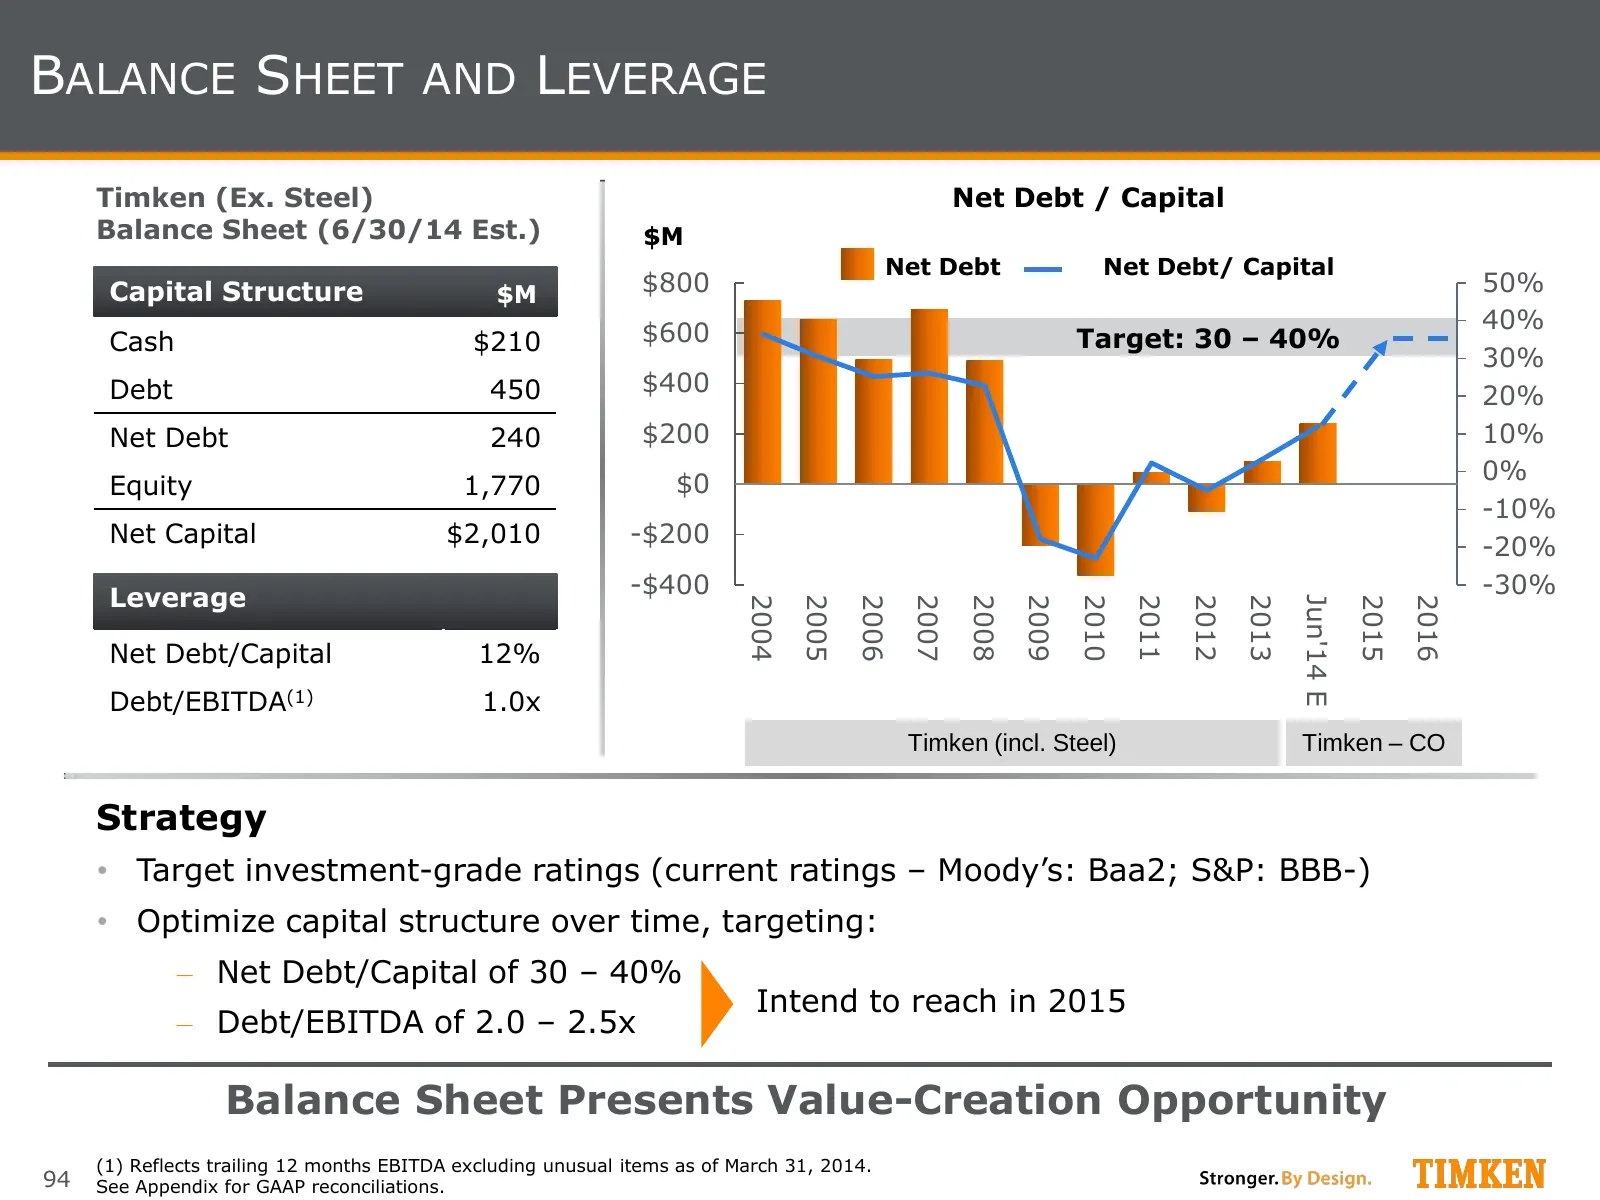
Slide 94: Balance Sheet and Leverage
BALANCE SHEET AND LEVERAGE Timken (Ex. Steel) Net Debt / Capital Balance Sheet (6/30/14 Est.) $M Net Debt Net Debt/ Capital Capital Structure $M $800 50% $600 40% Cash $210 Target: 30 – 40% 30% Debt 450 $400 20% Net Debt 240 $200 10% $0 0% Equity 1,770 -10% Net Capital $2,010 -$200 -20% -$400 -30% L
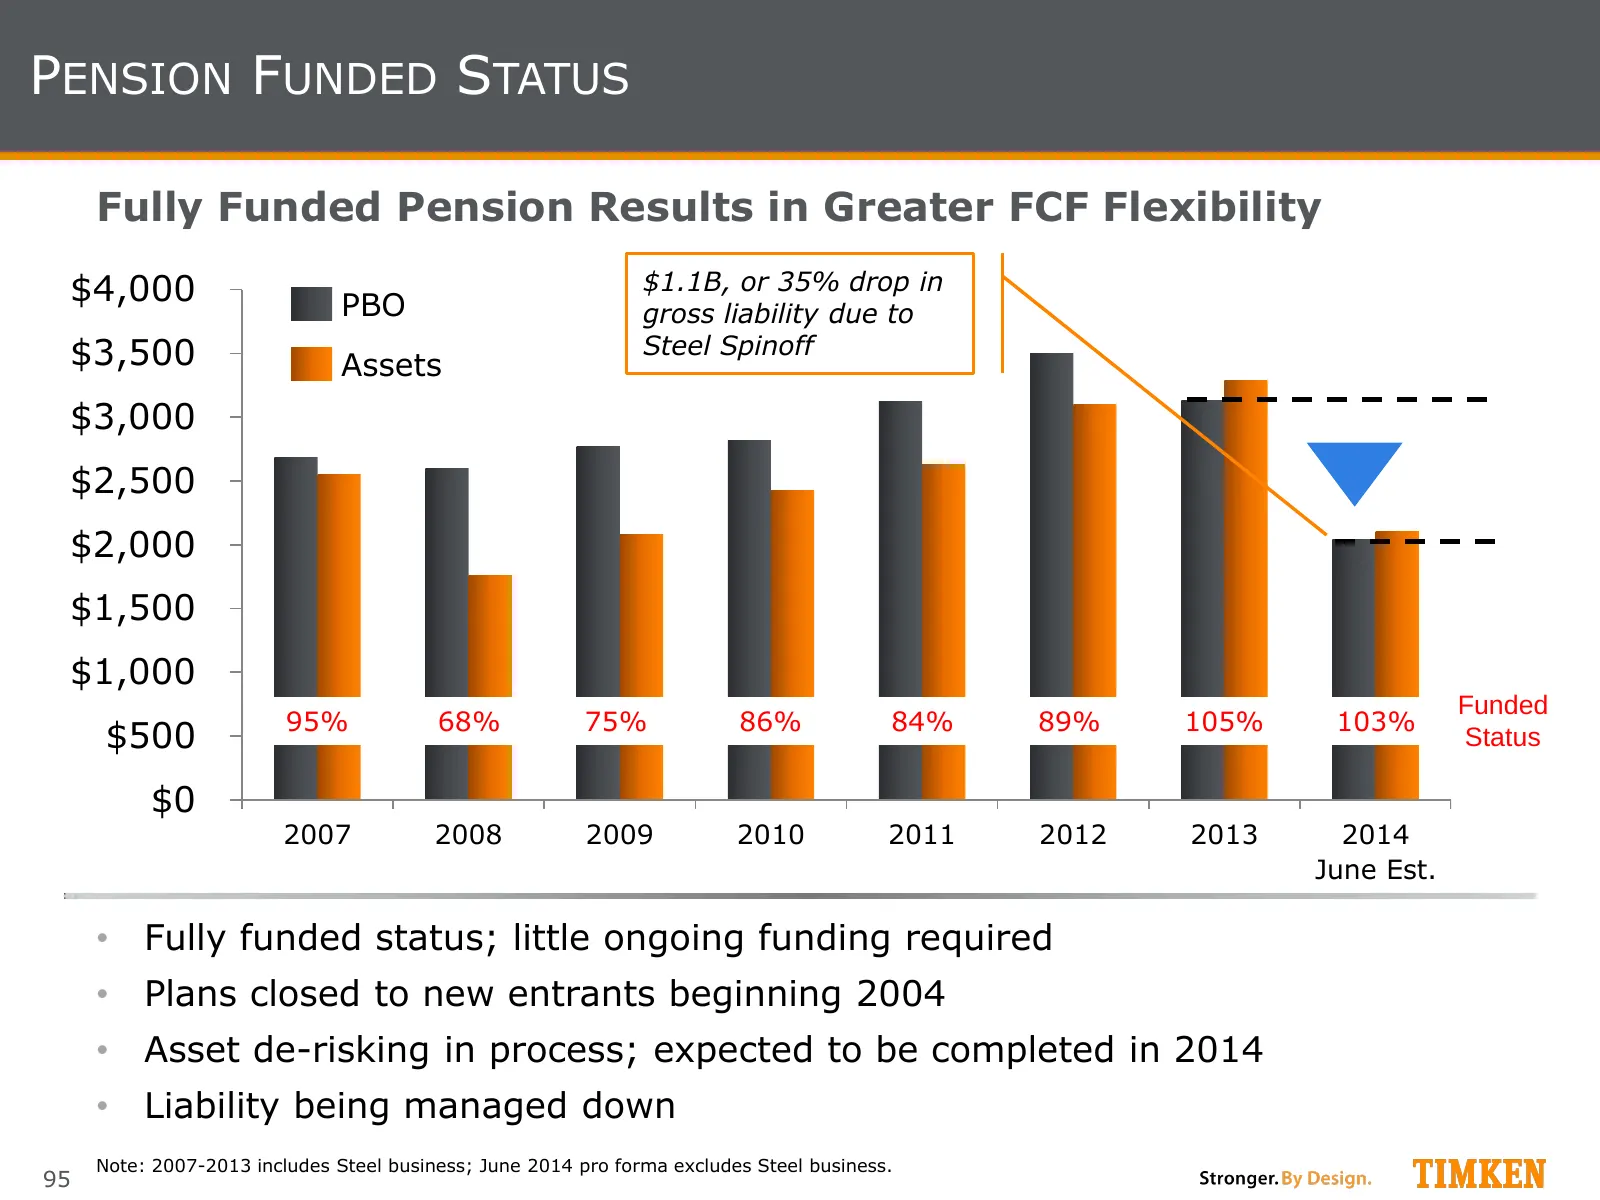
Slide 95: Pension Funded Status
PENSION FUNDED STATUS Fully Funded Pension Results in Greater FCF Flexibility $4,000 $1.1B, or 35% drop in PBO gross liability due to $3,500 Steel Spinoff Assets $3,000 $2,500 $2,000 $1,500 $1,000 Funded 95% 68% 75% 86% 84% 89% 105% 103% $500 Status $0 2007 2008 2009 2010 2011 2012 2013 2014 June Es
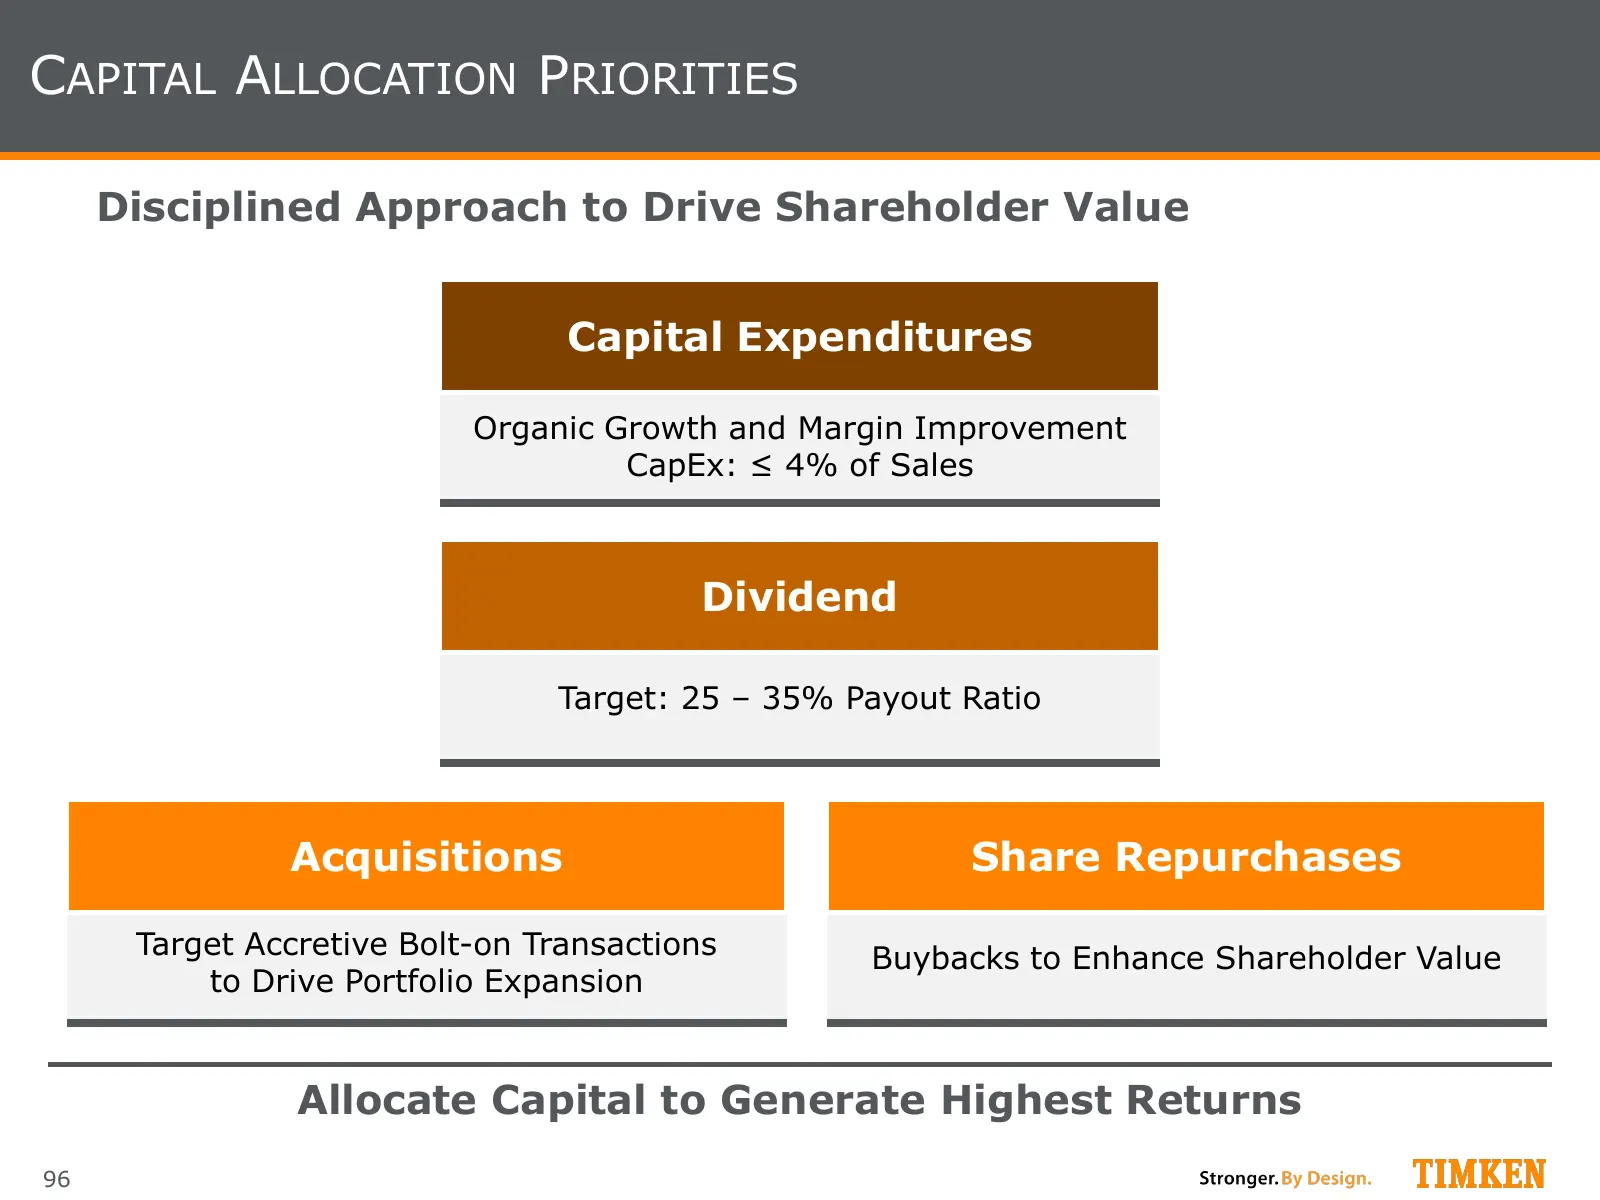
Slide 96: Capital Allocation Priorities
CAPITAL ALLOCATION PRIORITIES Disciplined Approach to Drive Shareholder Value Capital Expenditures Organic Growth and Margin Improvement CapEx: ≤ 4% of Sales Dividend Target: 25 – 35% Payout Ratio Acquisitions Share Repurchases Target Accretive Bolt-on Transactions Buybacks to Enhance Shareholder Va
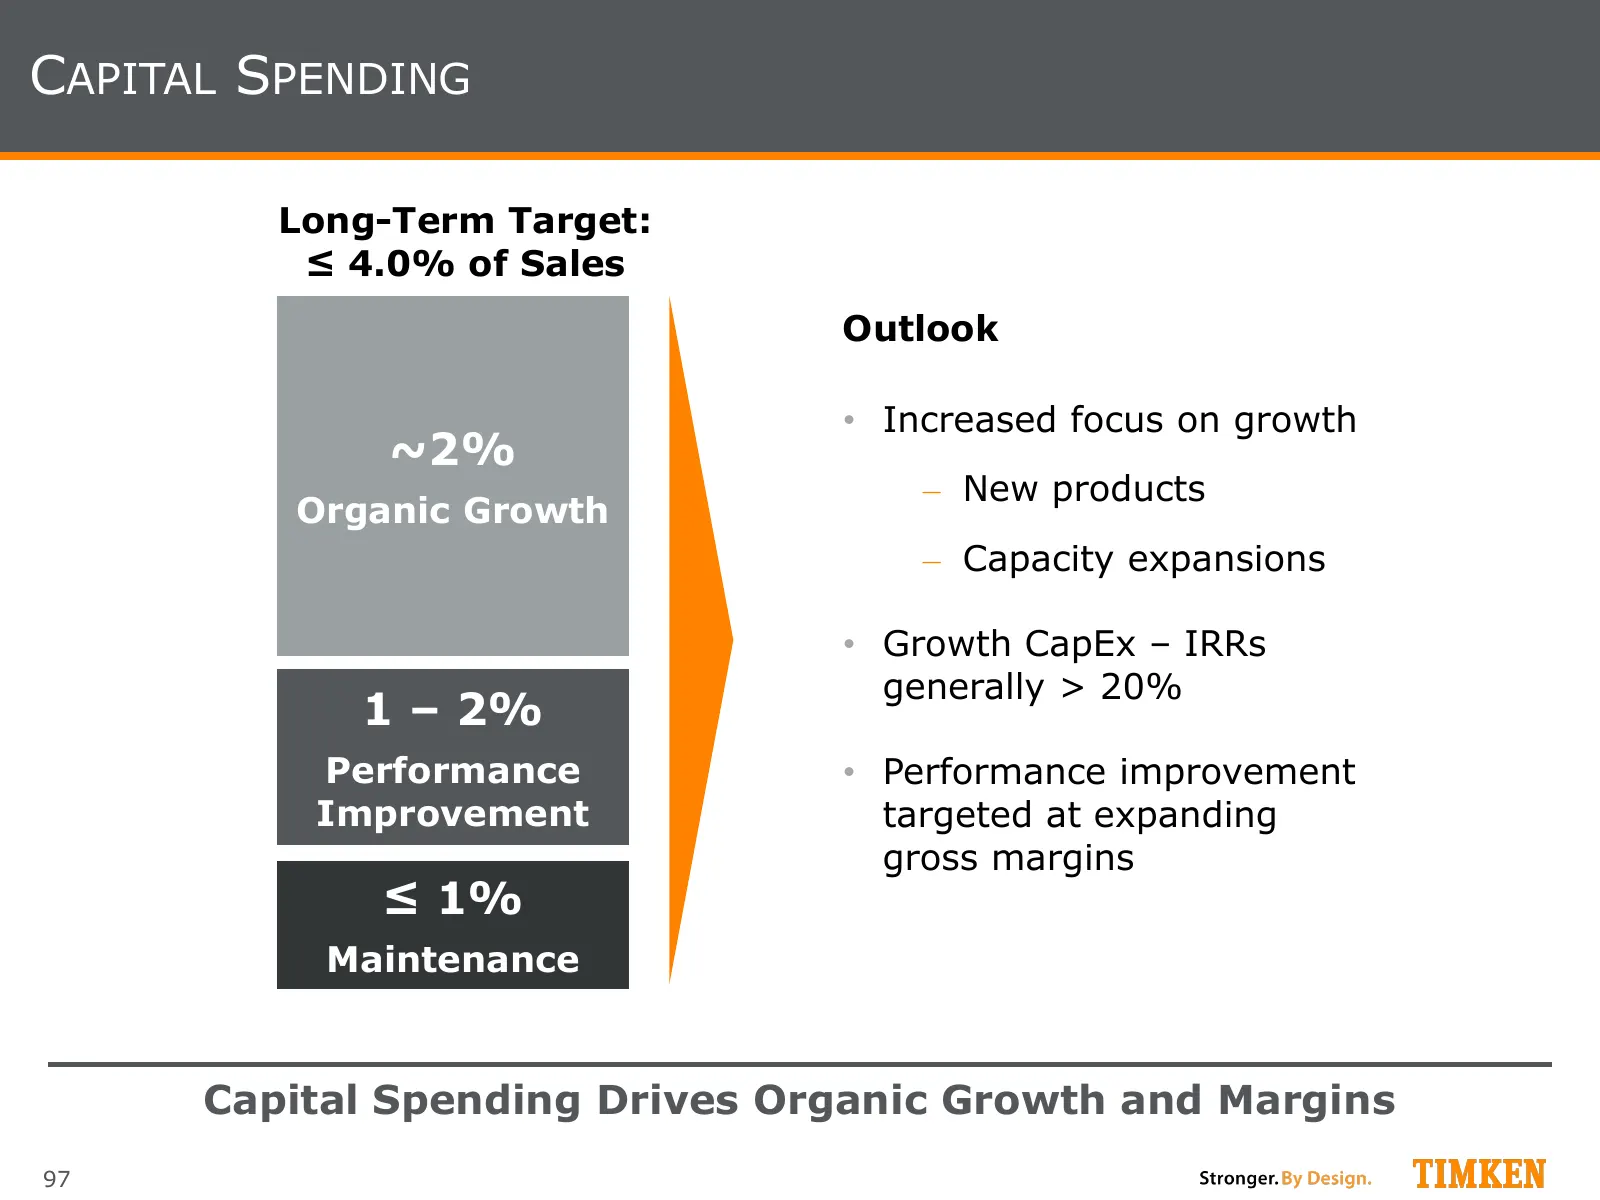
Slide 97: Capital Spending
CAPITAL SPENDING Long-Term Target: ≤ 4.0% of Sales Outlook • Increased focus on growth ~2% ‒ New products Organic Growth ‒ Capacity expansions • Growth CapEx – IRRs generally > 20% 1 – 2% Performance • Performance improvement Improvement targeted at expanding gross margins ≤ 1% Maintenance Capital S
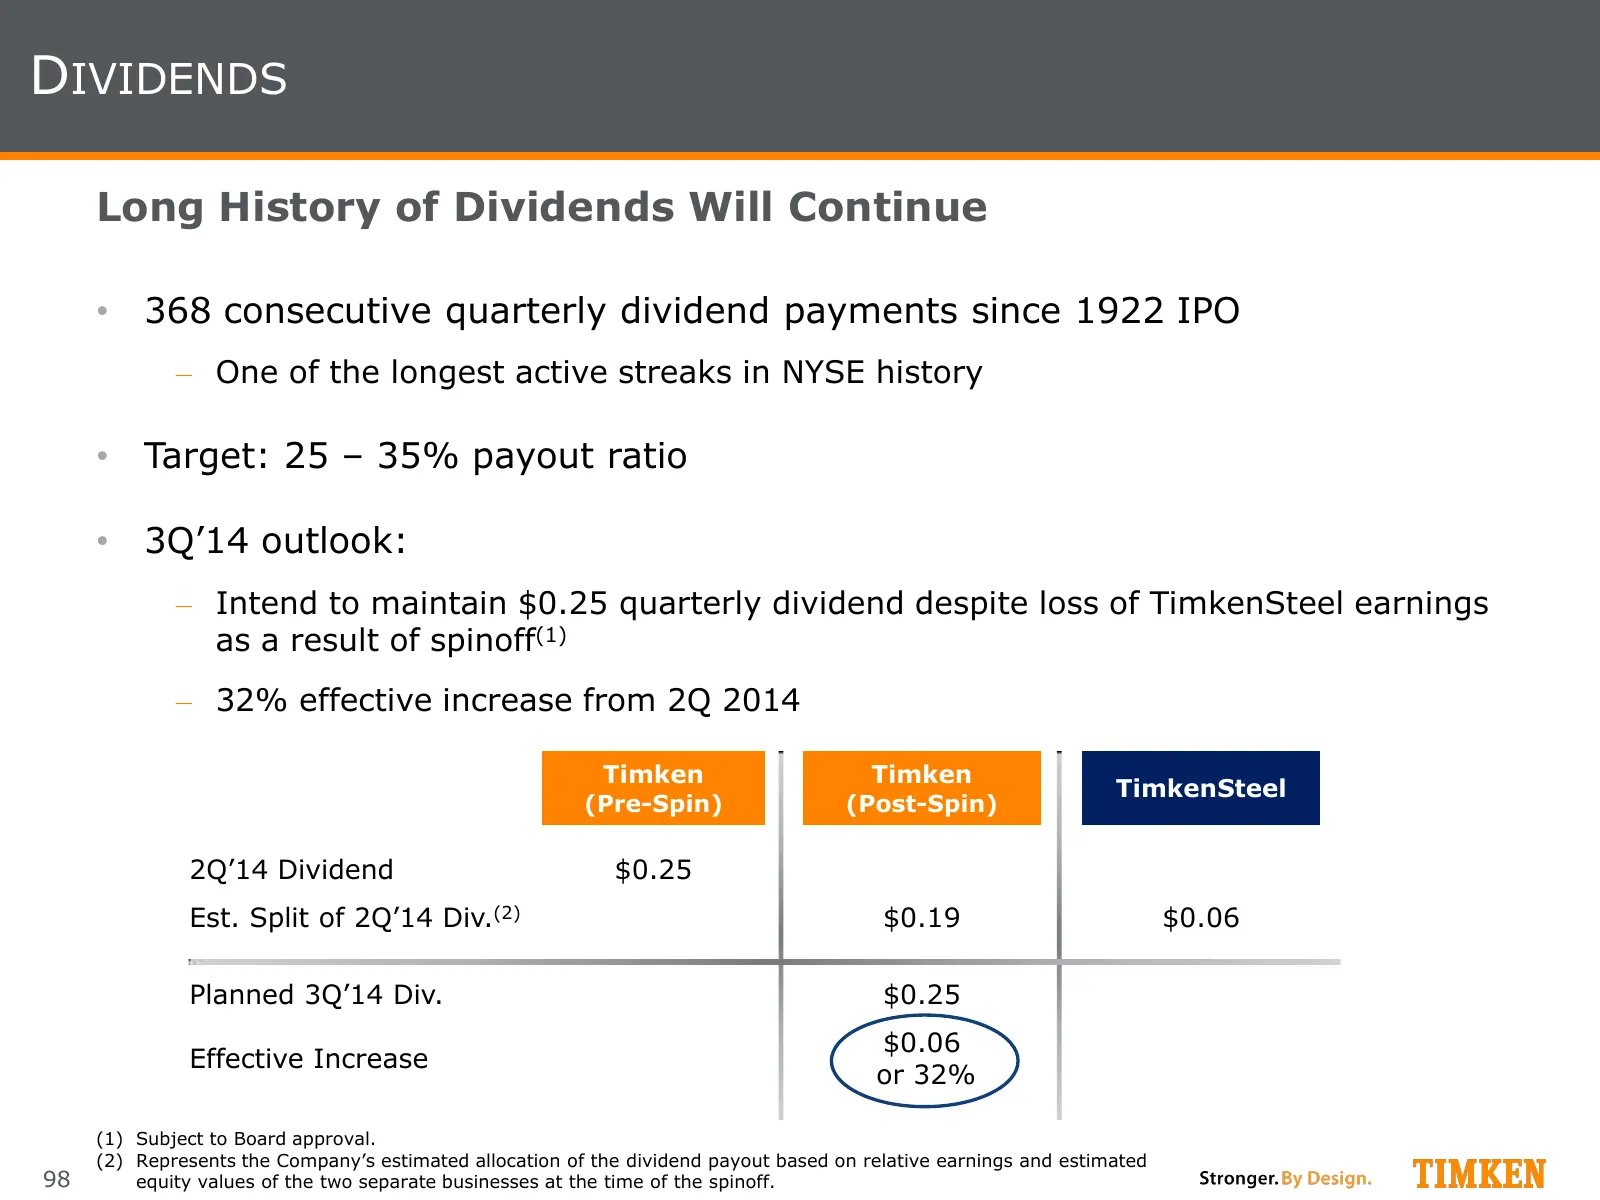
Slide 98: Dividends
DIVIDENDS Long History of Dividends Will Continue • 368 consecutive quarterly dividend payments since 1922 IPO ‒ One of the longest active streaks in NYSE history • Target: 25 – 35% payout ratio • 3Q’14 outlook: ‒ Intend to maintain $0.25 quarterly dividend despite loss of TimkenSteel earnings as a
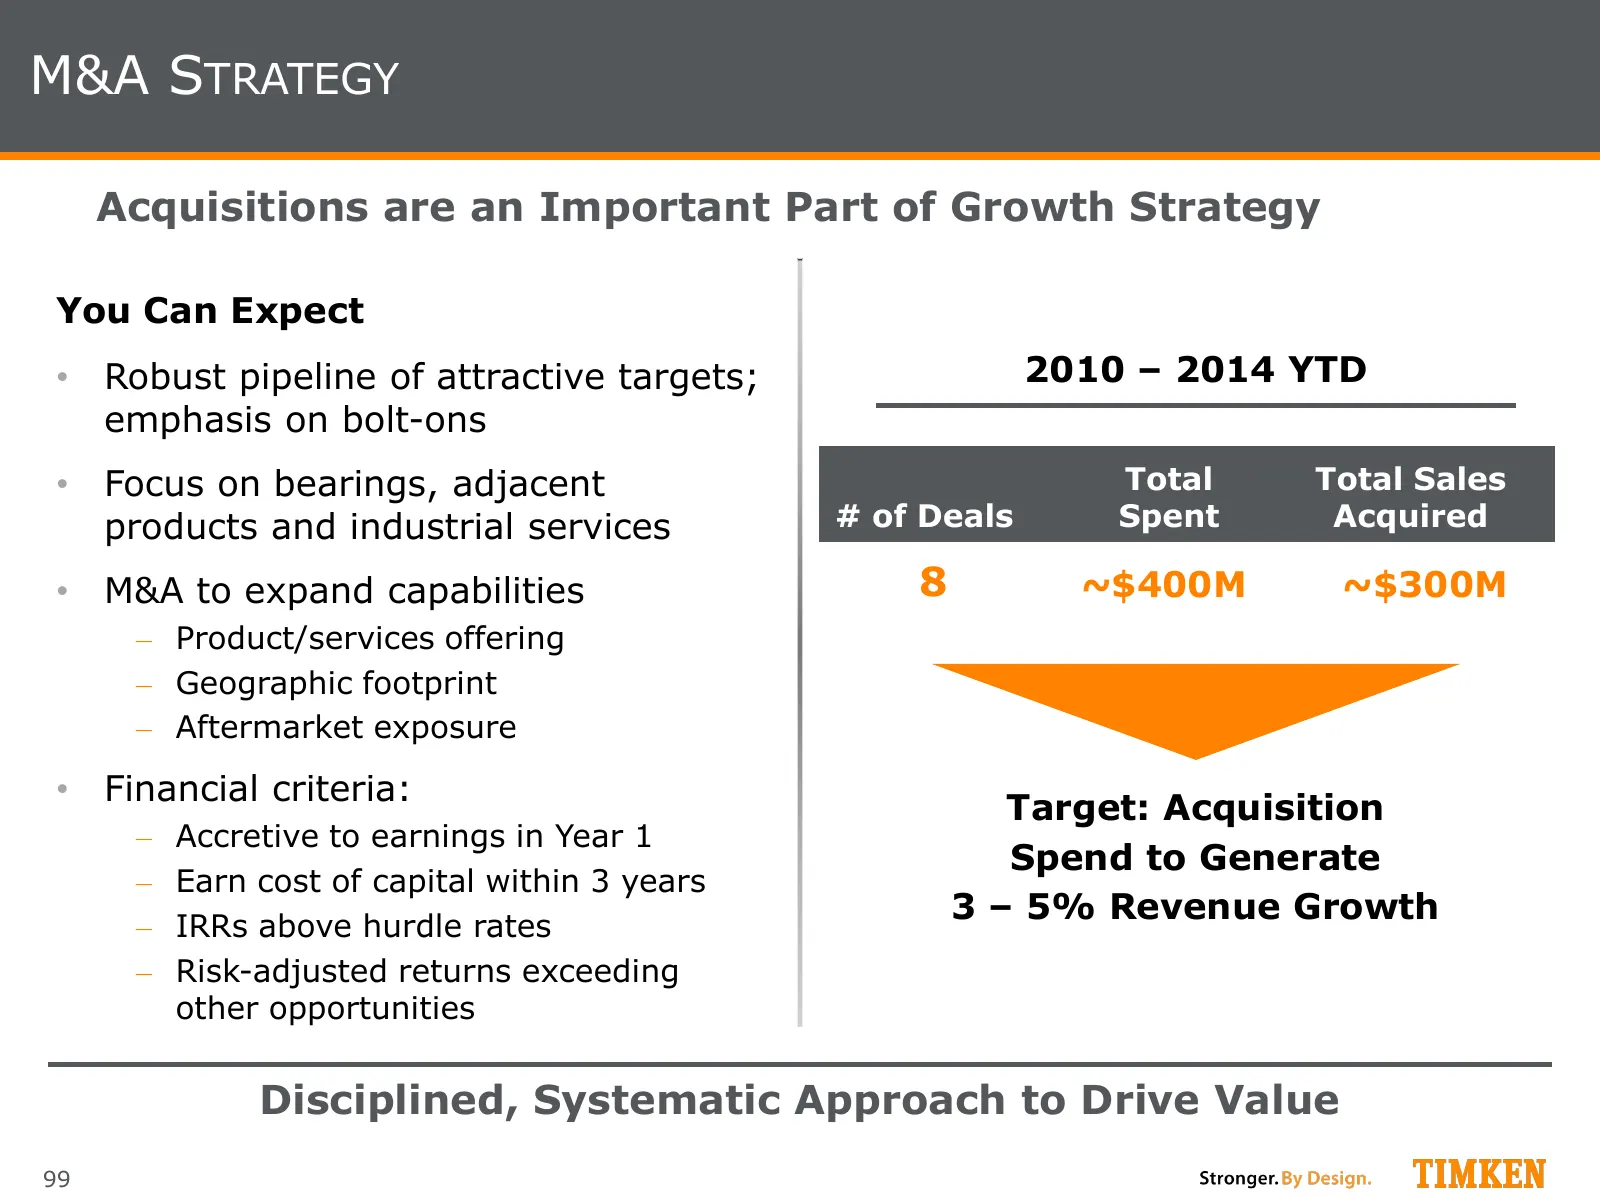
Slide 99: M&A Strategy
M&A STRATEGY Acquisitions are an Important Part of Growth Strategy You Can Expect • Robust pipeline of attractive targets; 2010 – 2014 YTD emphasis on bolt-ons • Focus on bearings, adjacent Total Total Sales products and industrial services # of Deals Spent Acquired • M&A to expand capabilities 8 ~$
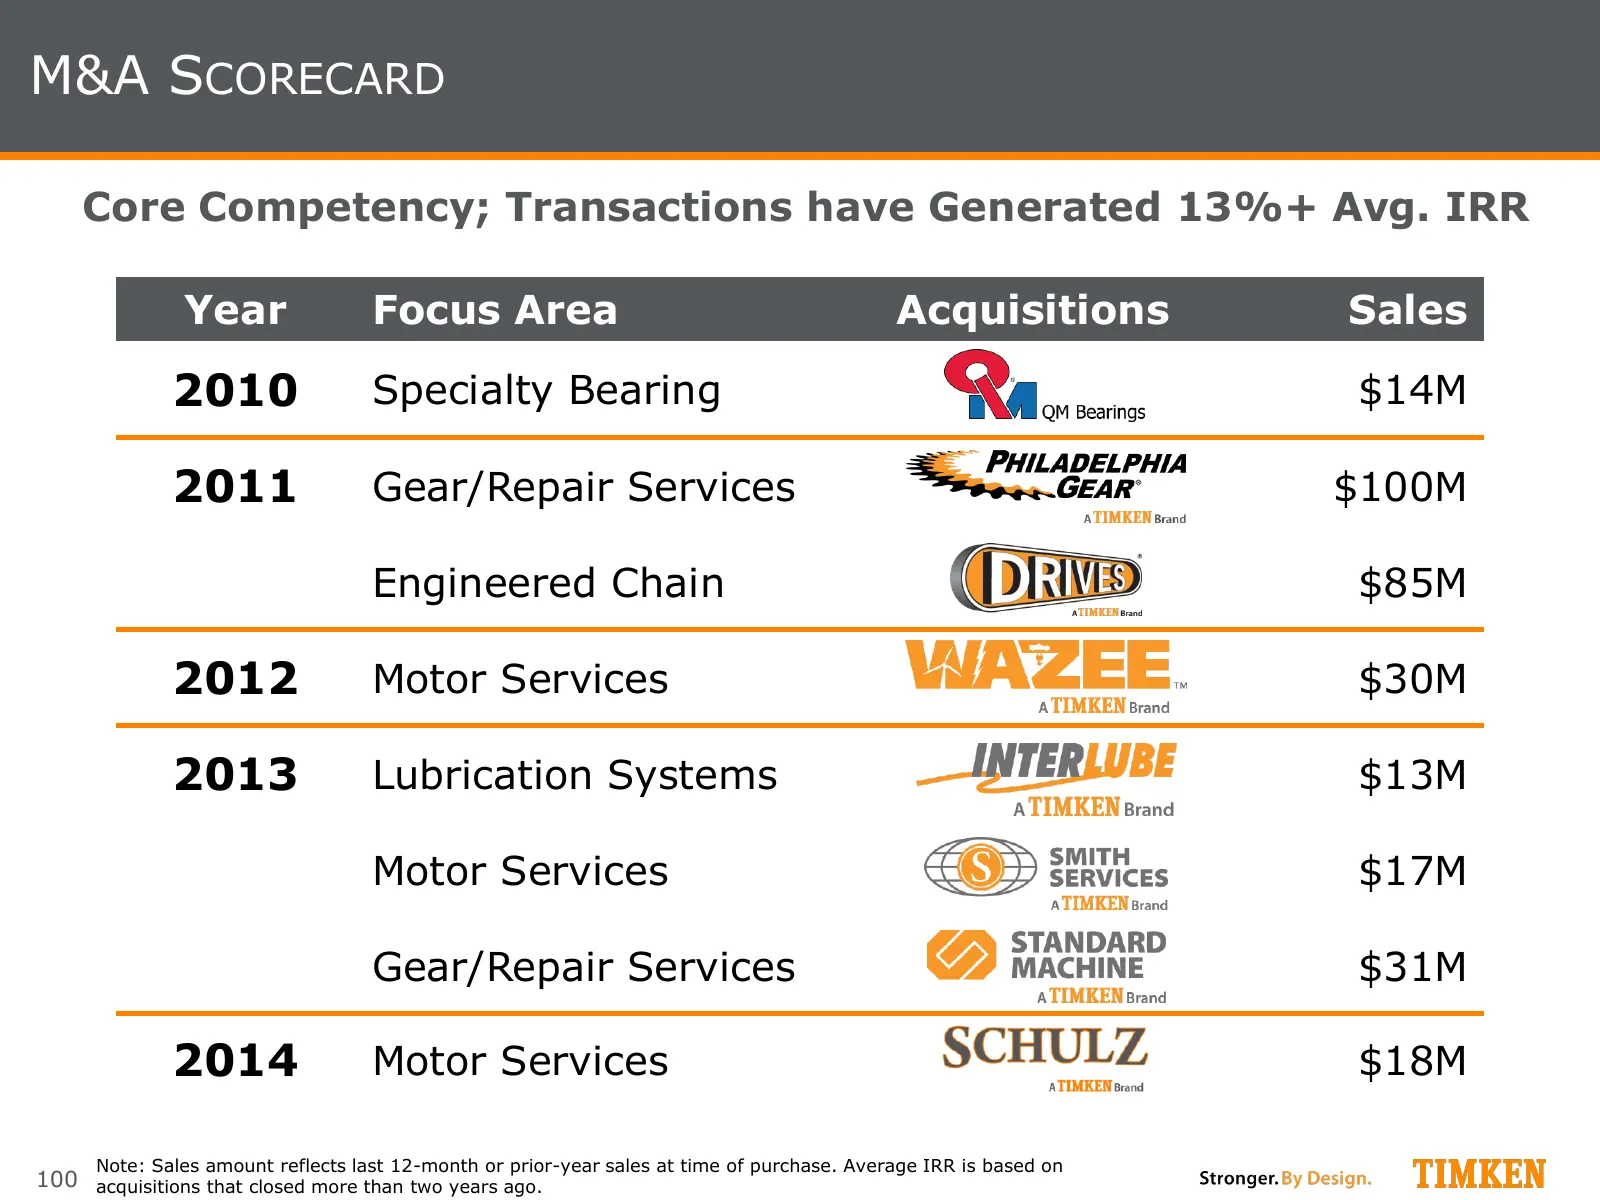
Slide 100: M&A Scorecard
M&A SCORECARD Core Competency; Transactions have Generated 13%+ Avg. IRR Year Focus Area Acquisitions Sales 2010 Specialty Bearing $14M 2011 Gear/Repair Services $100M Engineered Chain $85M 2012 Motor Services $30M 2013 Lubrication Systems $13M Motor Services $17M Gear/Repair Services $31M 2014 Moto
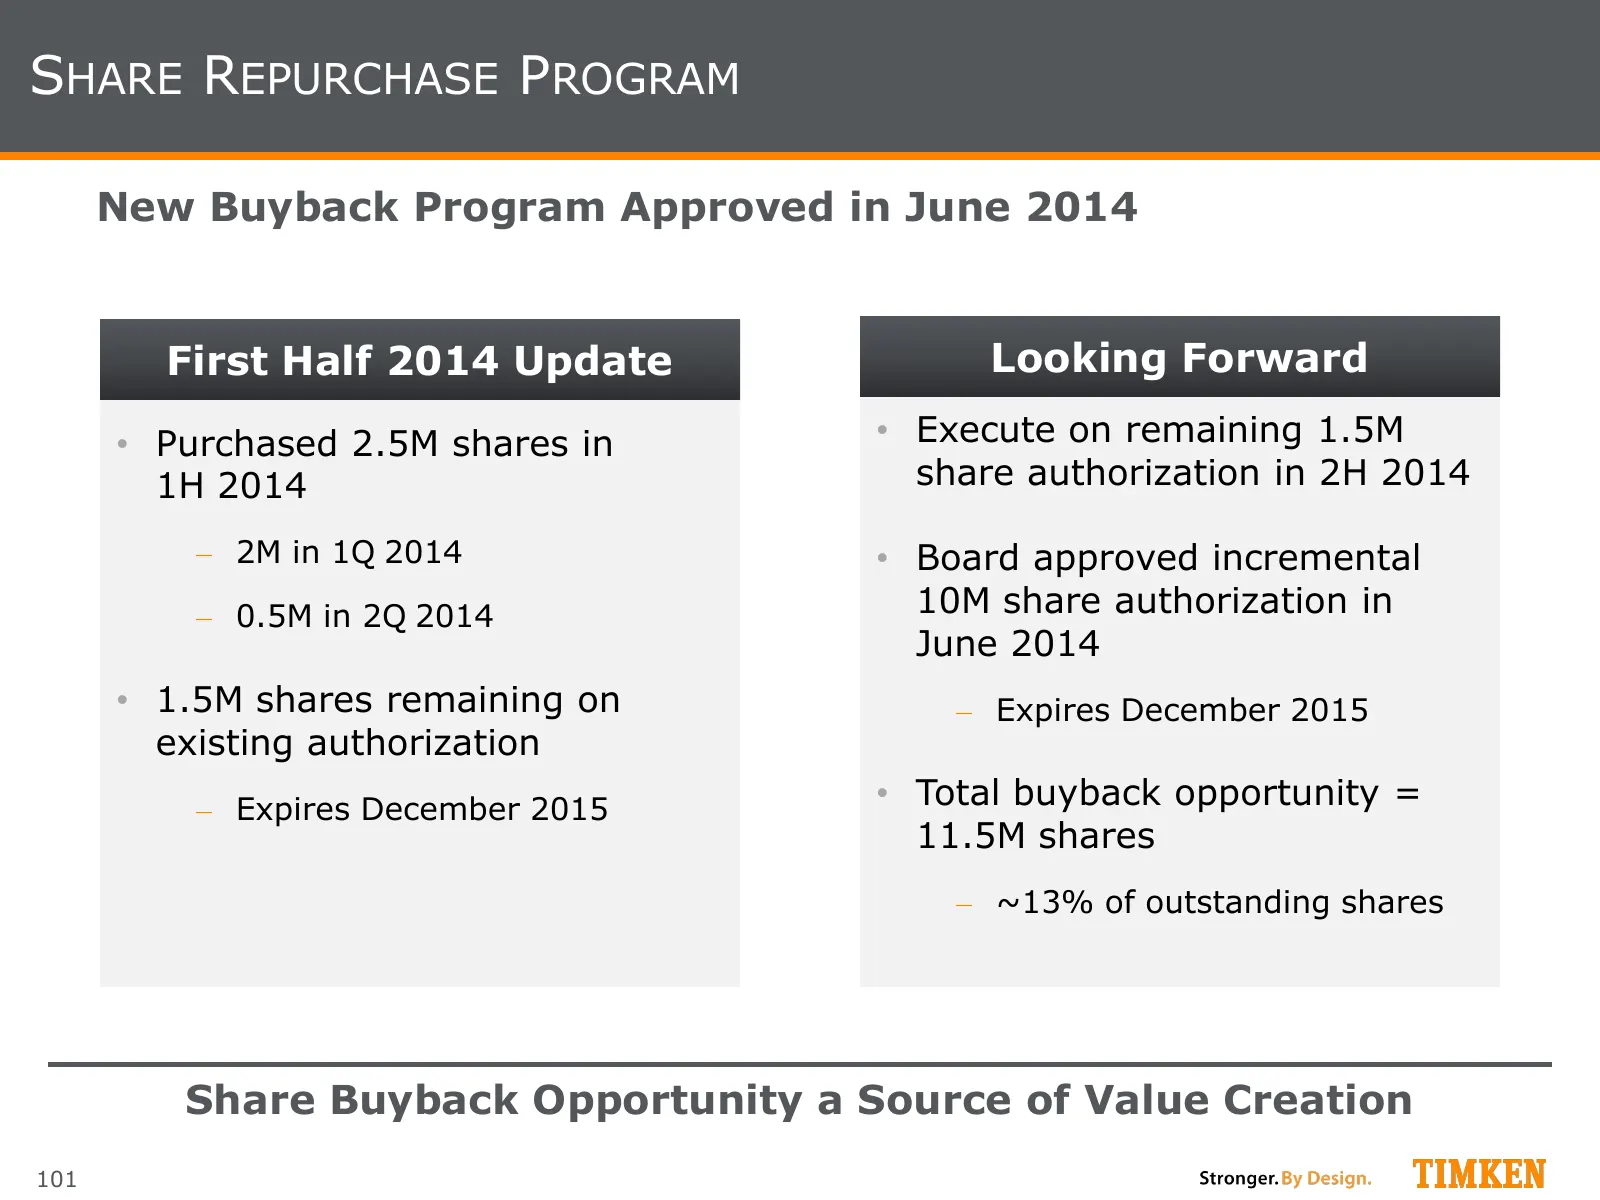
Slide 101: Share Repurchase Program
SHARE REPURCHASE PROGRAM New Buyback Program Approved in June 2014 First Half 2014 Update Looking Forward • Purchased 2.5M shares in • Execute on remaining 1.5M 1H 2014 share authorization in 2H 2014 ‒ 2M in 1Q 2014 • Board approved incremental ‒ 0.5M in 2Q 2014 10M share authorization in June 2014
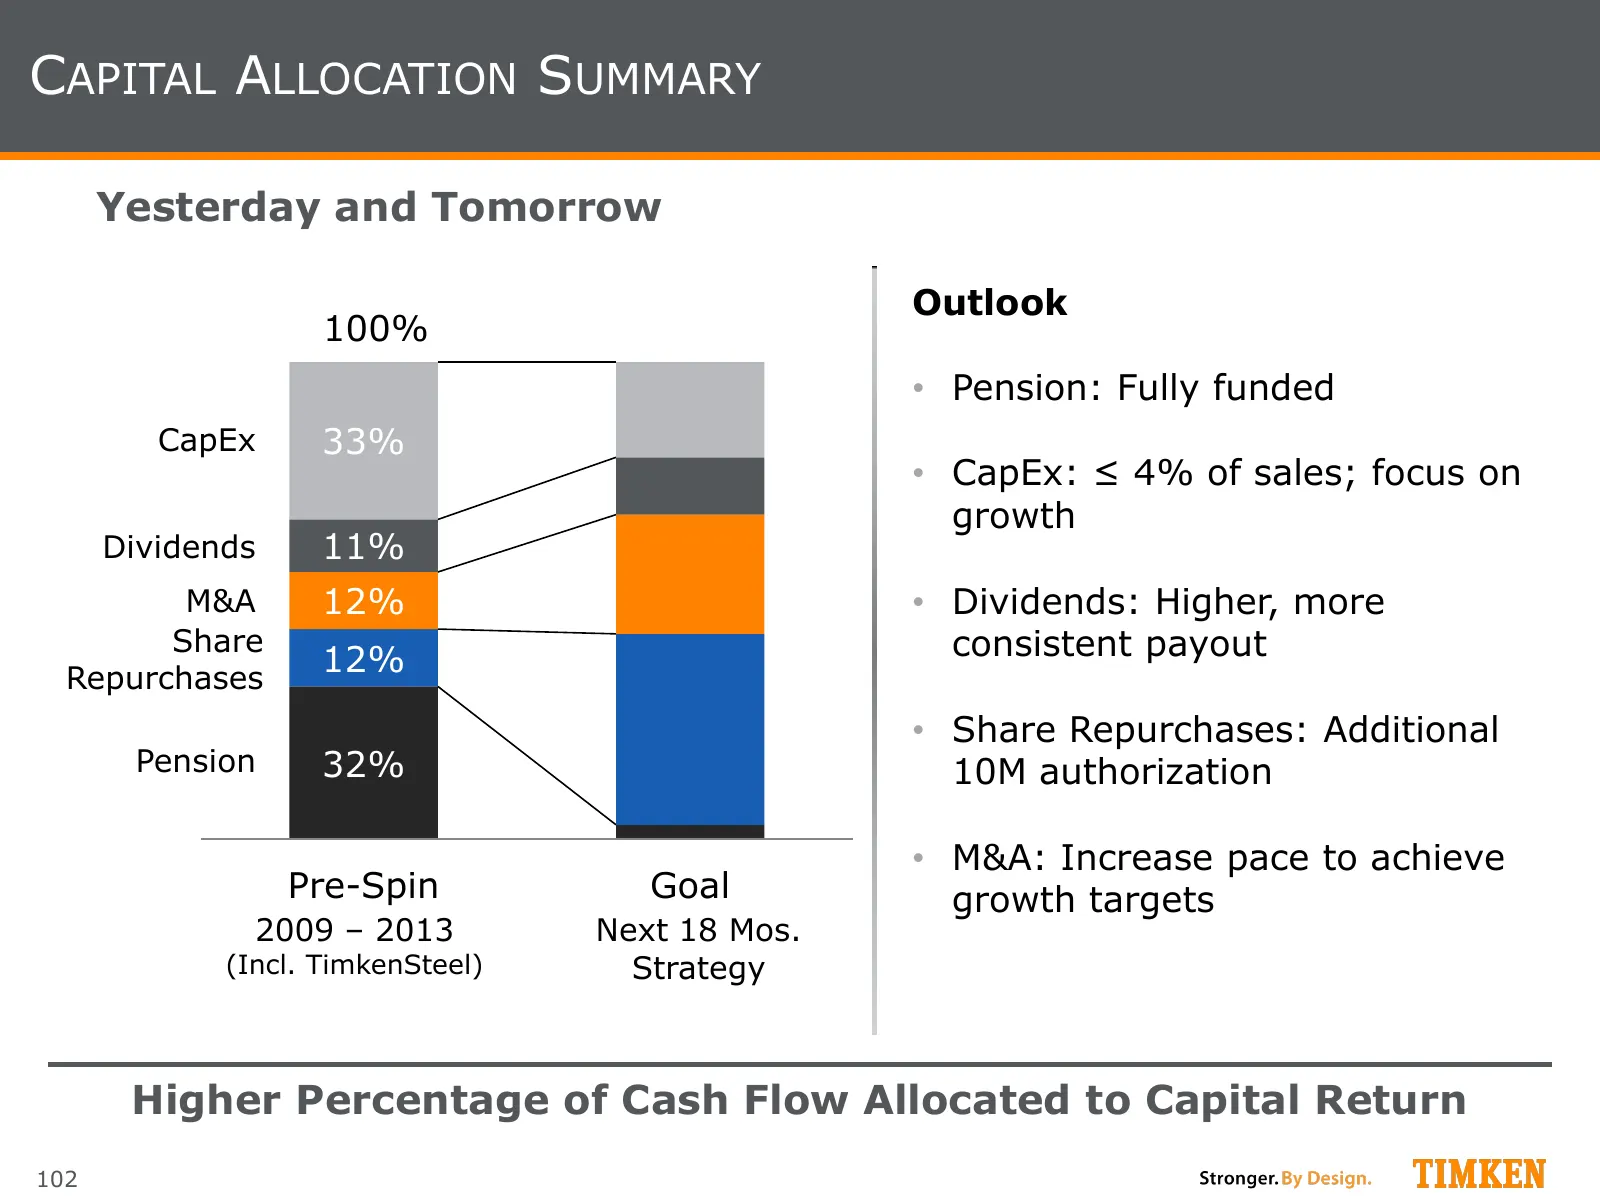
Slide 102: Capital Allocation Summary
CAPITAL ALLOCATION SUMMARY Yesterday and Tomorrow Outlook 100% • Pension: Fully funded CapEx 33% • CapEx: ≤ 4% of sales; focus on growth Dividends 11% M&A 12% • Dividends: Higher, more Share consistent payout Repurchases 12% • Share Repurchases: Additional Pension 32% 10M authorization • M&A: Increa
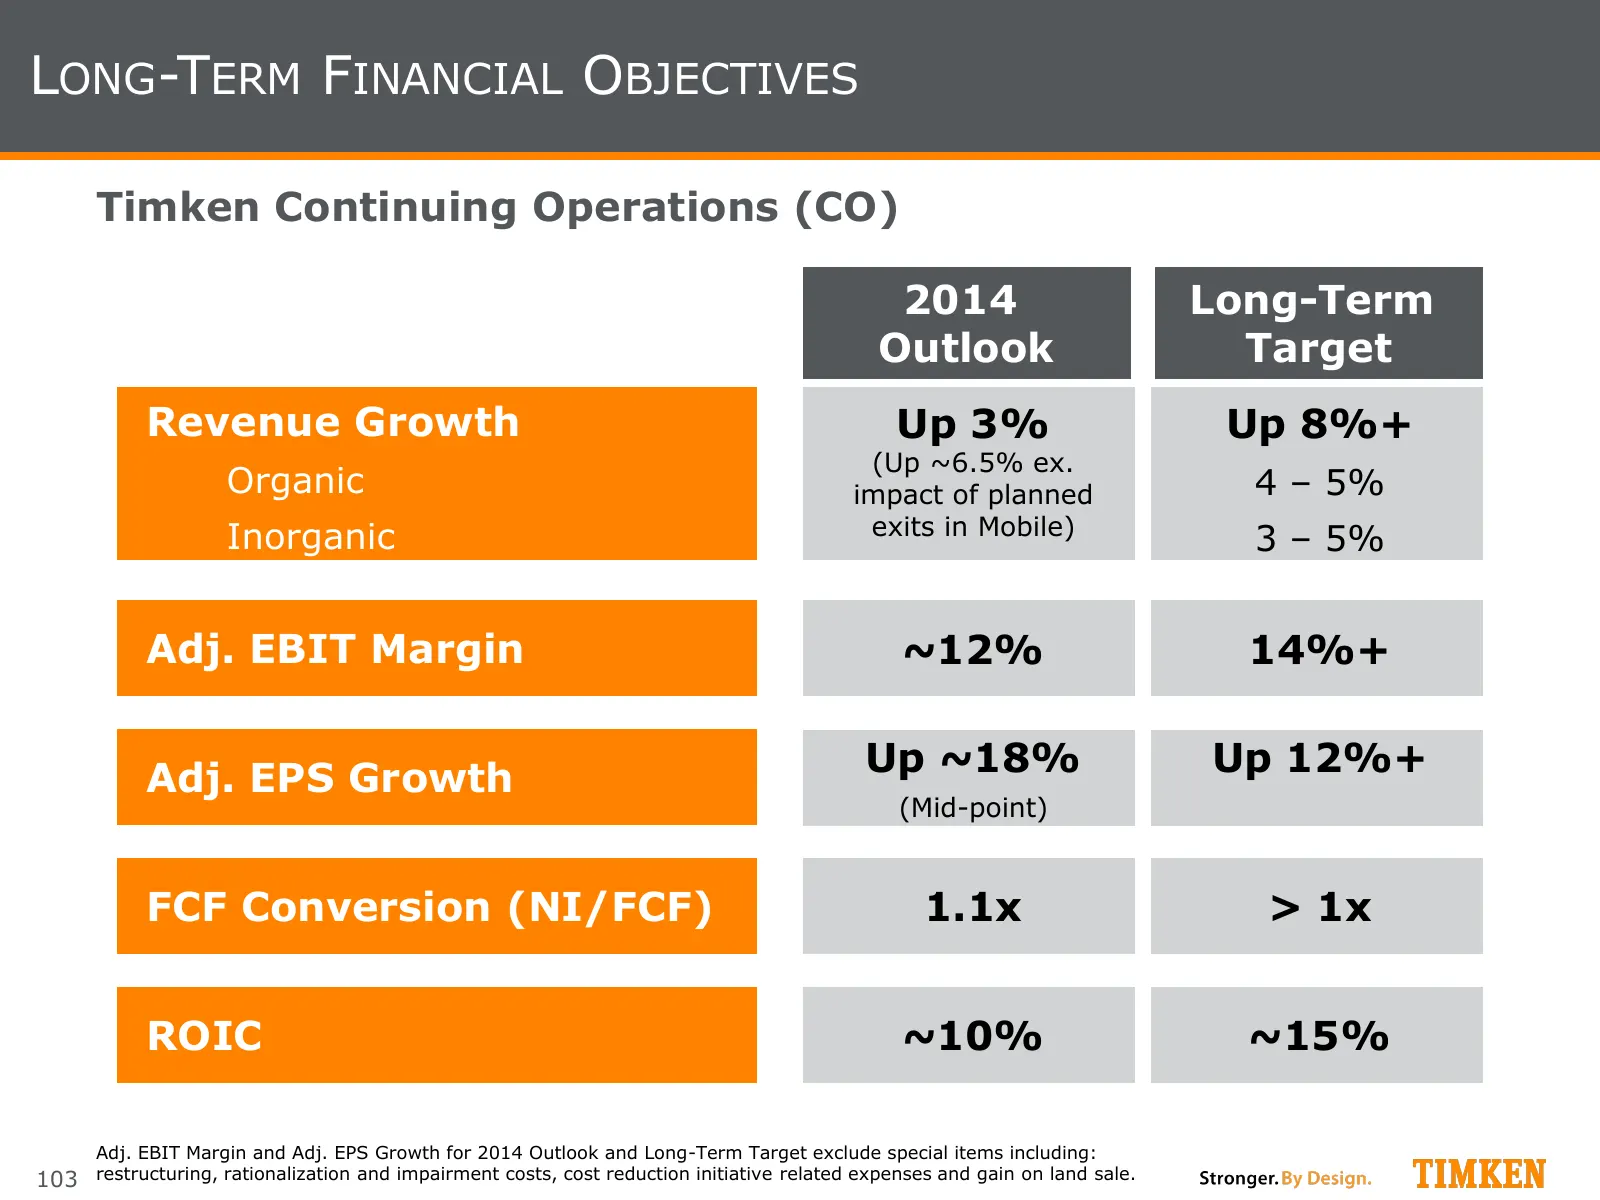
Slide 103: Long-Term Financial Objectives
LONG-TERM FINANCIAL OBJECTIVES Timken Continuing Operations (CO) 2014 Long-Term Outlook Target Revenue Growth Up 3% Up 8%+ (Up ~6.5% ex. Organic impact of planned 4 – 5% Inorganic exits in Mobile) 3 – 5% Adj. EBIT Margin ~12% 14%+ Adj. EPS Growth Up ~18% Up 12%+ (Mid-point) FCF Conversion (NI/FCF) 1
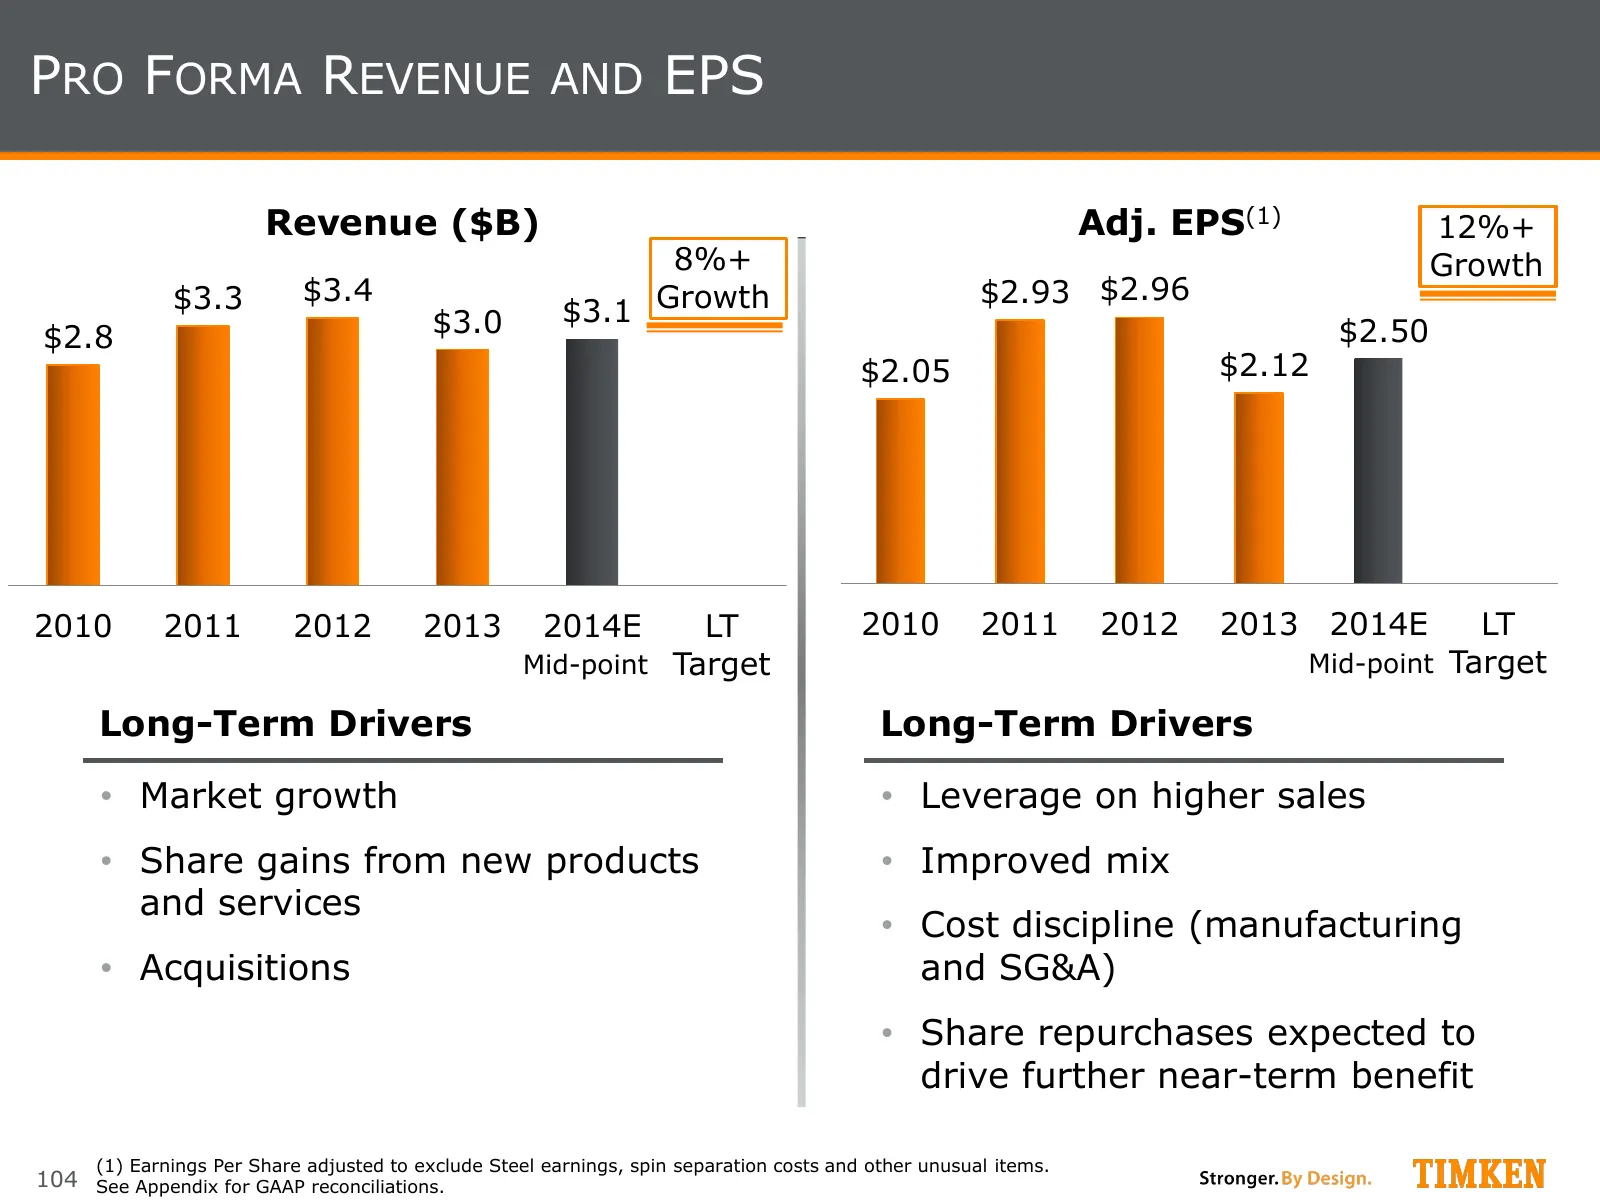
Slide 104: Pro Forma Revenue and EPS
PRO FORMA REVENUE AND EPS Revenue ($B) Adj. EPS(1) 12%+ 8%+ Growth $3.4 $2.93 $2.96 $3.3 $3.0 $3.1 Growth $2.8 $2.50 $2.05 $2.12 2010 2011 2012 2013 2014E LT 2010 2011 2012 2013 2014E LT Mid-point Target Mid-point Target Long-Term Drivers Long-Term Drivers • Market growth • Leverage on higher sales
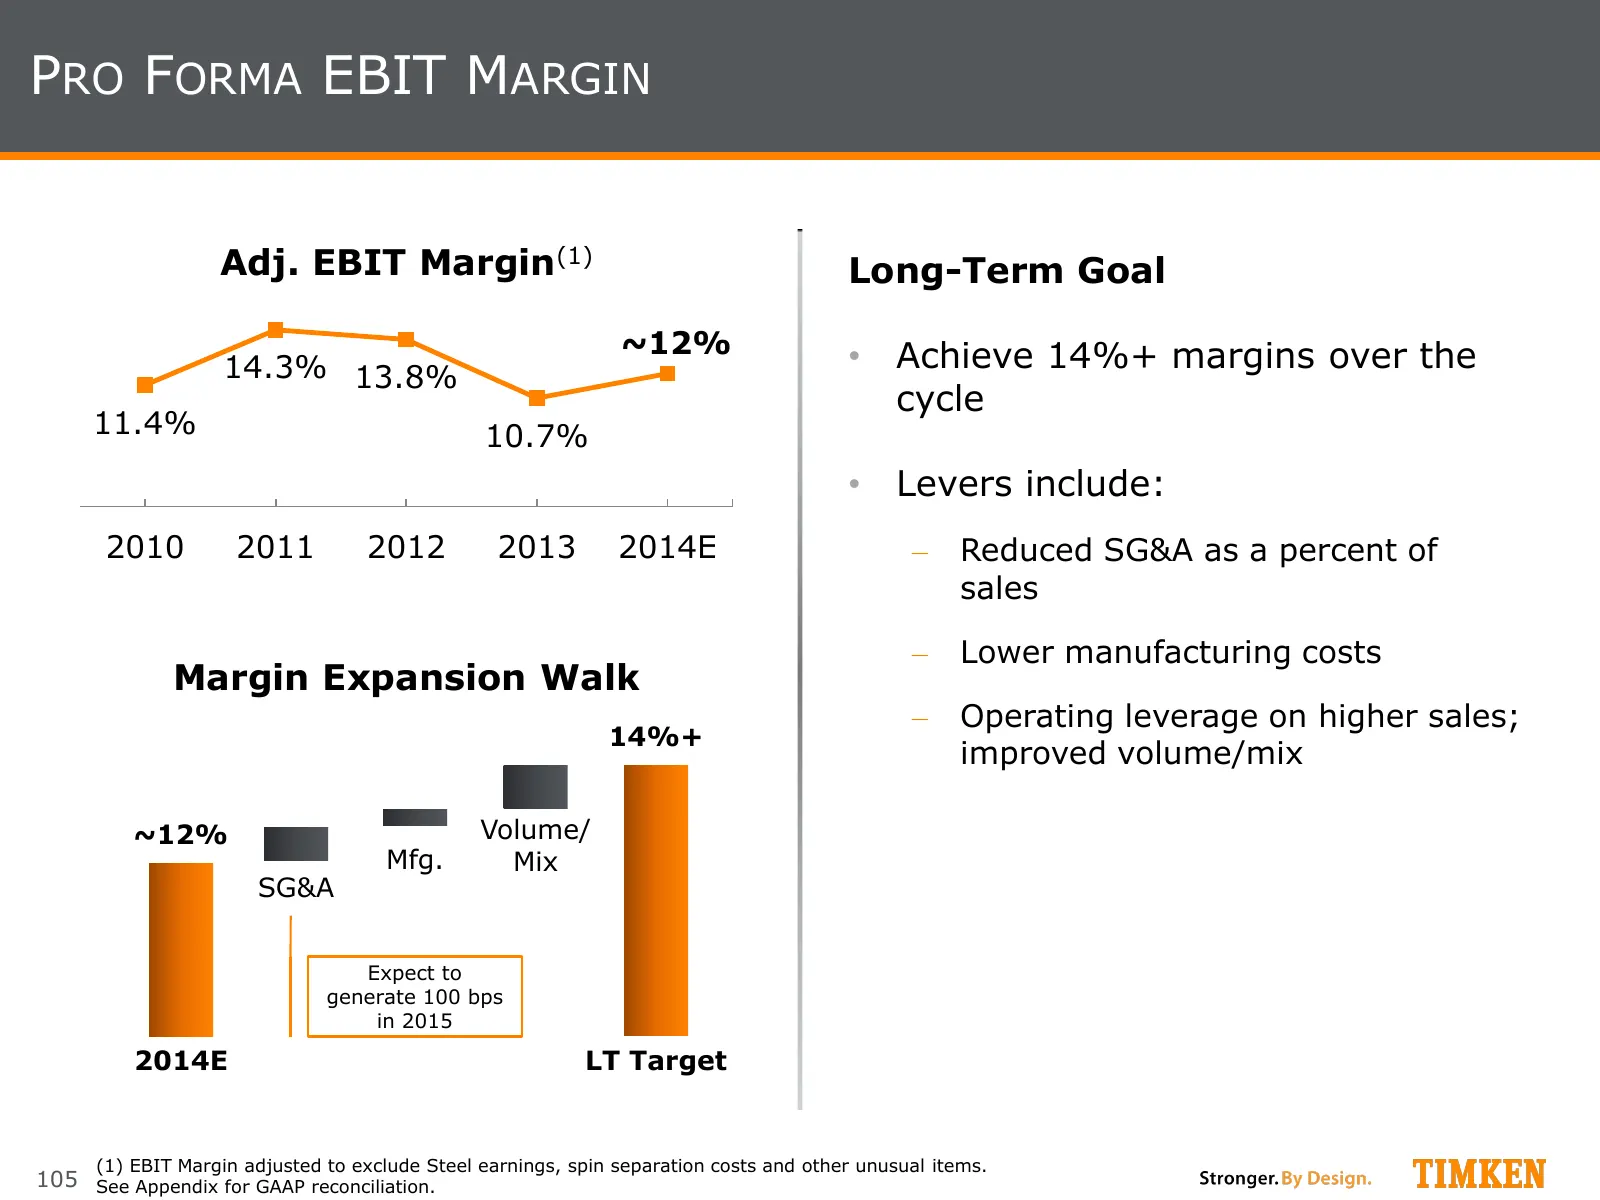
Slide 105: Pro Forma EBIT Margin
PRO FORMA EBIT MARGIN Adj. EBIT Margin(1) Long-Term Goal ~12% • Achieve 14%+ margins over the 14.3% 13.8% cycle 11.4% 10.7% • Levers include: 2010 2011 2012 2013 2014E ‒ Reduced SG&A as a percent of sales ‒ Lower manufacturing costs Margin Expansion Walk ‒ Operating leverage on higher sales; 14%+ im
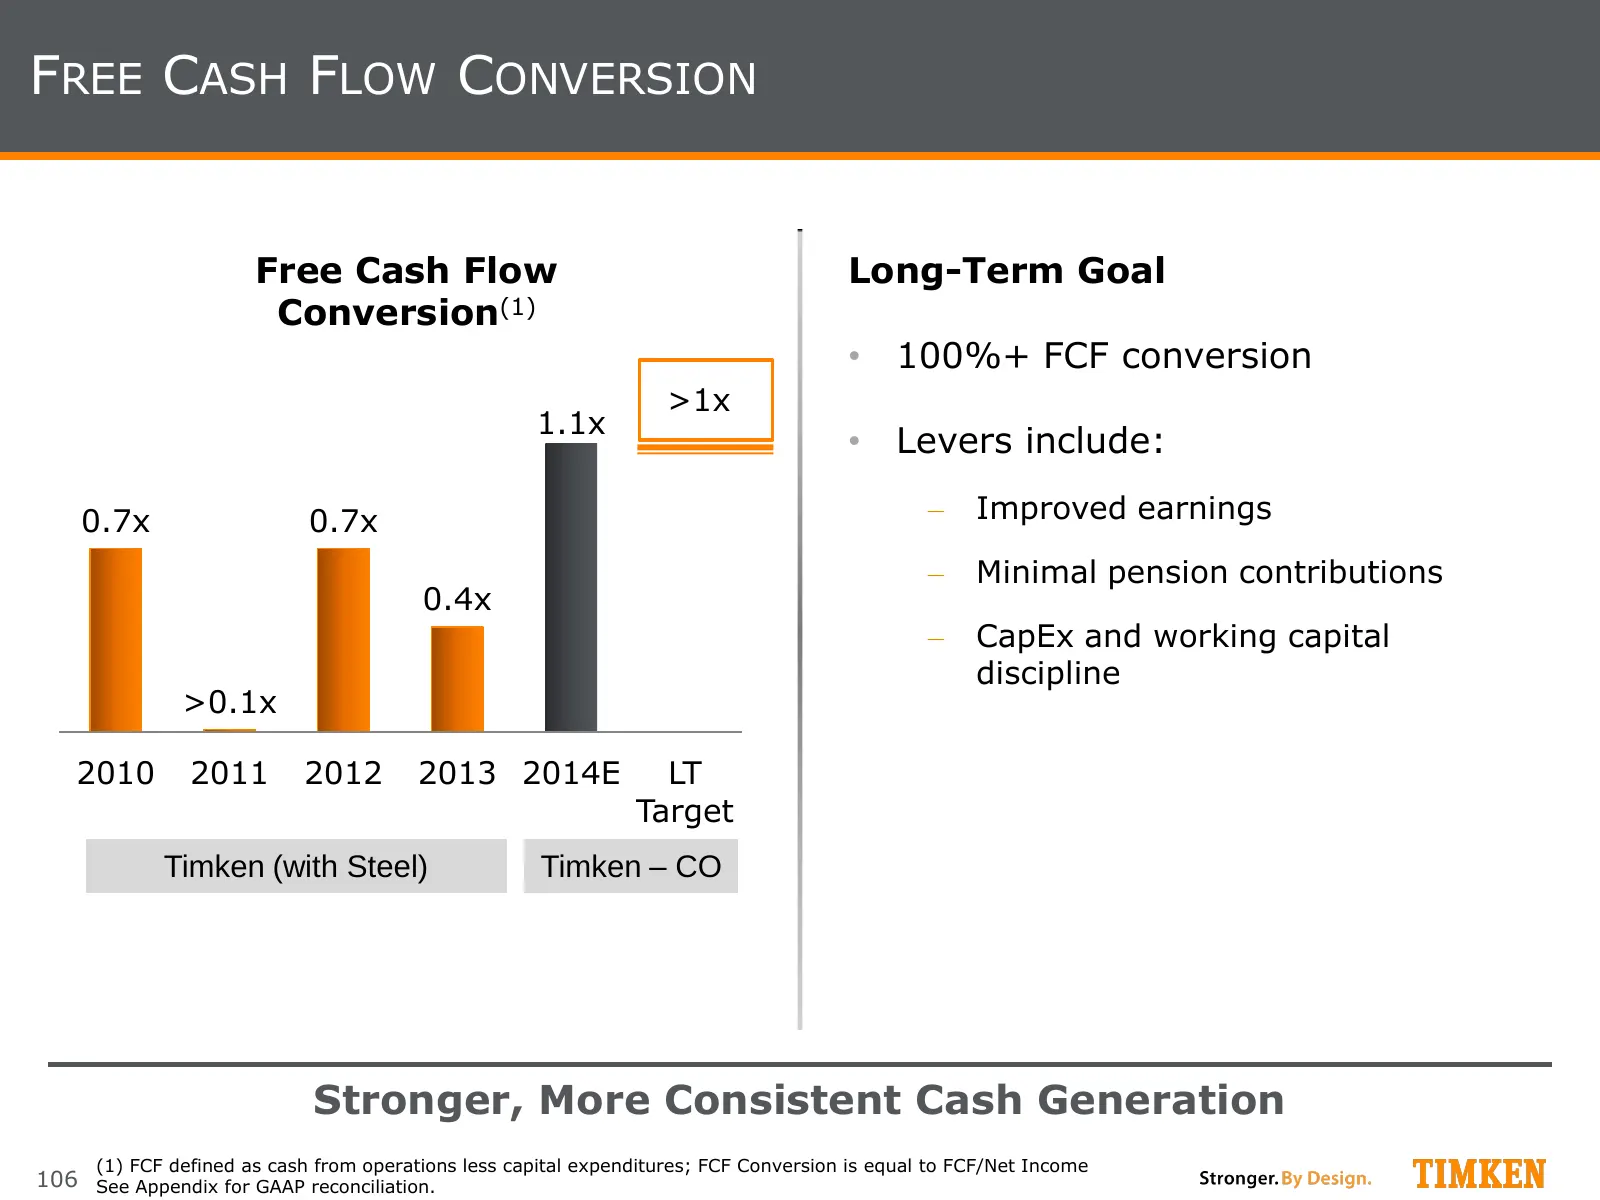
Slide 106: Free Cash Flow Conversion
FREE CASH FLOW CONVERSION Free Cash Flow Long-Term Goal Conversion(1) • 100%+ FCF conversion >1x 1.1x • Levers include: 0.7x 0.7x ‒ Improved earnings ‒ Minimal pension contributions 0.4x ‒ CapEx and working capital discipline >0.1x 2010 2011 2012 2013 2014E LT Target Timken (with Steel) Timken – CO
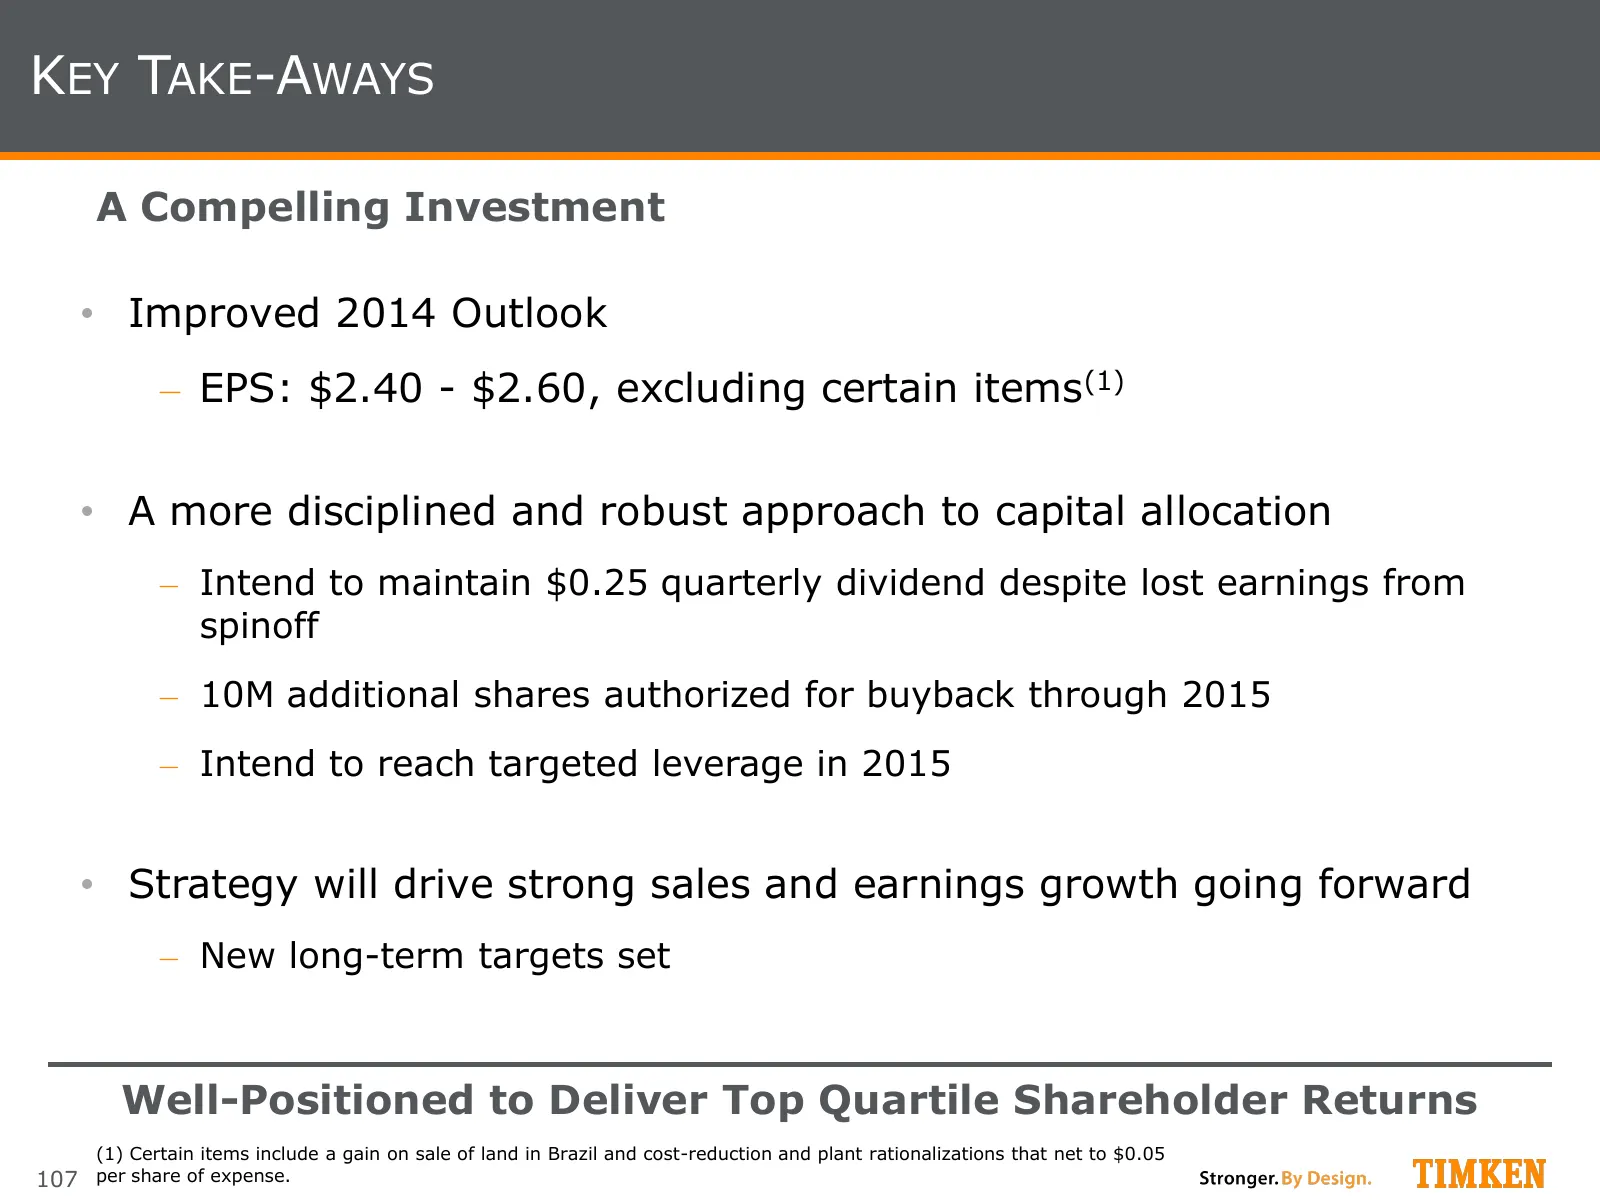
Slide 107: Key Take-Aways
KEY TAKE-AWAYS A Compelling Investment • Improved 2014 Outlook ‒ EPS: $2.40 - $2.60, excluding certain items(1) • A more disciplined and robust approach to capital allocation ‒ Intend to maintain $0.25 quarterly dividend despite lost earnings from spinoff ‒ 10M additional shares authorized for buyba
Slide 108: Building on the Momentum
Building on the Momentum
Slide 109: Investment Summary
INVESTMENT SUMMARY Timken is a Compelling Investment… • High-Margin Business Based on Differentiated Business Model ‒ Fragmented, diverse end markets and customers ‒ Attractive mix ‒ Global growth opportunity • Strong Management Team Focused on Results • Improved Cash Generation • Mobile Exits Compl
Slide 110: Executive Bios
Stronger. By Design. Executive Bios
Slide 111: John M. Timken Jr., Chairman, Board of Directors
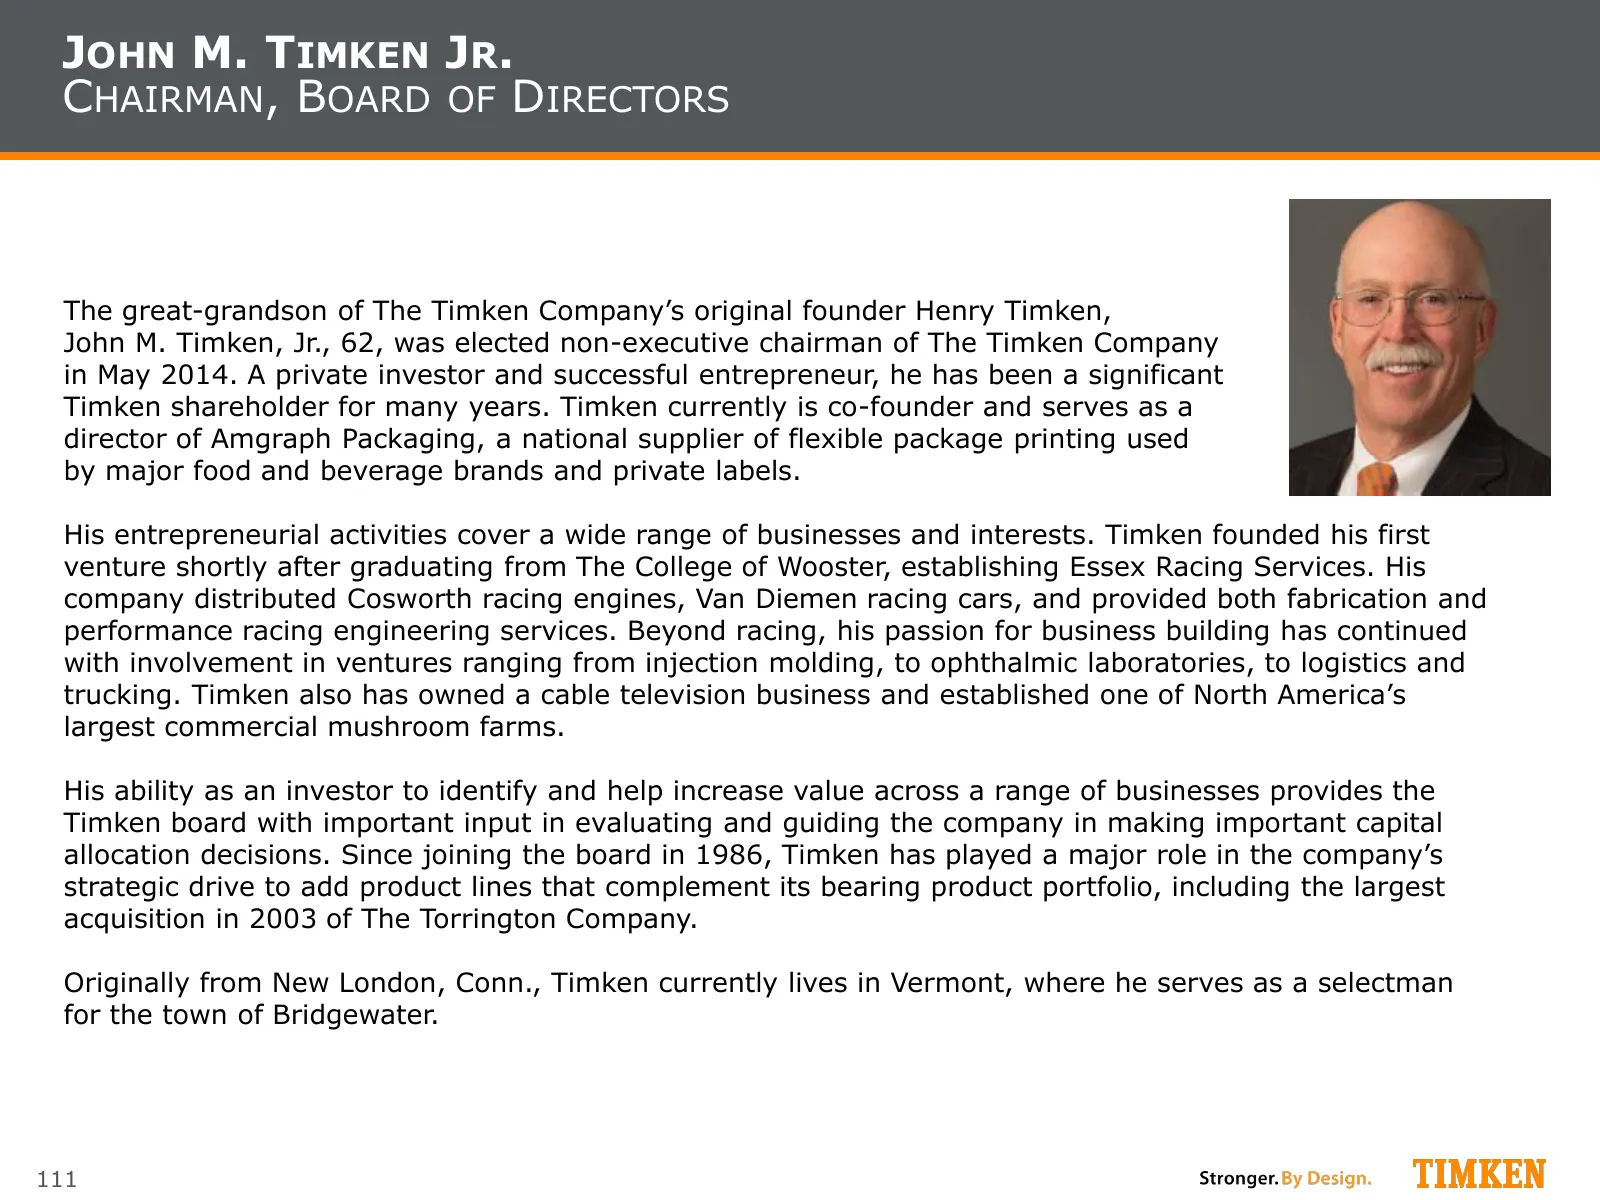
JOHN M. TIMKEN JR. CHAIRMAN, BOARD OF DIRECTORS The great-grandson of The Timken Company’s original founder Henry Timken, John M. Timken, Jr., 62, was elected non-executive chairman of The Timken Company in May 2014. A private investor and successful entrepreneur, he has been a significant Timken sh
Slide 112: Richard G. Kyle, President and CEO
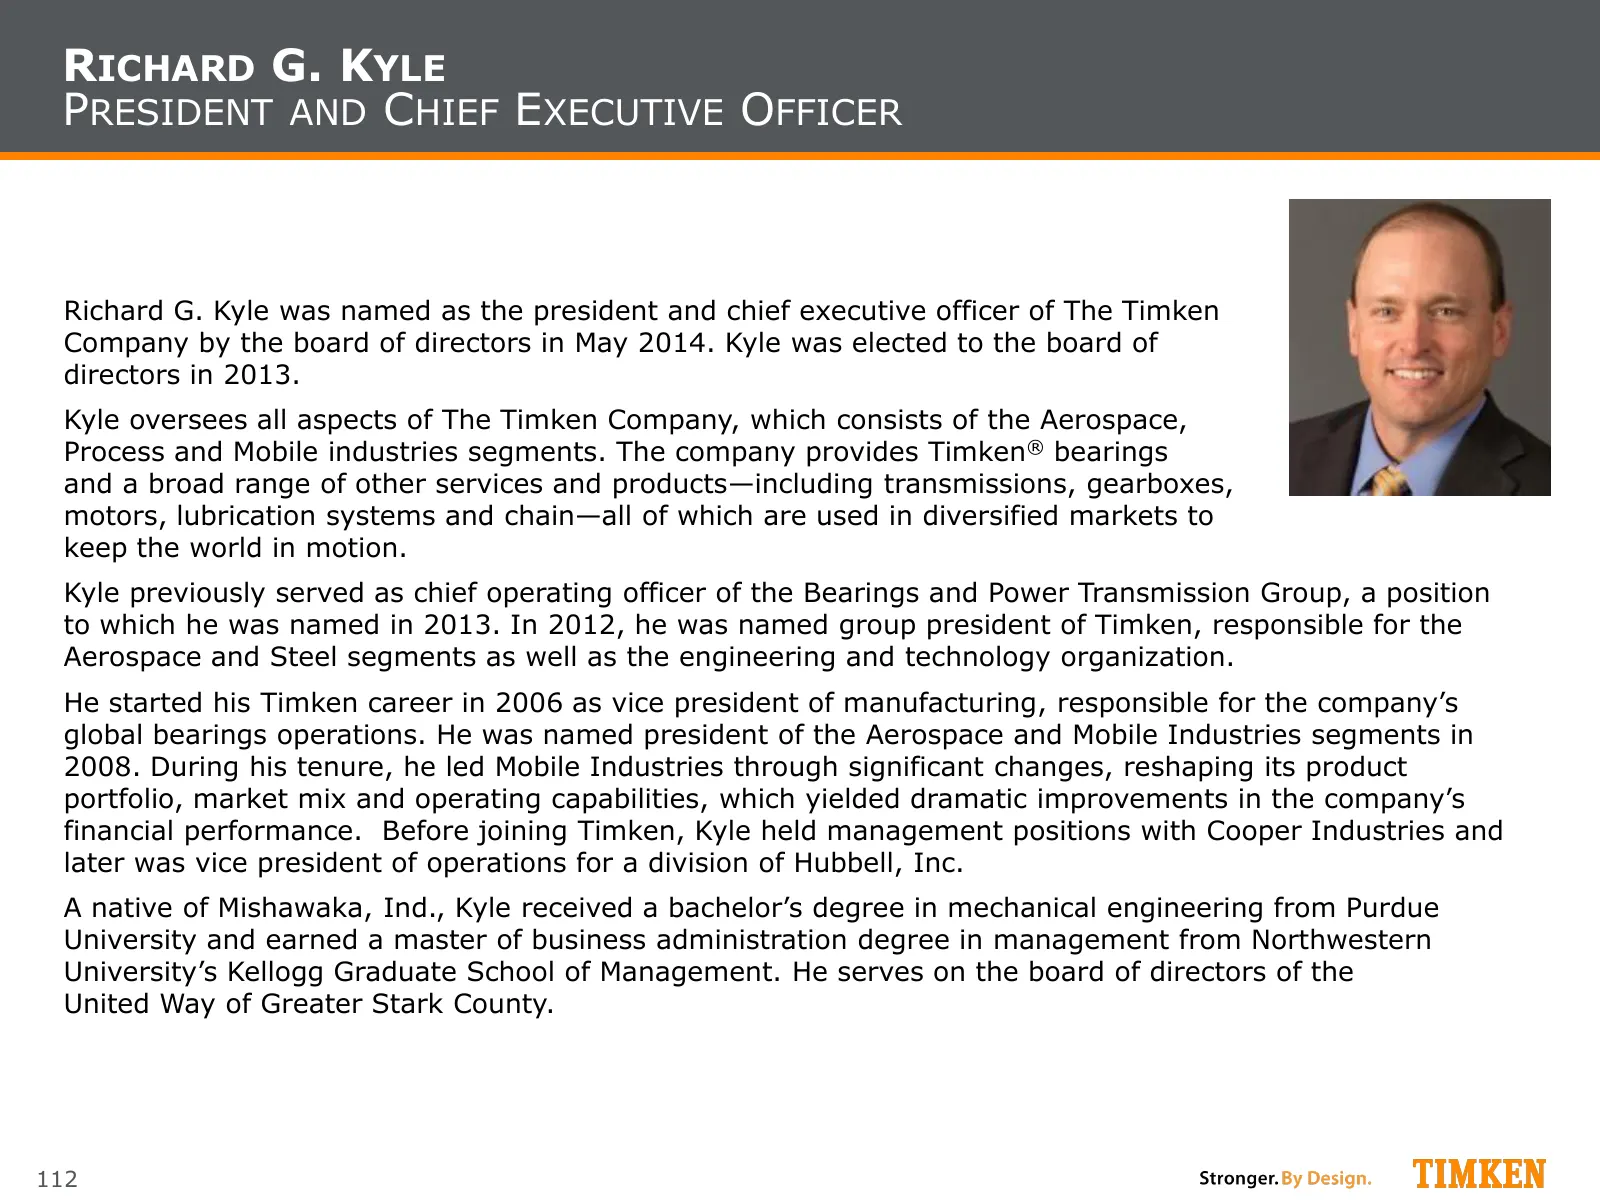
RICHARD G. KYLE PRESIDENT AND CHIEF EXECUTIVE OFFICER Richard G. Kyle was named as the president and chief executive officer of The Timken Company by the board of directors in May 2014. Kyle was elected to the board of directors in 2013. Kyle oversees all aspects of The Timken Company, which consist
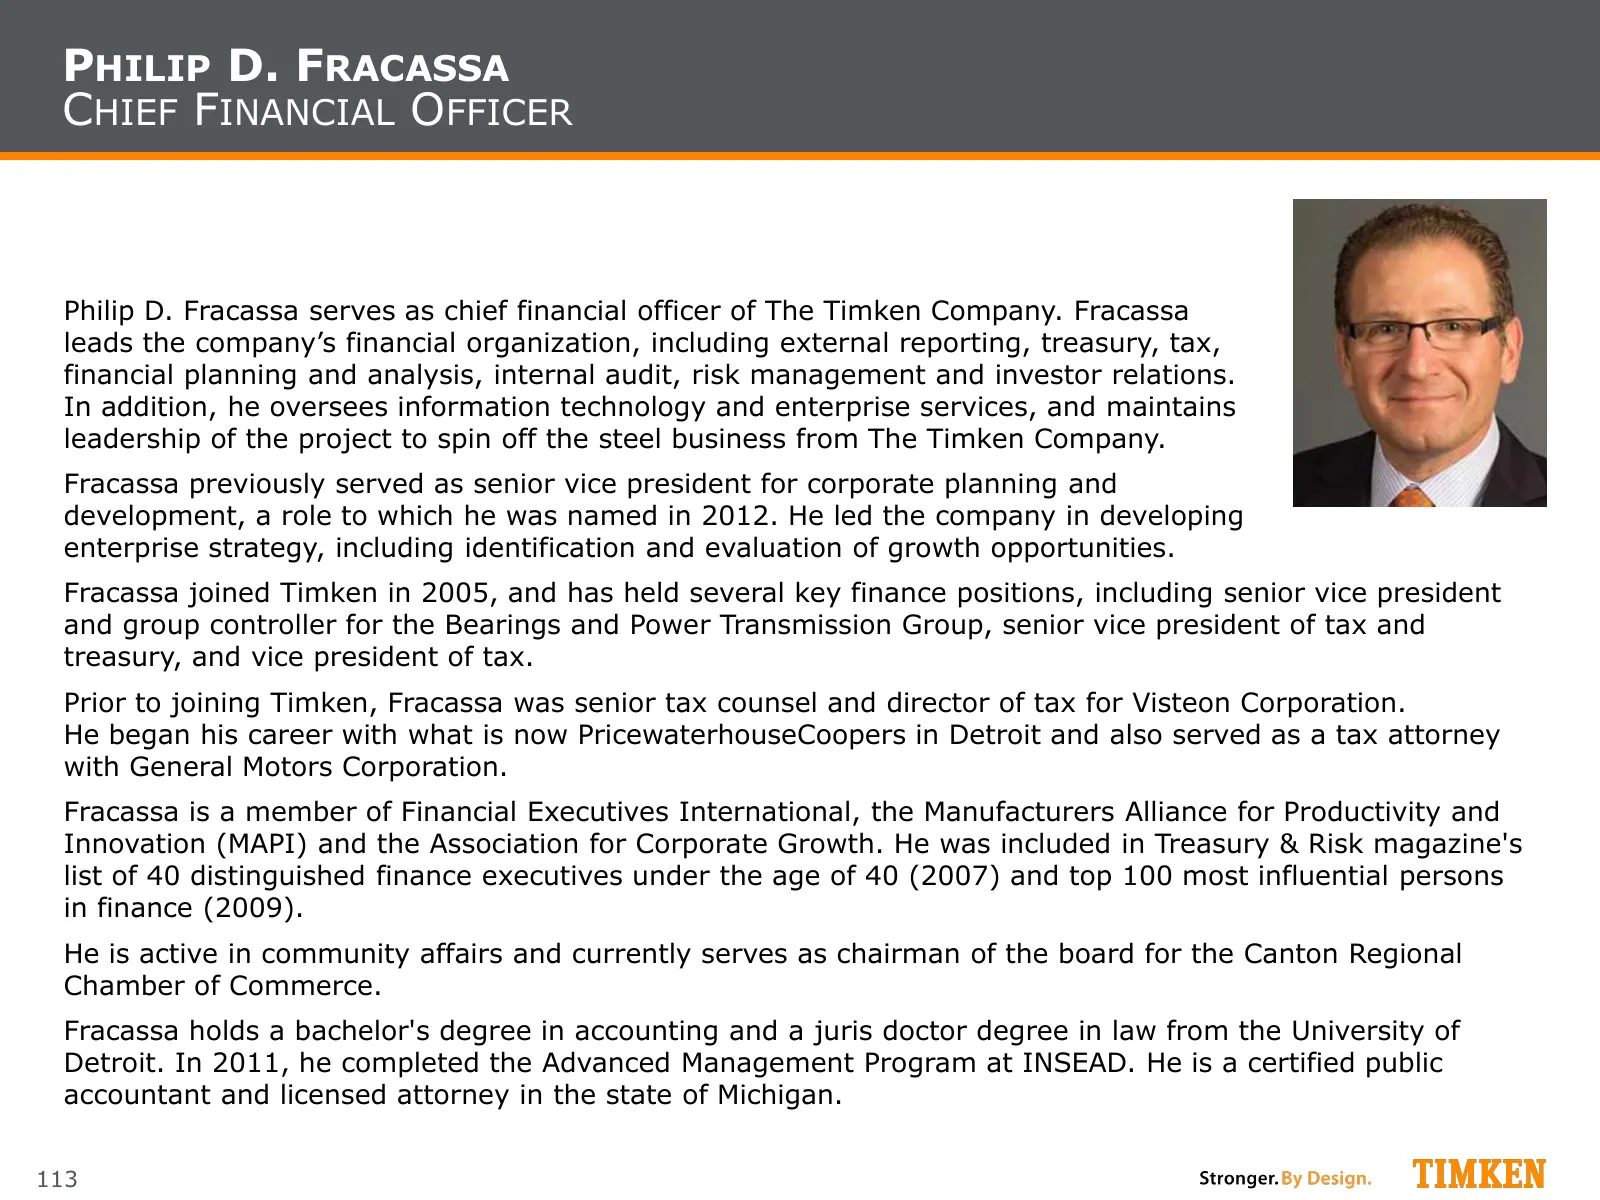
Slide 113: Philip D. Fracassa, Chief Financial Officer
PHILIP D. FRACASSA CHIEF FINANCIAL OFFICER Philip D. Fracassa serves as chief financial officer of The Timken Company. Fracassa leads the company’s financial organization, including external reporting, treasury, tax, financial planning and analysis, internal audit, risk management and investor relat
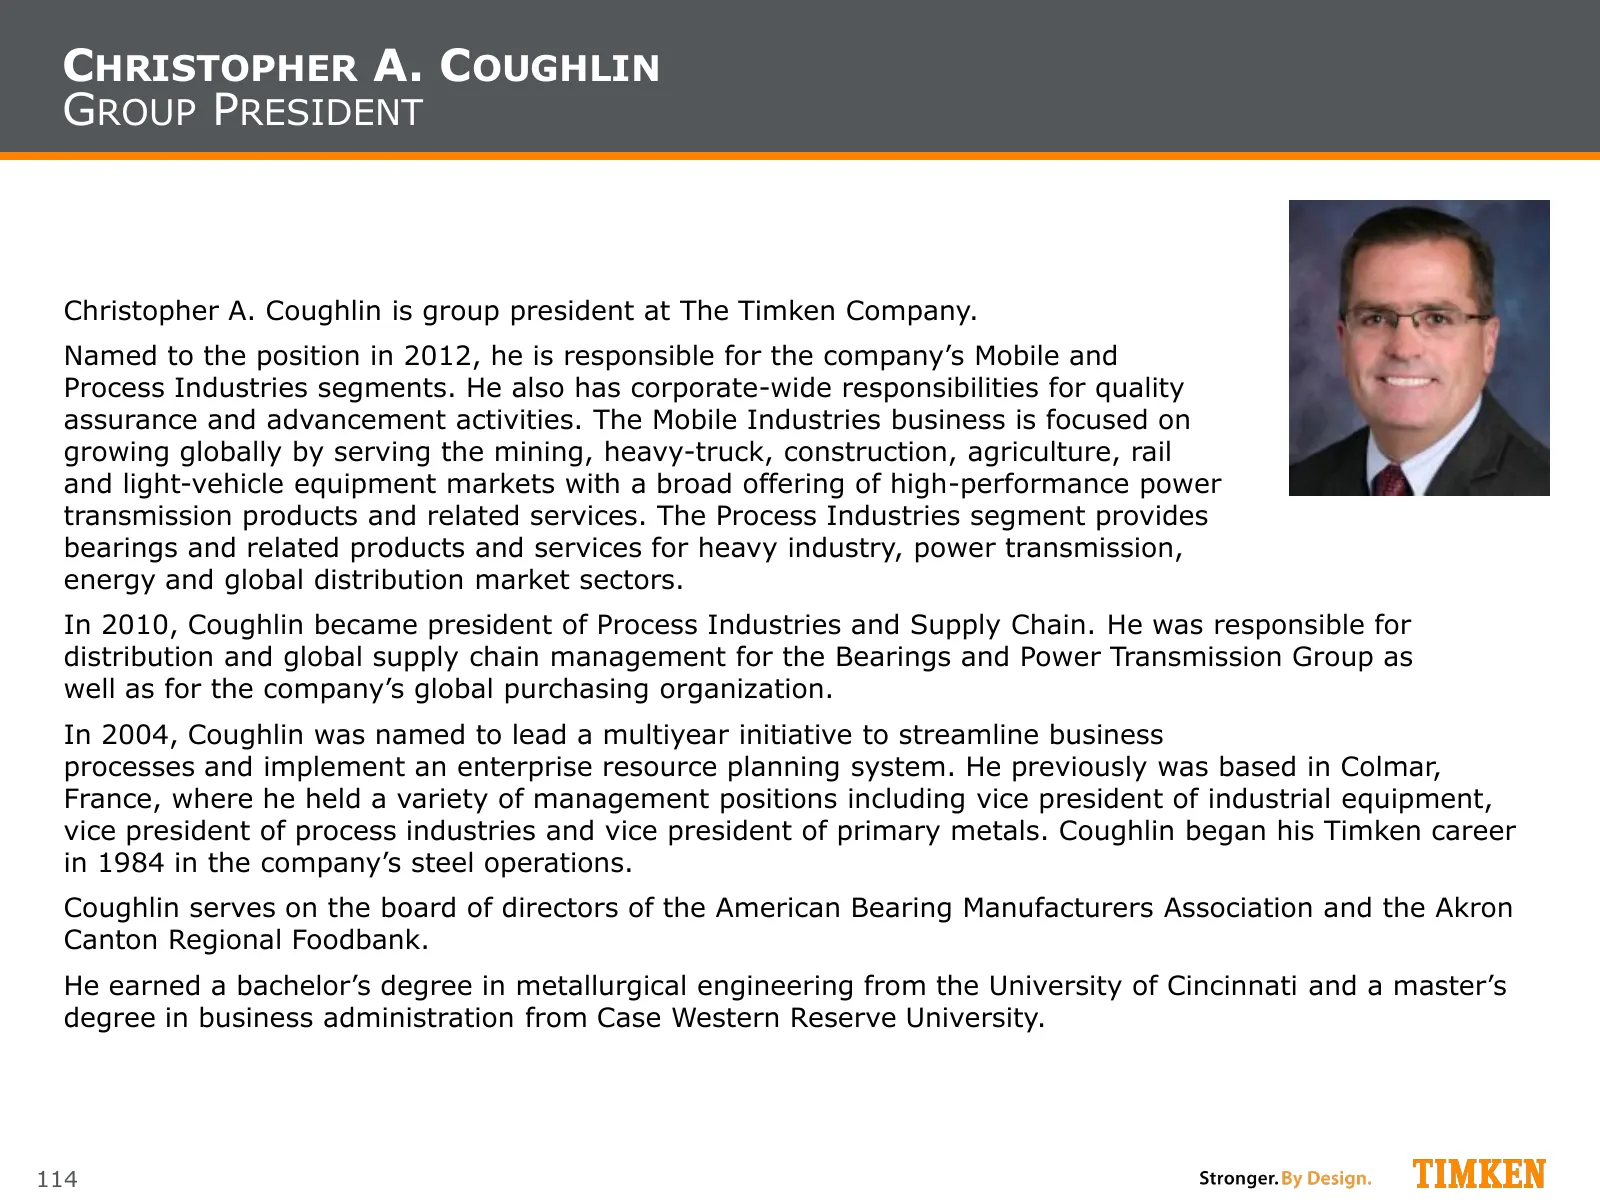
Slide 114: Christopher A. Coughlin, Group President
CHRISTOPHER A. COUGHLIN GROUP PRESIDENT Christopher A. Coughlin is group president at The Timken Company. Named to the position in 2012, he is responsible for the company’s Mobile and Process Industries segments. He also has corporate-wide responsibilities for quality assurance and advancement activ
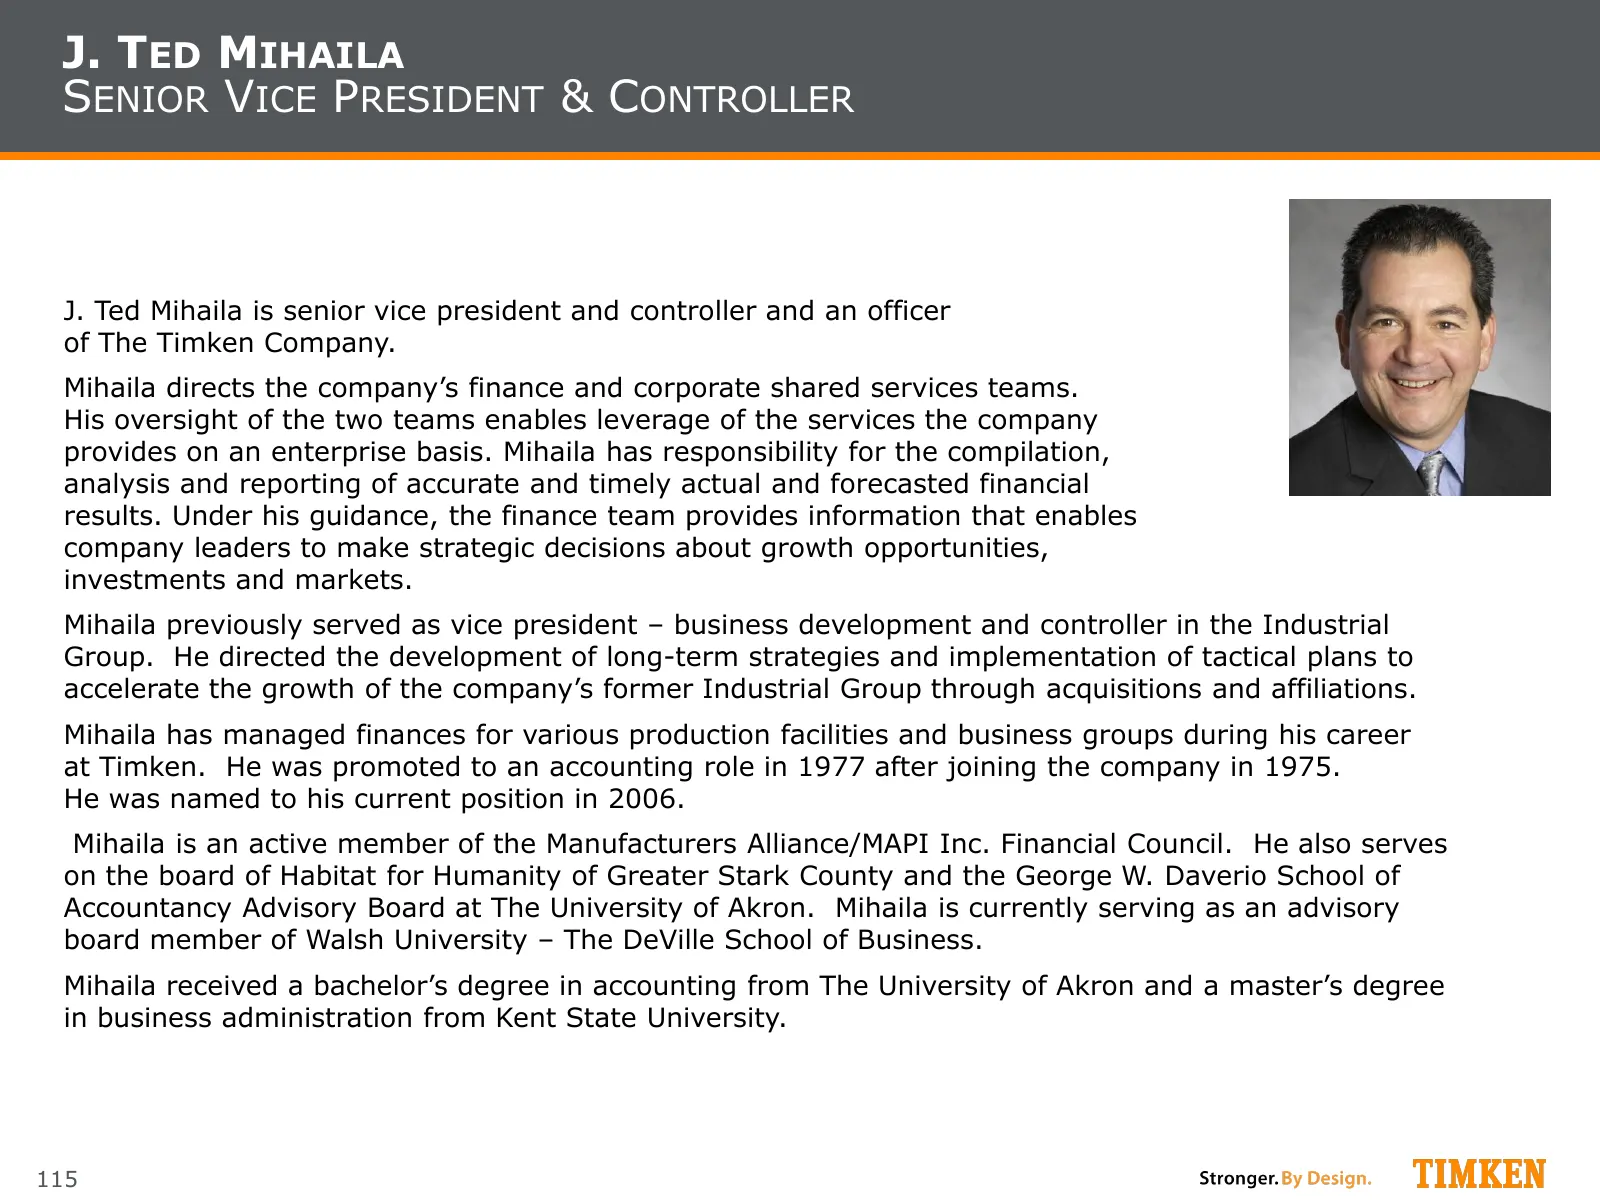
Slide 115: J. Ted Mihaila, Senior Vice President & Controller
J. TED MIHAILA SENIOR VICE PRESIDENT & CONTROLLER J. Ted Mihaila is senior vice president and controller and an officer of The Timken Company. Mihaila directs the company’s finance and corporate shared services teams. His oversight of the two teams enables leverage of the services the company provid
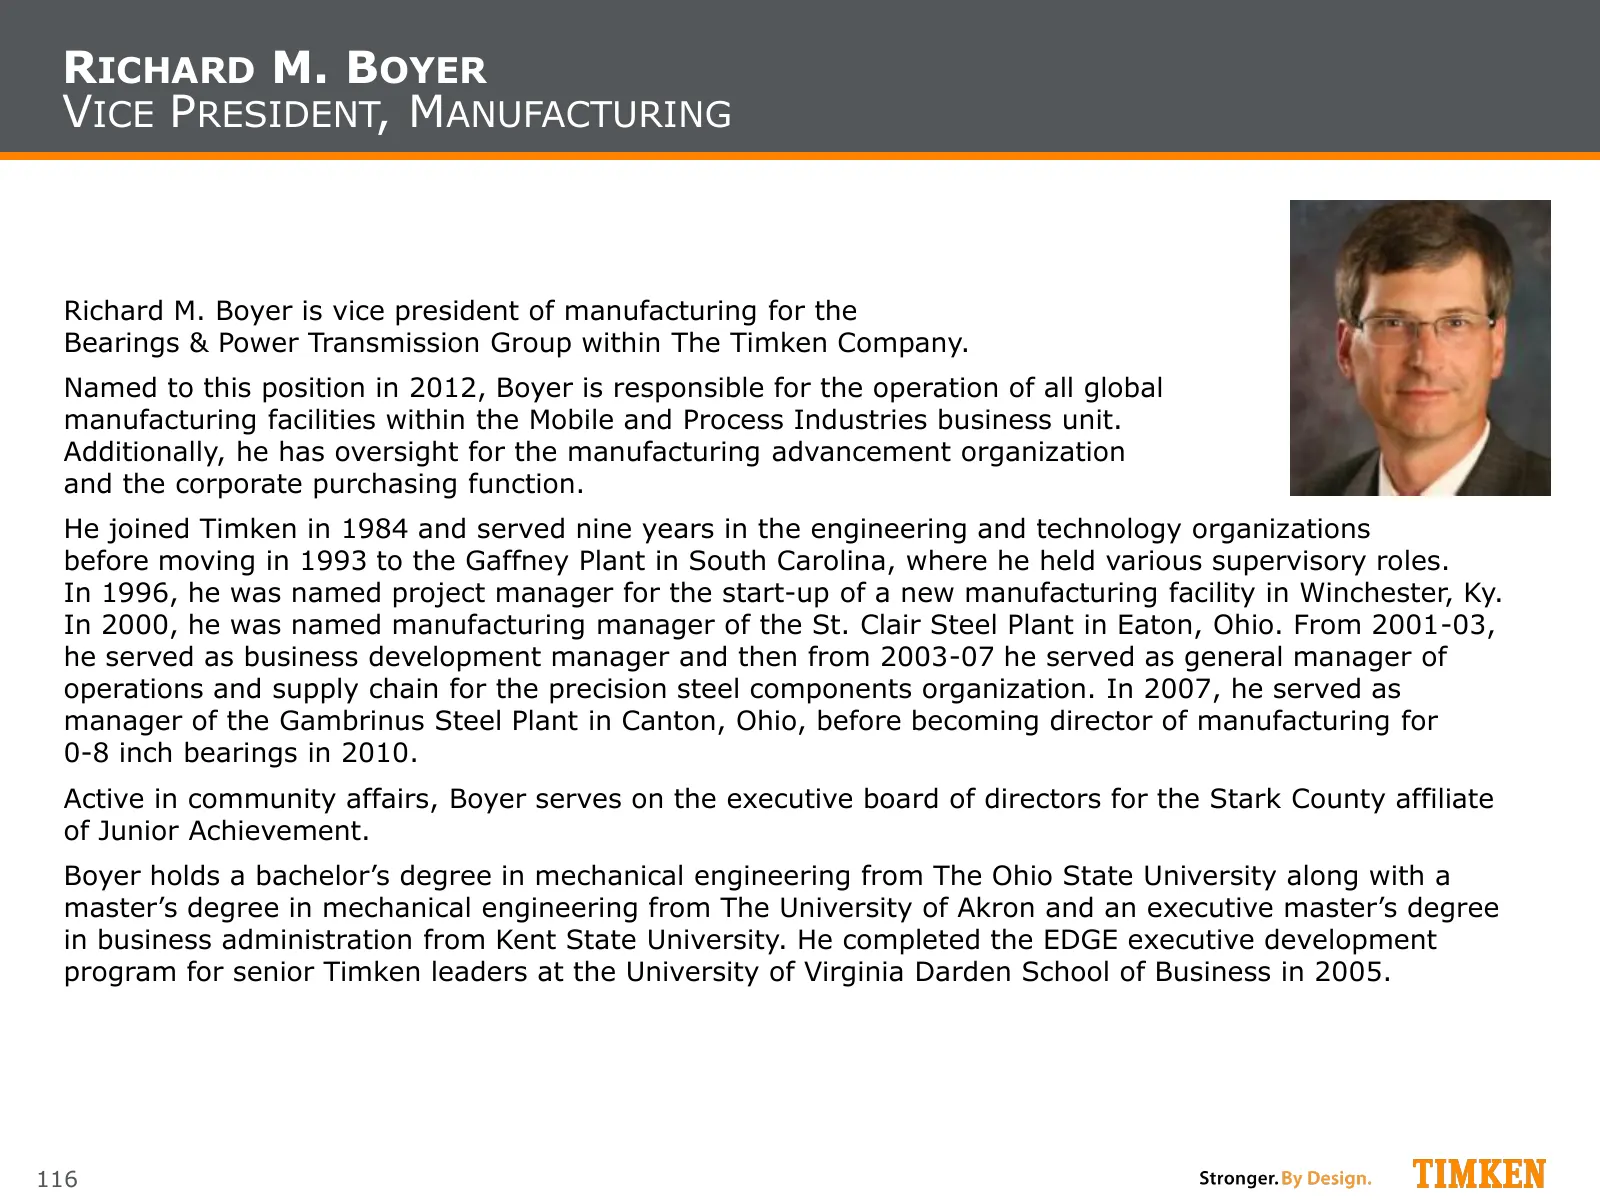
Slide 116: Richard M. Boyer, Vice President, Manufacturing
RICHARD M. BOYER VICE PRESIDENT, MANUFACTURING Richard M. Boyer is vice president of manufacturing for the Bearings & Power Transmission Group within The Timken Company. Named to this position in 2012, Boyer is responsible for the operation of all global manufacturing facilities within the Mobile an
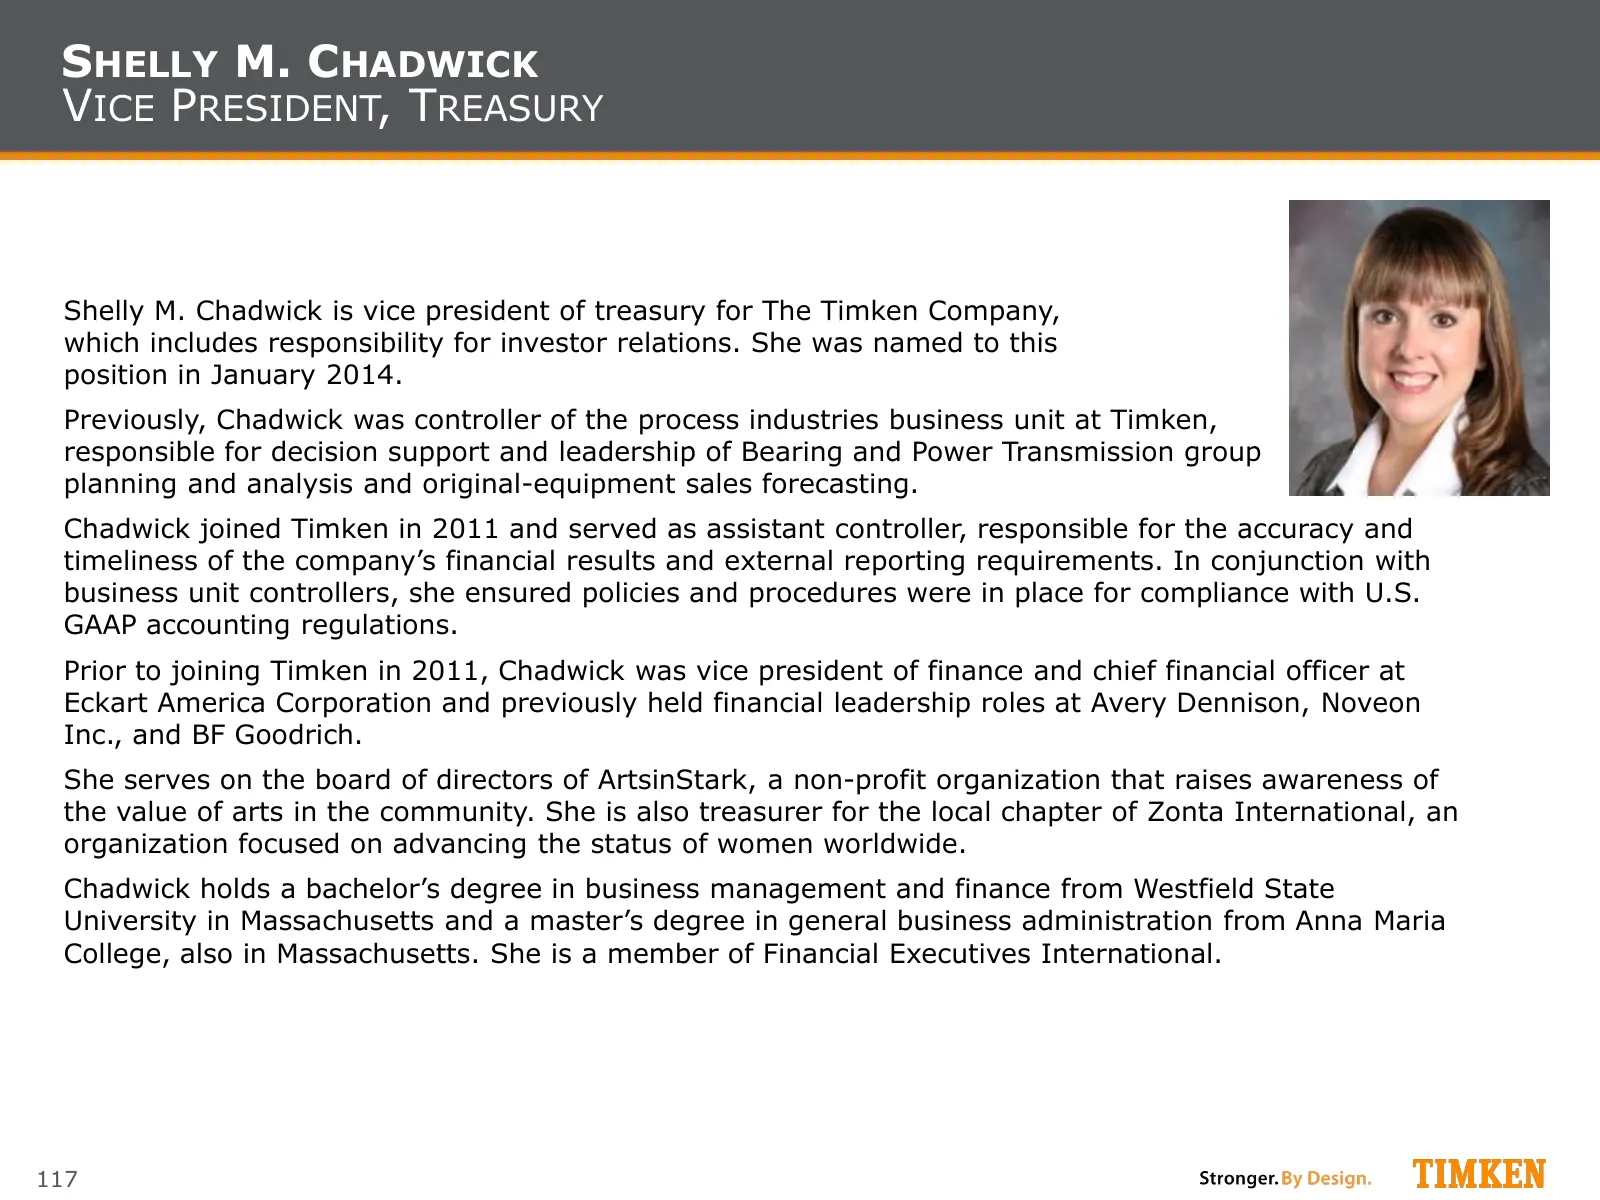
Slide 117: Shelly M. Chadwick, Vice President, Treasury
SHELLY M. CHADWICK VICE PRESIDENT, TREASURY Shelly M. Chadwick is vice president of treasury for The Timken Company, which includes responsibility for investor relations. She was named to this position in January 2014. Previously, Chadwick was controller of the process industries business unit at Ti
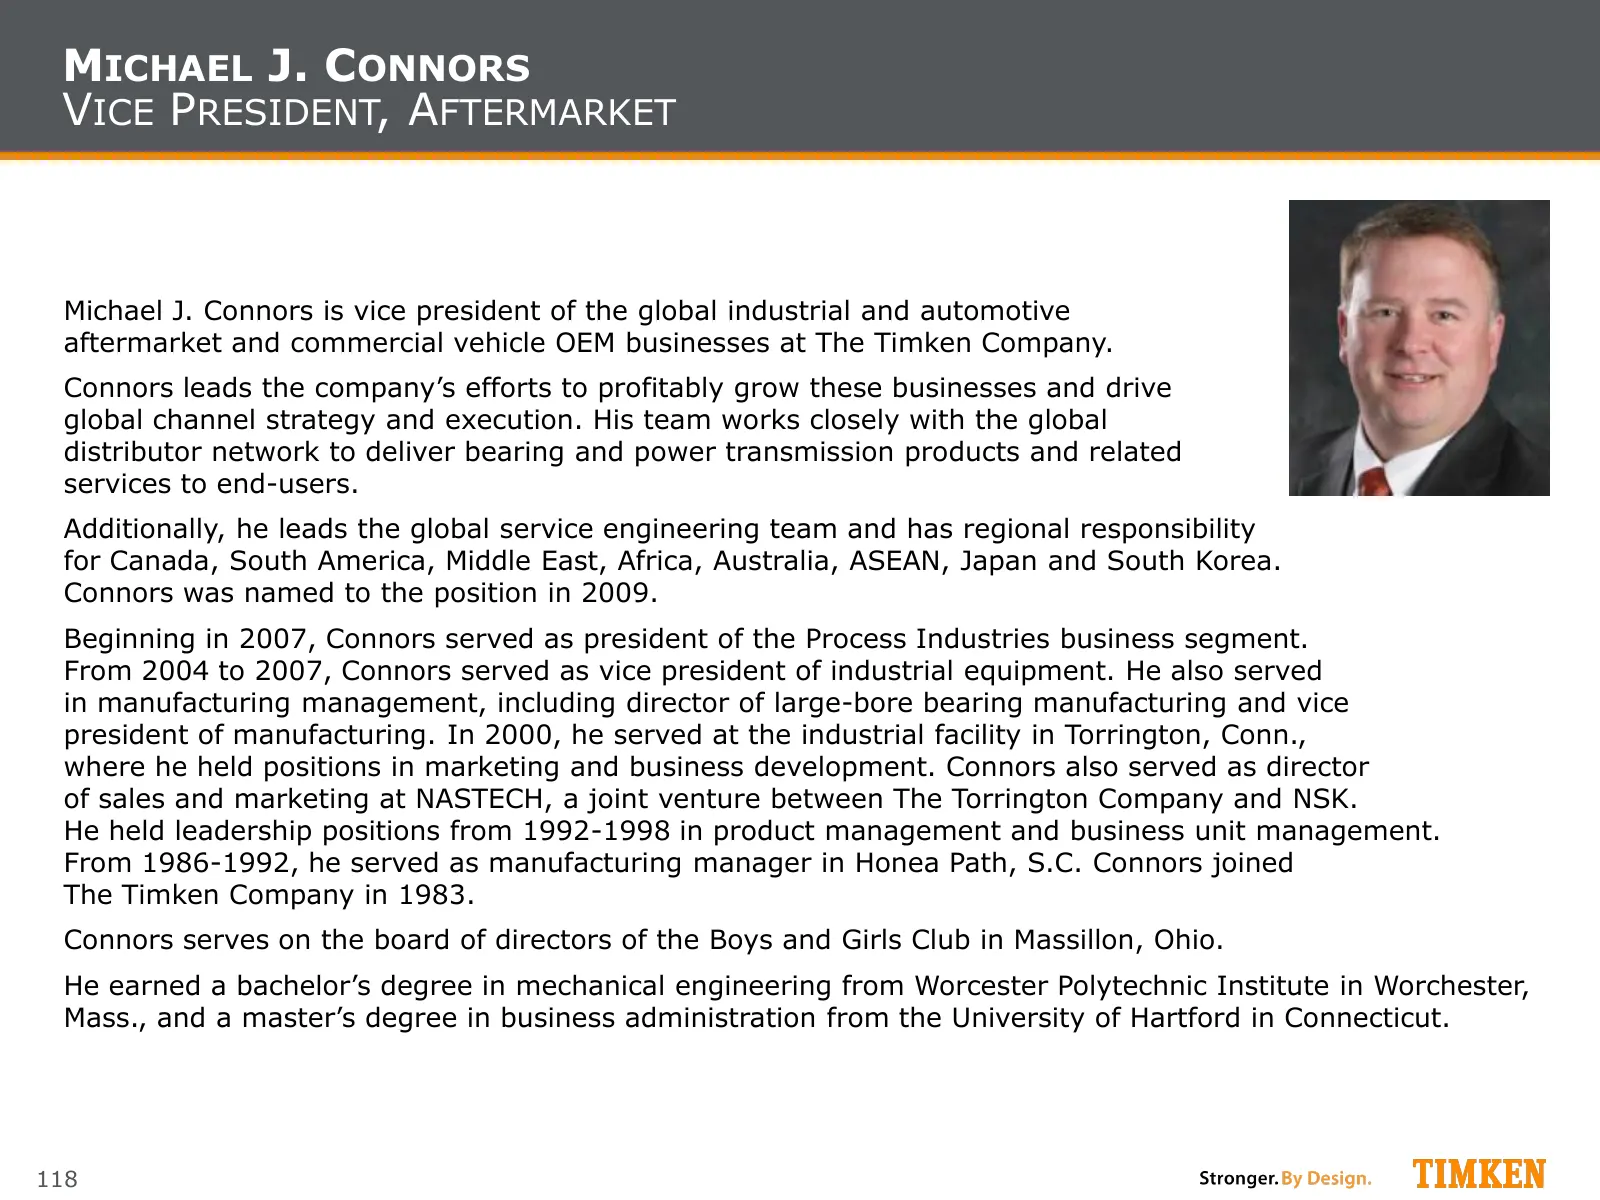
Slide 118: Michael J. Connors, Vice President, Aftermarket
MICHAEL J. CONNORS VICE PRESIDENT, AFTERMARKET Michael J. Connors is vice president of the global industrial and automotive aftermarket and commercial vehicle OEM businesses at The Timken Company. Connors leads the company’s efforts to profitably grow these businesses and drive global channel strate
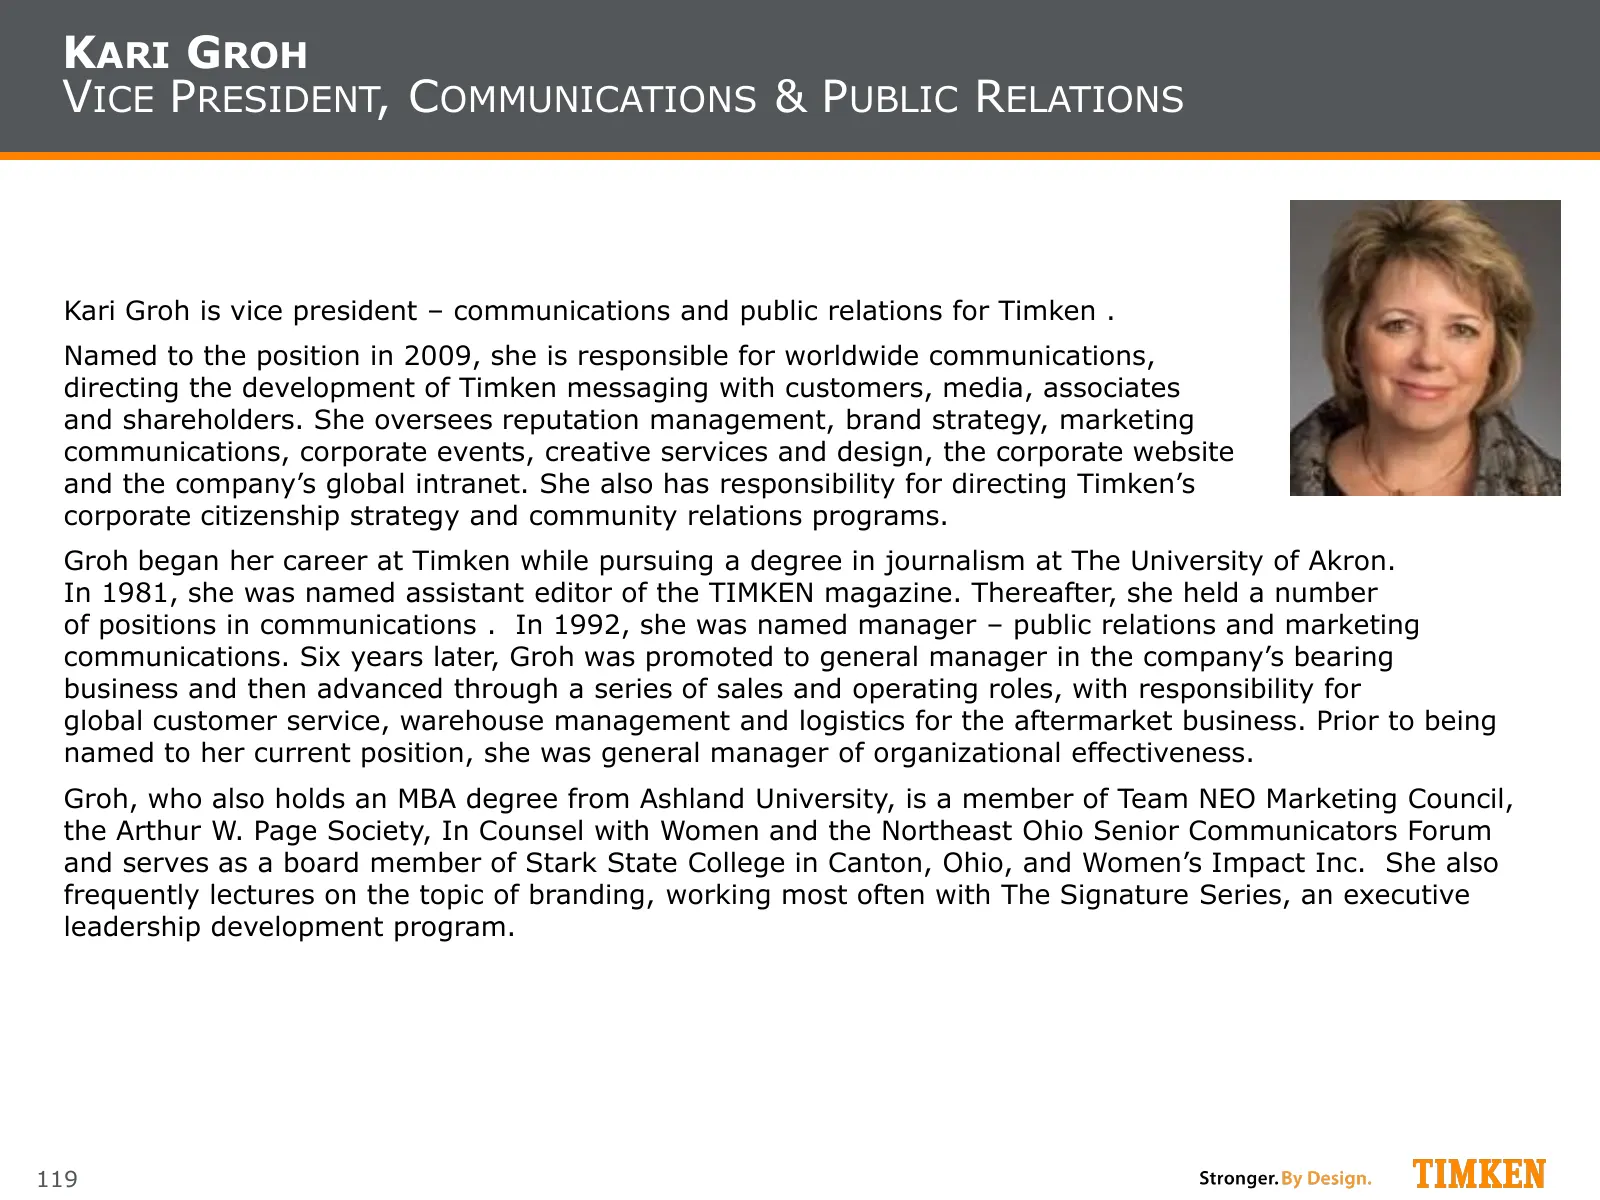
Slide 119: Kari Groh, VP, Communications & Public Relations
KARI GROH VICE PRESIDENT, COMMUNICATIONS & PUBLIC RELATIONS Kari Groh is vice president – communications and public relations for Timken . Named to the position in 2009, she is responsible for worldwide communications, directing the development of Timken messaging with customers, media, associates a
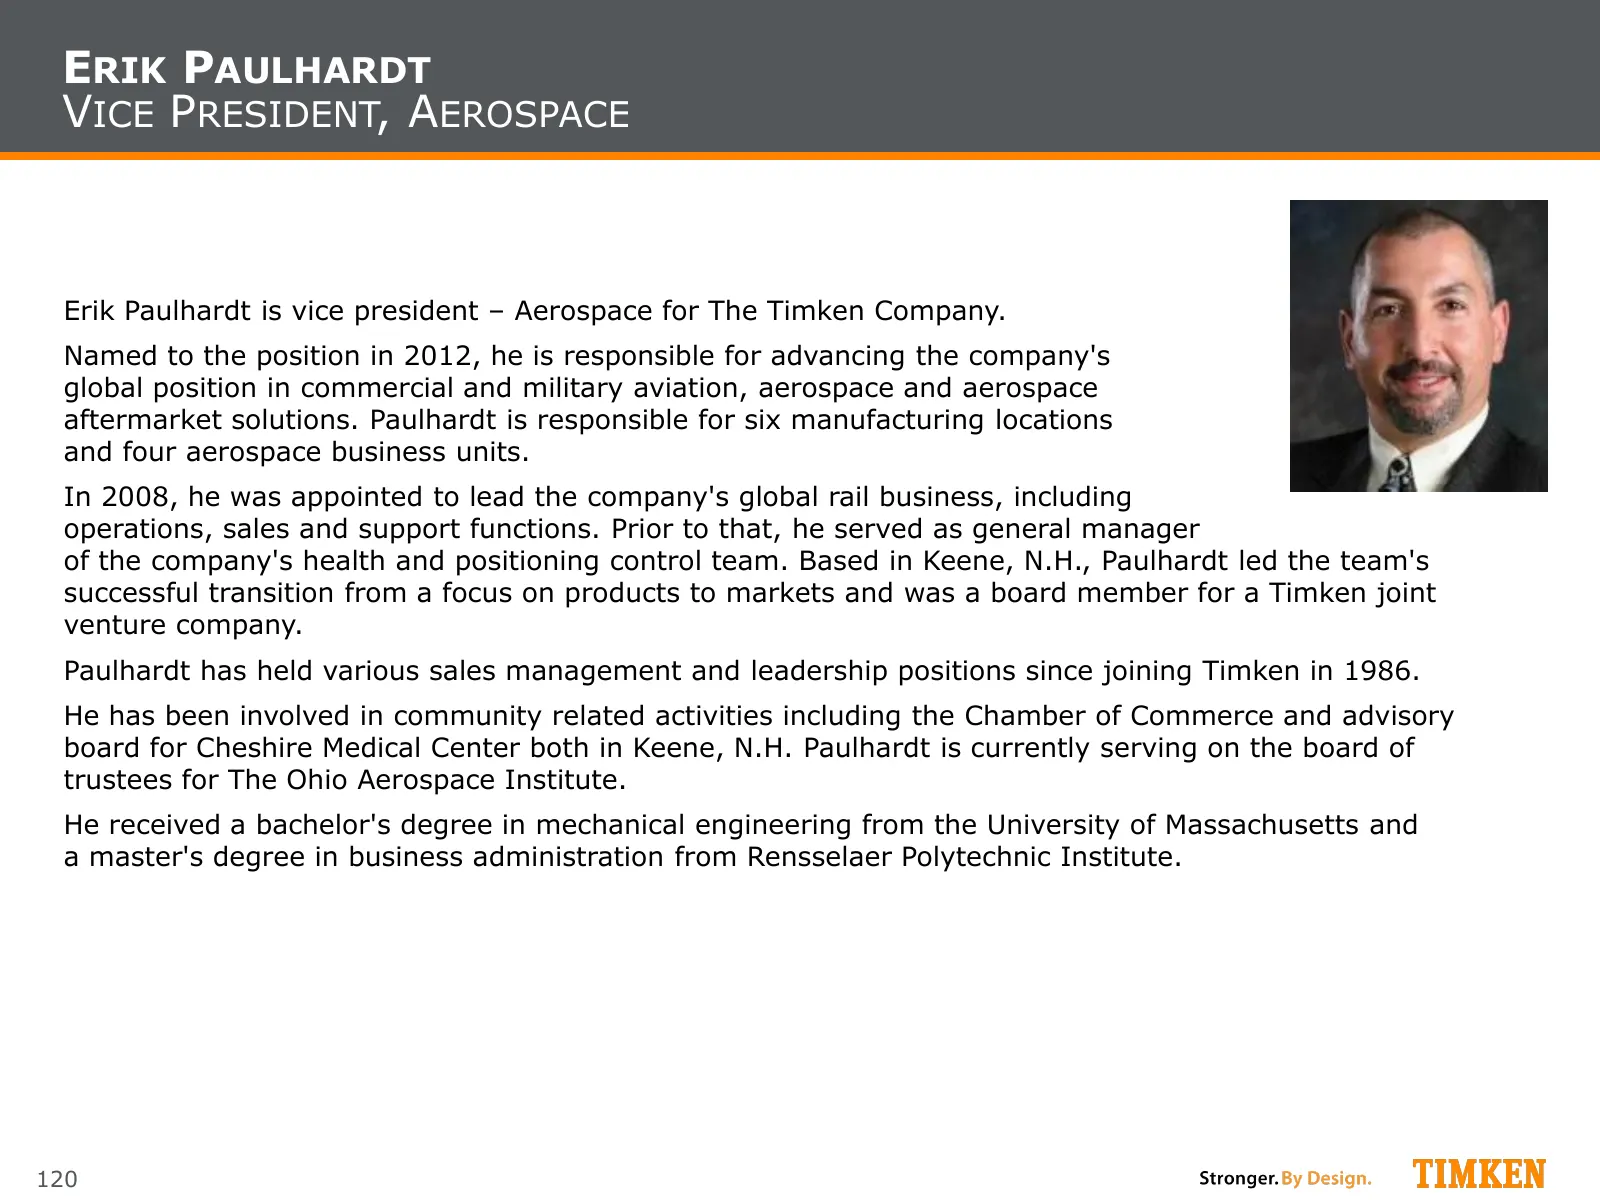
Slide 120: Erik Paulhardt, Vice President, Aerospace
ERIK PAULHARDT VICE PRESIDENT, AEROSPACE Erik Paulhardt is vice president – Aerospace for The Timken Company. Named to the position in 2012, he is responsible for advancing the company's global position in commercial and military aviation, aerospace and aerospace aftermarket solutions. Paulhardt is
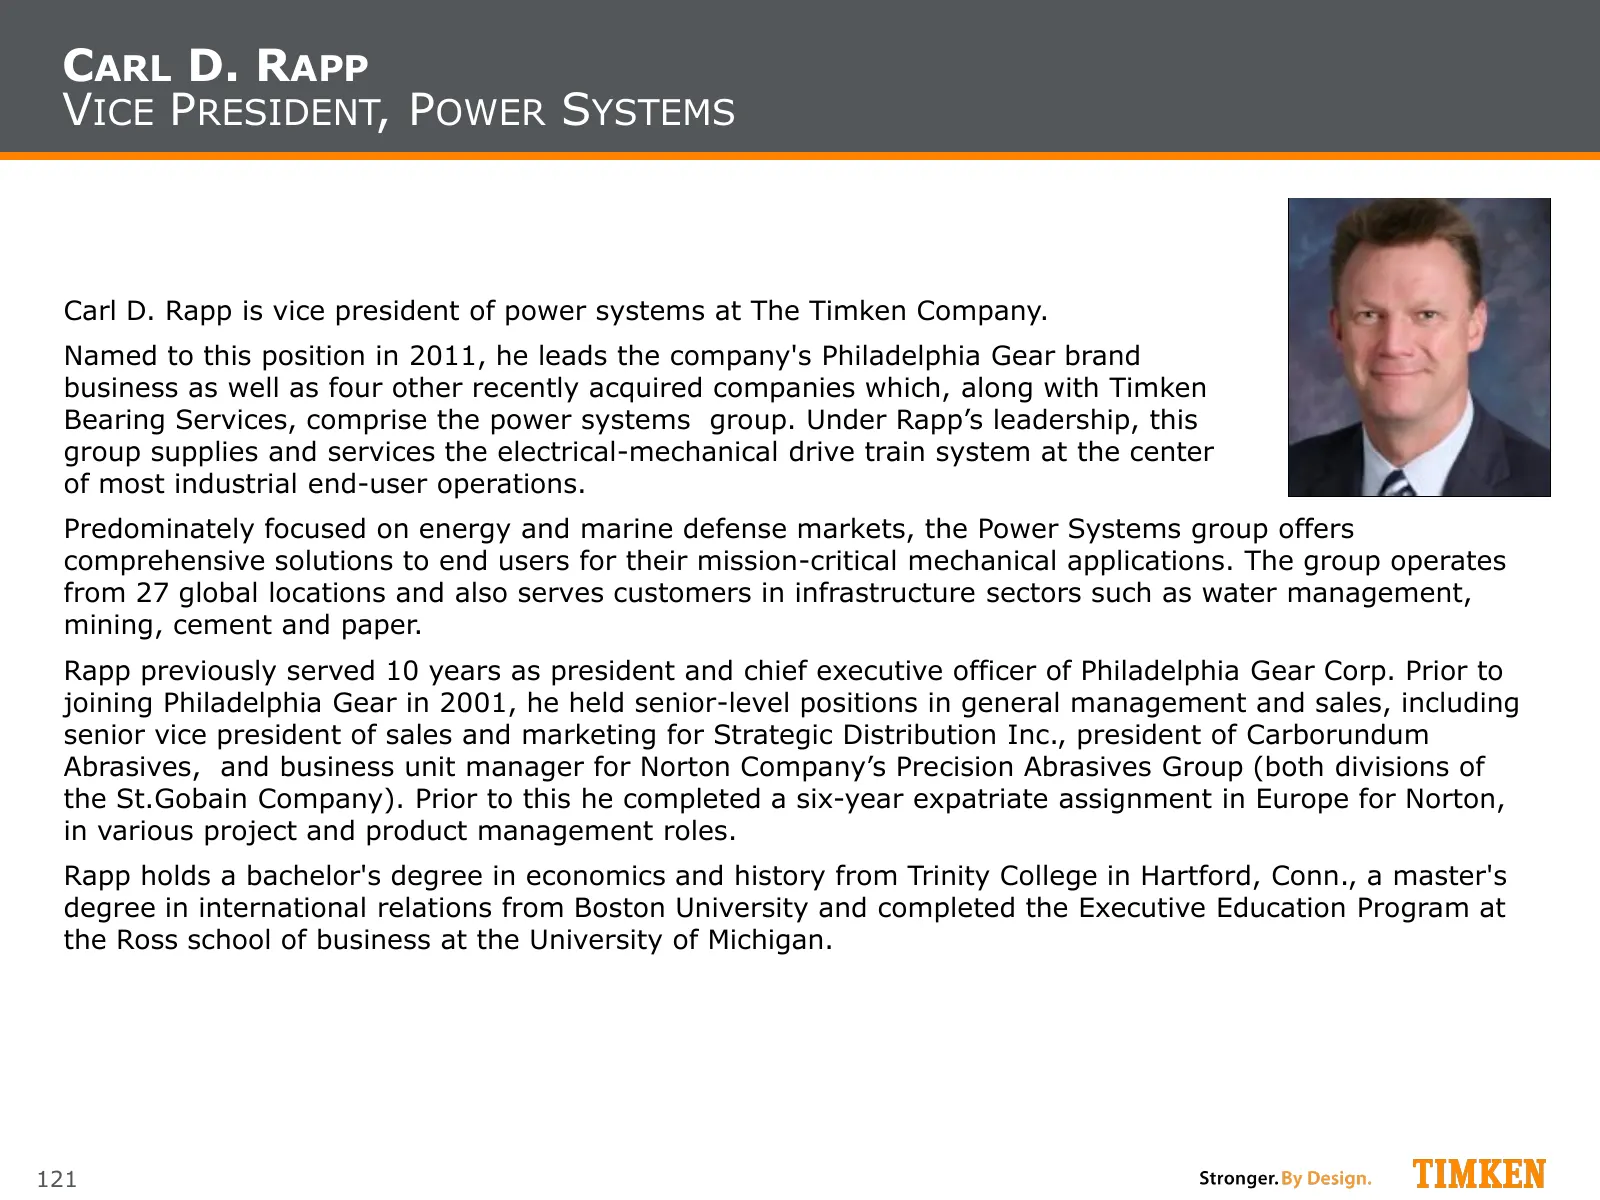
Slide 121: Carl D. Rapp, Vice President, Power Systems
CARL D. RAPP VICE PRESIDENT, POWER SYSTEMS Carl D. Rapp is vice president of power systems at The Timken Company. Named to this position in 2011, he leads the company's Philadelphia Gear brand business as well as four other recently acquired companies which, along with Timken Bearing Services, compr
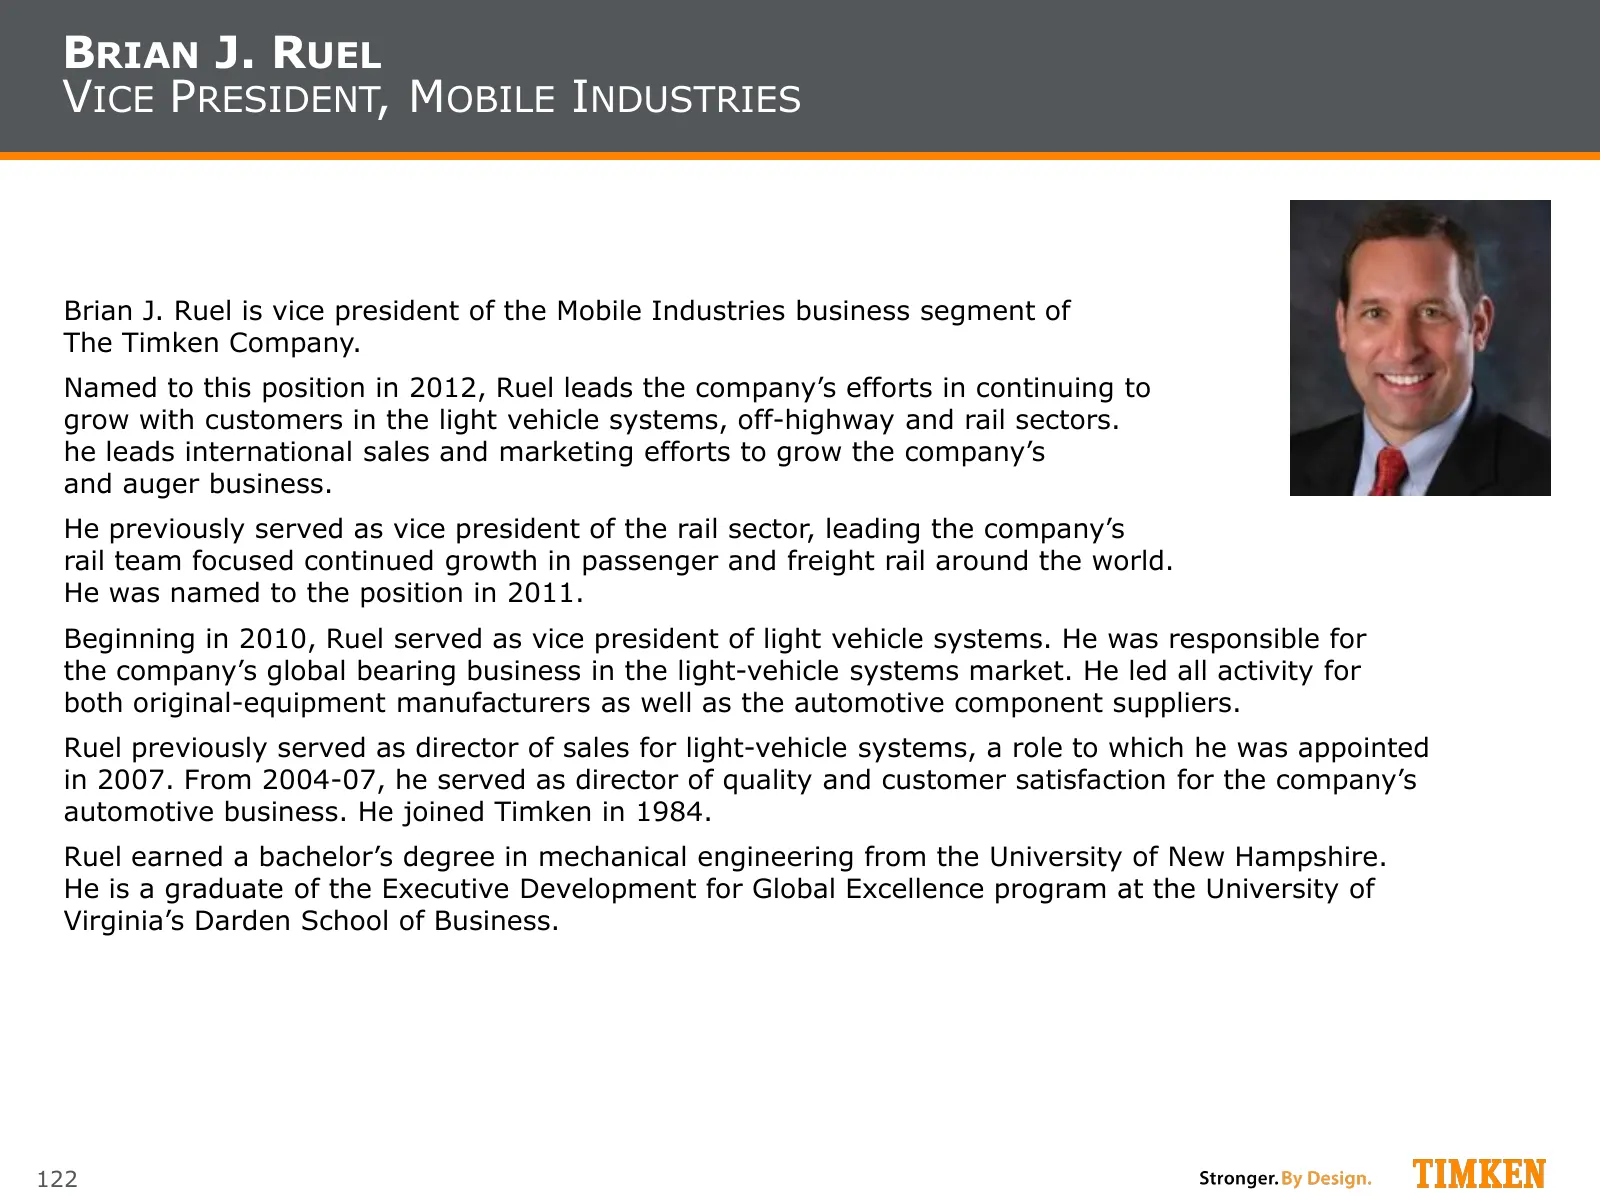
Slide 122: Brian J. Ruel, Vice President, Mobile Industries
BRIAN J. RUEL VICE PRESIDENT, MOBILE INDUSTRIES Brian J. Ruel is vice president of the Mobile Industries business segment of The The Timken Company. Named to this position in 2012, Ruel leads the company’s efforts in continuing to its global grow with customers in the light vehicle systems, off-high
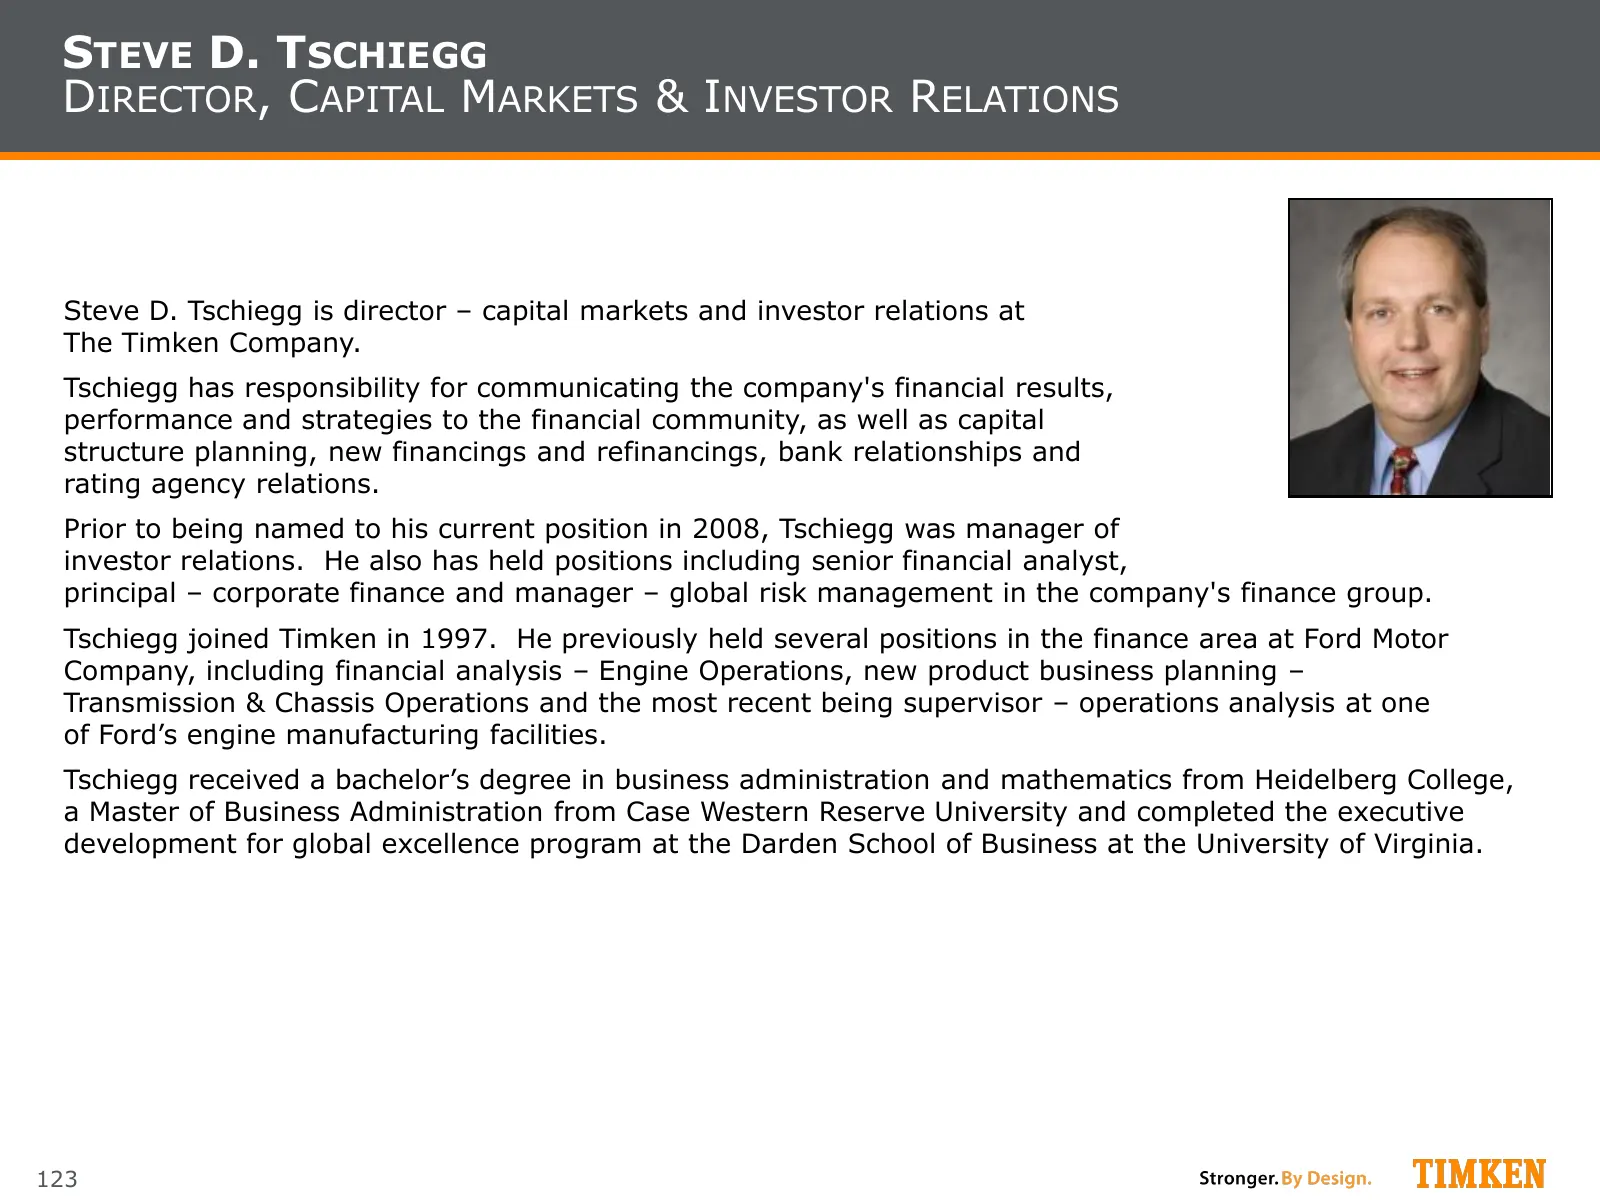
Slide 123: Steve D. Tschiegg, Director, Capital Markets & IR
STEVE D. TSCHIEGG DIRECTOR, CAPITAL MARKETS & INVESTOR RELATIONS Steve D. Tschiegg is director – capital markets and investor relations at The Timken Company. Tschiegg has responsibility for communicating the company's financial results, performance and strategies to the financial community, as well
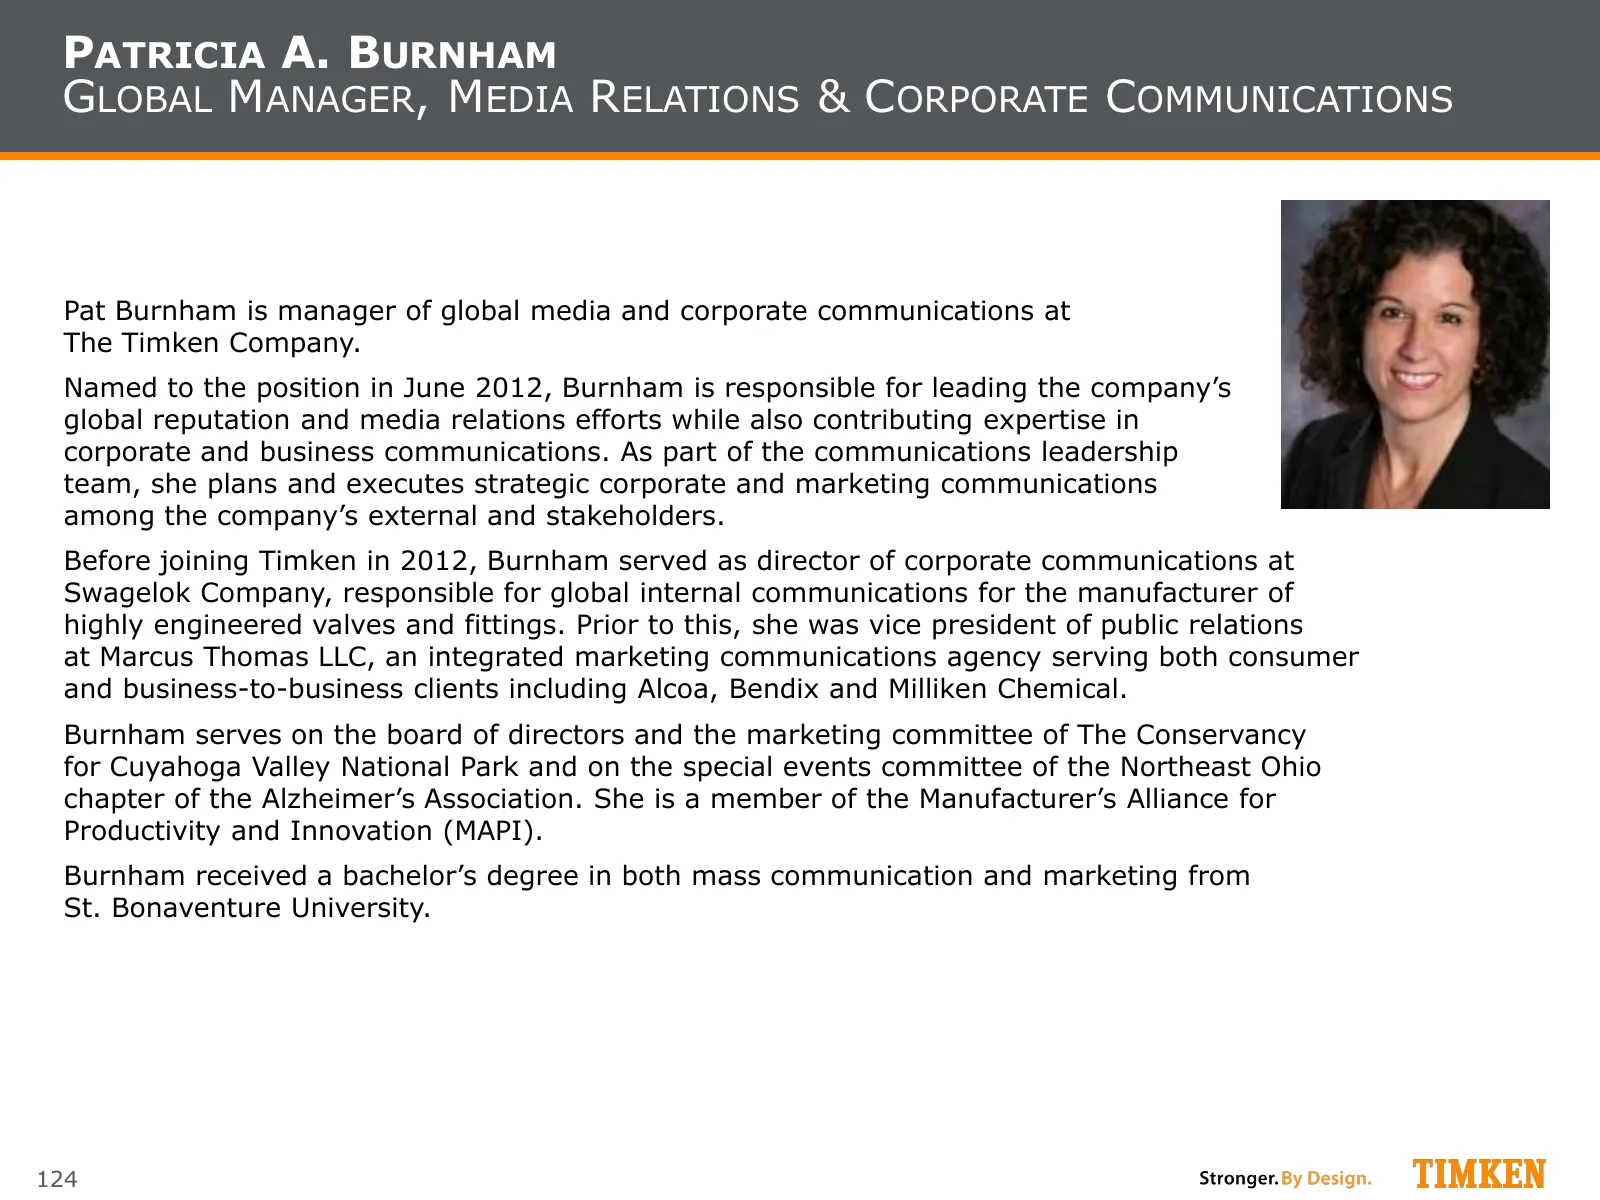
Slide 124: Patricia A. Burnham, Global Manager, Media Relations
PATRICIA A. BURNHAM GLOBAL MANAGER, MEDIA RELATIONS & CORPORATE COMMUNICATIONS Pat Burnham is manager of global media and corporate communications at The Timken Company. Named to the position in June 2012, Burnham is responsible for leading the company’s global reputation and media relations efforts
Slide 125: Appendix: GAAP Reconciliation
Appendix: GAAP Reconciliation
Slide 126: GAAP Reconciliation: 2004-2014
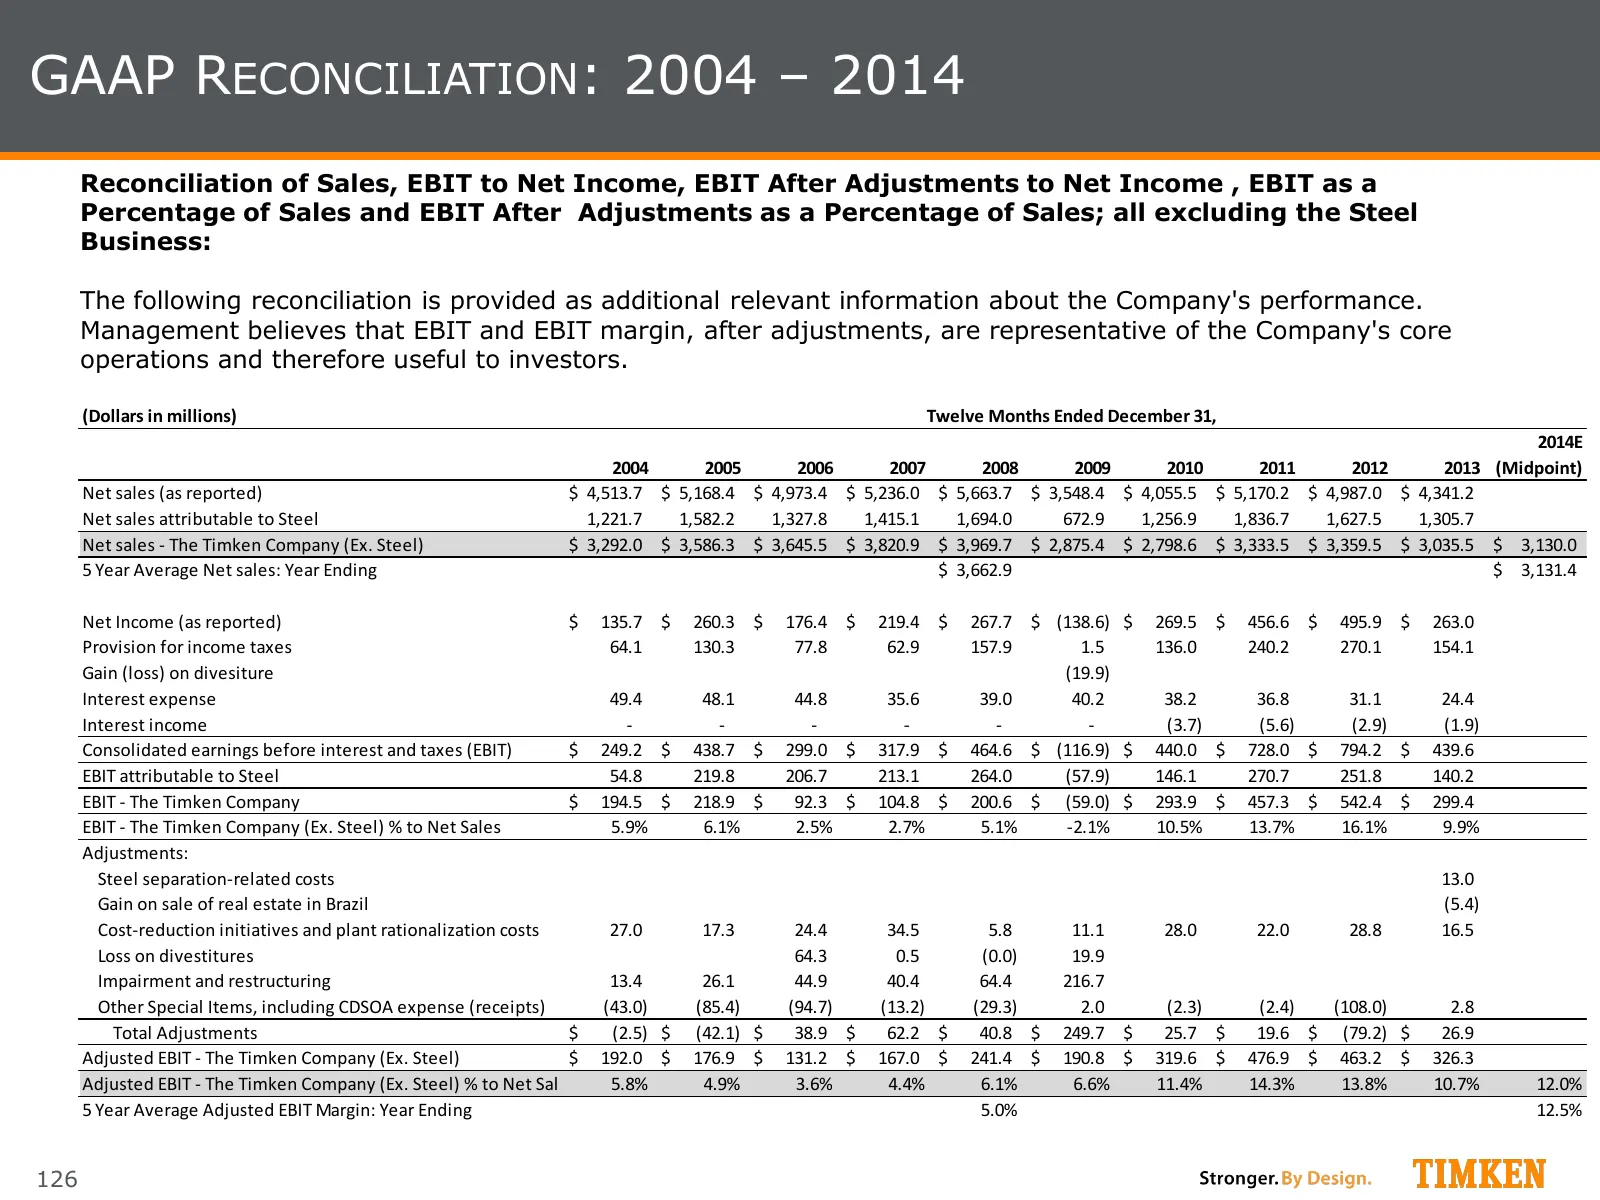
GAAP RECONCILIATION: 2004 – 2014 Reconciliation of Sales, EBIT to Net Income, EBIT After Adjustments to Net Income , EBIT as a Percentage of Sales and EBIT After Adjustments as a Percentage of Sales; all excluding the Steel Business: The following reconciliation is provided as additional relevant in
Slide 127: GAAP Reconciliation: Q1'14 vs. Q1'13
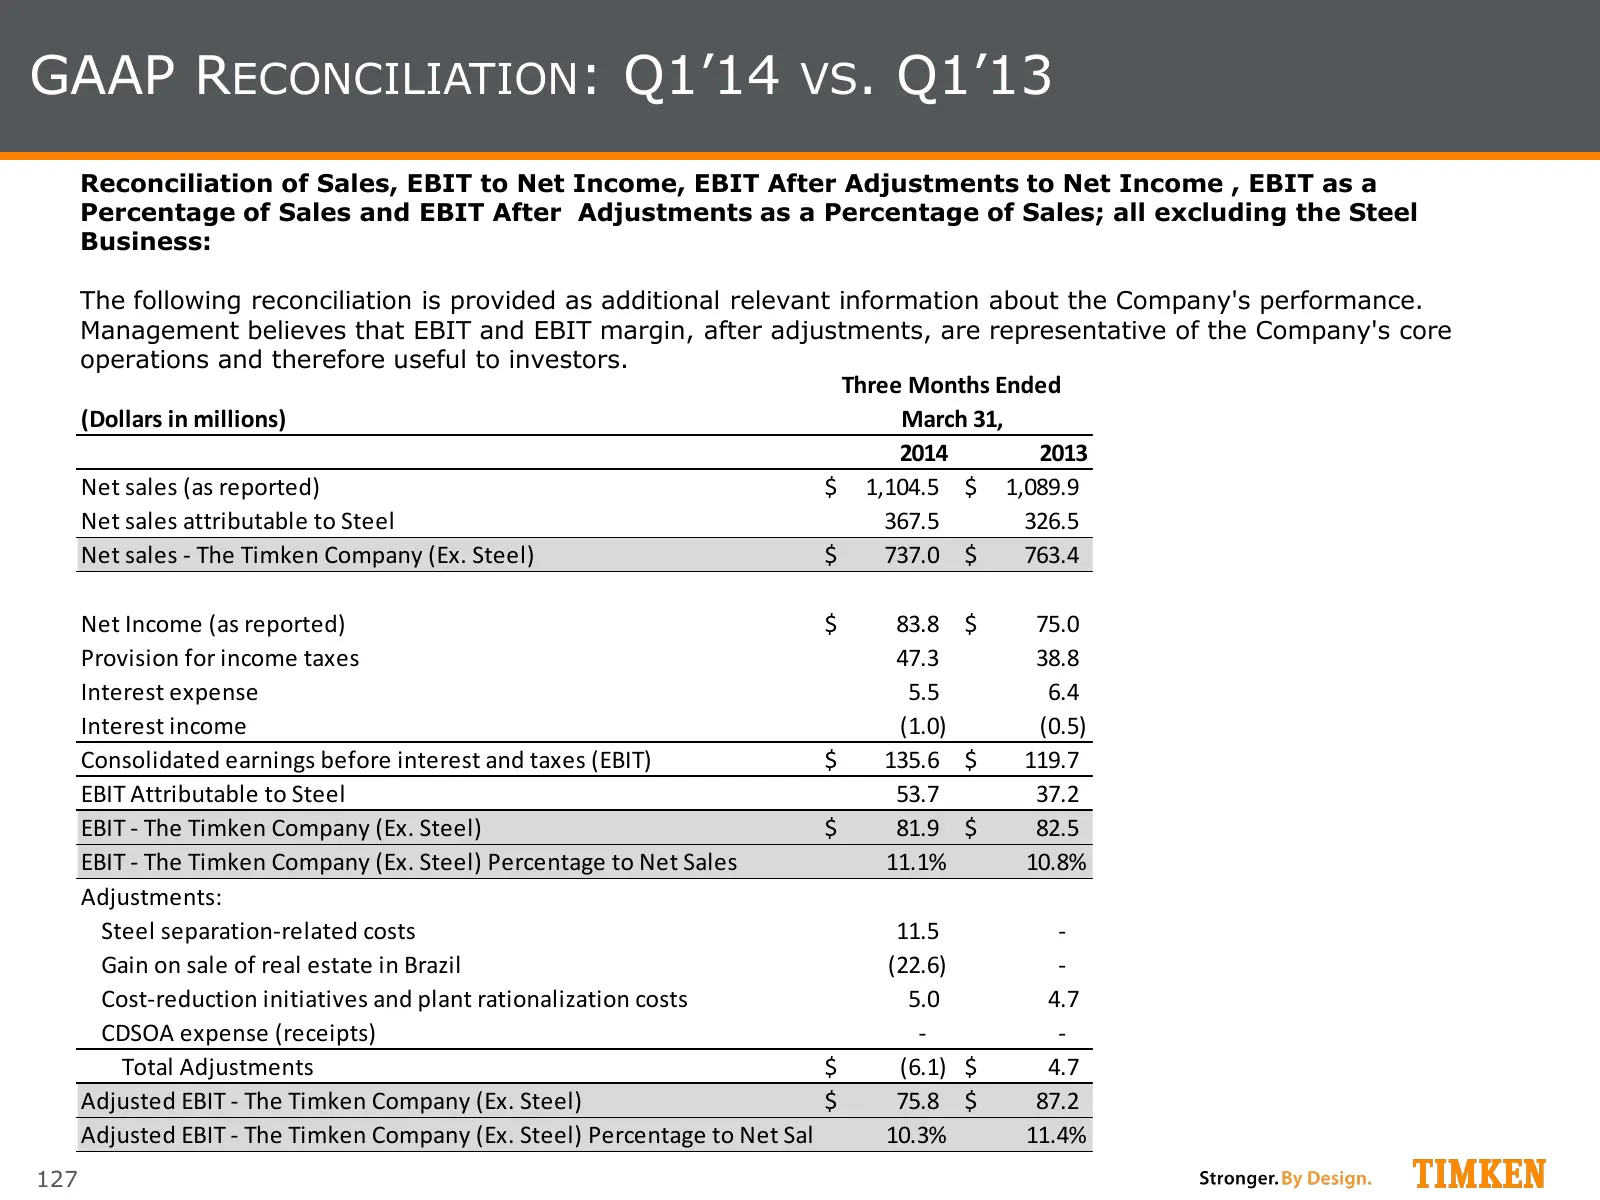
GAAP RECONCILIATION: Q1’14 VS. Q1’13 Reconciliation of Sales, EBIT to Net Income, EBIT After Adjustments to Net Income , EBIT as a Percentage of Sales and EBIT After Adjustments as a Percentage of Sales; all excluding the Steel Business: The following reconciliation is provided as additional relevan
Slide 128: GAAP Reconciliation: Q1'14 vs. Q1'13
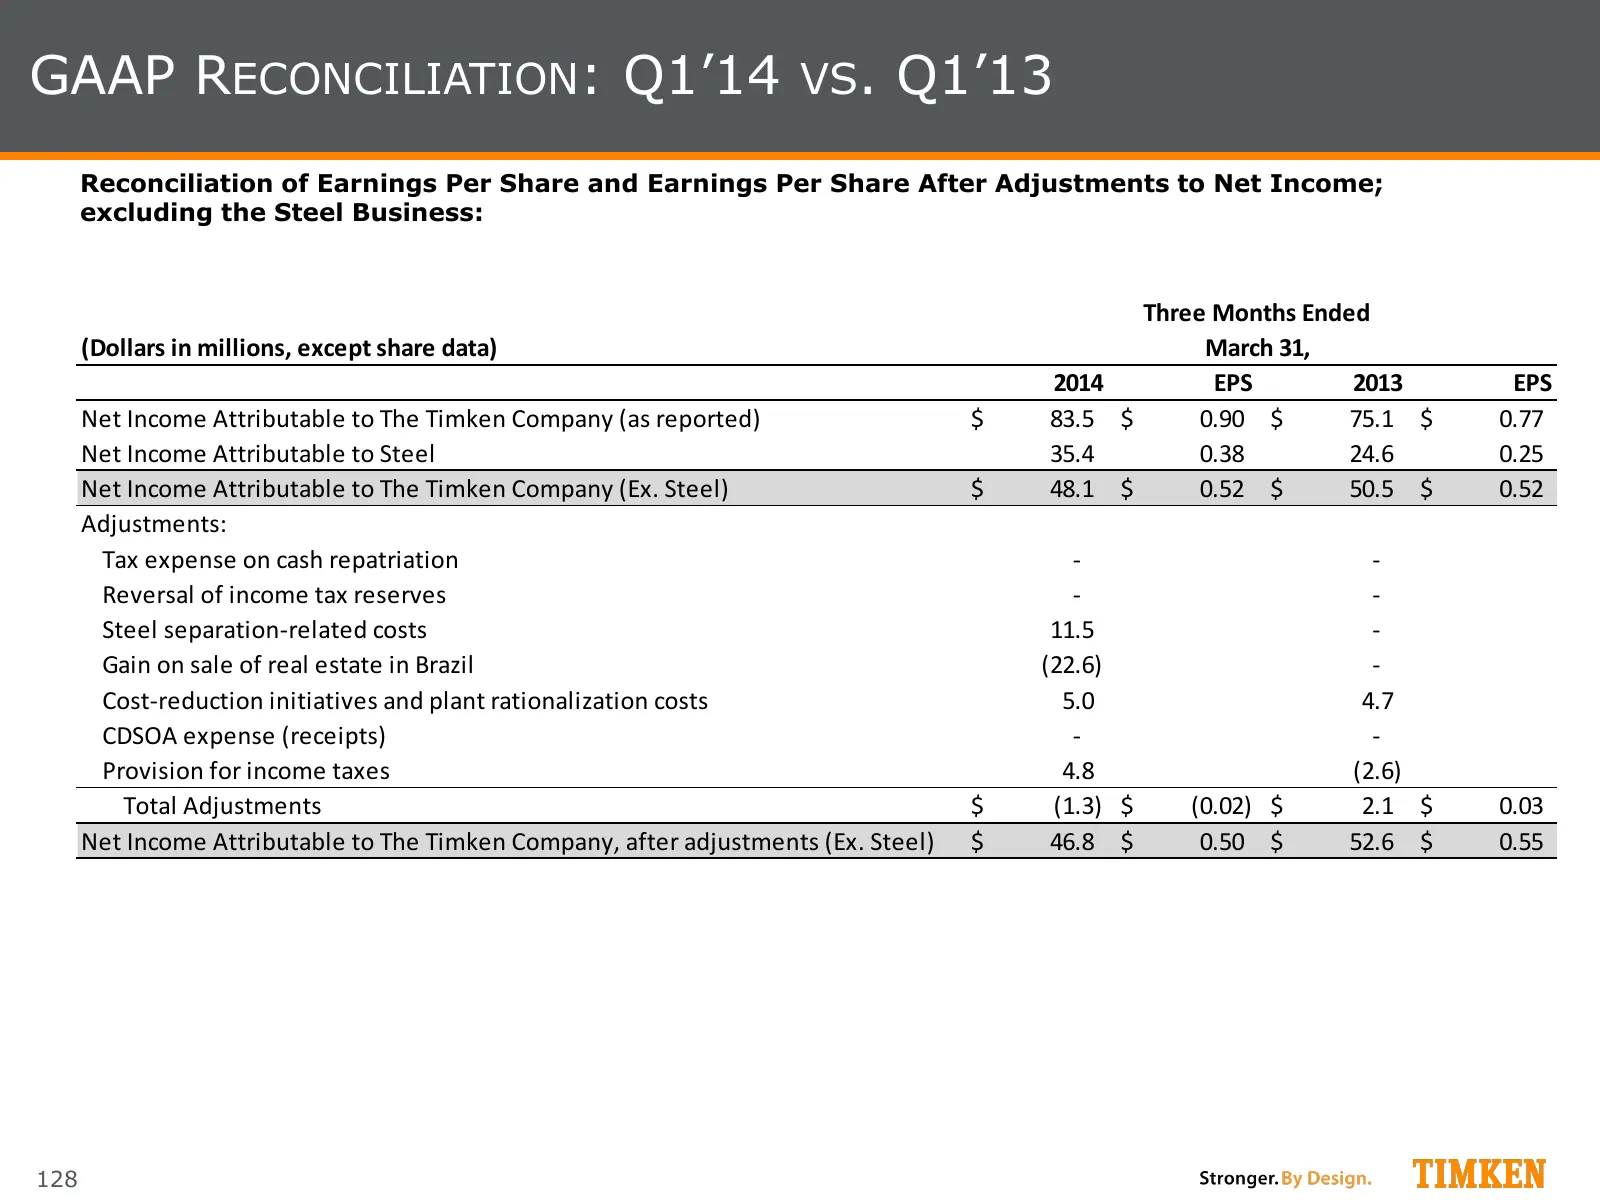
GAAP RECONCILIATION: Q1’14 VS. Q1’13 Reconciliation of Earnings Per Share and Earnings Per Share After Adjustments to Net Income; excluding the Steel Business: Three Months Ended (Dollars in millions, except share data) March 31, 2014 EPS 2013 EPS Net Income Attributable to The Timken Company (as re
Slide 129: GAAP Reconciliation: Debt / EBITDA
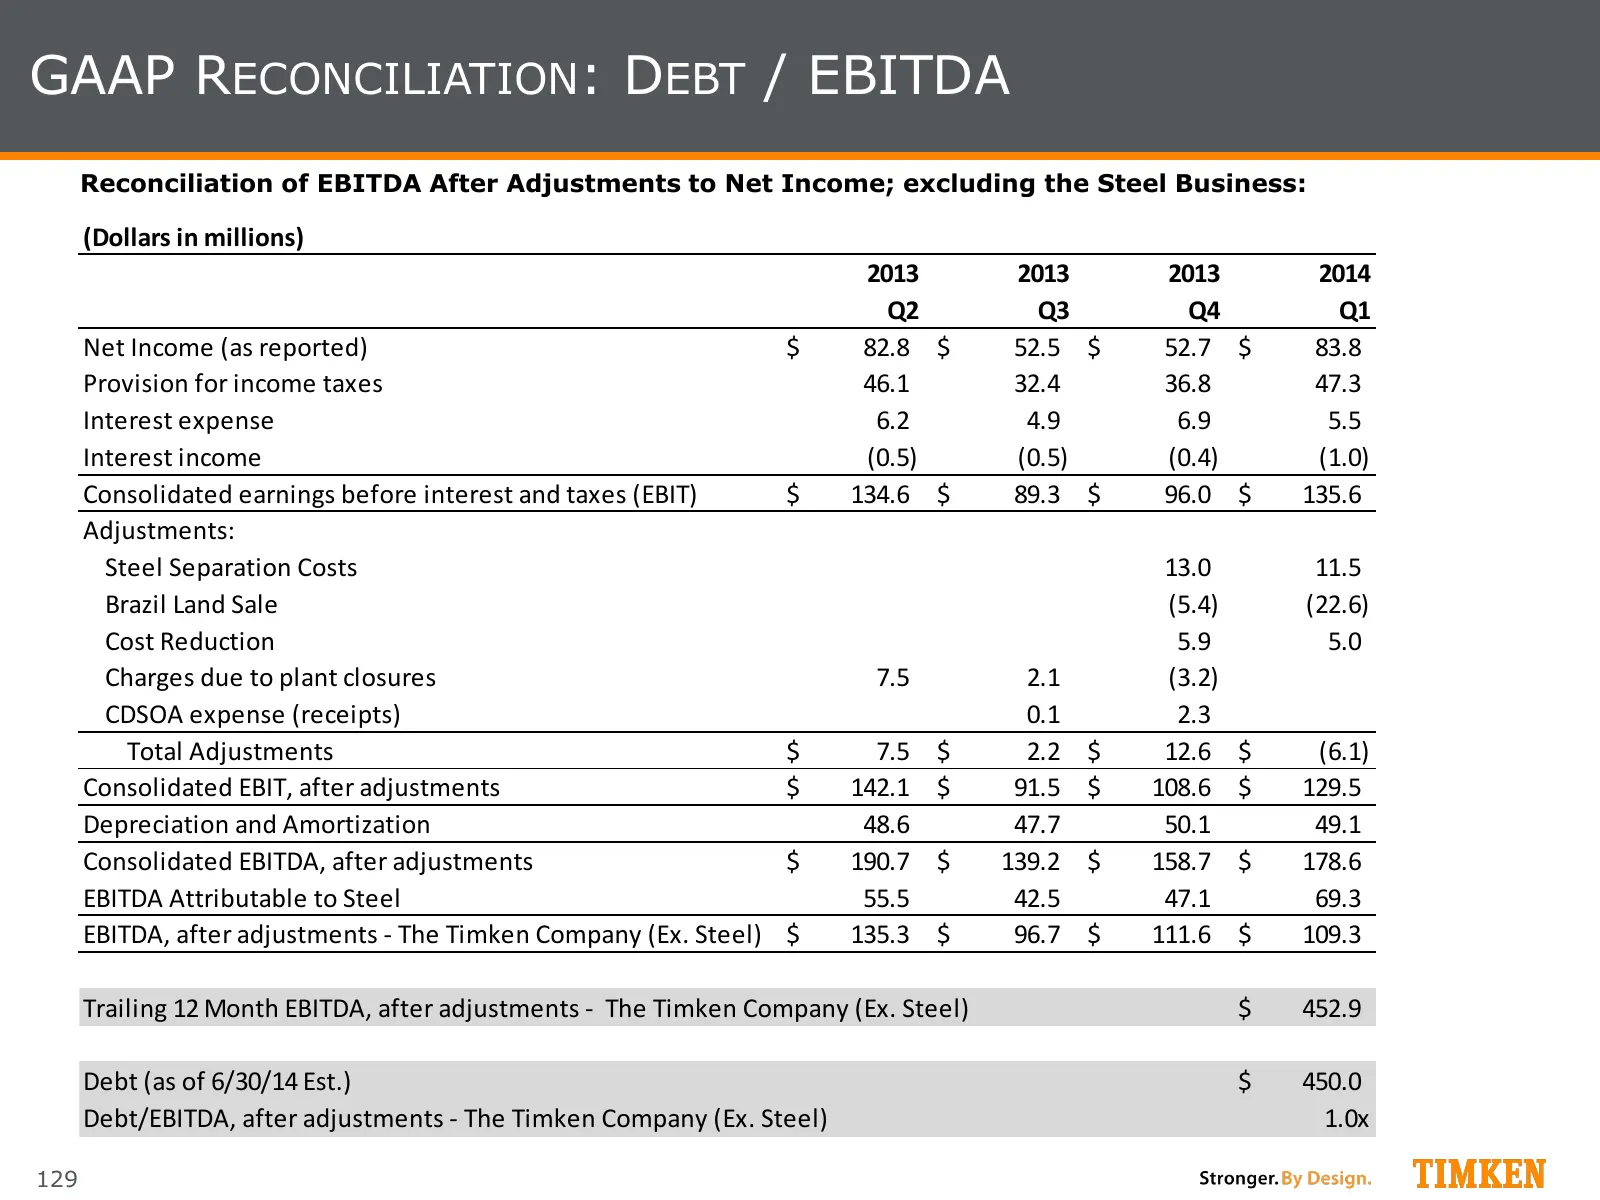
GAAP RECONCILIATION: DEBT / EBITDA Reconciliation of EBITDA After Adjustments to Net Income; excluding the Steel Business: (Dollars in millions) 2013 2013 2013 2014 Q2 Q3 Q4 Q1 Net Income (as reported) $ 82.8 $ 52.5 $ 52.7 $ 83.8 Provision for income taxes 46.1 32.4 36.8 47.3 Interest expense 6.2 4.
Slide 130: GAAP Reconciliation: Net Debt / Capital
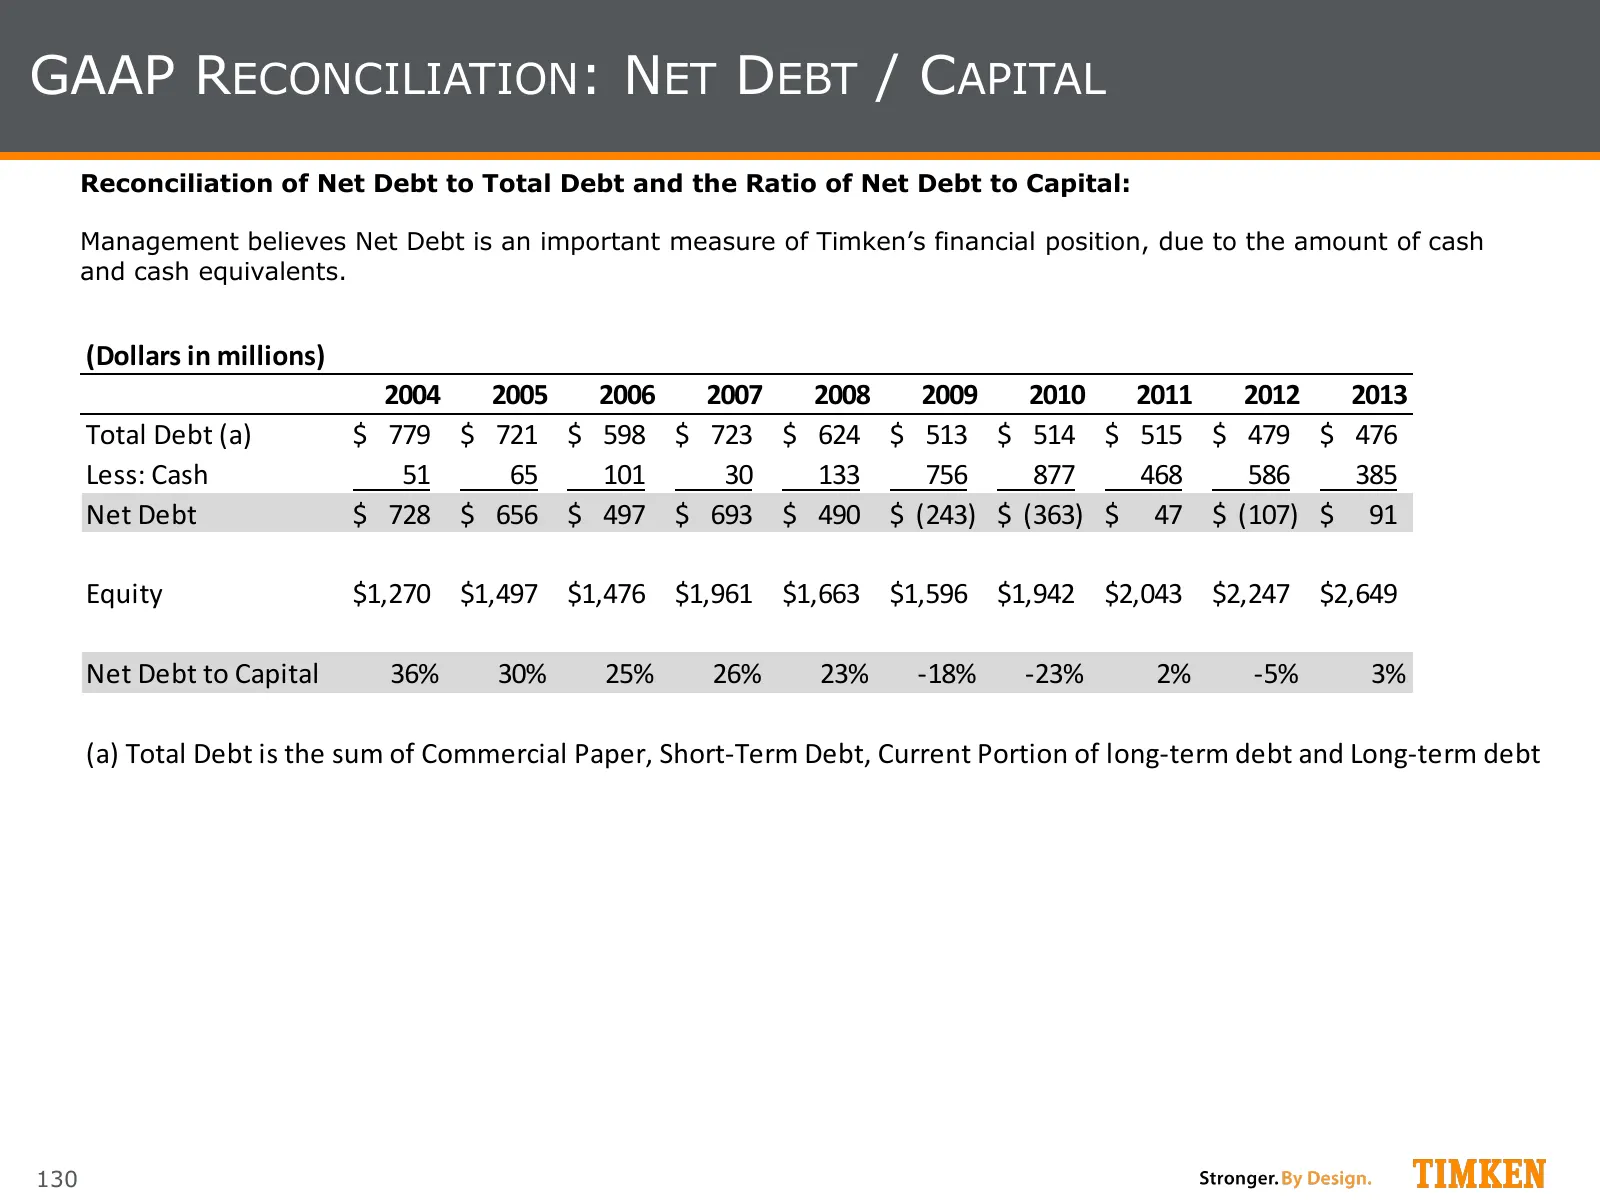
GAAP RECONCILIATION: NET DEBT / CAPITAL Reconciliation of Net Debt to Total Debt and the Ratio of Net Debt to Capital: Management believes Net Debt is an important measure of Timken’s financial position, due to the amount of cash and cash equivalents. (Dollars in millions) 2004 2005 2006 2007 2008 2
Slide 131: GAAP Reconciliation: Pro Forma Revenue and EBIT
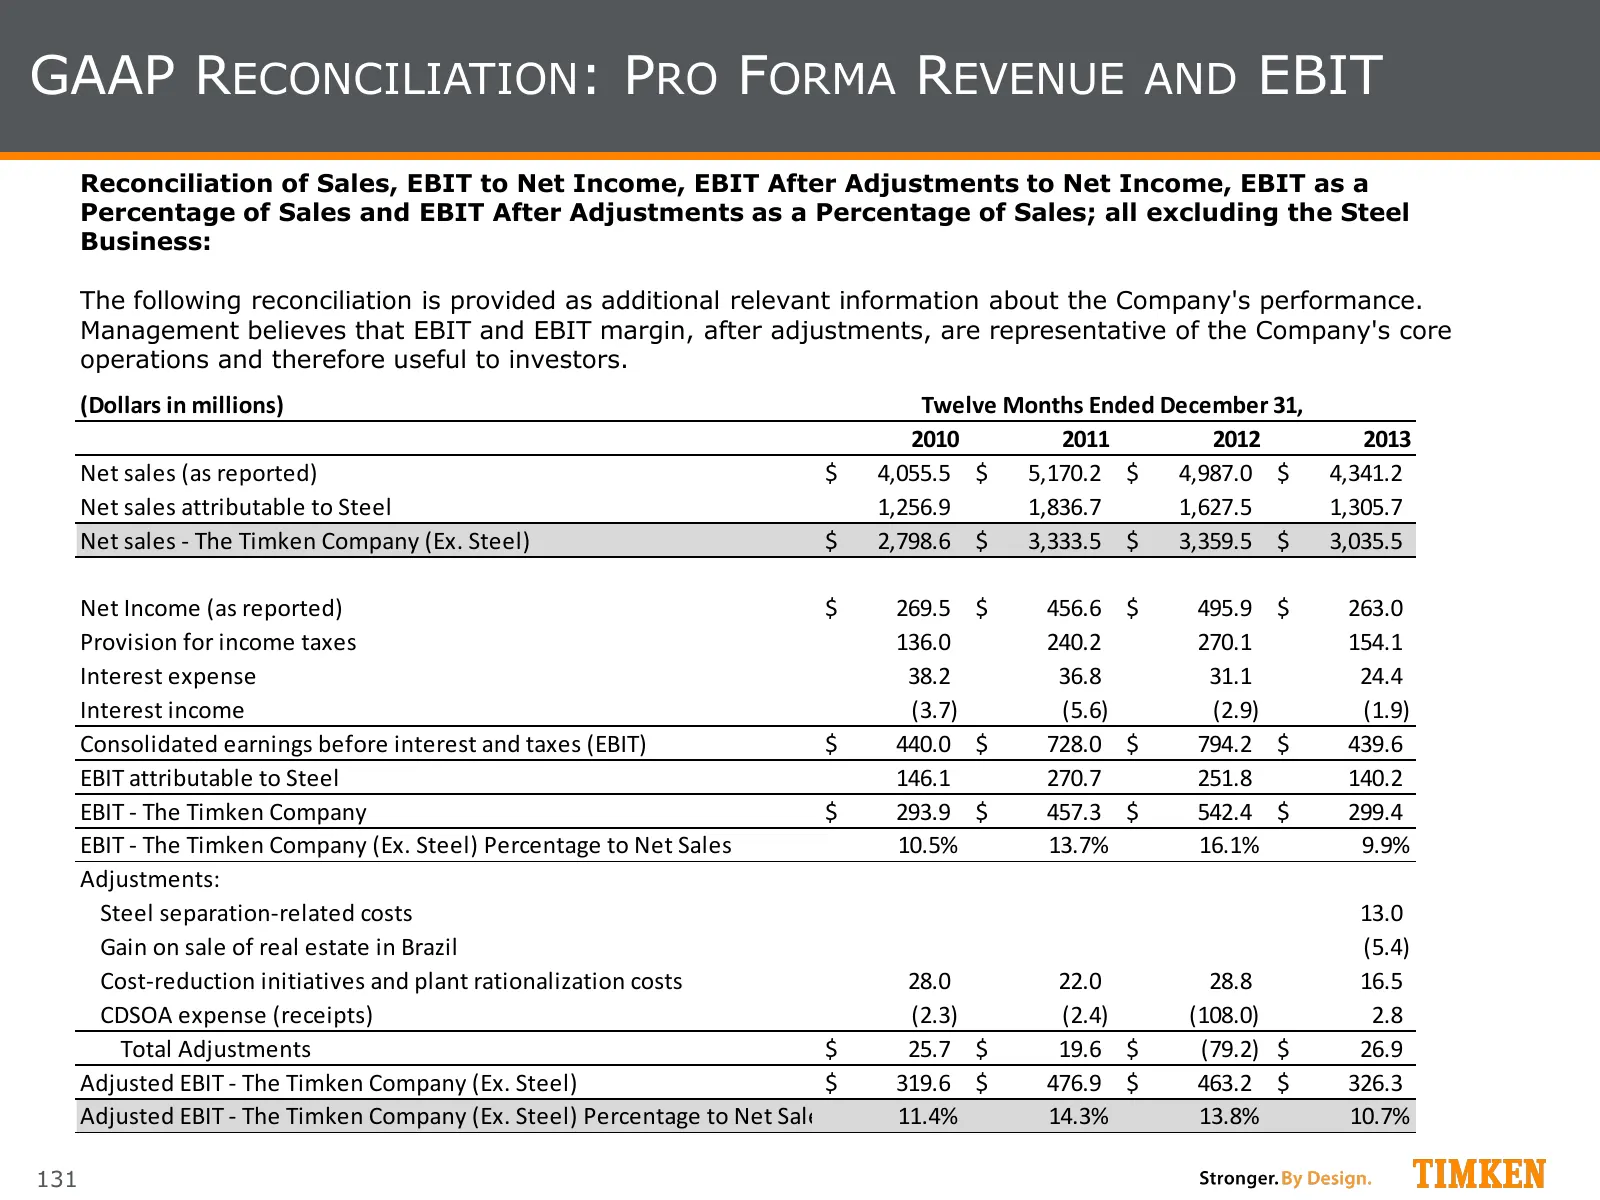
GAAP RECONCILIATION: PRO FORMA REVENUE AND EBIT Reconciliation of Sales, EBIT to Net Income, EBIT After Adjustments to Net Income, EBIT as a Percentage of Sales and EBIT After Adjustments as a Percentage of Sales; all excluding the Steel Business: The following reconciliation is provided as addition
Slide 132: GAAP Reconciliation: Pro Forma EPS
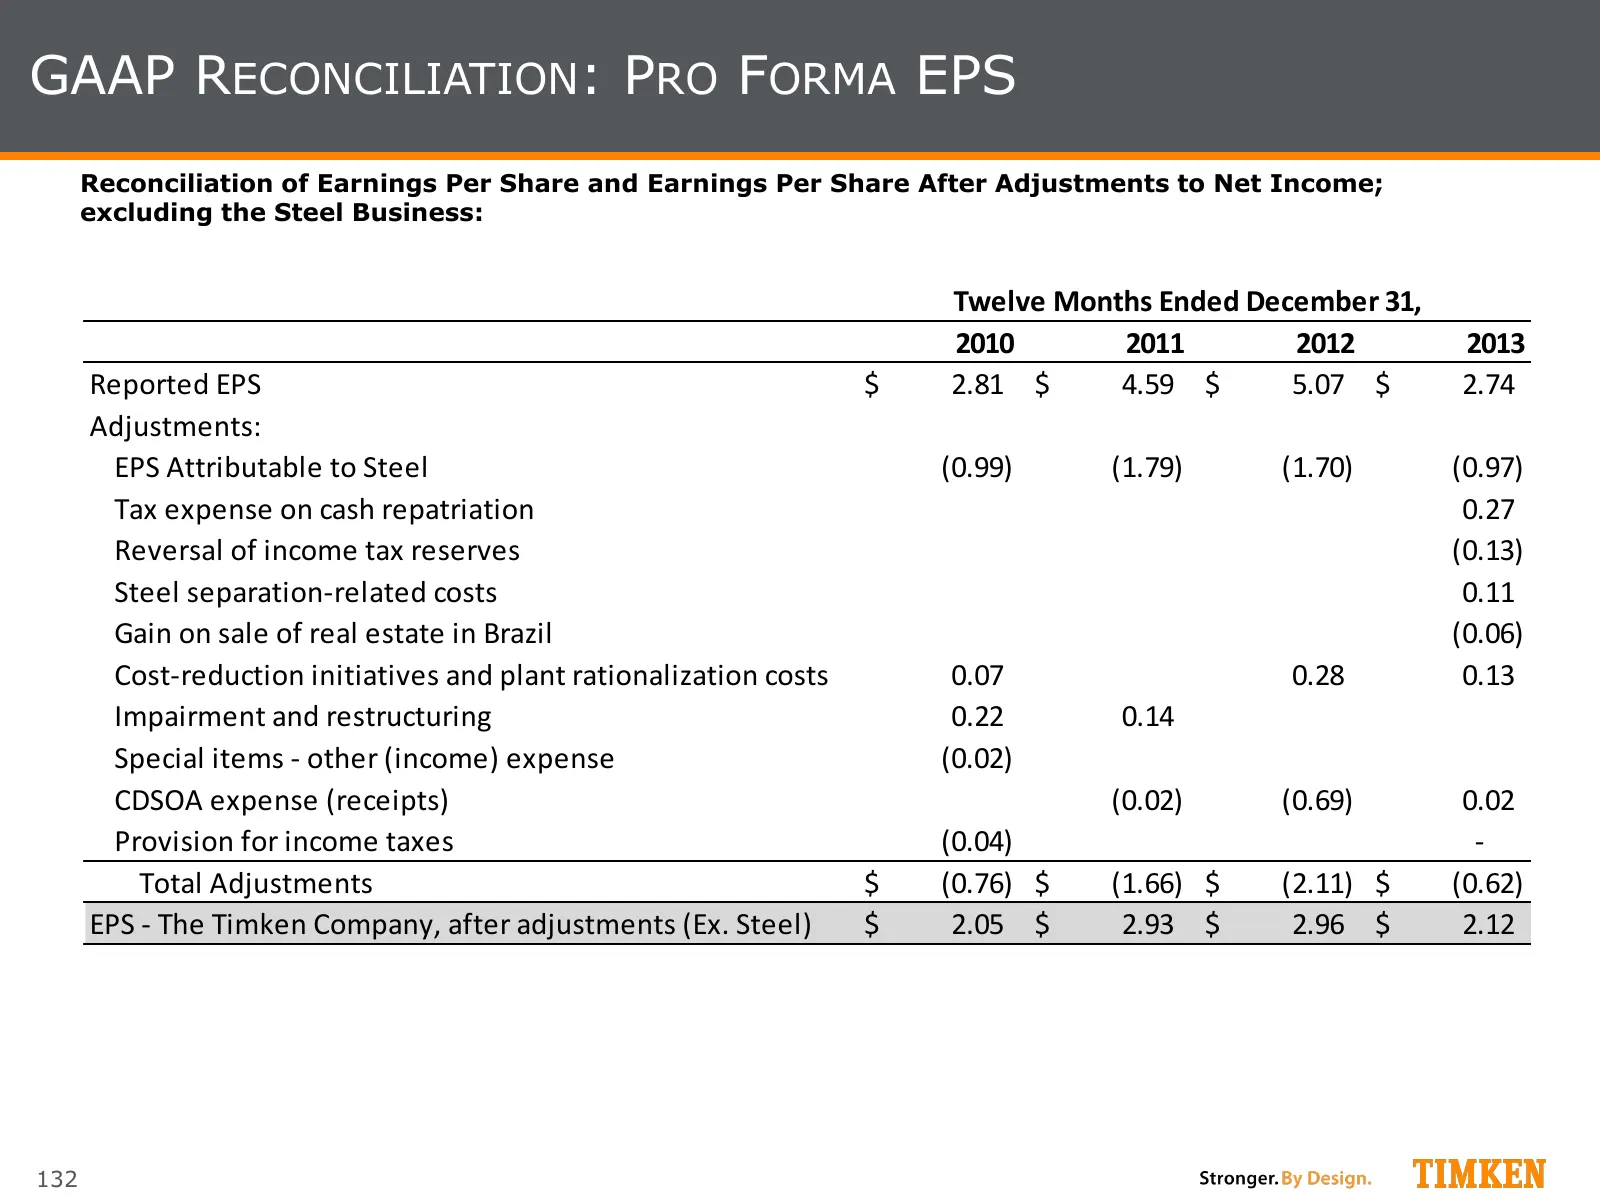
GAAP RECONCILIATION: PRO FORMA EPS Reconciliation of Earnings Per Share and Earnings Per Share After Adjustments to Net Income; excluding the Steel Business: Twelve Months Ended December 31, 2010 2011 2012 2013 Reported EPS $ 2.81 $ 4.59 $ 5.07 $ 2.74 Adjustments: EPS Attributable to Steel (0.99) (1
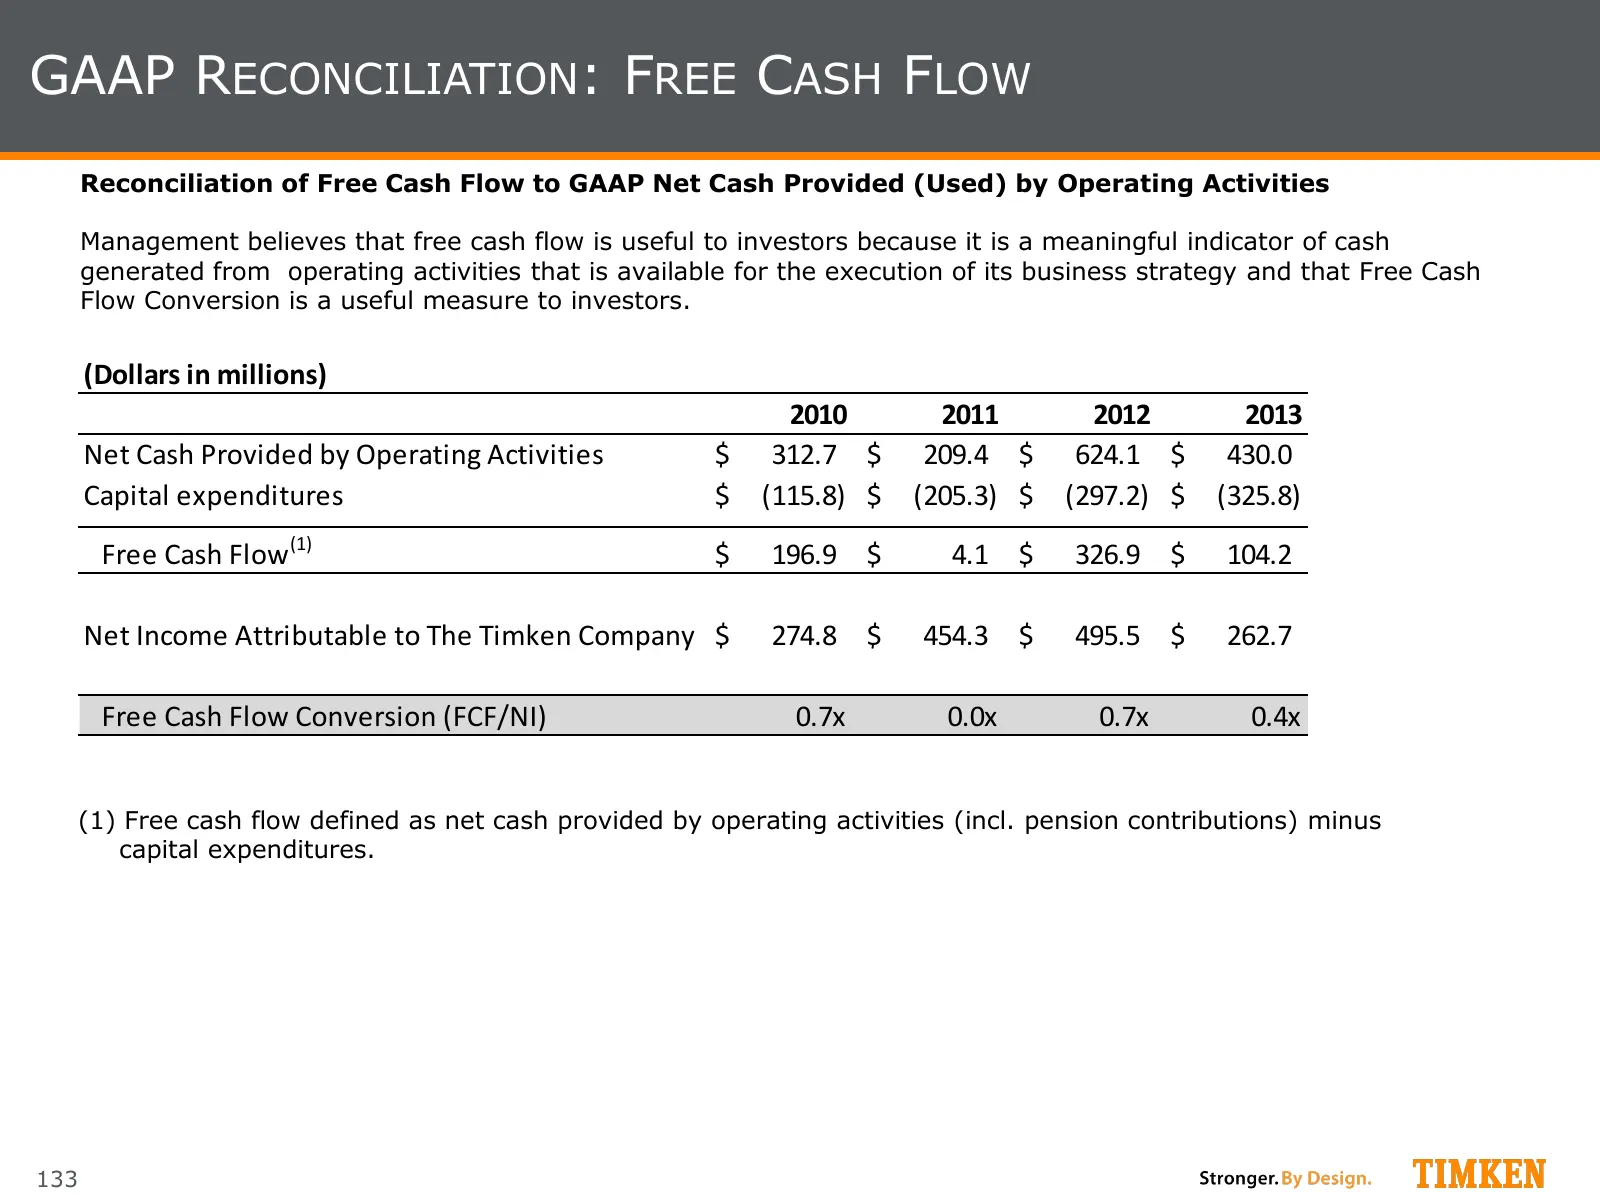
Slide 133: GAAP Reconciliation: Free Cash Flow
GAAP RECONCILIATION: FREE CASH FLOW Reconciliation of Free Cash Flow to GAAP Net Cash Provided (Used) by Operating Activities Management believes that free cash flow is useful to investors because it is a meaningful indicator of cash generated from operating activities that is available for the exec
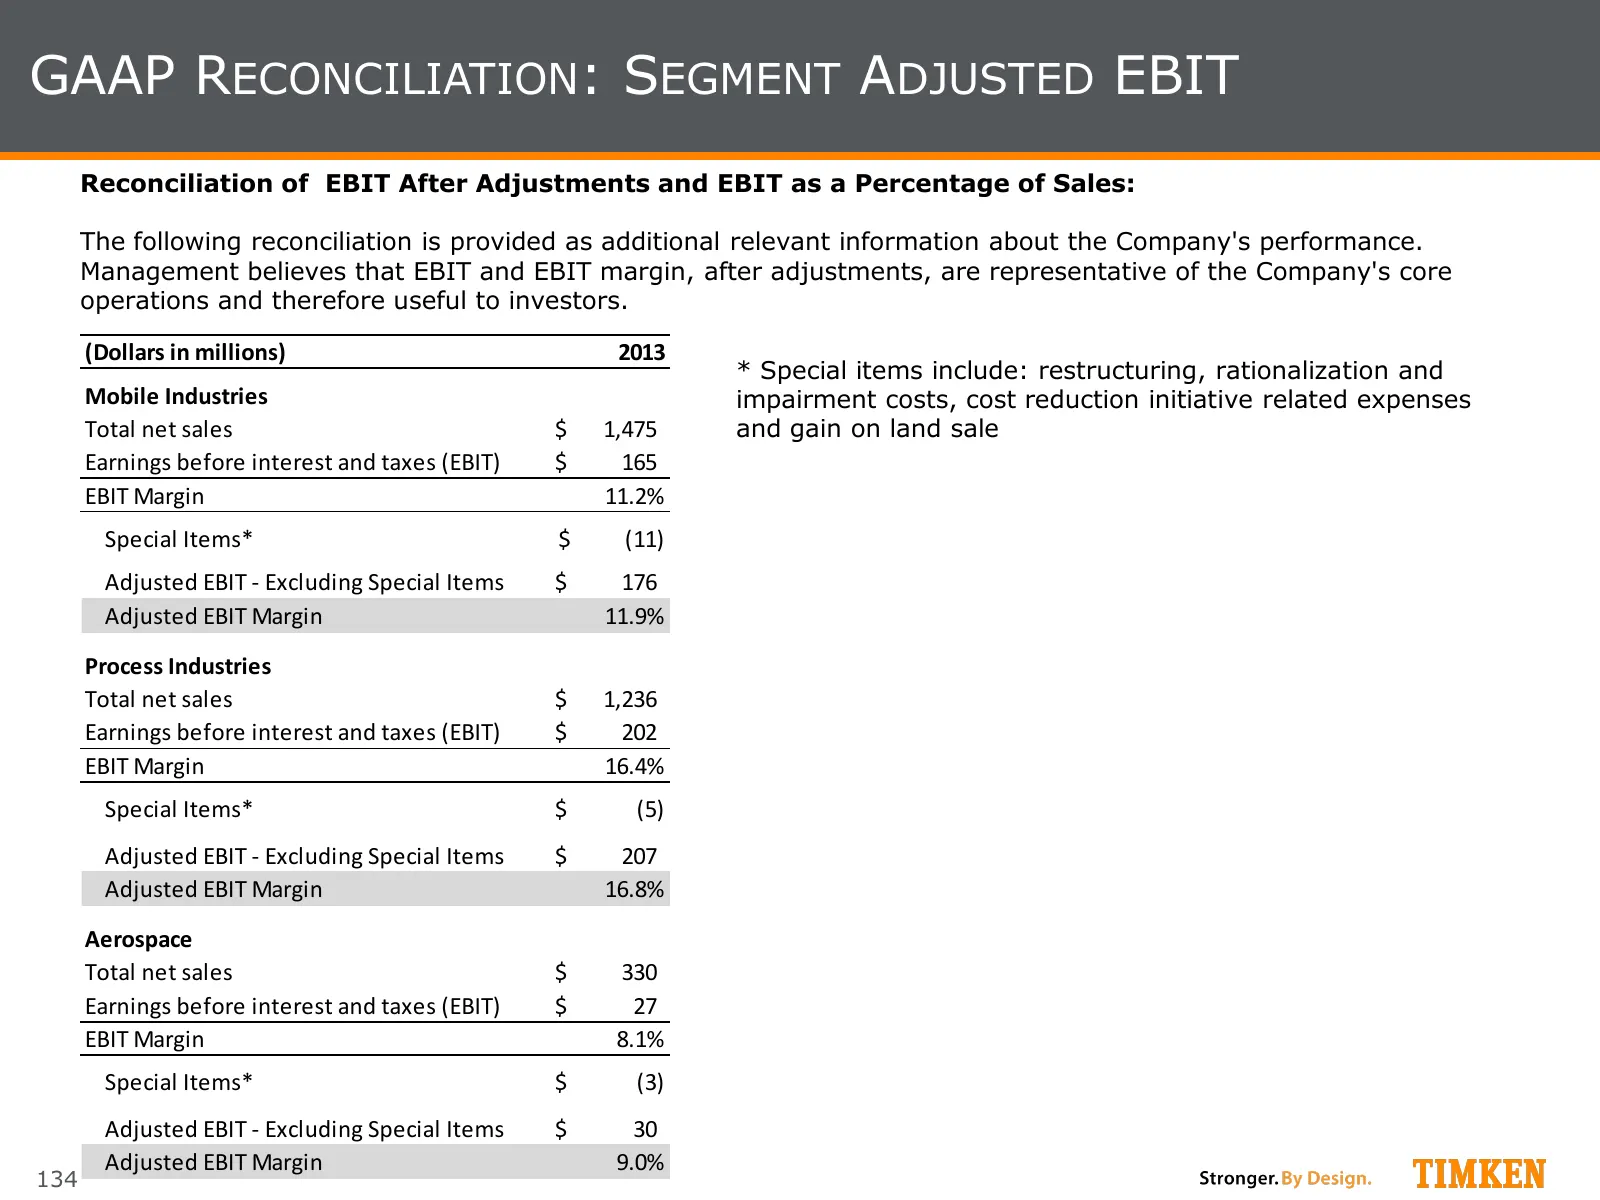
Slide 134: GAAP Reconciliation: Segment Adjusted EBIT
GAAP RECONCILIATION: SEGMENT ADJUSTED EBIT Reconciliation of EBIT After Adjustments and EBIT as a Percentage of Sales: The following reconciliation is provided as additional relevant information about the Company's performance. Management believes that EBIT and EBIT margin, after adjustments, are re
Source: Internet Archive copy of timken.com
More decks from Timken Company (the)
 The Timken Company — Baird Global Industrial Conference 202641 slides · Nov 10, 2026
 The Timken Company — Q3 2026 Earnings Presentation28 slides · Nov 4, 2026
 The Timken Company — Morgan Stanley Laguna Conference 202639 slides · Sep 16, 2026
 The Timken Company — Q2 2026 Earnings Presentation27 slides · Aug 4, 2026
 The Timken Company — Investor Presentation (August 2026)39 slides · August 2026
 The Timken Company — Investor Presentation (June 2026)38 slides · June 2026