Captiva Software — Sixth Annual Needham Growth Conference (January 2004)
10 slides from Captiva Software's conference presentation, Jan 12, 2004
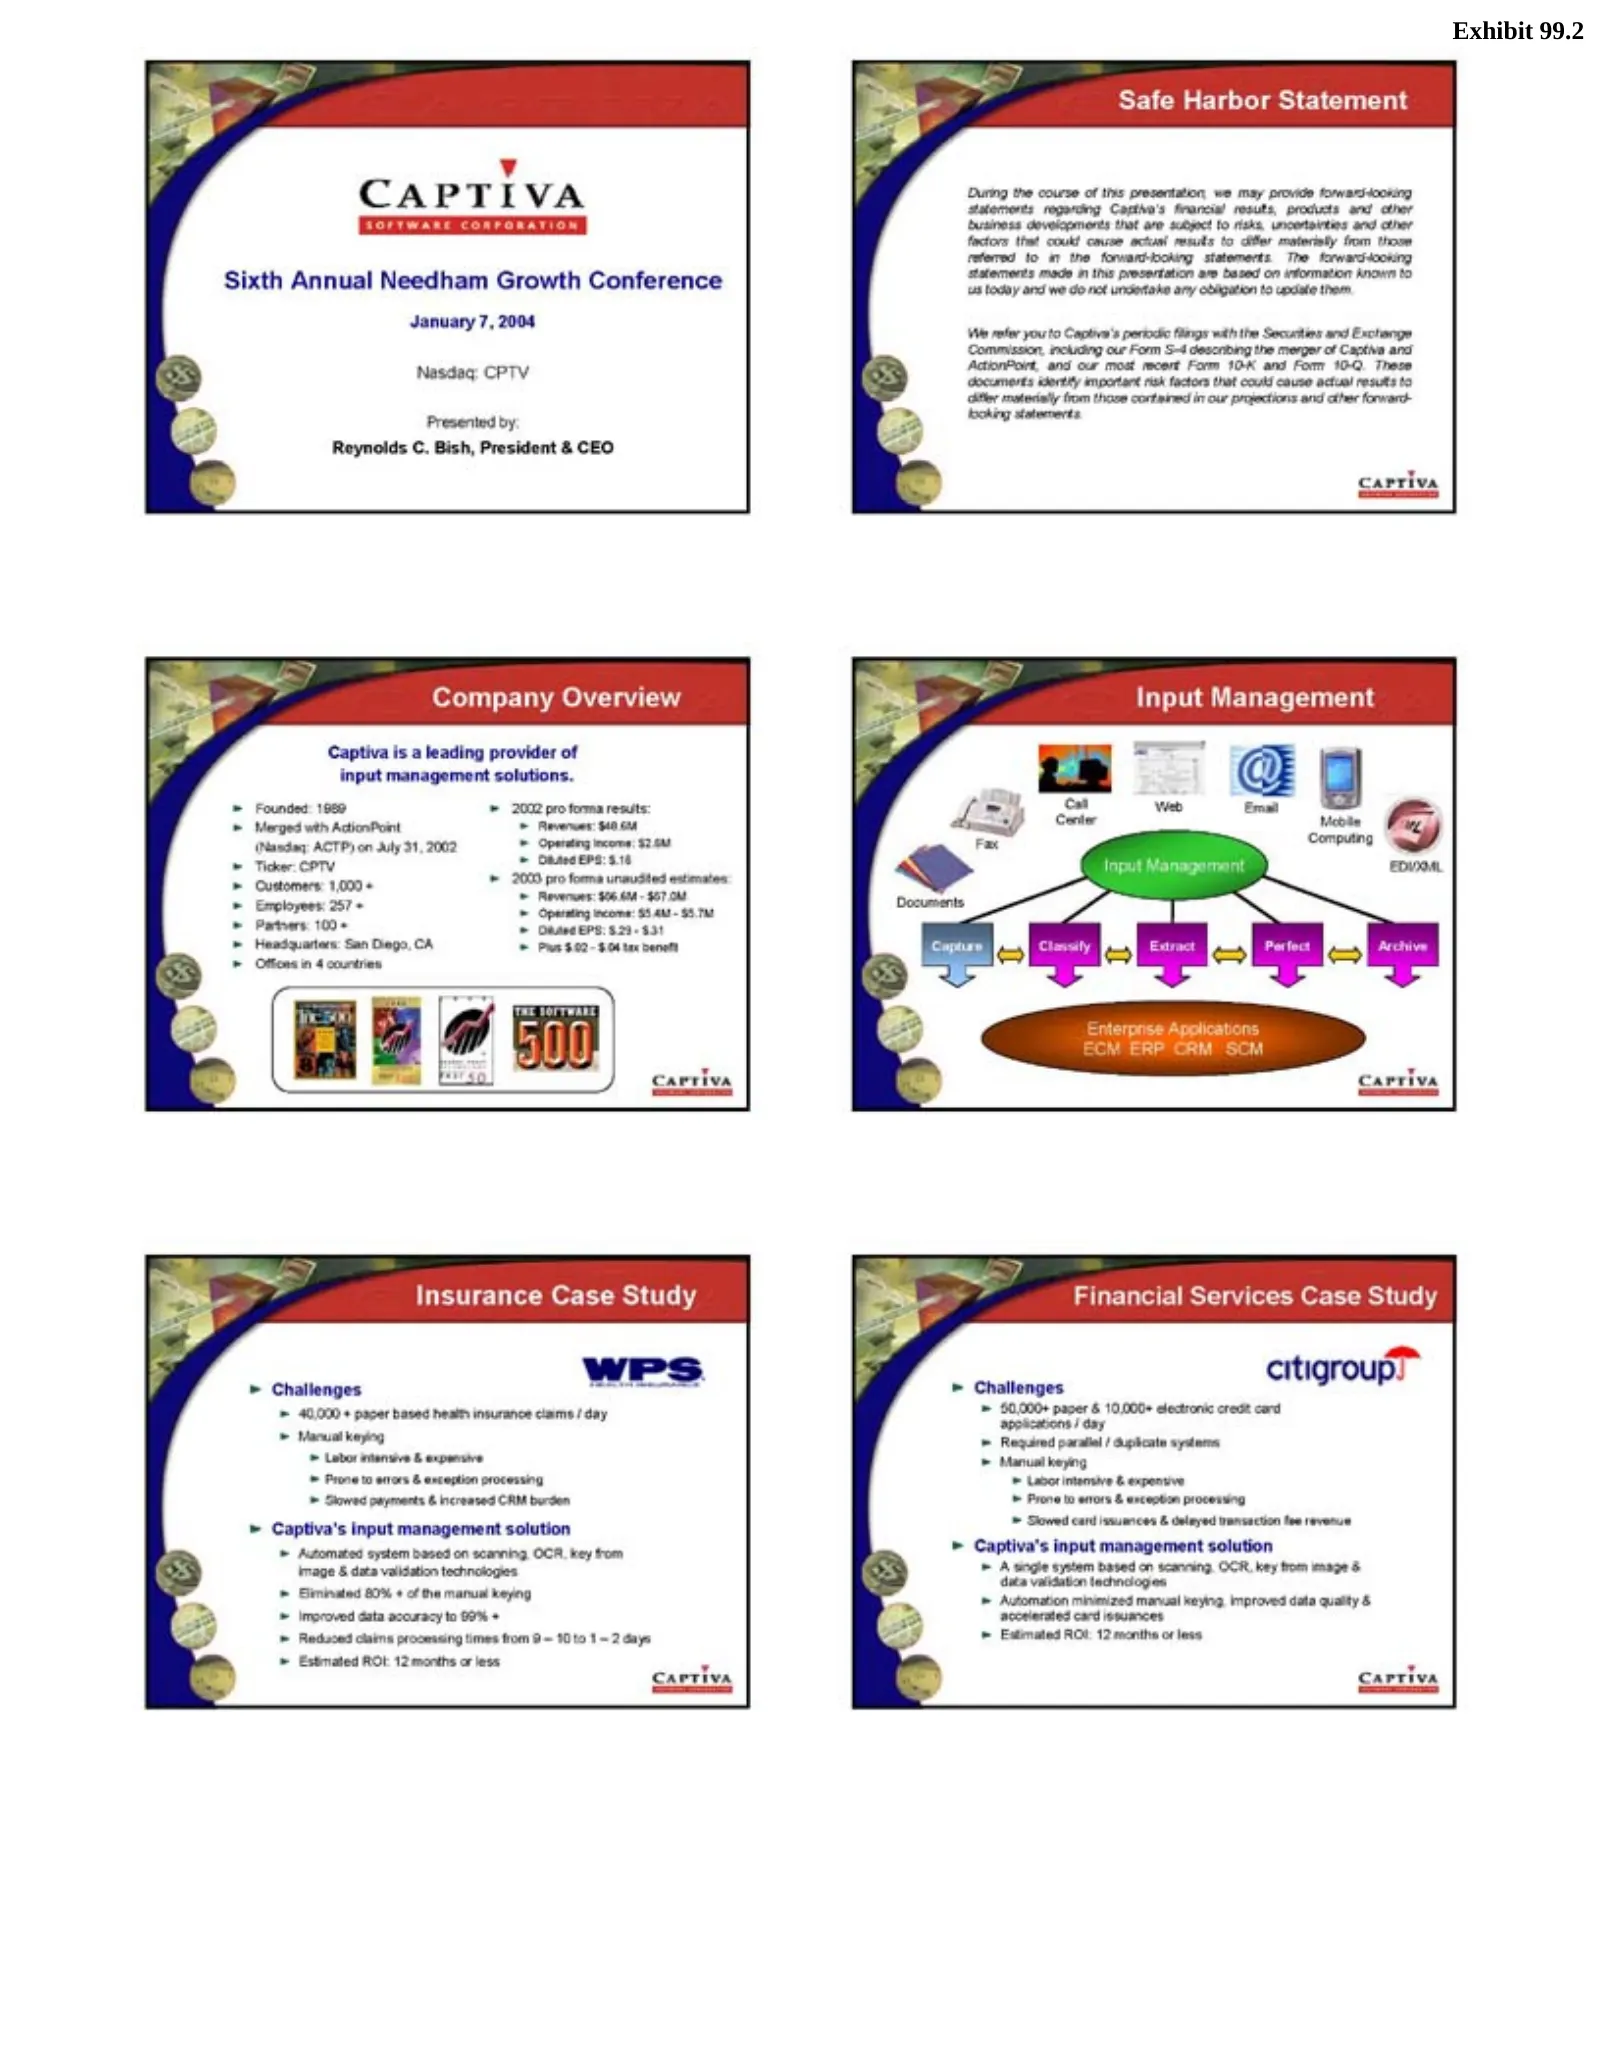
Slide 1: Sixth Annual Needham Growth Conference
Exhibit 99.2 Sixth Annual Needham Growth Conference January 7, 2004 Nasdaq: CPTV Presented by: Reynolds C. Bish, President & CEO Safe Harbor Statement During the course of this presentation, we may provide forward-looking statements regarding Captiva’s financial results, products and other business

Slide 2: Company Overview and Case Studies
Ticker: CPTV 2003 pro forma unaudited estimates: Customers: 1,000 + Revenues: $56.6M—$57.0M Employees: 257 + Operating Income: $5.4M—$5.7M Partners: 100 + Diluted EPS: $.29—$.31 Headquarters: San Diego, CA Plus $.02—$.04 tax benefit Offices in 4 countries Input Management Call Web Email Center Mobil
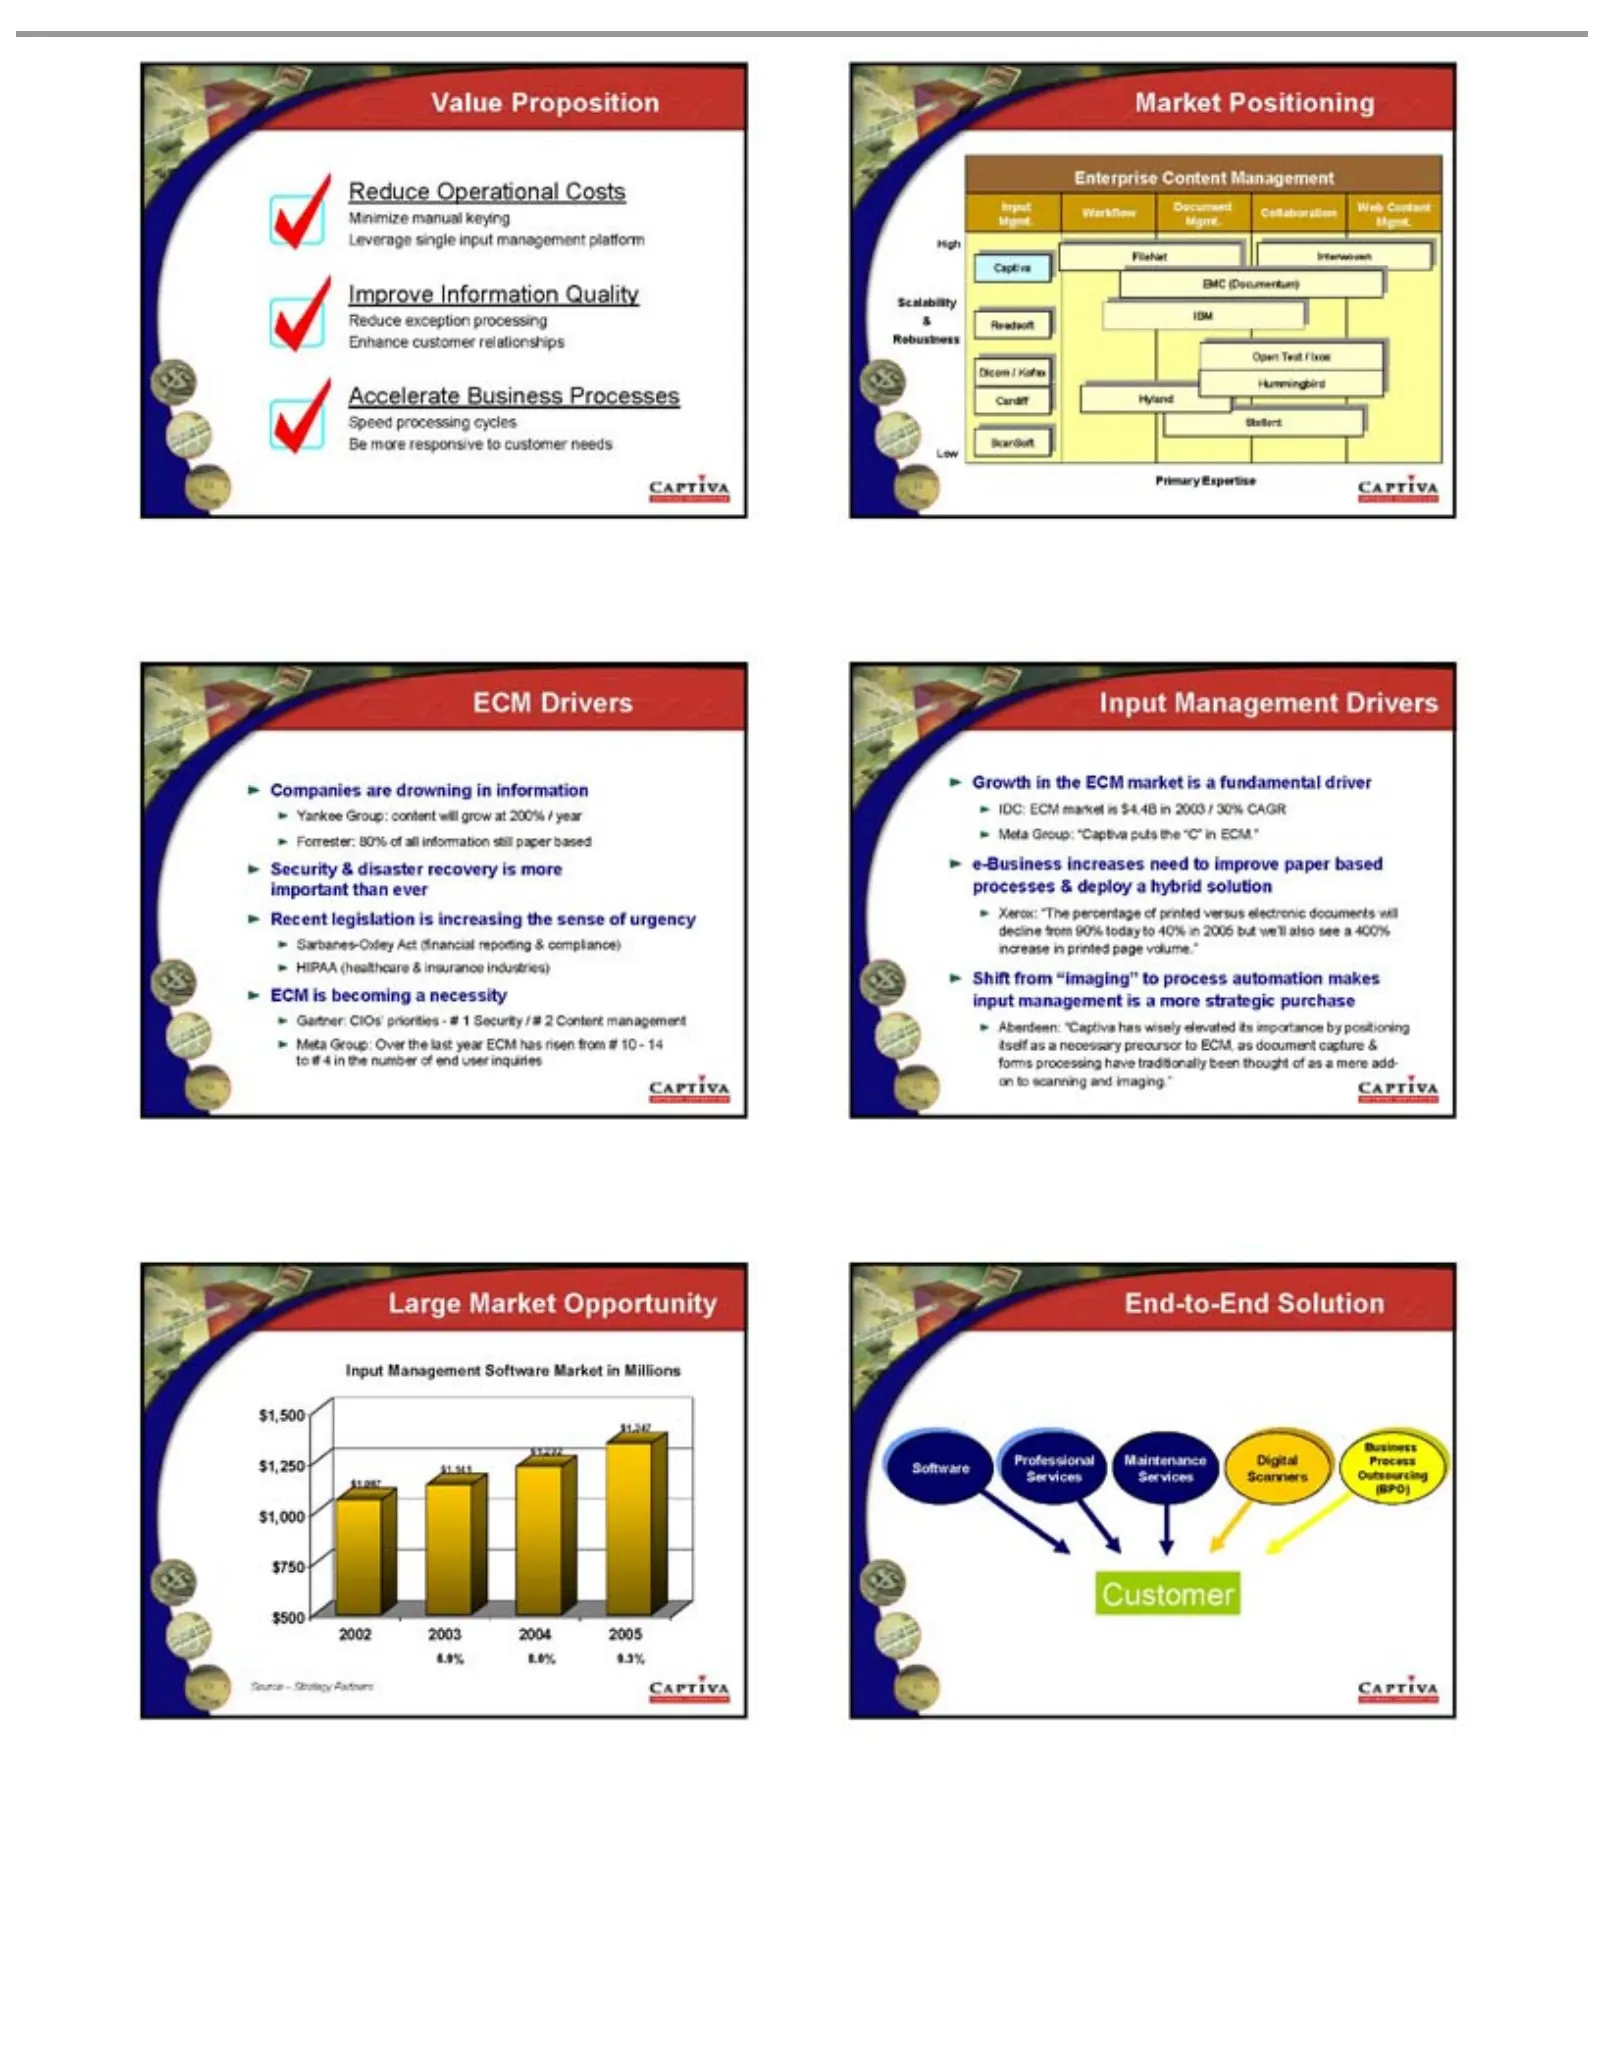
Slide 3: Value Proposition and Market Positioning
Value Proposition Reduce Operational Costs Minimize manual keying Leverage single input management platform Improve Information Quality Reduce exception processing Enhance customer relationships Accelerate Business Processes Speed processing cycles Be more responsive to customer needs Market Positio

Slide 4: ECM and Input Management Drivers
Scalability & IBM Readsoft Robustness Open Text / Ixos Dicom / Kofax Hummingbird Cardiff Hyland Stellent ScanSoft Low Primary Expertise ECM Drivers Companies are drowning in information Yankee Group: content will grow at 200% / year Forrester: 80% of all information still paper based Security & disa
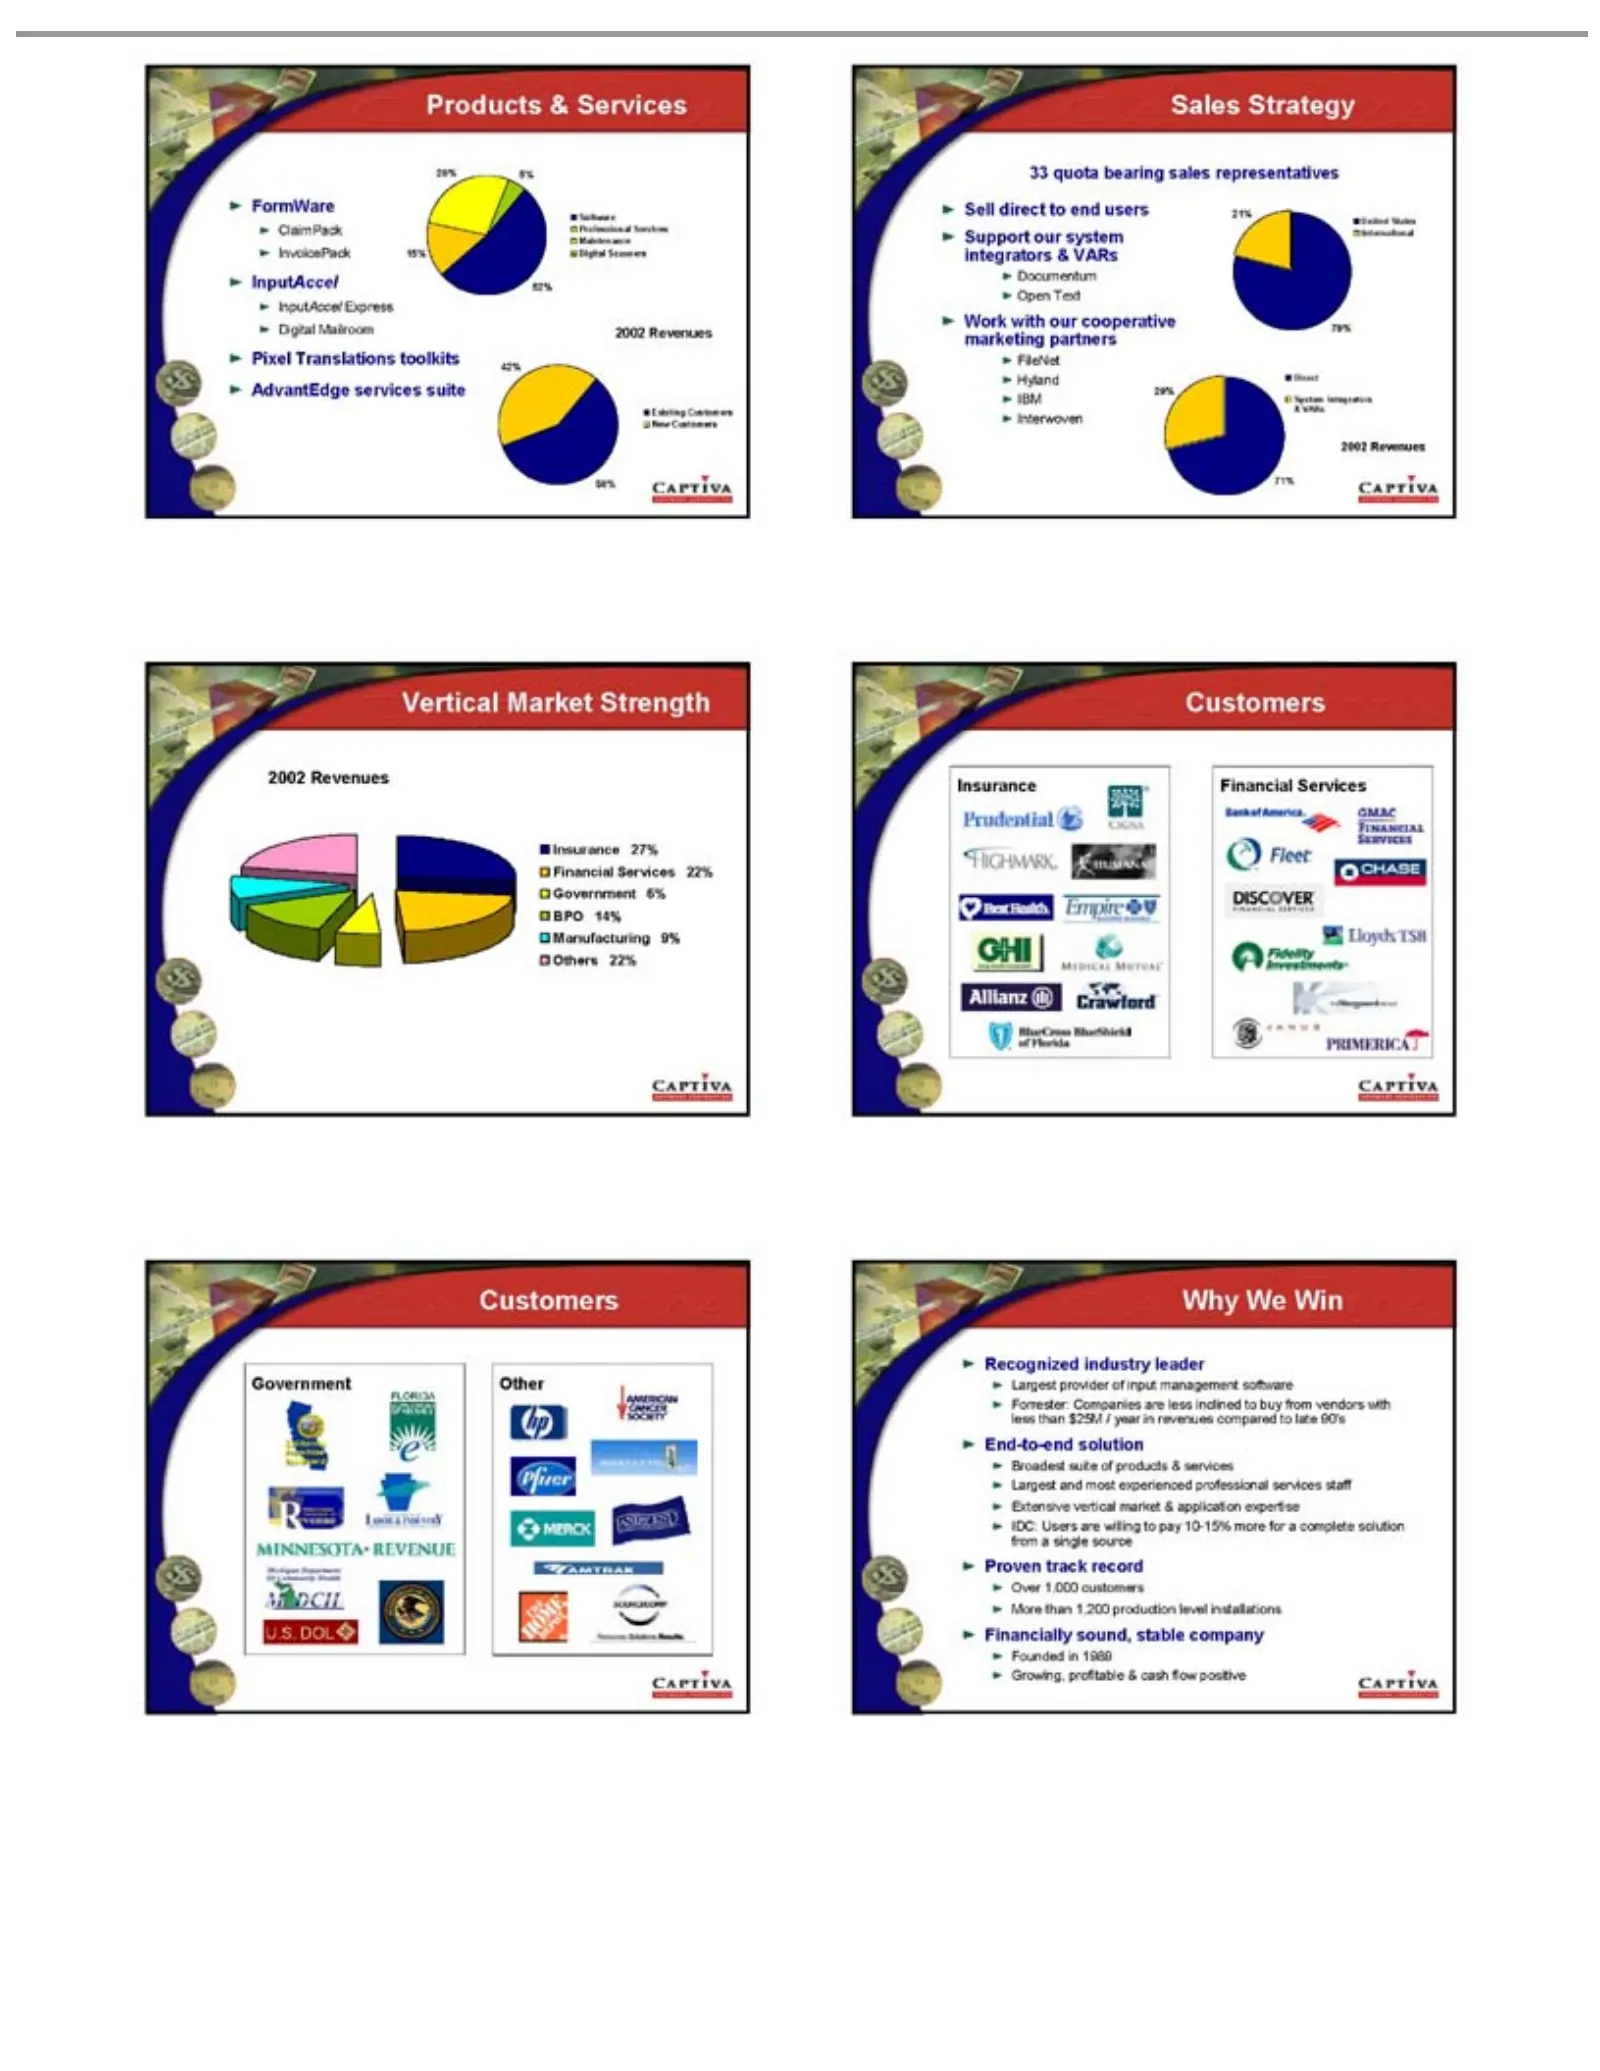
Slide 5: Products & Services
Products & Services 28% 5% FormWare Software ClaimPack Professional Services Maintenance InvoicePack 15% Digital Scanners InputAccel 52% InputAccel Express Digital Mailroom 2002 Revenues Pixel Translations toolkits 42% AdvantEdge services suite Existing Customers New Customers 58% Sales Strategy

Slide 6: Sales Strategy, Vertical Markets and Why We Win
33 quota bearing sales representatives Sell direct to end users 21% United States Support our system International integrators & VARs Documentum Open Text Work with our cooperative 79% marketing partners FileNet Hyland Direct 29% IBM System Integrators & VARs Interwoven 2002 Revenues 71% Vertical Ma
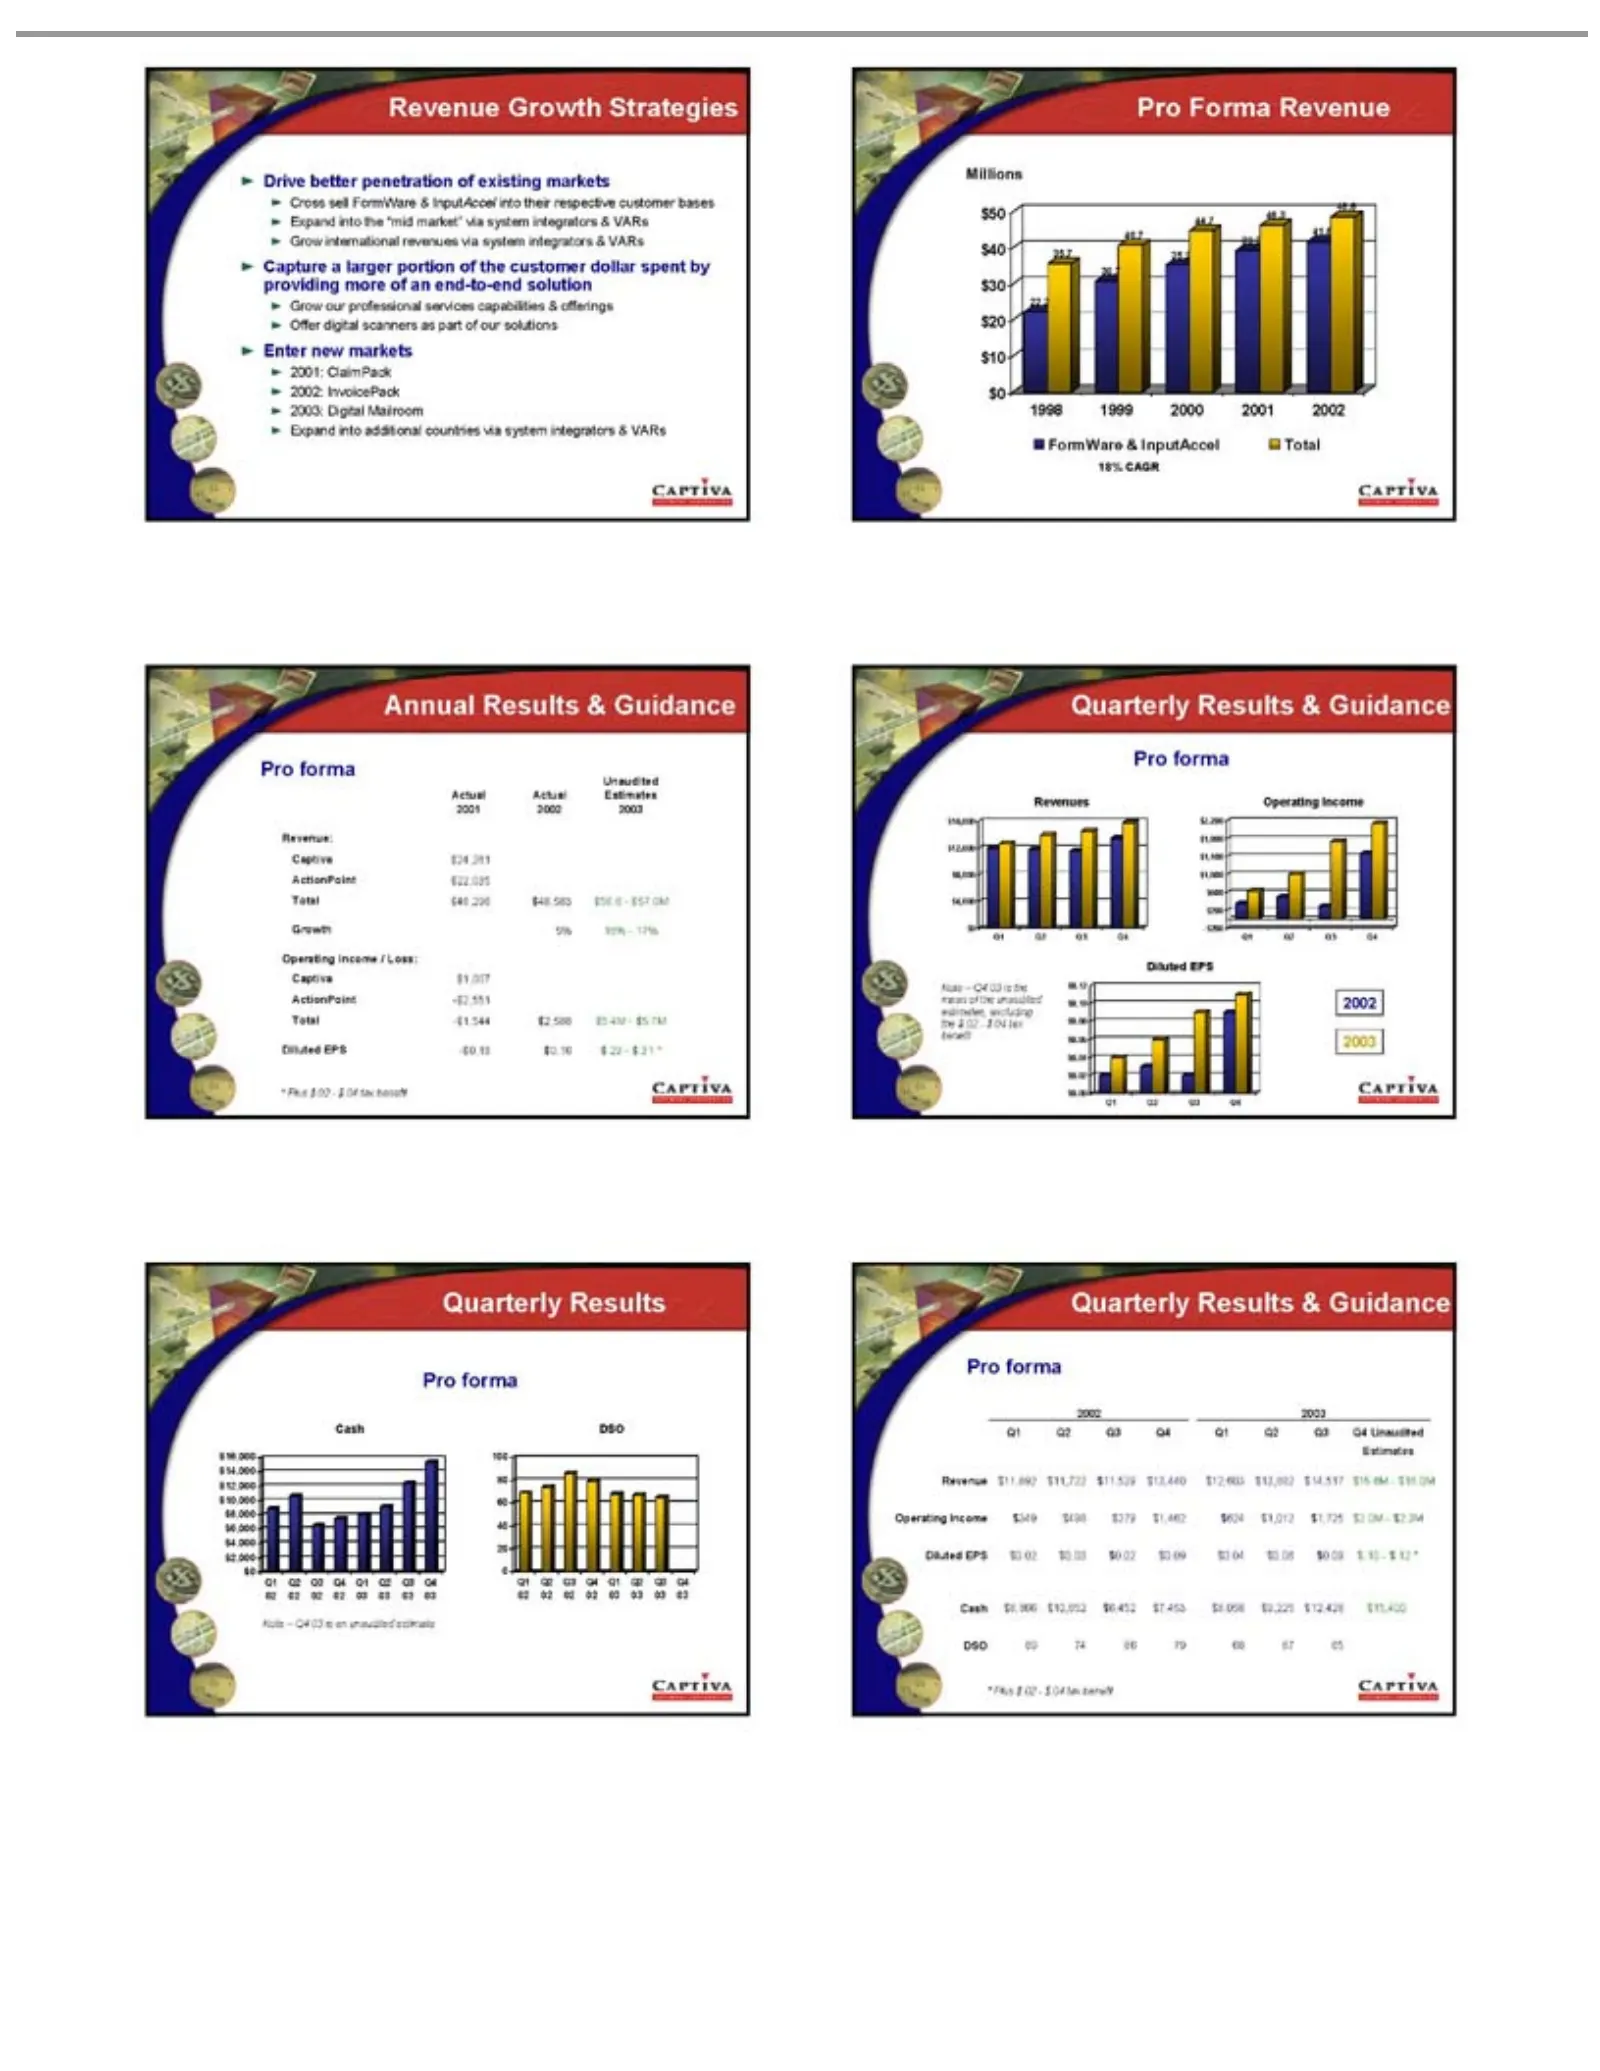
Slide 7: Revenue Growth Strategies
Revenue Growth Strategies Drive better penetration of existing markets Cross sell FormWare & InputAccel into their respective customer bases Expand into the “mid market” via system integrators & VARs Grow international revenues via system integrators & VARs Capture a larger portion of the customer d

Slide 8: Annual Results & Guidance
$0 1998 1999 2000 2001 2002 FormWare & InputAccel Total 18% CAGR Annual Results & Guidance Pro forma Unaudited Actual Actual Estimates 2001 2002 2003 Revenue: Captiva $24,261 ActionPoint $22,035 Total $46,296 $48,583 $56.6—$57.0M Growth 5% 16%—17% Operating Income / Loss: Captiva $1,007 ActionPoint
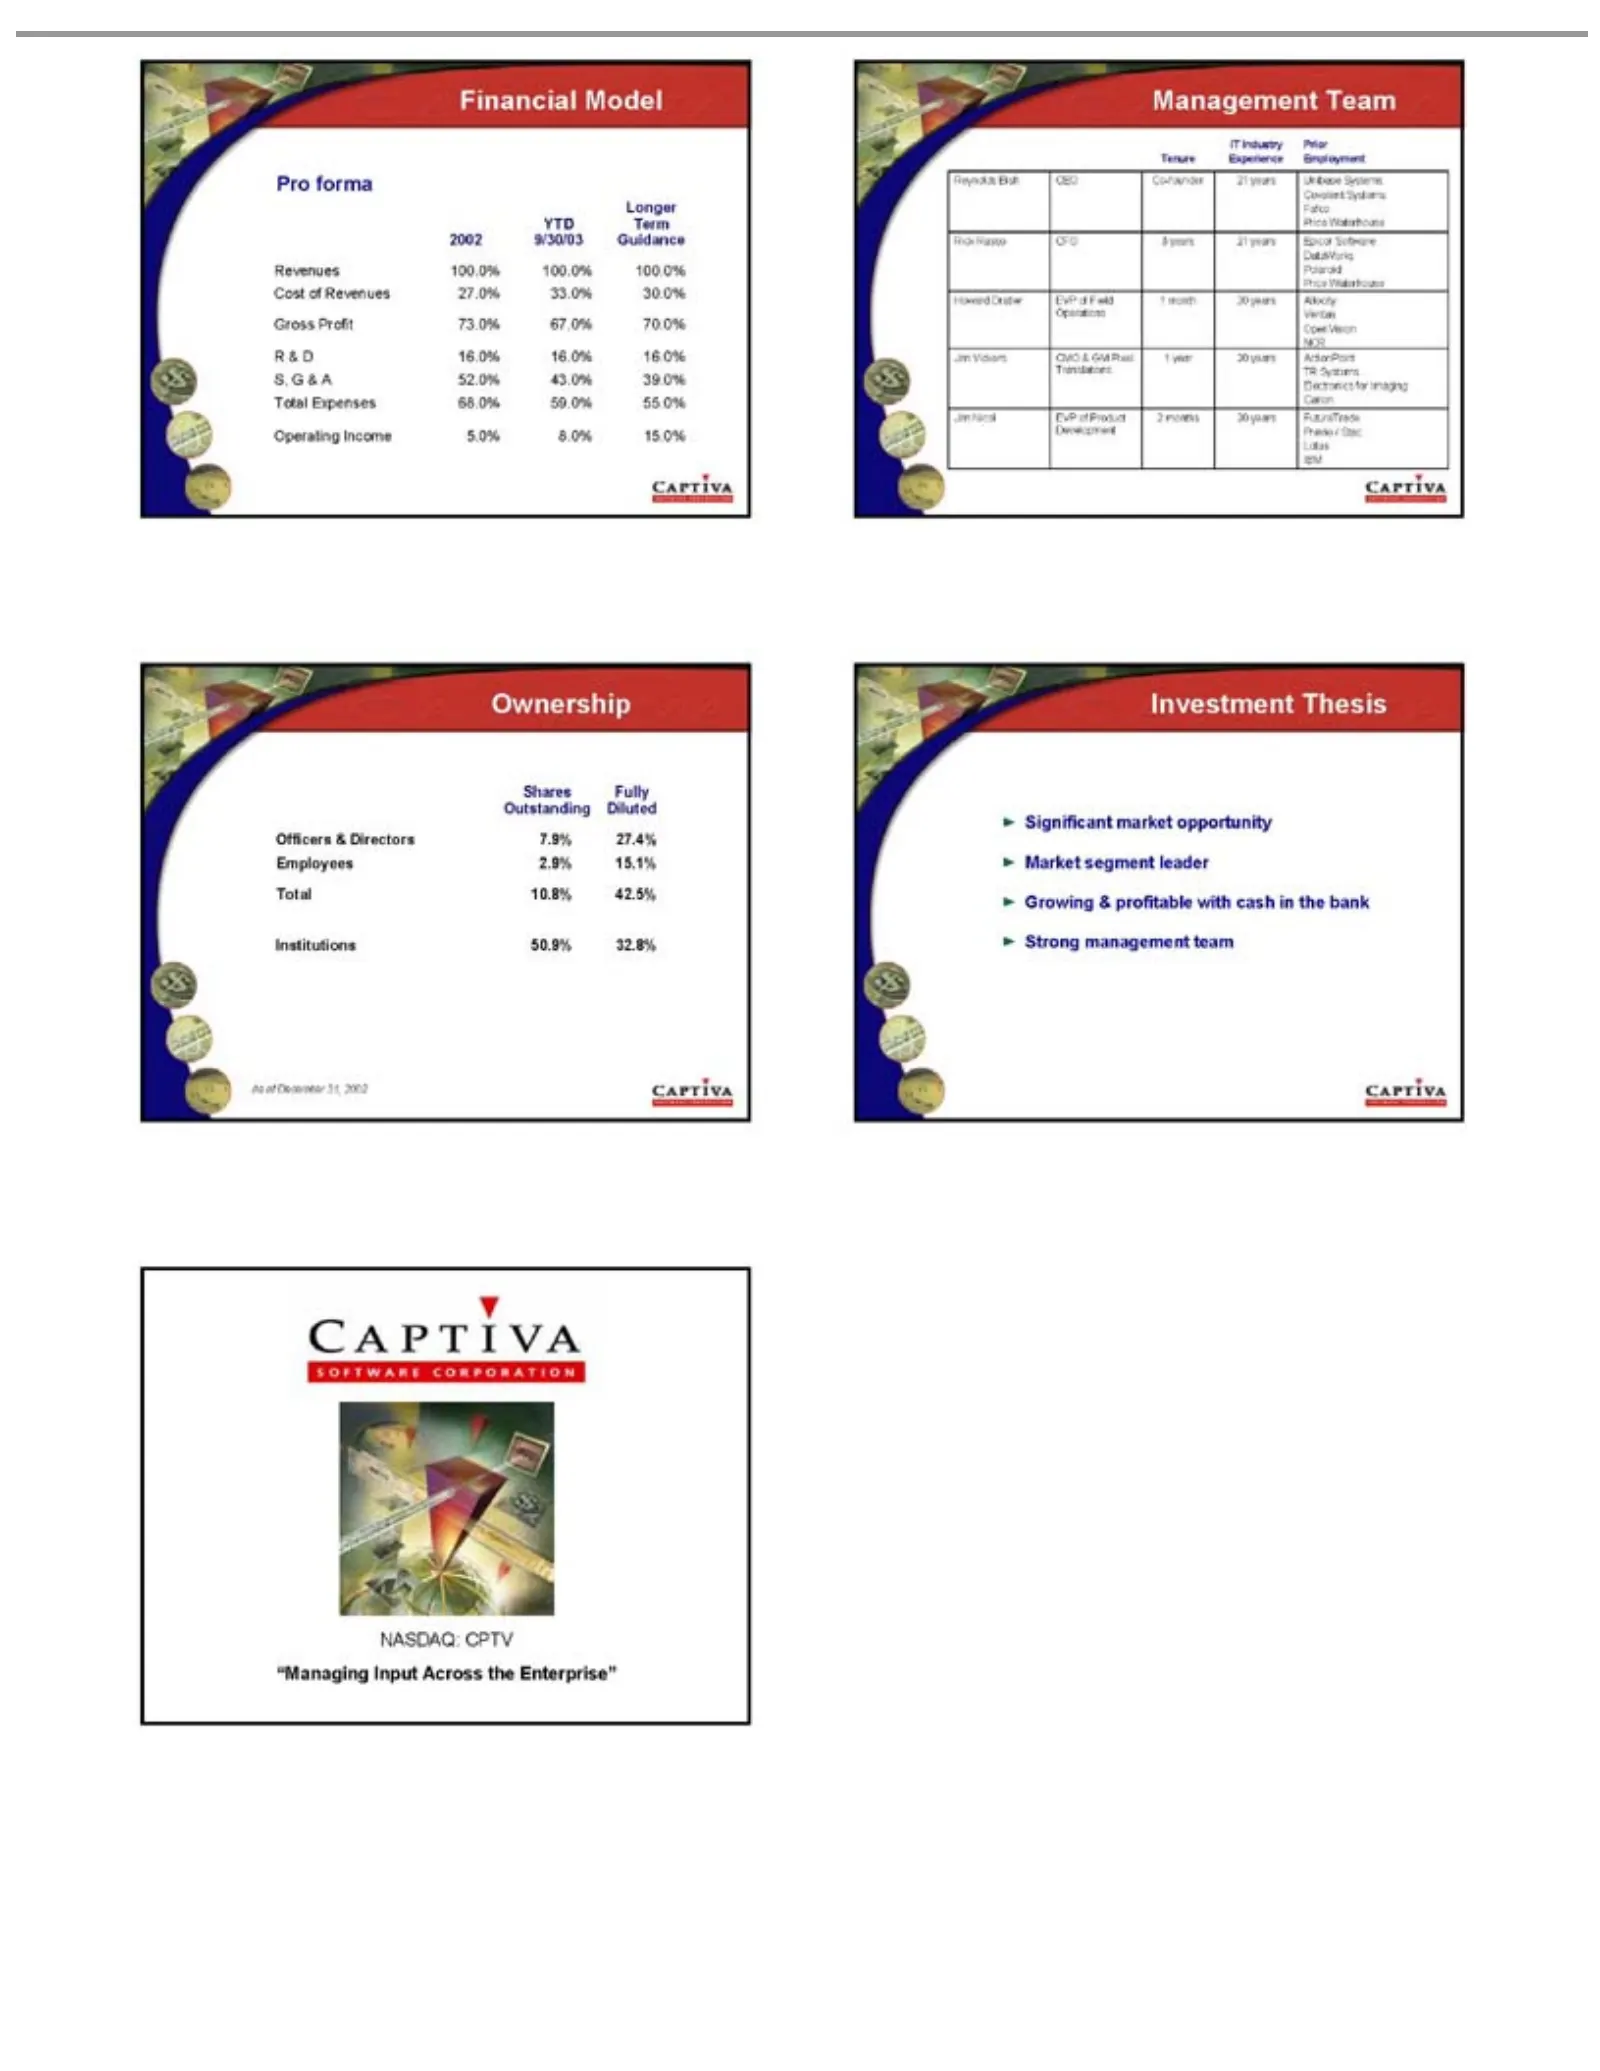
Slide 9: Financial Model and Management Team
Financial Model Pro forma Longer YTD Term 2002 9/30/03 Guidance Revenues 100.0% 100.0% 100.0% Cost of Revenues 27.0% 33.0% 30.0% Gross Profit 73.0% 67.0% 70.0% R & D 16.0% 16.0% 16.0% S, G & A 52.0% 43.0% 39.0% Total Expenses 68.0% 59.0% 55.0% Operating Income 5.0% 8.0% 15.0% Management Team IT Indu

Slide 10: Ownership and Investment Thesis
Shares Fully Outstanding Diluted Officers & Directors 7.9% 27.4% Employees 2.9% 15.1% Total 10.8% 42.5% Institutions 50.9% 32.8% As of December 31, 2002 Investment Thesis Significant market opportunity Market segment leader Growing & profitable with cash in the bank Strong management team NASDAQ: CP
Source: SEC EDGAR · 8-K filed Jan 12, 2004