Heritage Oaks Bancorp — Sandler O'Neill Conference 2013
29 slides from Heritage Oaks Bancorp's conference presentation, Mar 6, 2013

Slide 1: Heritage Oaks Bancorp - Sandler O'Neill Conference
Heritage Oaks Bancorp © Heritage OaksBank® Expect More Sandler O’Neill Conference March 5, 2013
Slide 2: Forward Looking Statements
Forward Looking Statements Certain statements contained in this Report, including, without limitation, statements containing the words “believes”, “anticipates”, “intends”, “expects”, and words of similar impact, constitute “forward- looking statements” within the meaning of Section 27A of the Secur
Slide 3: Company Overview
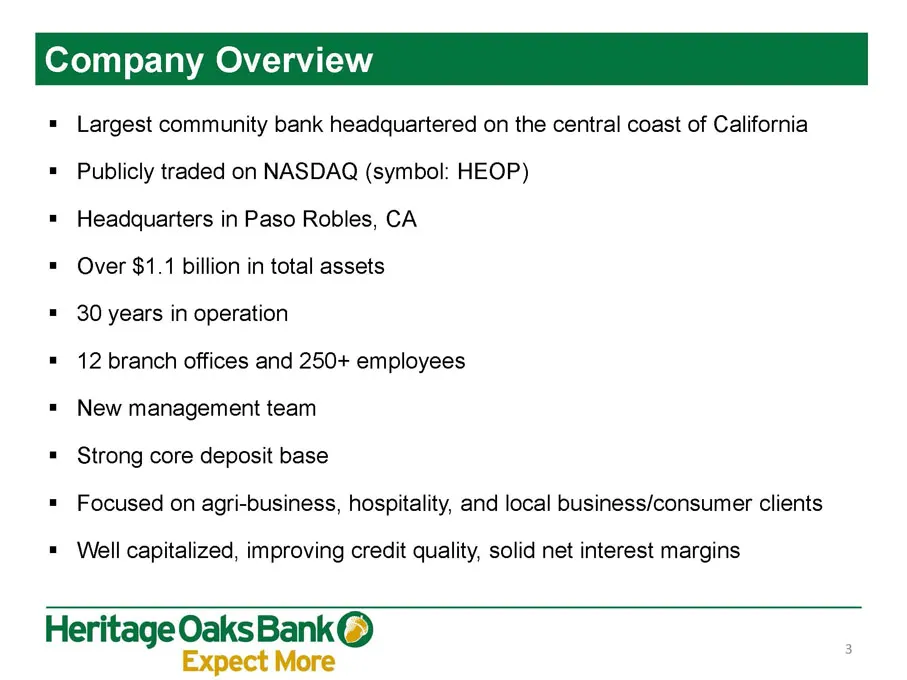
Company Overview = Largest community bank headquartered on the central coast of California * Publicly traded on NASDAQ (symbol: HEOP) = Headquarters in Paso Robles, CA * Over $1.1 billion in total assets = 30 years in operation = 12 branch offices and 250+ employees = New management team = Strong co
Slide 4: Leading Community Bank in Highly Attractive Market Area
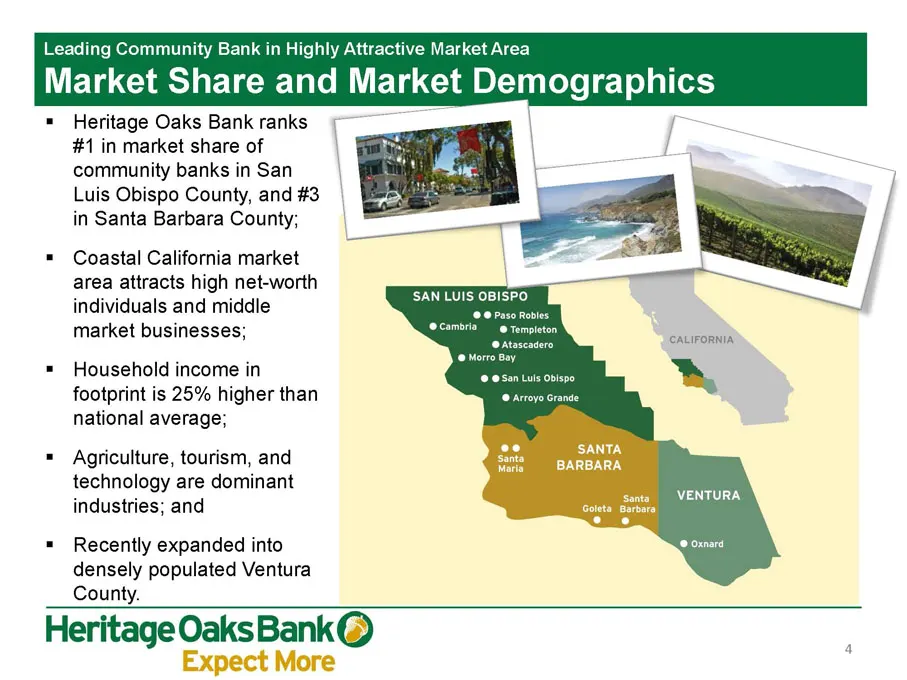
Leading Community Bank in Highly Attractive Market Area Market Share and Market Demographics = Heritage Oaks Bank ranks #1 in market share of community banks in San Luis Obispo County, and #3 in Santa Barbara County; = Coastal California market area attracts high net-worth individuals and middle mar
Slide 5: Leading Community Bank in Highly Attractive Market Area
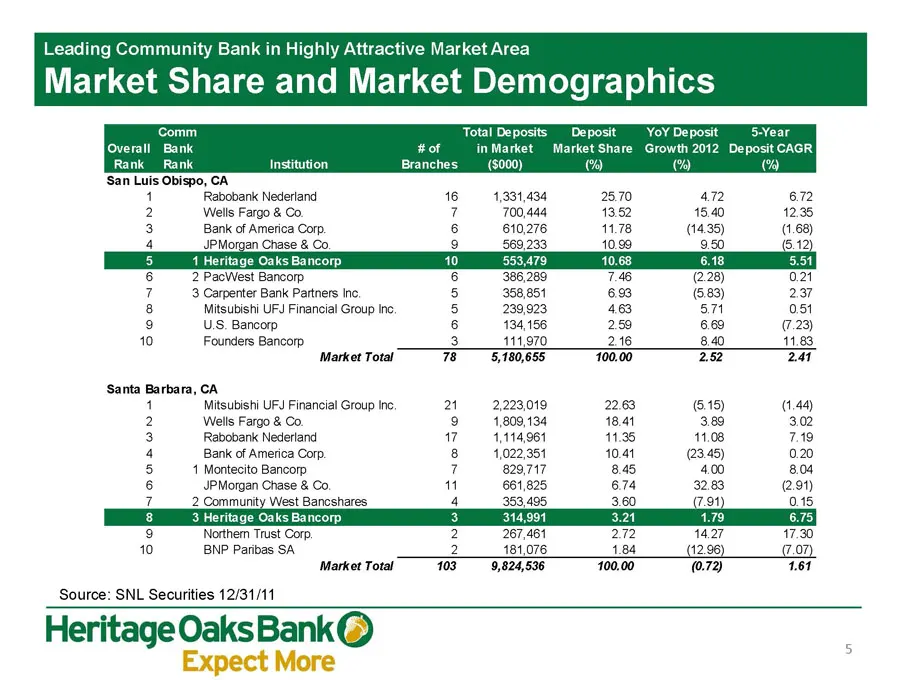
Leading Community Bank in Highly Attractive Market Area Market Share and Market Demographics ‘Comm Total Deposits Deposit YoYDeposit — 5-Year Overall Bank #of — inMarket Market Share Growth 2012 Deposit CAGR Rank _ Rank Institution Branches (S000) (%) (% 1) ‘San Luis Obispo, CA Rabobank Nederland 1
Slide 6: New Management Team
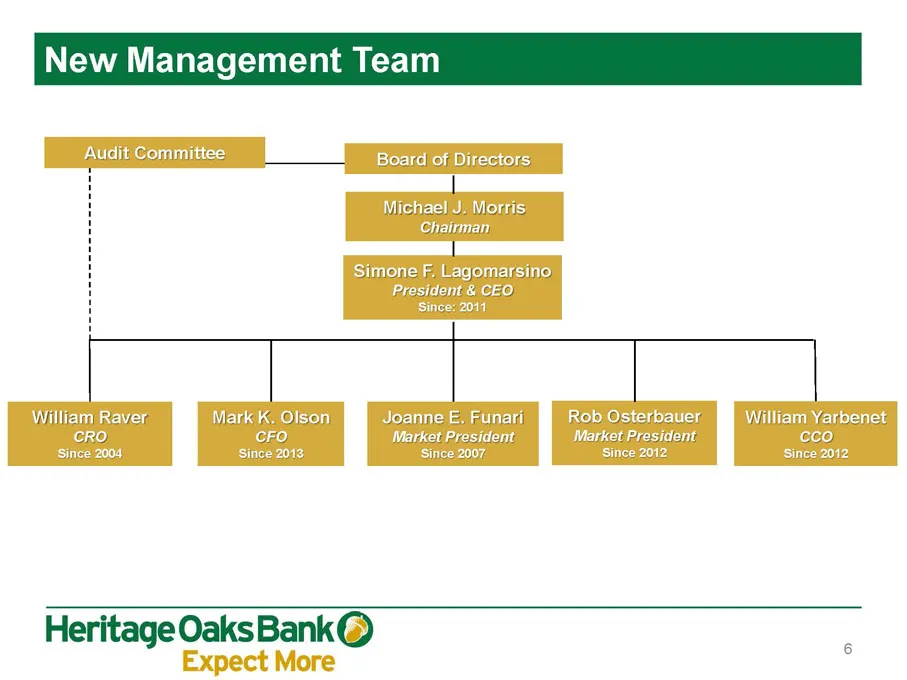
New Management Tea Board of Directors Michael J. Morris Chairman Simone F, Lagomarsino President & CEO, Since: 2014 William Raver Mark K. Olson Joanne E. Funari Rob Osterbauer William Yarbenet CRO CFO Market President Market President cco Since 2004 Since 2013 Since 2007 Since 2012 Since 2012 Heri O
Slide 7: Earnings Highlights
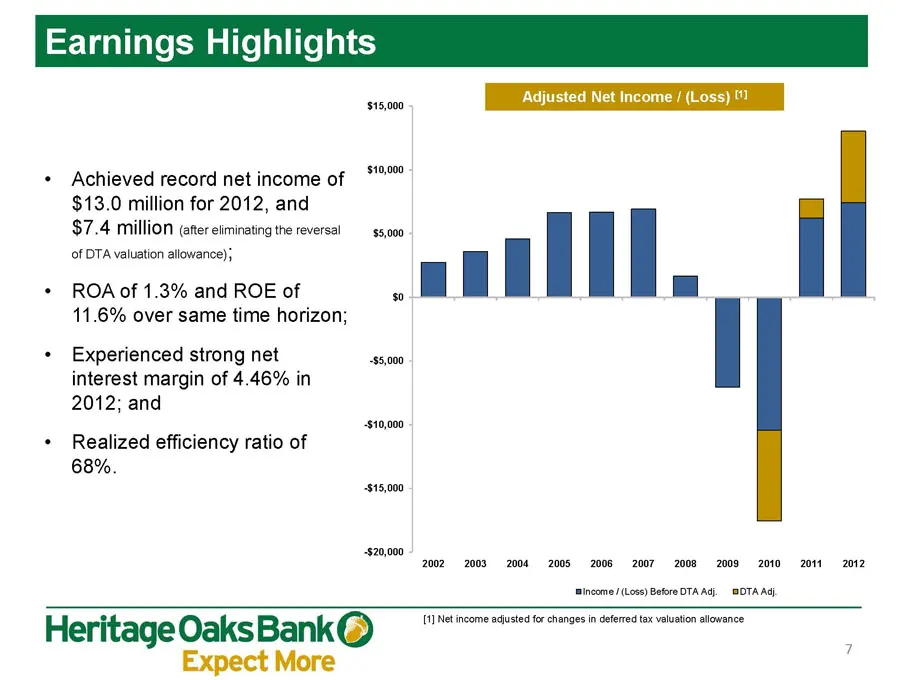
Earnings Highlights $15,000 A . s + Achieved record net income of |" $13.0 million for 2012, and $7.4 million (eter eliminating the reversal $5,000 of OTA valuation allowance); a | + ROA of 1.3% and ROE of % C] |_| 11.6% over same time horizon; + Experienced strong net -$5,000 interest margin of 4.4
Slide 8: Business Model
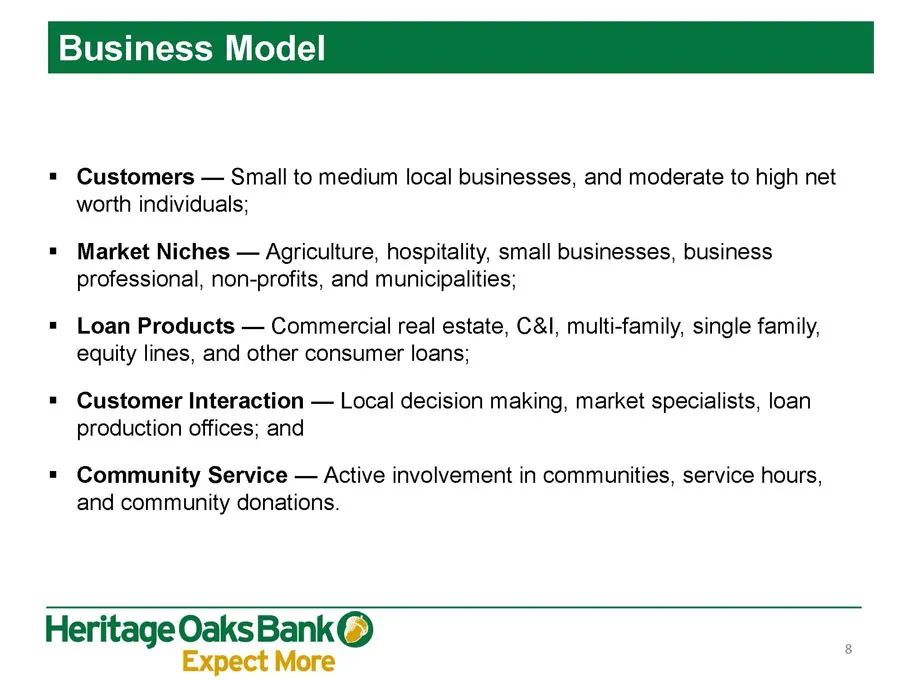
Business Model = Customers — Small to medium local businesses, and moderate to high net worth individuals; = Market Niches — Agriculture, hospitality, small businesses, business professional, non-profits, and municipalities; = Loan Products — Commercial real estate, C&l, multi-family, single family,
Slide 9: 2013 Strategic Plan
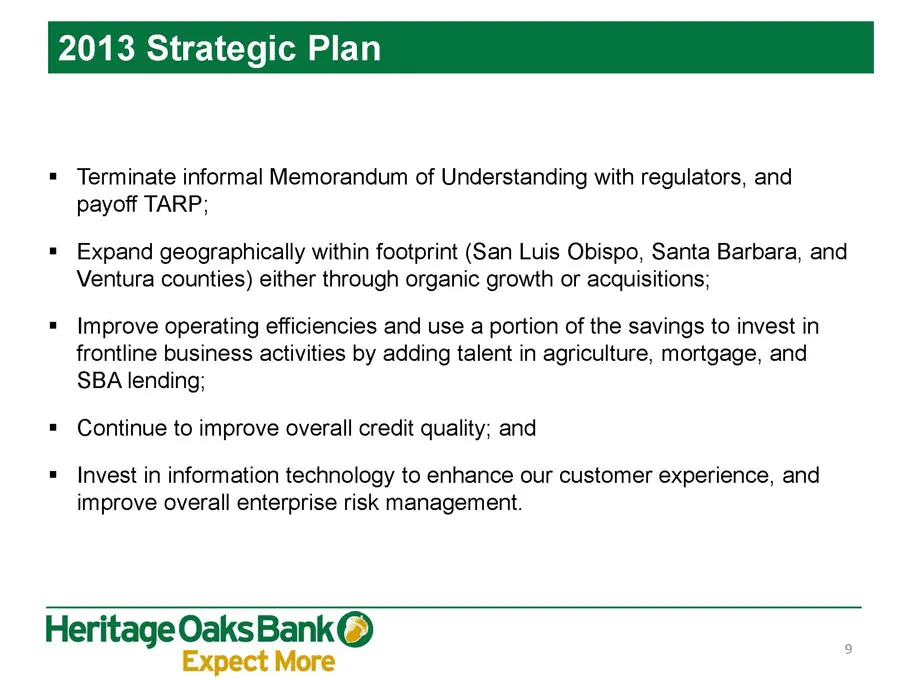
2013 Strate Plan = Terminate informal Memorandum of Understanding with regulators, and payoff TARP; = Expand geographically within footprint (San Luis Obispo, Santa Barbara, and Ventura counties) either through organic growth or acquisitions; = Improve operating efficiencies and use a portion of the
Slide 10: Strong Loan Production Trends
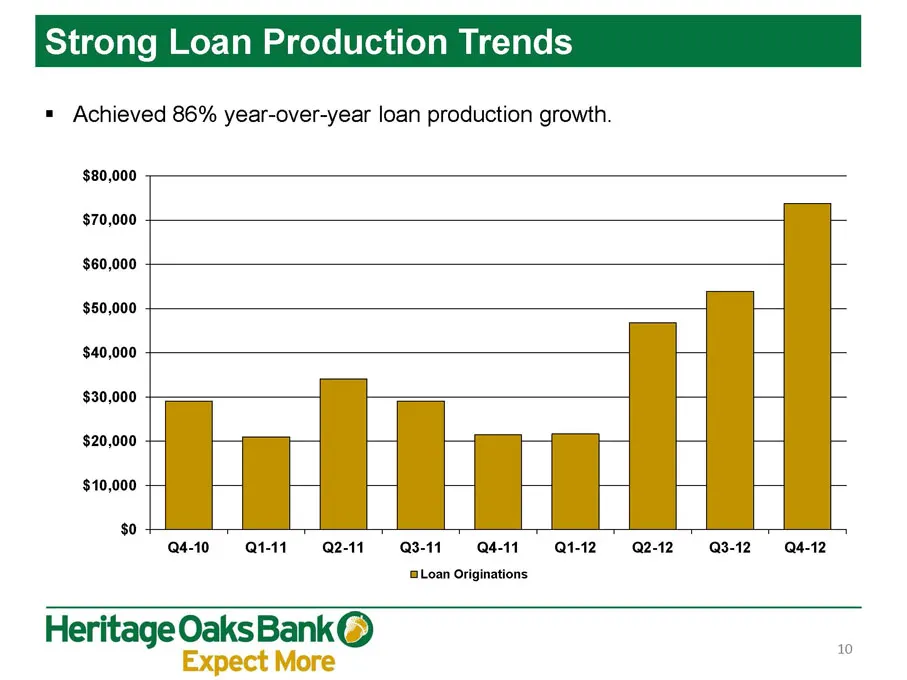
Strong Loan Production Trends = Achieved 86% year-over-year loan production growth. $80,000 $70,000 $60,000 $50,000 $40,000 $30,000 $20,000 $10,000 $0 Q4-10 Q1-11 Q2-11 Q3-11 4-11 Q1-12 Q2-12 Q3-12 Q4-12 Loan Originations Heritage Oaks Bank® Expect More
Slide 11: Loan Portfolio Segmentation
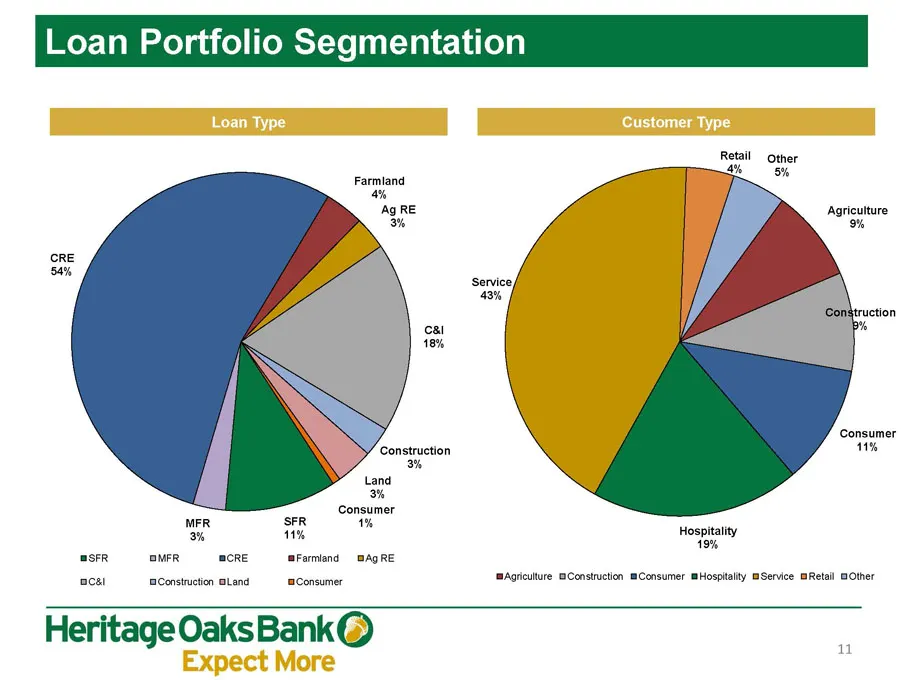
Loan Portfolio Segmentati Farmland 4% Ag RE 3% cRE 54% ‘Construction Land 3% Consumer MFR SFR 1% 3% 11% asFR OMFR CRE ‘aFarmiand @AQRE ace! ‘Construction Bland Consumer Other Retail ah By Agriculture 9% Service 43% ‘Consumer 41% Hospitality 19% Agriculture BConstuction mConsumer Hospitality BService
Slide 12: Growth in Loan Portfolio
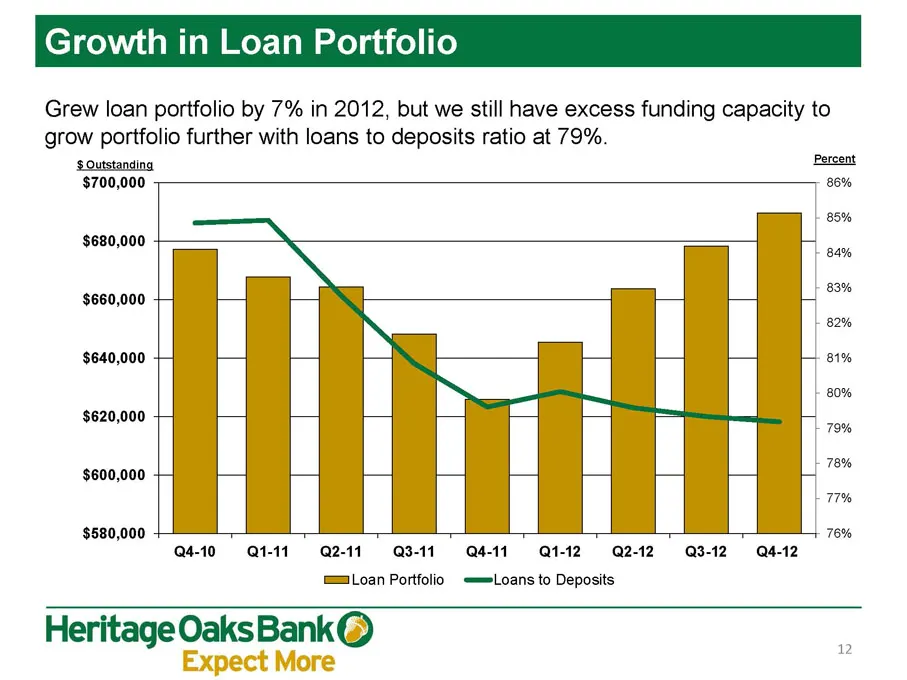
Growth in Loan Portfolio Grew loan portfolio by 7% in 2012, but we still have excess funding capacity to grow portfolio further with loans to deposits ratio at 79%. Percent SOutstanding $700,000 86% —_ my 85% $680,000 — 1 | ats = cot $660,000 | = J] oom $640,000 I t— i— i 81% N 80% $620,000 t— It t—
Slide 13: Low Cost Deposit Base
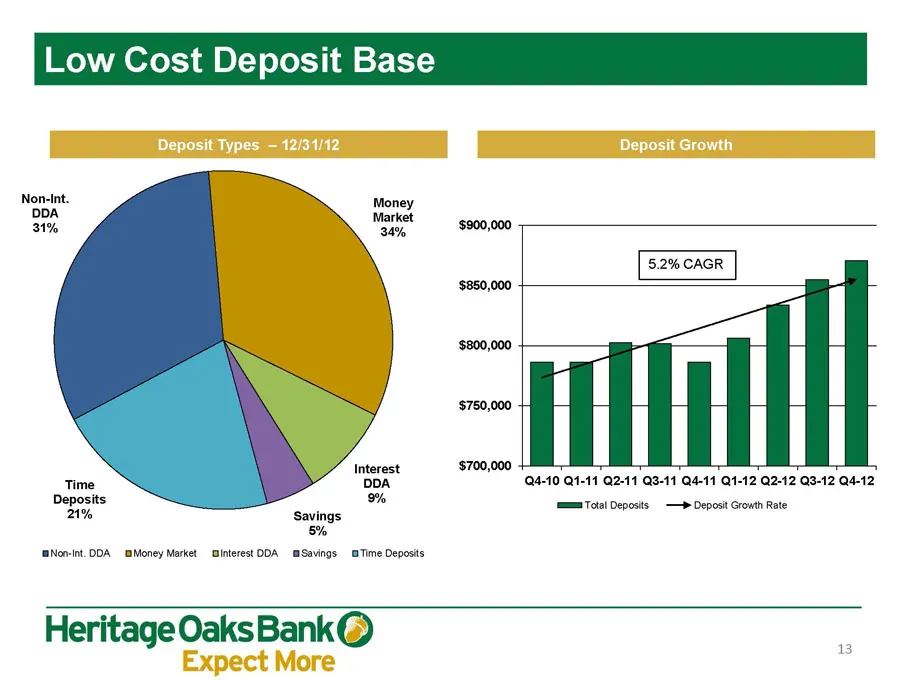
w Cost Deposit Base Non-nt feces pow Market at tarket 500,000 $850,000 + $800,000 + $750,000 Interest $700,000 Time DOA 4-10 1-11 Q241 O8-11 A411 1412 G242 O8-12 Q4-12 Deposits o% ‘EE Total Deposits ©— Deposit Growth Rate aA% ‘Savings 5% [Non-Int. DA @Money Market interest ODA @Savings aTime Deposit
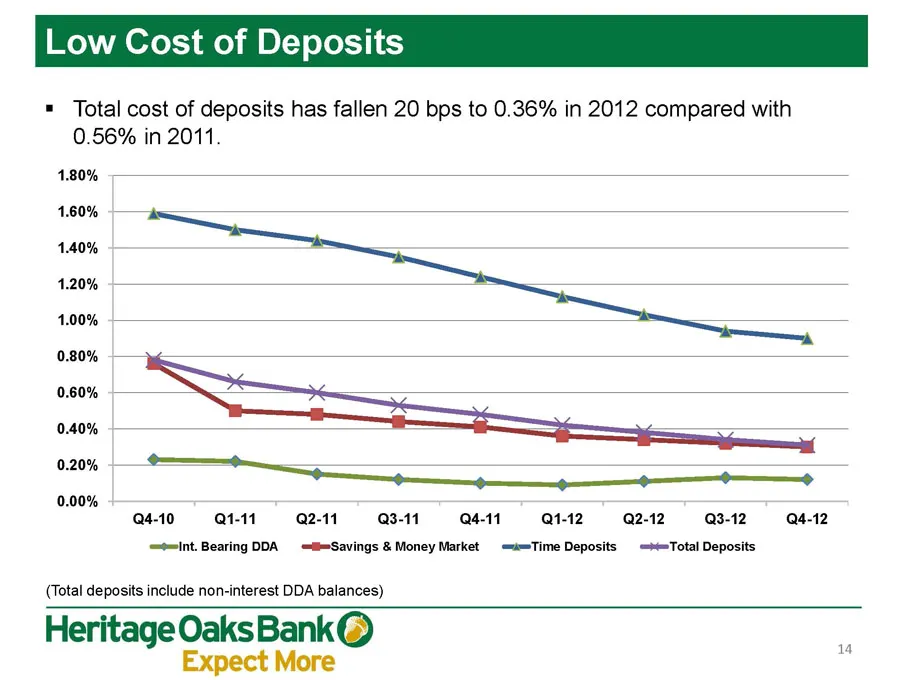
Slide 14: Low Cost of Deposits
w Cost of Deposits = Total cost of deposits has fallen 20 bps to 0.36% in 2012 compared with 0.56% in 2011. 1.80% 1.60% 1.40% oe 1.20% 1.00% —— 0.80% ~~ 0.60% ook See 0.20% ——— 0.00% 4-10 Qt-11 Q2-11 Q3-11 4-11 Q1-12 — Q2-12 Q3-12 Q4-12 Int. Bearing DA =@=Savings & Money Market =ws=Time Deposits =+=
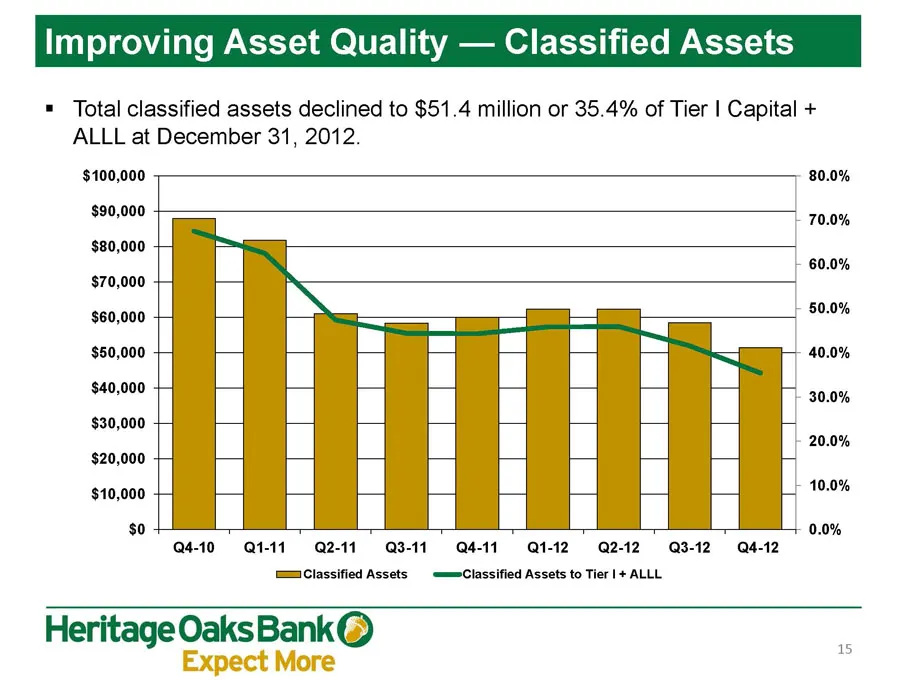
Slide 15: Improving Asset Quality — Classified Assets
Improving Asset Quality — Classified Assets = Total classified assets declined to $51.4 million or 35.4% of Tier | Capital + ALLL at December 31, 2012. $100,000 80.0% $90,000 70.0% $80,000 60.0% $70,000 $60,000 50.0% $60,000 40.0% $40,000 30.0% $30,000 20.0% $20,000 $10,000 10.0% $0 0.0% Q4-10 Q1-11
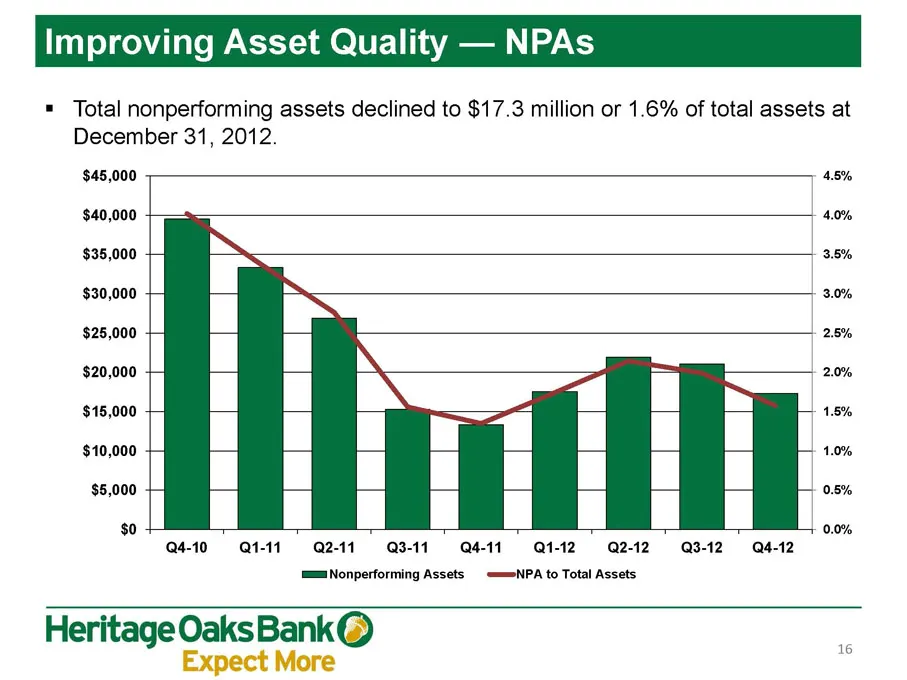
Slide 16: Improving Asset Quality — NPAs
Improving Asset Quality — NPAs = Total nonperforming assets declined to $17.3 million or 1.6% of total assets at December 31, 2012. $45,000 45% $40,000 $35,000 $30,000 $25,000 $20,000 $18,000 $10,000 $5,000 $0 Q4-10 Q1-11 Q2-11 Q3-11 Q4-11 Q1-12 Q2-12 Q3-12,_Q4-12 m==Nonperforming Assets ==NPA to To
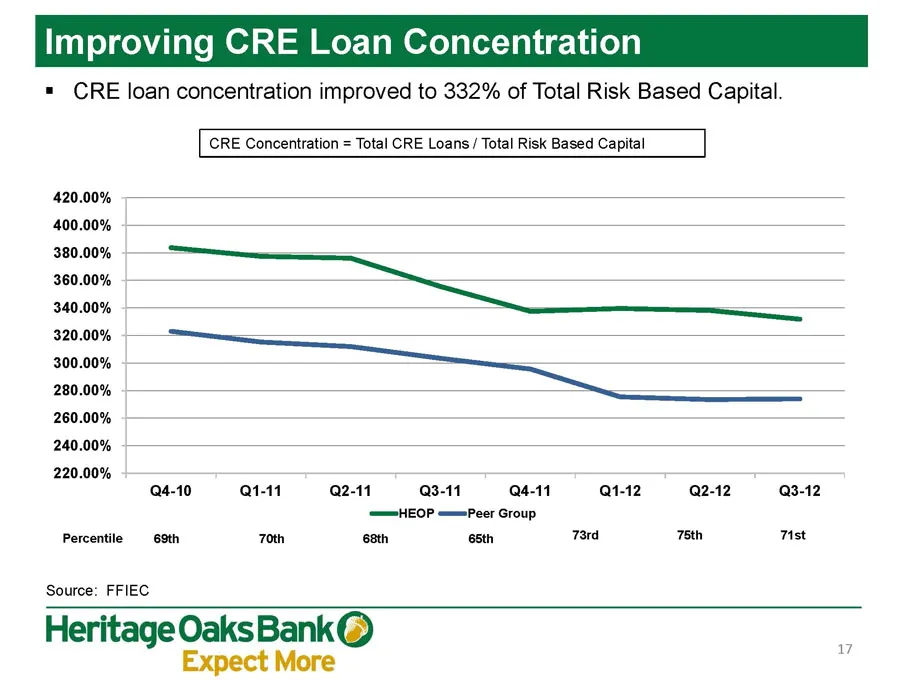
Slide 17: Improving CRE Loan Concentration
Improving CRE Loan Concentratio = CRE loan concentration improved to 332% of Total Risk Based Capital. [CRE Concentration = Total CRE Loans / Total Risk Based Capital | 420.00% 400.00% 380.00% 360.00% 340.00% 320.00% 300.00% 280.00% 260.00% 240.00% 20.00% 4-10 1-11 2-11 3-11 Q4-11 Q1-12 Q2-12 Q3-12
Slide 18: Low Sensitivity to Market Risk
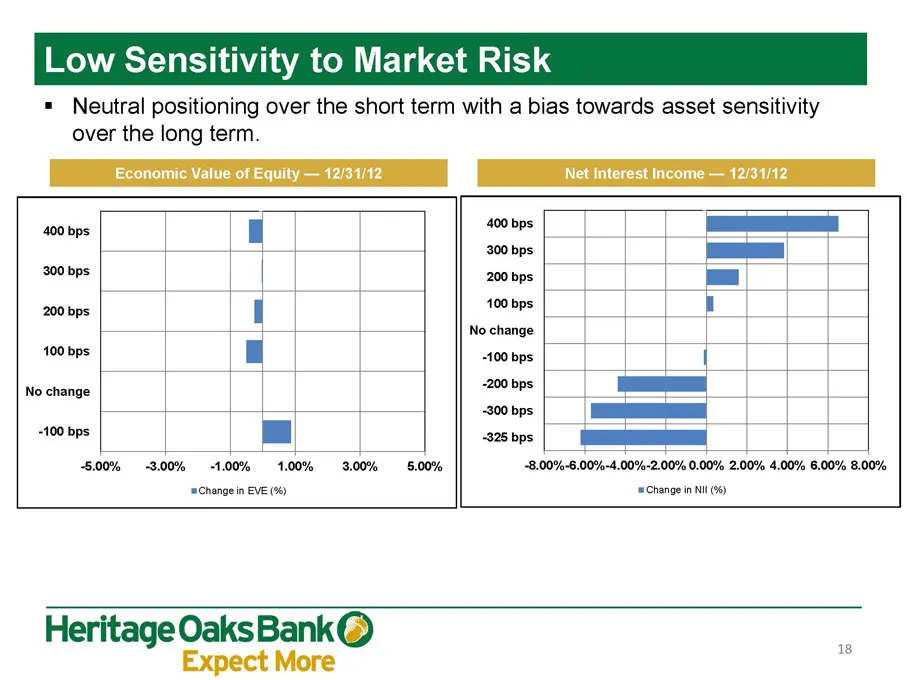
ow Sensitivity to Market Risk = Neutral positioning over the short term with a bias towards asset sensitivity over the long term. Economic Value of Equity — 12/31/12 Net Interest Income — 12/31/12 _ - wn ——= 300 bps ___] 200 bps 200 bps = 200 bps | 100 bes: J No change soobes: | -100 bps 200 bps No
Slide 19: Reduced Wholesale Funding Dependency
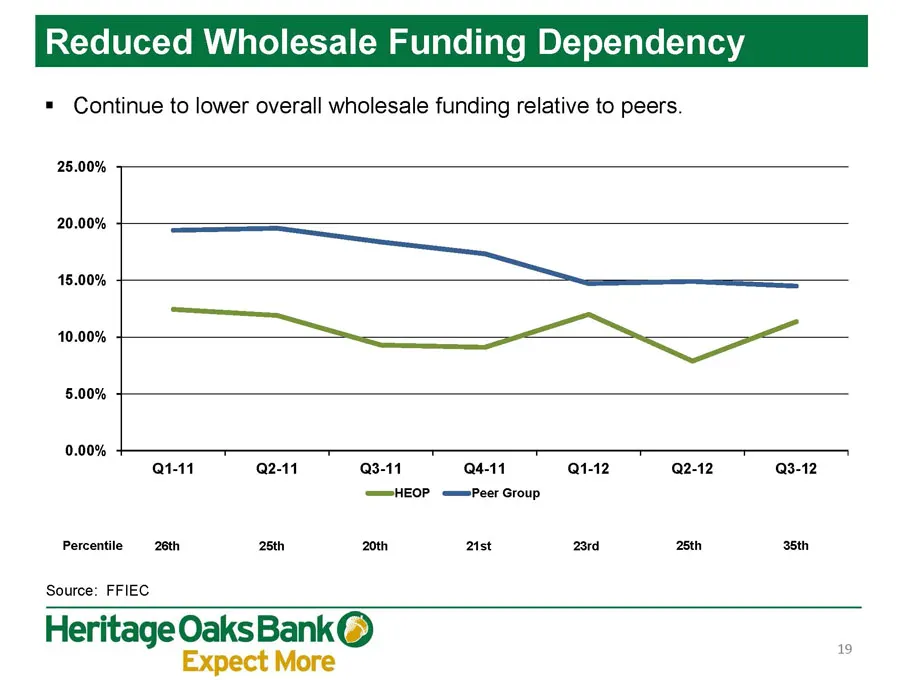
Reduced Wholesale Funding Dependency = Continue to lower overall wholesale funding relative to peers. 25.00% 20.00% 15.00% oo so.00% ee 5.00% 0.00% Qt-11 Q2-11 Q3-11 4-11 Q1-12 Q2-12 Q3-12 “—=HEOP ===Peer Group Percentile 26th 25th, 20th 21st 23rd 25th 36th Source: FFIEC Heritage OaksBank iad ae
Slide 20: Strong Liquidity Position
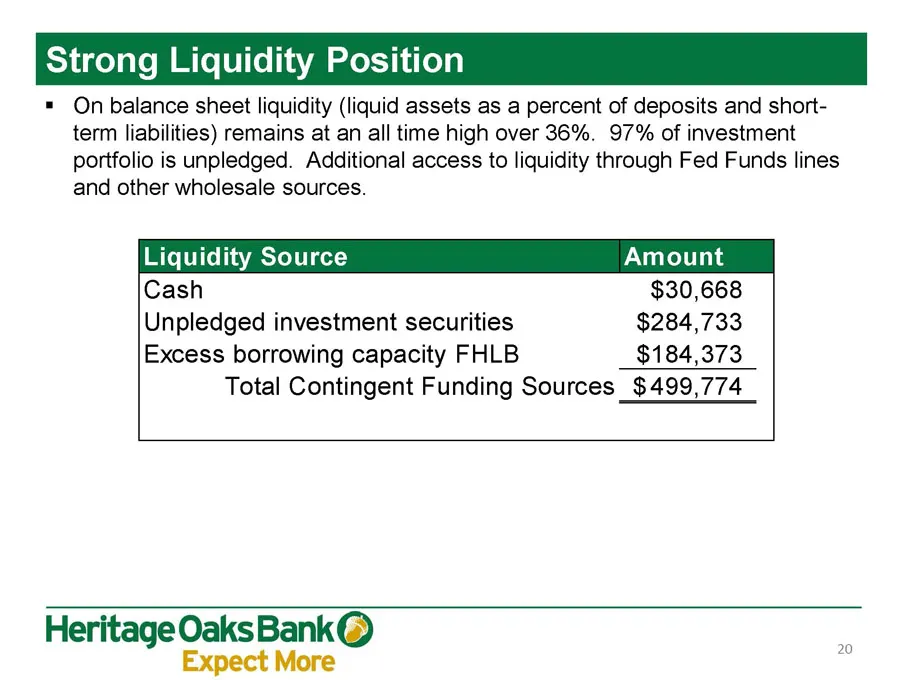
Strong Liquidity Position = On balance sheet liquidity (liquid assets as a percent of deposits and short- term liabilities) remains at an all time high over 36%. 97% of investment portfolio is unpledged. Additional access to liquidity through Fed Funds lines and other wholesale sources. Liquidity So
Slide 21: High Quality Investment Securities Portfolio
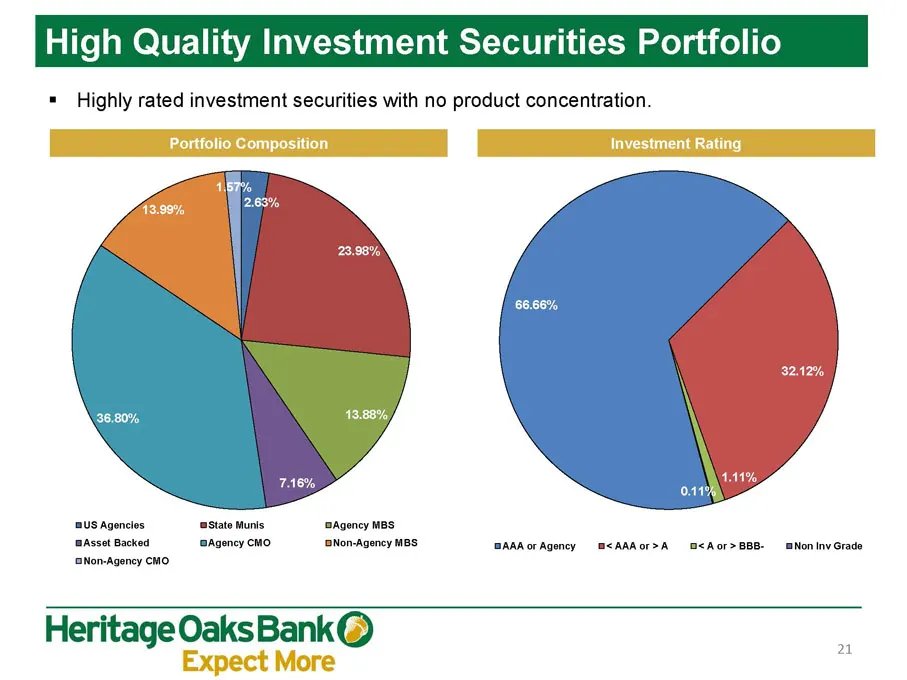
High Quality Investment Securities Portfolio = Highly rated investment securities with no product concentration. Portfolio Composition Investment Rating BUS Agencies state Munis Agency MBS Asset Backed Agency CMO ‘BNon-Agency MBS BAAAor Agency @<AAROr>A <Aor>BBB- Non Inv Grade |Non-Agency CMO Herita
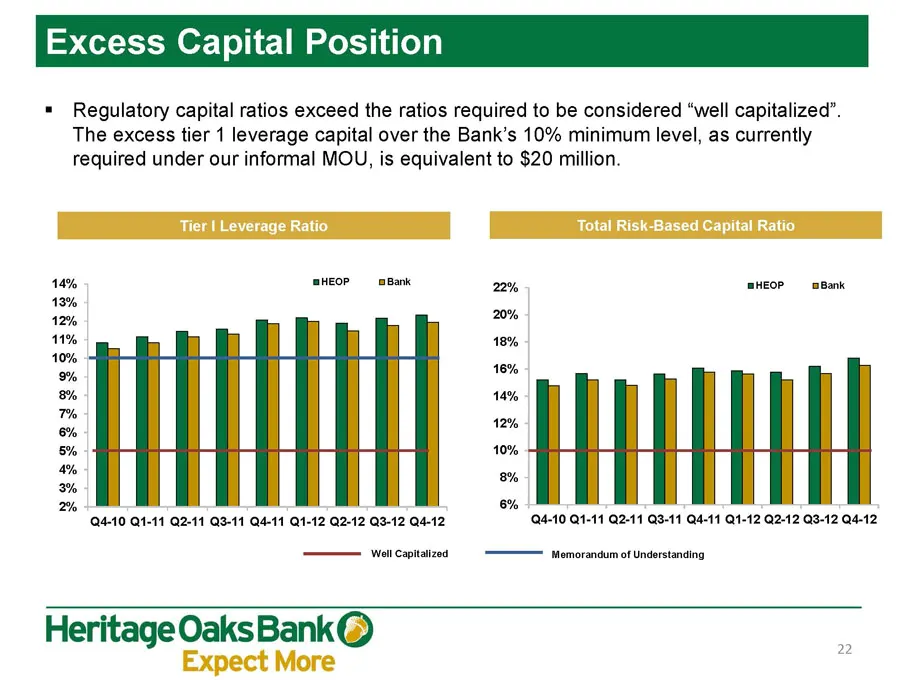
Slide 22: Excess Capital Position
Excess Capital Positio = Regulatory capital ratios exceed the ratios required to be considered “well capitalized”. The excess tier 1 leverage capital over the Bank’s 10% minimum level, as currently required under our informal MOU, is equivalent to $20 million. | Leverage Ratio Total Risk-Based Capit
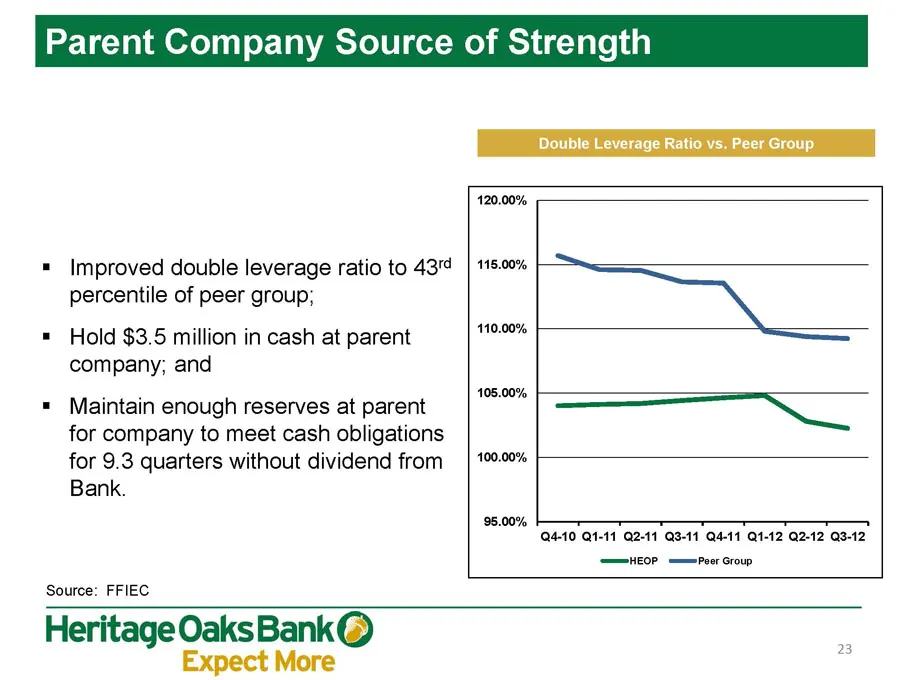
Slide 23: Parent Company Source of Strength
Parent Company Source of Strength Double Leverage Ratio vs. Peer Group 120.00% = Improved double leverage ratio to 43°4 | 115.0% percentile of peer group; —, 10.00% Ne = Hold $3.5 million in cash at parent company; and 4108,00% = Maintain enough reserves at parent for company to meet cash obligation
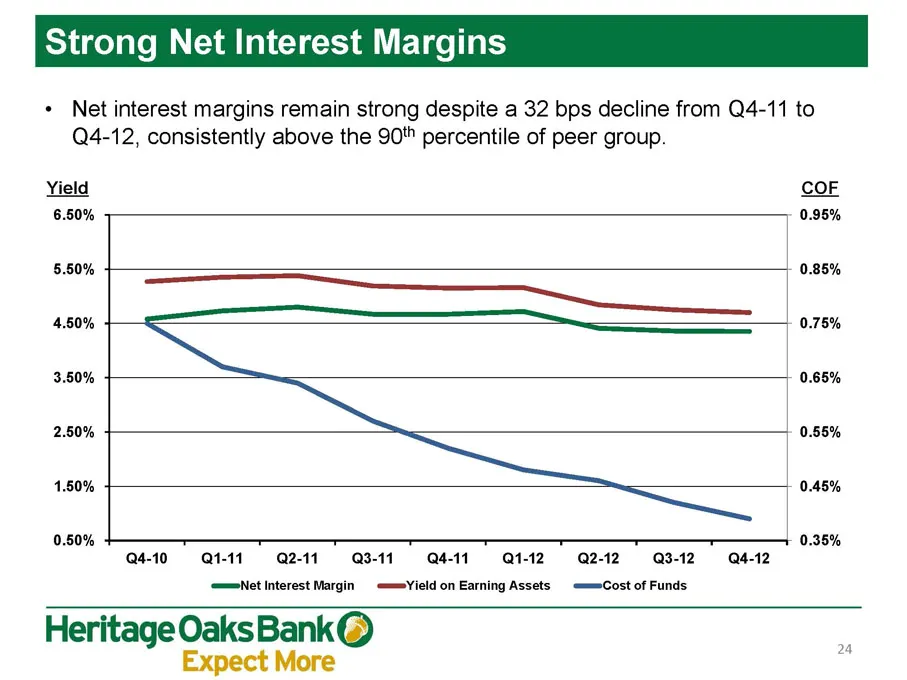
Slide 24: Strong Net Interest Margins
$s g Net Interest Margins + Net interest margins remain strong despite a 32 bps decline from Q4-11 to Q4-12, consistently above the 90" percentile of peer group. Yield COF 6.50% 0.95% 5.50% 0.85% 4.50% ; = 0.75% 3.60% 0.65% 2.50% _™ 0.55% 1.50% ~~ — 0.45% 0.50% 0.35% Q4-10 Q1-11 Q2-11 Q3-11 4-11 Q1-
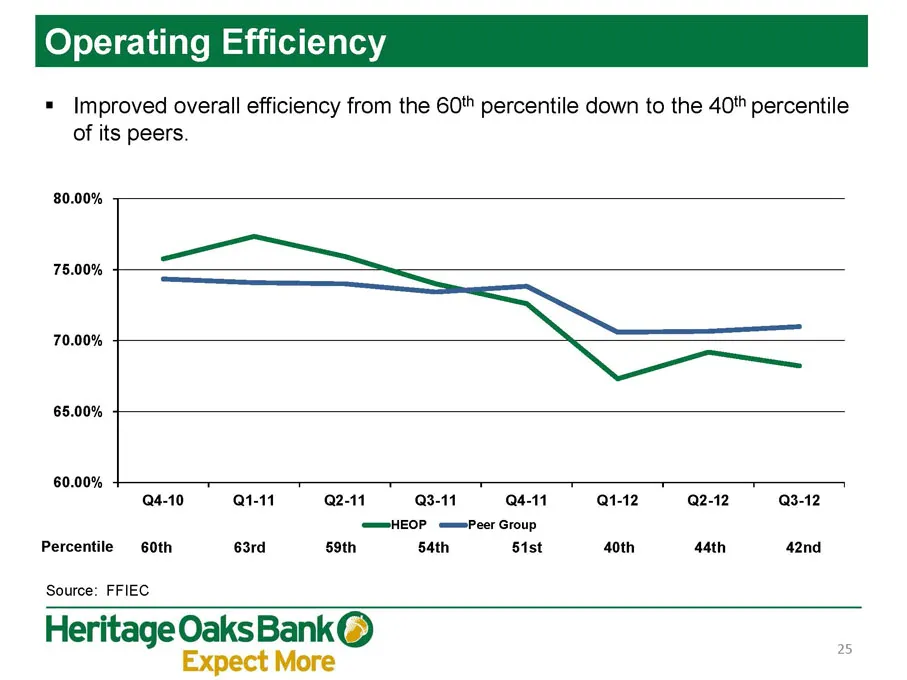
Slide 25: Operating Efficiency
perating Efficiency = Improved overall efficiency from the 60" percentile down to the 40" percentile of its peers. 80.00% 75.00% ie ~ Ne 65.00% 60.00% Q4-10 Qi-11 2-11 3-11 4-11 Q1-12 Q2-12 Q3-12 ‘—HEOP ===Peer Group Percentile 60th 63rd 59th 54th 51st 4oth 44th 42nd Source: FFIEC 25 Heritage Oaks B
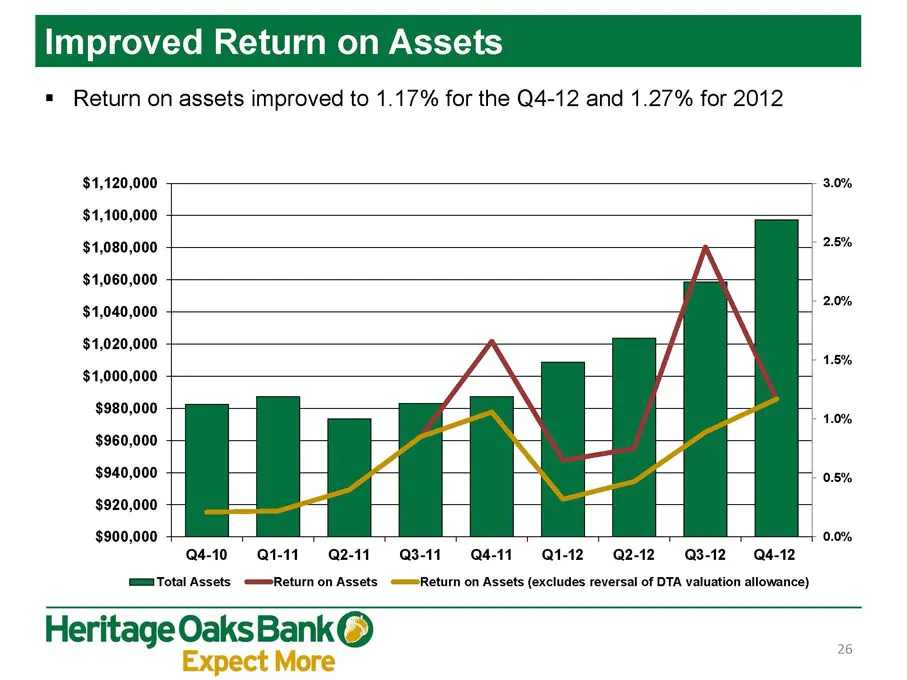
Slide 26: Improved Return on Assets
Improved Return on Assets = Return on assets improved to 1.17% for the Q4-12 and 1.27% for 2012 $1,120,000 3.0% $1,100,000 $1,080,000 2.5% $1,060,000 $1,040,000 ia $1,020,000 $1,000,000 we $980,000 ie $960,000 $940,000 0.5% $920,000 $900,000 0.0% Q4-10 I-11 Q2-11 3-11 4-11 1-12, Q2-12Q3-12, 4-12 im
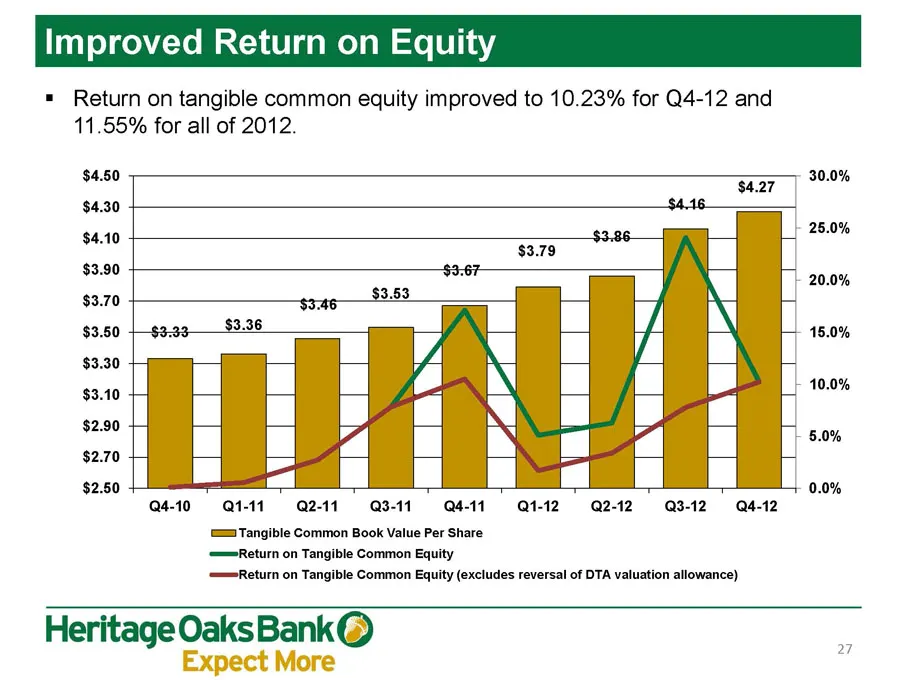
Slide 27: Improved Return on Equity
Improved Return on Equity = Return on tangible common equity improved to 10.23% for Q4-12 and 11.55% for all of 2012. $4.50 $4.30 $4.10 $3.90 $3.70 $3.50 + $3.30 $3.10 $2.90 $2.70 $2.50 $4.46. $4.27 Q410 Qt-11 Q241 3-11 [== Tangible Common Book Value Per Share Equity ‘Return on Tangible Common 4-11
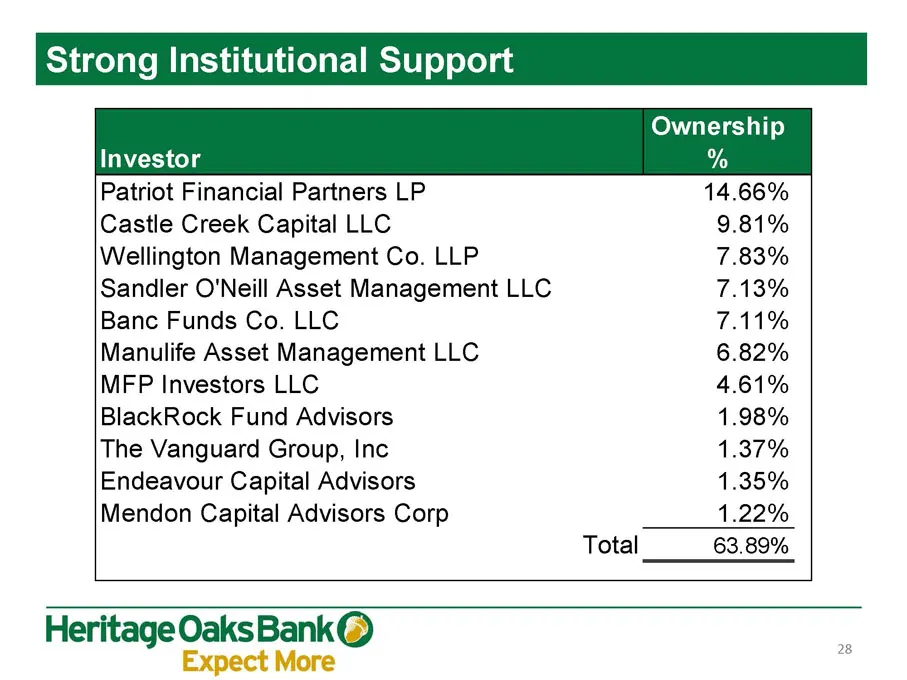
Slide 28: Strong Institutional Support
ng Institutional Support Ownership Investor % Patriot Financial Partners LP 14.66% Castle Creek Capital LLC 9.81% Wellington Management Co. LLP 7.83% Sandler O'Neill Asset Management LLC 7.13% Banc Funds Co. LLC 7.11% Manulife Asset Management LLC. 6.82% MFP Investors LLC 4.61% BlackRock Fund Adviso
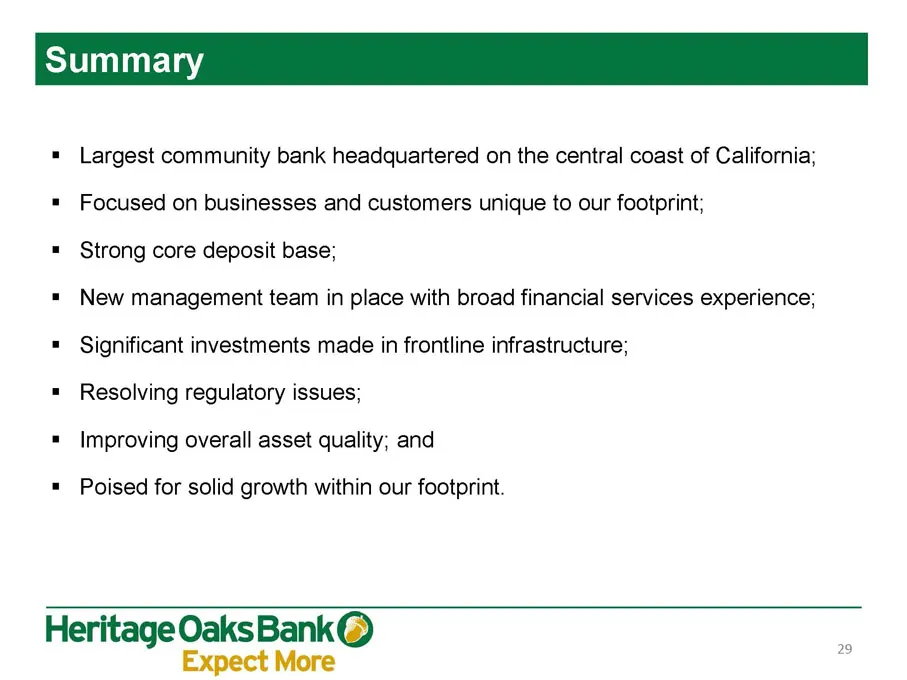
Slide 29: Largest community bank headquartered on the central coast of California
« Largest community bank headquartered on the central coast of California; = Focused on businesses and customers unique to our footprint; = Strong core deposit base; = New management team in place with broad financial services experience; = Significant investments made in frontline infrastructure; =
Source: SEC EDGAR · 8-K filed Mar 6, 2013
More decks from Heritage Oaks Bancorp
 Merger or Acquisition (March 2017)6 slides · Mar 27, 2017
 Merger or Acquisition (February 2017)26 slides · Feb 1, 2017
 West Coast Financial Services Conference 201628 slides · Mar 7, 2016
 West Coast CEO Forum 201628 slides · Feb 3, 2016
 Investor Presentation (March 2015)28 slides · Mar 10, 2015
 Sandler O'Neill 2013 West Coast Financial Services Conference23 slides · Mar 11, 2014