Blue Bird Corporation · NASDAQ:BLBD
Blue Bird — Investor Presentation (February 2026)
33 slides from Blue Bird's investor presentation, February 2026
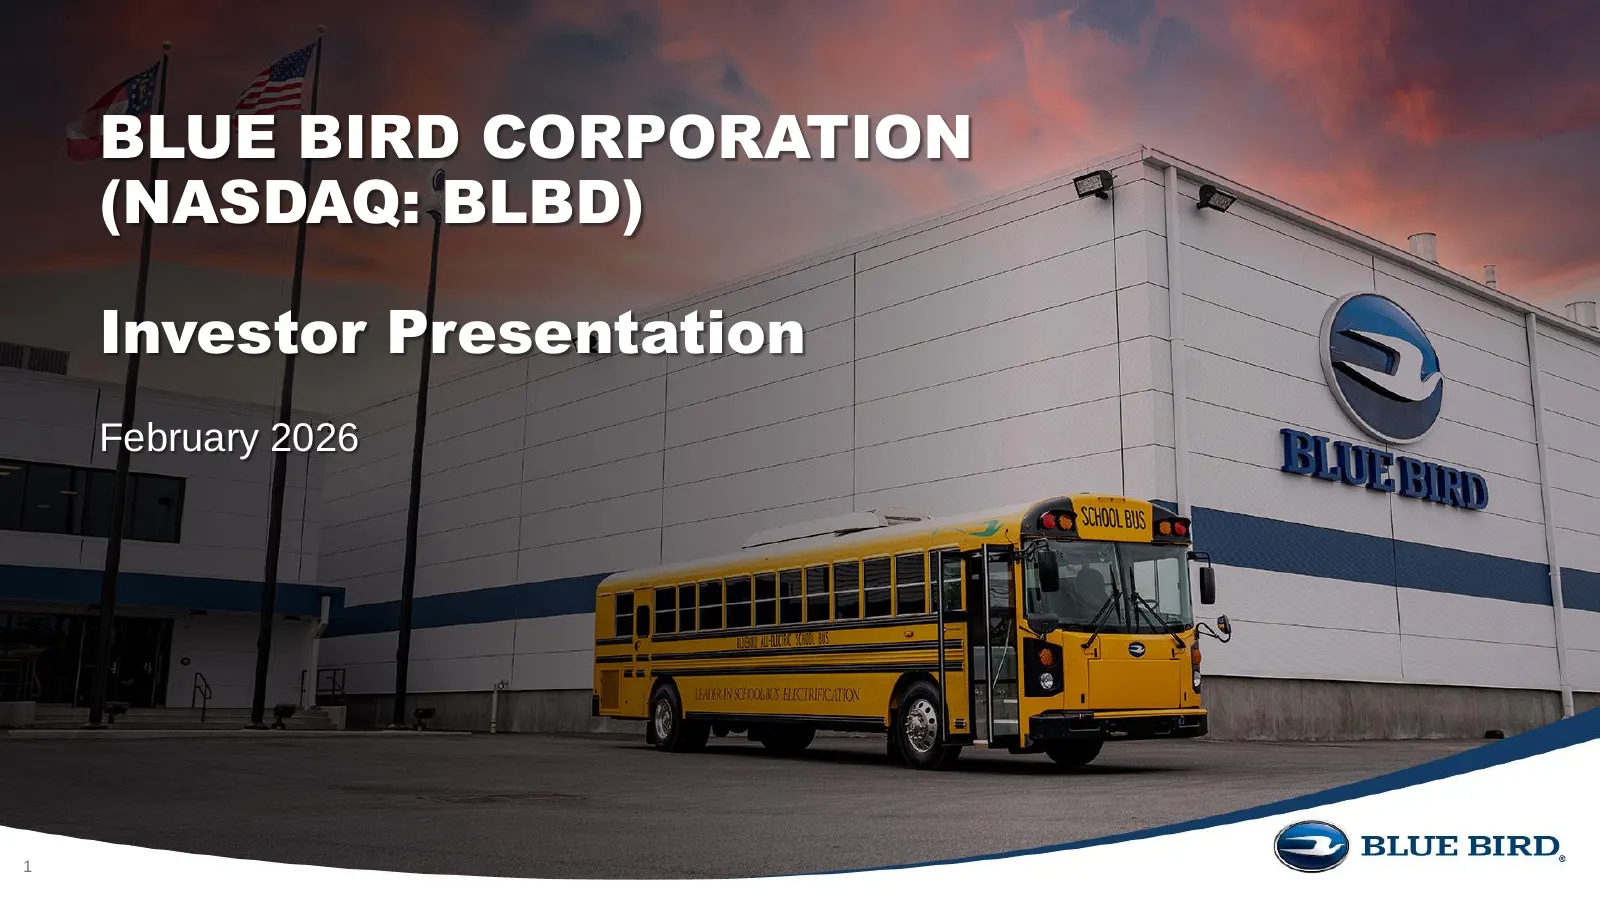
Slide 1: Blue Bird Corporation Investor Presentation February 2026
BLUE BIRD CORPORATION (NASDAQ: BLBD) Investor Presentation February 2026 1
Slide 2: Important Disclaimers: Forward Looking Statements
Important Disclaimers Forward Looking Statements This presentation includes forward-looking statements within the meaning of the “safe harbor” provisions of the Private Securities Litigation Reform Act of 1995. These forward-looking statements relate to expectations for future financial performance,
Slide 3: Important Disclaimers: Non-GAAP Financial Measures
Important Disclaimers Non-GAAP Financial Measures This presentation may include the following non-GAAP financial measures: “Adjusted EBITDA,” "Adjusted EBITDA Margin," “Adjusted Net Income,” “Adjusted Diluted Earnings per Share,” “Free Cash Flow” and “Adjusted Free Cash Flow.” Additional information
Slide 4: Agenda
Agenda 1. Investment Highlights 2. School Bus Industry Overview 3. Company & Product Highlights 4. FY2025 Objectives 5. Growth Runway 4
Slide 5: Investment Highlights
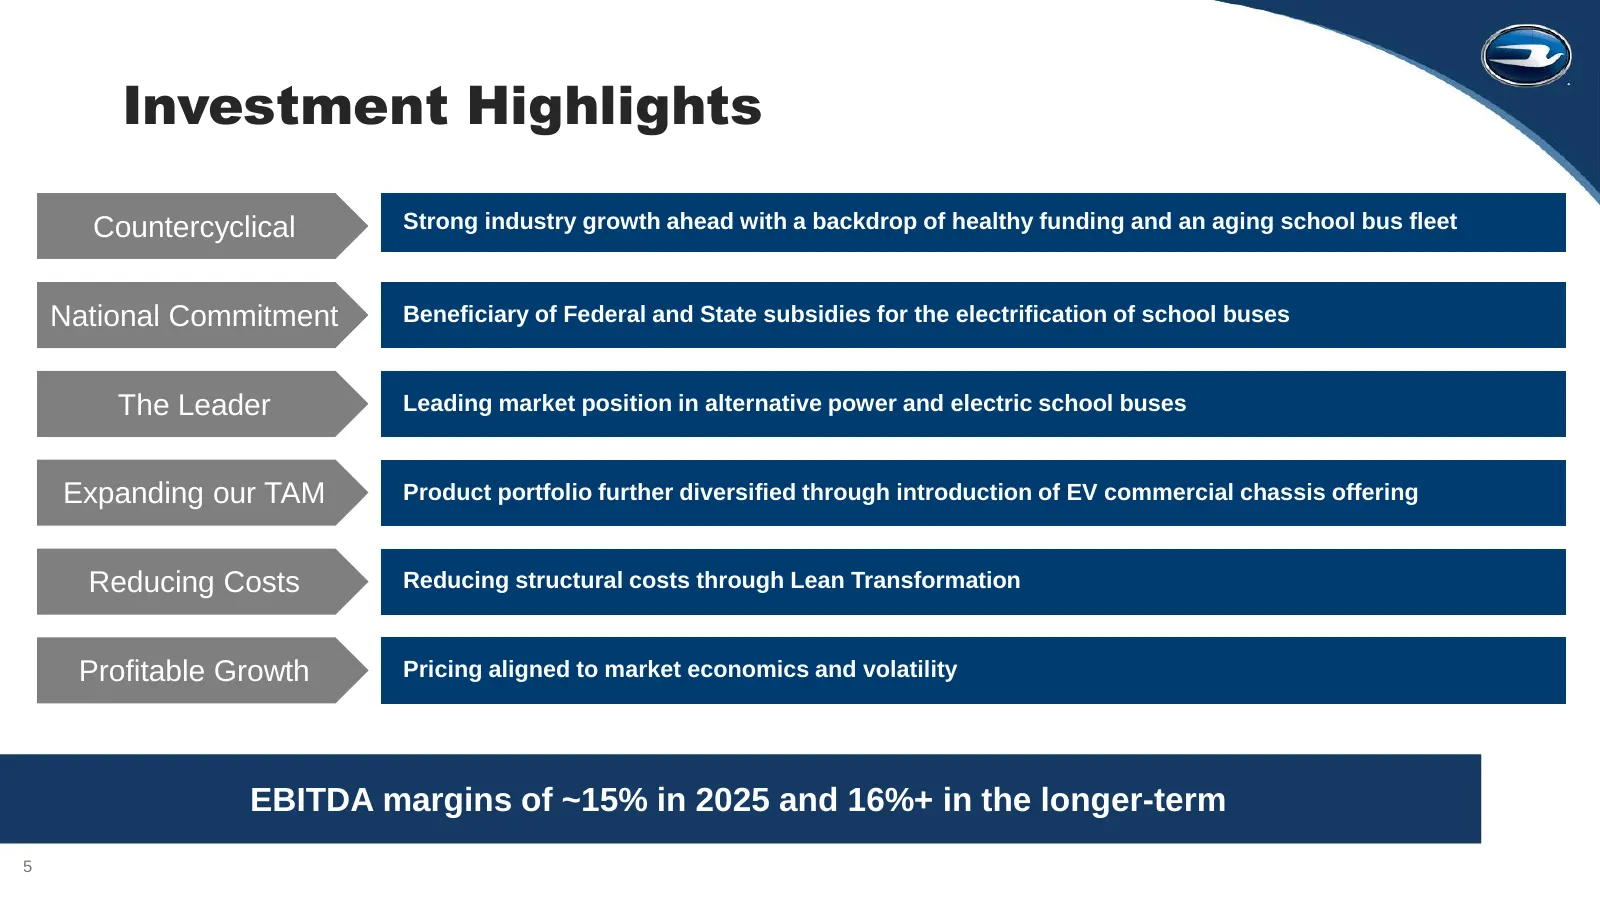
Investment Highlights Countercyclical Strong industry growth ahead with a backdrop of healthy funding and an aging school bus fleet National Commitment Beneficiary of Federal and State subsidies for the electrification of school buses The Leader Leading market position in alternative power and elect
Slide 6: School Bus Industry Overview
School Bus Industry Overview 6
Slide 7: Industry Highlights
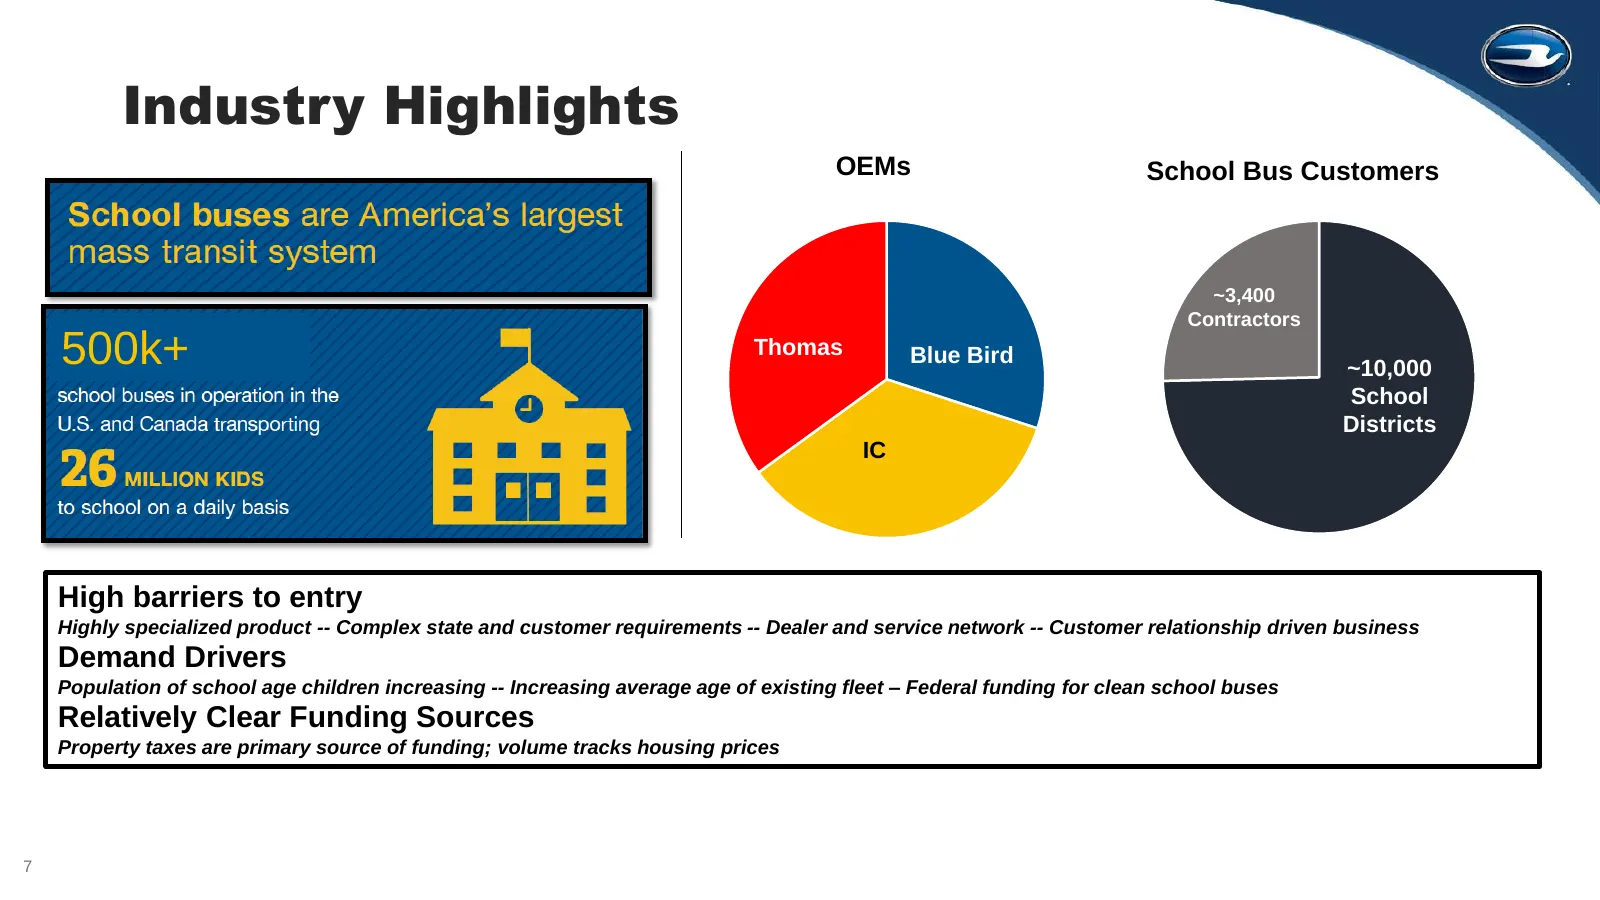
Industry Highlights OEMs School Bus Customers ~3,400 Contractors 500k+ Thomas Blue Bird ~10,000 School Districts IC High barriers to entry Highly specialized product -- Complex state and customer requirements -- Dealer and service network -- Customer relationship driven business Demand Drivers Popul
Slide 8: Type C & D School Bus Industry
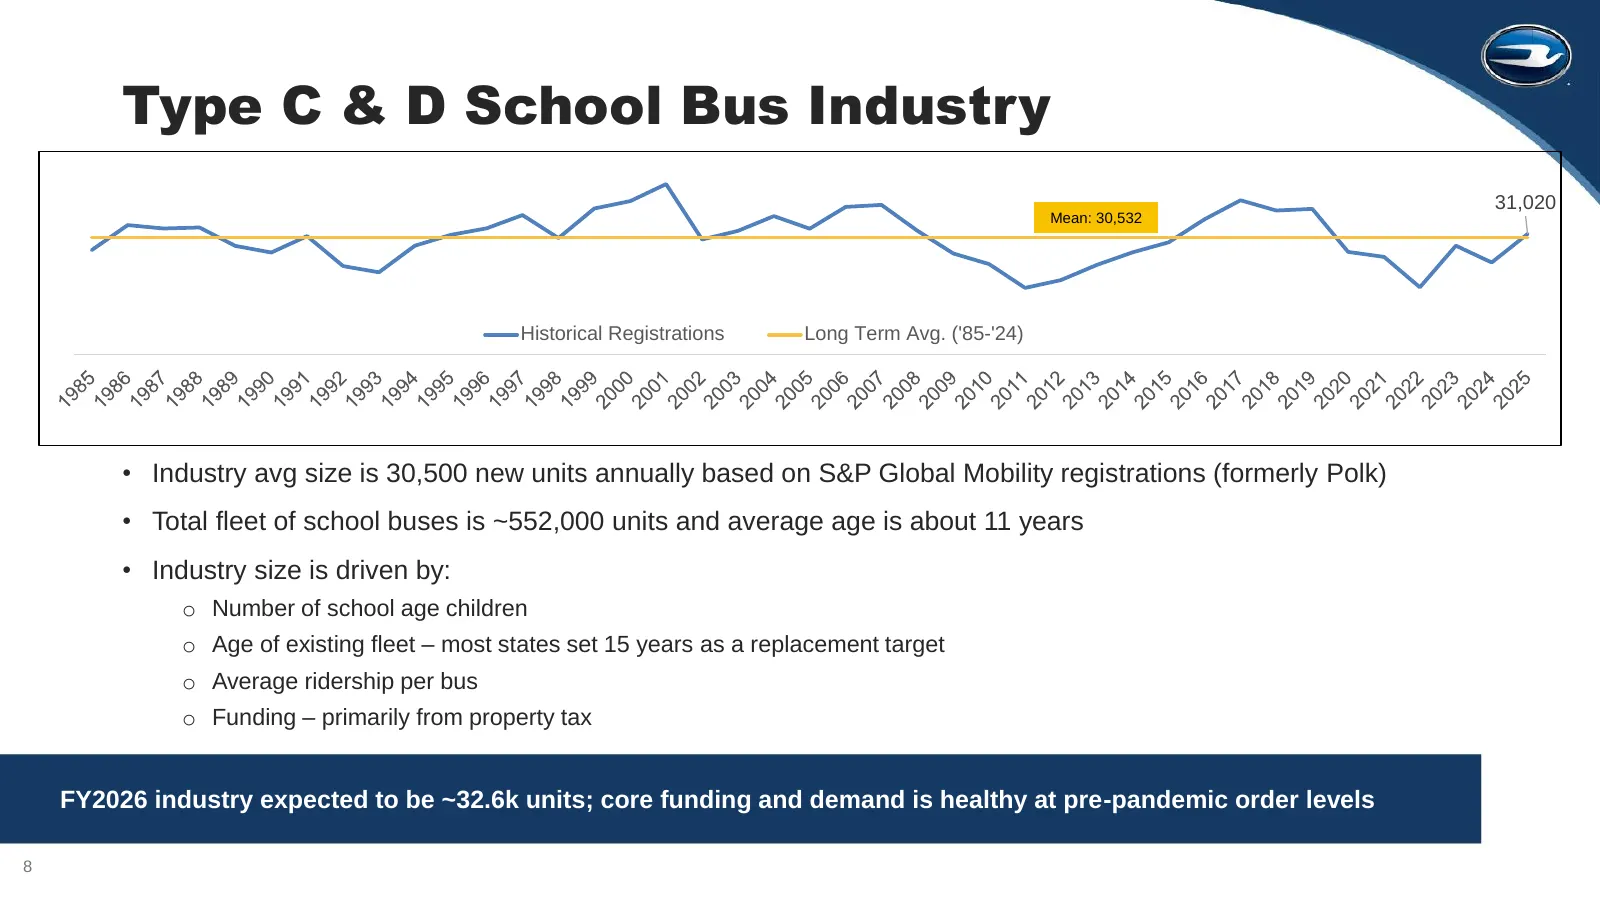
Type C & D School Bus Industry 31,020 Mean: 30,532 Historical Registrations Long Term Avg. ('85-'24) • Industry avg size is 30,500 new units annually based on S&P Global Mobility registrations (formerly Polk) • Total fleet of school buses is ~552,000 units and average age is about 11 years • Industr
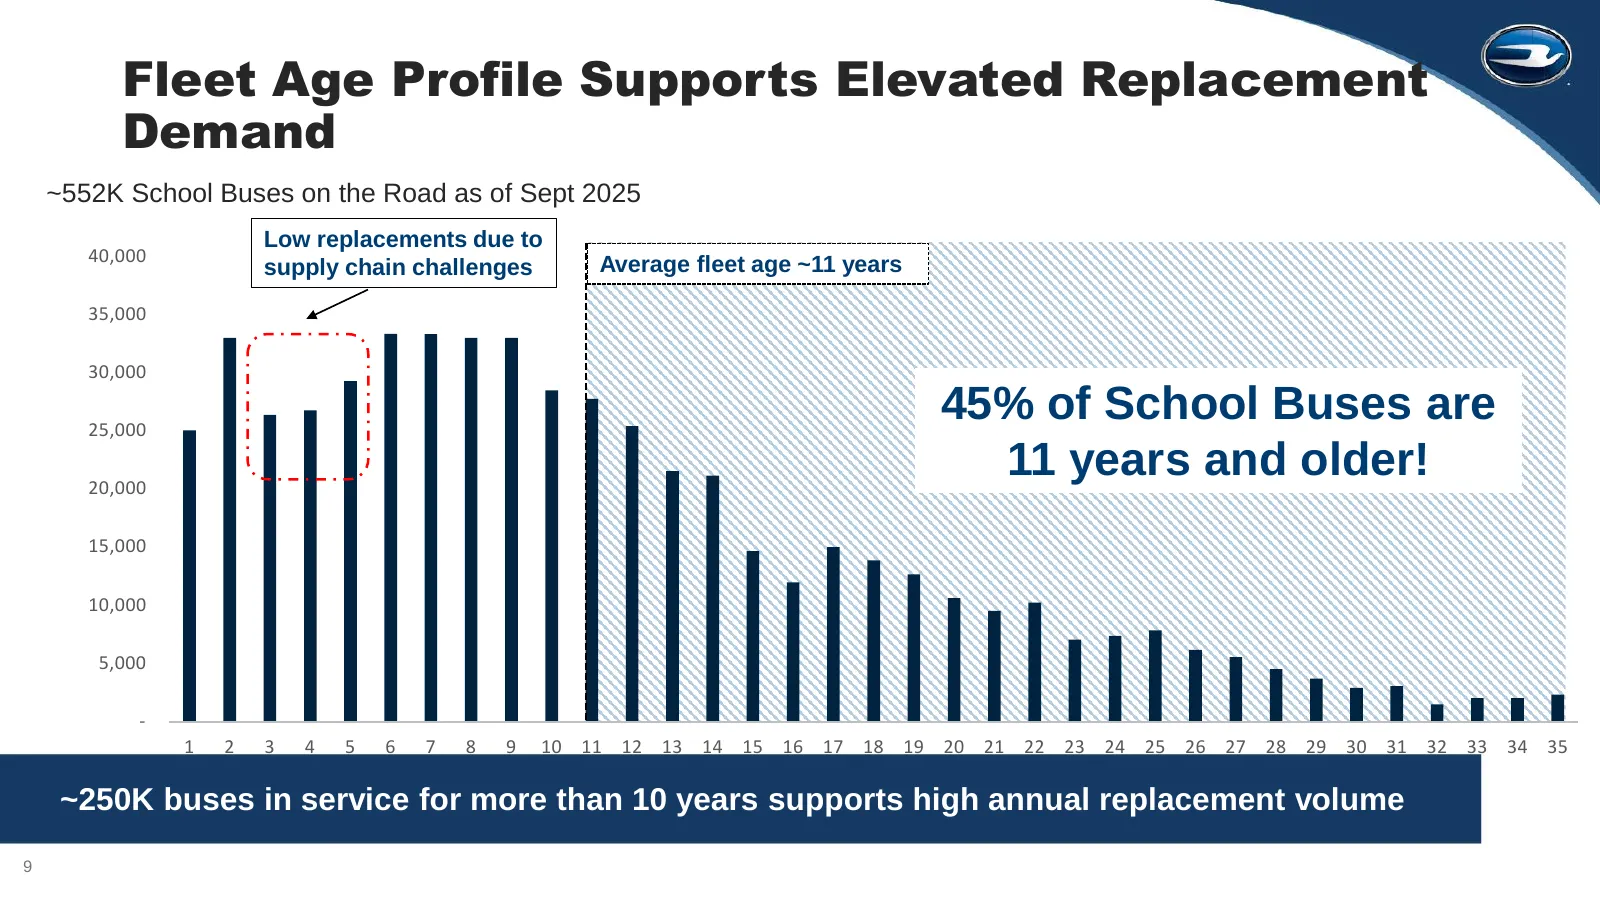
Slide 9: Fleet Age Profile Supports Elevated Replacement Demand
Fleet Age Profile Supports Elevated Replacement Demand ~552K School Buses on the Road as of Sept 2025 Low replacements due to 40,000 supply chain challenges Average fleet age ~11 years 35,000 30,000 25,000 45% of School Buses are 20,000 11 years and older! 15,000 10,000 5,000 - 1 2 3 4 5 6 7 8 9 10

Slide 10: Company & Product Highlights
Company & Product Highlights 10
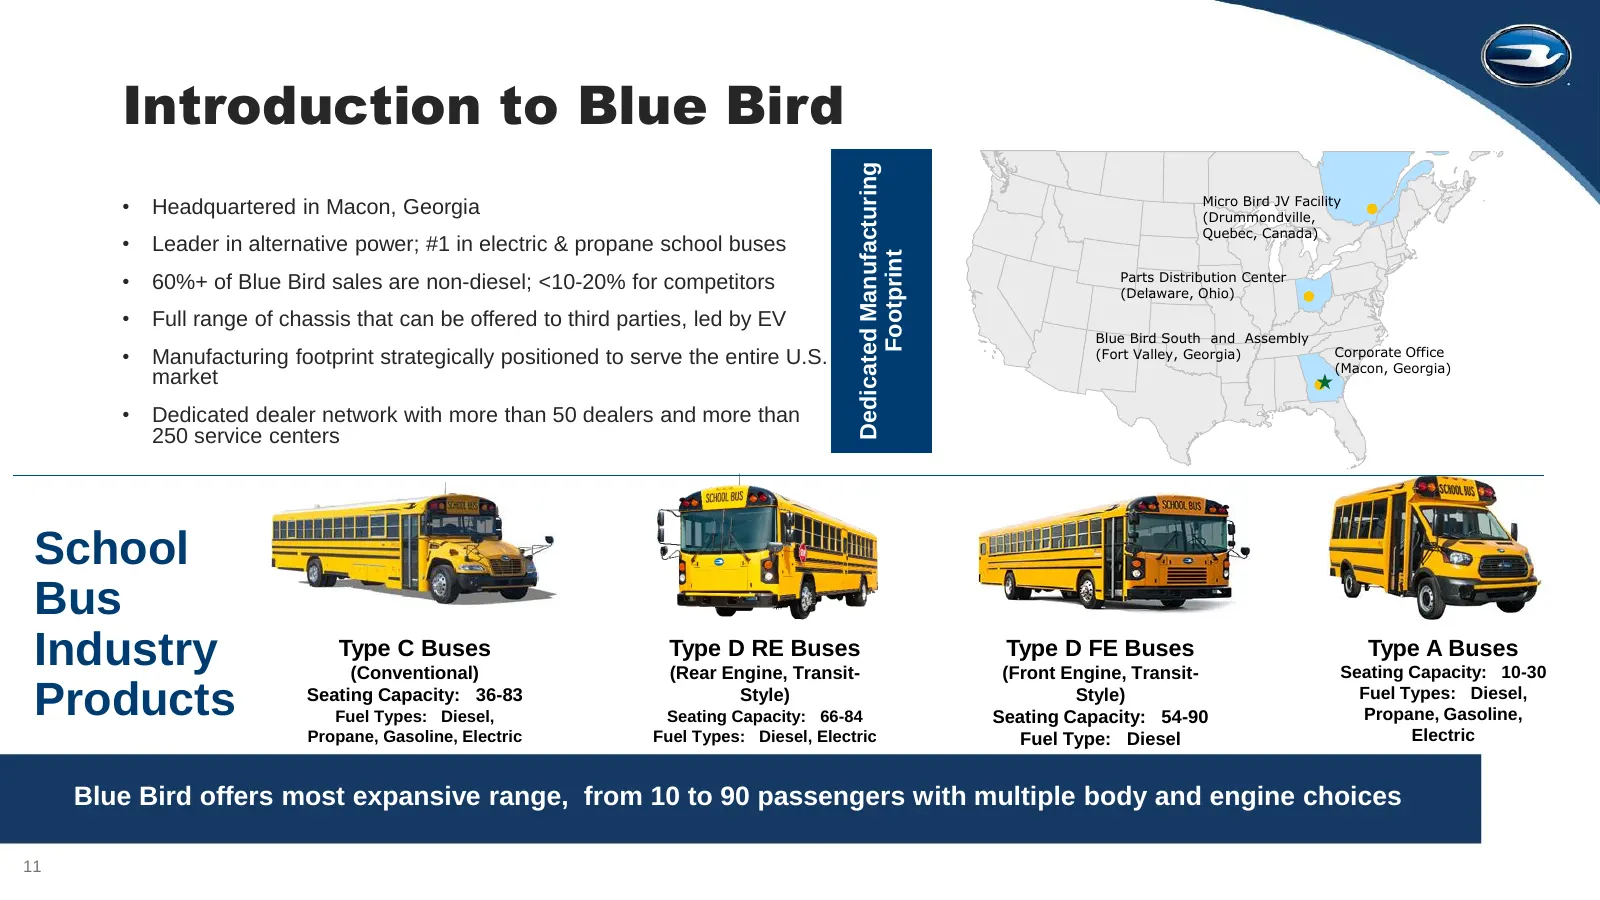
Slide 11: Introduction to Blue Bird
Introduction to Blue Bird Dedicated Manufacturing Micro Bird JV Facility • Headquartered in Macon, Georgia (Drummondville, Quebec, Canada) • Leader in alternative power; #1 in electric & propane school buses Footprint • 60%+ of Blue Bird sales are non-diesel; <10-20% for competitors Parts Distributi
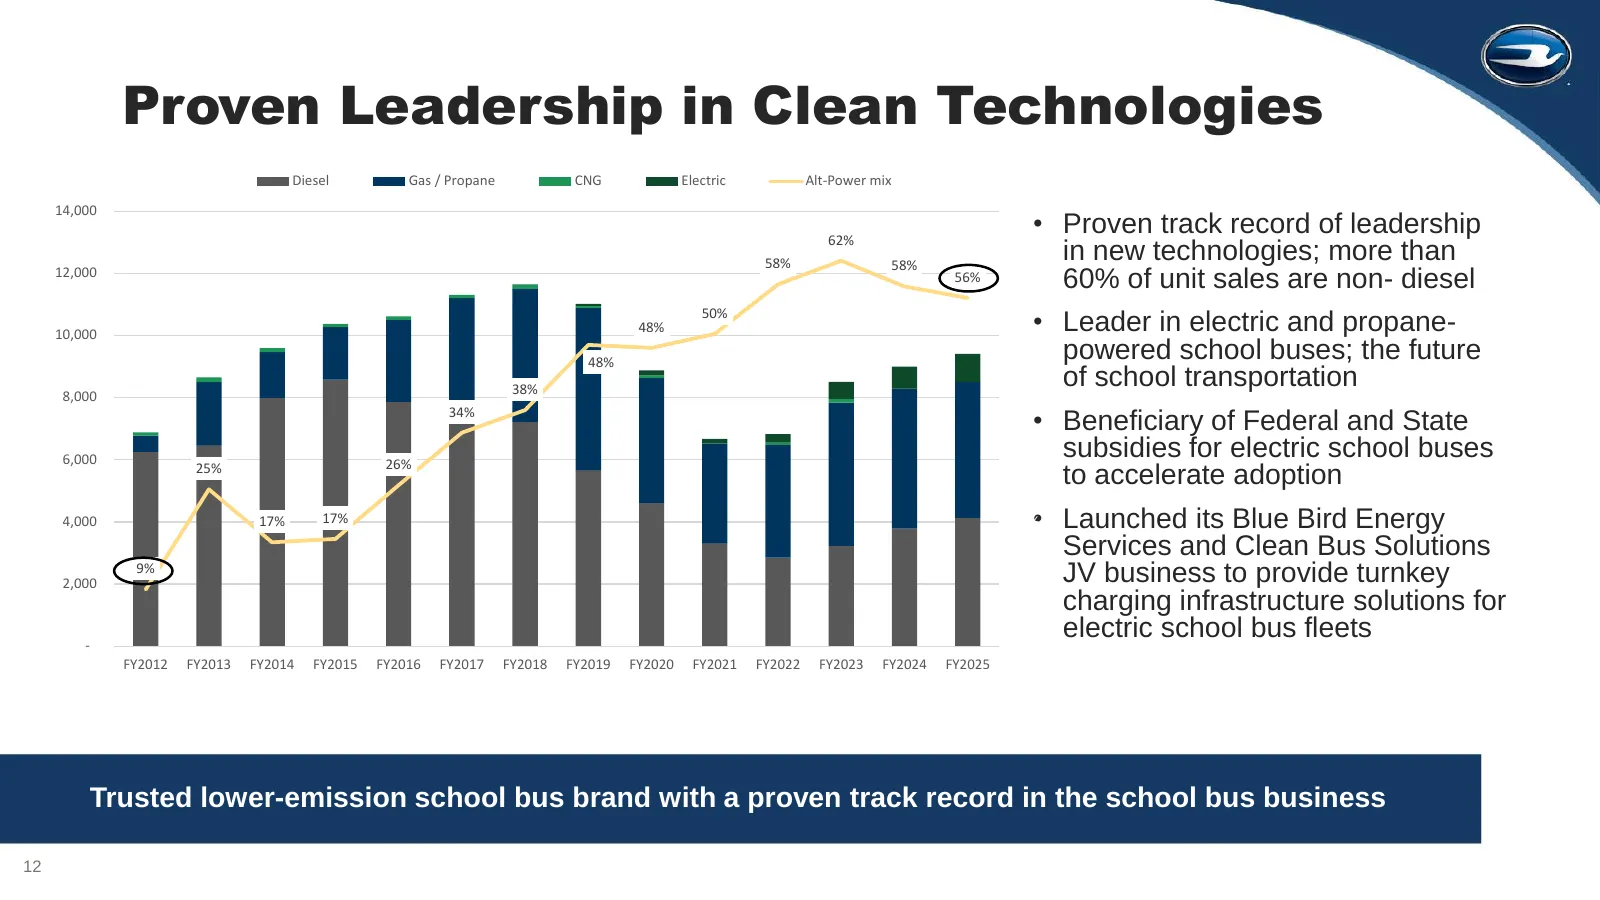
Slide 12: Proven Leadership in Clean Technologies
Proven Leadership in Clean Technologies Diesel Gas / Propane CNG Electric Alt-Power mix 14,000 70% 62% • Proven track record of leadership 58% 58% in new technologies; more than 12,000 60% 56% 60% of unit sales are non- diesel 10,000 48% 50% • Leader in electric and propane- 50% 48% powered school b
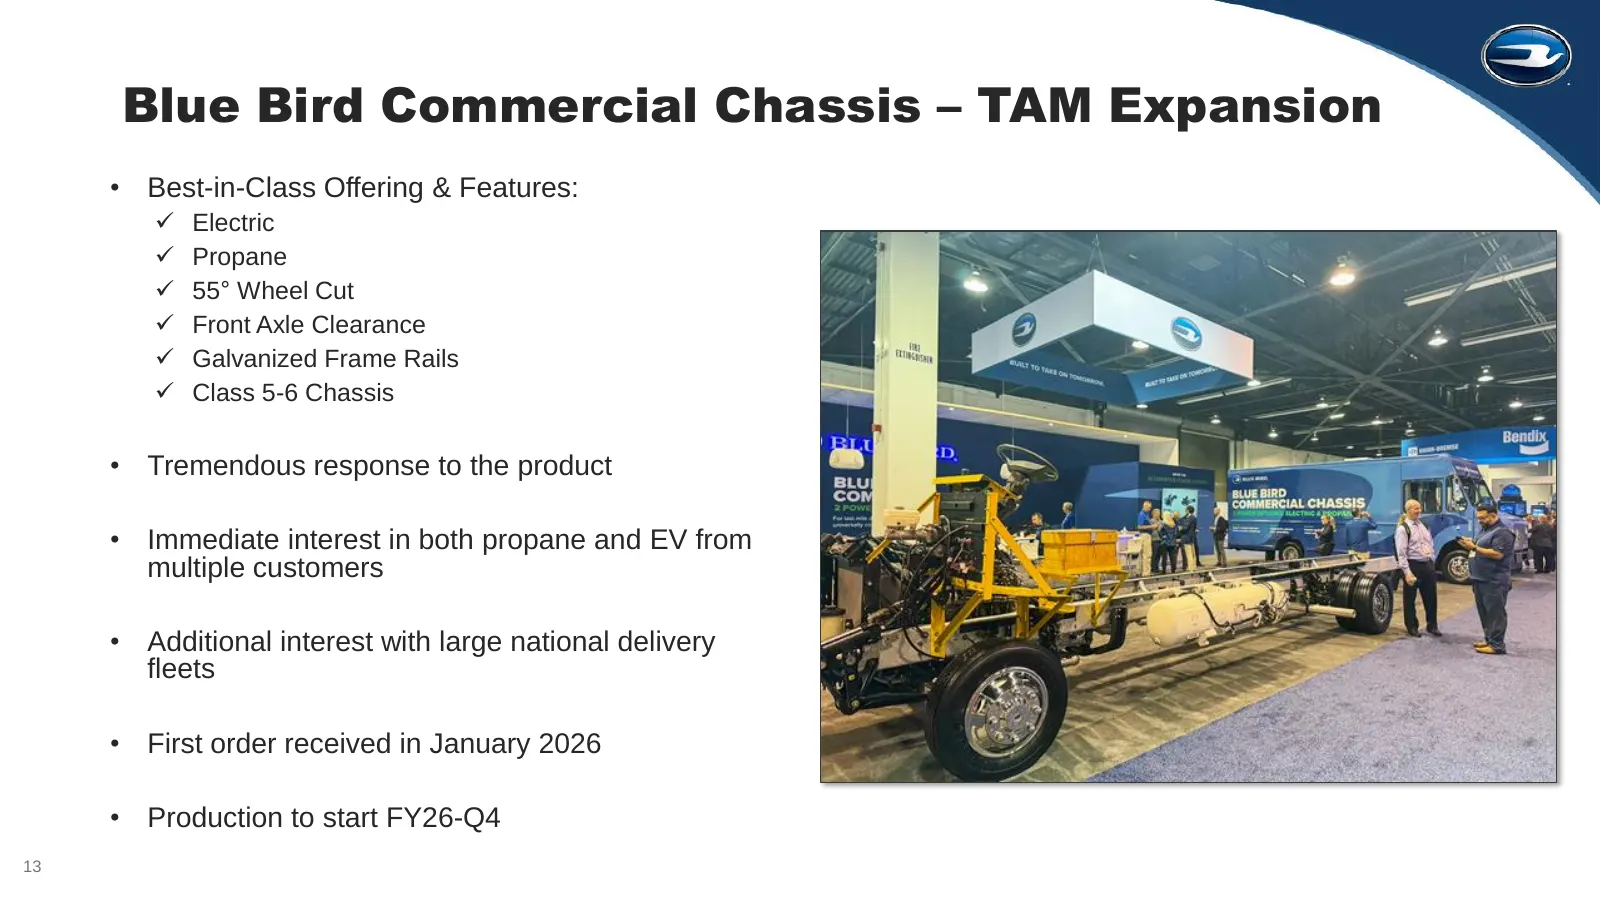
Slide 13: Blue Bird Commercial Chassis – TAM Expansion
Blue Bird Commercial Chassis – TAM Expansion • Best-in-Class Offering & Features: ✓ Electric ✓ Propane ✓ 55° Wheel Cut ✓ Front Axle Clearance ✓ Galvanized Frame Rails ✓ Class 5-6 Chassis • Tremendous response to the product • Immediate interest in both propane and EV from multiple customers • Additi
Slide 14: FY2026 Objectives
FY2026 Objectives 14
Slide 15: FY2026 Guidance Updated – Raised to $225M and 15%
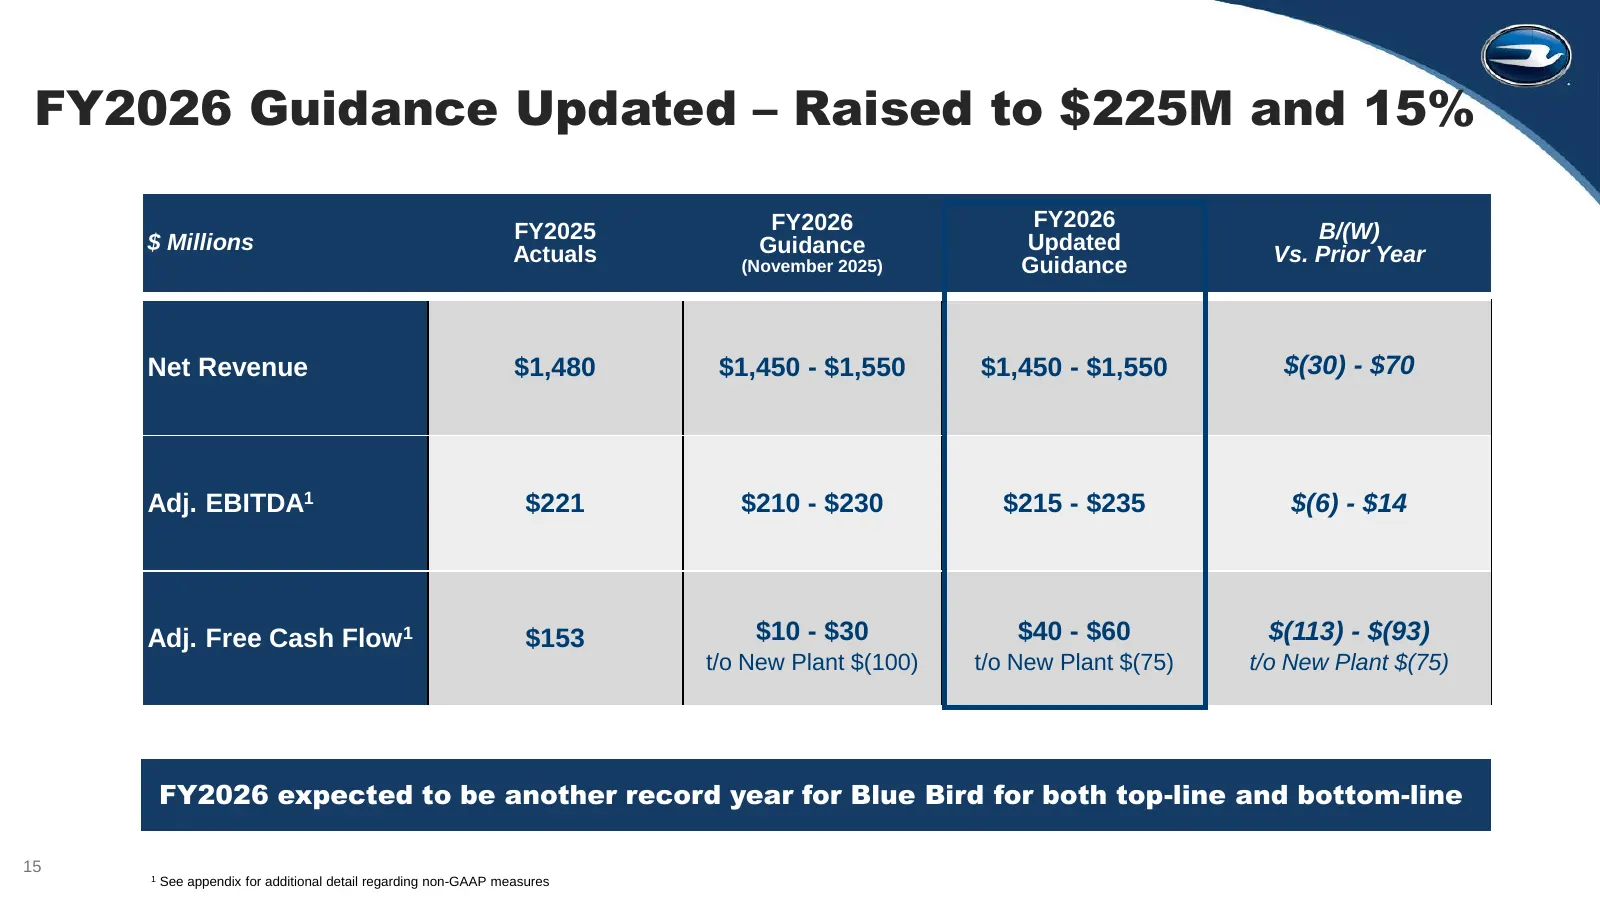
FY2026 Guidance Updated – Raised to $225M and 15% FY2025 FY2026 FY2026 B/(W) $ Millions Actuals Guidance Updated Vs. Prior Year (November 2025) Guidance Net Revenue $1,480 $1,450 - $1,550 $1,450 - $1,550 $(30) - $70 Adj. EBITDA1 $221 $210 - $230 $215 - $235 $(6) - $14 Adj. Free Cash Flow1 $153 $10 -
Slide 16: FY2026 Guidance Updated – Raised to $225M and 15%
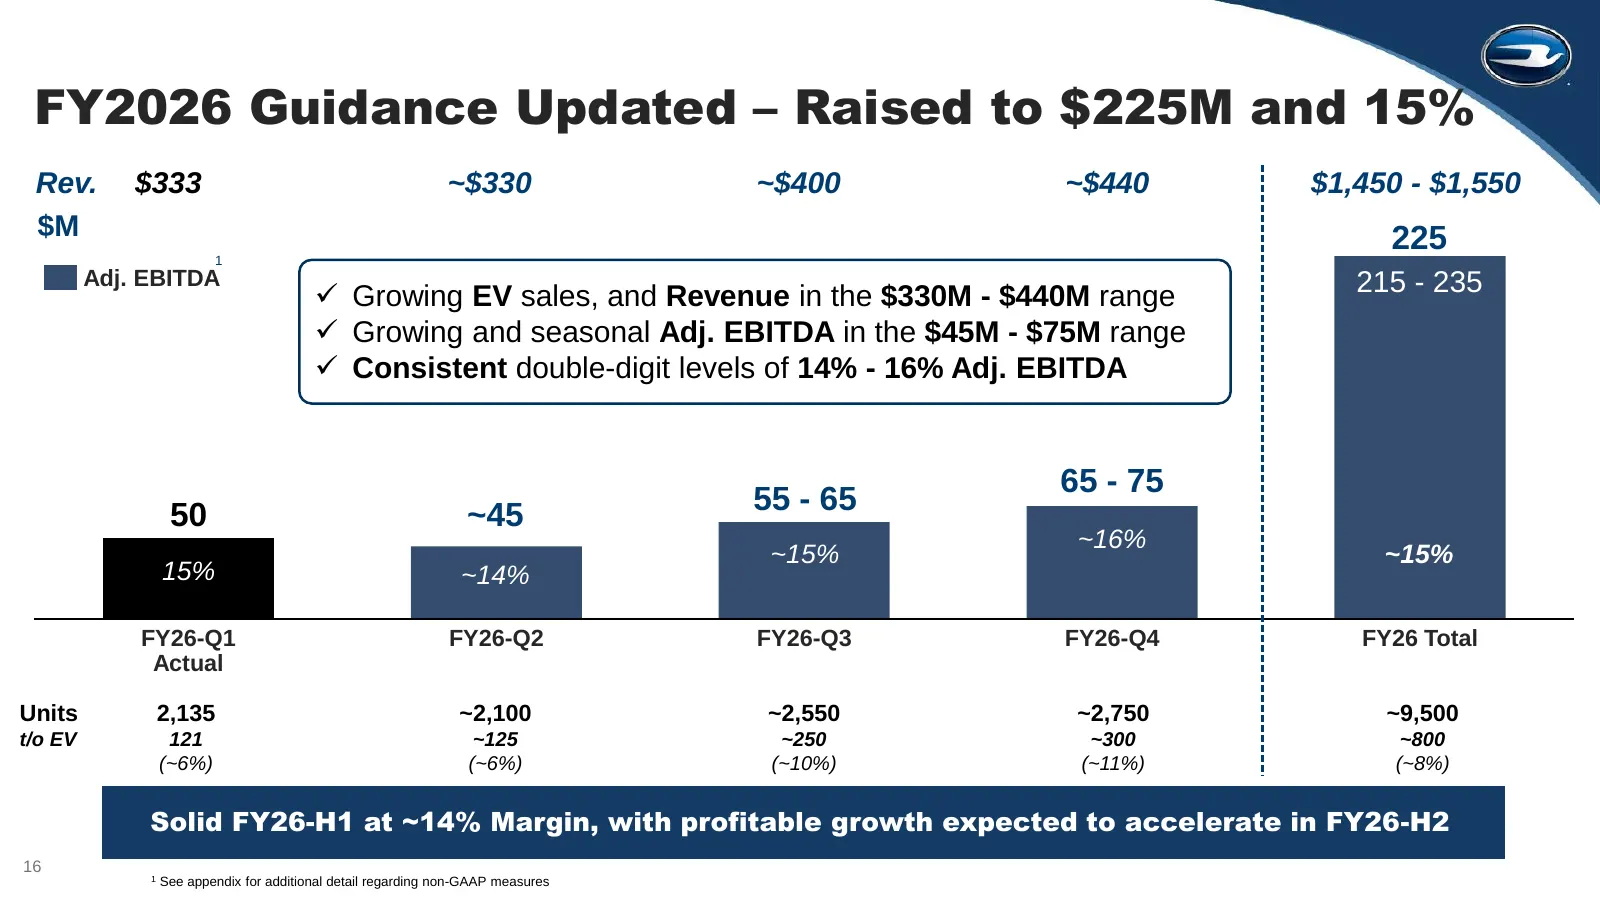
FY2026 Guidance Updated – Raised to $225M and 15% Rev. $333 ~$330 ~$400 ~$440 $1,450 - $1,550 $M 225 1 Adj. EBITDA 215 - 235 ✓ Growing EV sales, and Revenue in the $330M - $440M range ✓ Growing and seasonal Adj. EBITDA in the $45M - $75M range ✓ Consistent double-digit levels of 14% - 16% Adj. EBITD
Slide 17: Capital Allocation – Incl. $100M Share Repurchase Program
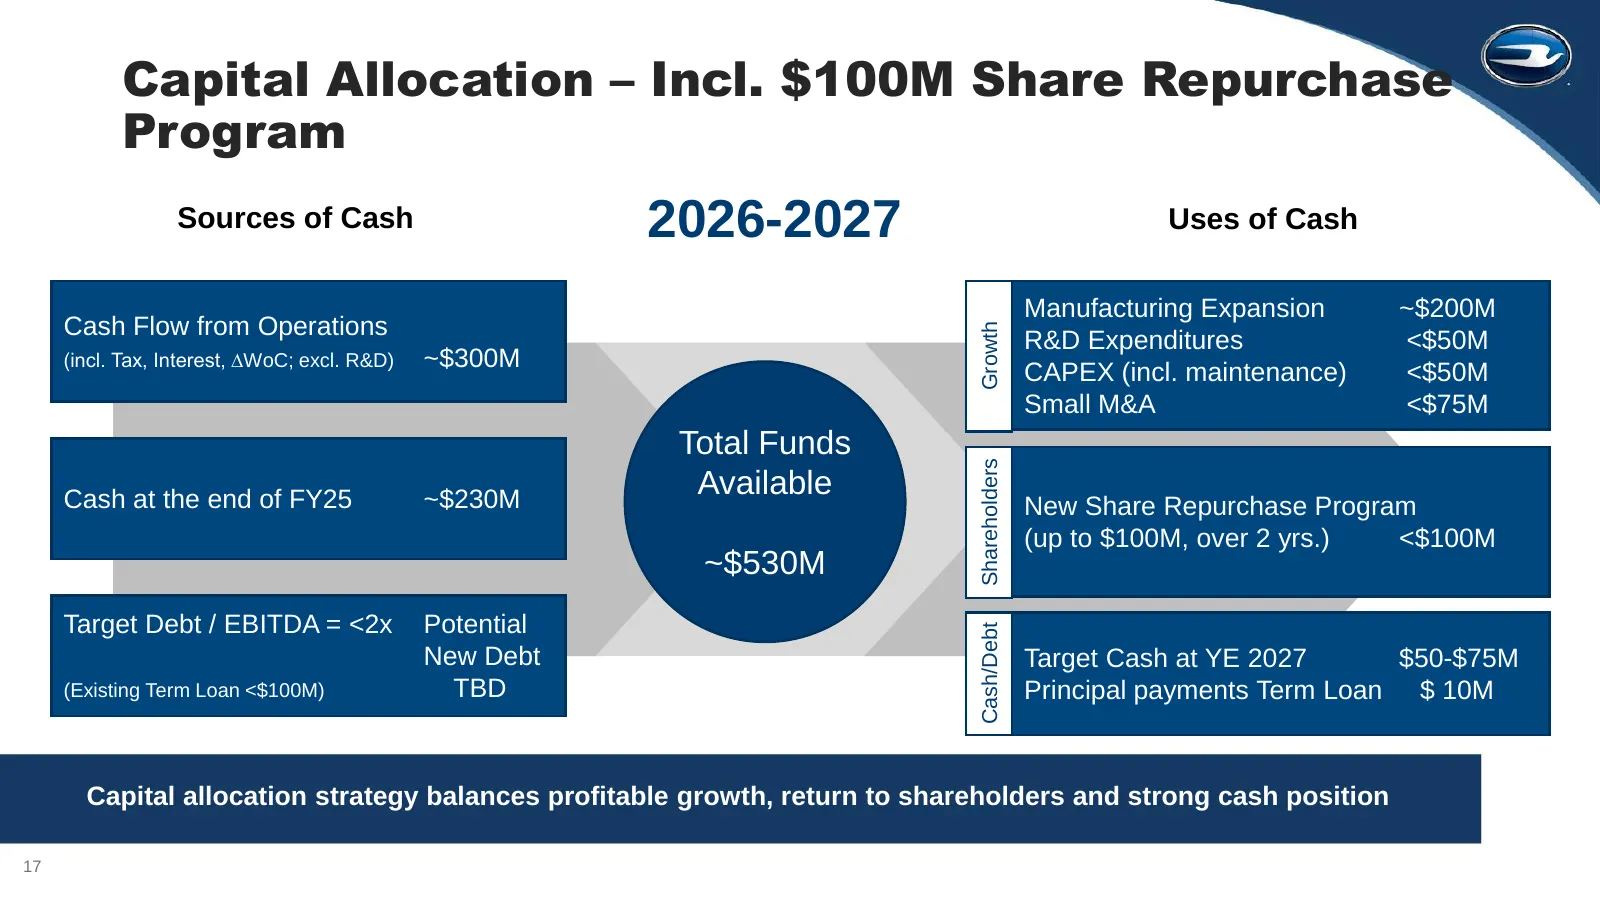
Capital Allocation – Incl. $100M Share Repurchase Program Sources of Cash 2026-2027 Uses of Cash Manufacturing Expansion ~$200M Cash Flow from Operations Growth R&D Expenditures <$50M (incl. Tax, Interest, ∆WoC; excl. R&D) ~$300M CAPEX (incl. maintenance) <$50M Small M&A <$75M Total Funds Shareholde
Slide 18: Solid Growth Runway
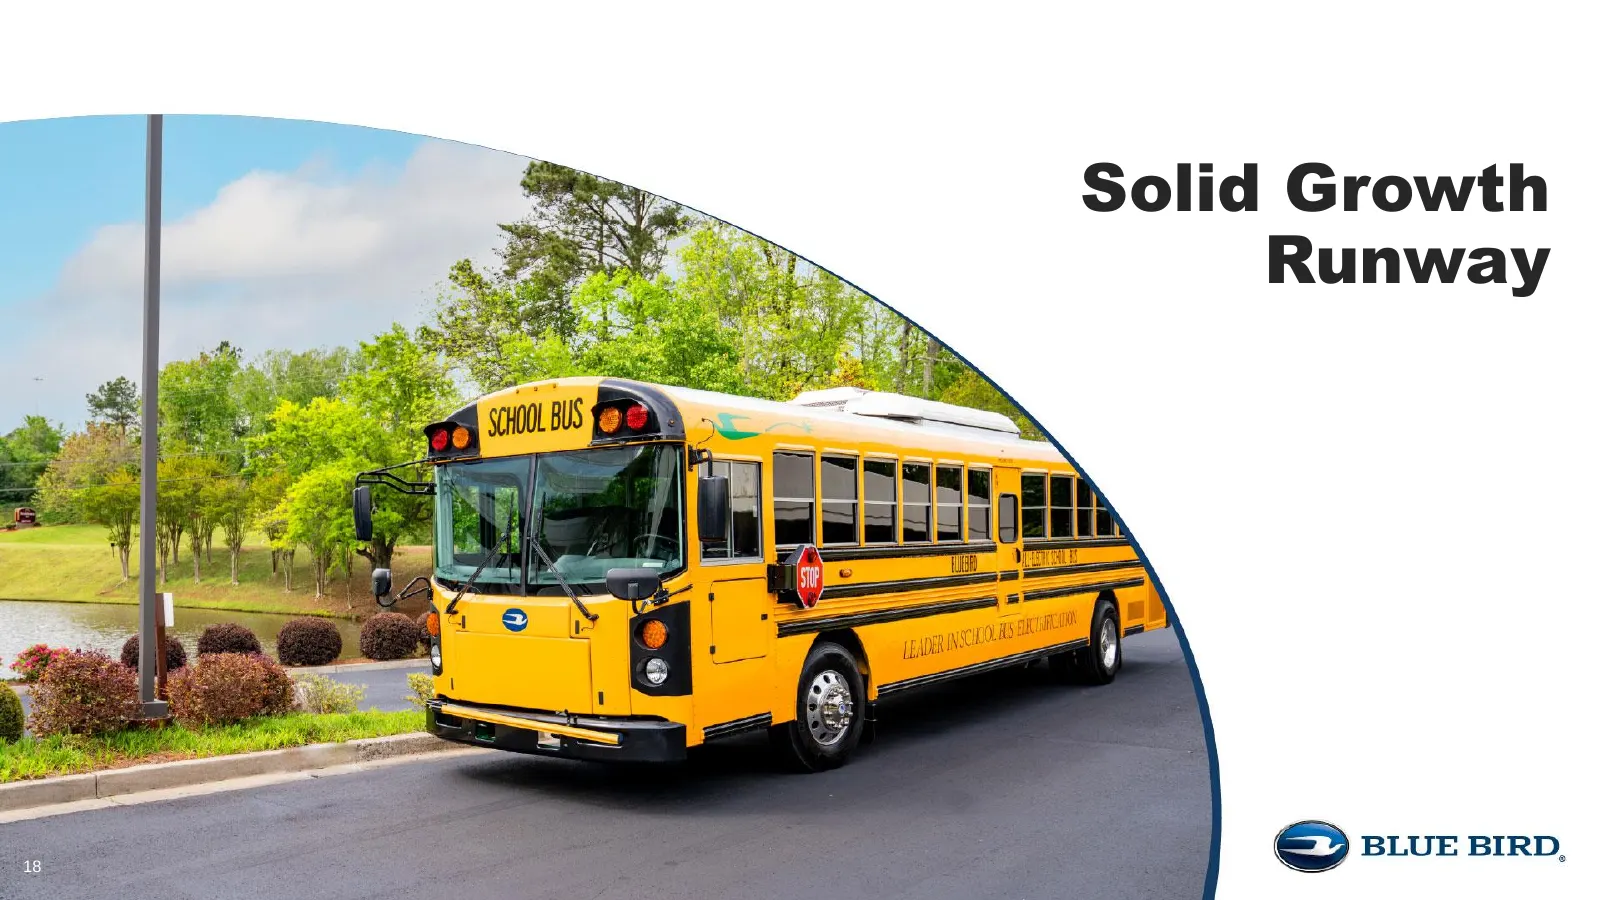
Solid Growth Runway 18
Slide 19: Key Elements of Strategic Positioning
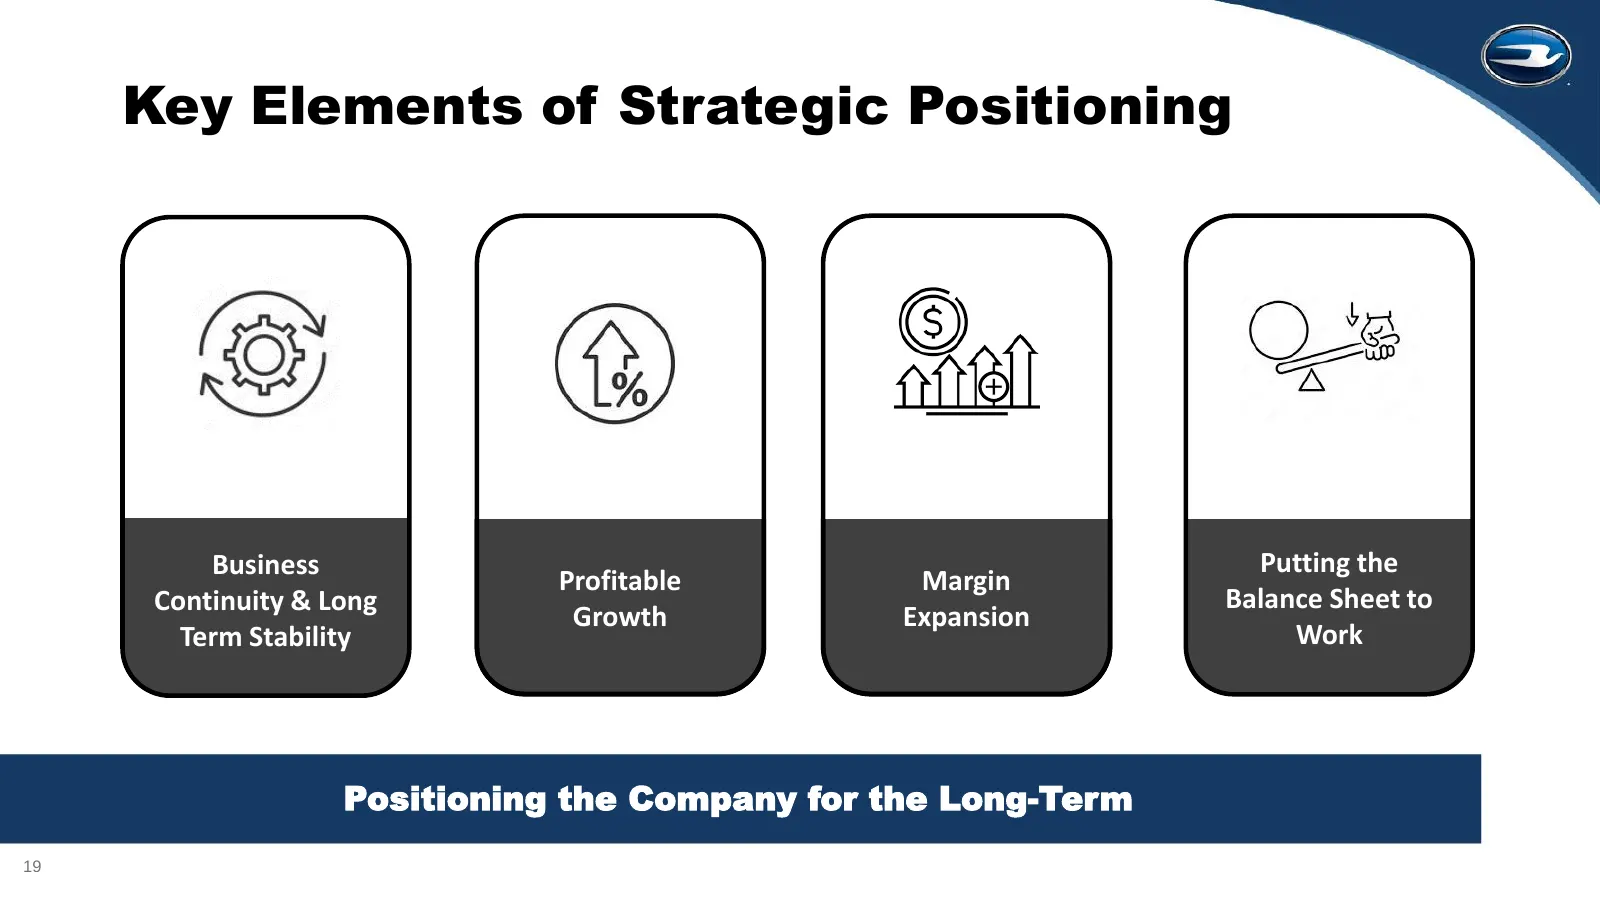
Key Elements of Strategic Positioning Business Putting the Profitable Margin Continuity & Long Balance Sheet to Growth Expansion Term Stability Work Positioning the Company for the Long-Term 19
Slide 20: Strong Industry and Blue Bird Outlook
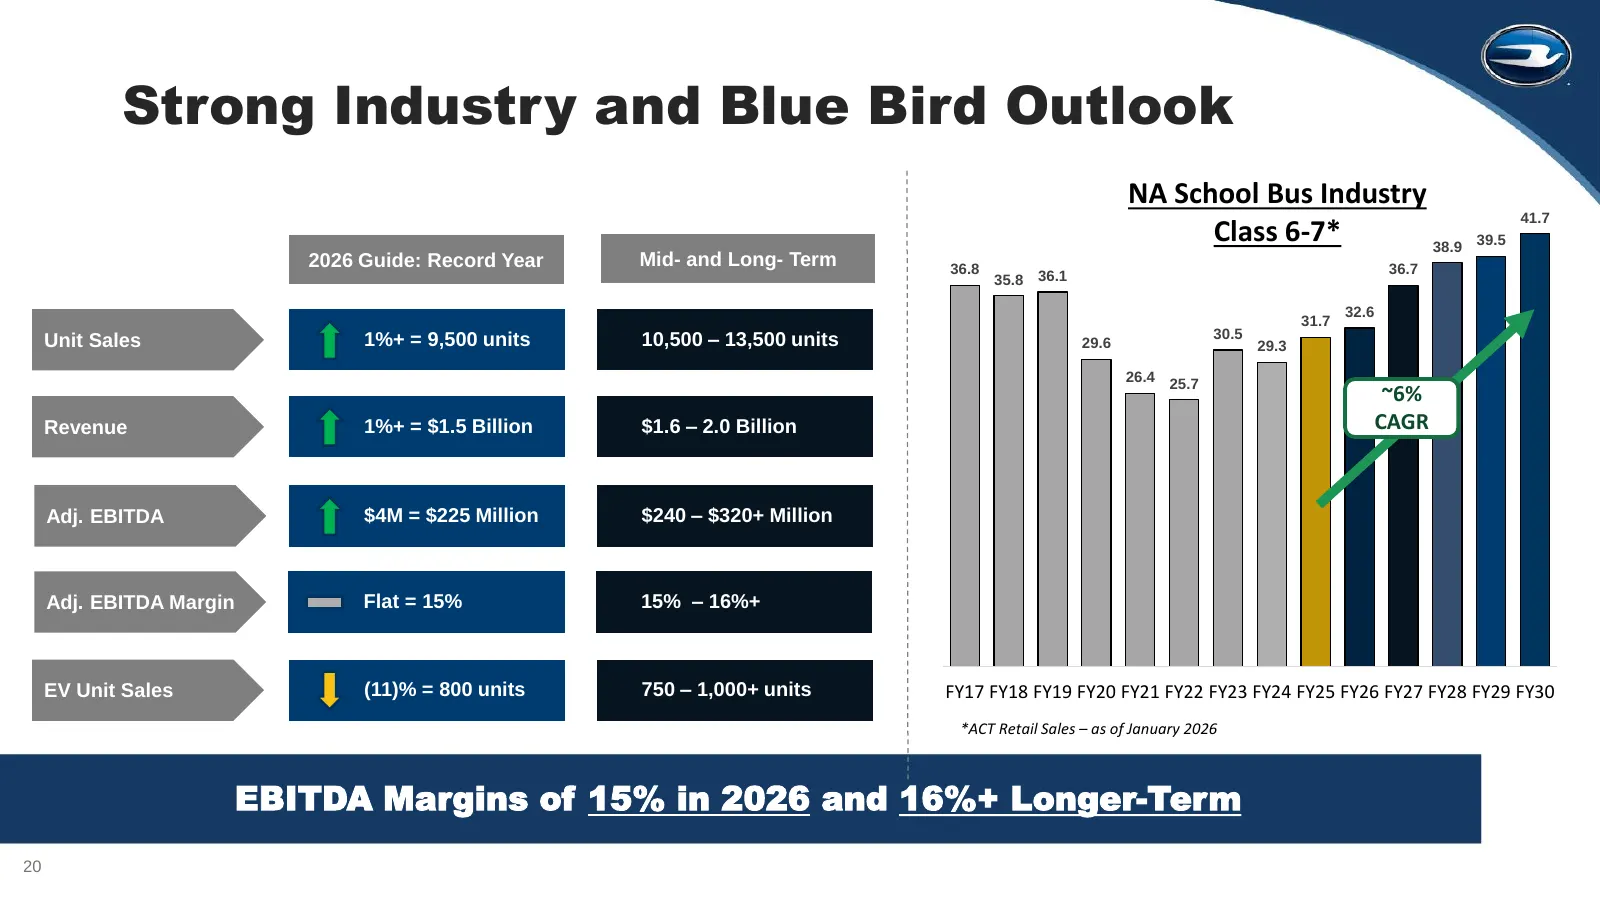
Strong Industry and Blue Bird Outlook NA School Bus Industry 41.7 Class 6-7* 38.9 39.5 2026 Guide: Record Year Mid- and Long- Term 36.8 36.7 35.8 36.1 32.6 31.7 Unit Sales 1%+ = 9,500 units 10,500 – 13,500 units 29.6 30.5 29.3 26.4 25.7 ~6% Revenue 1%+ = $1.5 Billion $1.6 – 2.0 Billion CAGR Adj. EBI
Slide 21: Blue Bird long term outlook confirmed
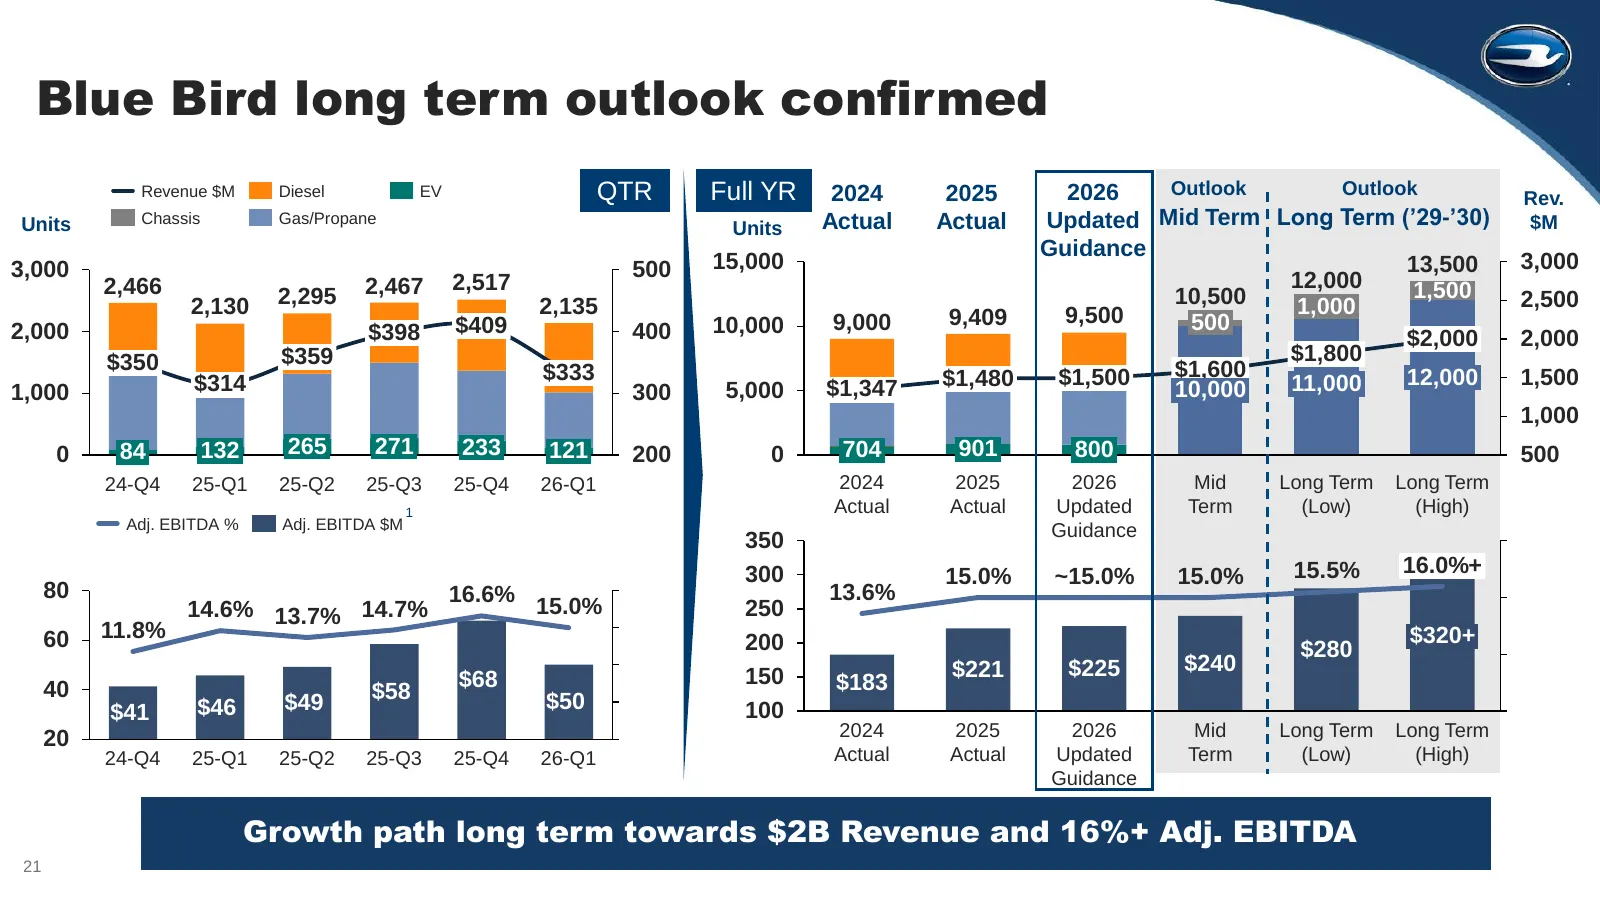
Blue Bird long term outlook confirmed Revenue $M Diesel EV QTR Full YR 2024 2025 2026 Outlook Outlook Rev. Units Chassis Gas/Propane Units Actual Actual Updated Mid Term Long Term (’29-’30) $M Guidance 3,000 500 15,000 13,500 3,000 2,466 2,467 2,517 12,000 1,500 2,130 2,295 2,135 10,500 1,000 2,500
Slide 22: Investment Highlights
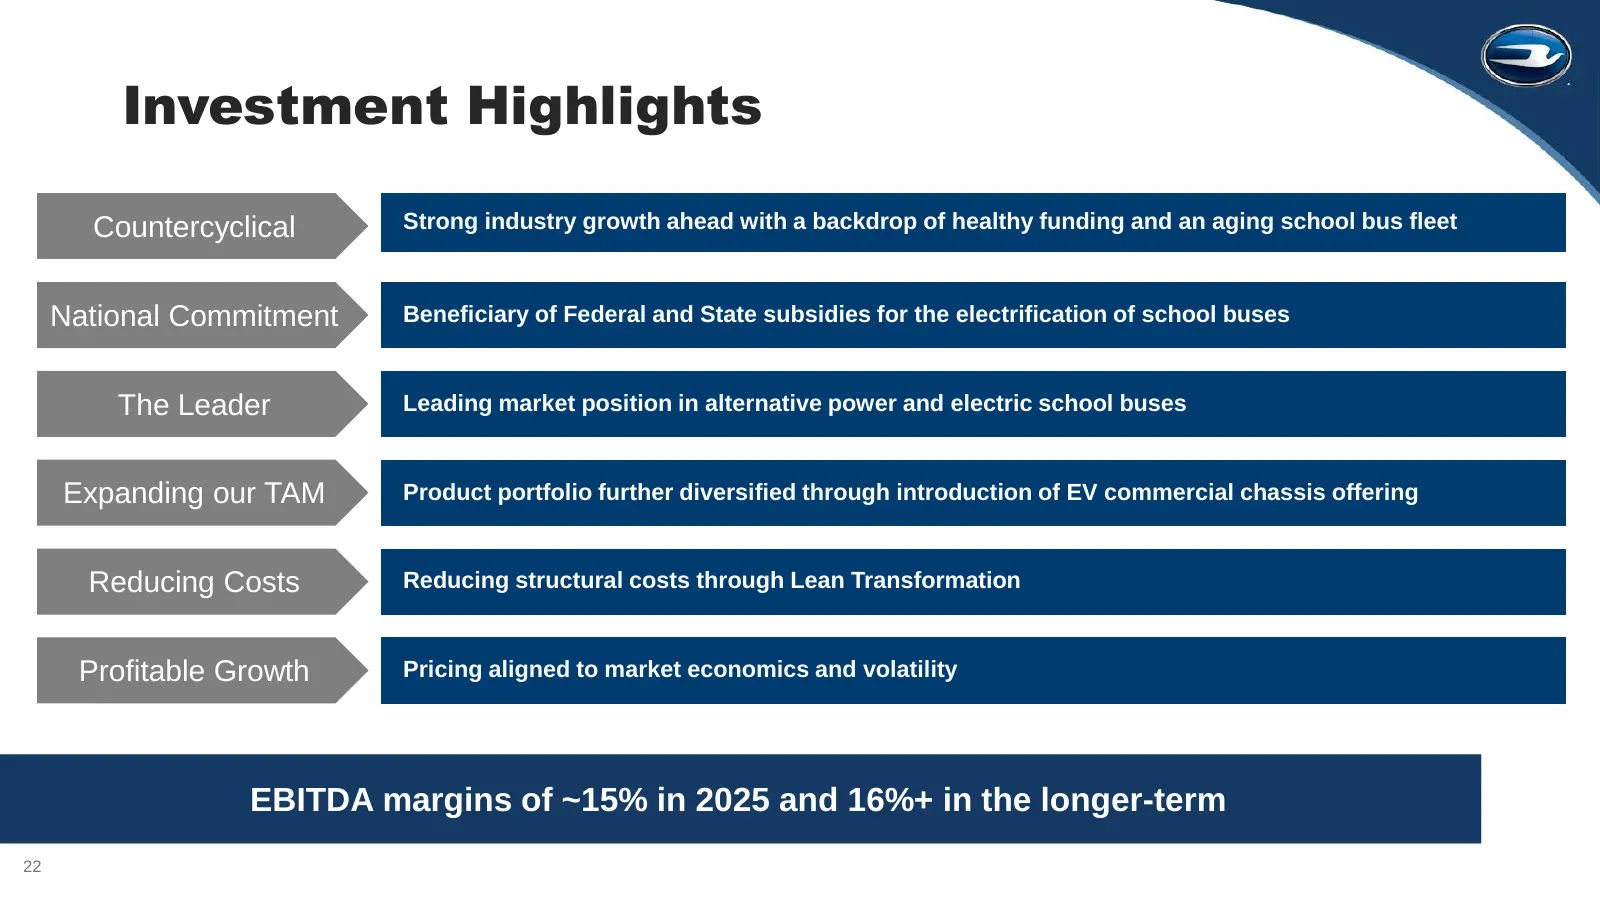
Investment Highlights Countercyclical Strong industry growth ahead with a backdrop of healthy funding and an aging school bus fleet National Commitment Beneficiary of Federal and State subsidies for the electrification of school buses The Leader Leading market position in alternative power and elect
Slide 23: Appendix
Appendix 23
Slide 24: Key FY2026 Q1 Takeaways
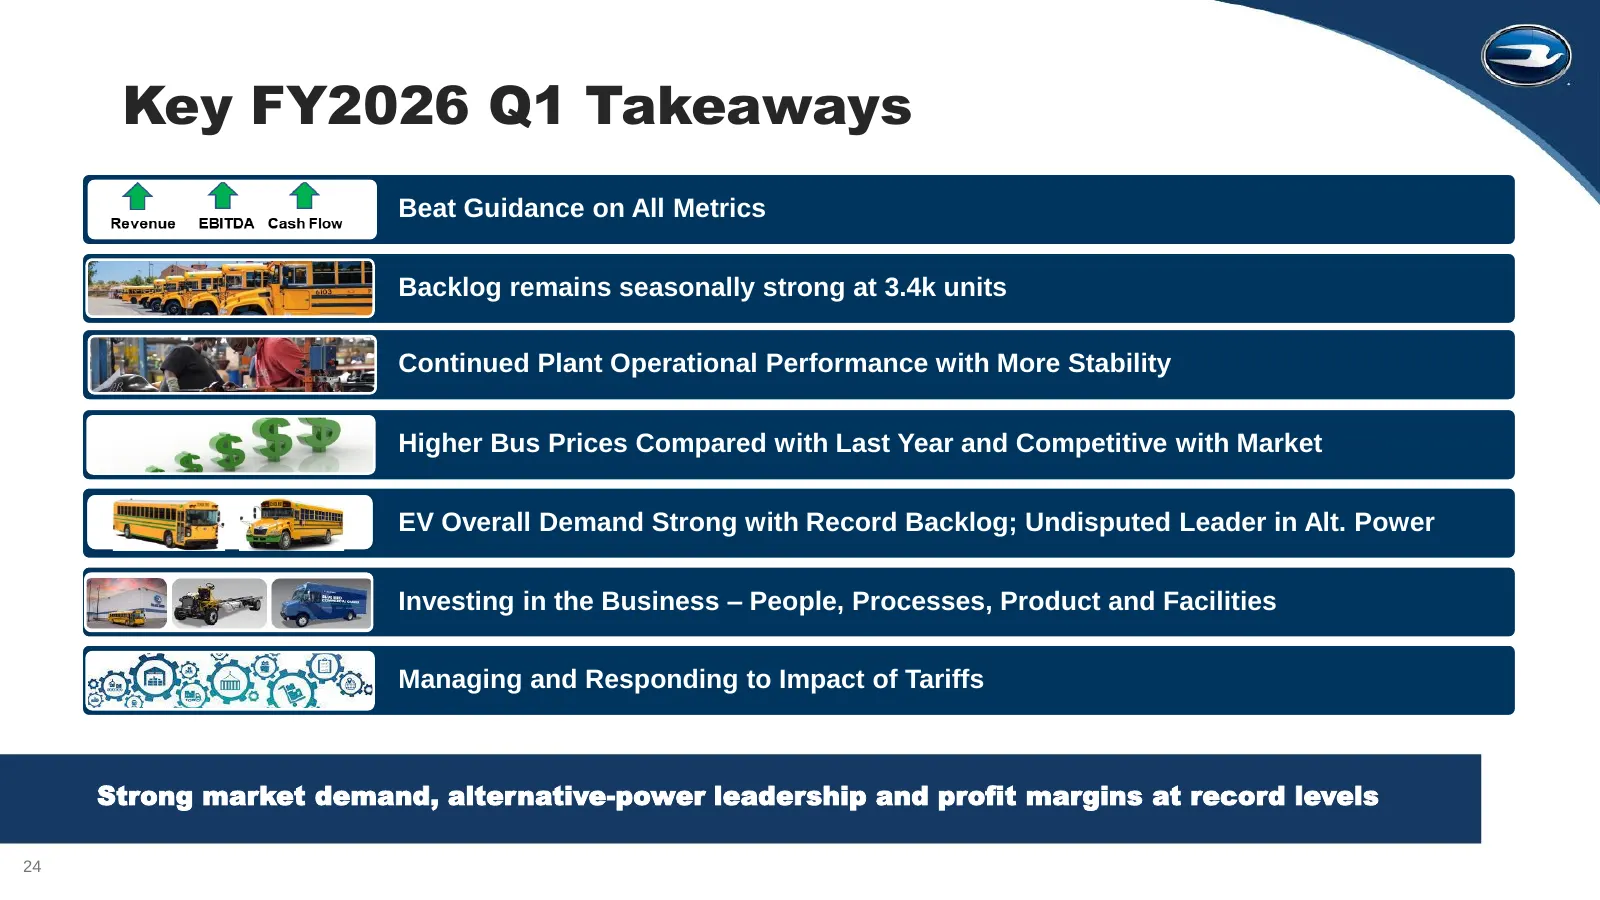
Key FY2026 Q1 Takeaways Beat Guidance on All Metrics Backlog remains seasonally strong at 3.4k units Continued Plant Operational Performance with More Stability Higher Bus Prices Compared with Last Year and Competitive with Market EV Overall Demand Strong with Record Backlog; Undisputed Leader in Al
Slide 25: FY2026 Q1 Financial Results and Key Business Highlights
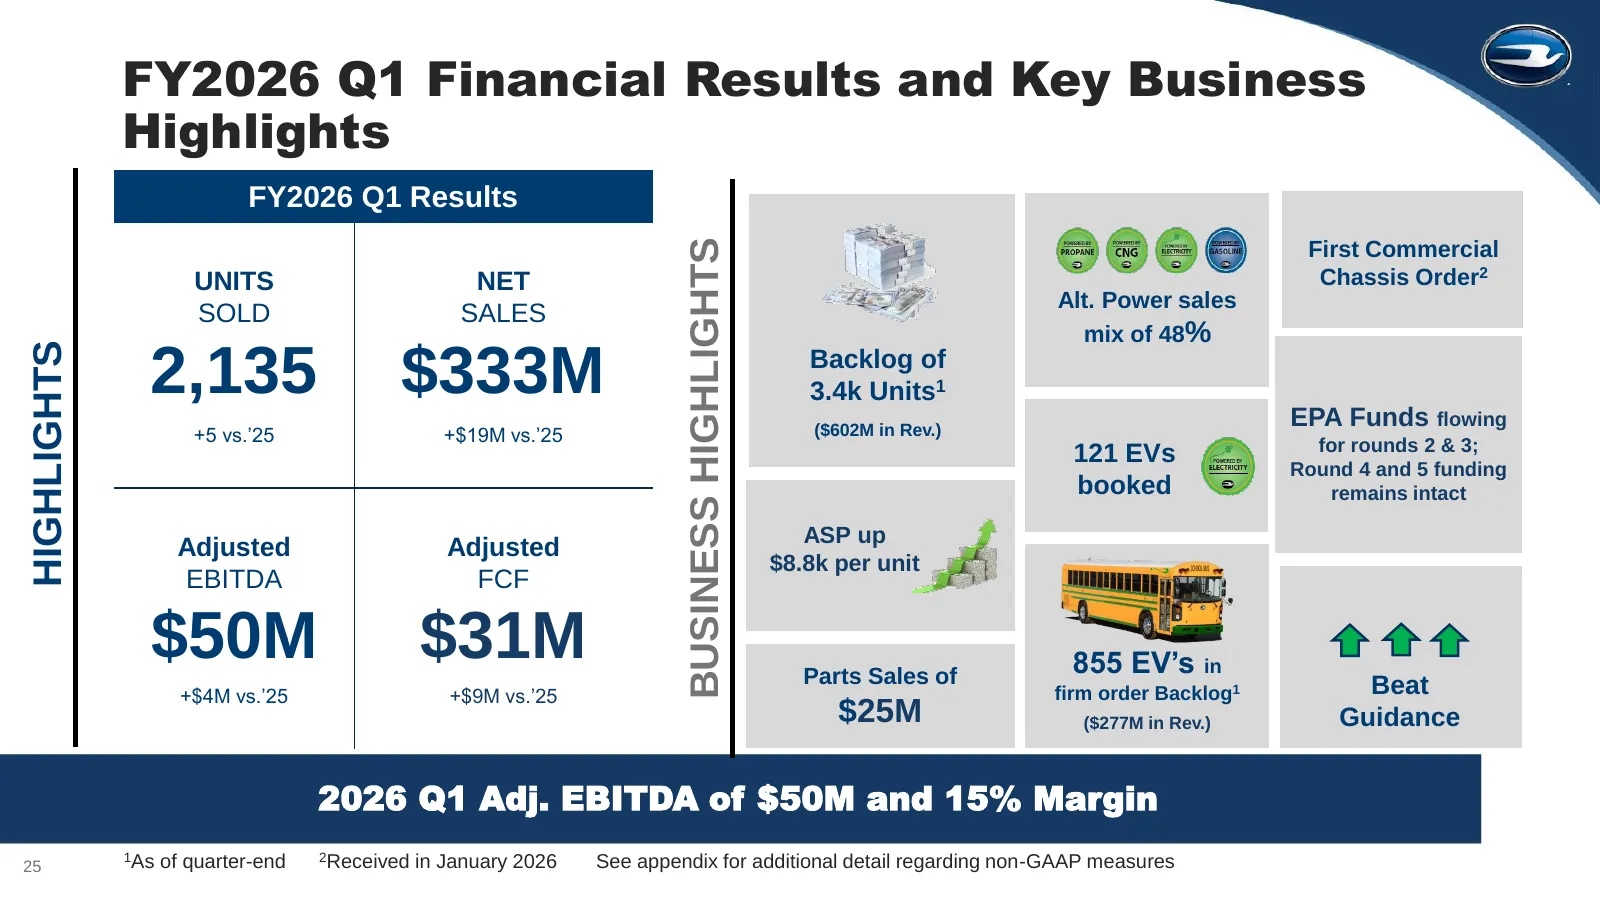
FY2026 Q1 Financial Results and Key Business Highlights FY2026 Q1 Results BUSINESS HIGHLIGHTS First Commercial UNITS NET Chassis Order2 Alt. Power sales SOLD SALES mix of 48% HIGHLIGHTS 2,135 $333M Backlog of 3.4k Units1 EPA Funds flowing +5 vs.’25 +$19M vs.’25 ($602M in Rev.) for rounds 2 & 3; 121
Slide 26: FY2026 Q1 Financial Results
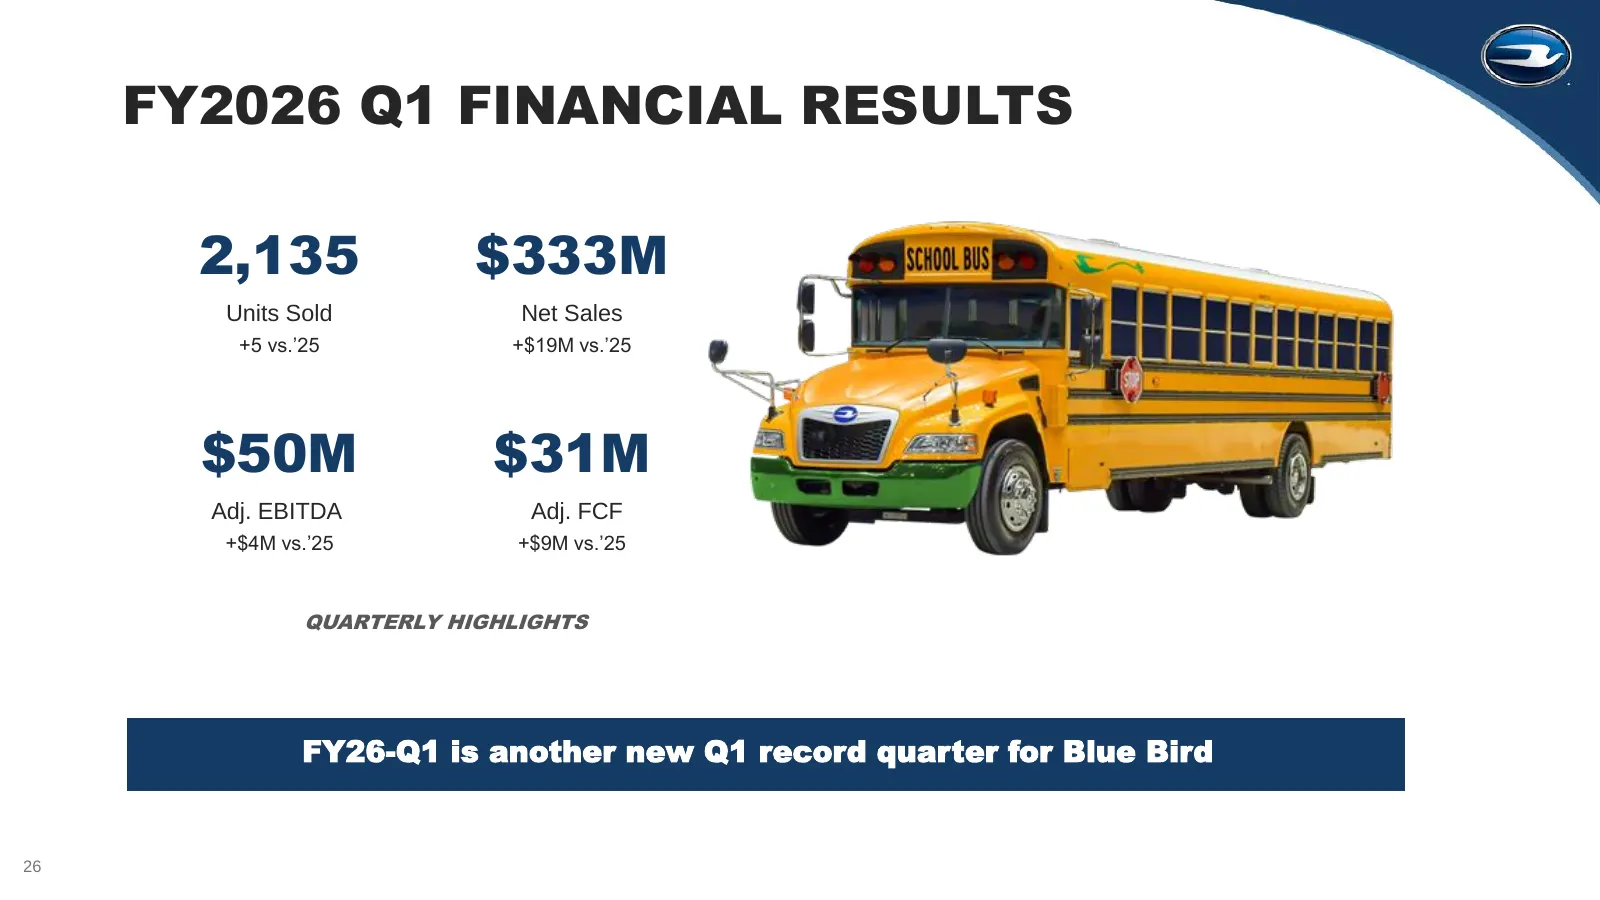
FY2026 Q1 FINANCIAL RESULTS 2,135 $333M Units Sold Net Sales +5 vs.’25 +$19M vs.’25 $50M $31M Adj. EBITDA Adj. FCF +$4M vs.’25 +$9M vs.’25 QUARTERLY HIGHLIGHTS FY26-Q1 is another new Q1 record quarter for Blue Bird 26
Slide 27: Quarterly Income Statement
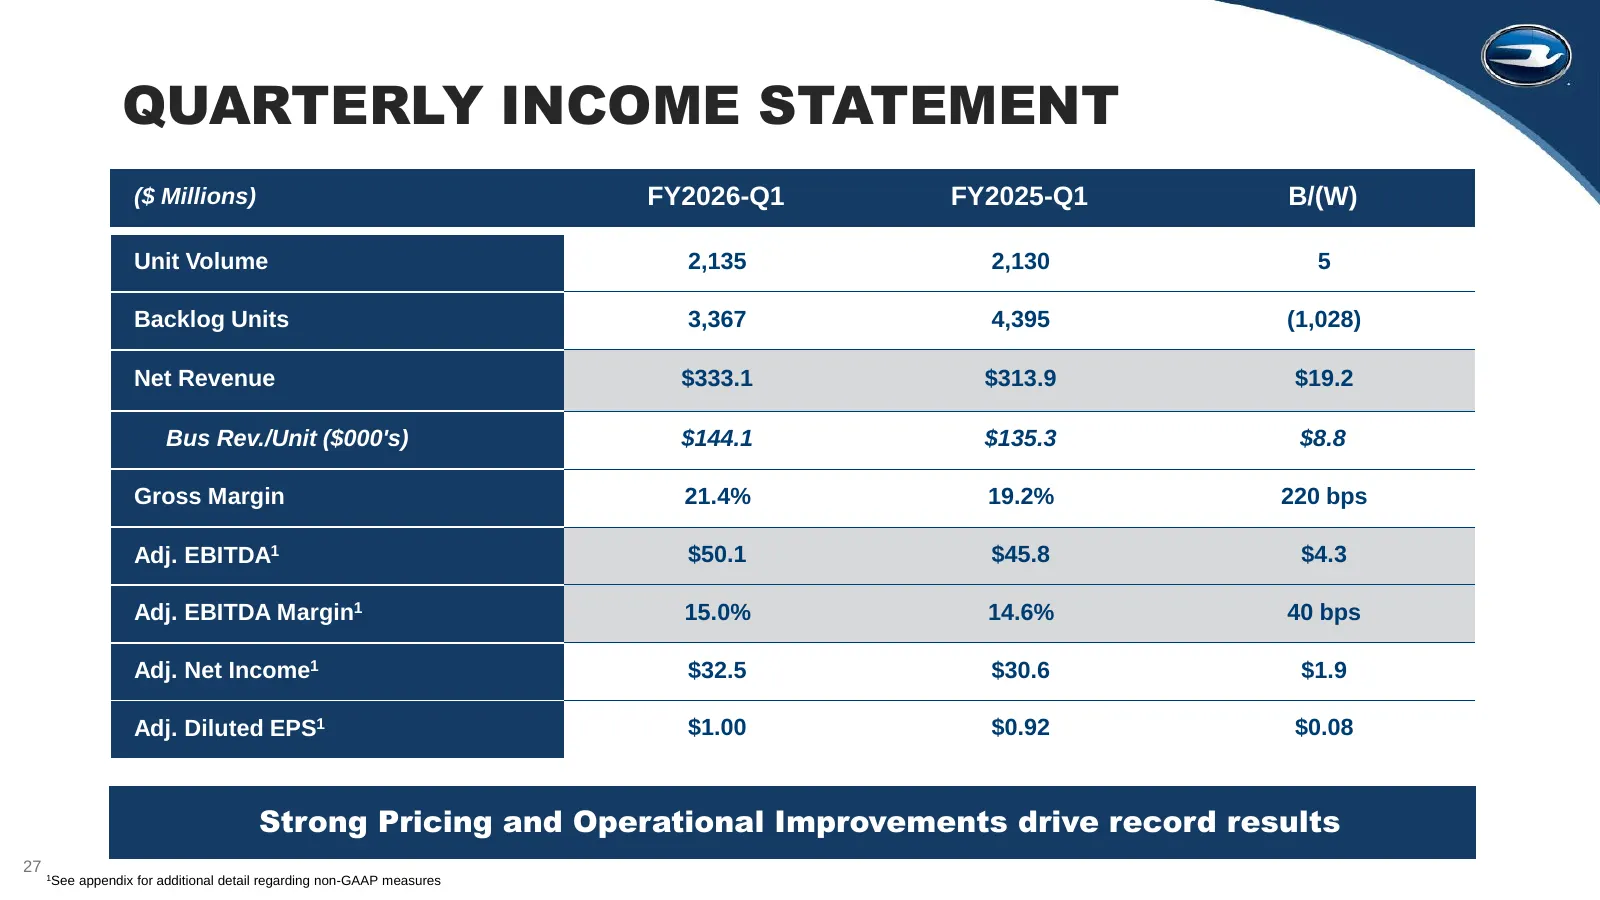
QUARTERLY INCOME STATEMENT ($ Millions) FY2026-Q1 FY2025-Q1 B/(W) Unit Volume 2,135 2,130 5 Backlog Units 3,367 4,395 (1,028) Net Revenue $333.1 $313.9 $19.2 Bus Rev./Unit ($000's) $144.1 $135.3 $8.8 Gross Margin 21.4% 19.2% 220 bps Adj. EBITDA1 $50.1 $45.8 $4.3 Adj. EBITDA Margin1 15.0% 14.6% 40 bp
Slide 28: FY25-Q1 to FY26-Q1 Adj. EBITDA Walk
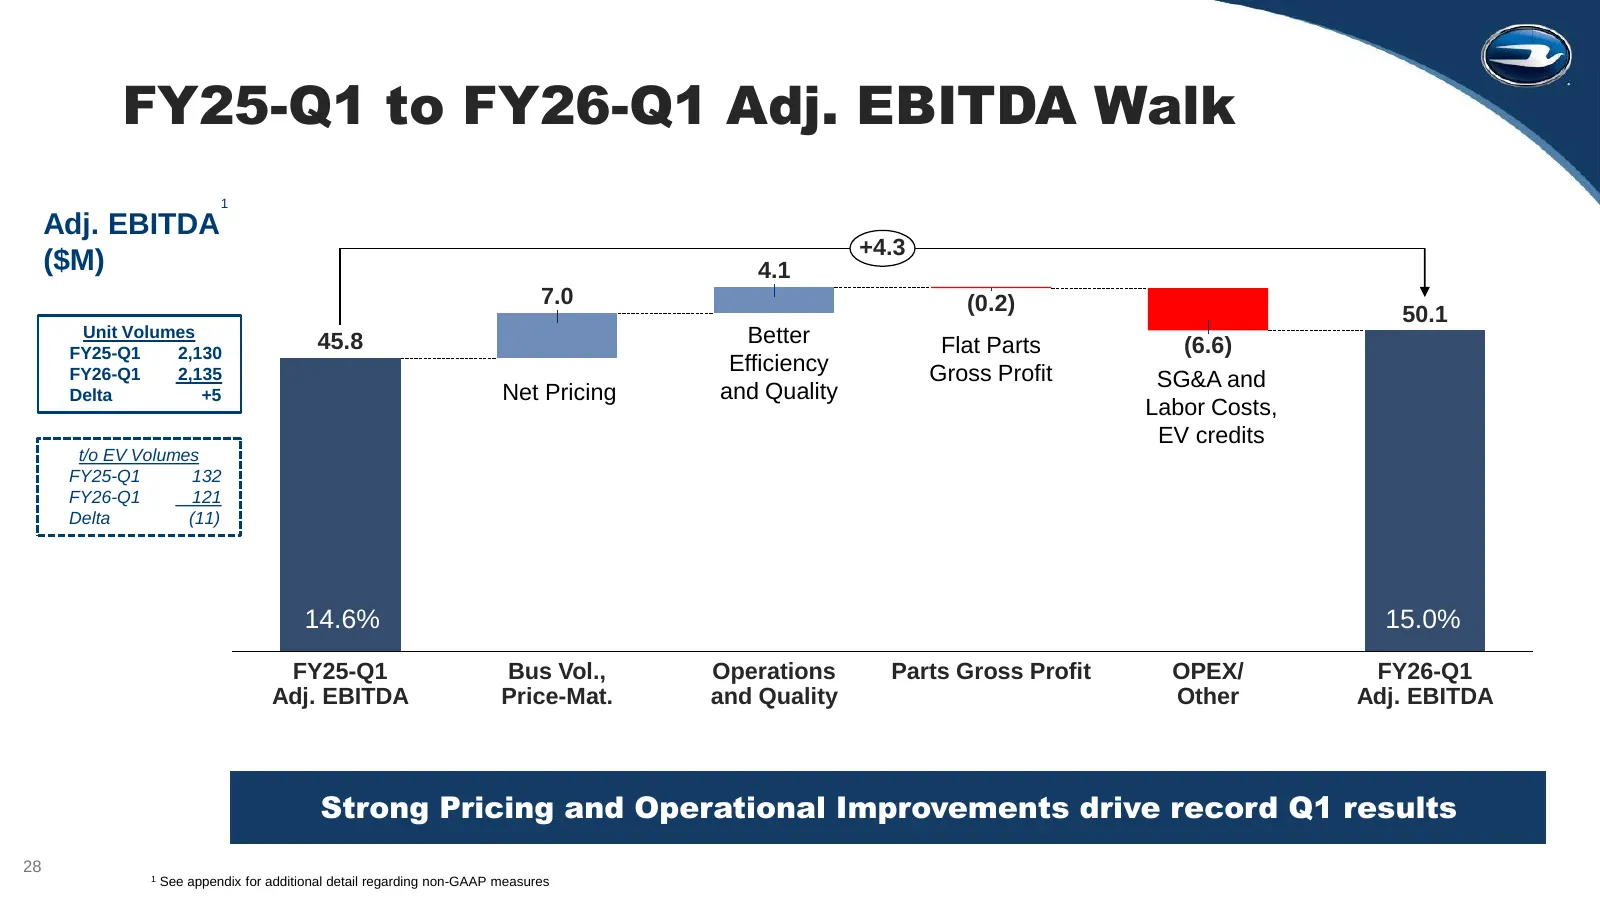
FY25-Q1 to FY26-Q1 Adj. EBITDA Walk 1 Adj. EBITDA +4.3 ($M) 4.1 7.0 (0.2) 50.1 Unit Volumes Better FY25-Q1 2,130 45.8 Flat Parts (6.6) FY26-Q1 2,135 Efficiency Gross Profit SG&A and Delta +5 Net Pricing and Quality Labor Costs, EV credits t/o EV Volumes FY25-Q1 132 FY26-Q1 121 Delta (11) 14.6% 15.0%
Slide 29: Balance Sheet and Cash Flow
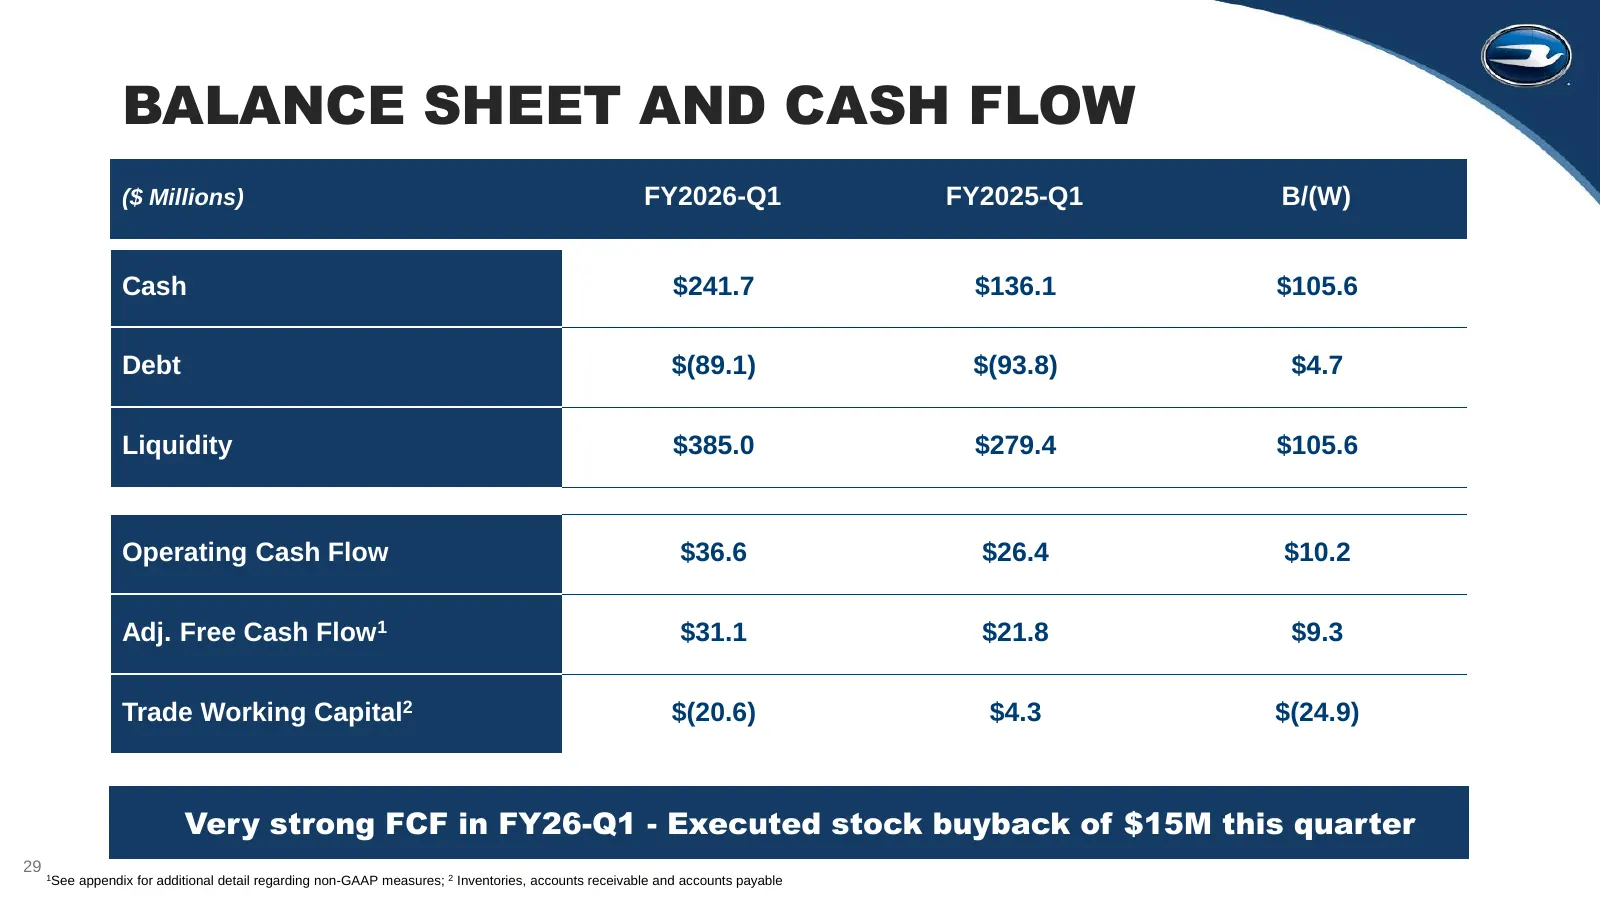
BALANCE SHEET AND CASH FLOW ($ Millions) FY2026-Q1 FY2025-Q1 B/(W) Cash $241.7 $136.1 $105.6 Debt $(89.1) $(93.8) $4.7 Liquidity $385.0 $279.4 $105.6 Operating Cash Flow $36.6 $26.4 $10.2 Adj. Free Cash Flow1 $31.1 $21.8 $9.3 Trade Working Capital2 $(20.6) $4.3 $(24.9) Very strong FCF in FY26-Q1 - E
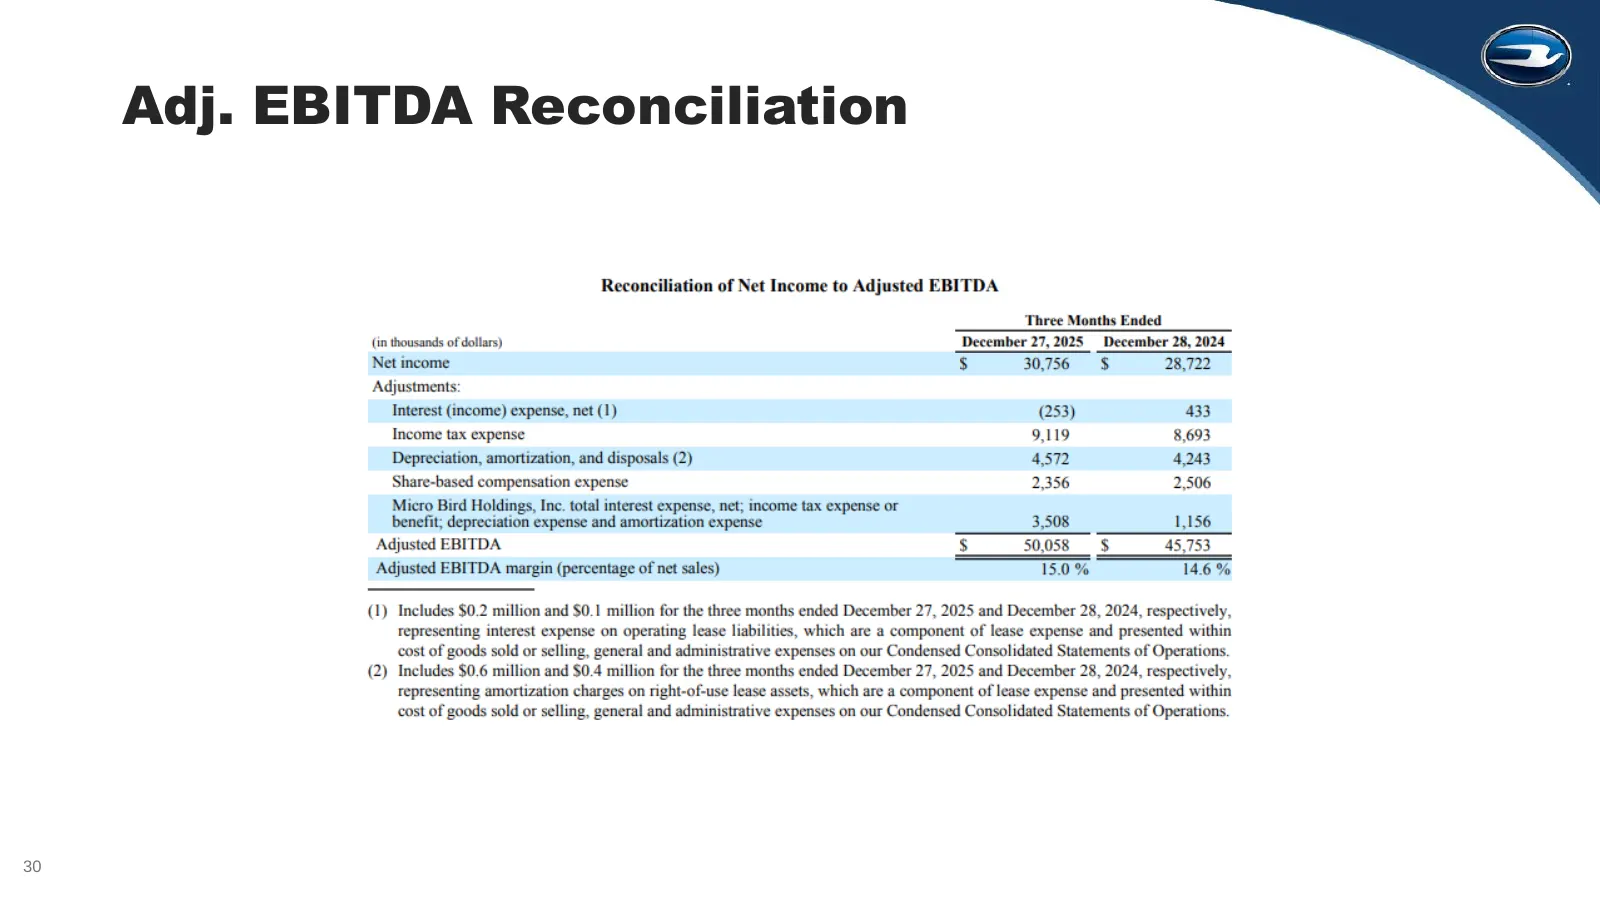
Slide 30: Adj. EBITDA Reconciliation
Adj. EBITDA Reconciliation 30
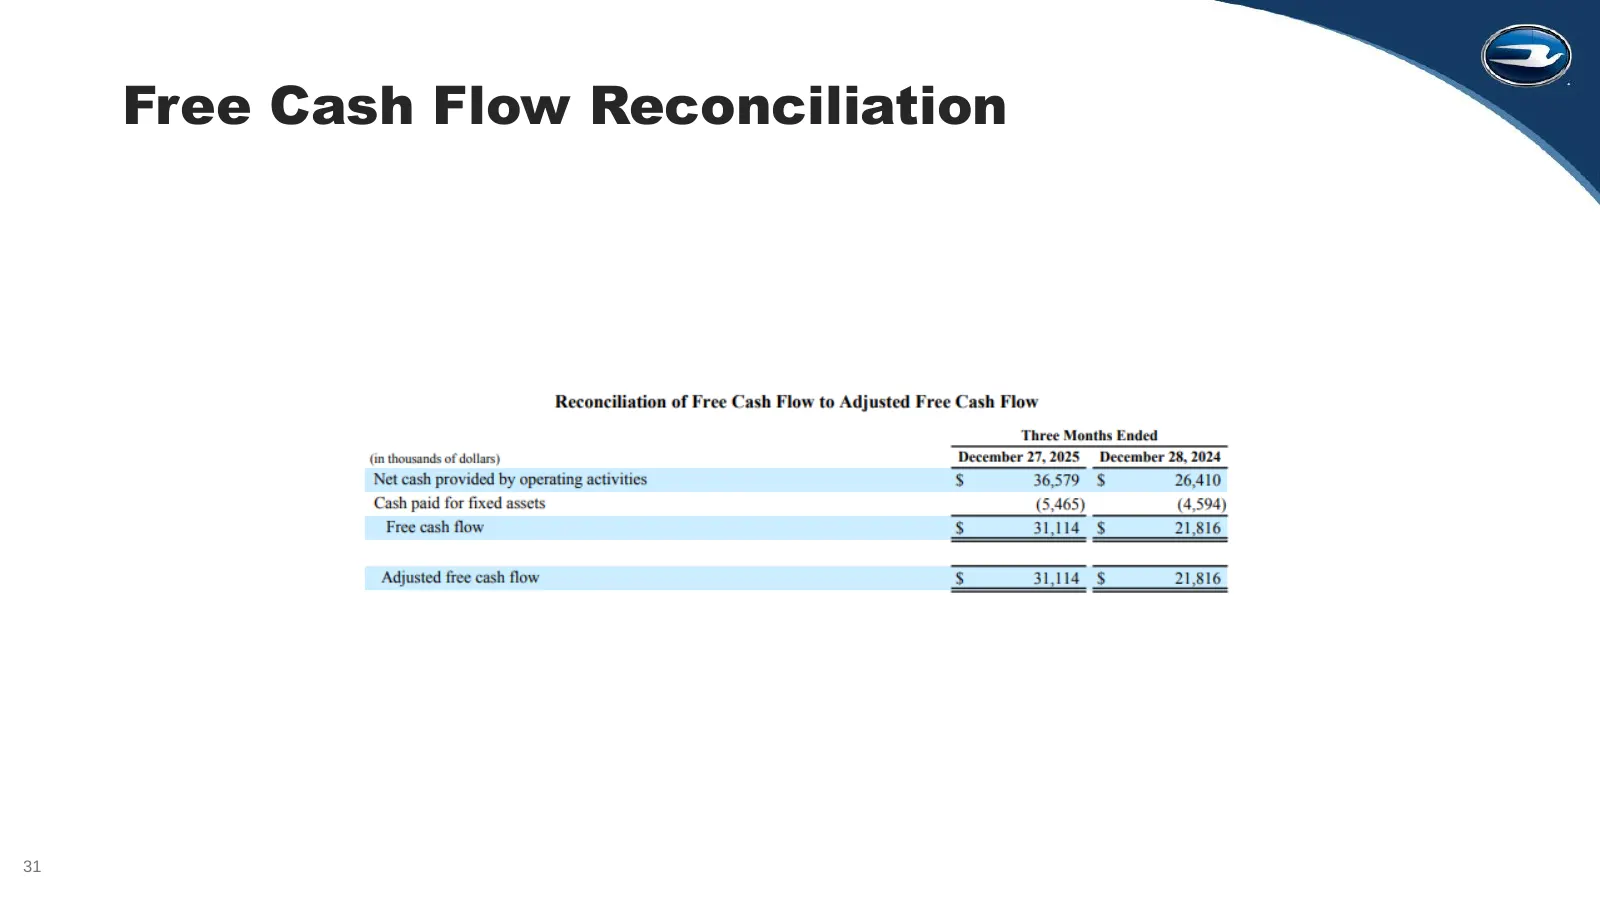
Slide 31: Free Cash Flow Reconciliation
Free Cash Flow Reconciliation 31
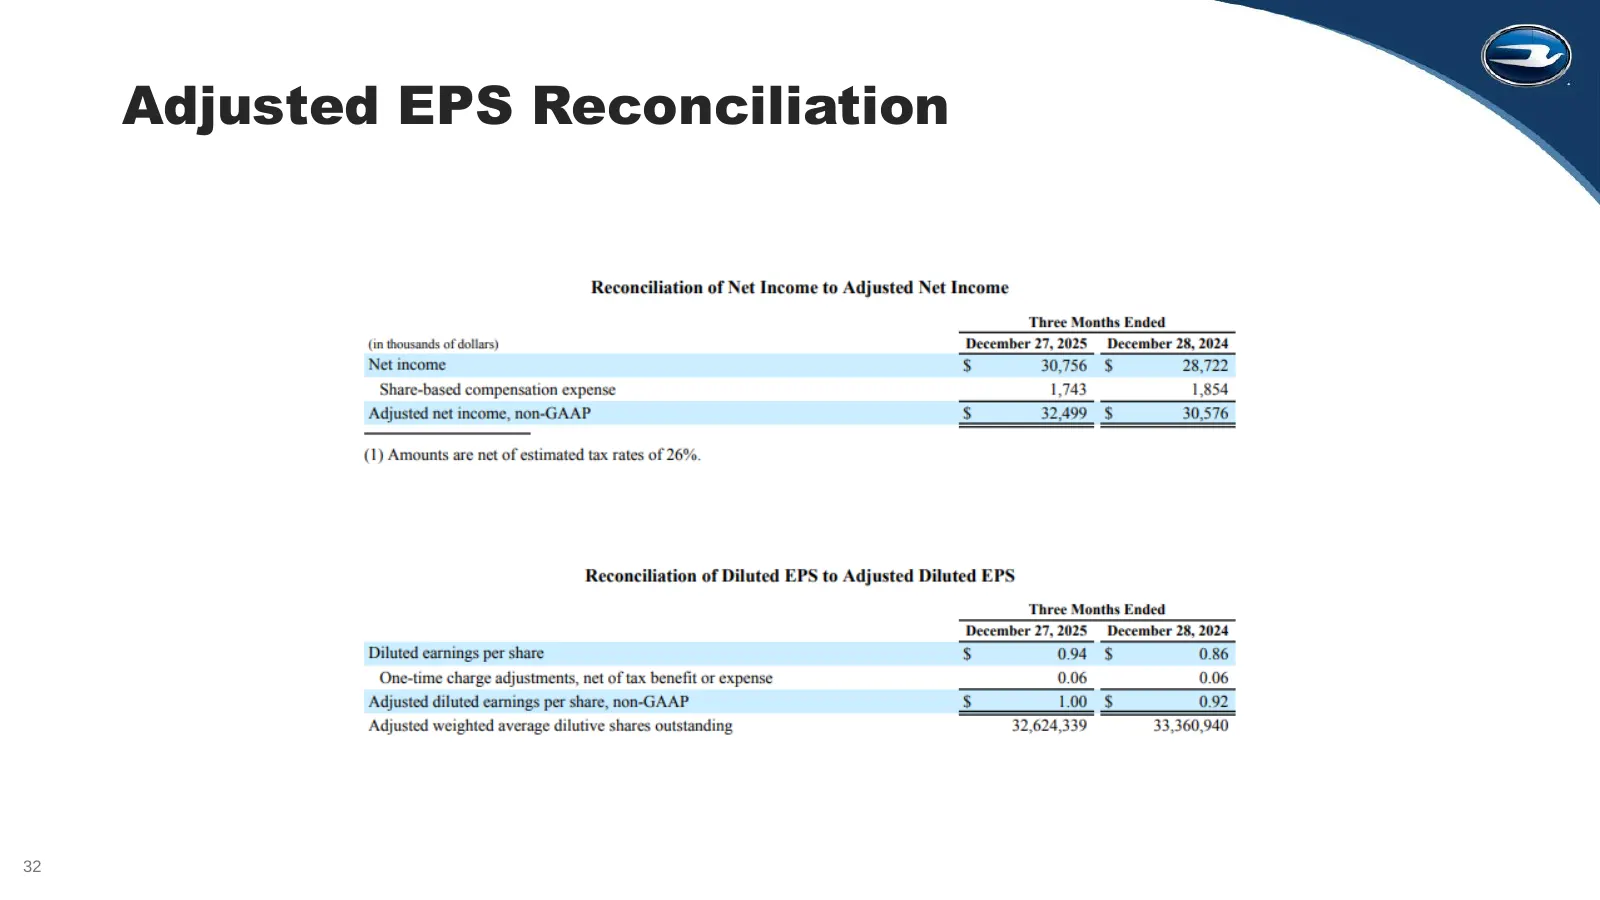
Slide 32: Adjusted EPS Reconciliation
Adjusted EPS Reconciliation 32
Slide 33: Investor Relations Contact Information
Investor Relations Contact Information Mark Benfield Mark.Benfield@Blue-Bird.com 33
Source: company website
More decks from Blue Bird Corporation
 Q3 2026 Earnings Presentation28 slides · Aug 5, 2026
 Investor Presentation (August 2026)36 slides · August 2026
 Q2 2026 Earnings Presentation30 slides · May 6, 2026
 Investor Presentation (May 2026)37 slides · May 2026
 Merger or Acquisition (February 2026)11 slides · Feb 17, 2026
 Q1 2026 Earnings Presentation25 slides · Feb 4, 2026