Seche Environnement SA · EURONEXT:SCHP
Seche Environnement SA — H1 2019 Earnings Presentation
39 slides from Seche Environnement SA's earnings presentation, Sep 10, 2019
Slide 1: Consolidated results at June 30, 2019
Consolidated results at June 30, 2019 Meeting of September 10, 2019
Slide 2: Confirmed strategy of profitable growth
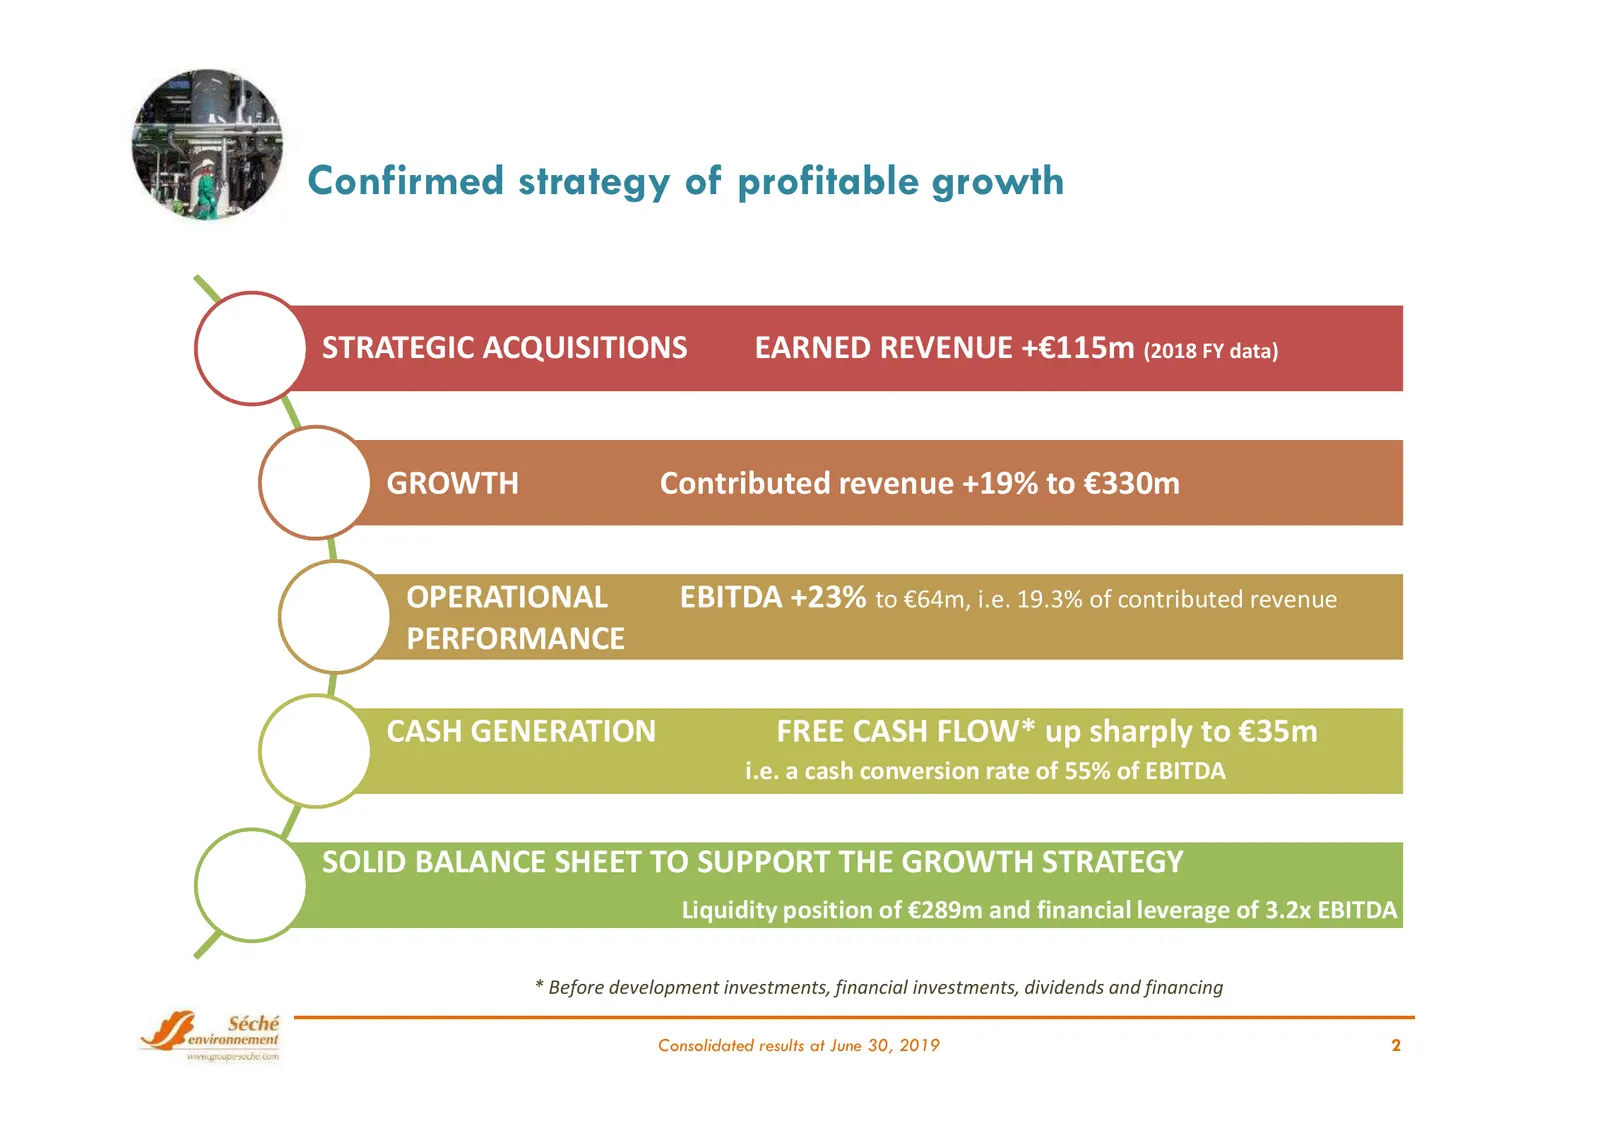
Confirmed strategy of profitable growth STRATEGIC ACQUISITIONS EARNED REVENUE +€115m (2018 FY data) GROWTH Contributed revenue +19% to €330m OPERATIONAL EBITDA +23% to €64m, i.e. 19.3% of contributed revenue PERFORMANCE CASH GENERATION FREE CASH FLOW* up sharply to €35m i.e. a cash conversion rate o
Slide 3: Structural international acquisitions
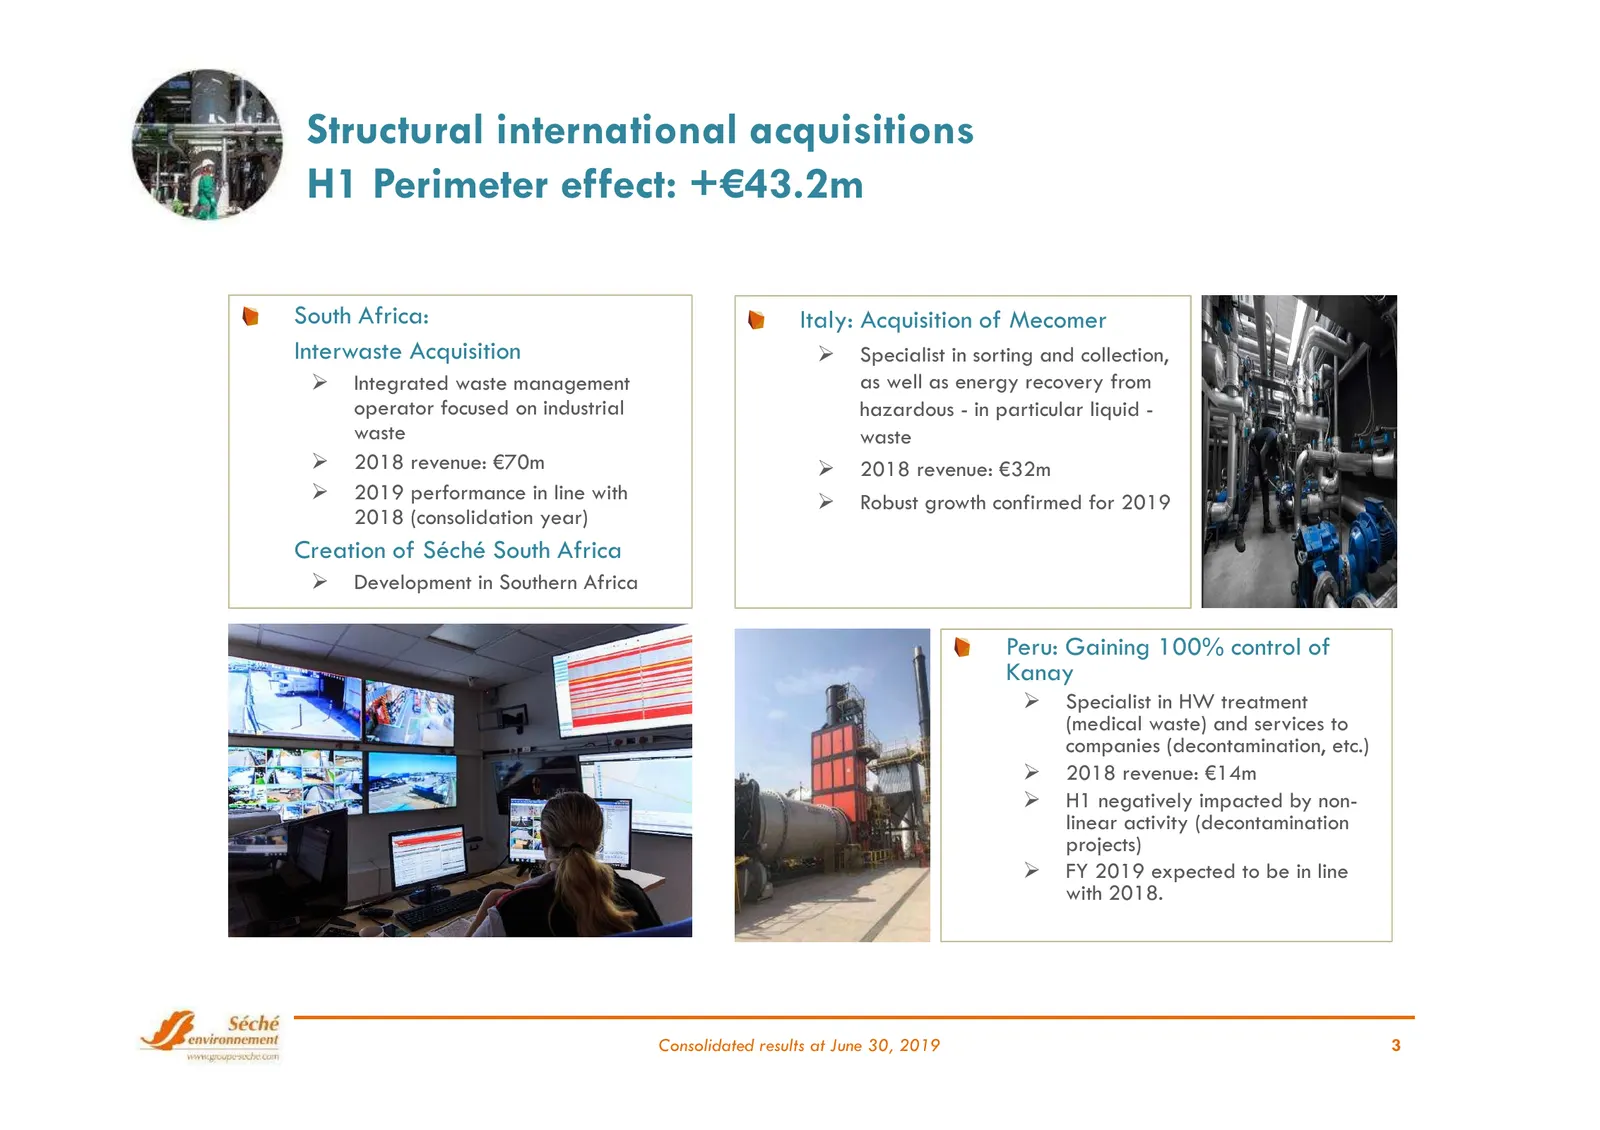
Structural international acquisitions H1 Perimeter effect: +€43.2m South Africa: Italy: Acquisition of Mecomer Interwaste Acquisition Specialist in sorting and collection, Integrated waste management as well as energy recovery from operator focused on industrial hazardous - in particular liquid - wa
Slide 4: Consistent growth on solid markets, increased profitability, cash generated
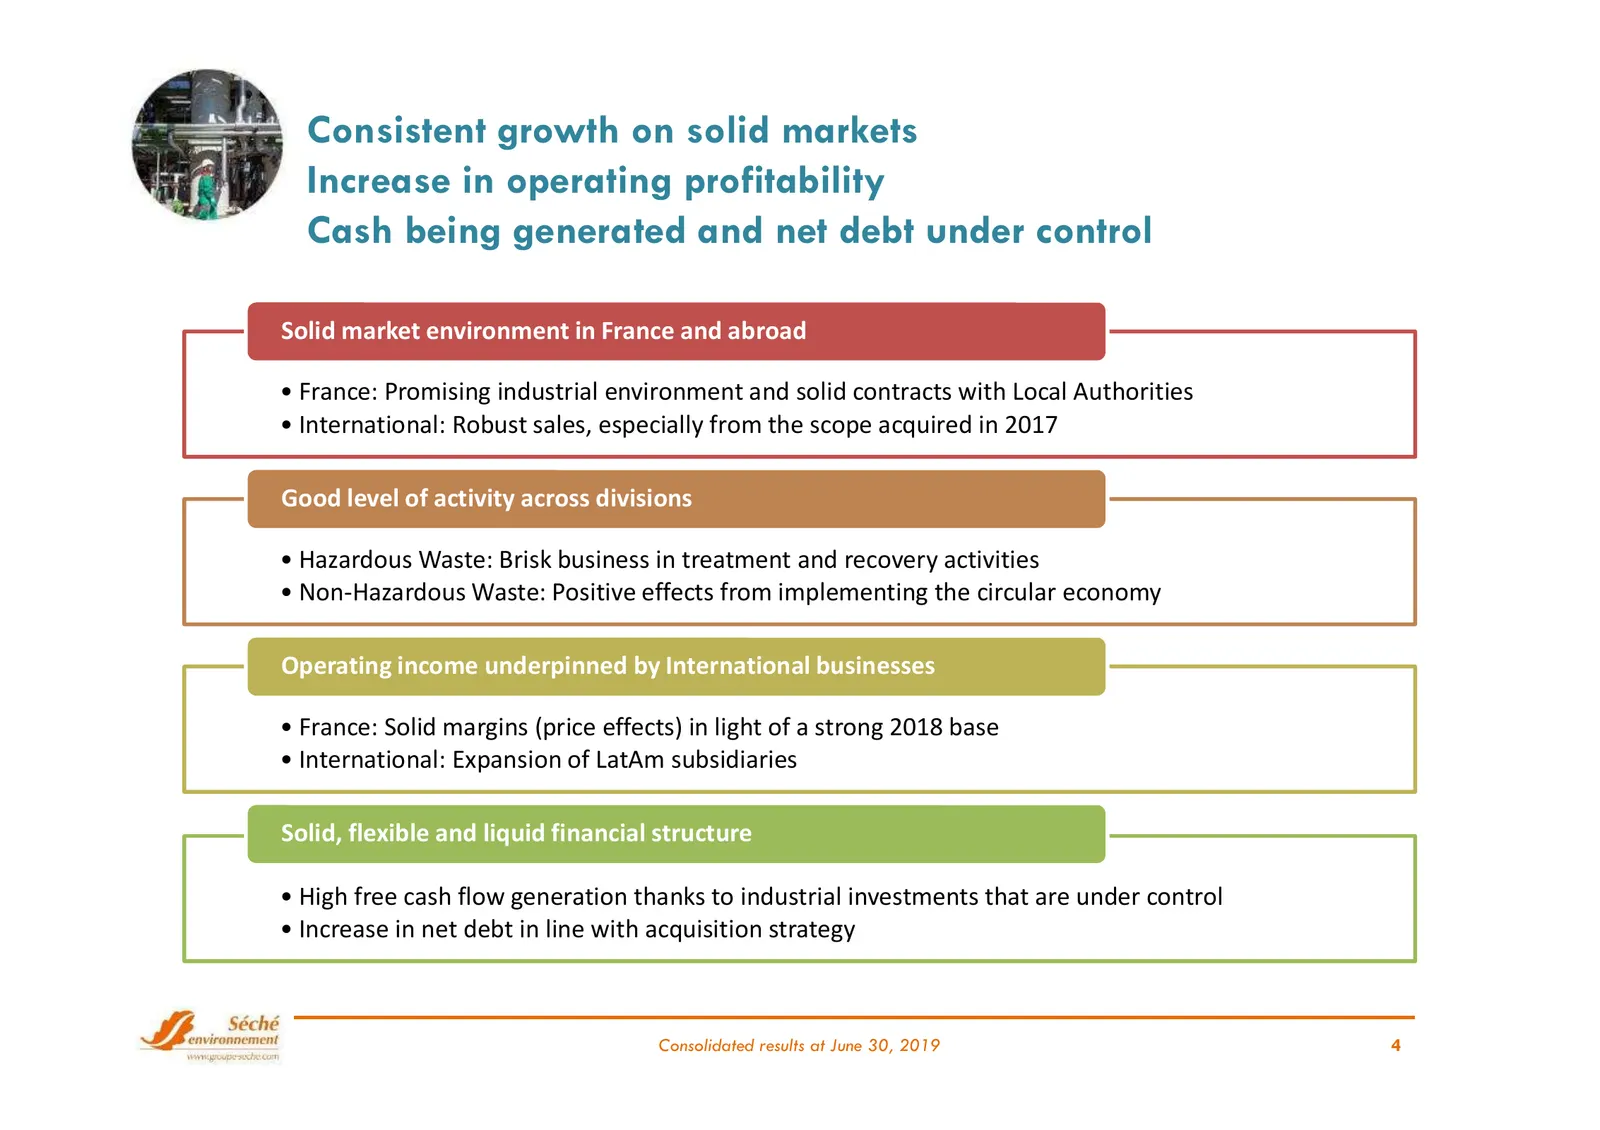
Consistent growth on solid markets Increase in operating profitability Cash being generated and net debt under control Solid market environment in France and abroad • France: Promising industrial environment and solid contracts with Local Authorities • International: Robust sales, especially from th
Slide 5: Medium-term growth and profitability outlook consolidated
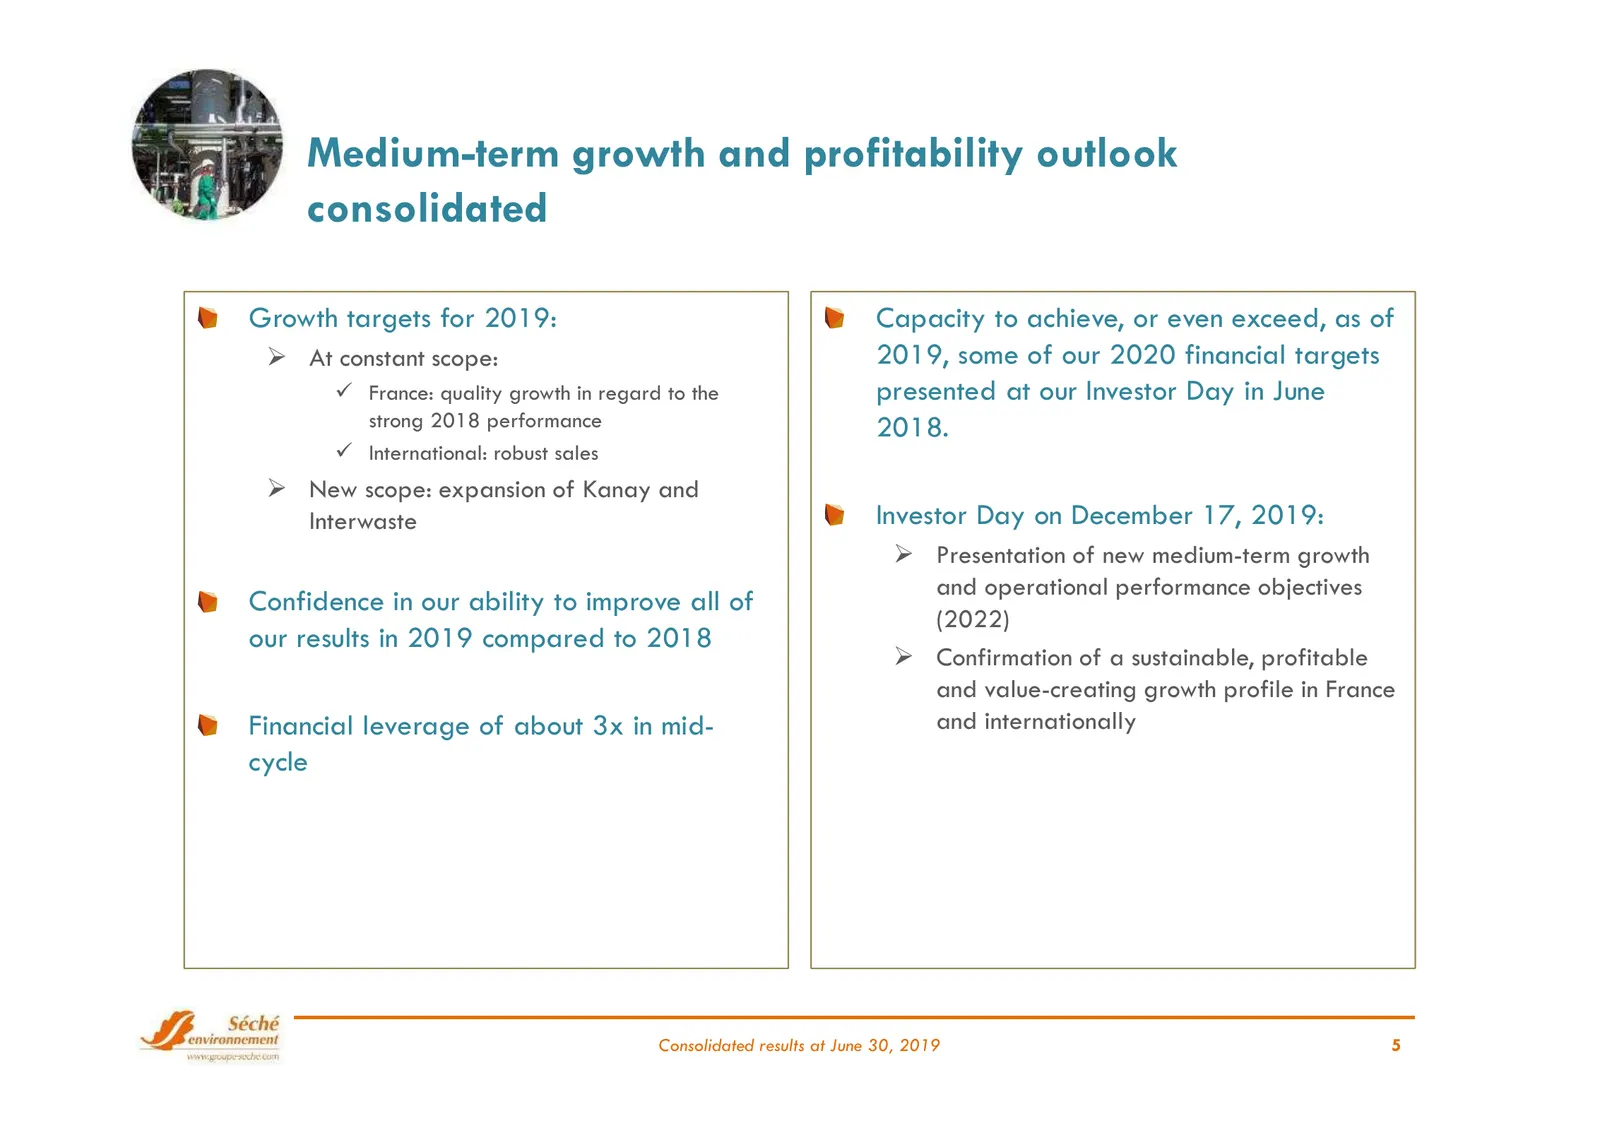
Medium-term growth and profitability outlook consolidated Growth targets for 2019: Capacity to achieve, or even exceed, as of At constant scope: 2019, some of our 2020 financial targets France: quality growth in regard to the presented at our Investor Day in June strong 2018 performance 2018. Intern
Slide 6: Results and financial situation as at June 30, 2019
Baptiste Janiaud Administrative and Financial Manager RESULTS AND FINANCIAL SITUATION AS AT JUNE 30, 2019 Consolidated results at June 30, 2019 6
Slide 7: Key figures for H1 2019
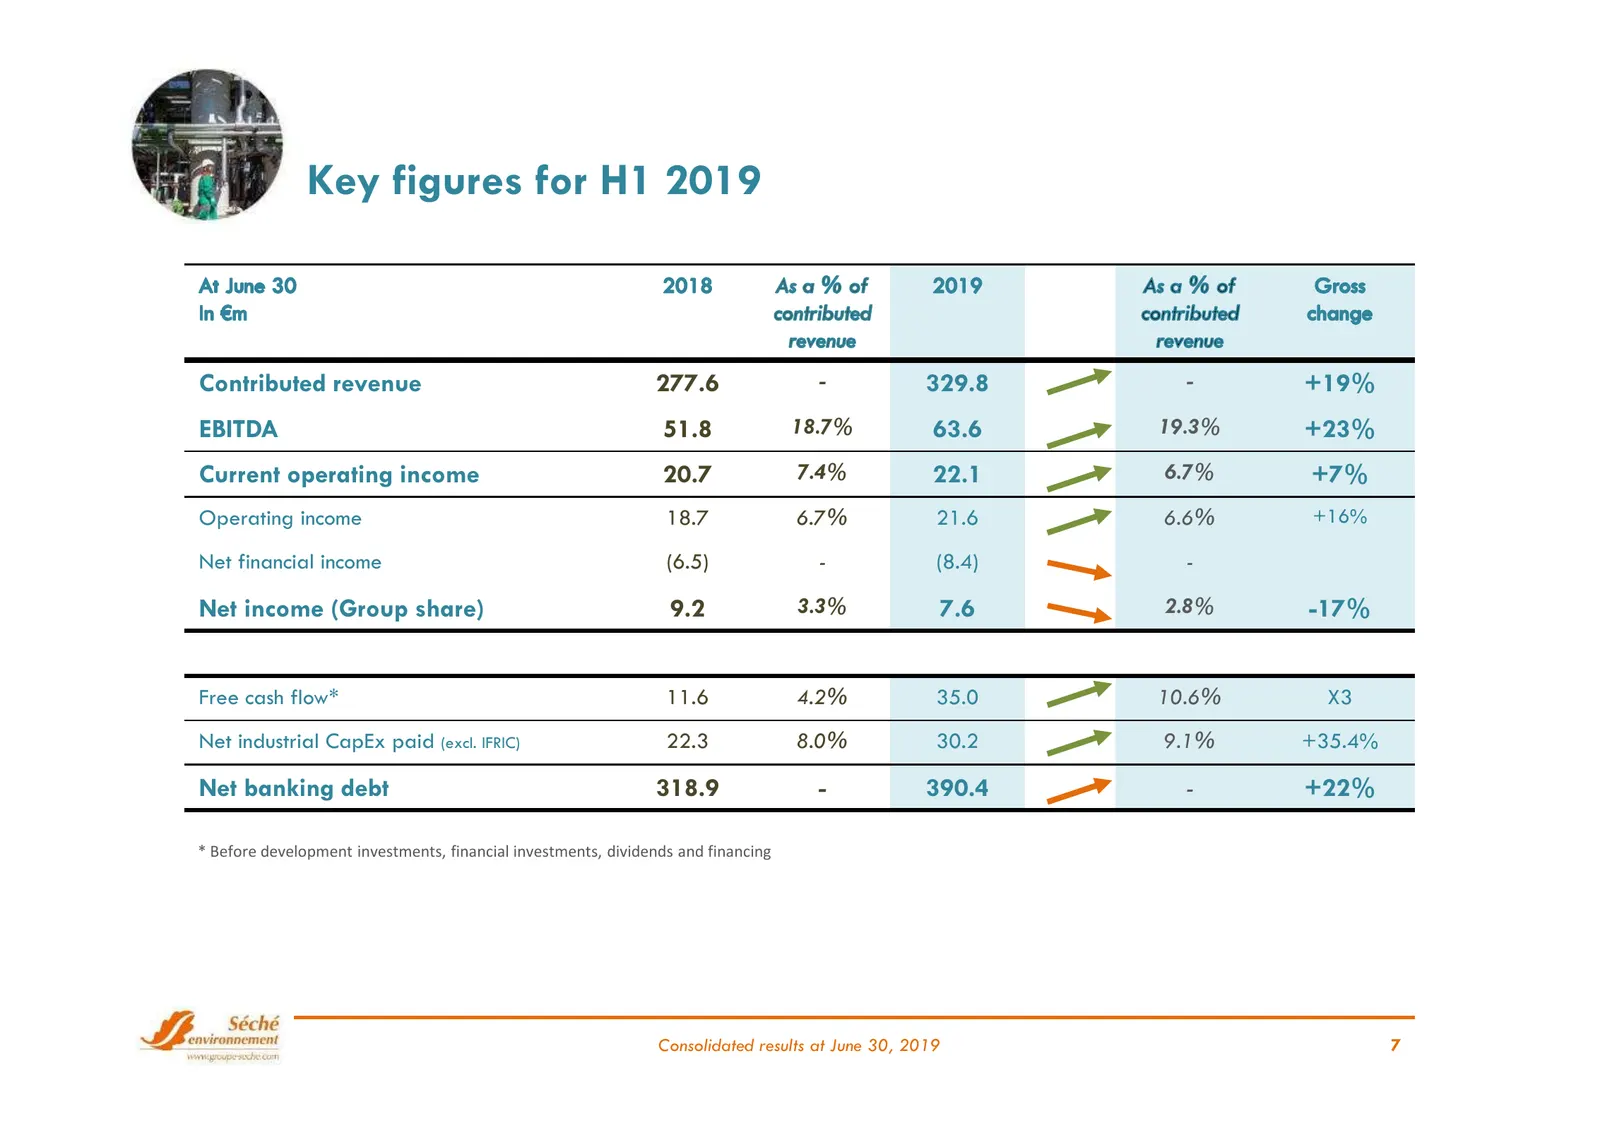
Key figures for H1 2019 Contributed revenue 277.6 - 329.8 - +19% EBITDA 51.8 18.7% 63.6 19.3% +23% Current operating income 20.7 7.4% 22.1 6.7% +7% Operating income 18.7 6.7% 21.6 6.6% +16% Net financial income (6.5) - (8.4) - Net income (Group share) 9.2 3.3% 7.6 2.8% -17% Free cash flow* 11.6 4.2%
Slide 8: Sharp growth in contributed revenue +19%
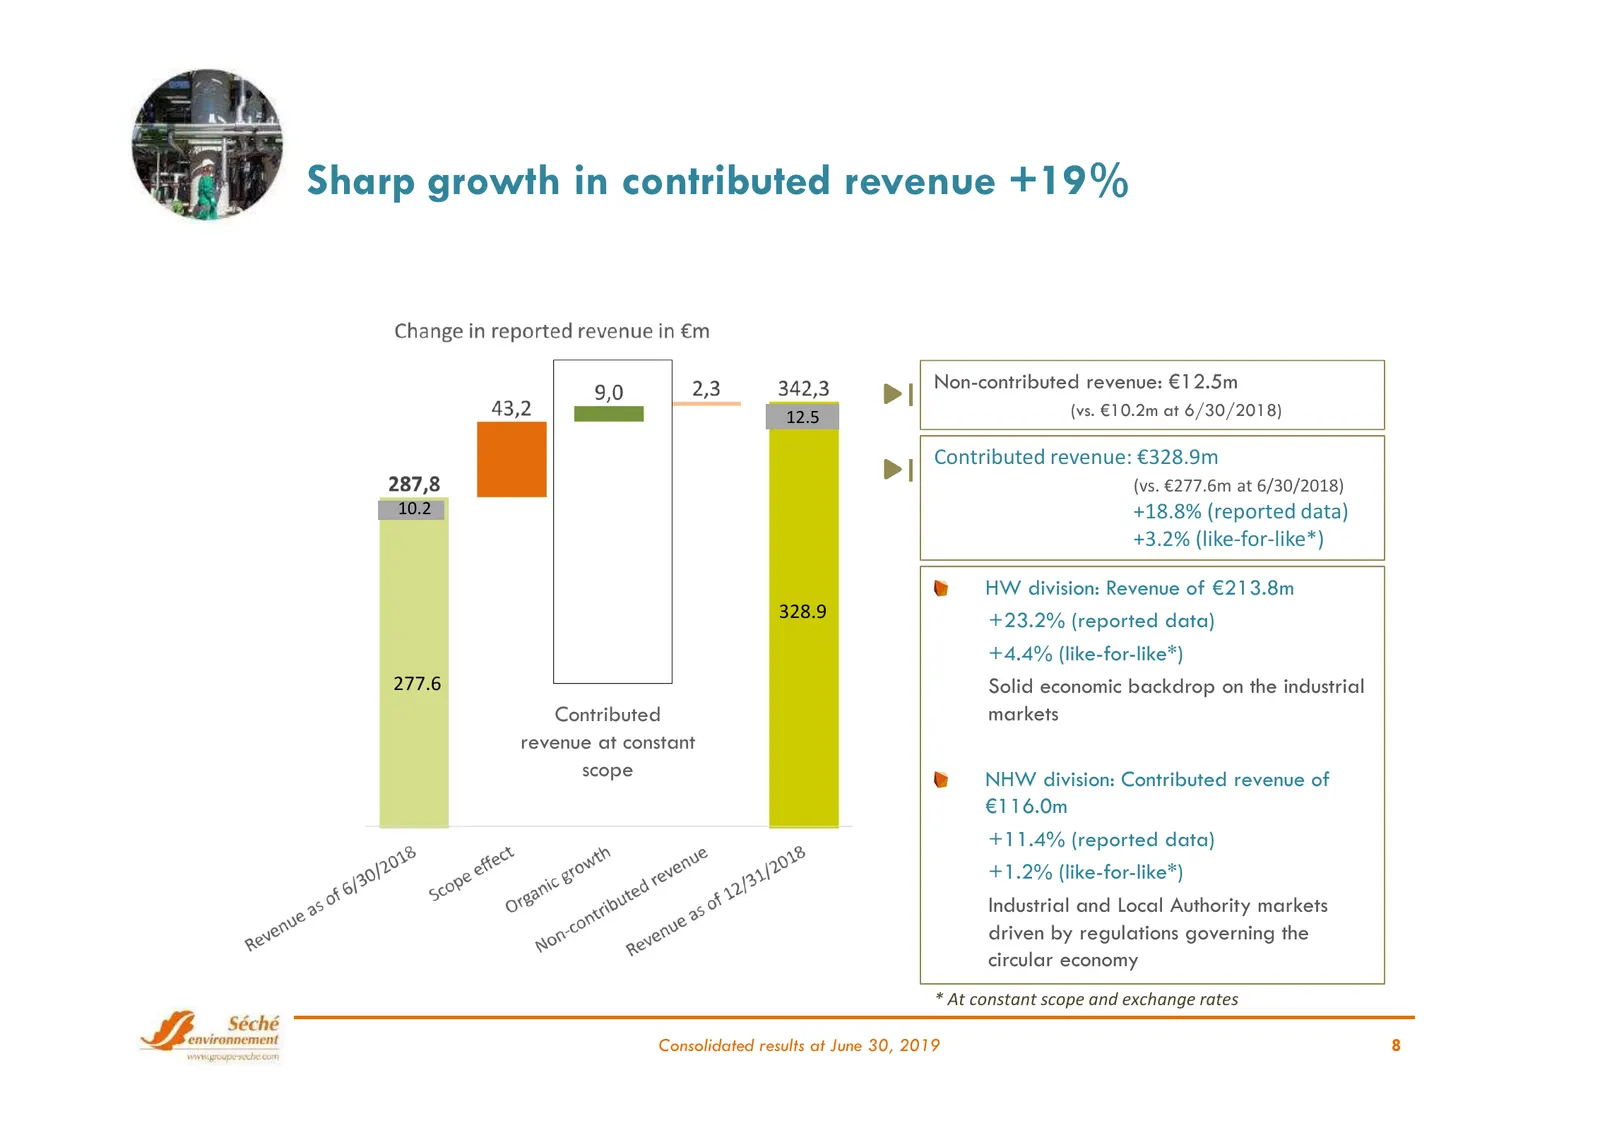
Sharp growth in contributed revenue +19% Non-contributed revenue: €12.5m 12.5 (vs. €10.2m at 6/30/2018) Contributed revenue: €328.9m (vs. €277.6m at 6/30/2018) 10.2 +18.8% (reported data) +3.2% (like-for-like*) HW division: Revenue of €213.8m 328.9 +23.2% (reported data) +4.4% (like-for-like*) 277.6
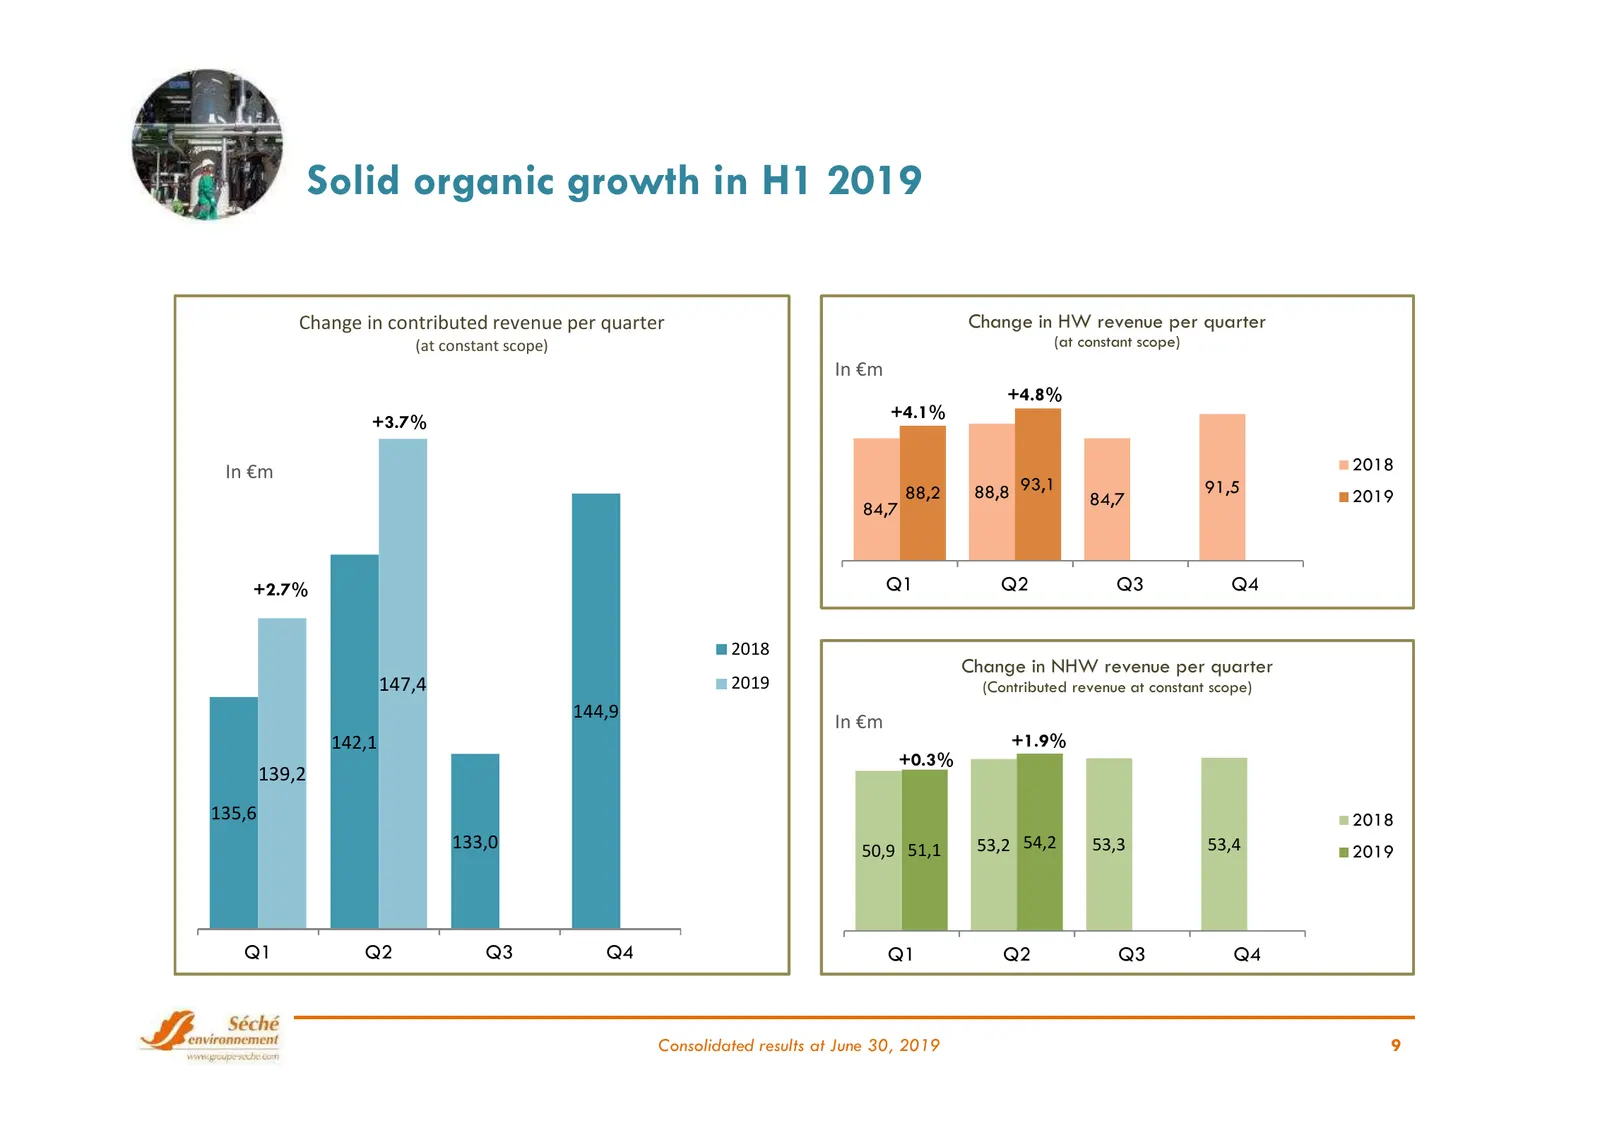
Slide 9: Solid organic growth in H1 2019
Solid organic growth in H1 2019 Change in contributed revenue per quarter Change in HW revenue per quarter (at constant scope) (at constant scope) In €m +4.8% +4.1% +3.7% In €m 2018 88,2 88,8 93,1 84,7 91,5 2019 84,7 +2.7% Q1 Q2 Q3 Q4 2018 Change in NHW revenue per quarter 147,4 2019 (Contributed re
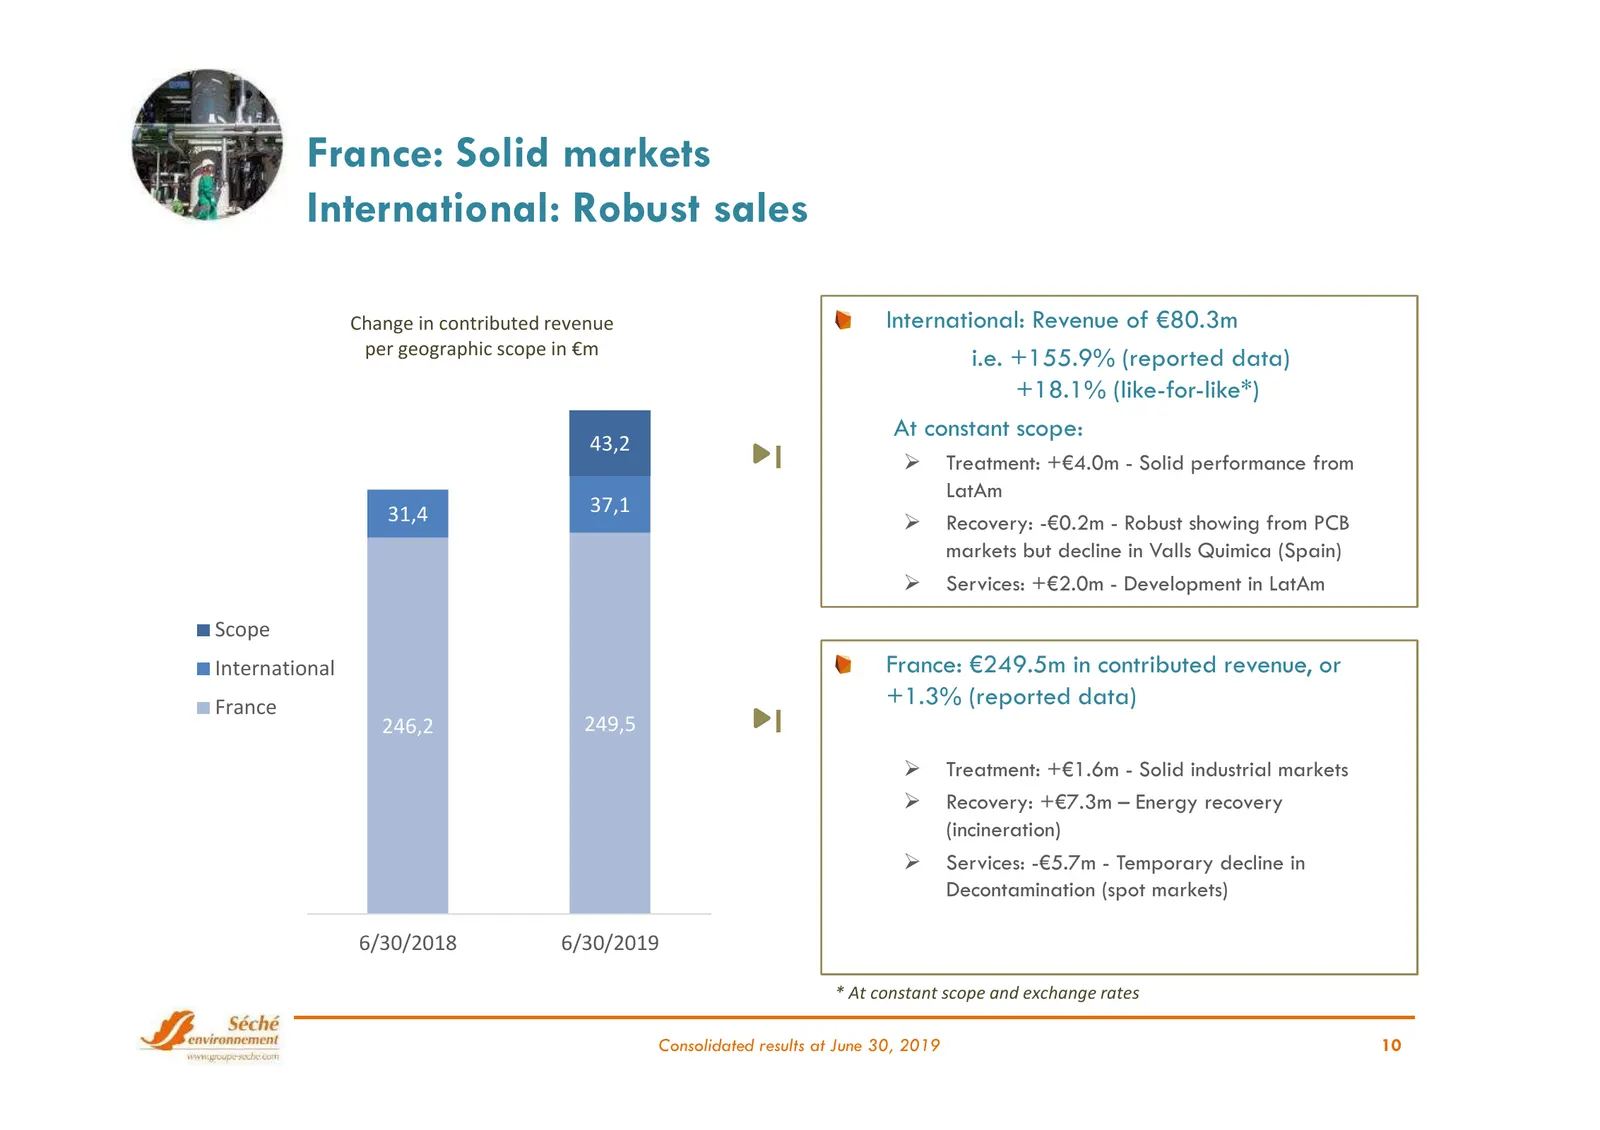
Slide 10: France: Solid markets, International: Robust sales
France: Solid markets International: Robust sales Change in contributed revenue International: Revenue of €80.3m per geographic scope in €m i.e. +155.9% (reported data) +18.1% (like-for-like*) At constant scope: 43,2 Treatment: +€4.0m - Solid performance from LatAm 31,4 37,1 Recovery: -€0.2m - Robus
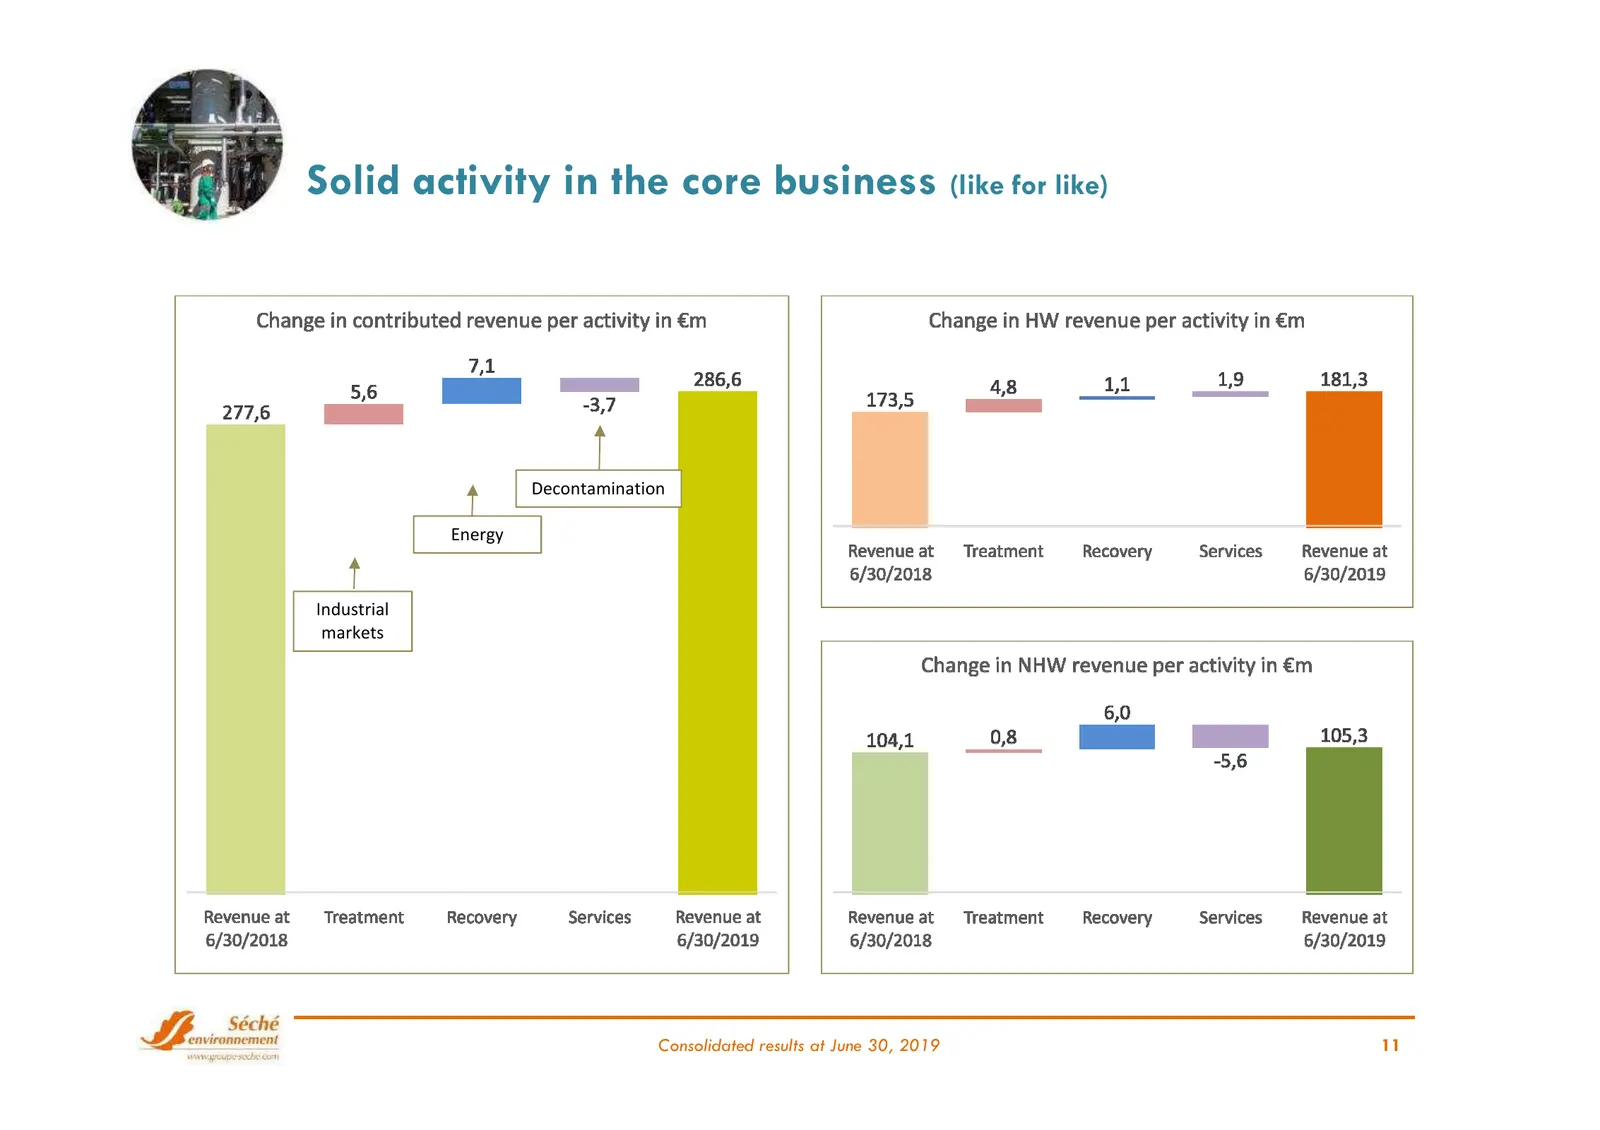
Slide 11: Solid activity in the core business (like for like)
Solid activity in the core business (like for like) Decontamination Energy Industrial markets Consolidated results at June 30, 2019 11
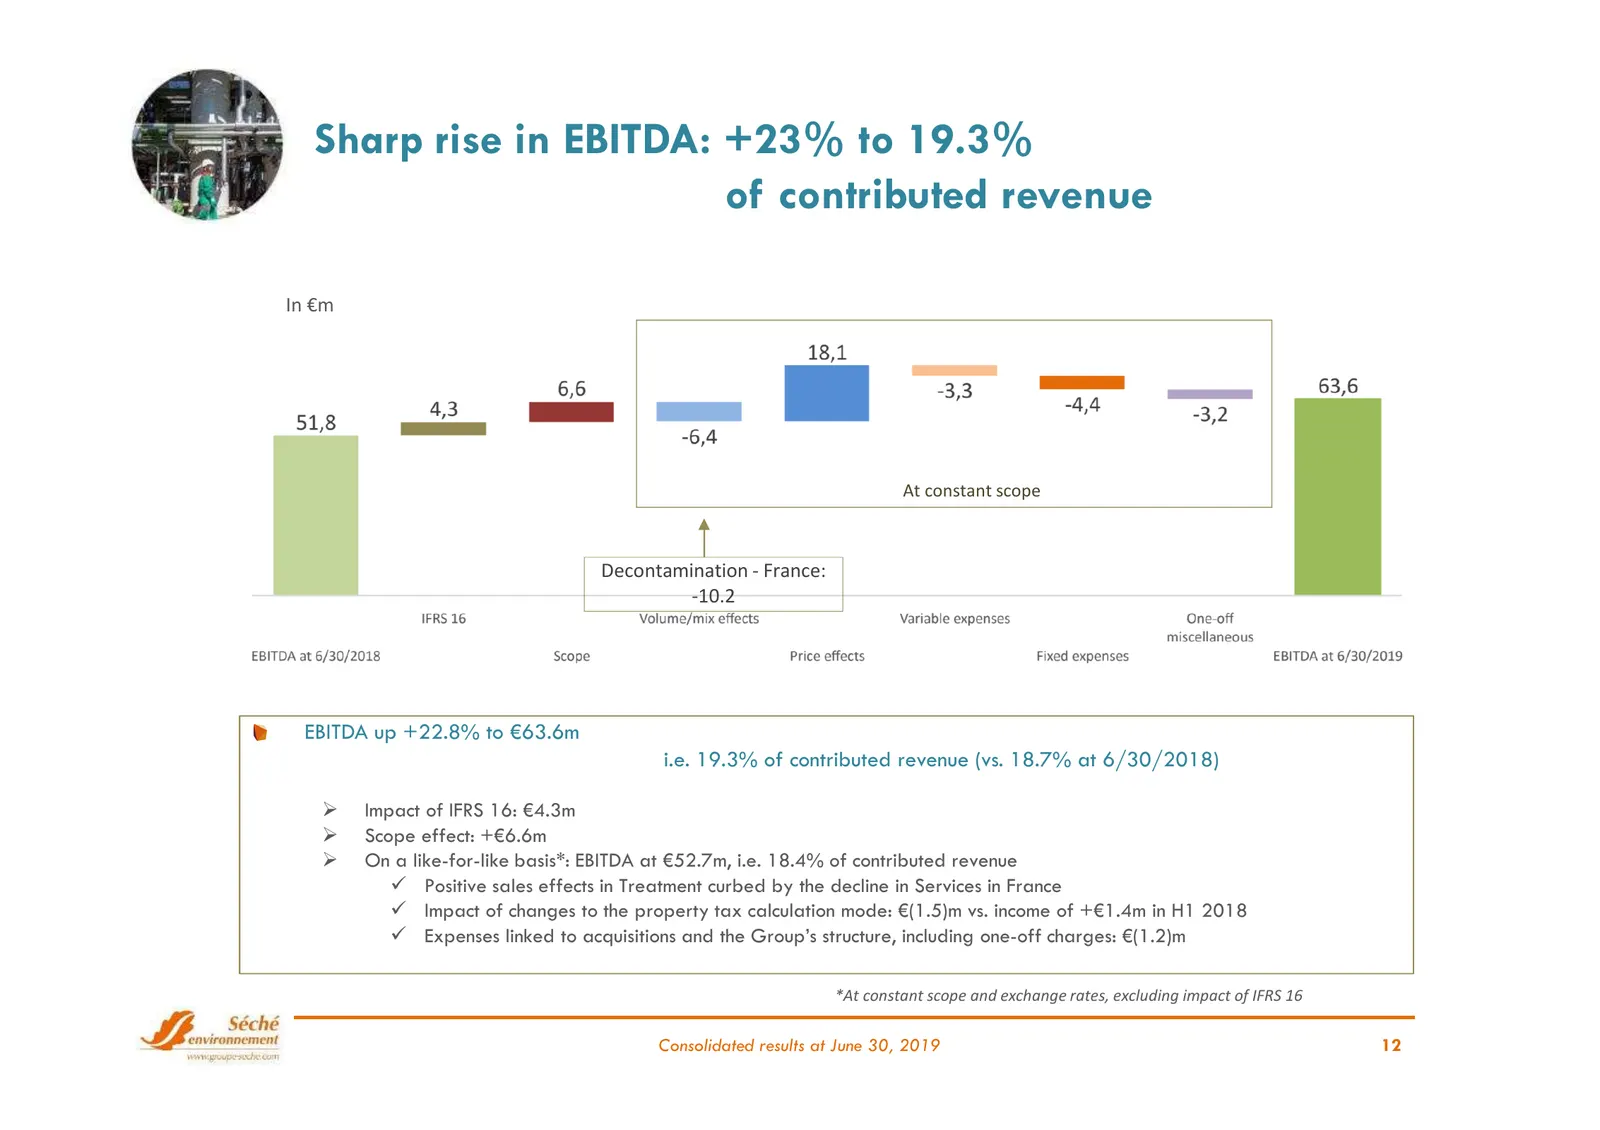
Slide 12: Sharp rise in EBITDA: +23% to 19.3% of contributed revenue
Sharp rise in EBITDA: +23% to 19.3% of contributed revenue In €m At constant scope Decontamination - France: -10.2 EBITDA up +22.8% to €63.6m i.e. 19.3% of contributed revenue (vs. 18.7% at 6/30/2018) Impact of IFRS 16: €4.3m Scope effect: +€6.6m On a like-for-like basis*: EBITDA at €52.7m, i.e. 18.
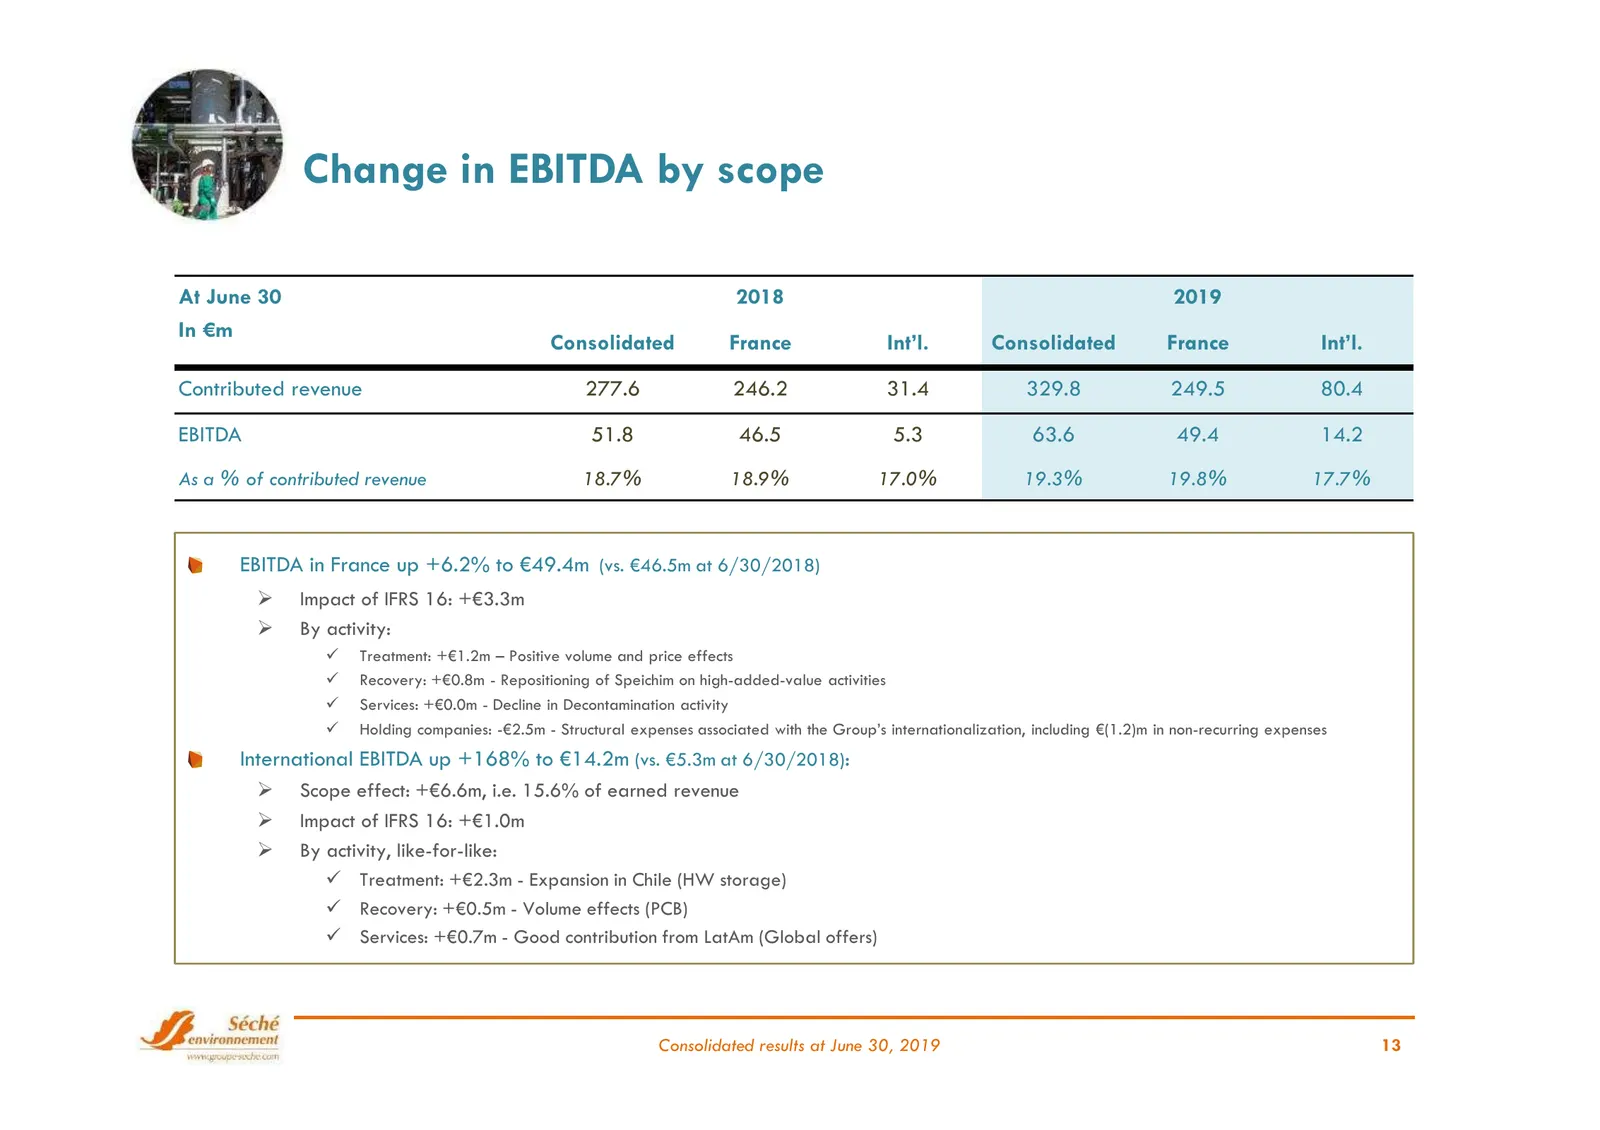
Slide 13: Change in EBITDA by scope
Change in EBITDA by scope At June 30 2018 2019 In €m Consolidated France Int’l. Consolidated France Int’l. Contributed revenue 277.6 246.2 31.4 329.8 249.5 80.4 EBITDA 51.8 46.5 5.3 63.6 49.4 14.2 As a % of contributed revenue 18.7% 18.9% 17.0% 19.3% 19.8% 17.7% EBITDA in France up +6.2% to €49.4m (
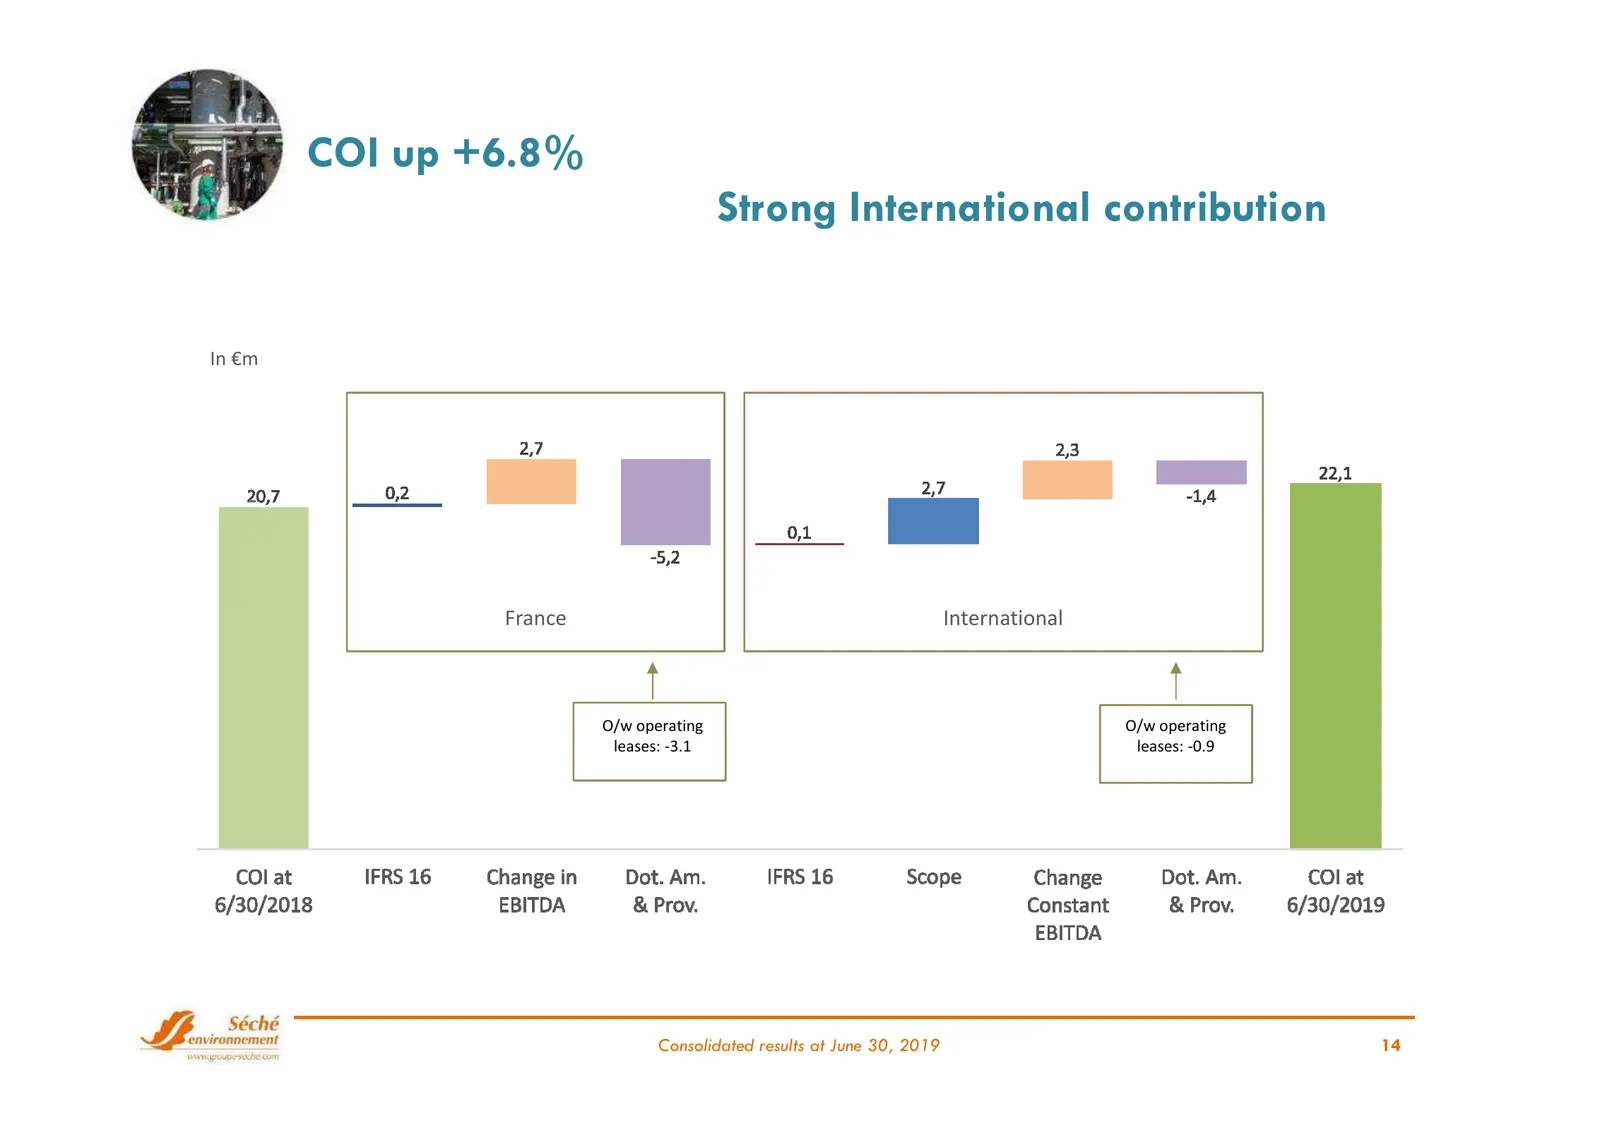
Slide 14: COI up +6.8%, strong International contribution
COI up +6.8% Strong International contribution In €m France International O/w operating O/w operating leases: -3.1 leases: -0.9 Consolidated results at June 30, 2019 14
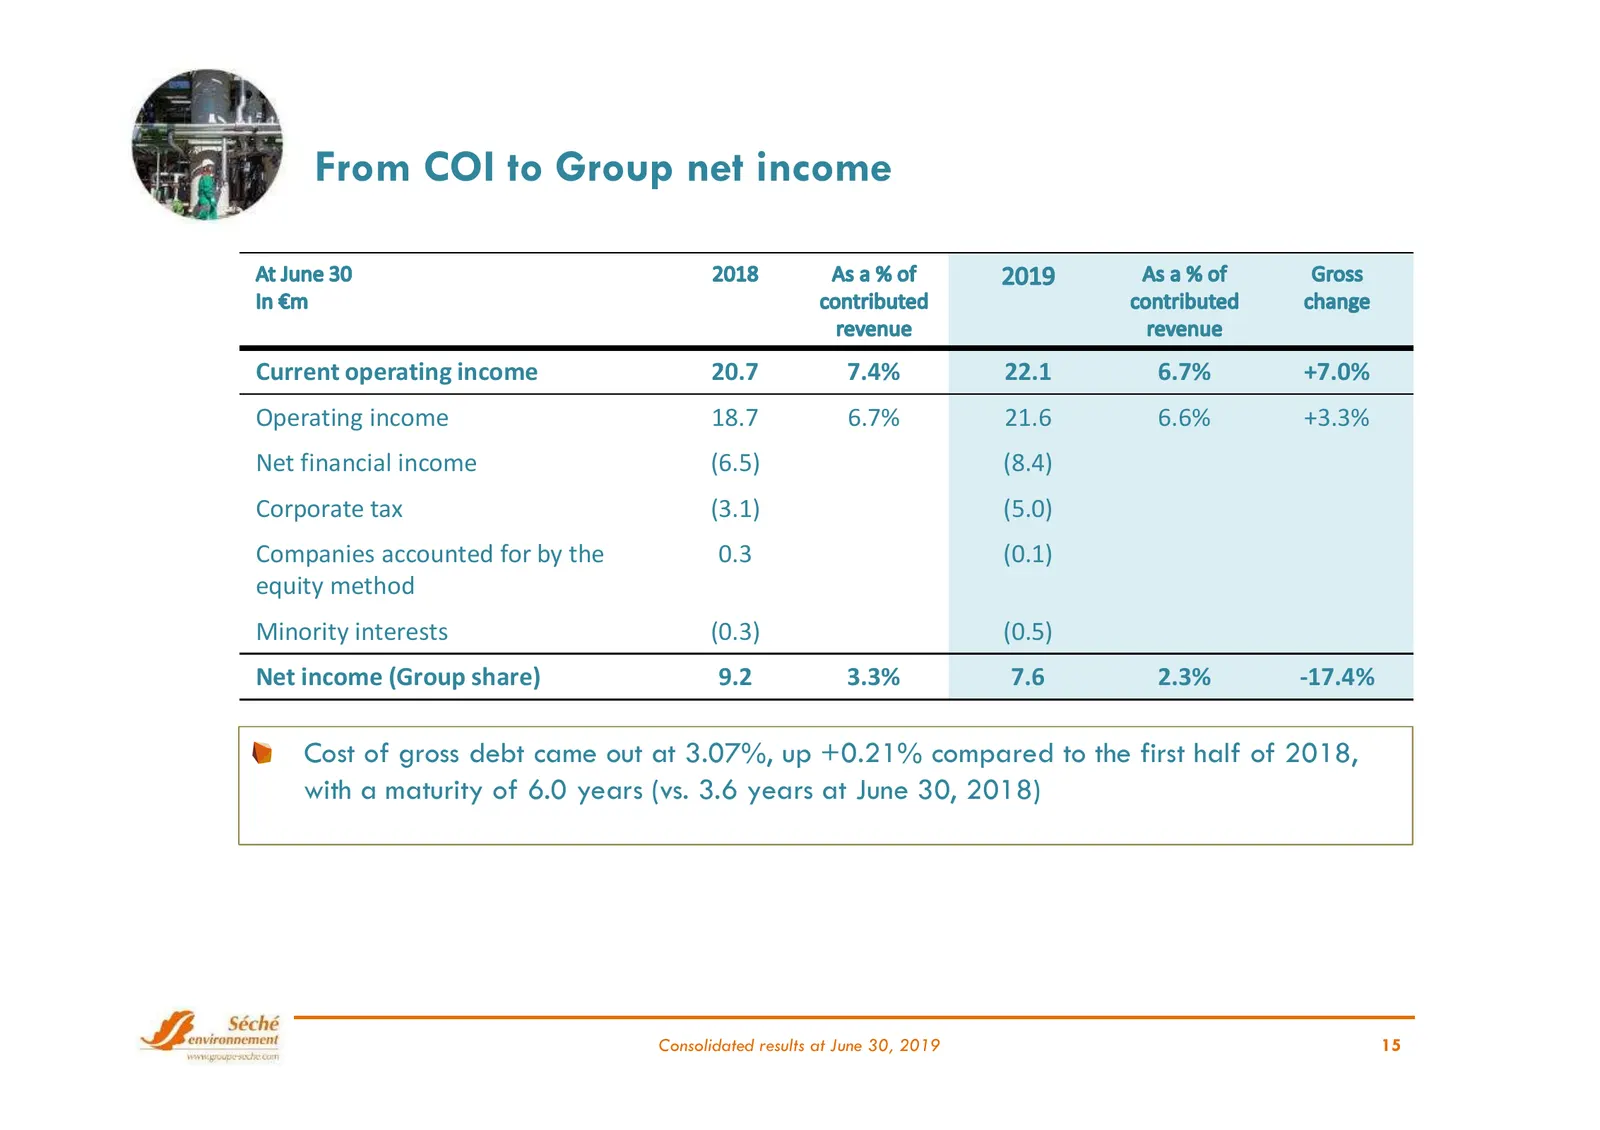
Slide 15: From COI to Group net income
From COI to Group net income Current operating income 20.7 7.4% 22.1 6.7% +7.0% Operating income 18.7 6.7% 21.6 6.6% +3.3% Net financial income (6.5) (8.4) Corporate tax (3.1) (5.0) Companies accounted for by the 0.3 (0.1) equity method Minority interests (0.3) (0.5) Net income (Group share) 9.2 3.3
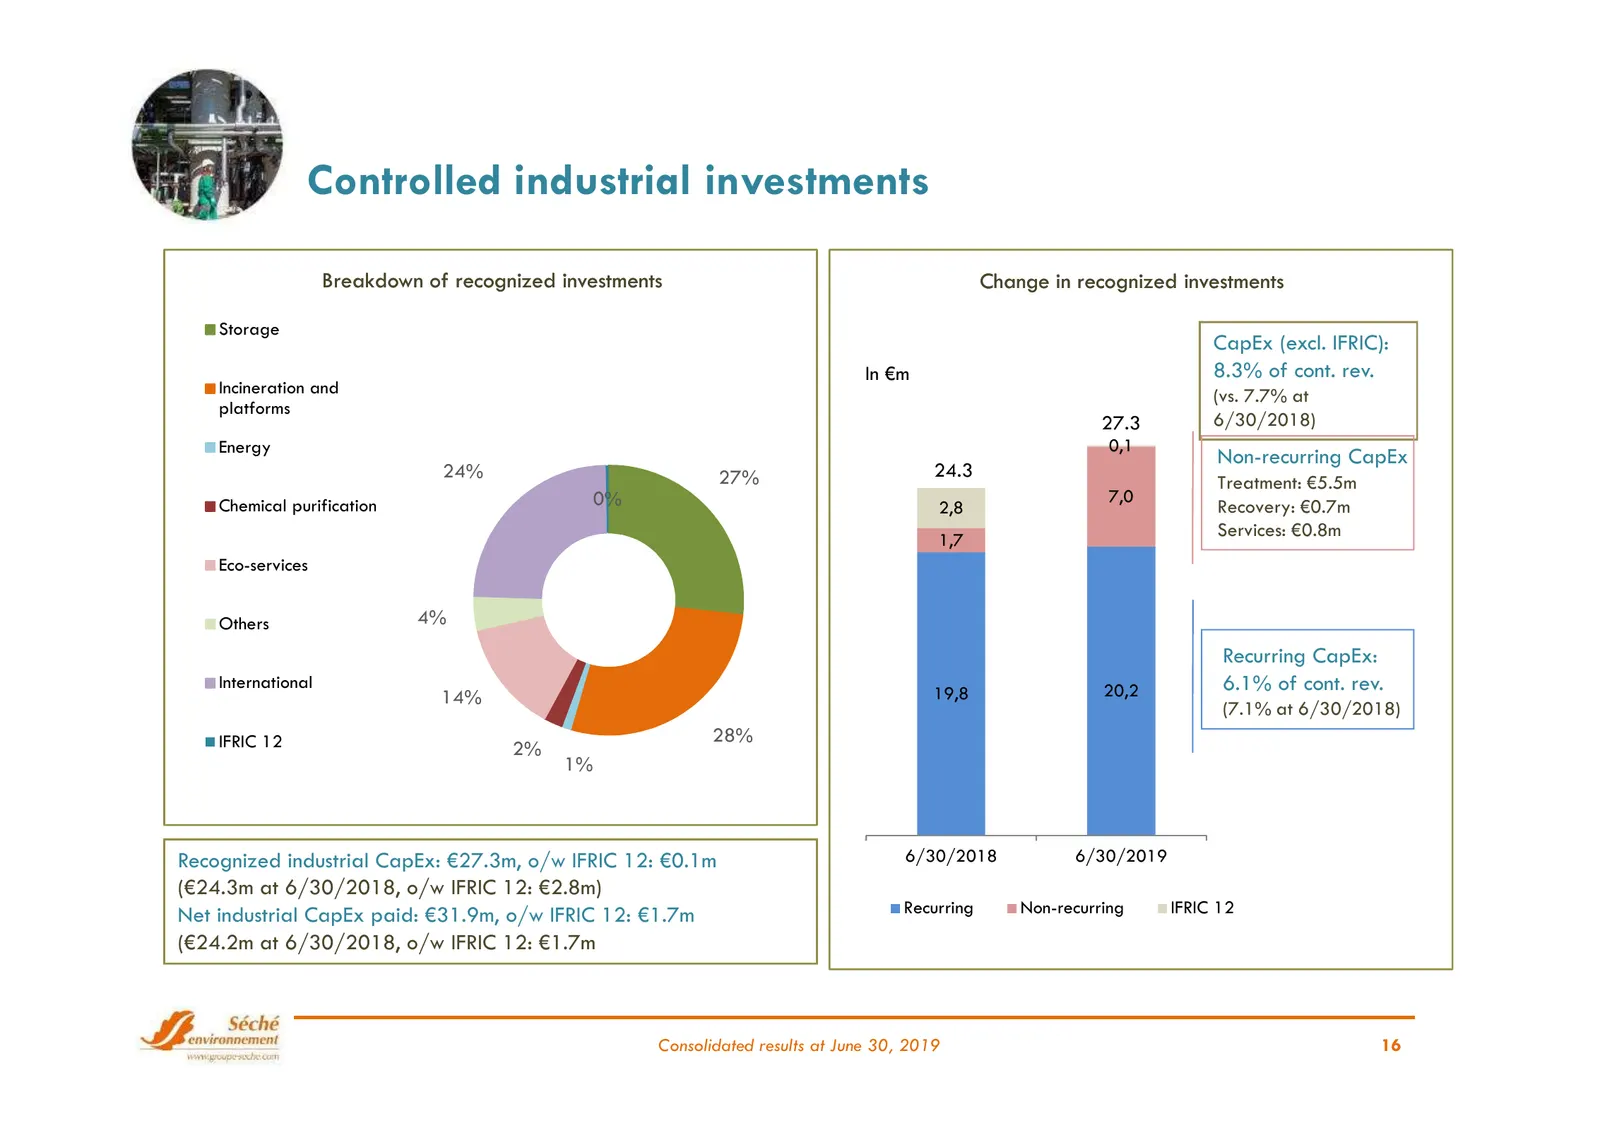
Slide 16: Controlled industrial investments
Controlled industrial investments Breakdown of recognized investments Change in recognized investments Storage CapEx (excl. IFRIC): In €m 8.3% of cont. rev. Incineration and (vs. 7.7% at platforms 27.3 6/30/2018) Energy 0,1 Non-recurring CapEx 24% 27% 24.3 Treatment: €5.5m Chemical purification 0% 7
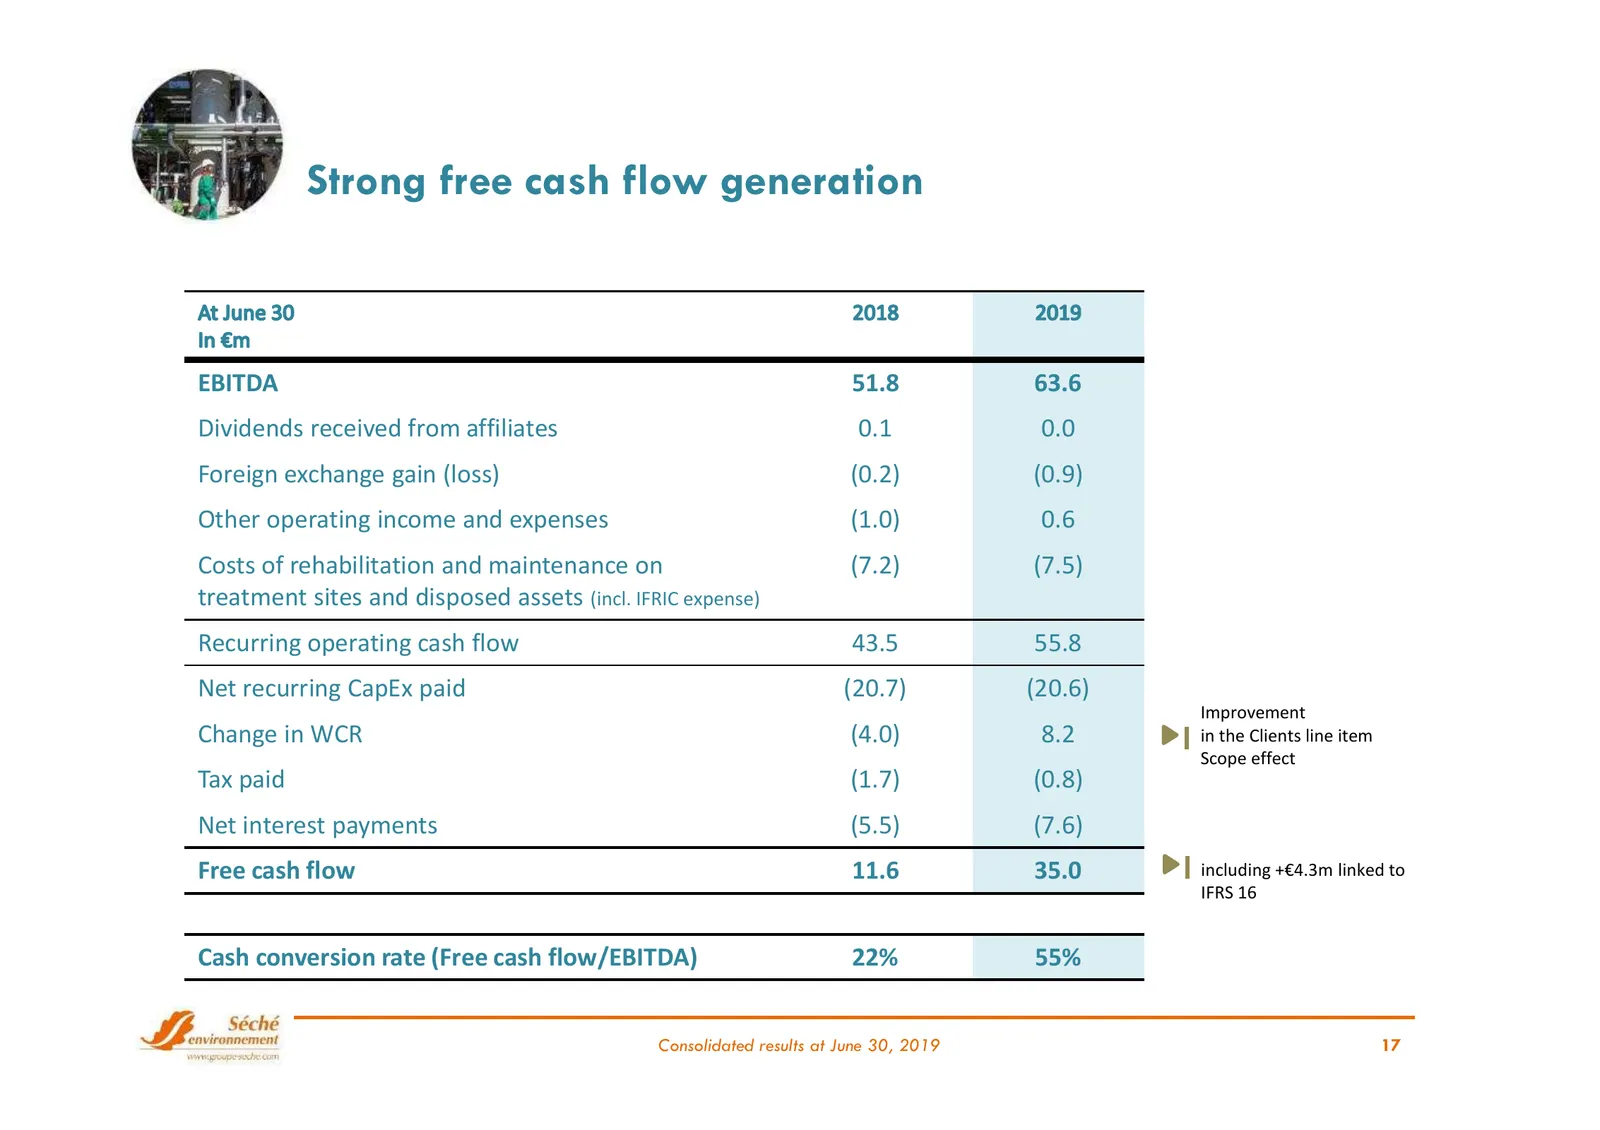
Slide 17: Strong free cash flow generation
Strong free cash flow generation EBITDA 51.8 63.6 Dividends received from affiliates 0.1 0.0 Foreign exchange gain (loss) (0.2) (0.9) Other operating income and expenses (1.0) 0.6 Costs of rehabilitation and maintenance on (7.2) (7.5) treatment sites and disposed assets (incl. IFRIC expense) Recurri
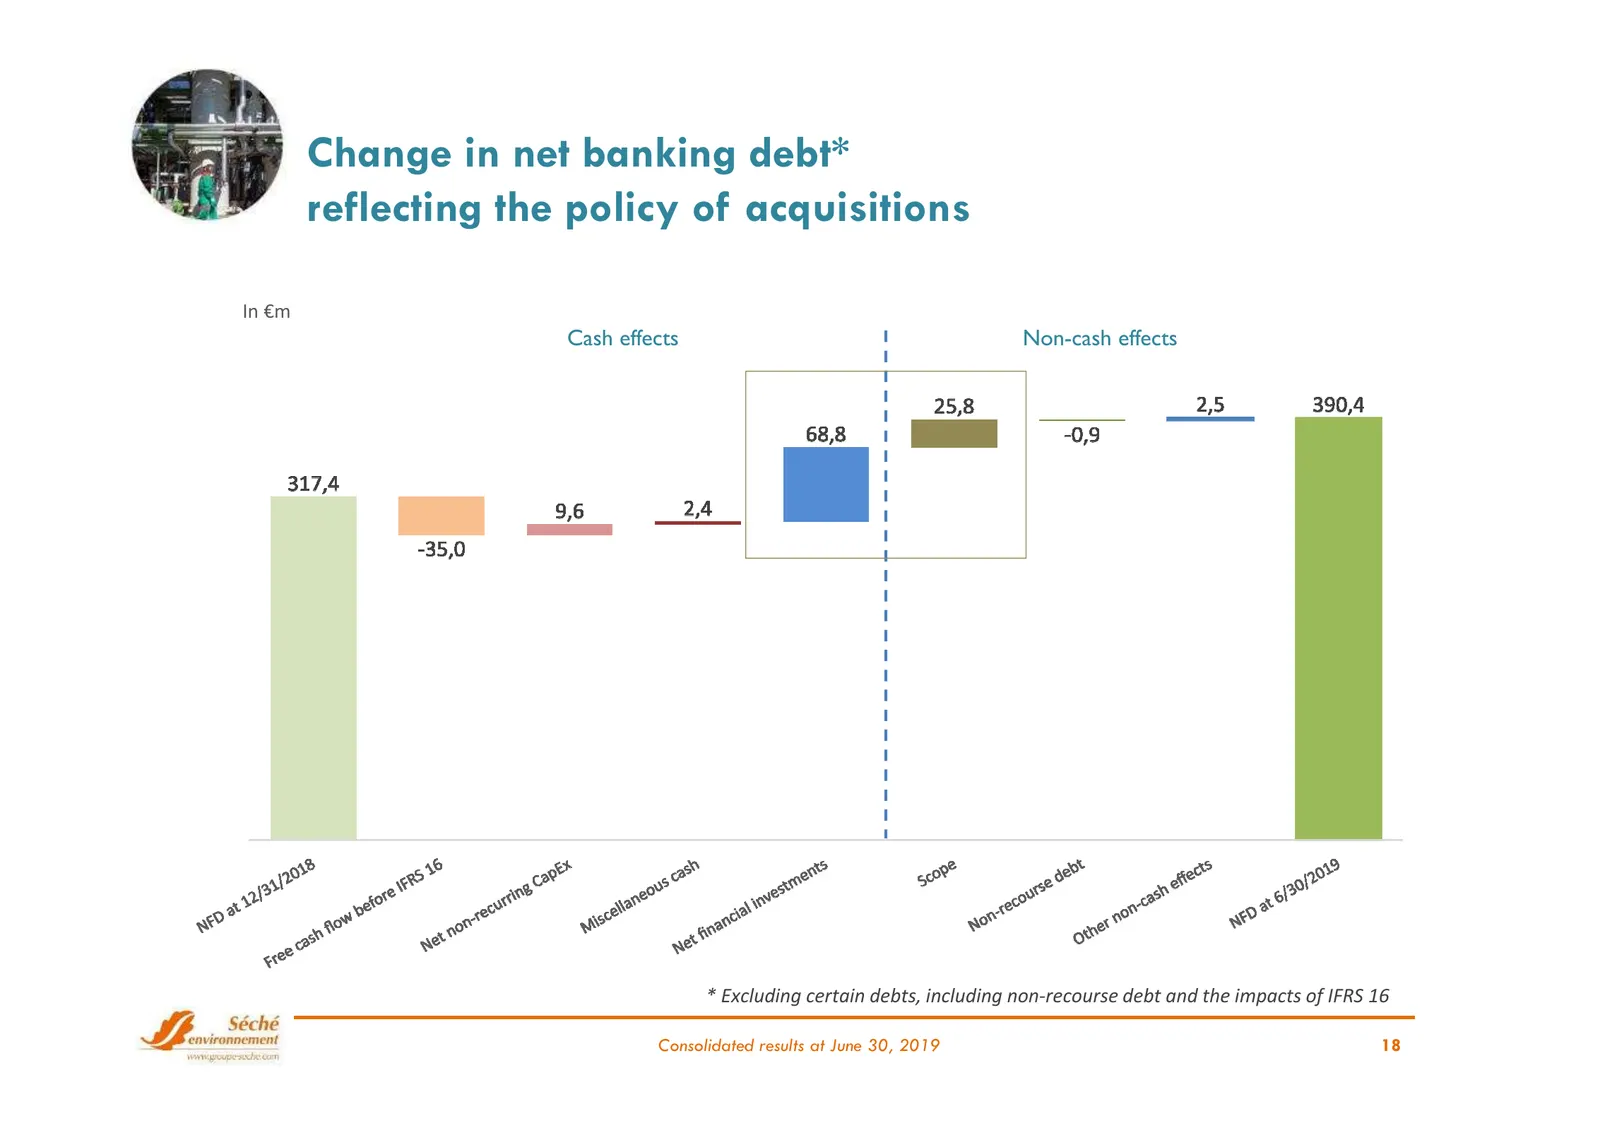
Slide 18: Change in net banking debt reflecting the policy of acquisitions
Change in net banking debt* reflecting the policy of acquisitions In €m Cash effects Non-cash effects * Excluding certain debts, including non-recourse debt and the impacts of IFRS 16 Consolidated results at June 30, 2019 18
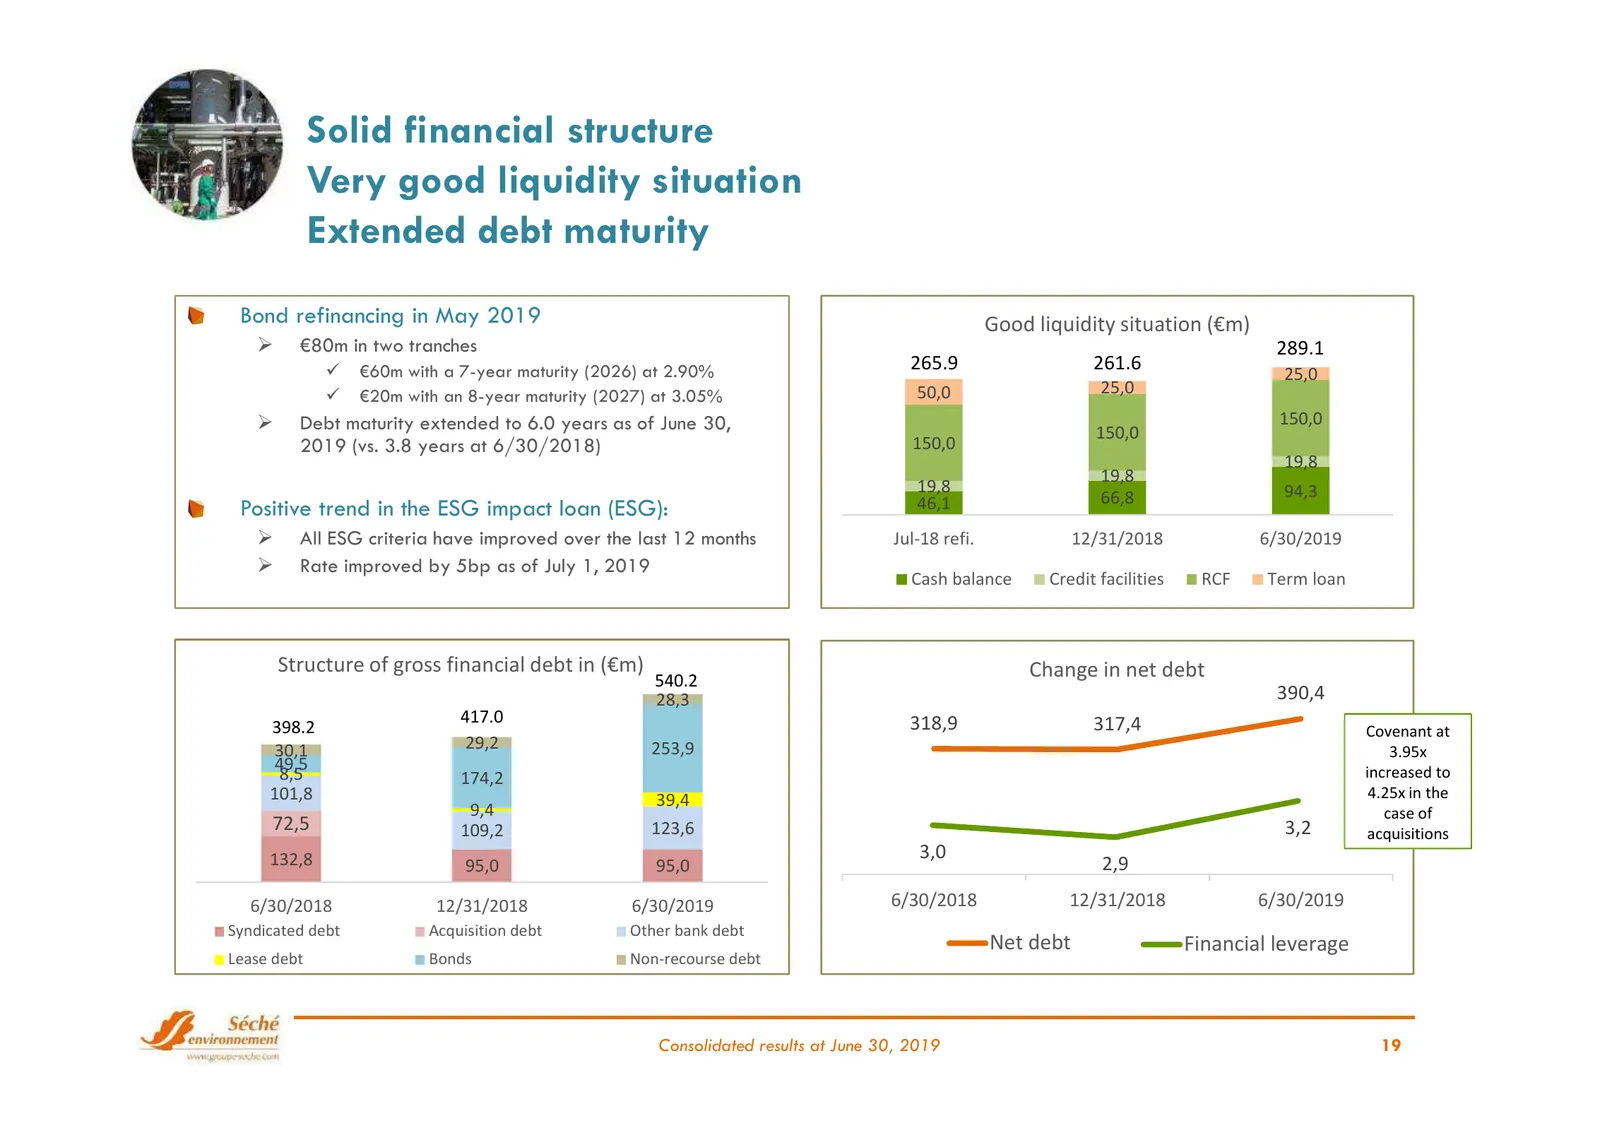
Slide 19: Solid financial structure, very good liquidity, extended debt maturity
Solid financial structure Very good liquidity situation Extended debt maturity Bond refinancing in May 2019 Good liquidity situation (€m) €80m in two tranches 289.1 €60m with a 7-year maturity (2026) at 2.90% 265.9 261.6 25,0 €20m with an 8-year maturity (2027) at 3.05% 50,0 25,0 Debt maturity exten
Slide 20: Outlook
OUTLOOK Consolidated results at June 30, 2019 20
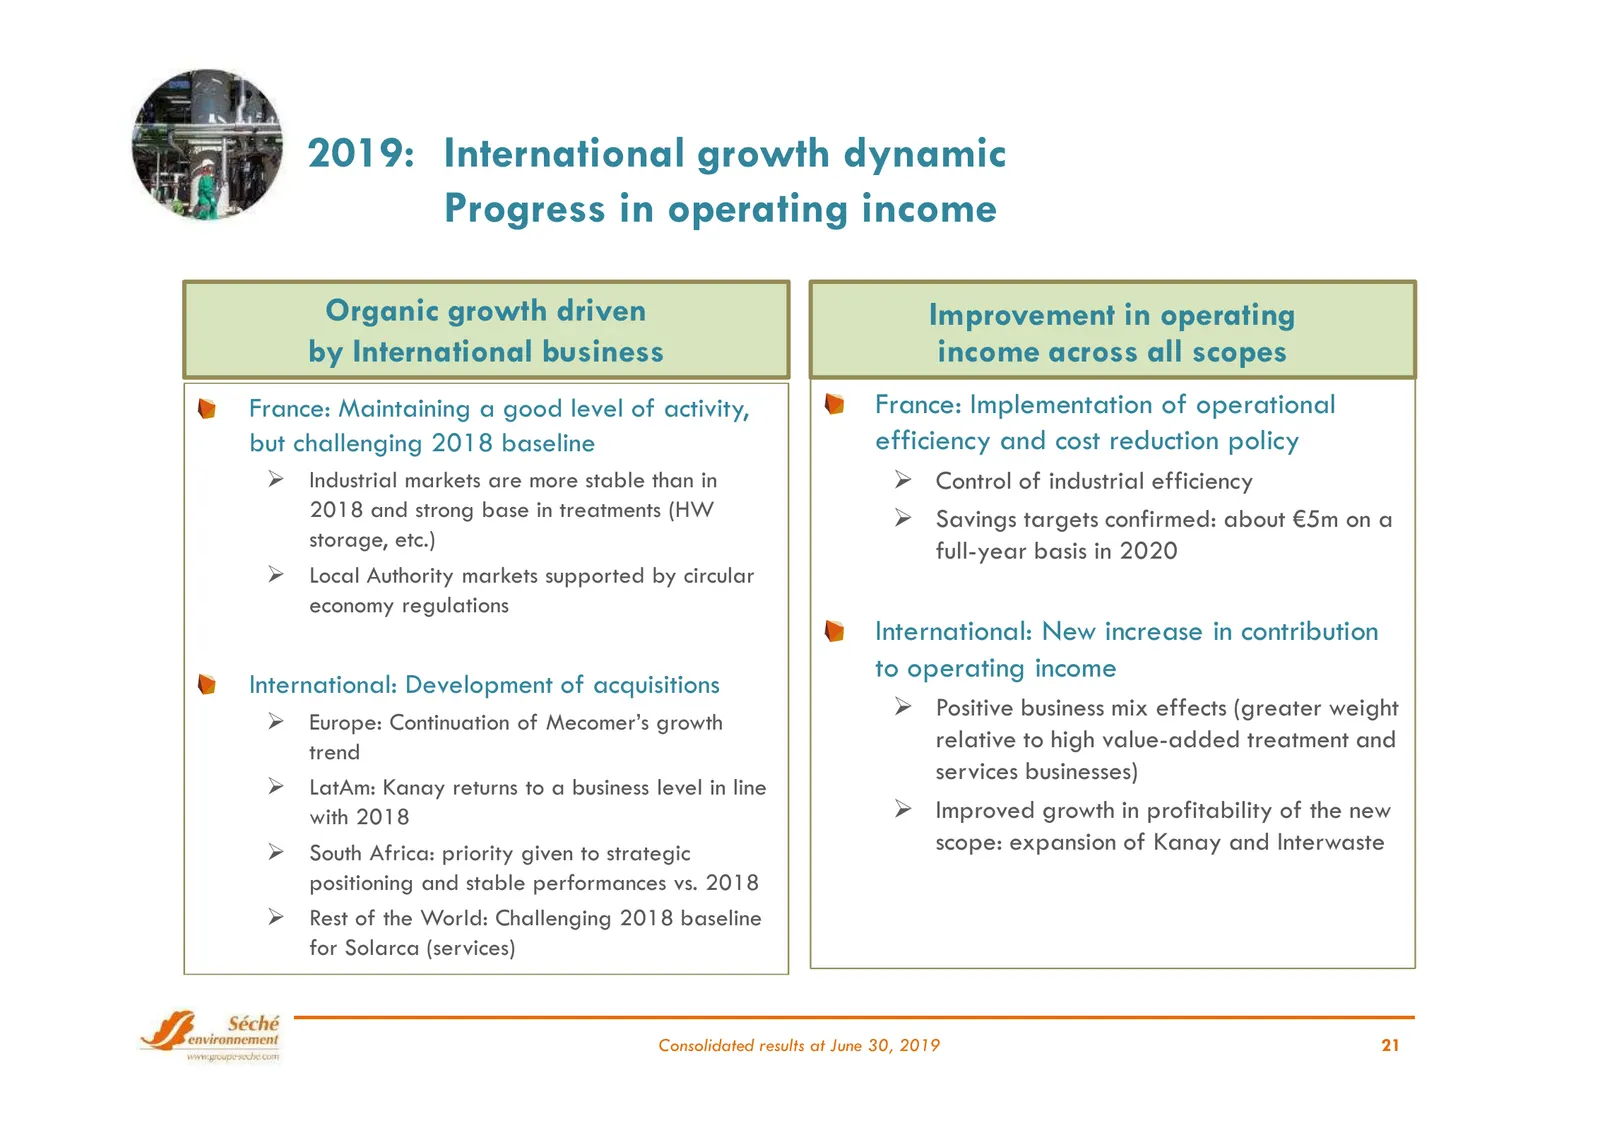
Slide 21: 2019: International growth dynamic, progress in operating income
2019: International growth dynamic Progress in operating income Organic growth driven Improvement in operating by International business income across all scopes France: Maintaining a good level of activity, France: Implementation of operational but challenging 2018 baseline efficiency and cost redu
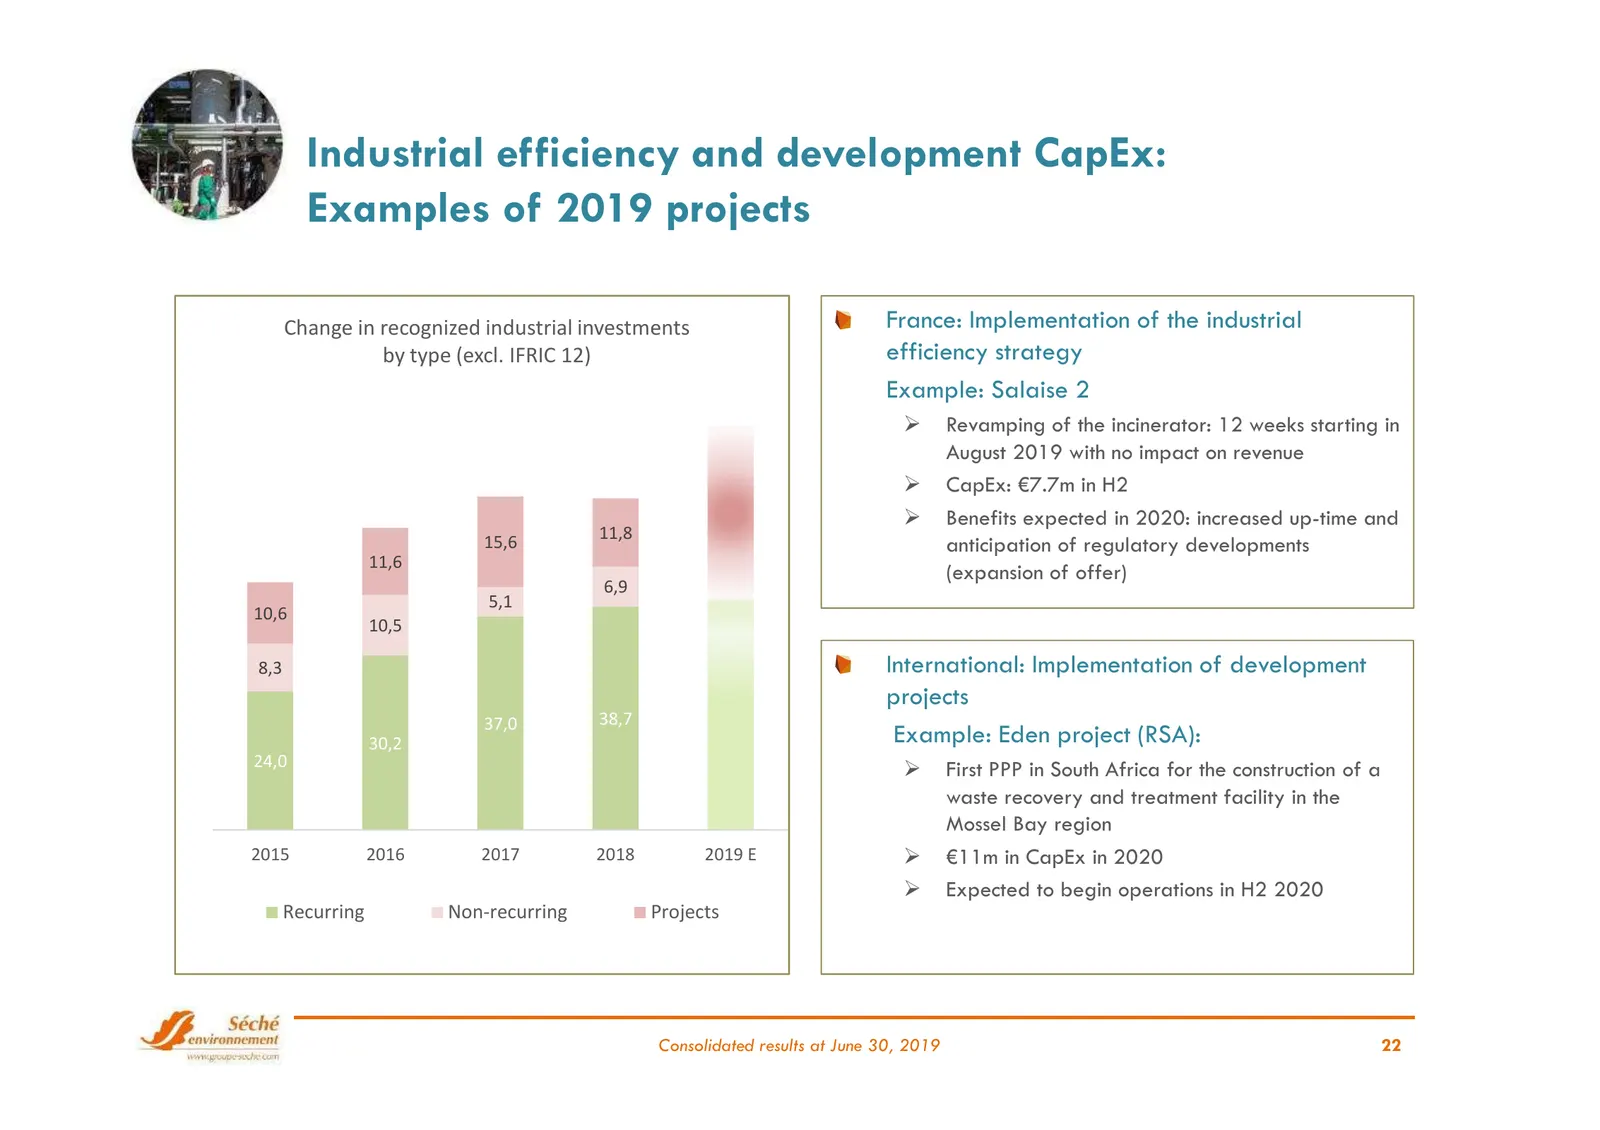
Slide 22: Industrial efficiency and development CapEx: examples of 2019 projects
Industrial efficiency and development CapEx: Examples of 2019 projects Change in recognized industrial investments France: Implementation of the industrial by type (excl. IFRIC 12) efficiency strategy Example: Salaise 2 Revamping of the incinerator: 12 weeks starting in August 2019 with no impact on
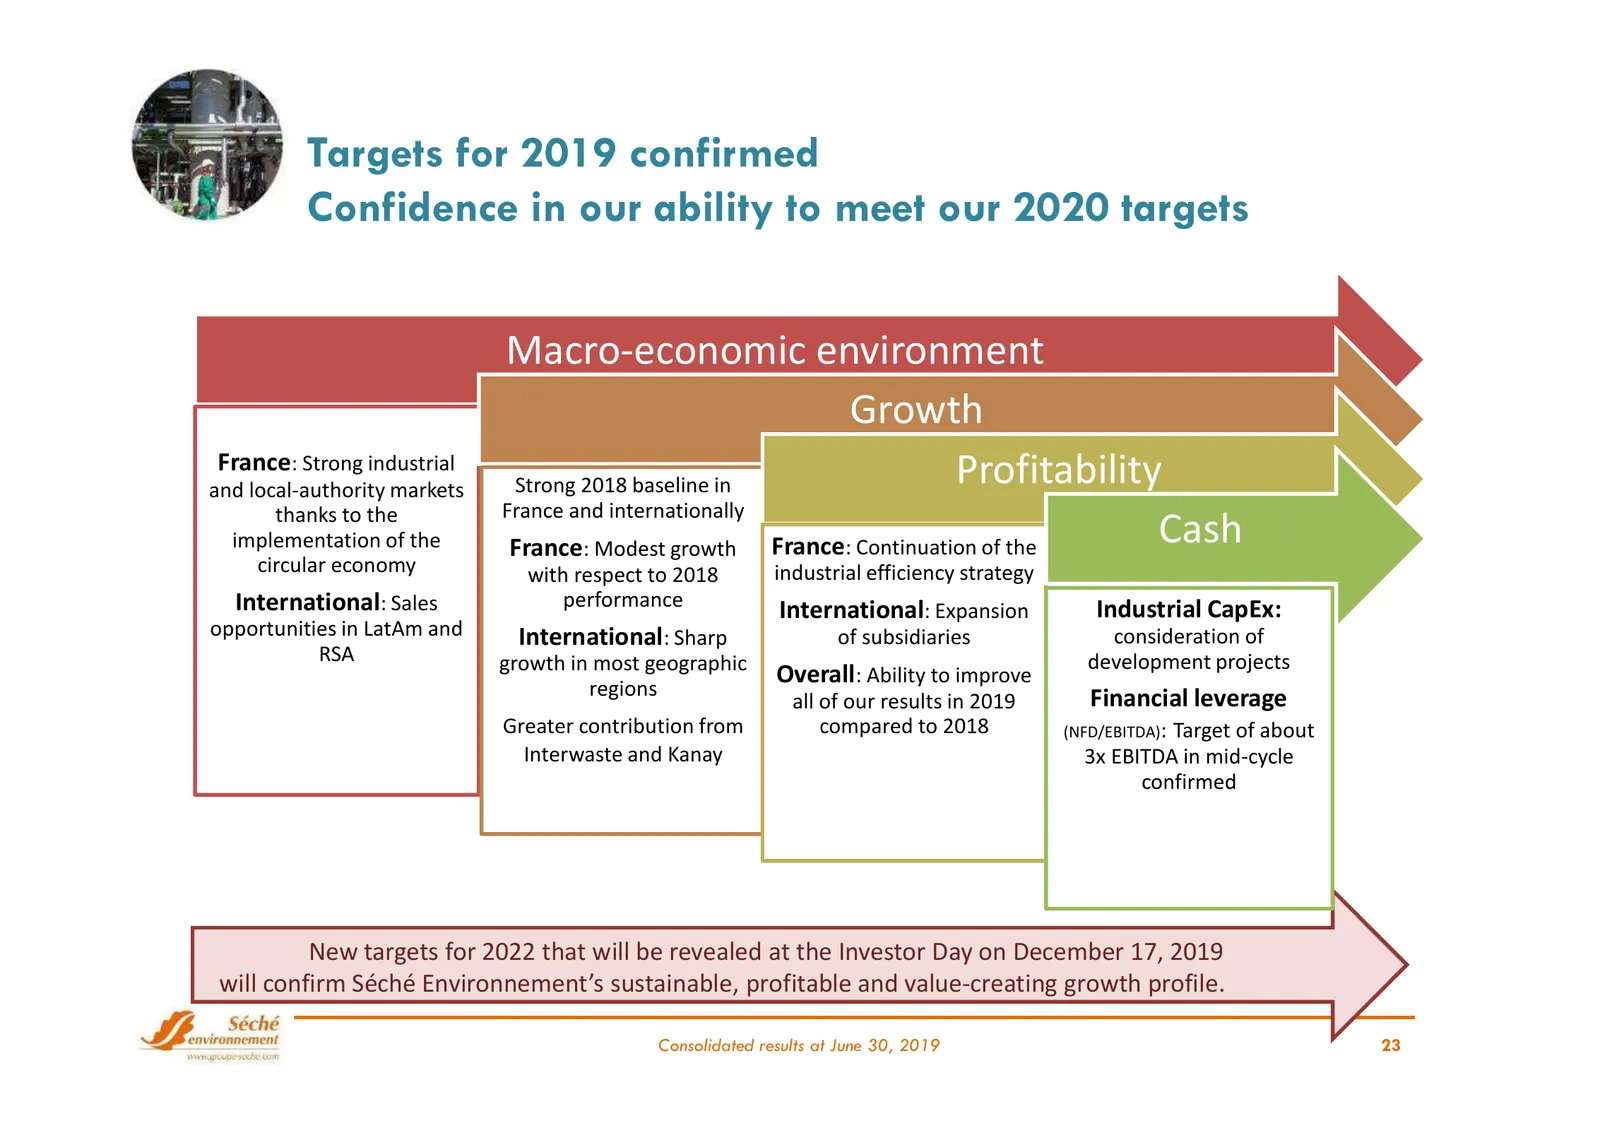
Slide 23: Targets for 2019 confirmed
Targets for 2019 confirmed Confidence in our ability to meet our 2020 targets Macro-economic environment Growth France: Strong industrial Profitability and local-authority markets Strong 2018 baseline in thanks to the France and internationally implementation of the France: Modest growth France: Con
Slide 24: Questions? Answers
Questions? Answers Contact: Manuel Andersen Head of Investor Relations m.andersen@groupe-seche.com
Slide 25: Appendices
APPENDIX 1: DEFINITION OF CONTRIBUTED REVENUE APPENDIX 2: BREAKDOWN OF CONTRIBUTED REVENUE BY GEOGRAPHIC AREA Appendices APPENDIX 3: BREAKDOWN OF CONTRIBUTED REVENUE BY CLIENT AND TYPE OF WASTE APPENDIX 4: BREAKDOWN OF SCOPE EFFECT BY DIVISION AND ACTIVITY APPENDIX 5: CHANGE IN CONTRIBUTED REVENUE B
Slide 26: Appendix 1: Definition of contributed revenue
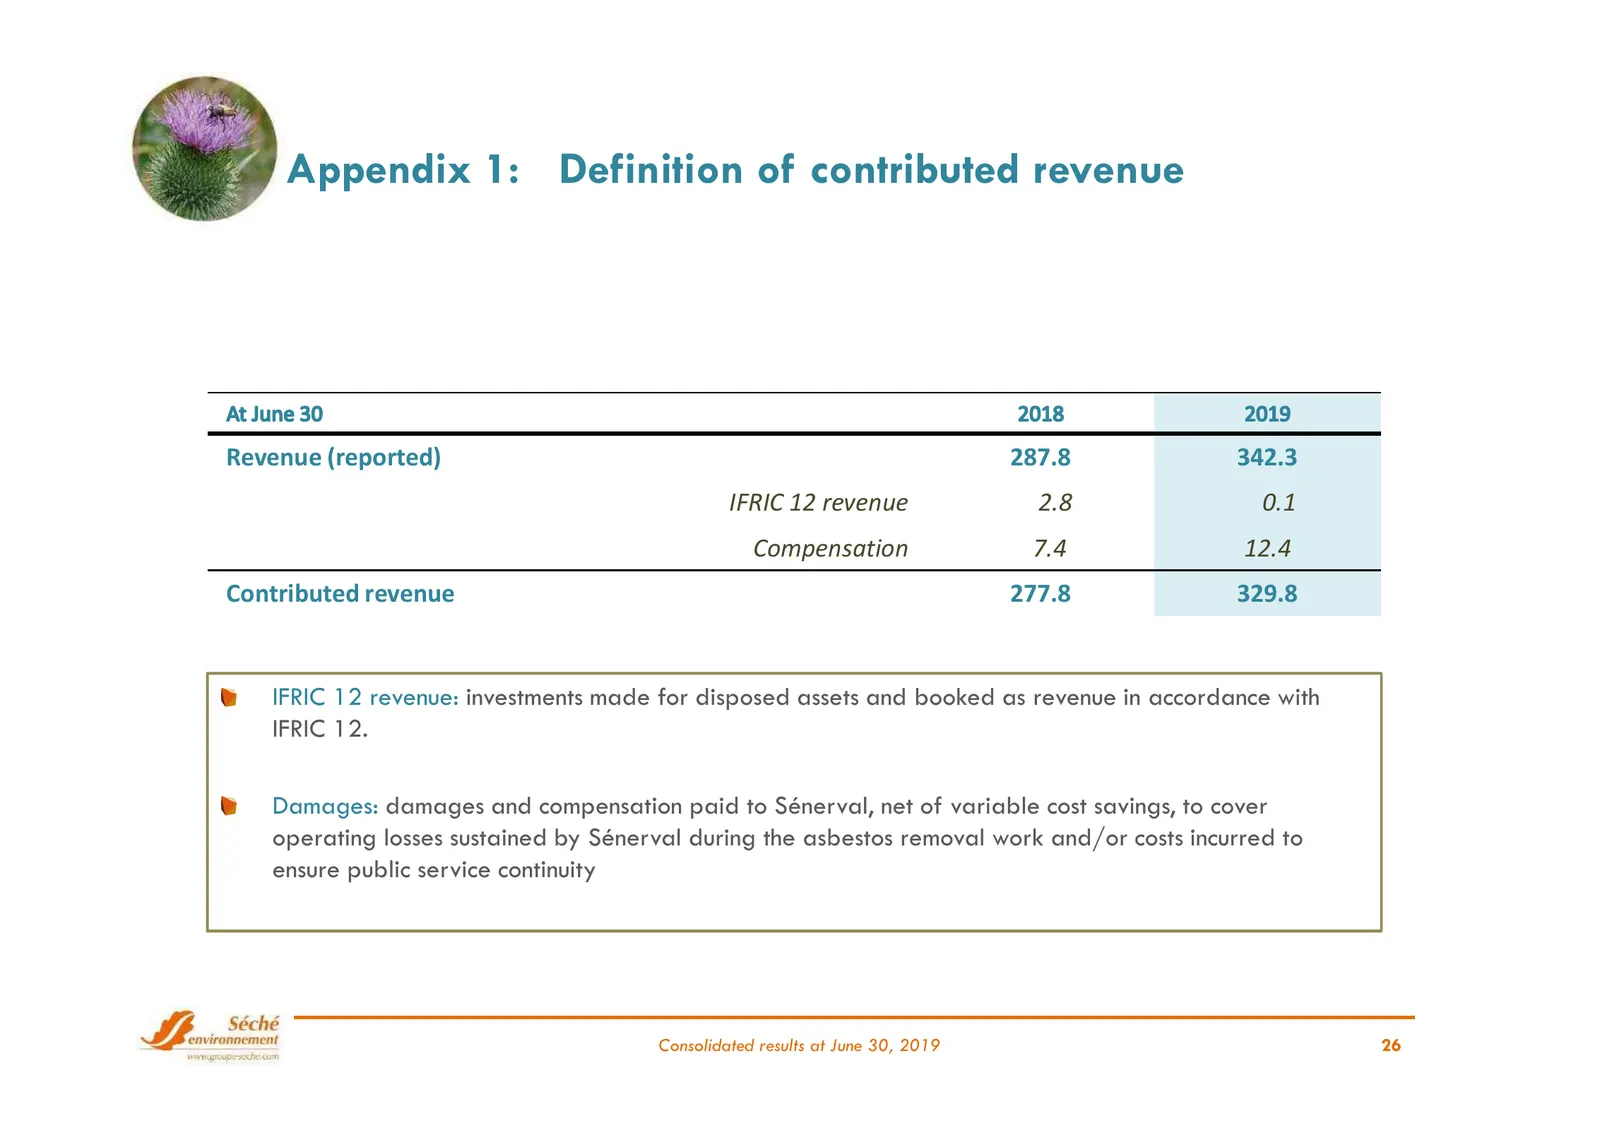
Appendix 1: Definition of contributed revenue Revenue (reported) 287.8 342.3 IFRIC 12 revenue 2.8 0.1 Compensation 7.4 12.4 Contributed revenue 277.8 329.8 IFRIC 12 revenue: investments made for disposed assets and booked as revenue in accordance with IFRIC 12. Damages: damages and compensation paid
Slide 27: Appendix 2: Contributed revenue by geographic area
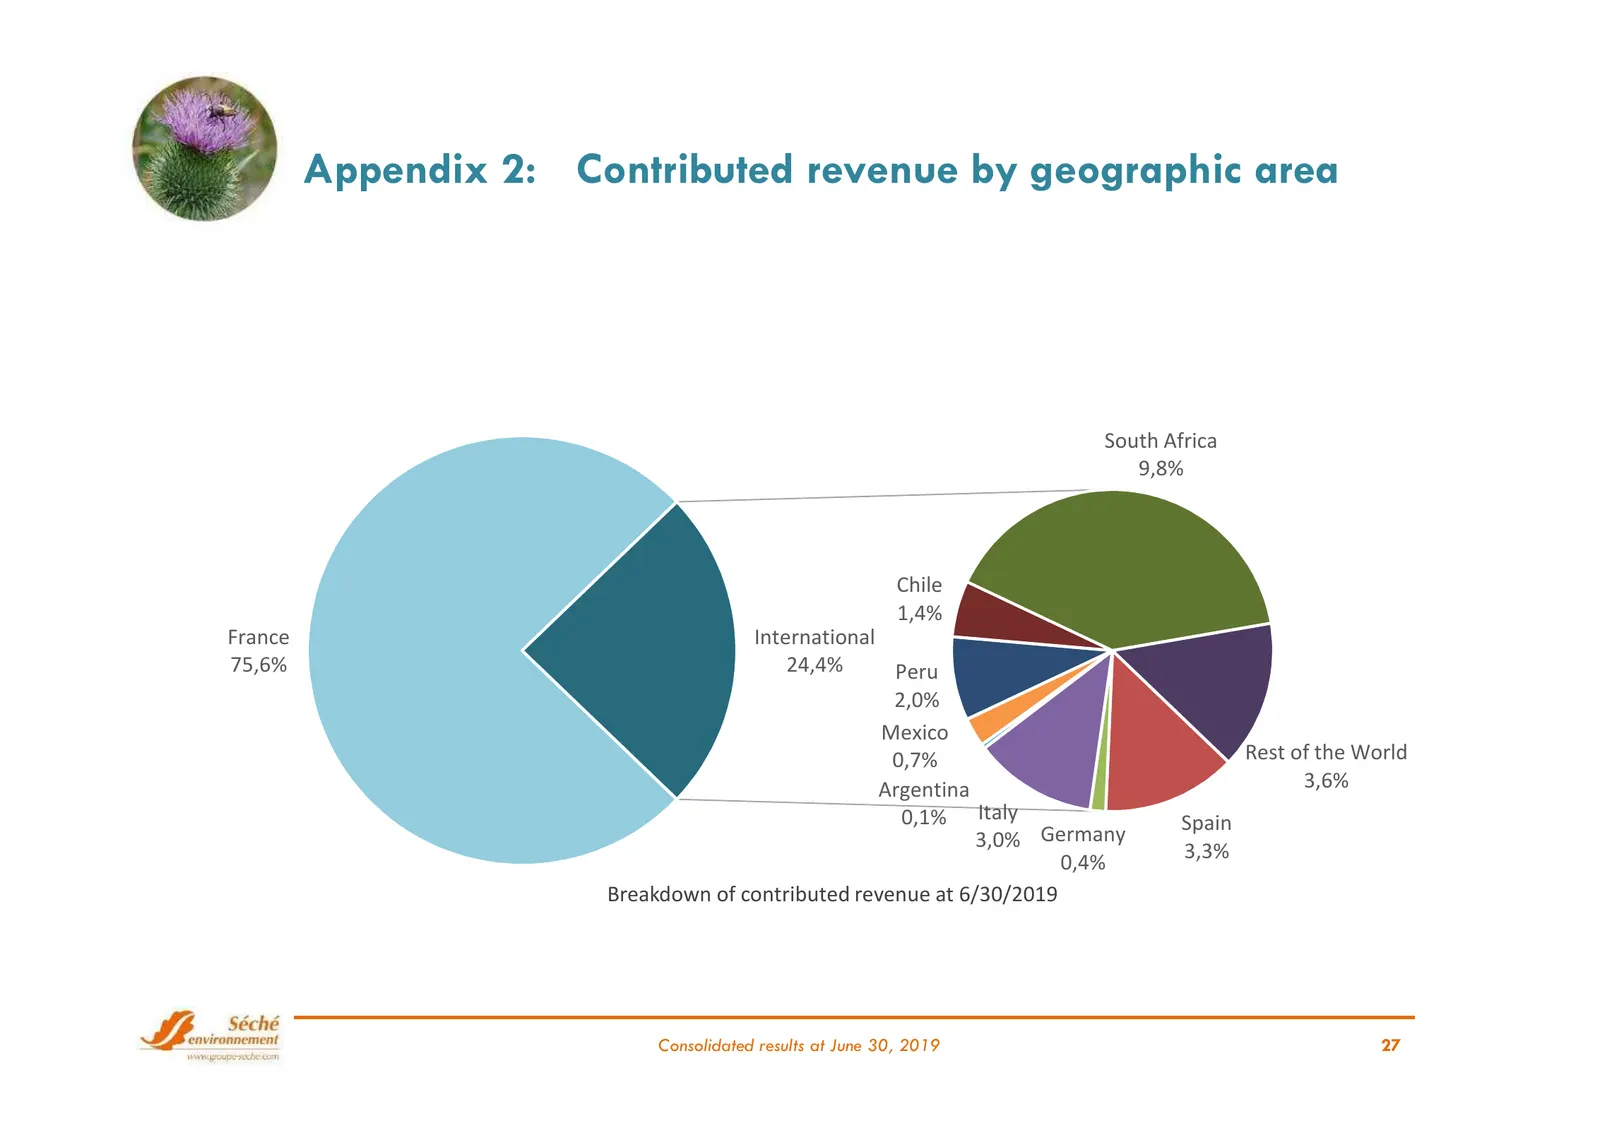
Appendix 2: Contributed revenue by geographic area South Africa 9,8% Chile 1,4% France International 75,6% 24,4% Peru 2,0% Mexico 0,7% Rest of the World Argentina 3,6% 0,1% Italy Spain 3,0% Germany 3,3% 0,4% Breakdown of contributed revenue at 6/30/2019 Consolidated results at June 30, 2019 27
Slide 28: Appendix 3: Breakdown of contributed revenue by client
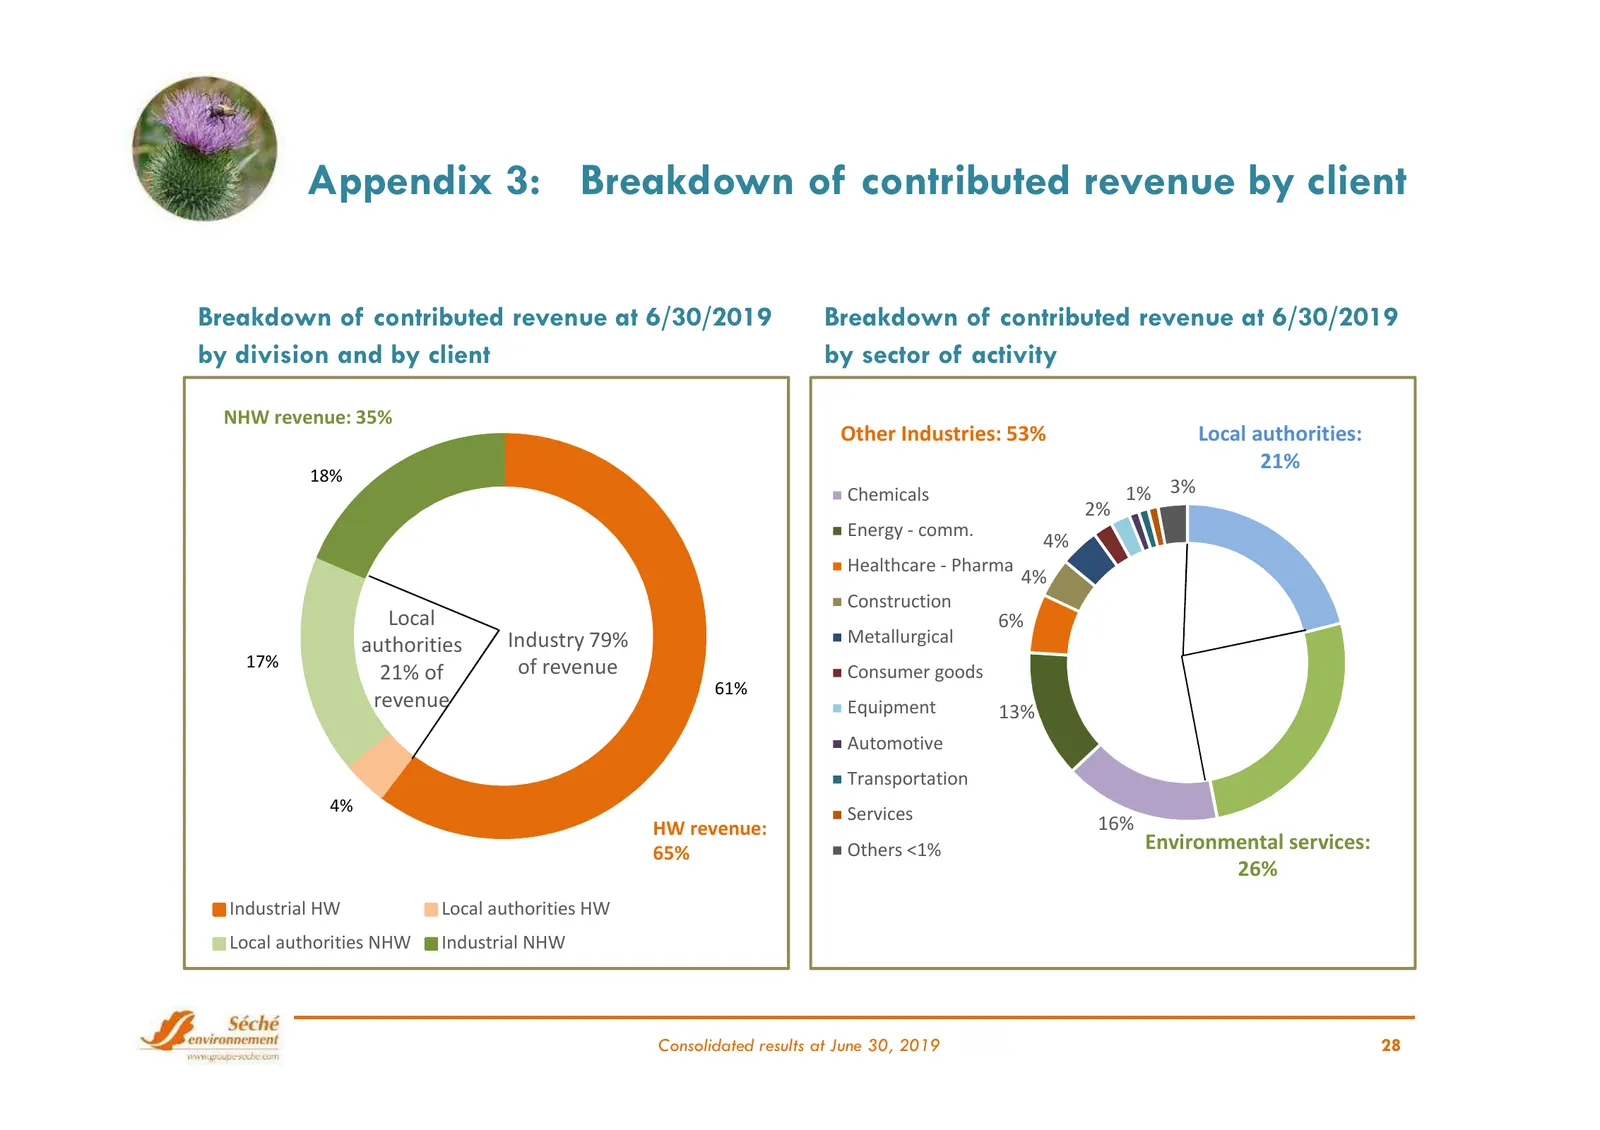
Appendix 3: Breakdown of contributed revenue by client Breakdown of contributed revenue at 6/30/2019 Breakdown of contributed revenue at 6/30/2019 by division and by client by sector of activity NHW revenue: 35% Other Industries: 53% Local authorities: 21% 18% Chemicals 1% 3% 2% Energy - comm. 4% He
Slide 29: Appendix 4: Breakdown of scope effect by activity and division
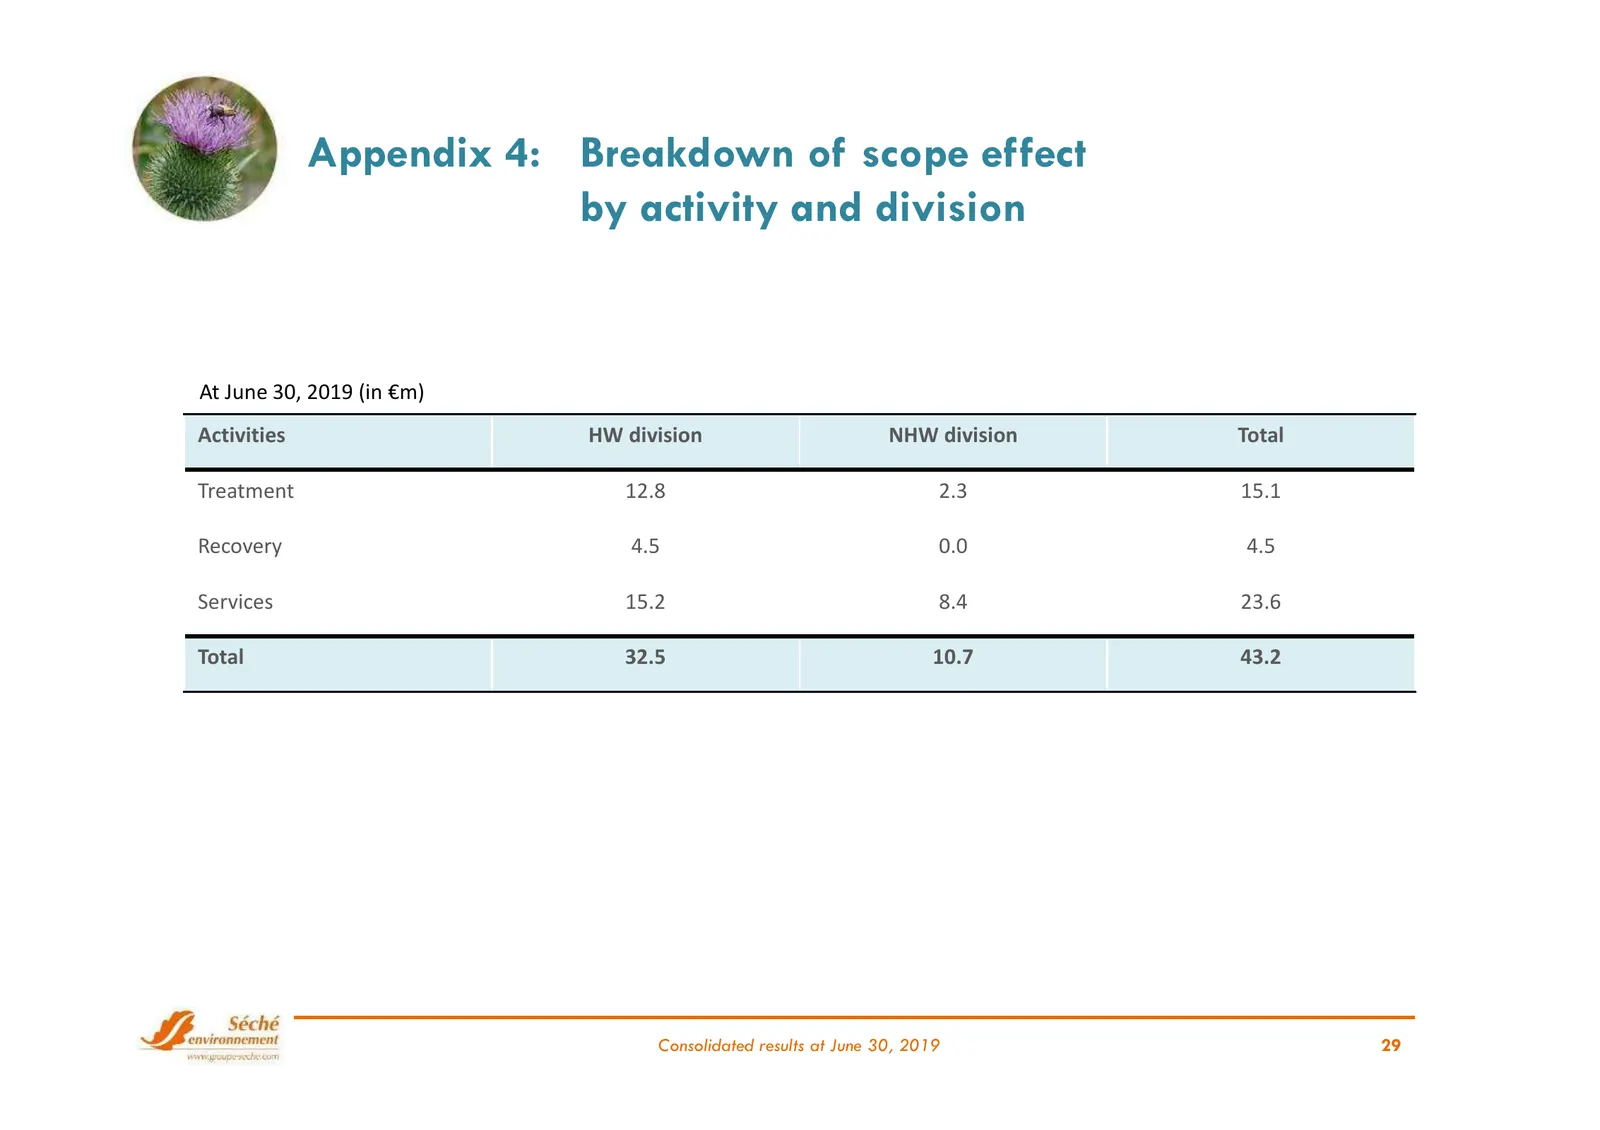
Appendix 4: Breakdown of scope effect by activity and division At June 30, 2019 (in €m) Activities HW division NHW division Total Treatment 12.8 2.3 15.1 Recovery 4.5 0.0 4.5 Services 15.2 8.4 23.6 Total 32.5 10.7 43.2 Consolidated results at June 30, 2019 29
Slide 30: Appendix 5: Change in contributed revenue by division
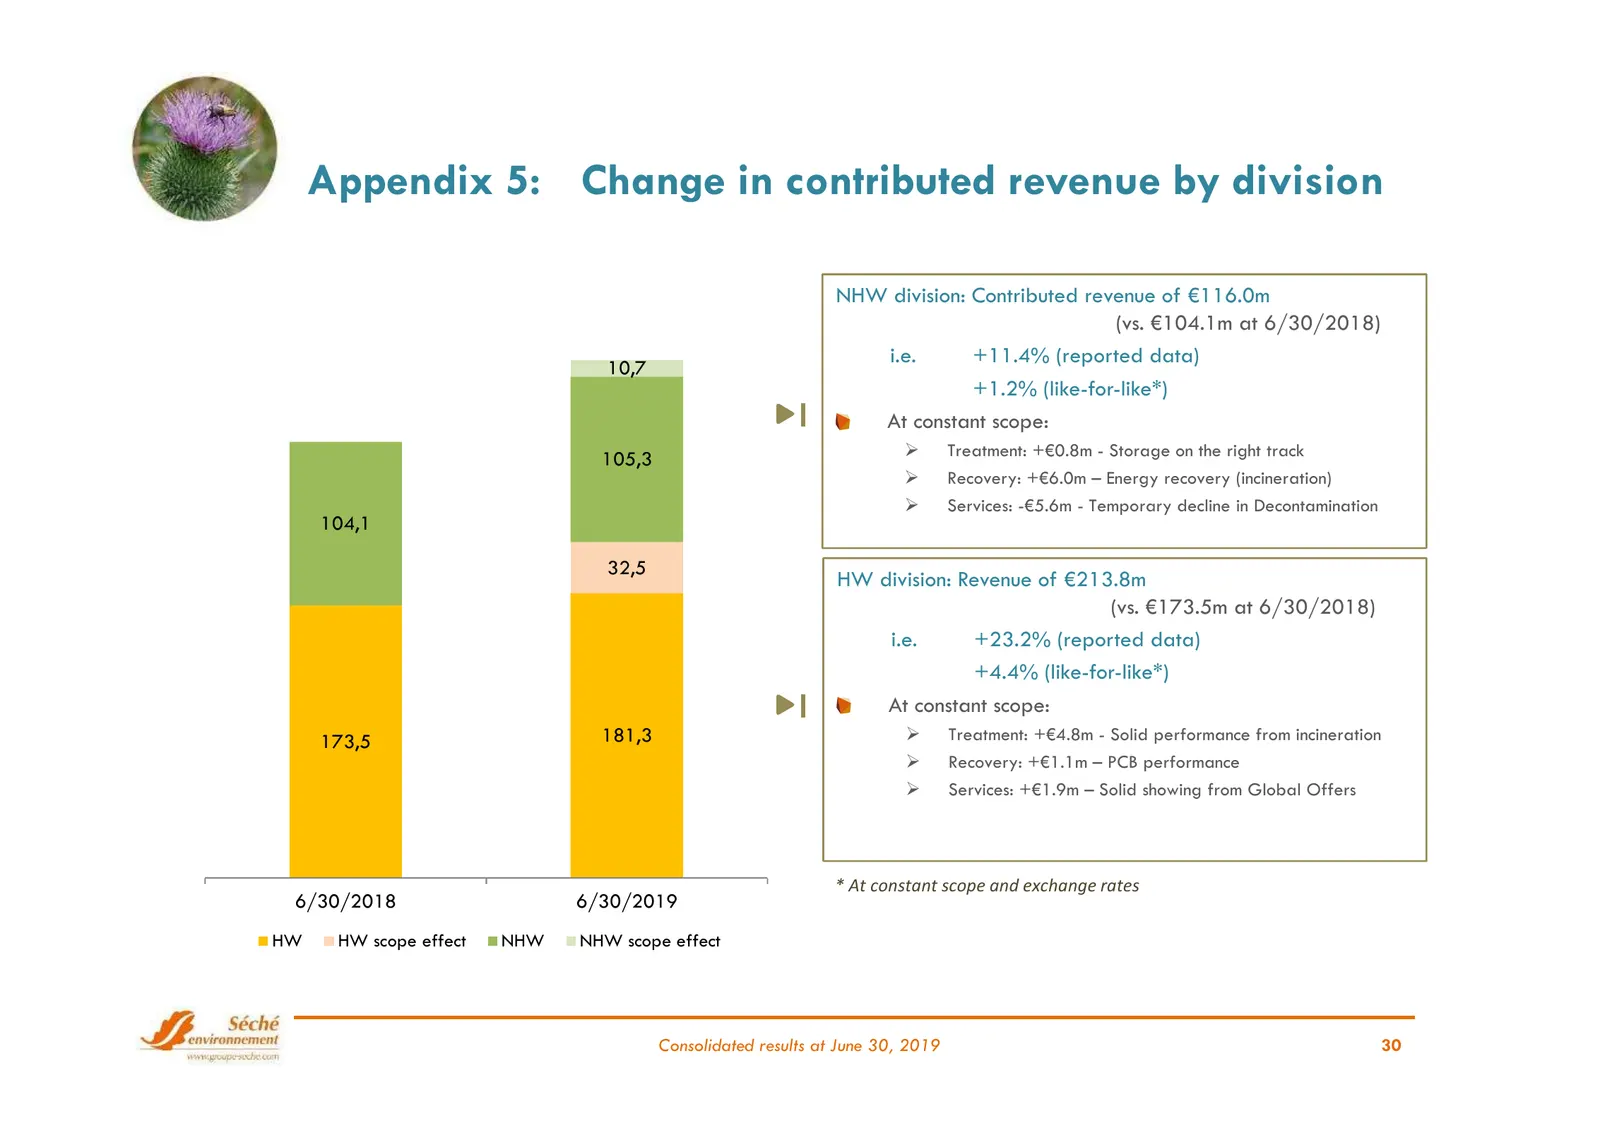
Appendix 5: Change in contributed revenue by division NHW division: Contributed revenue of €116.0m (vs. €104.1m at 6/30/2018) i.e. +11.4% (reported data) 10,7 +1.2% (like-for-like*) At constant scope: 105,3 Treatment: +€0.8m - Storage on the right track Recovery: +€6.0m – Energy recovery (incinerati
Slide 31: Appendix 6: Change in contributed revenue by activity
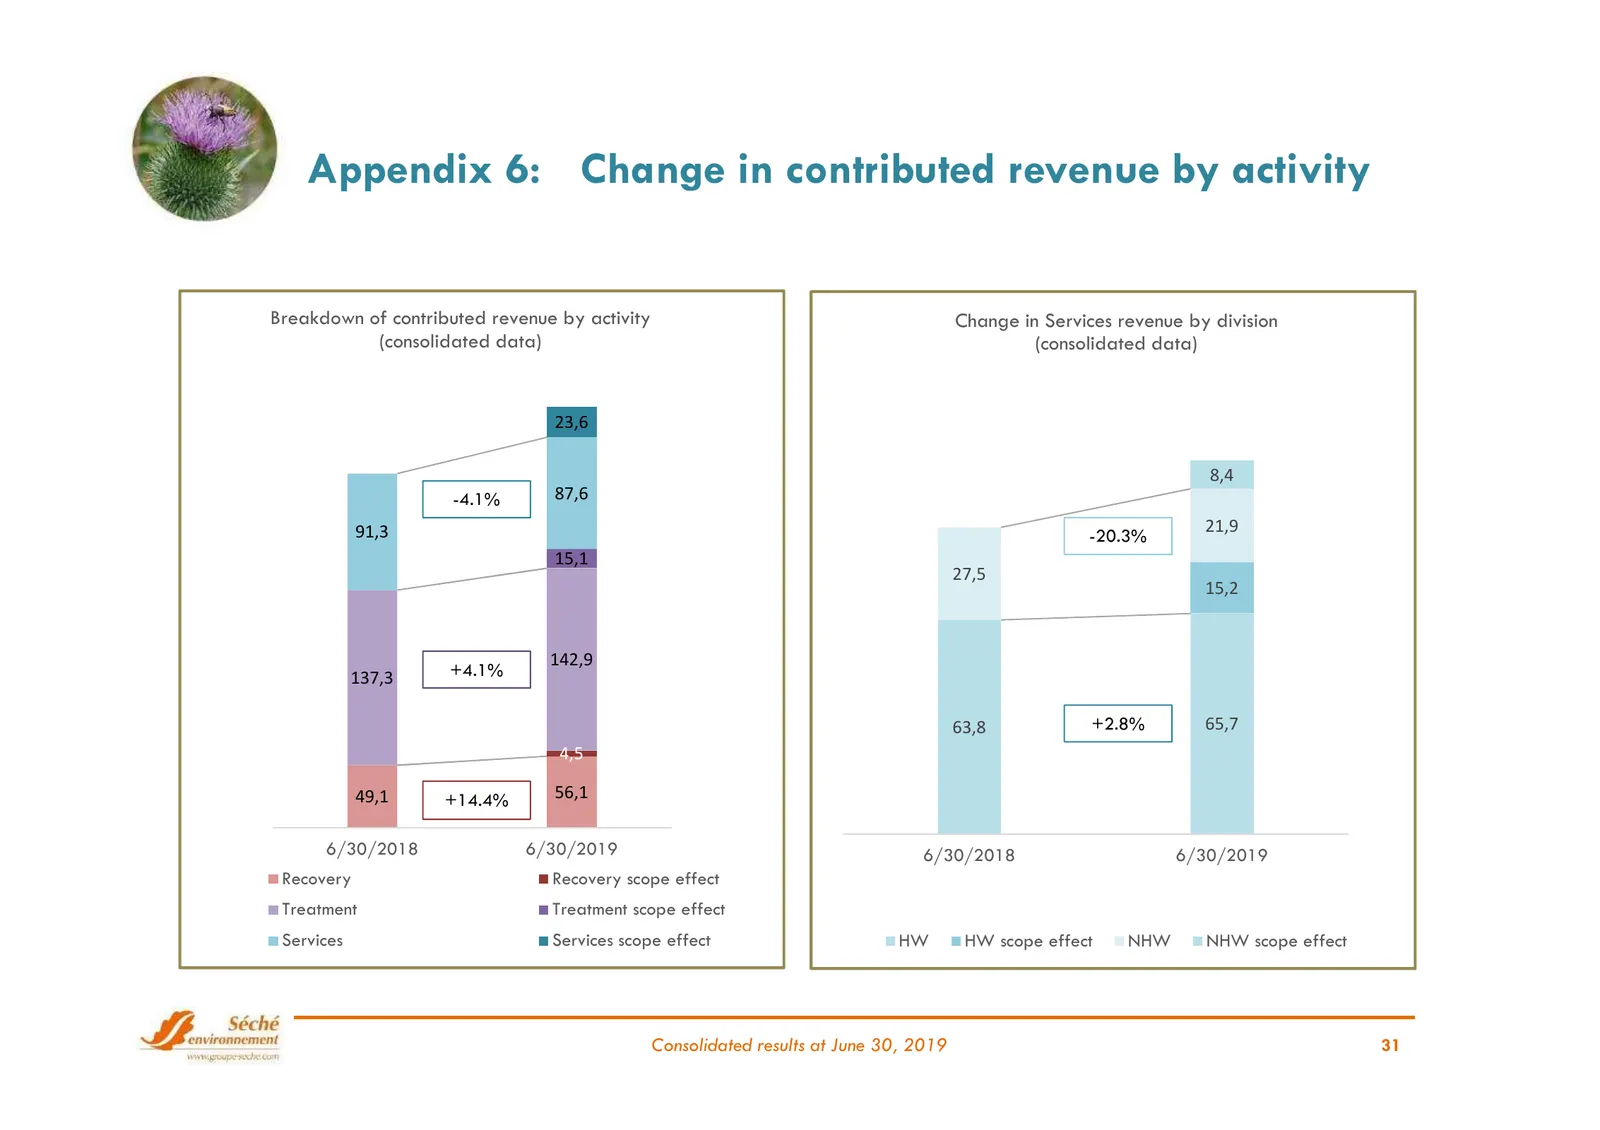
Appendix 6: Change in contributed revenue by activity Breakdown of contributed revenue by activity Change in Services revenue by division (consolidated data) (consolidated data) 23,6 8,4 -4.1% 87,6 91,3 21,9 -20.3% 15,1 27,5 15,2 142,9 137,3 +4.1% 63,8 +2.8% 65,7 4,5 49,1 +14.4% 56,1 6/30/2018 6/30/
Slide 32: Appendix 7: Breakdown of revenue by business
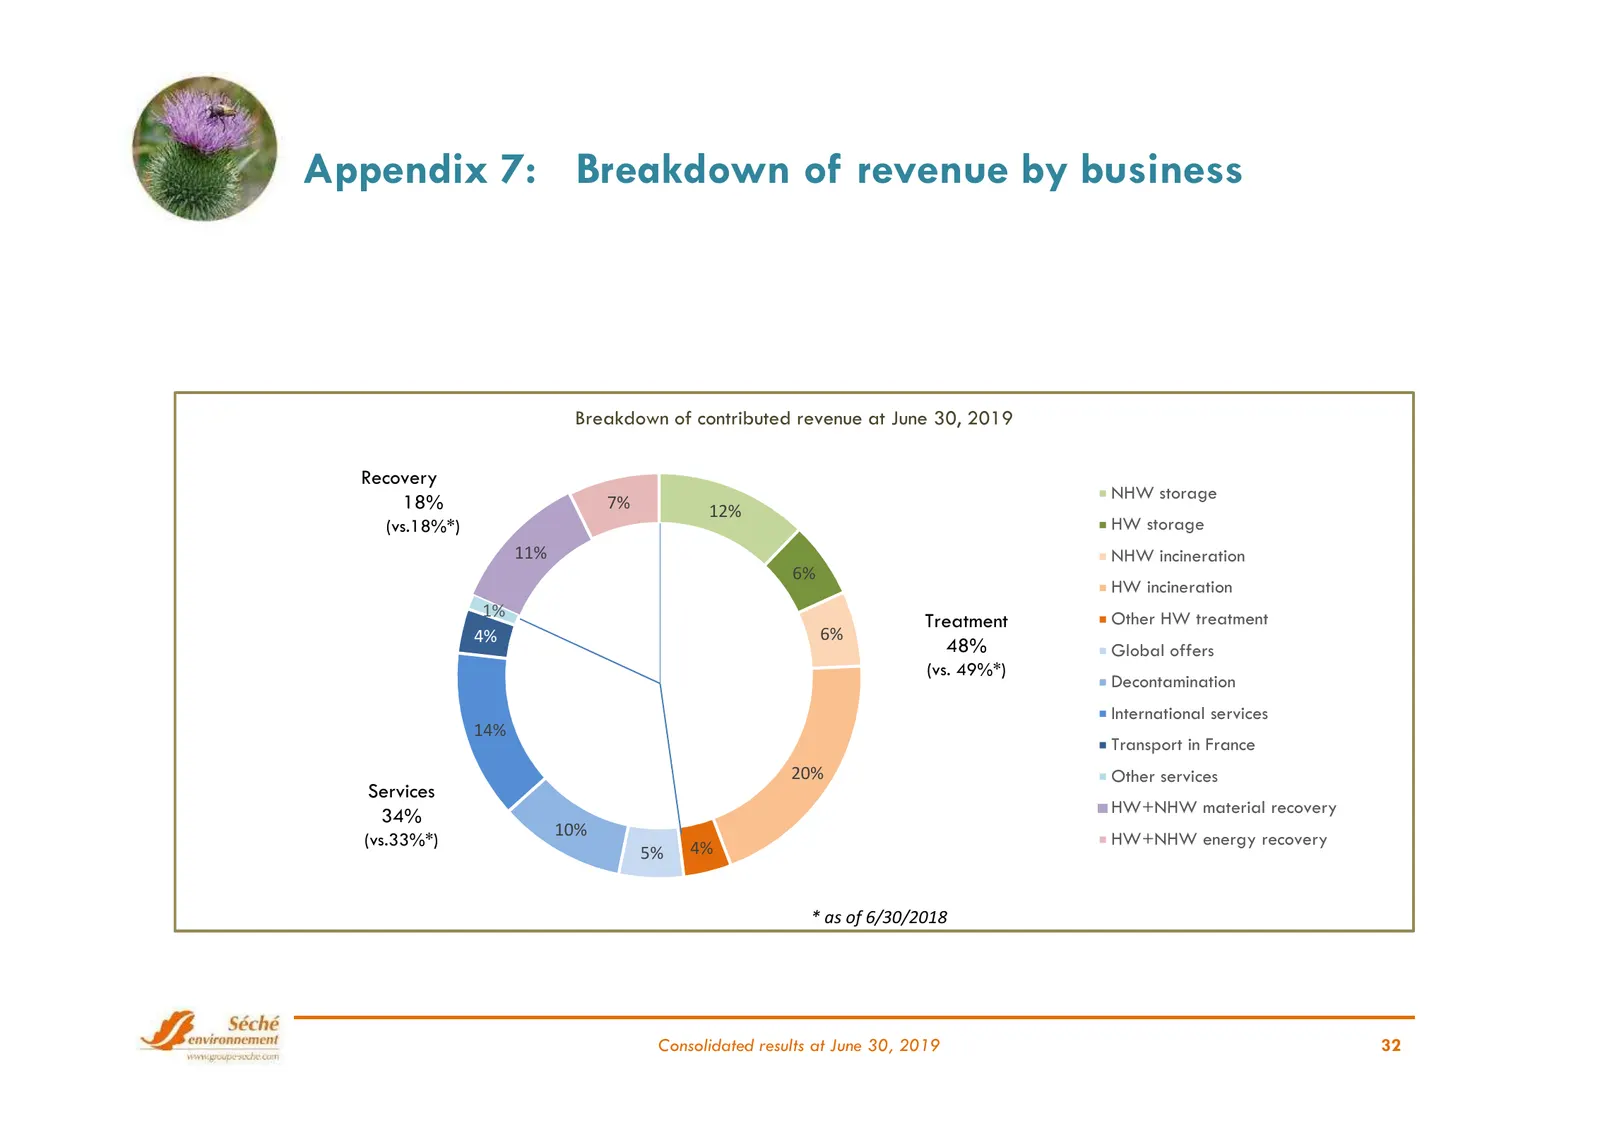
Appendix 7: Breakdown of revenue by business Breakdown of contributed revenue at June 30, 2019 Recovery NHW storage 18% 7% 12% (vs.18%*) HW storage 11% NHW incineration 6% HW incineration 1% Other HW treatment Treatment 4% 6% 48% Global offers (vs. 49%*) Decontamination International services 14% Tr
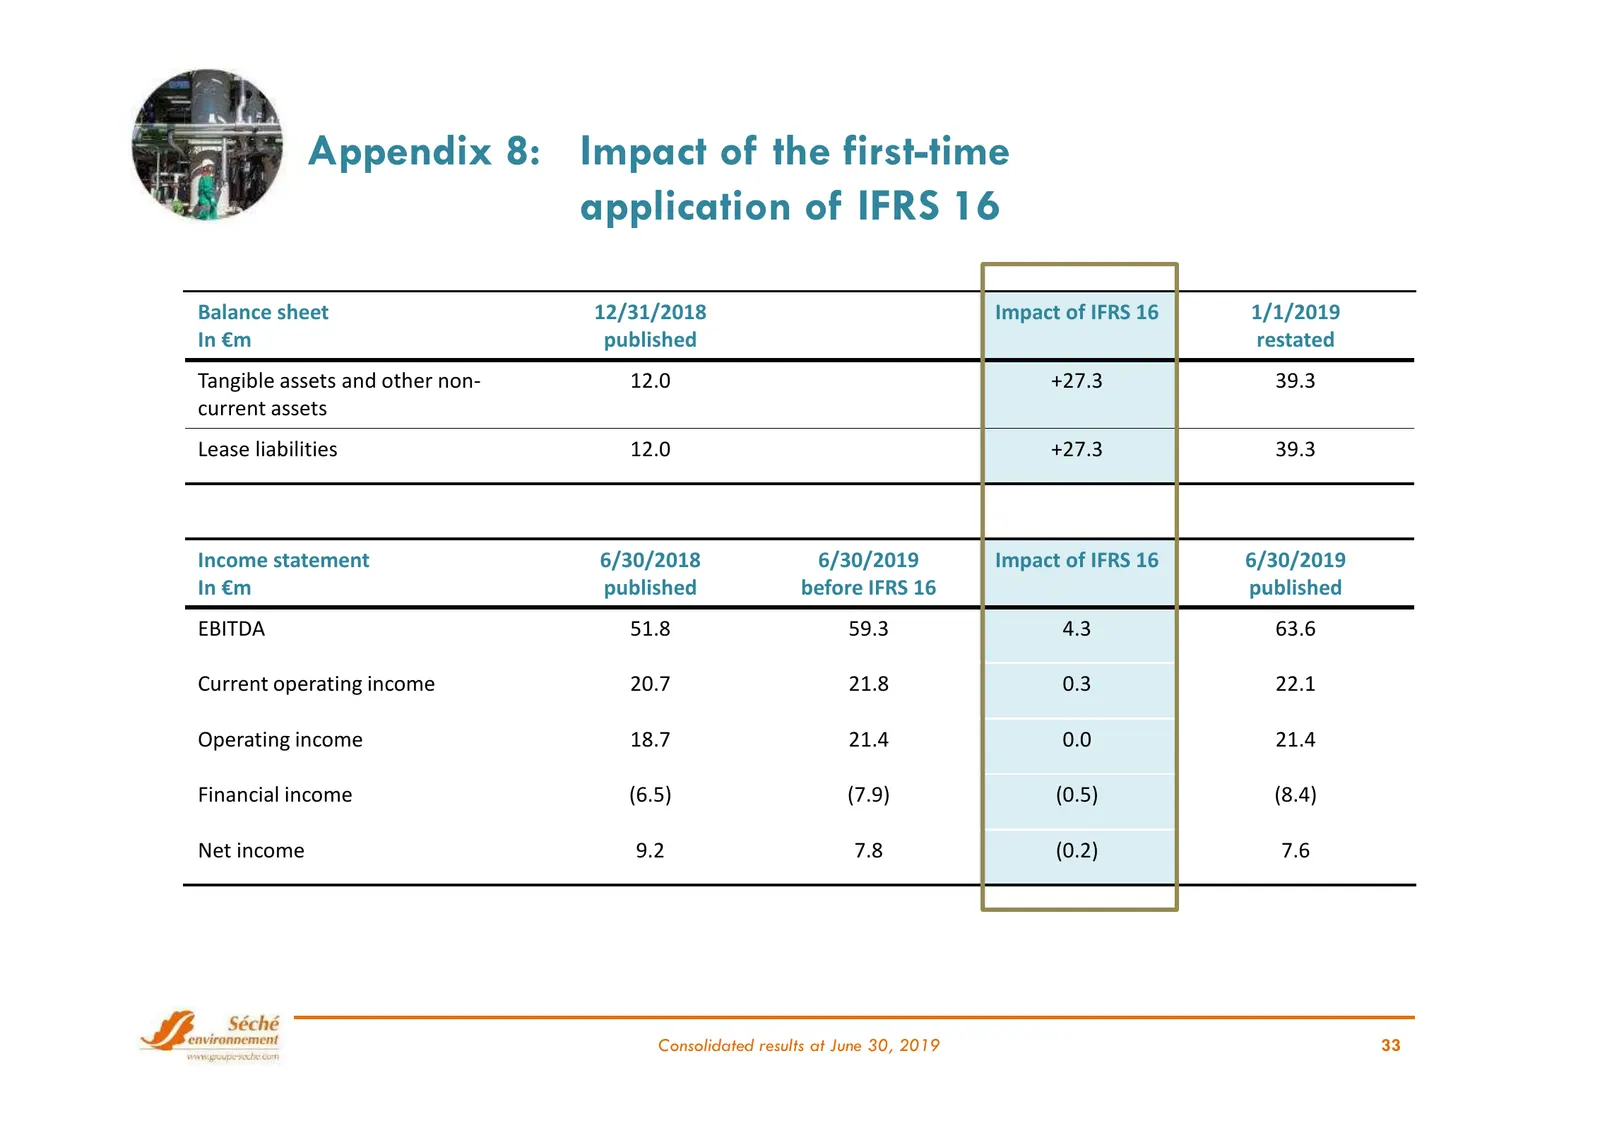
Slide 33: Appendix 8: Impact of first-time application of IFRS 16
Appendix 8: Impact of the first-time application of IFRS 16 Balance sheet 12/31/2018 Impact of IFRS 16 1/1/2019 In €m published restated Tangible assets and other non- 12.0 +27.3 39.3 current assets Lease liabilities 12.0 +27.3 39.3 Income statement 6/30/2018 6/30/2019 Impact of IFRS 16 6/30/2019 In
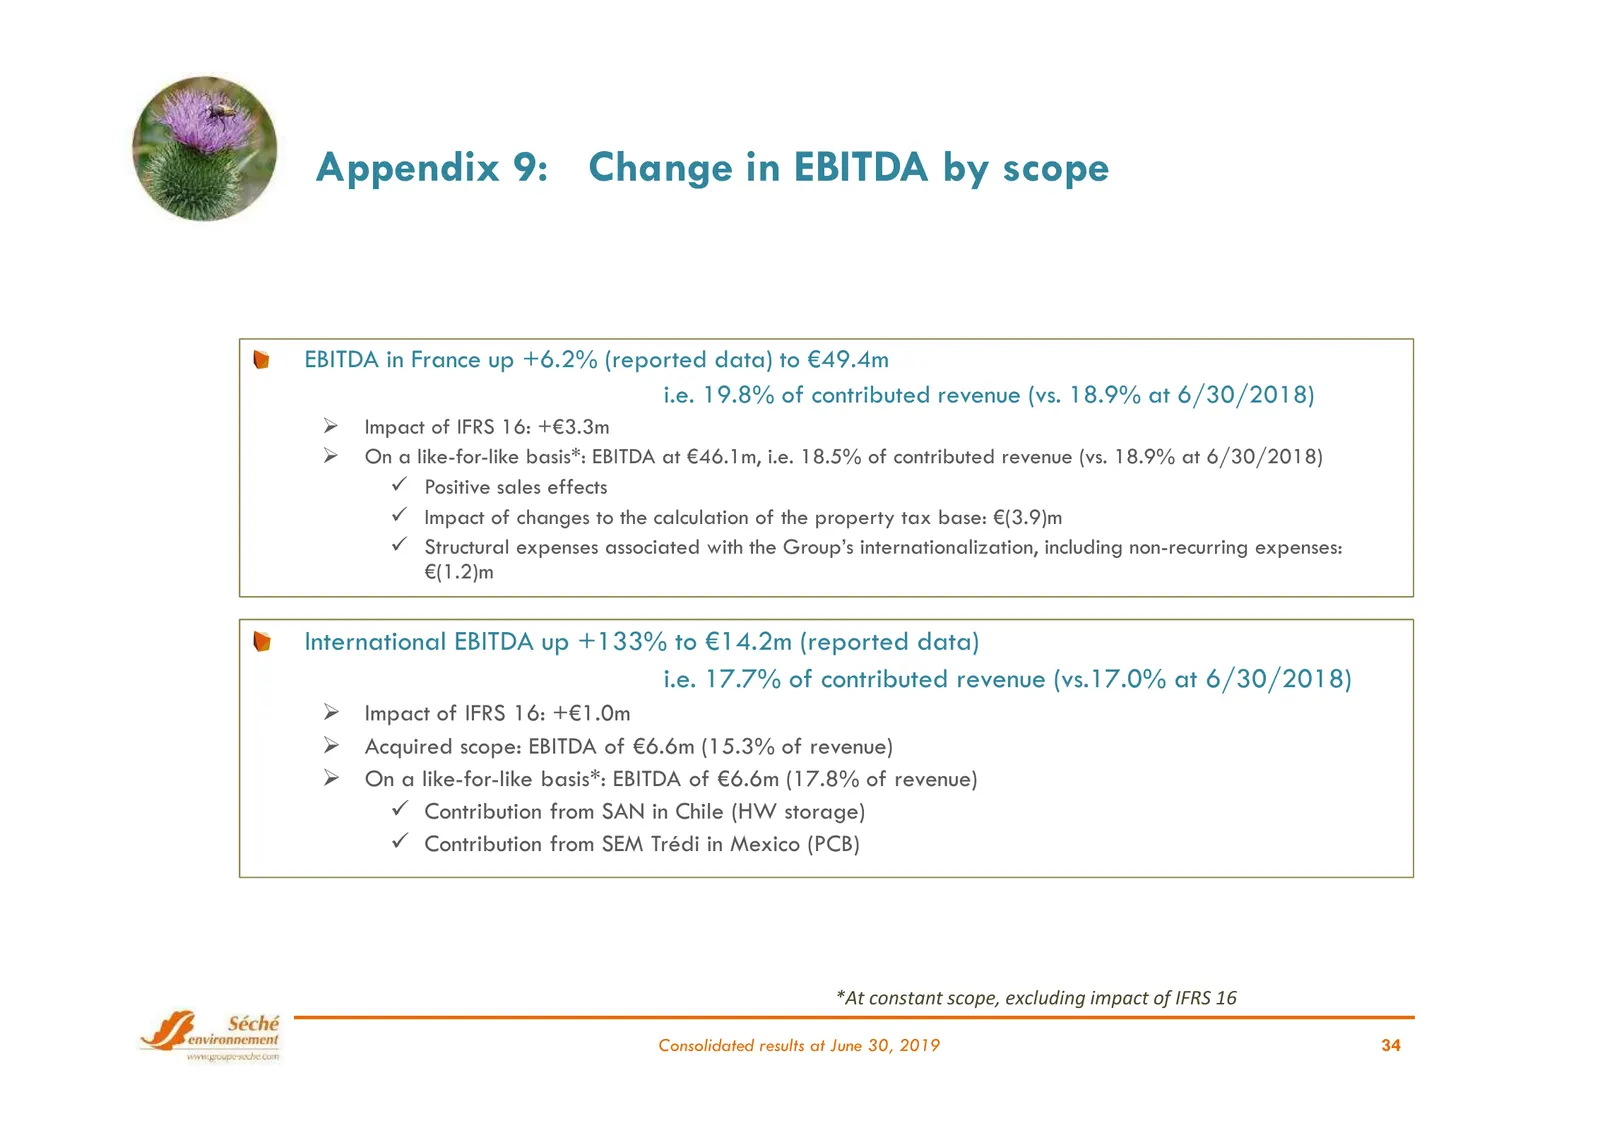
Slide 34: Appendix 9: Change in EBITDA by scope
Appendix 9: Change in EBITDA by scope EBITDA in France up +6.2% (reported data) to €49.4m i.e. 19.8% of contributed revenue (vs. 18.9% at 6/30/2018) Impact of IFRS 16: +€3.3m On a like-for-like basis*: EBITDA at €46.1m, i.e. 18.5% of contributed revenue (vs. 18.9% at 6/30/2018) Positive sales effect
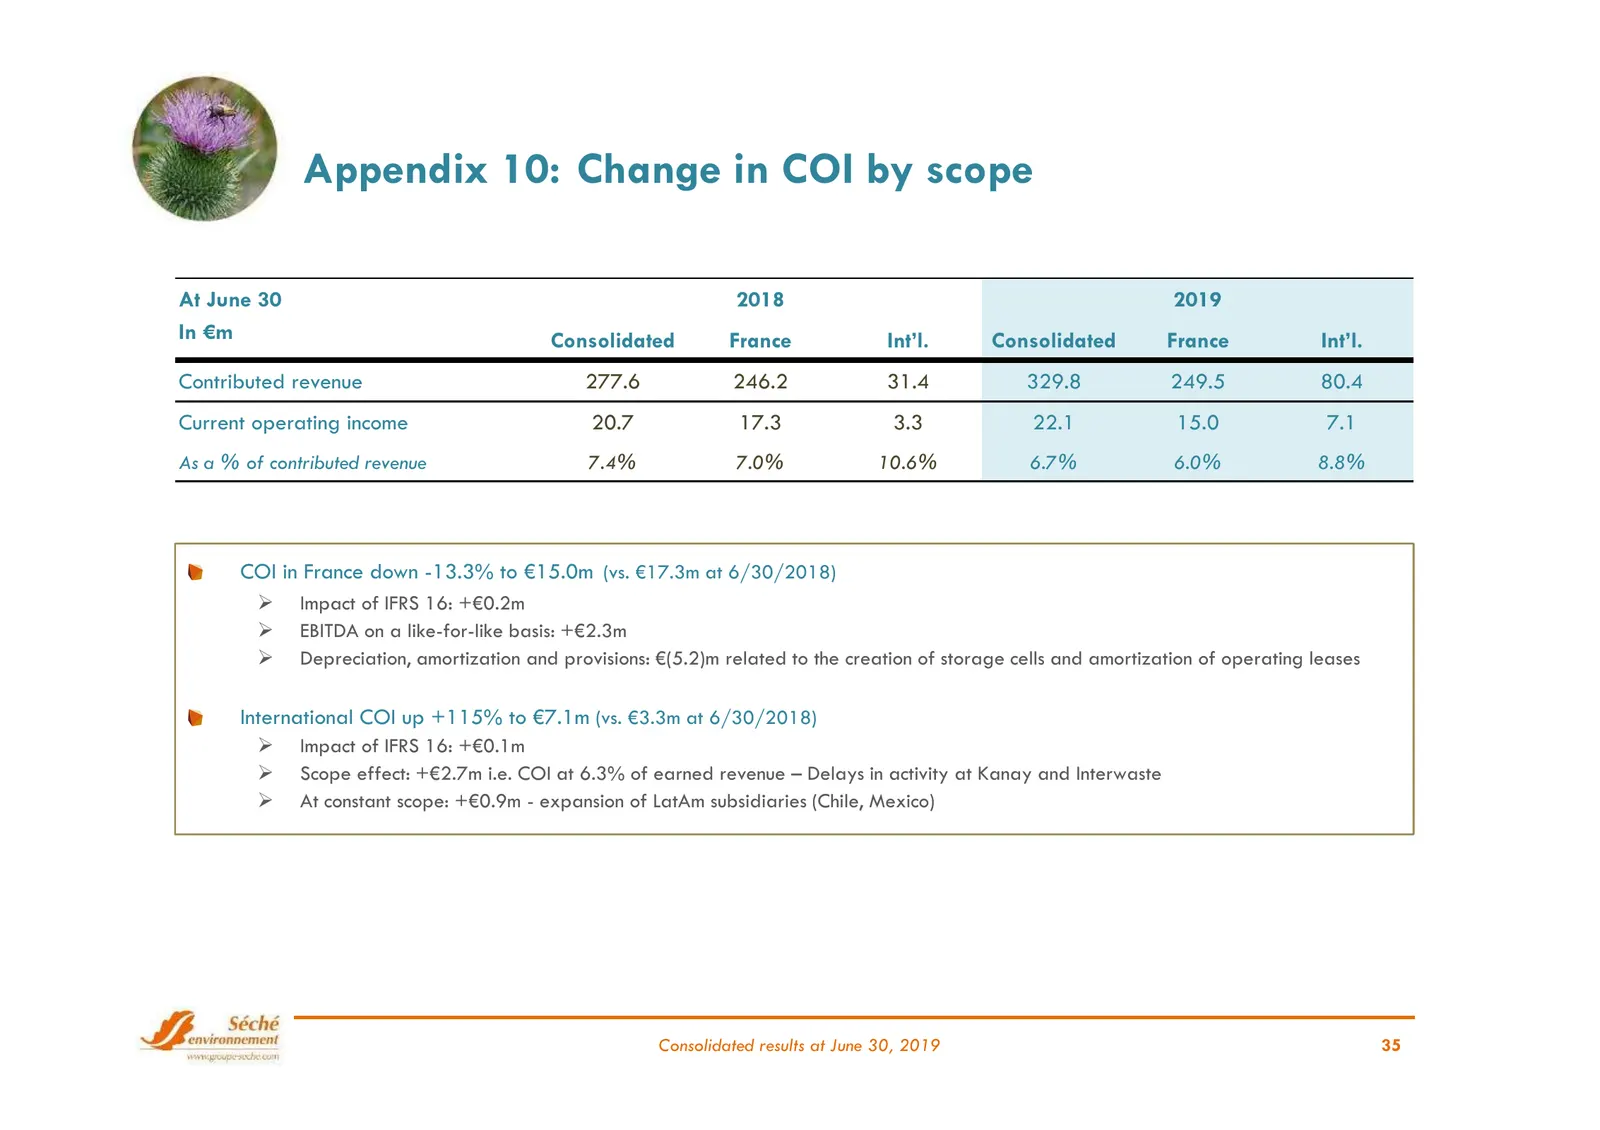
Slide 35: Appendix 10: Change in COI by scope
Appendix 10: Change in COI by scope At June 30 2018 2019 In €m Consolidated France Int’l. Consolidated France Int’l. Contributed revenue 277.6 246.2 31.4 329.8 249.5 80.4 Current operating income 20.7 17.3 3.3 22.1 15.0 7.1 As a % of contributed revenue 7.4% 7.0% 10.6% 6.7% 6.0% 8.8% COI in France d
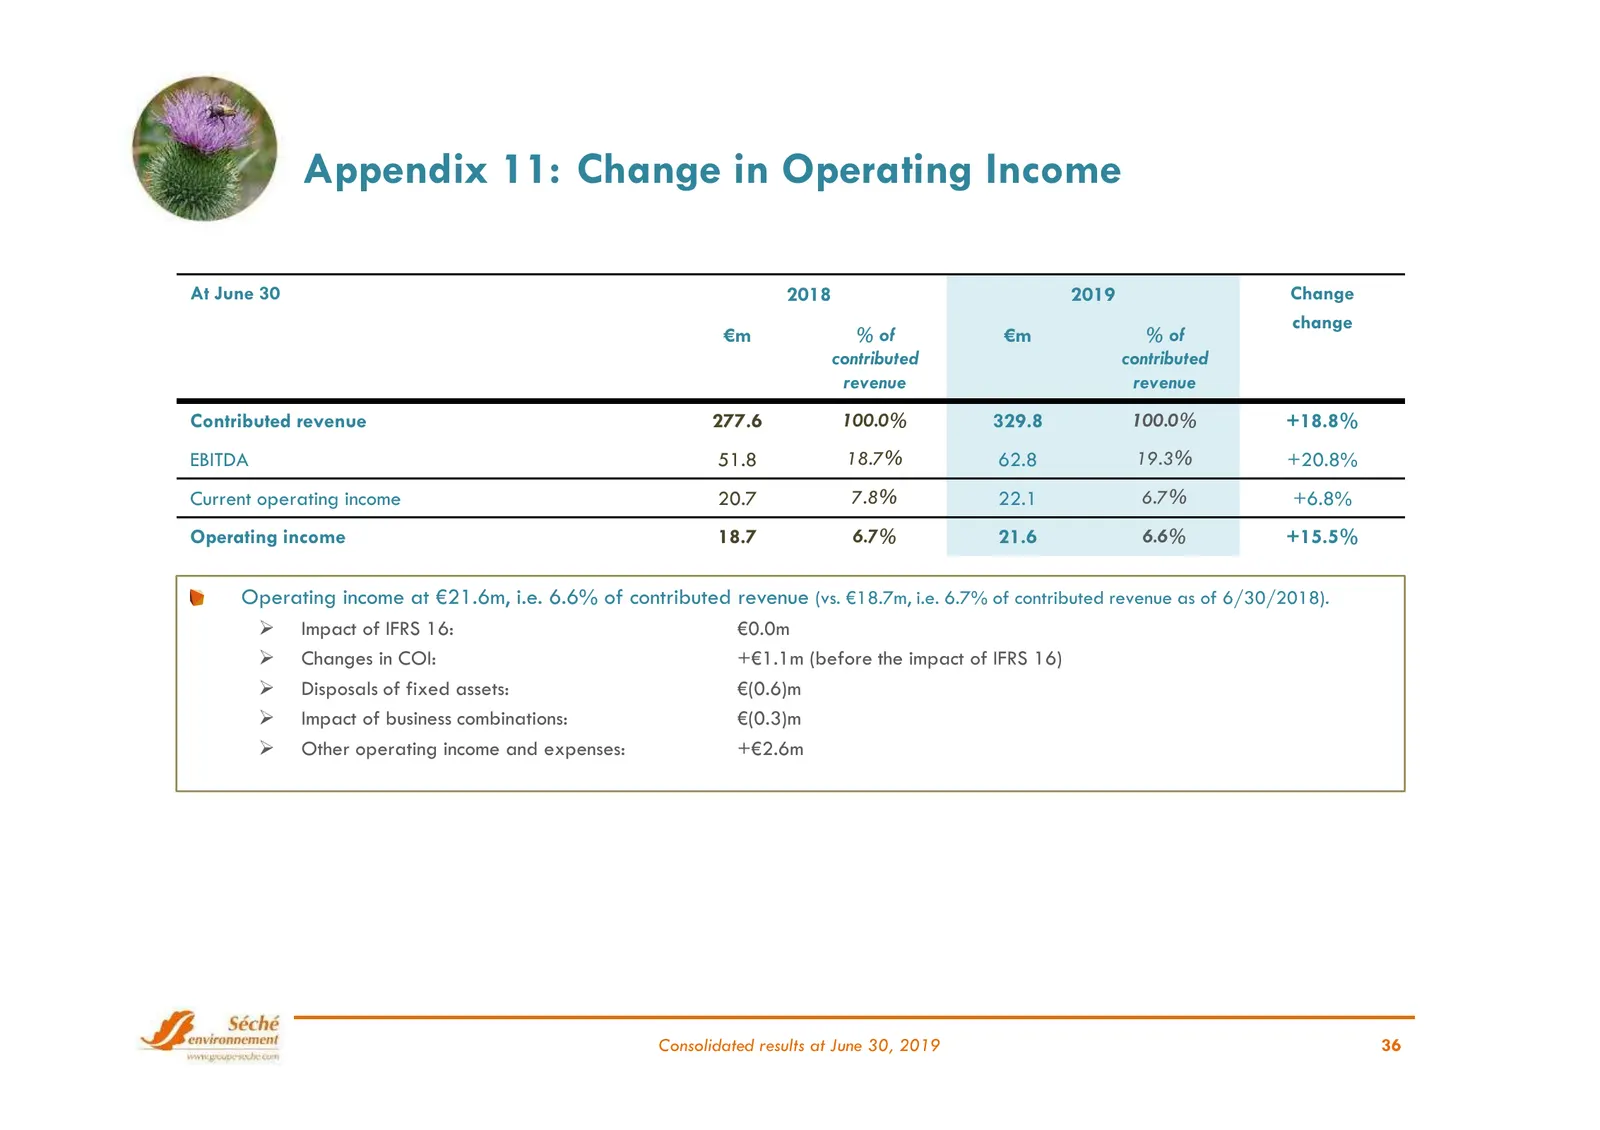
Slide 36: Appendix 11: Change in Operating Income
Appendix 11: Change in Operating Income At June 30 2018 2019 Change change €m % of €m % of contributed contributed revenue revenue Contributed revenue 277.6 100.0% 329.8 100.0% +18.8% EBITDA 51.8 18.7% 62.8 19.3% +20.8% Current operating income 20.7 7.8% 22.1 6.7% +6.8% Operating income 18.7 6.7% 21
Slide 37: Appendix 12: Changes in Financial Income
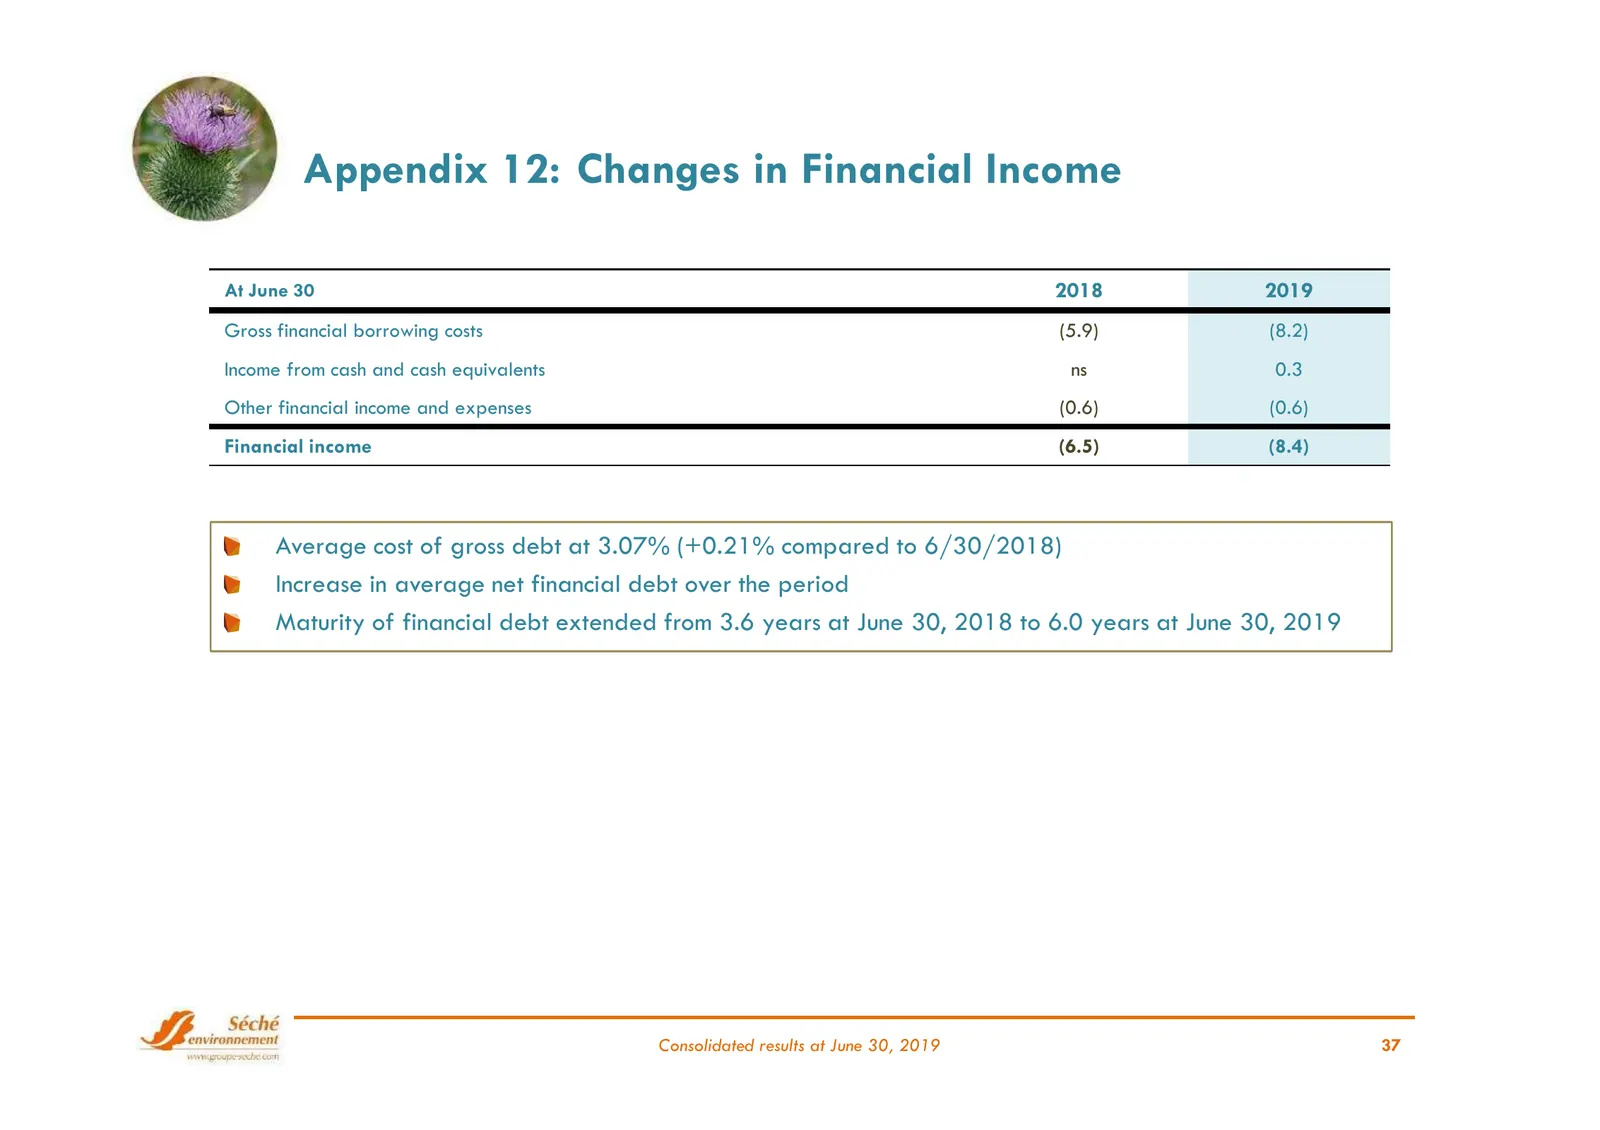
Appendix 12: Changes in Financial Income At June 30 2018 2019 Gross financial borrowing costs (5.9) (8.2) Income from cash and cash equivalents ns 0.3 Other financial income and expenses (0.6) (0.6) Financial income (6.5) (8.4) Average cost of gross debt at 3.07% (+0.21% compared to 6/30/2018) Incre
Slide 38: Appendix 13: Shareholder structure and voting rights
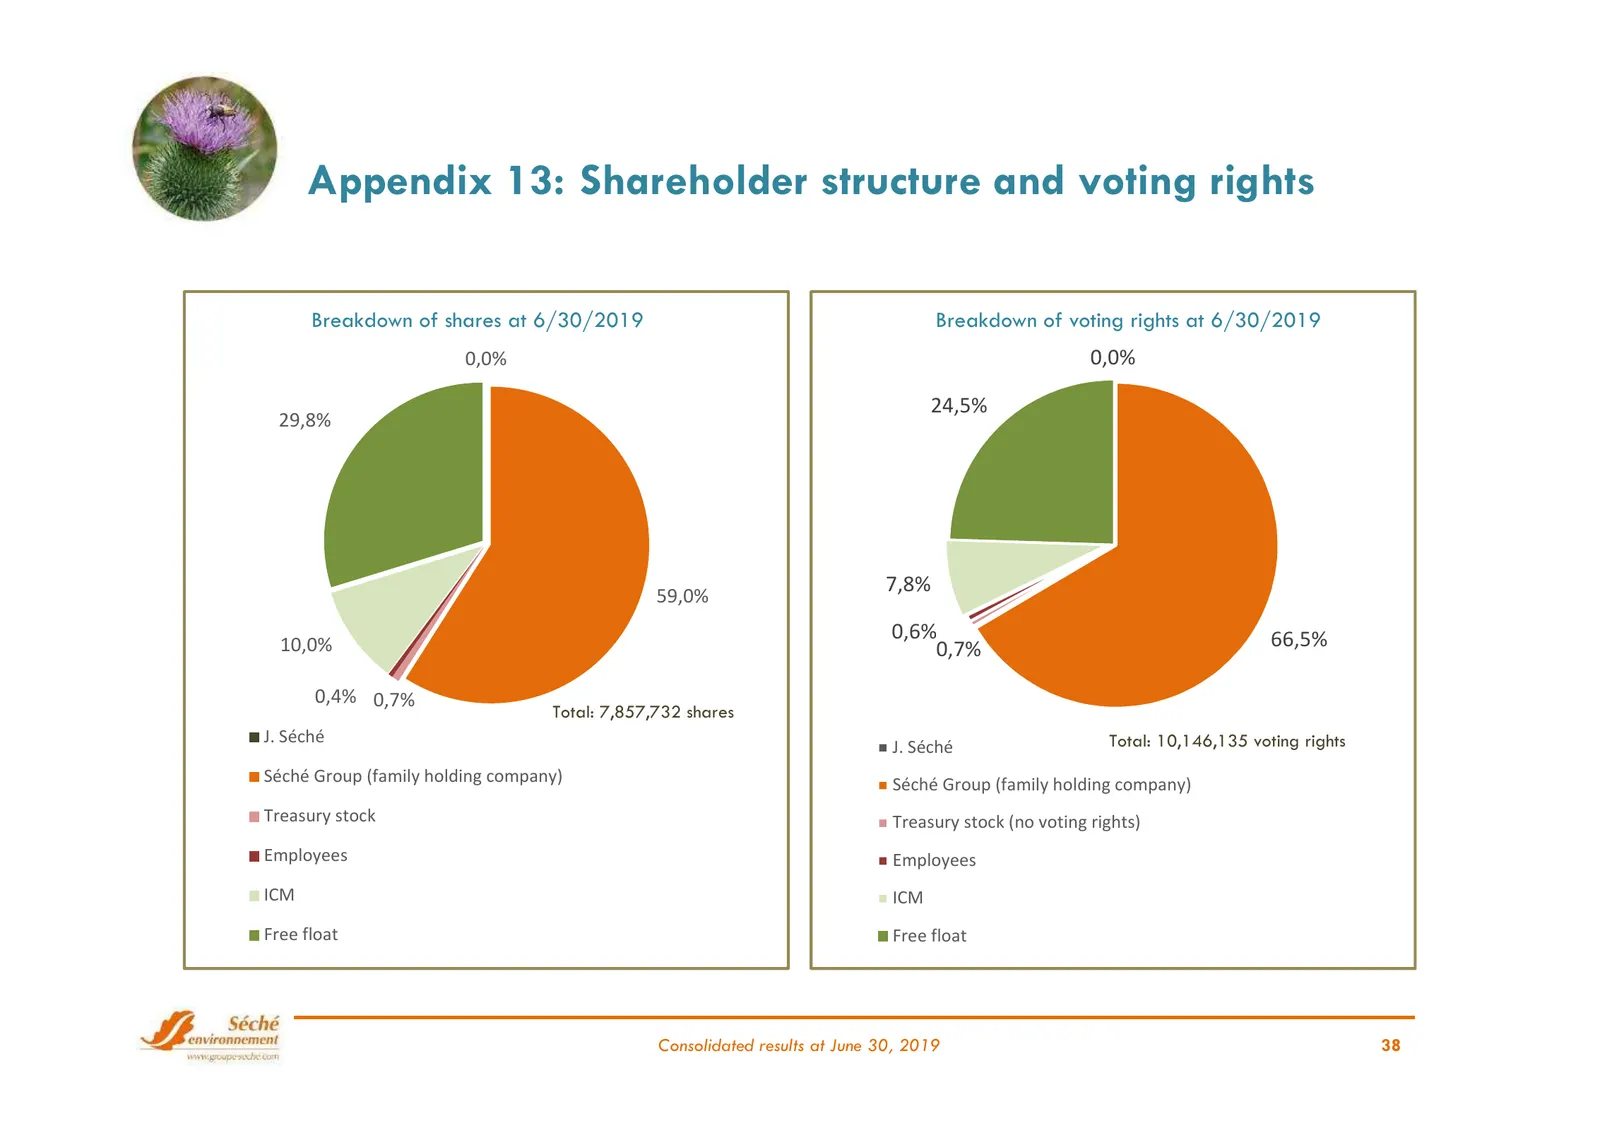
Appendix 13: Shareholder structure and voting rights Breakdown of shares at 6/30/2019 Breakdown of voting rights at 6/30/2019 0,0% 0,0% 24,5% 29,8% 59,0% 7,8% 0,6% 66,5% 10,0% 0,7% 0,4% 0,7% Total: 7,857,732 shares J. Séché Total: 10,146,135 voting rights J. Séché Séché Group (family holding company
Slide 39: Disclaimer
DISCLAIMER THIS DOCUMENT MAY CONTAIN INFORMATION OF A PROVISIONAL NATURE. THIS INFORMATION REPRESENTS EITHER TRENDS OR TARGETS AT THE DATE OF THIS DOCUMENT'S CREATION AND MAY NOT BE CONSIDERED AS RESULTS FORECASTS OR AS ANY OTHER TYPE OF PERFORMANCE INDICATORS. THIS INFORMATION IS BY NATURE SUBJECT
Source: Internet Archive copy of groupe-seche.com
More decks from Seche Environnement SA
 Groupe Séché Environnement — Q3 2026 Earnings Presentation13 slides · Oct 27, 2026
 H1 2026 Earnings Presentation34 slides · Sep 9, 2026
 H1 2026 Earnings Presentation34 slides · Sep 9, 2026
 Q1 2026 Earnings Presentation10 slides · Apr 23, 2026
 FY2025 Earnings Presentation43 slides · Mar 10, 2026
 Q3 2025 Earnings Presentation13 slides · Oct 28, 2025