Kingfisher PLC · LSE:KGF
Kingfisher — FY2016/17 Earnings Presentation
41 slides from Kingfisher's earnings presentation, Mar 28, 2017
Slide 1: Kingfisher plc Final Results
KINGFISHER PLC FINAL RESULTS Year ended 31 January 2017
Slide 2: Disclaimer
Disclaimer You are not to construe the content of this presentation as investment, legal or tax advice and you should make you own evaluation of the Company and the market. If you are in any doubt about the contents of this presentation or the action you should take, you should consult a person auth
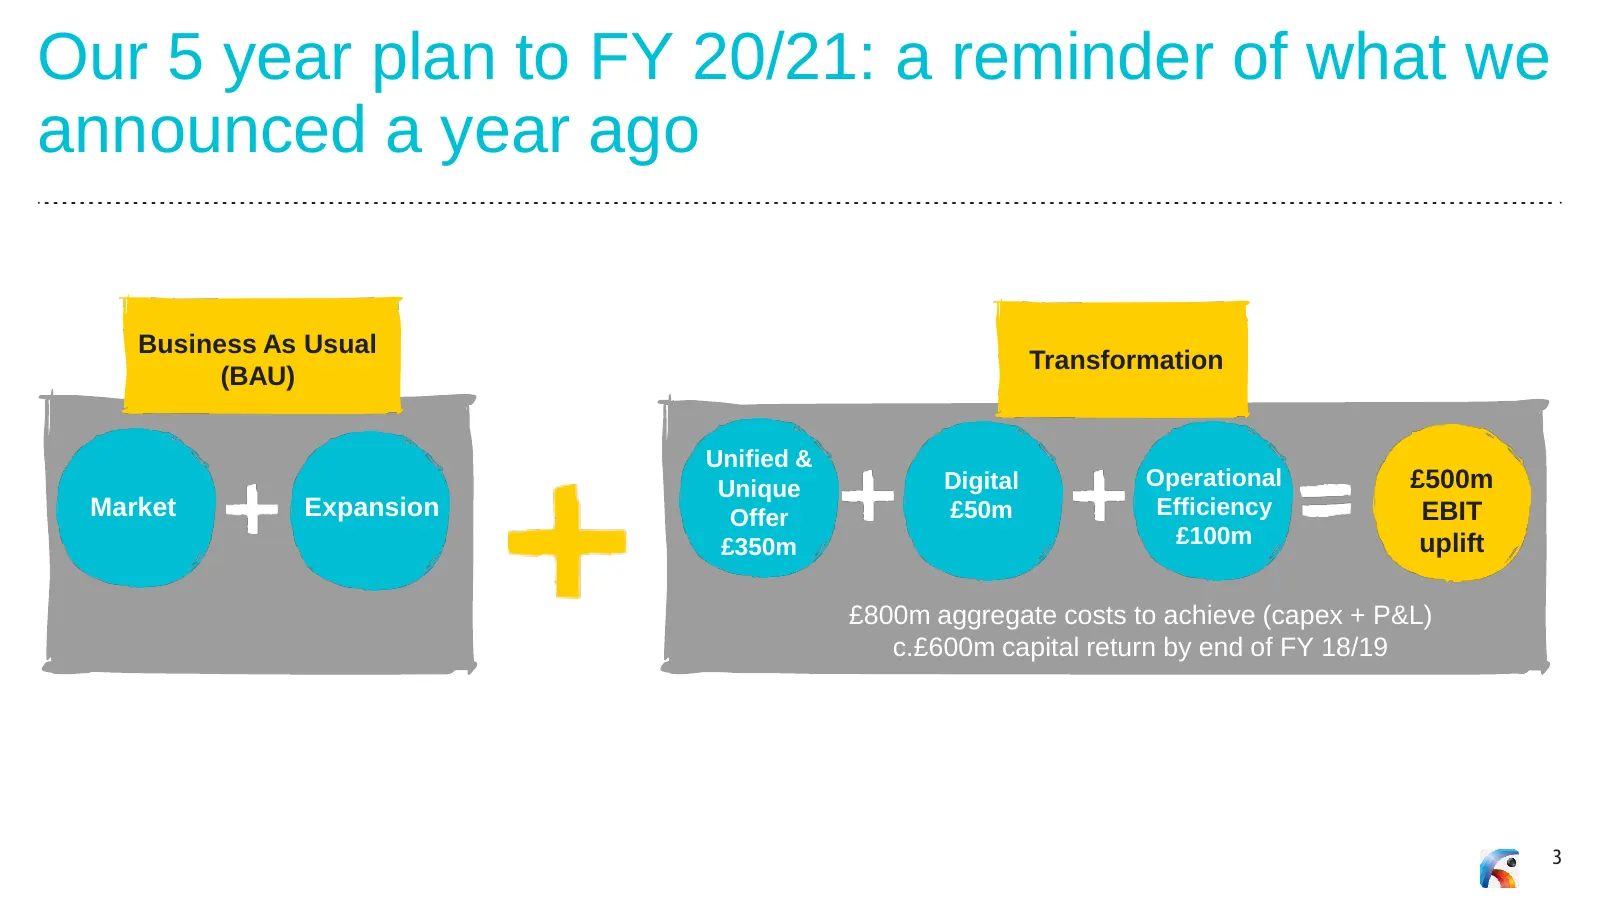
Slide 3: Our 5 year plan to FY 20/21: a reminder
Our 5 year plan to FY 20/21: a reminder of what we announced a year ago Business As Usual Transformation (BAU) Unified & Unique Digital Operational £500m Market Expansion Offer £50m Efficiency EBIT £350m £100m uplift £800m aggregate costs to achieve (capex + P&L) c.£600m capital return by end of FY
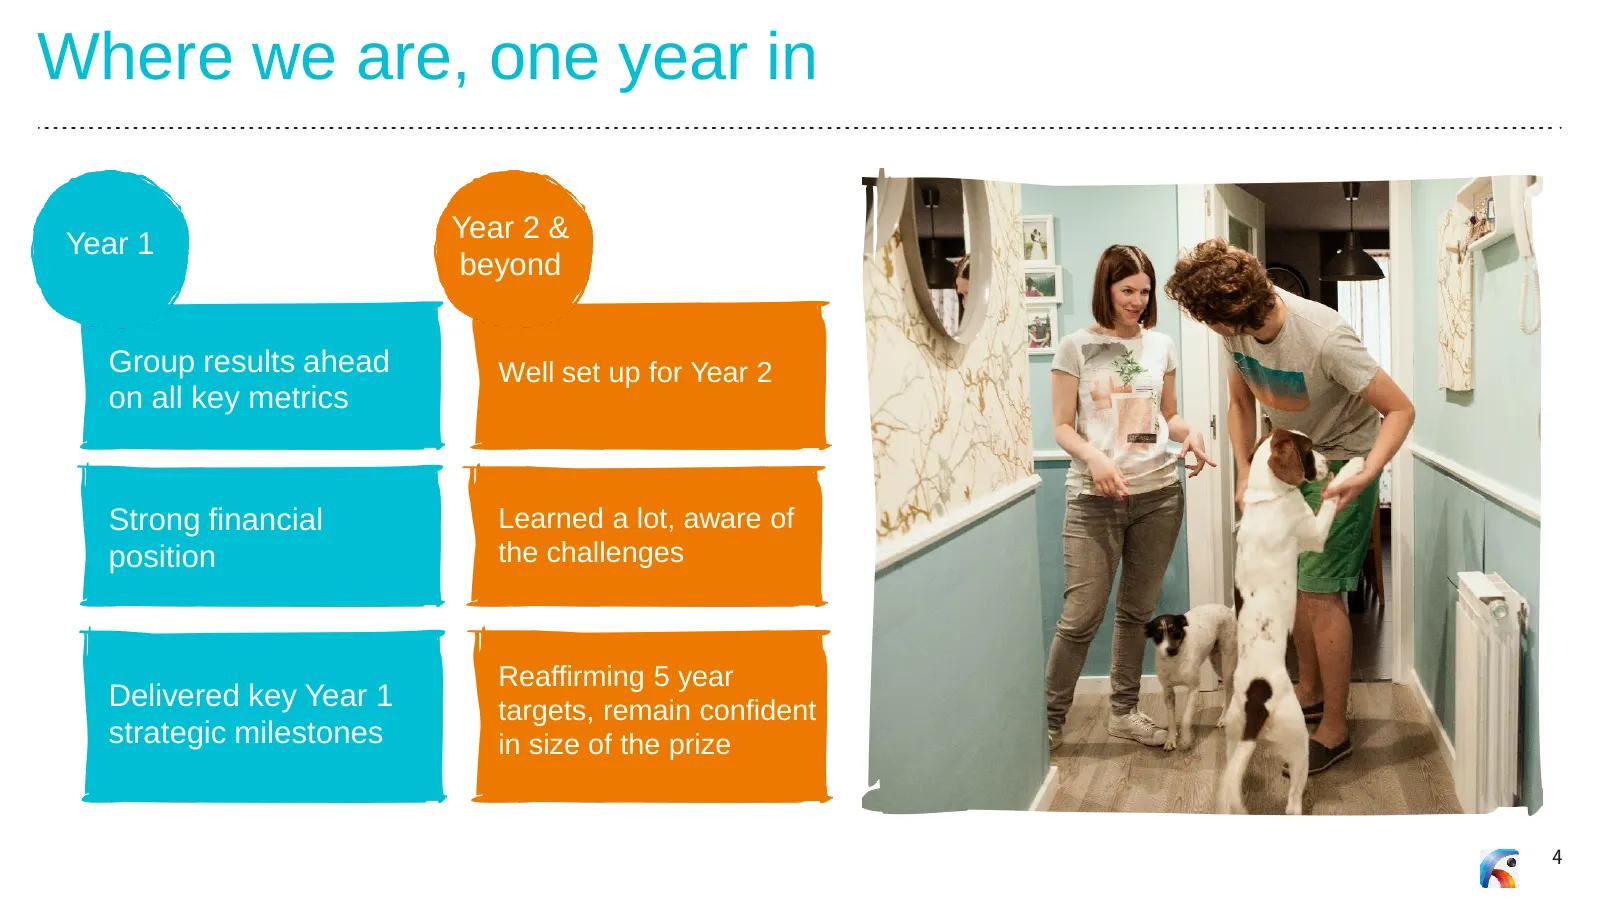
Slide 4: Where we are, one year in
Where we are, one year in Year 2 & Year 1 beyond Group results ahead Well set up for Year 2 on all key metrics Strong financial Learned a lot, aware of position the challenges Reaffirming 5 year Delivered key Year 1 targets, remain confident strategic milestones in size of the prize 4

Slide 5: Year 1
Year 1 5
Slide 6: Financial summary: income statement
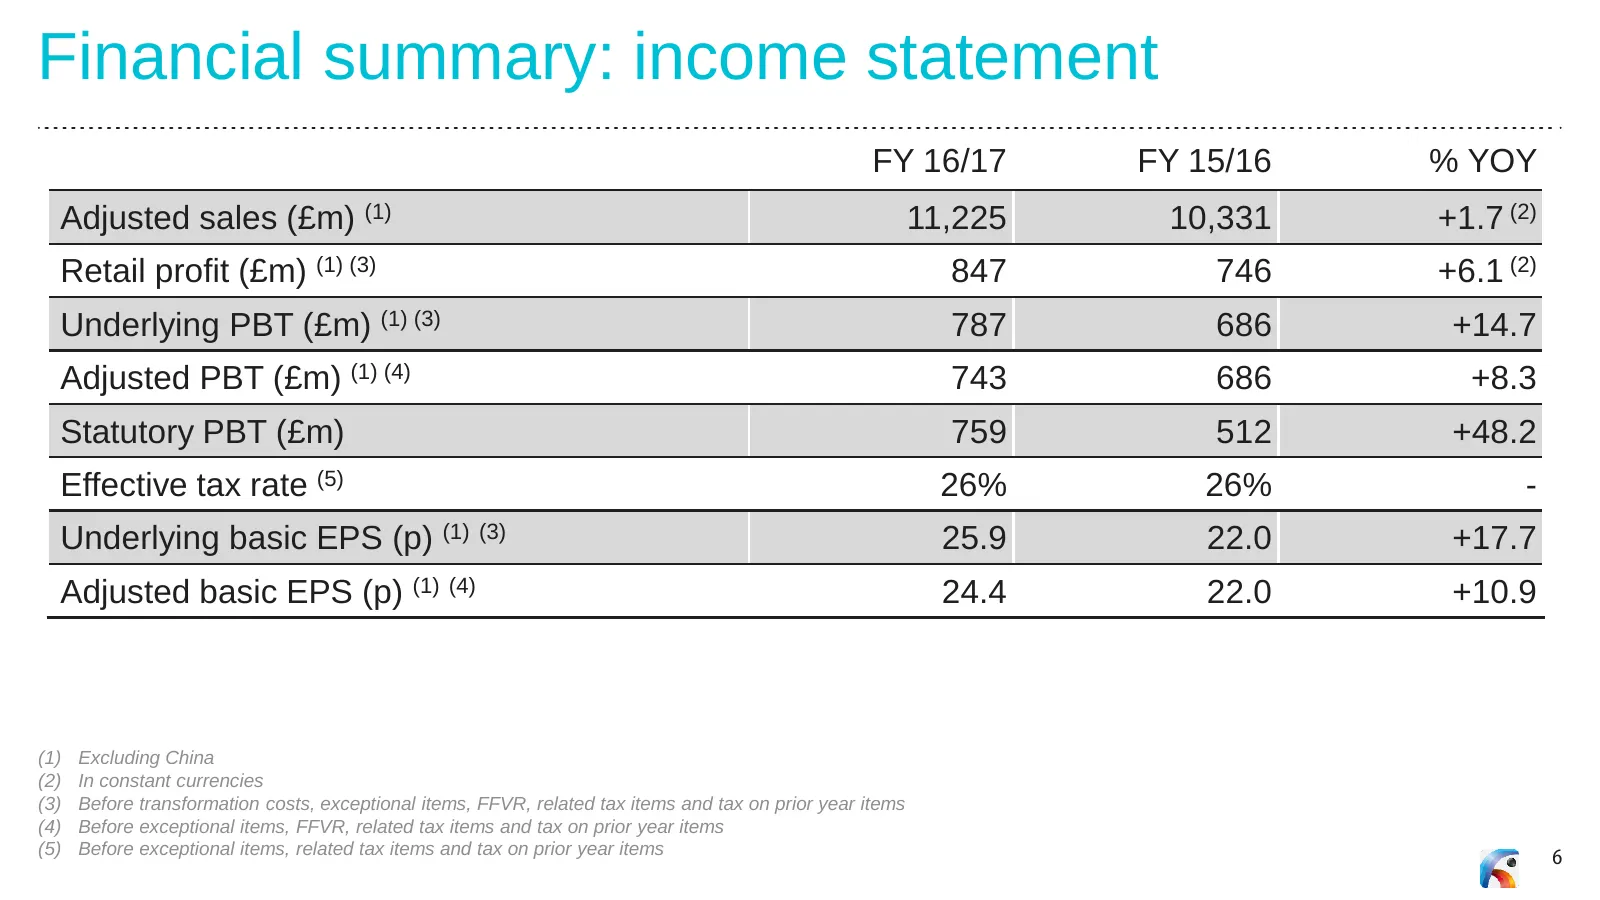
Financial summary: income statement FY 16/17 FY 15/16 % YOY Adjusted sales (£m) (1) 11,225 10,331 +1.7 (2) Retail profit (£m) (1) (3) 847 746 +6.1 (2) Underlying PBT (£m) (1) (3) 787 686 +14.7 Adjusted PBT (£m) (1) (4) 743 686 +8.3 Statutory PBT (£m) 759 512 +48.2 Effective tax rate (5) 26% 26% - Un
Slide 7: Year 1 PBT bridge
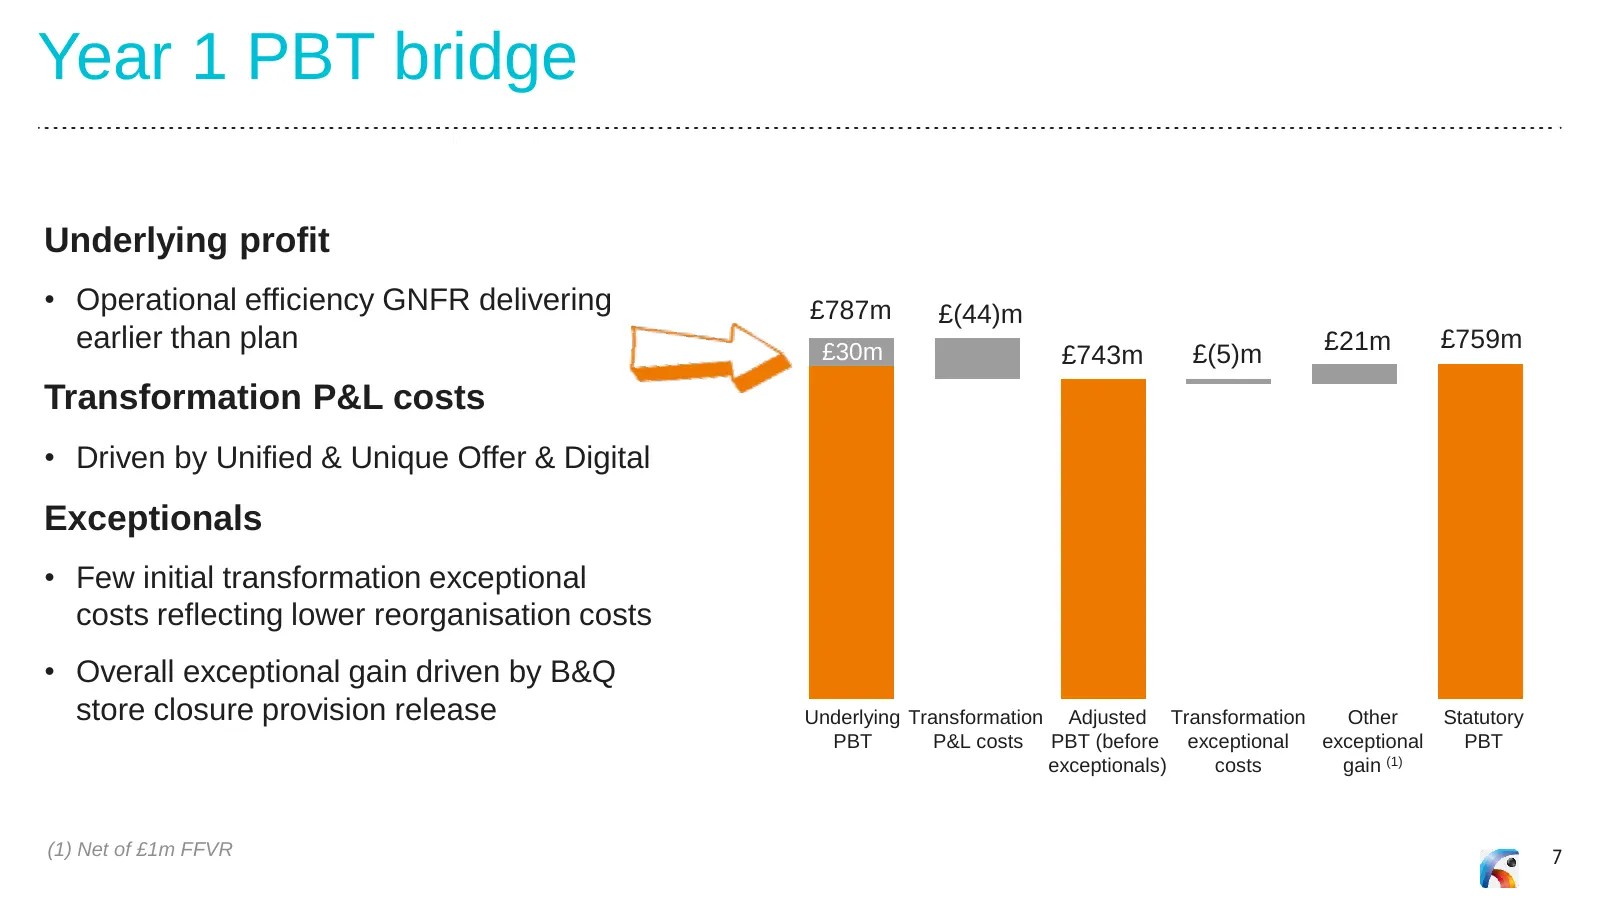
Year 1 PBT bridge Underlying profit • Operational efficiency GNFR delivering £787m £(44)m earlier than plan £30m £21m £759m £743m £(5)m Transformation P&L costs • Driven by Unified & Unique Offer & Digital Exceptionals • Few initial transformation exceptional costs reflecting lower reorganisation co
Slide 8: Group operational highlights
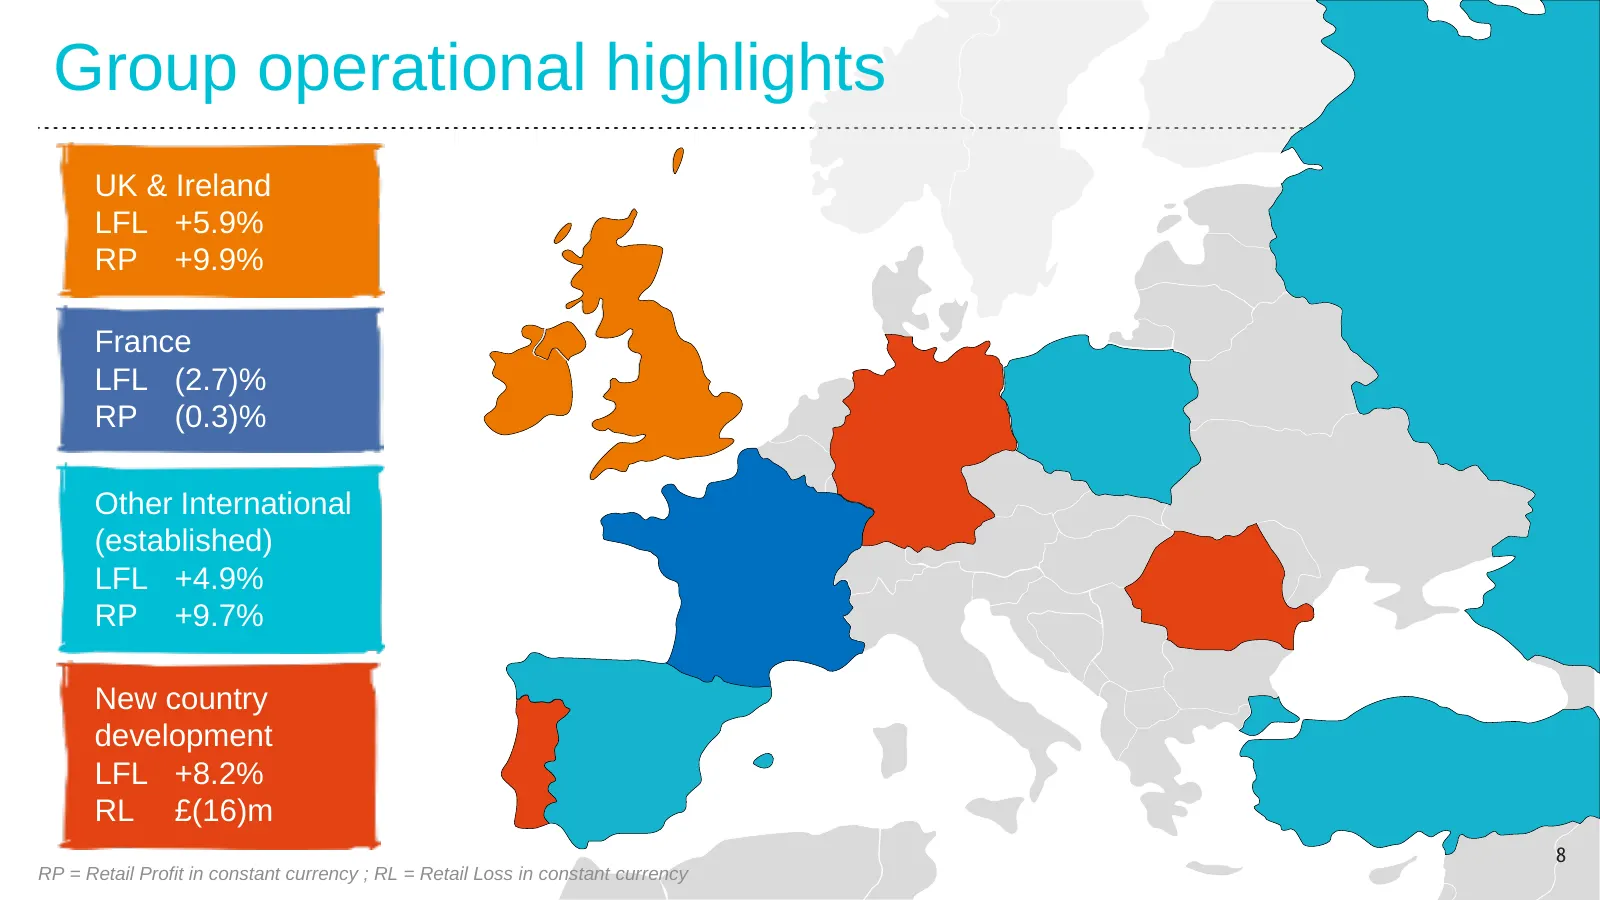
Group operational highlights UK & Ireland LFL +5.9% RP +9.9% France LFL (2.7)% RP (0.3)% Other International (established) LFL +4.9% RP +9.7% New country development LFL +8.2% RL £(16)m 88 RP = Retail Profit in constant currency ; RL = Retail Loss in constant currency
Slide 9: Financial summary: cash and returns
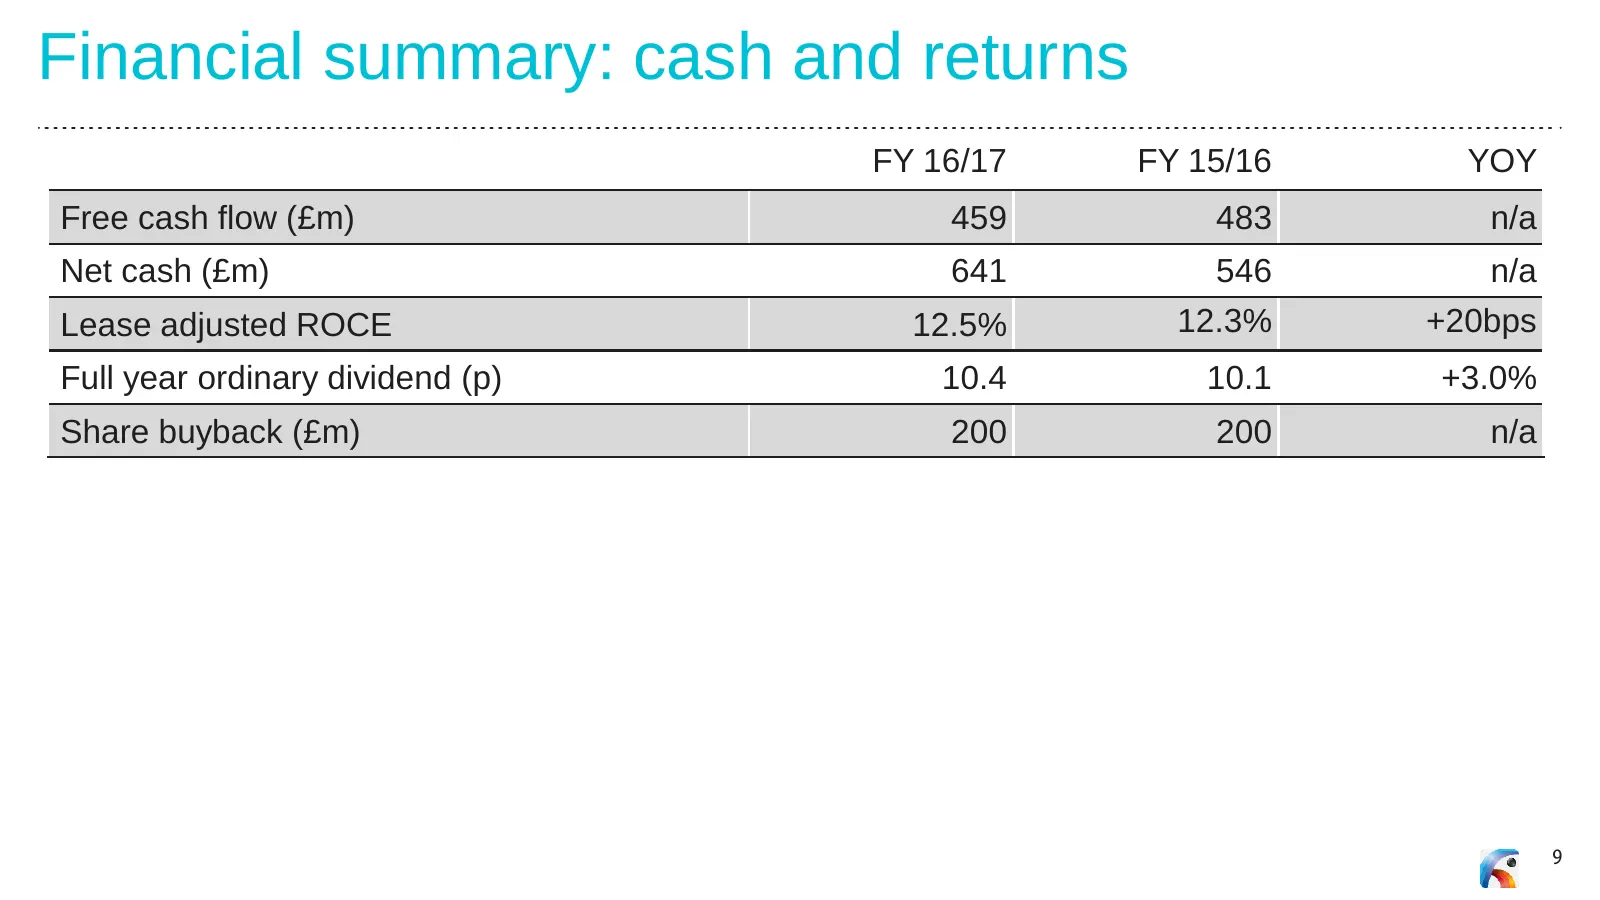
Financial summary: cash and returns FY 16/17 FY 15/16 YOY Free cash flow (£m) 459 483 n/a Net cash (£m) 641 546 n/a Lease adjusted ROCE 12.5% 12.3% +20bps Full year ordinary dividend (p) 10.4 10.1 +3.0% Share buyback (£m) 200 200 n/a 9
Slide 10: Uses of operating cash flow
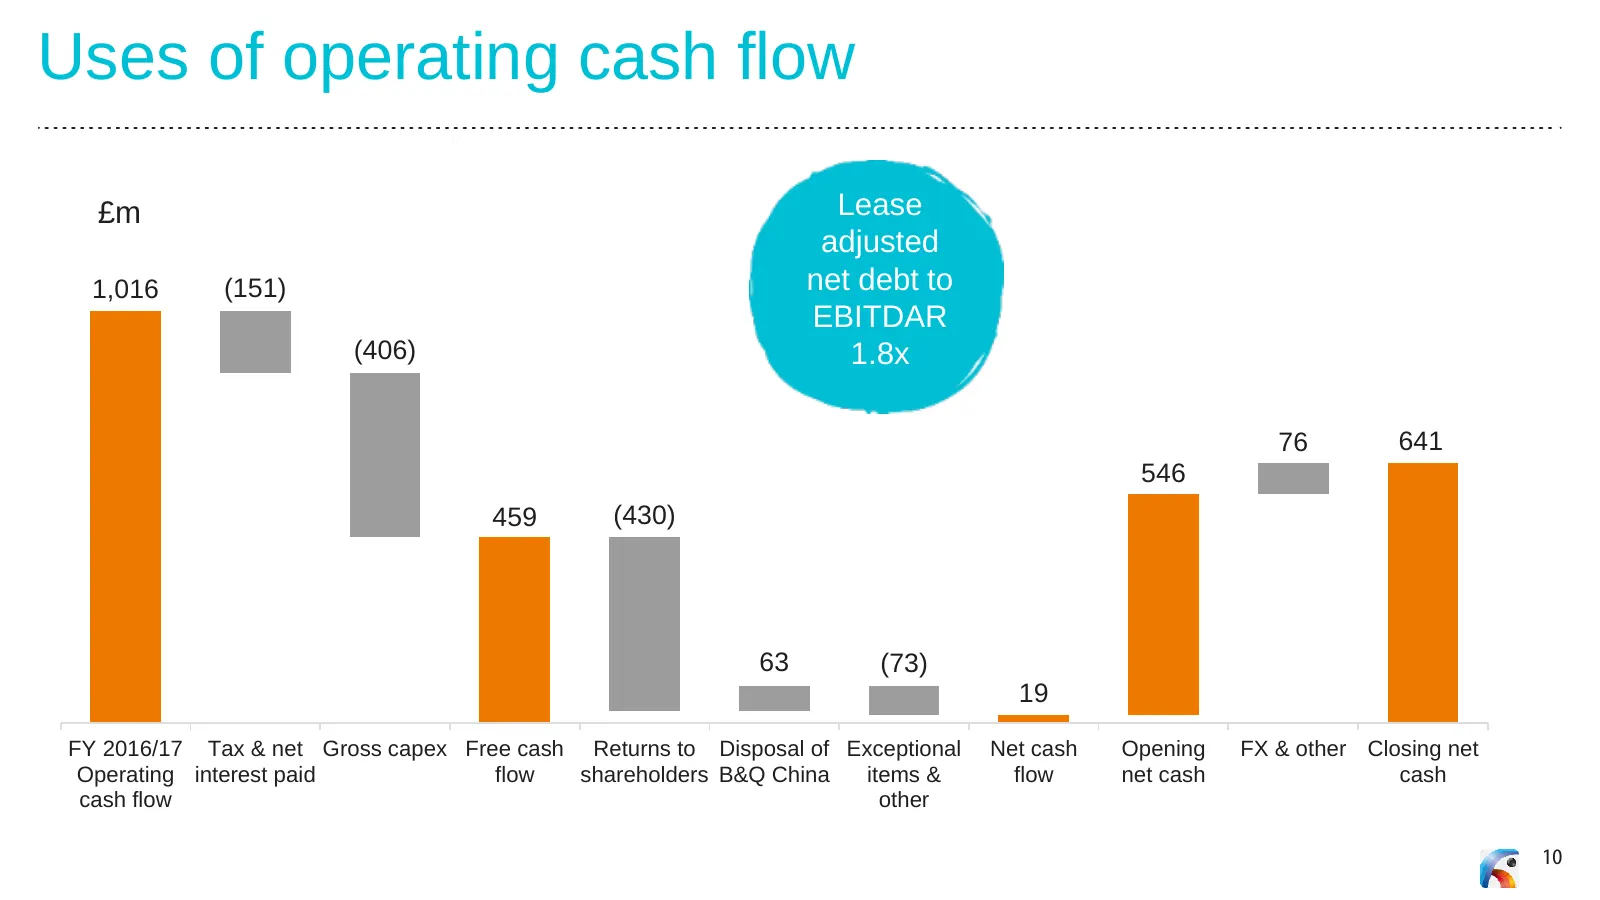
Uses of operating cash flow £m Lease adjusted 1,016 (151) net debt to EBITDAR (406) 1.8x 76 641 546 459 (430) 63 (73) 19 FY 2016/17 Tax & net Gross capex Free cash Returns to Disposal of Exceptional Net cash Opening FX & other Closing net Operating interest paid flow shareholders B&Q China items & f
Slide 11: Delivered key Year 1 strategic milestones
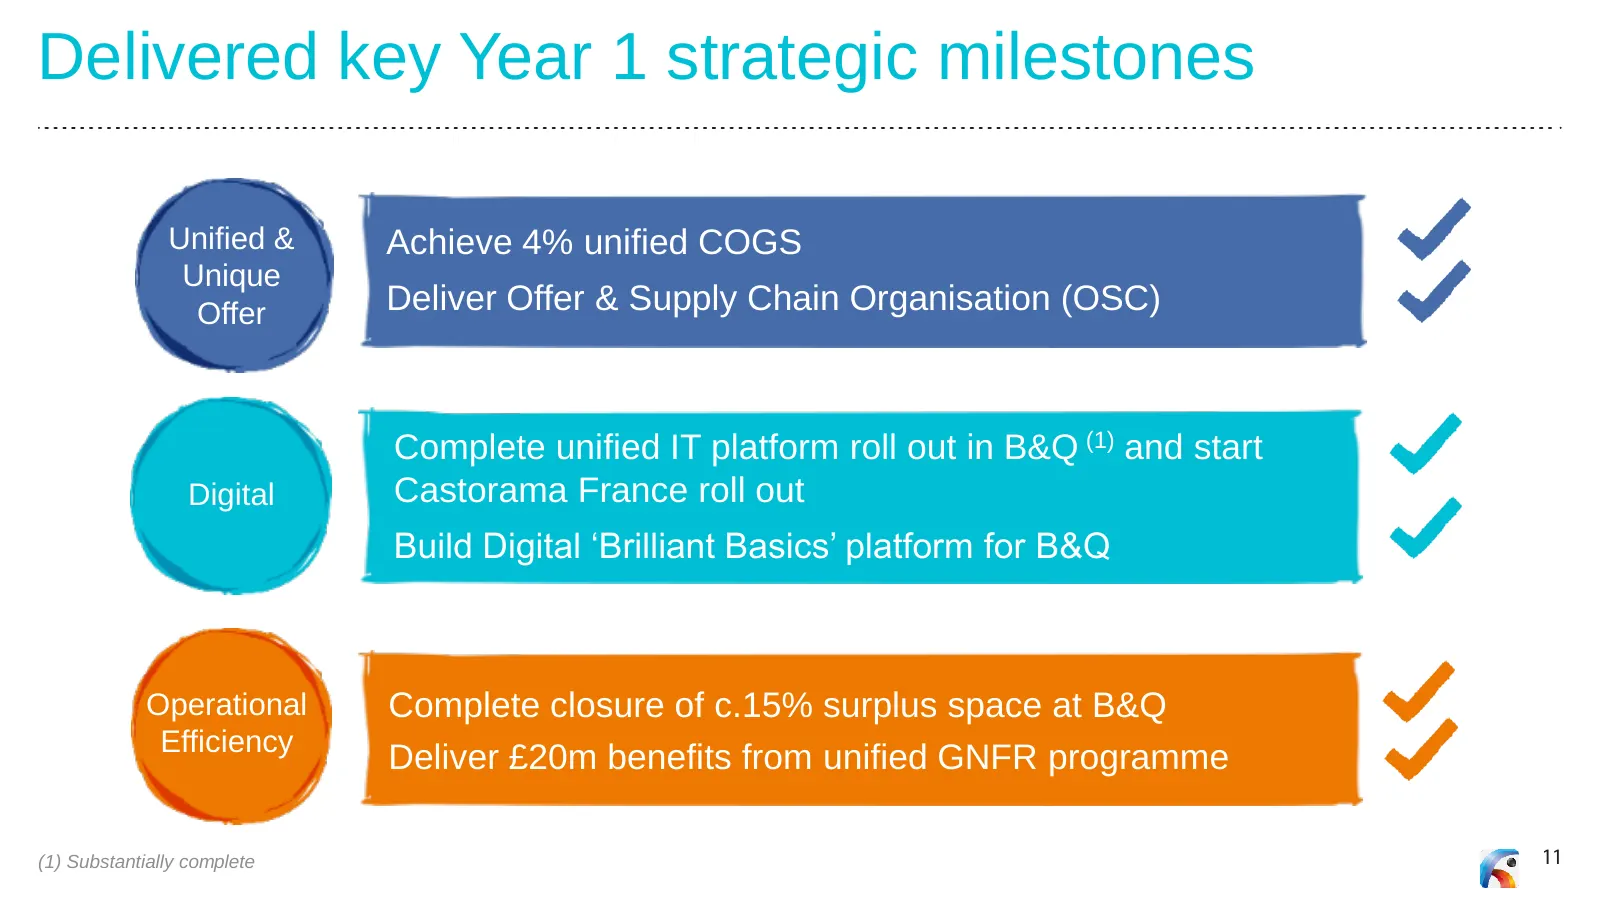
Delivered key Year 1 strategic milestones Unified & Achieve 4% unified COGS Unique Offer Deliver Offer & Supply Chain Organisation (OSC) Complete unified IT platform roll out in B&Q (1) and start Digital Castorama France roll out Build Digital ‘Brilliant Basics’ platform for B&Q Operational Complete
Slide 12: Unified ranges: where we are
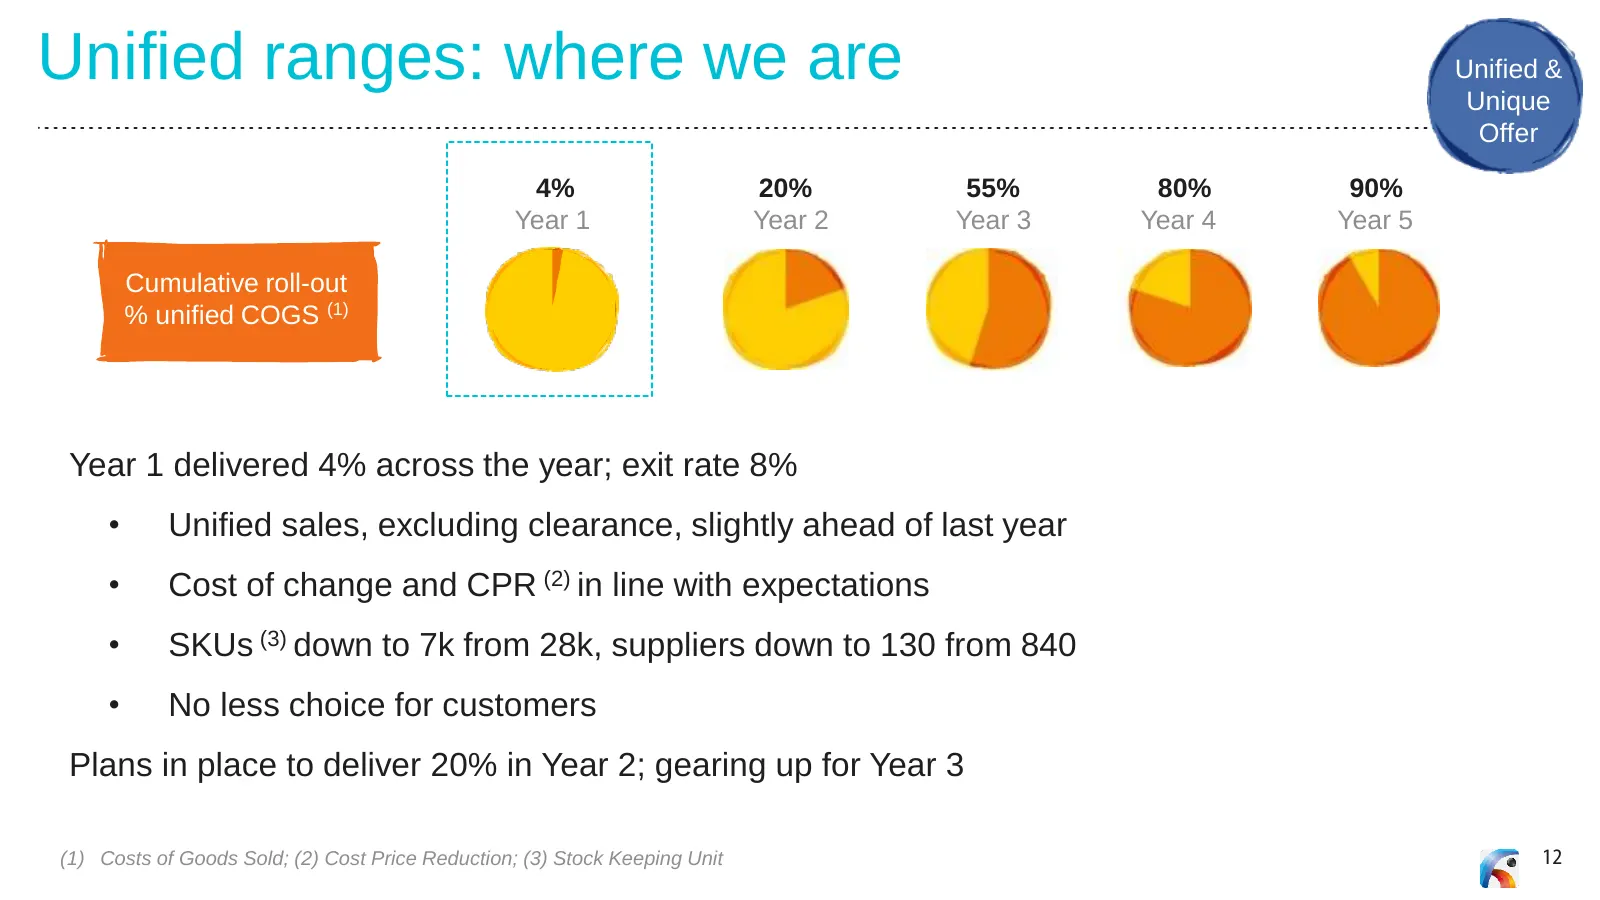
Unified ranges: where we are Unified & Unique Offer 4% 20% 55% 80% 90% Year 1 Year 2 Year 3 Year 4 Year 5 Cumulative roll-out % unified COGS (1) Year 1 delivered 4% across the year; exit rate 8% • Unified sales, excluding clearance, slightly ahead of last year • Cost of change and CPR (2) in line wi
Slide 13: First unique ranges landing in stores
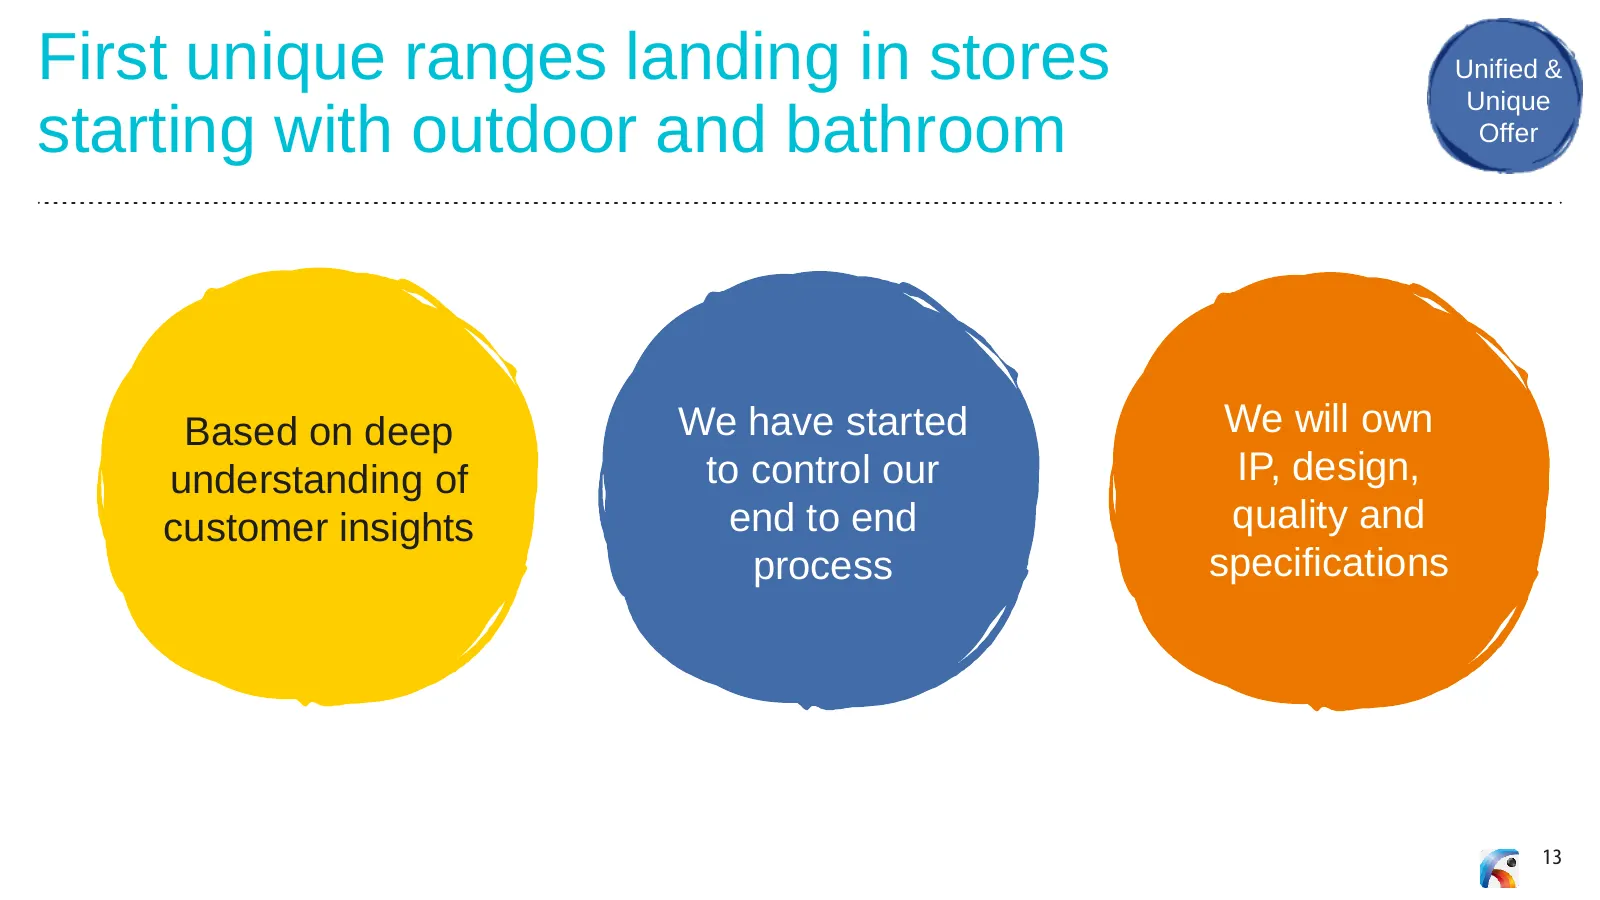
First unique ranges landing in stores Unified & Unique starting with outdoor and bathroom Offer Based on deep We have started We will own understanding of to control our IP, design, customer insights end to end quality and process specifications 13
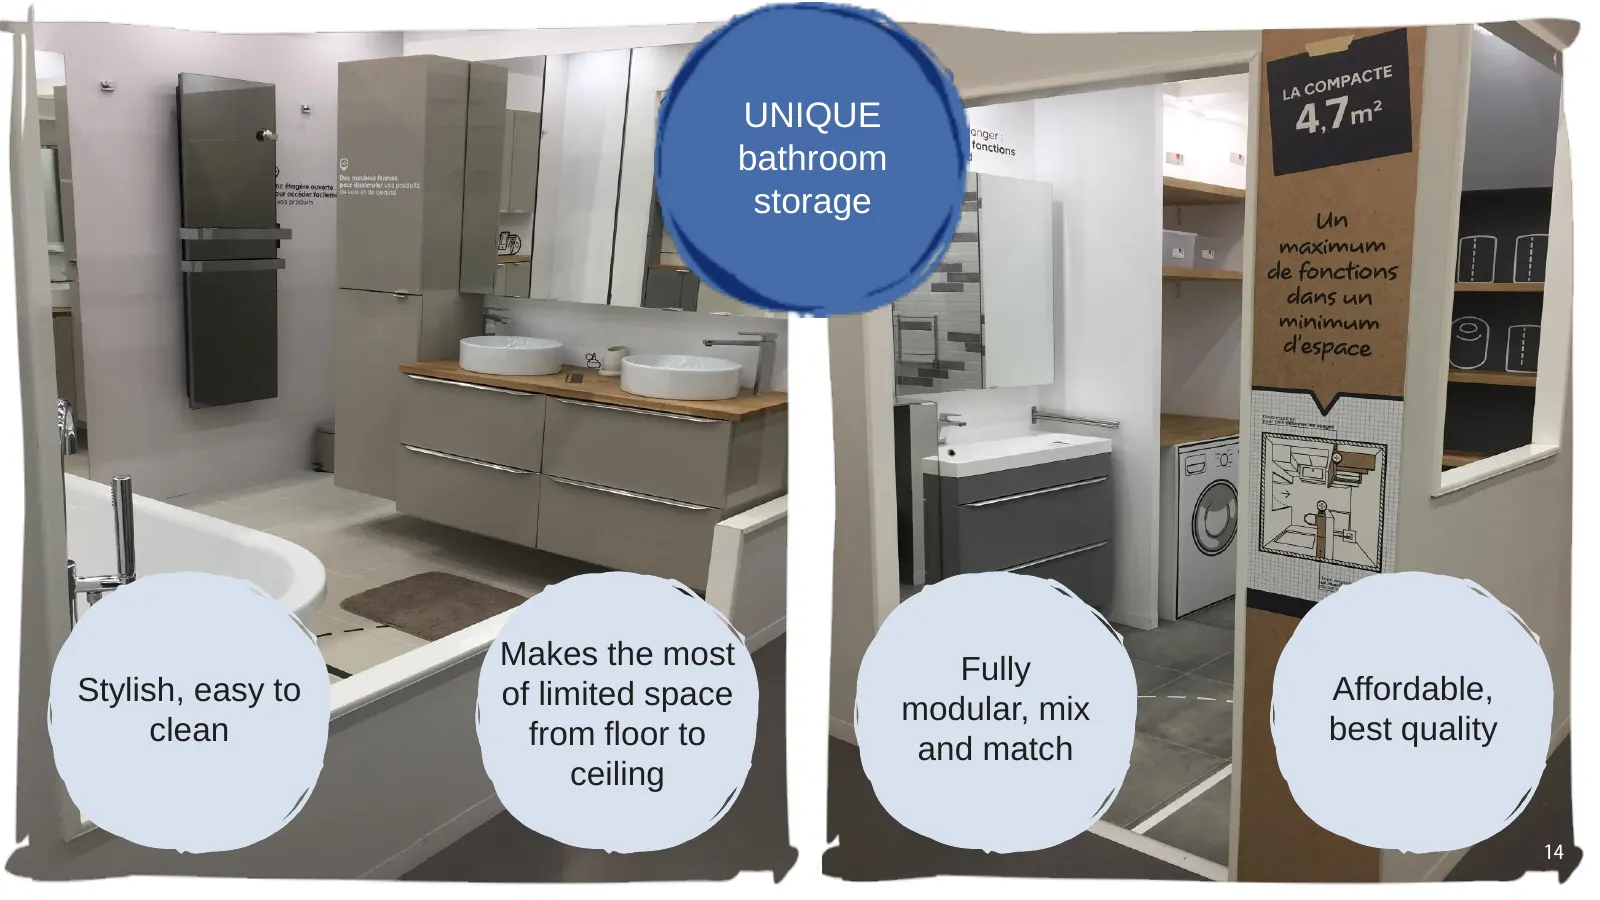
Slide 14: Unique bathroom storage
UNIQUE bathroom storage Makes the most Fully Stylish, easy to of limited space Affordable, modular, mix clean from floor to best quality and match ceiling 14
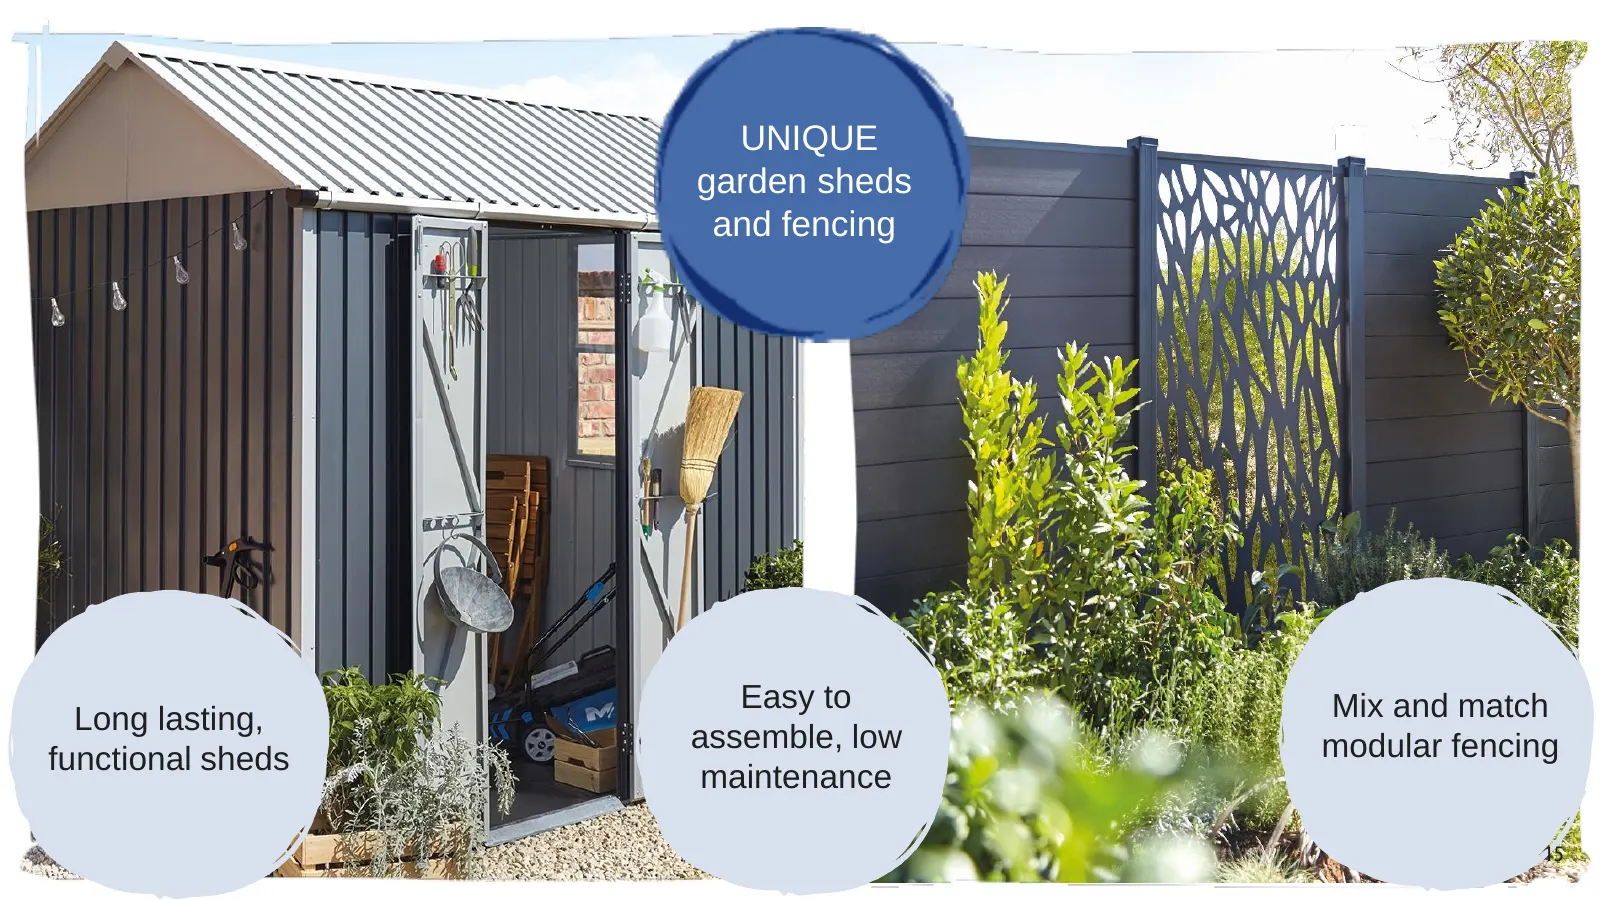
Slide 15: Unique garden sheds and fencing
UNIQUE garden sheds and fencing • Mix and match, low maintenance, easy to install and uninstall modular fencing • Easy to plan, easy to install and low maintenance flexibly sized ‘Little House’ shed • Easy to store and space efficient furniture Easy to Mix and match Long lasting, assemble, low modul
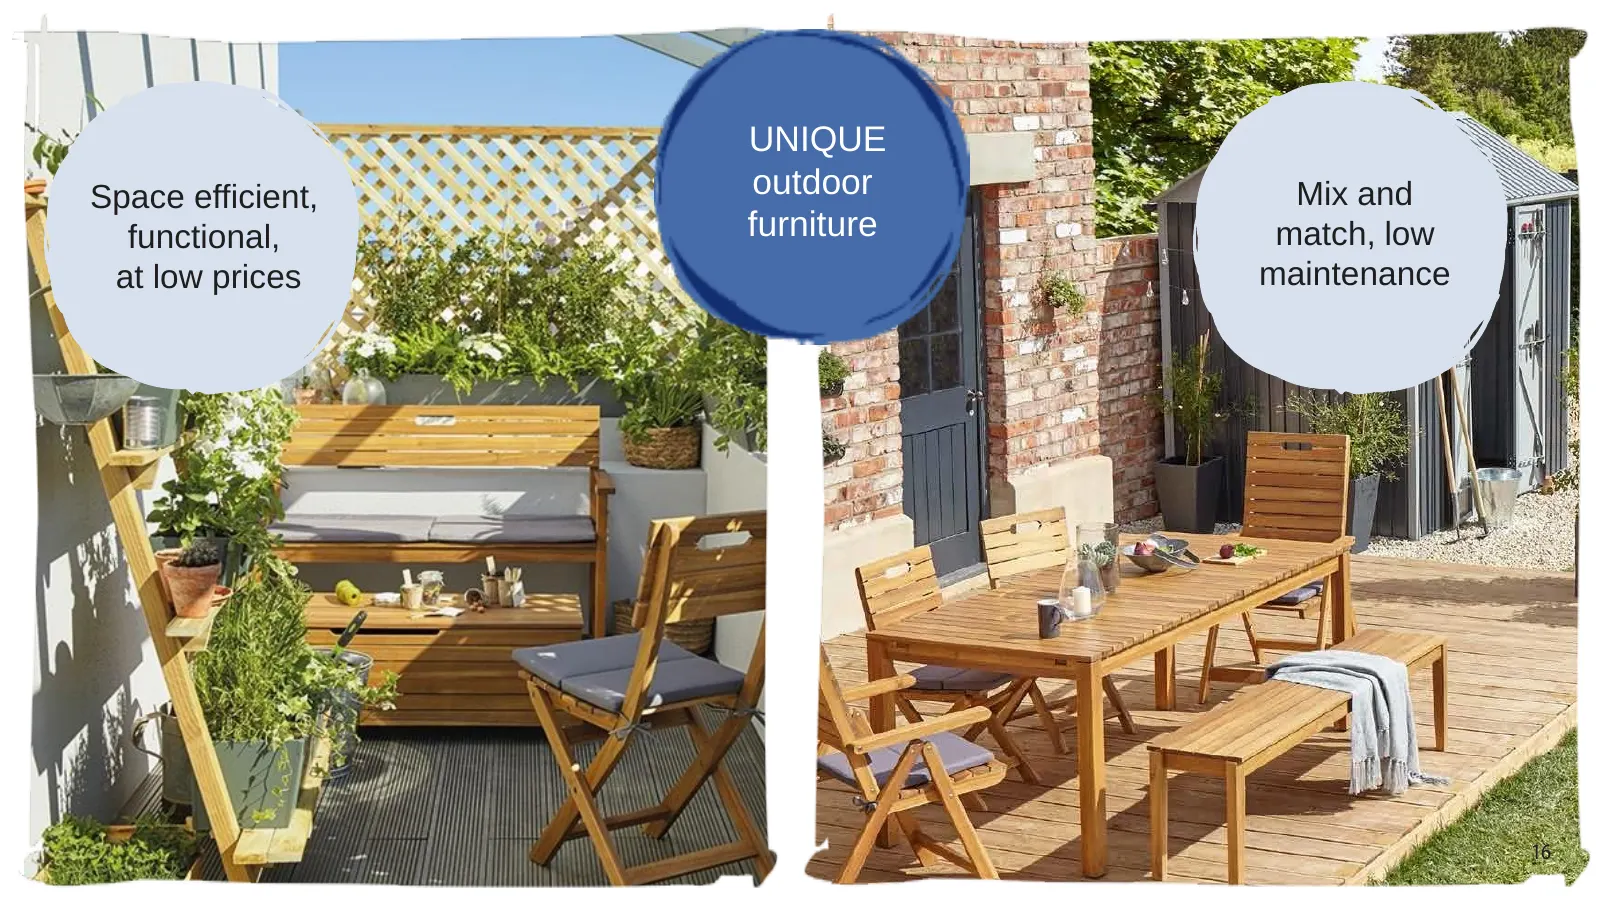
Slide 16: Space efficient, functional, at low prices
UNIQUE Space efficient, outdoor Mix and functional, furniture match, low at low prices maintenance 16
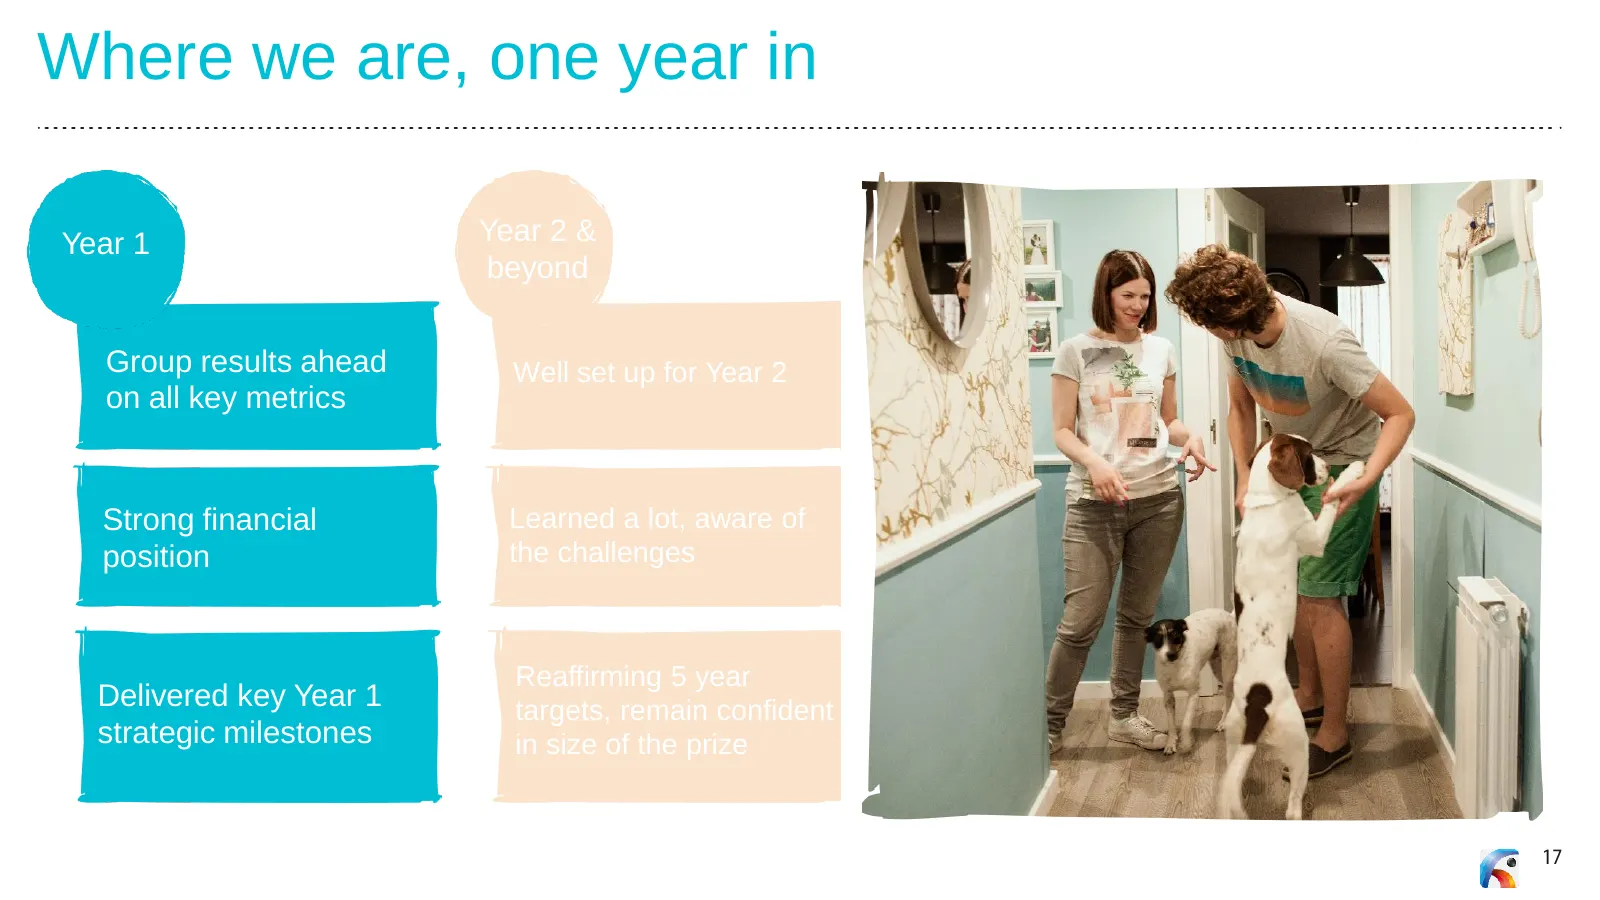
Slide 17: Where we are, one year in
Where we are, one year in Year 1 Year 2 & beyond Group results ahead Well set up for Year 2 on all key metrics Strong financial Learned a lot, aware of position the challenges Reaffirming 5 year Delivered key Year 1 targets, remain confident strategic milestones in size of the prize 17
Slide 18: Where we are, one year in
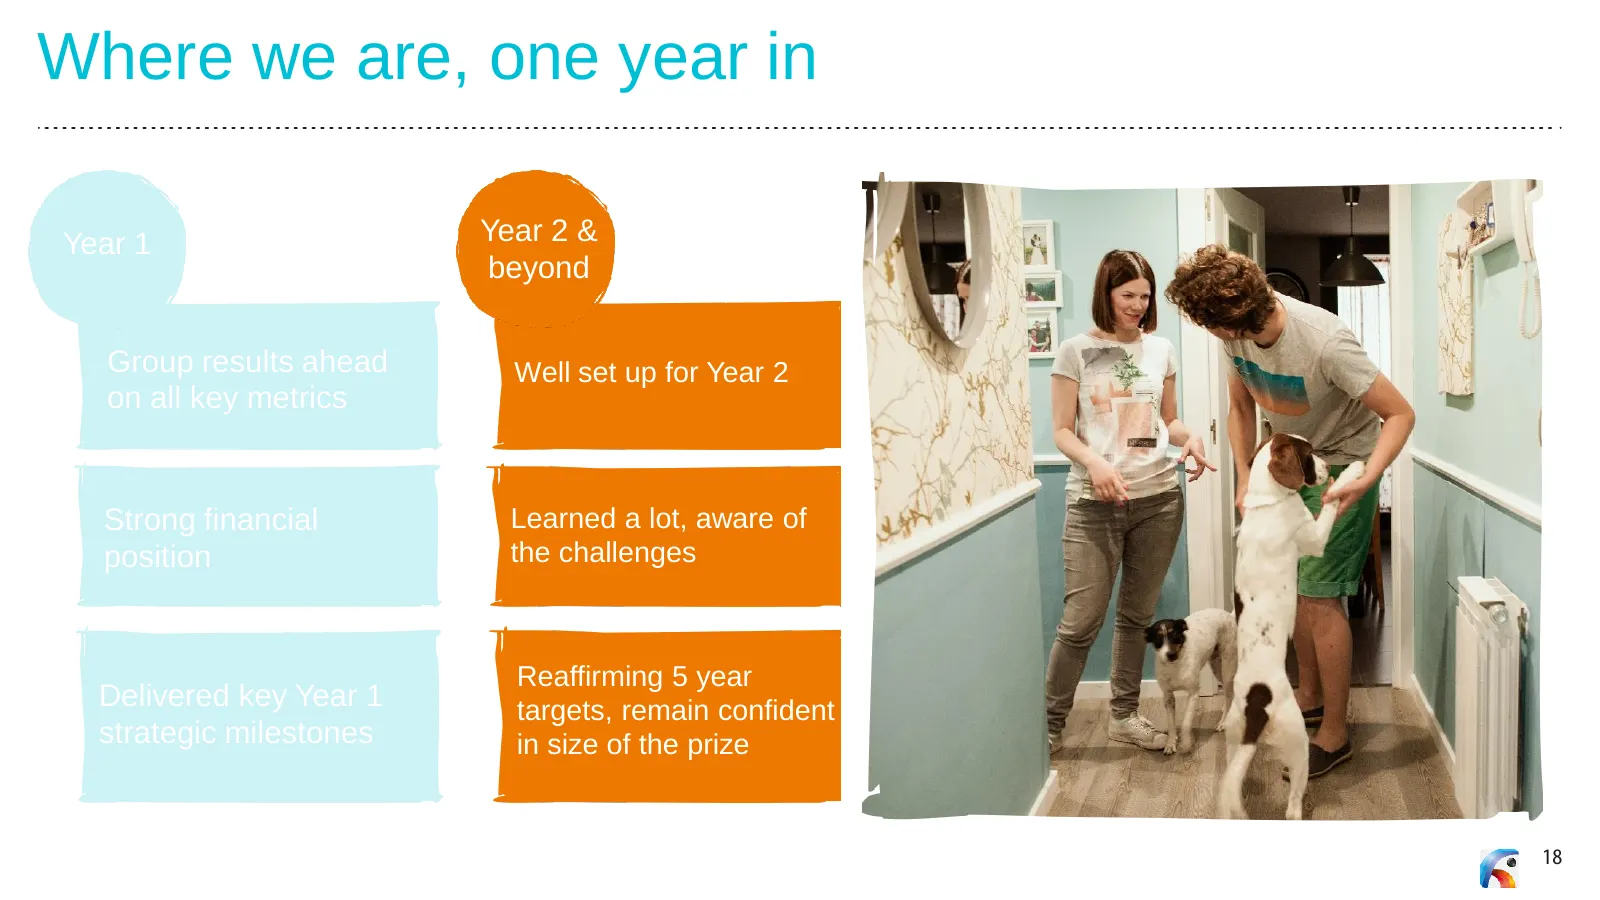
Where we are, one year in Year 1 Year 2 & beyond Group results ahead Well set up for Year 2 on all key metrics Strong financial Learned a lot, aware of position the challenges Reaffirming 5 year Delivered key Year 1 targets, remain confident strategic milestones in size of the prize 18
Slide 19: Year 2 & beyond
Year 2 & beyond 19
Slide 20: Clear long term roadmap
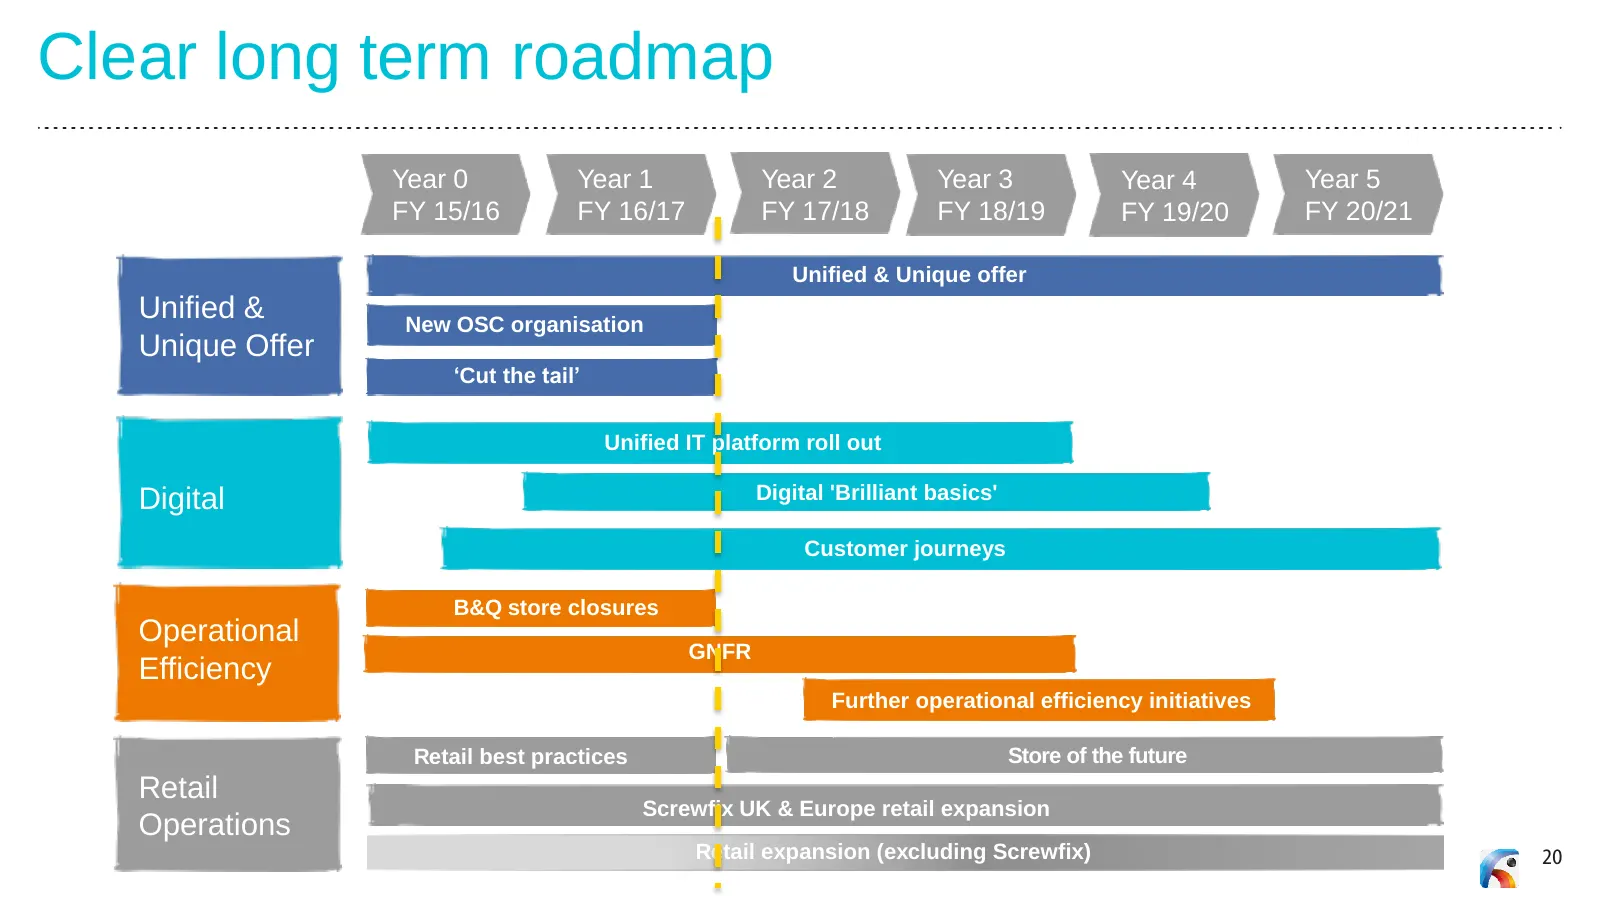
Clear long term roadmap Year 0 Year 1 Year 2 Year 3 Year 4 Year 5 FY 15/16 FY 16/17 FY 17/18 FY 18/19 FY 19/20 FY 20/21 Unified & Unique offer Unified & New OSC organisation Unique Offer ‘Cut the tail’ Unified IT platform roll out Digital Digital 'Brilliant basics' Customer journeys B&Q store closur
Slide 21: Well set up to deliver Year 2 alongside preparing for Year 3
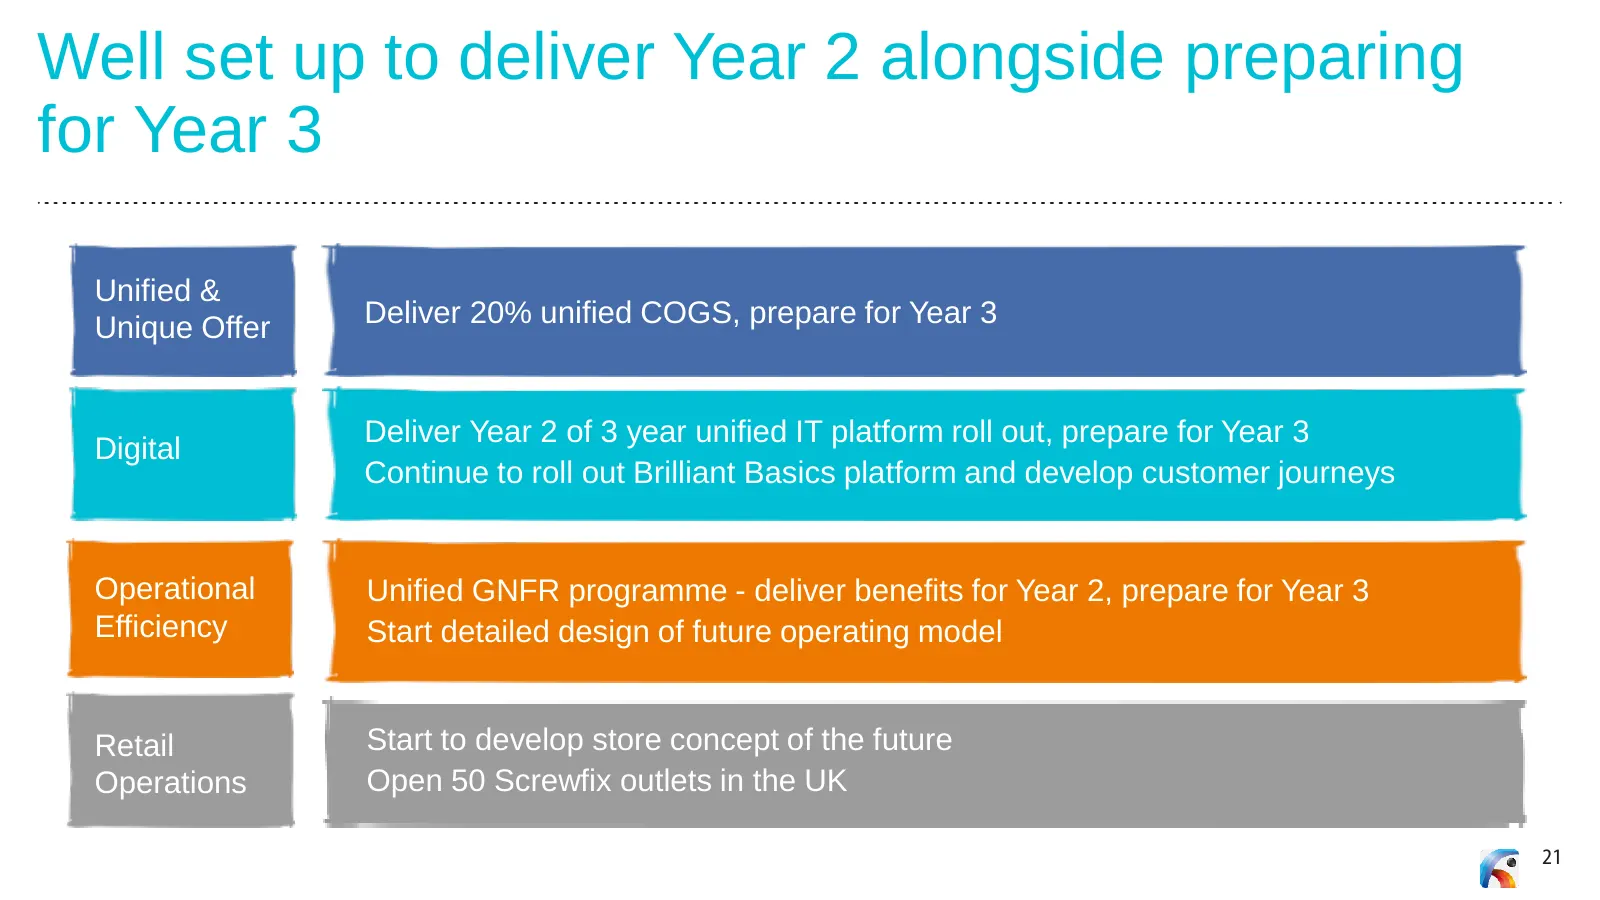
Well set up to deliver Year 2 alongside preparing for Year 3 Unified & Unique Offer Deliver 20% unified COGS, prepare for Year 3 Deliver Year 2 of 3 year unified IT platform roll out, prepare for Year 3 Digital Continue to roll out Brilliant Basics platform and develop customer journeys Operational
Slide 22: Key learnings taken on board, aware of the challenges
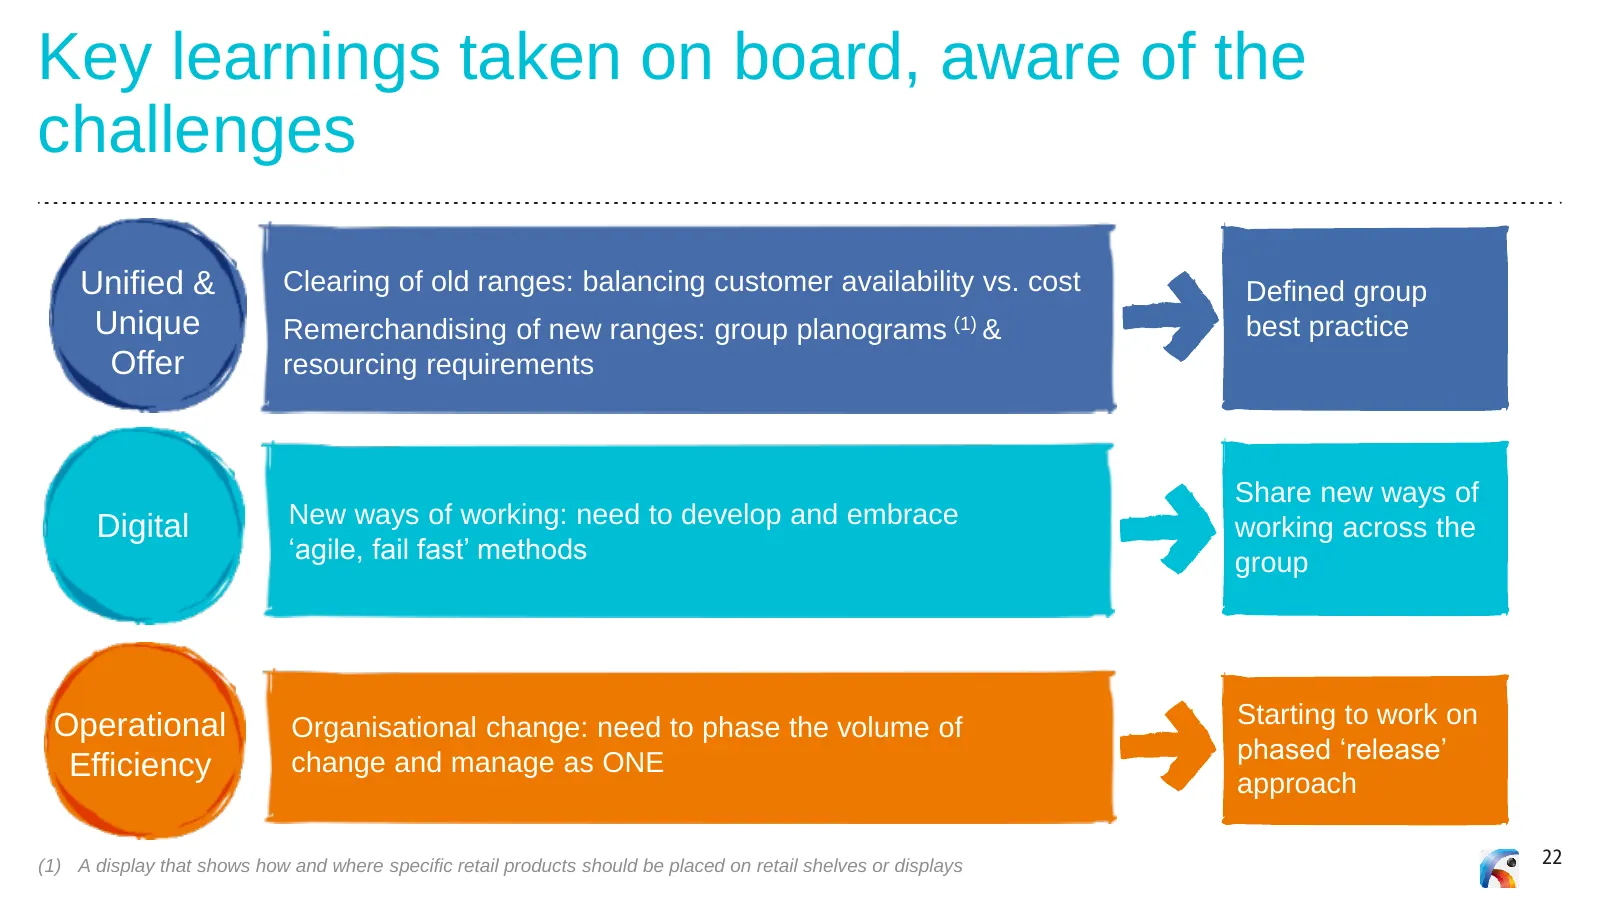
Key learnings taken on board, aware of the challenges Unified & Clearing of old ranges: balancing customer availability vs. cost Defined group Unique Remerchandising of new ranges: group planograms (1) & best practice Offer resourcing requirements Share new ways of Digital New ways of working: need
Slide 23: Scale of unified & unique change for Year 2
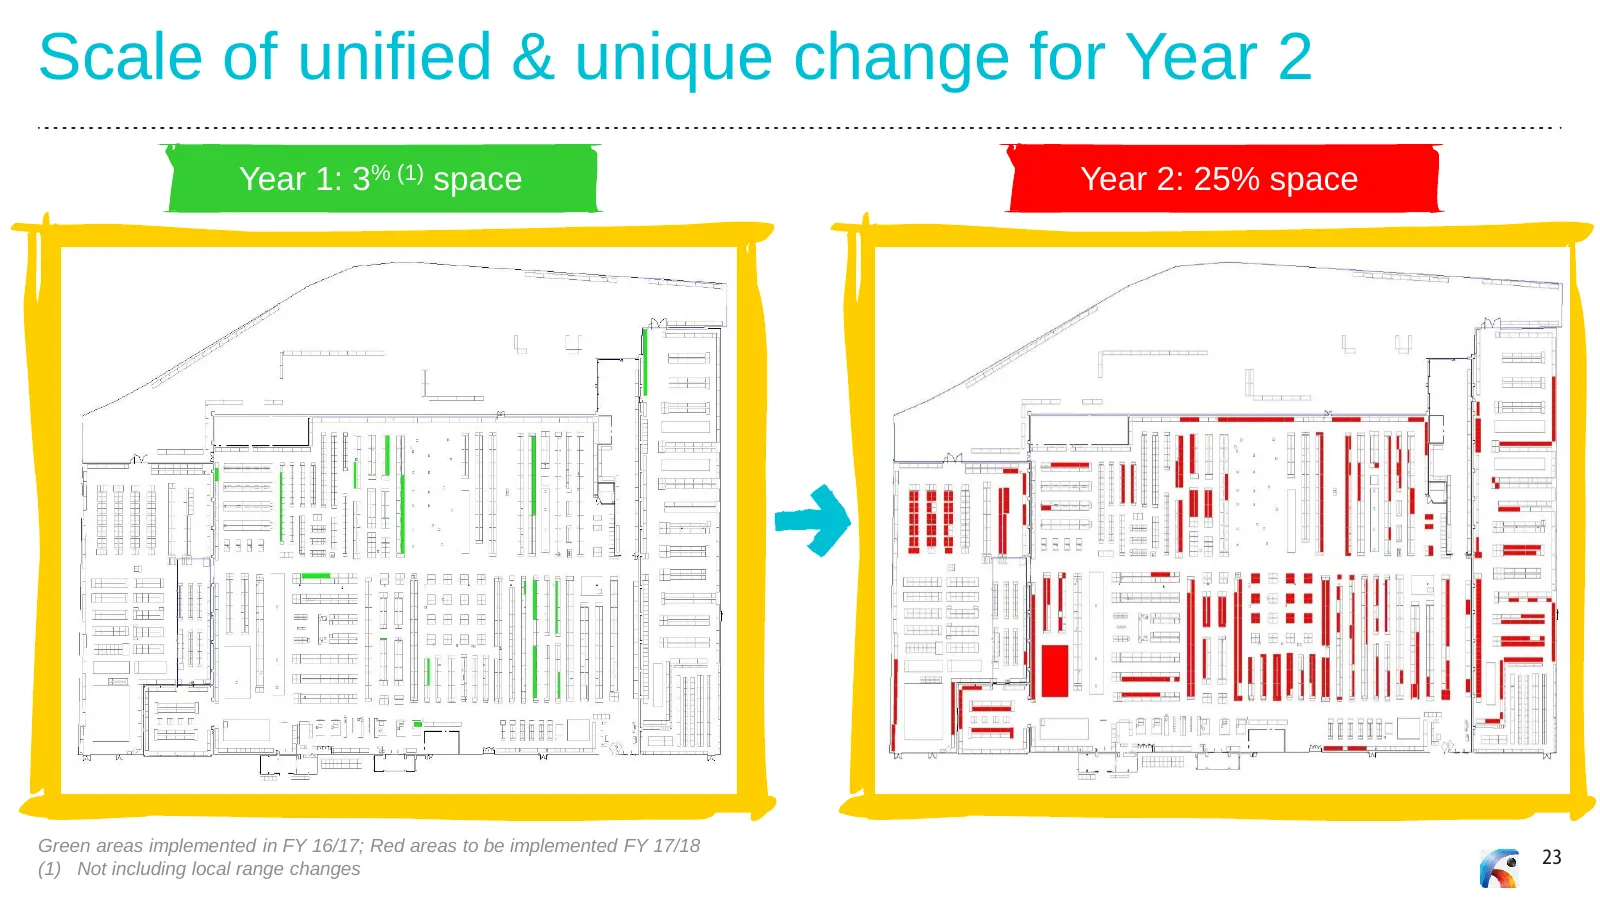
Scale of unified & unique change for Year 2 Year 1: 3% (1) space Year 2: 25% space Green areas implemented in FY 16/17; Red areas to be implemented FY 17/18 (1) Not including local range changes 23
Slide 24: Clearing of old ranges to make way for new ranges
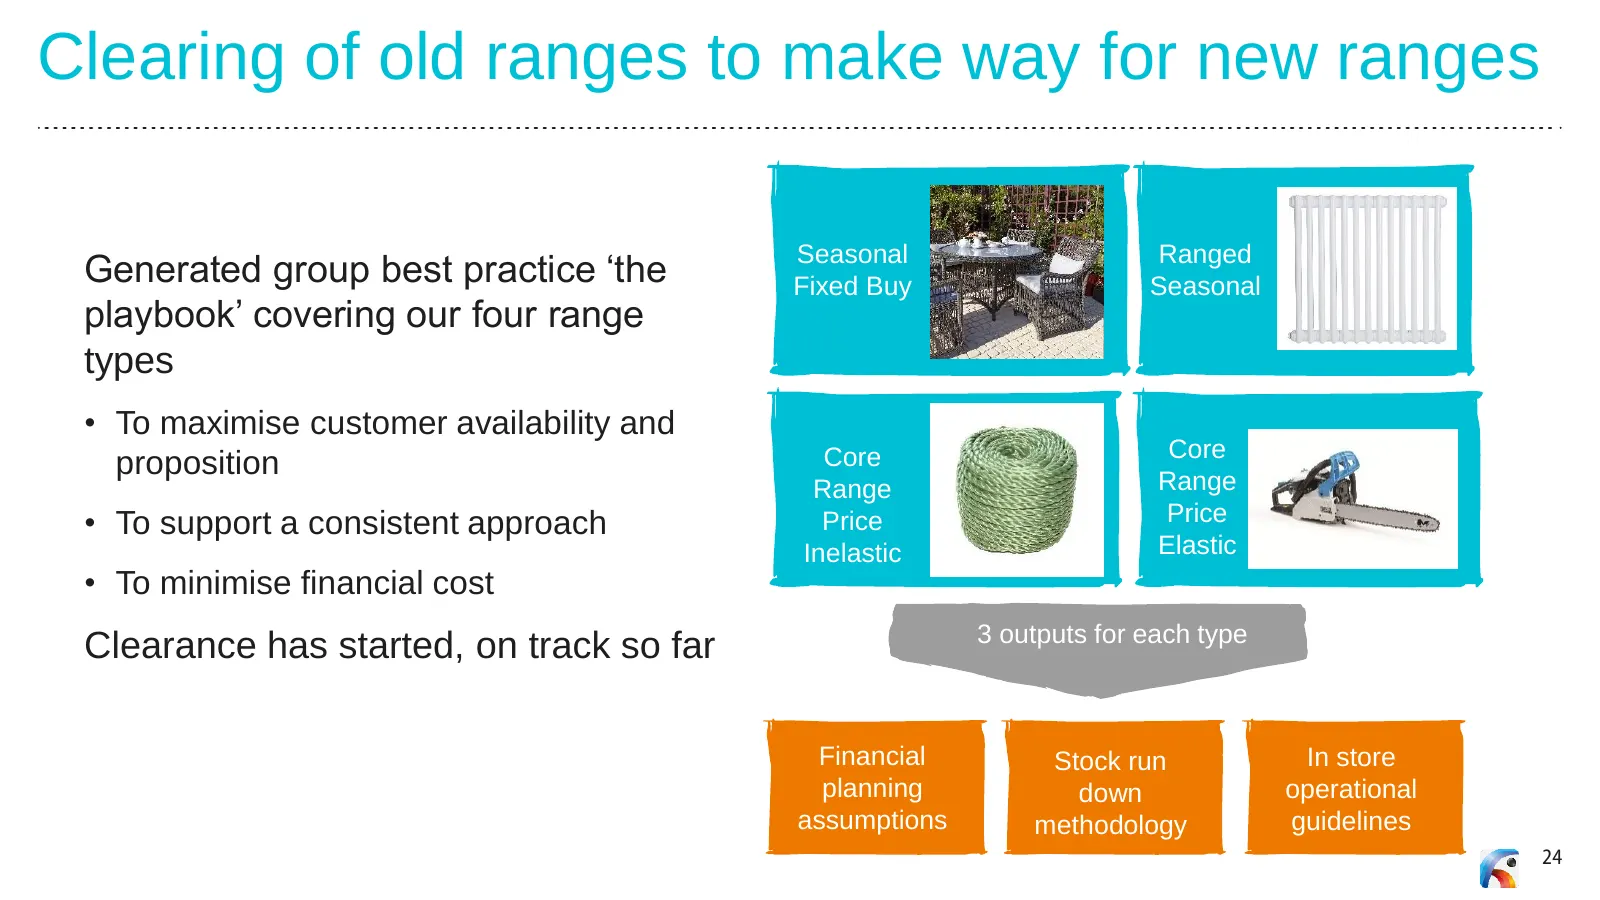
Clearing of old ranges to make way for new ranges Seasonal Ranged Generated group best practice ‘the Fixed Buy Seasonal playbook’ covering our four range types • To maximise customer availability and Core Core proposition Range Range • To support a consistent approach Price Price Inelastic Elastic •
Slide 25: Remerchandising of new ranges
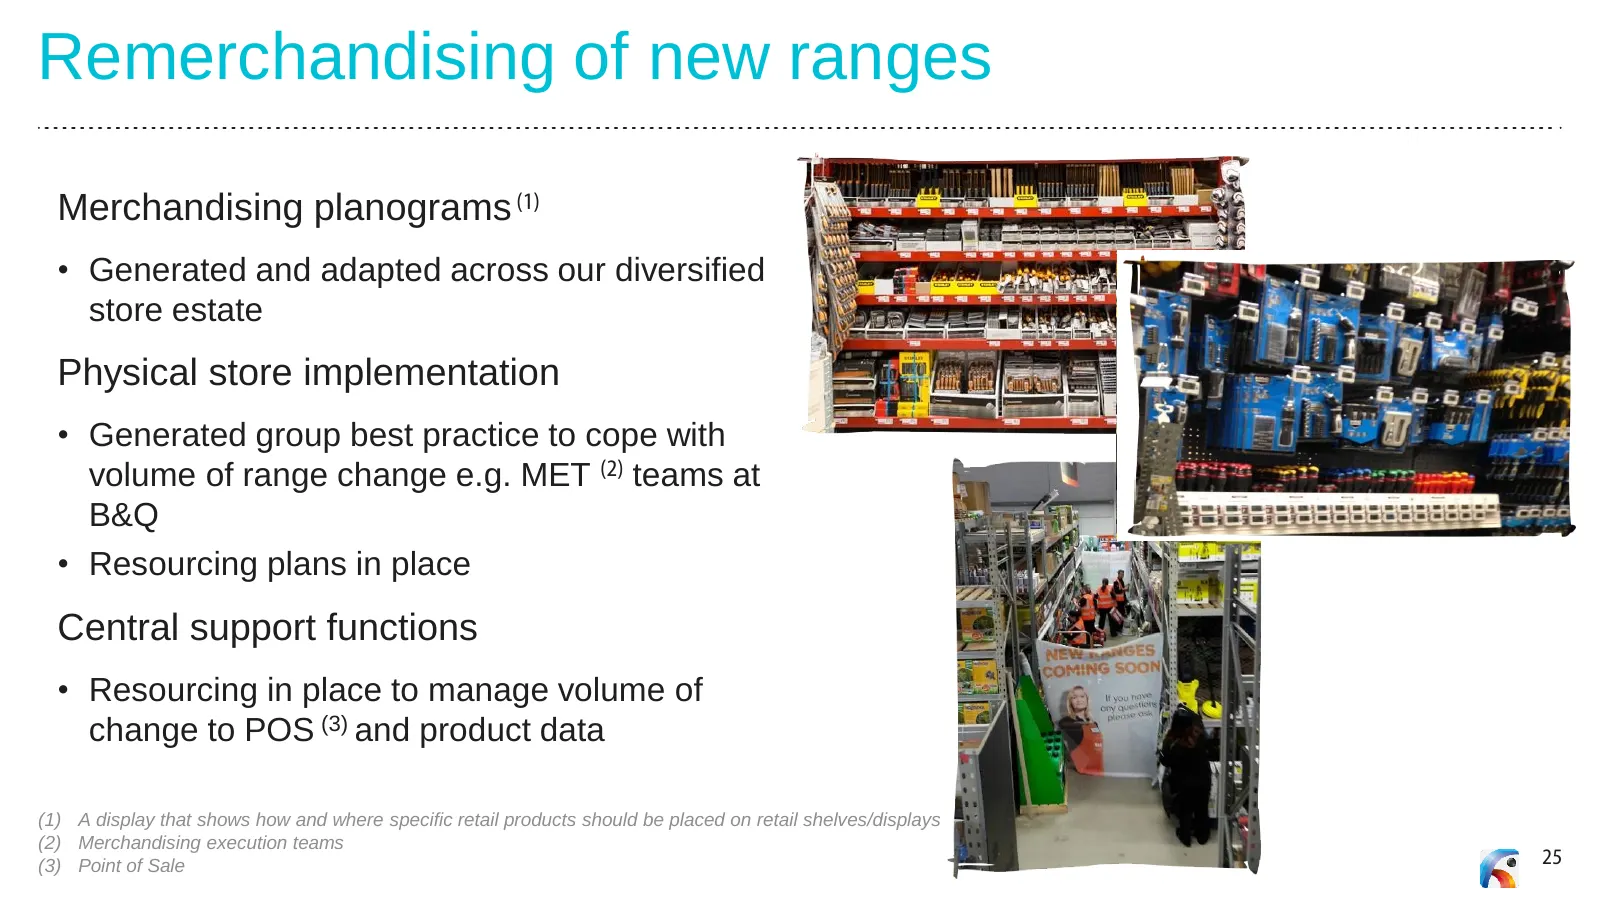
Remerchandising of new ranges Merchandising planograms (1) • Generated and adapted across our diversified store estate Physical store implementation • Generated group best practice to cope with volume of range change e.g. MET (2) teams at B&Q • Resourcing plans in place Central support functions • R
Slide 26: Phasing the volume of transformation change
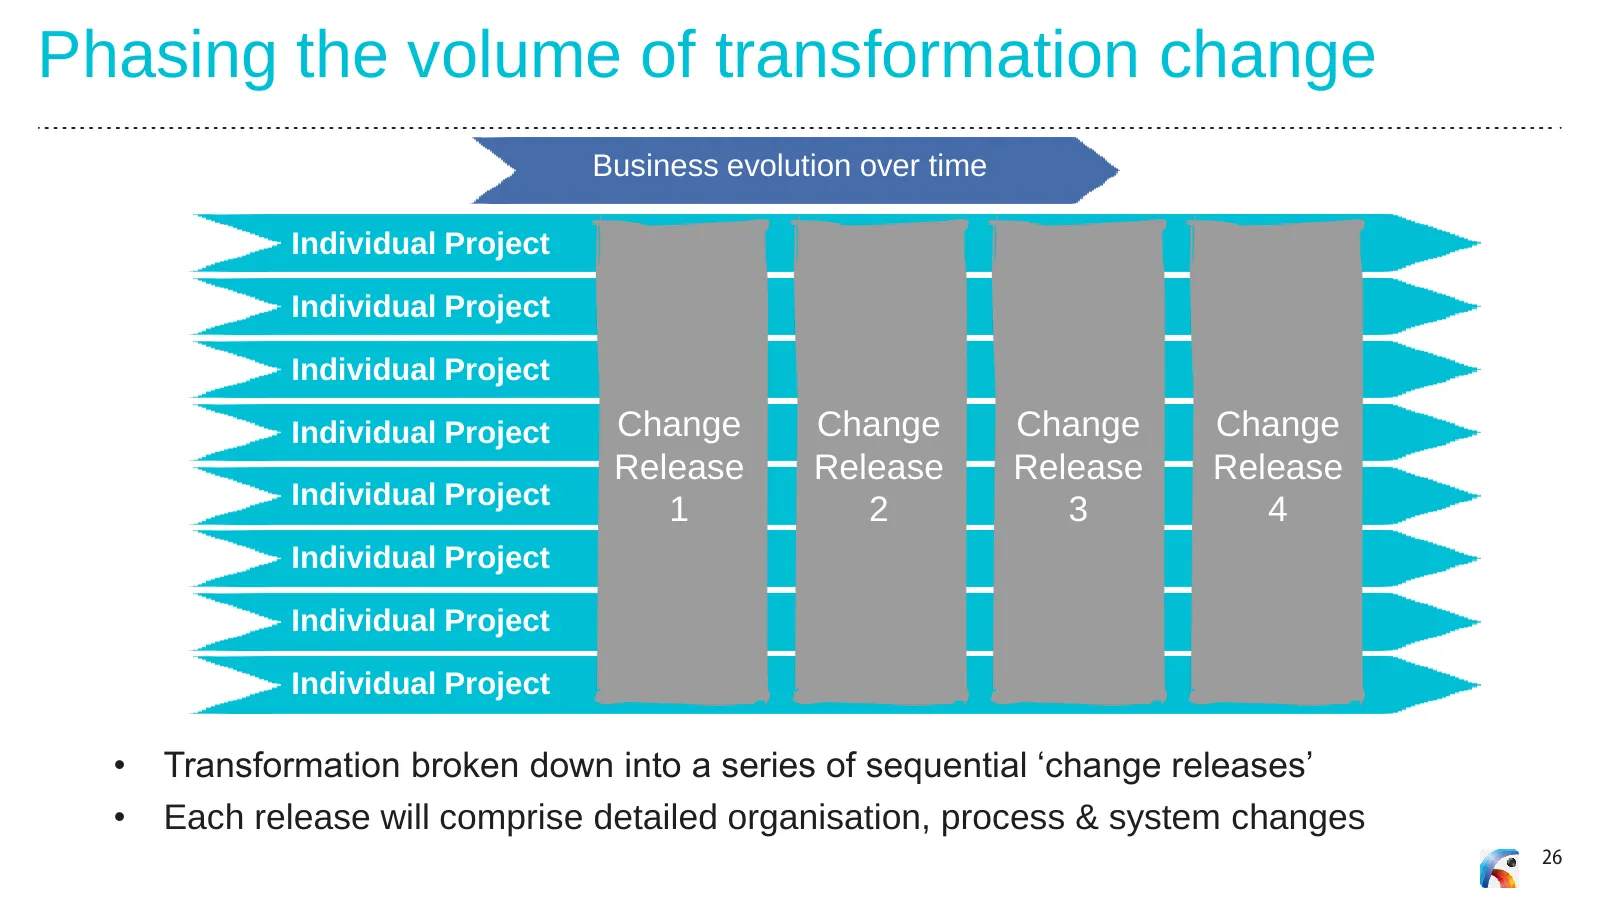
Phasing the volume of transformation change Business evolution over time Individual Project Individual Project Individual Project Individual Project Change Change Change Change Release Release Release Release Individual Project 1 2 3 4 Individual Project Individual Project Individual Project • Trans
Slide 27: France - where we are today
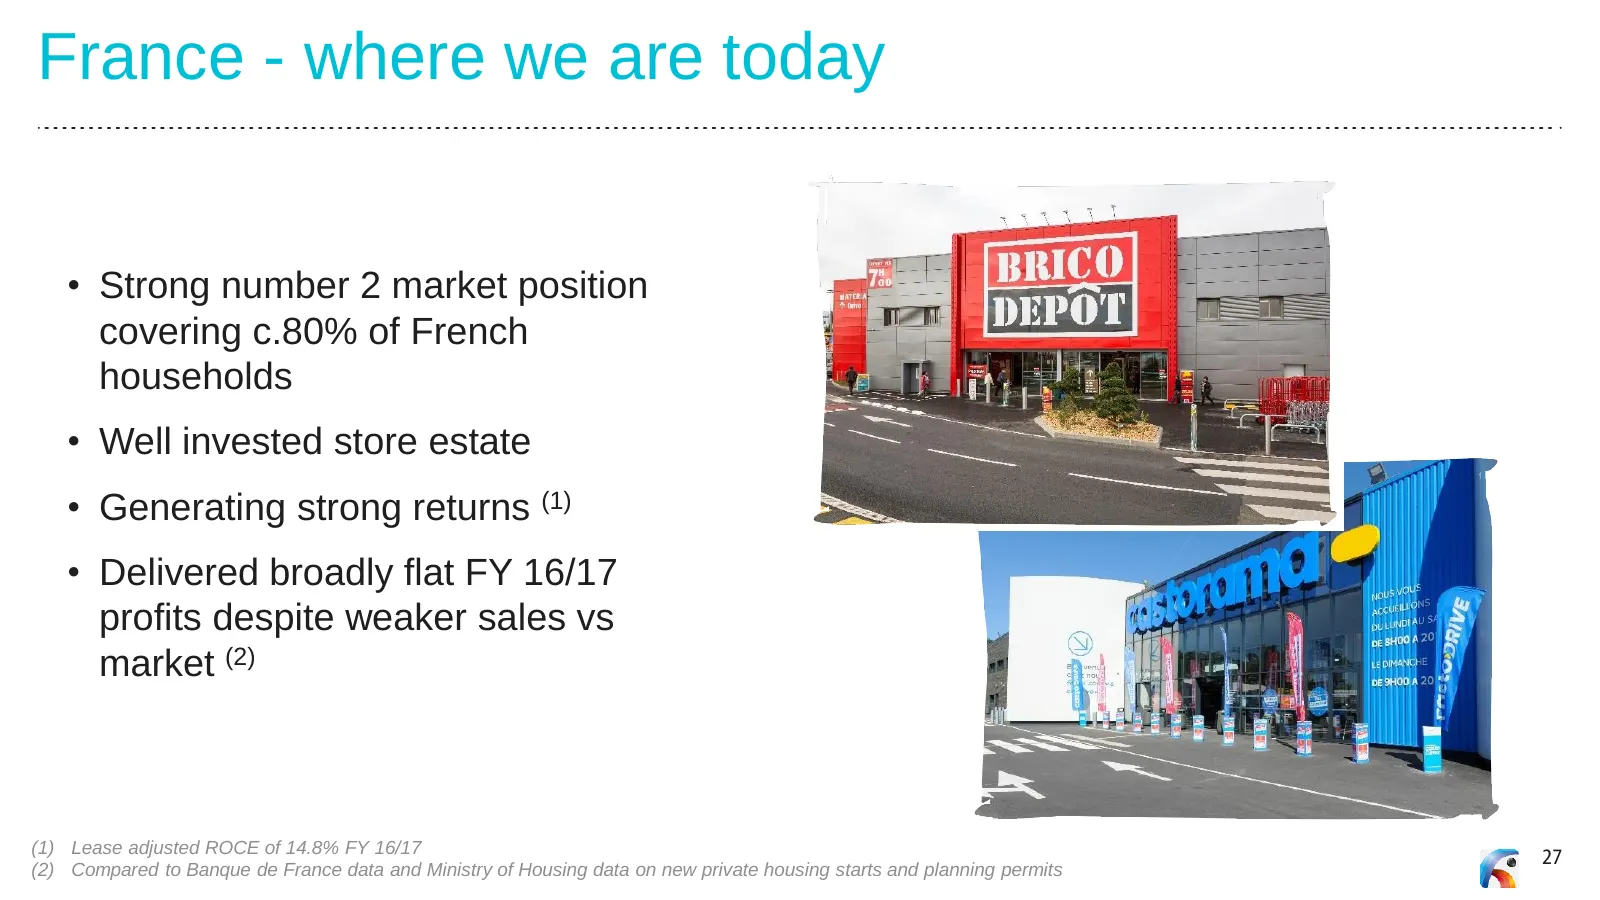
France - where we are today • Strong number 2 market position covering c.80% of French households • Well invested store estate • Generating strong returns (1) • Delivered broadly flat FY 16/17 profits despite weaker sales vs market (2) (1) Lease adjusted ROCE of 14.8% FY 16/17 27 (2) Compared to Ban
Slide 28: ONE Kingfisher plan will drive our France business
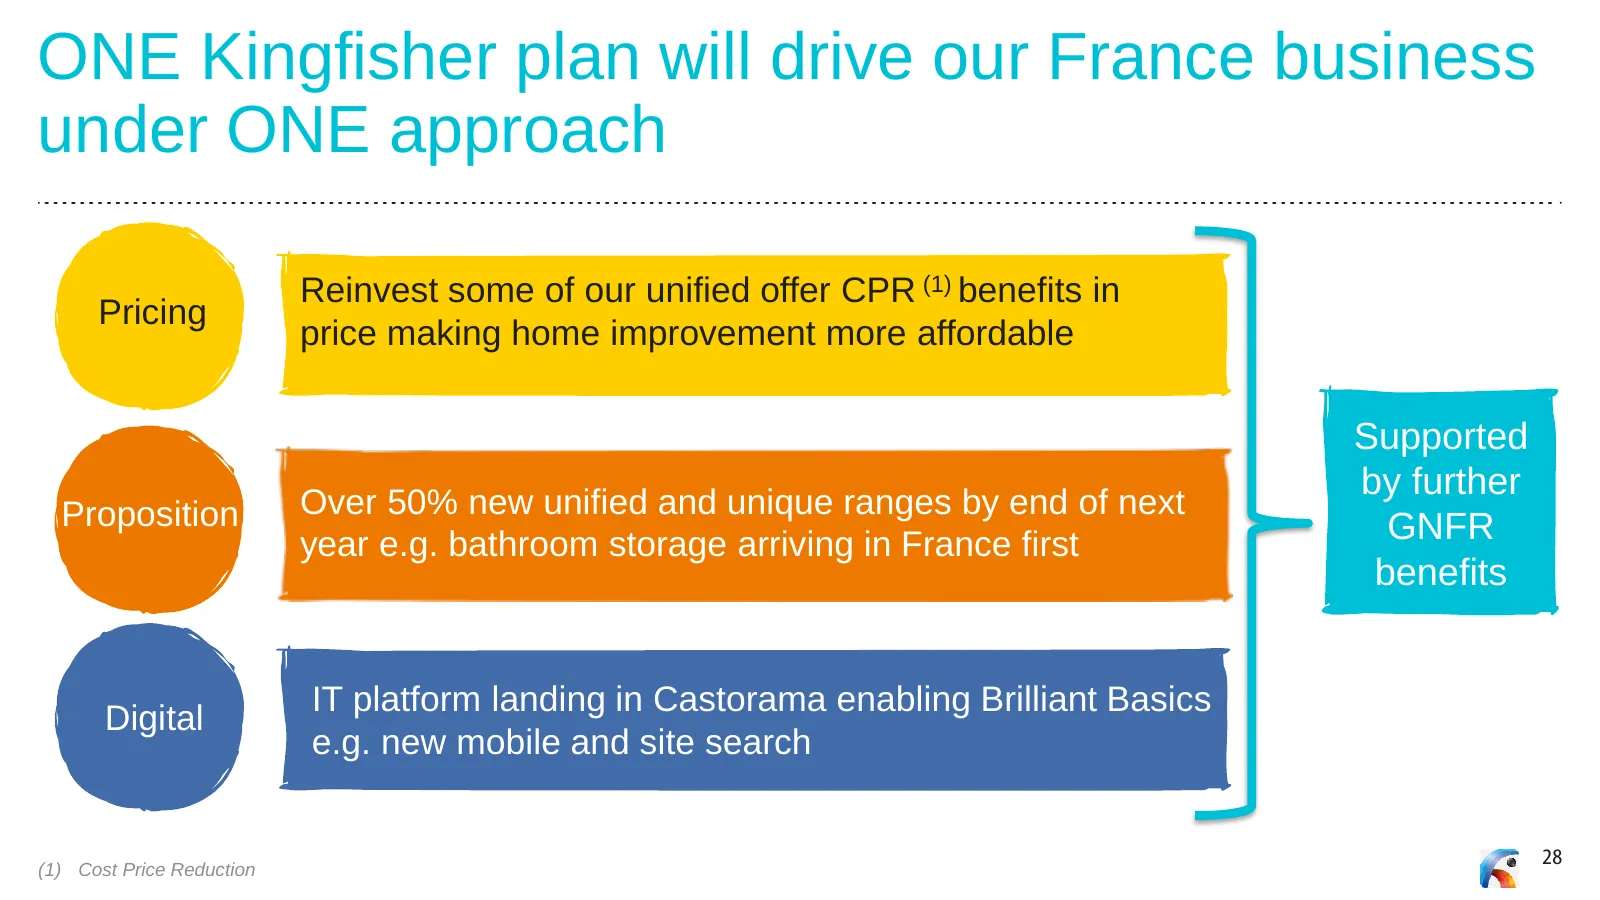
ONE Kingfisher plan will drive our France business under ONE approach Reinvest some of our unified offer CPR (1) benefits in Pricing price making home improvement more affordable Supported by further Proposition Over 50% new unified and unique ranges by end of next year e.g. bathroom storage arrivin
Slide 29: Year 2 strategic milestones
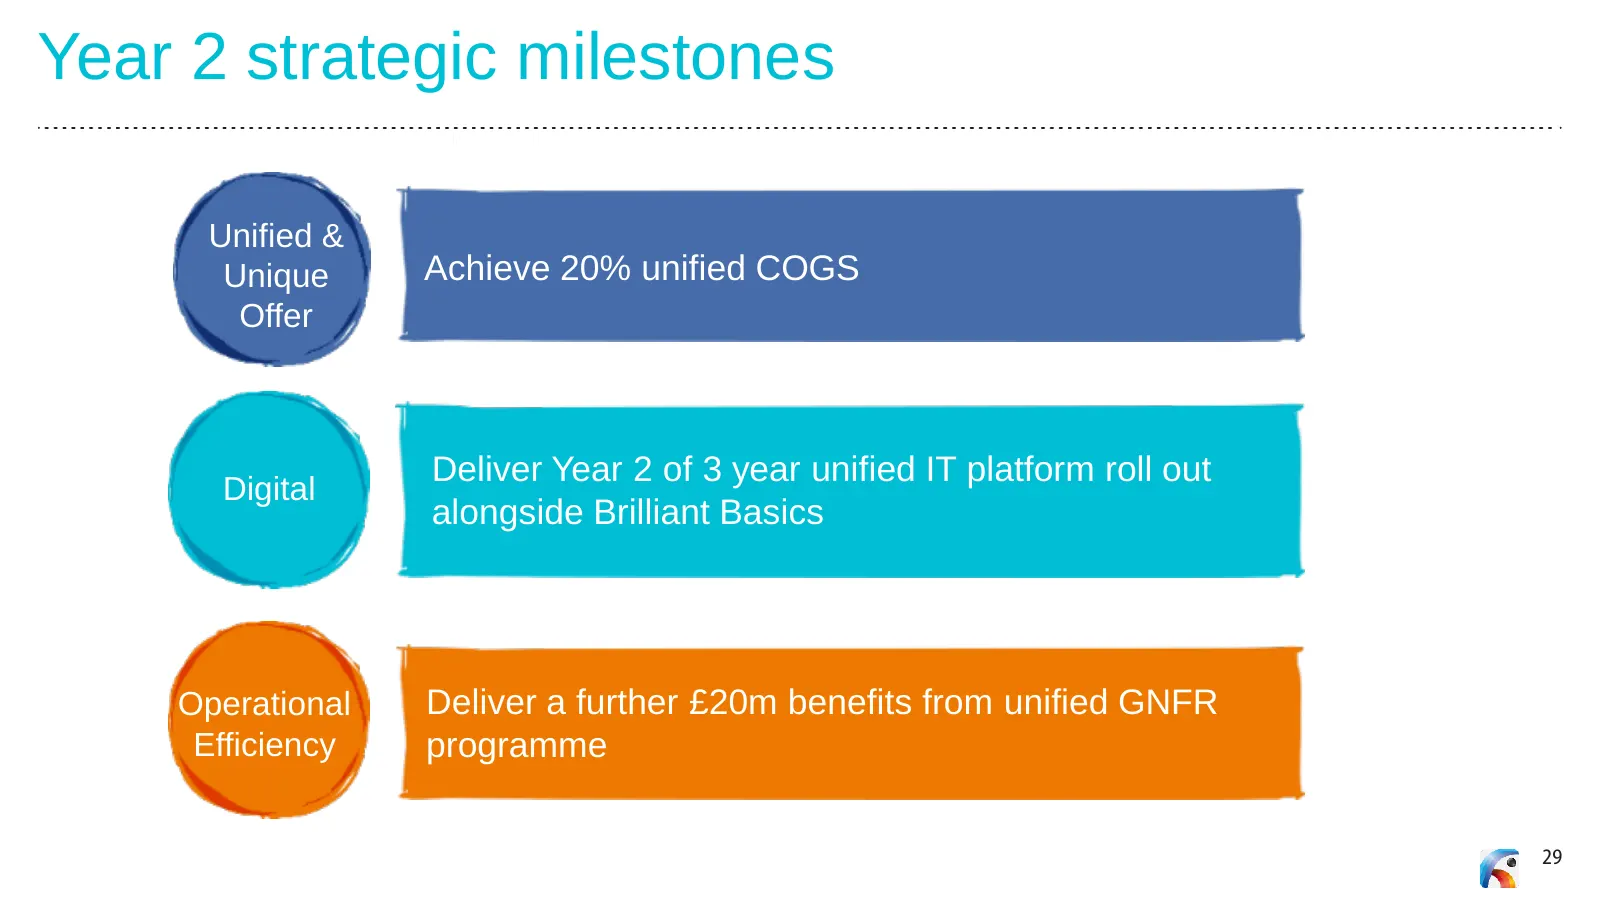
Year 2 strategic milestones Unified & Unique Achieve 20% unified COGS Offer Deliver Year 2 of 3 year unified IT platform roll out Digital alongside Brilliant Basics Operational Deliver a further £20m benefits from unified GNFR Efficiency programme 29
Slide 30: Year 2 PBT guidance
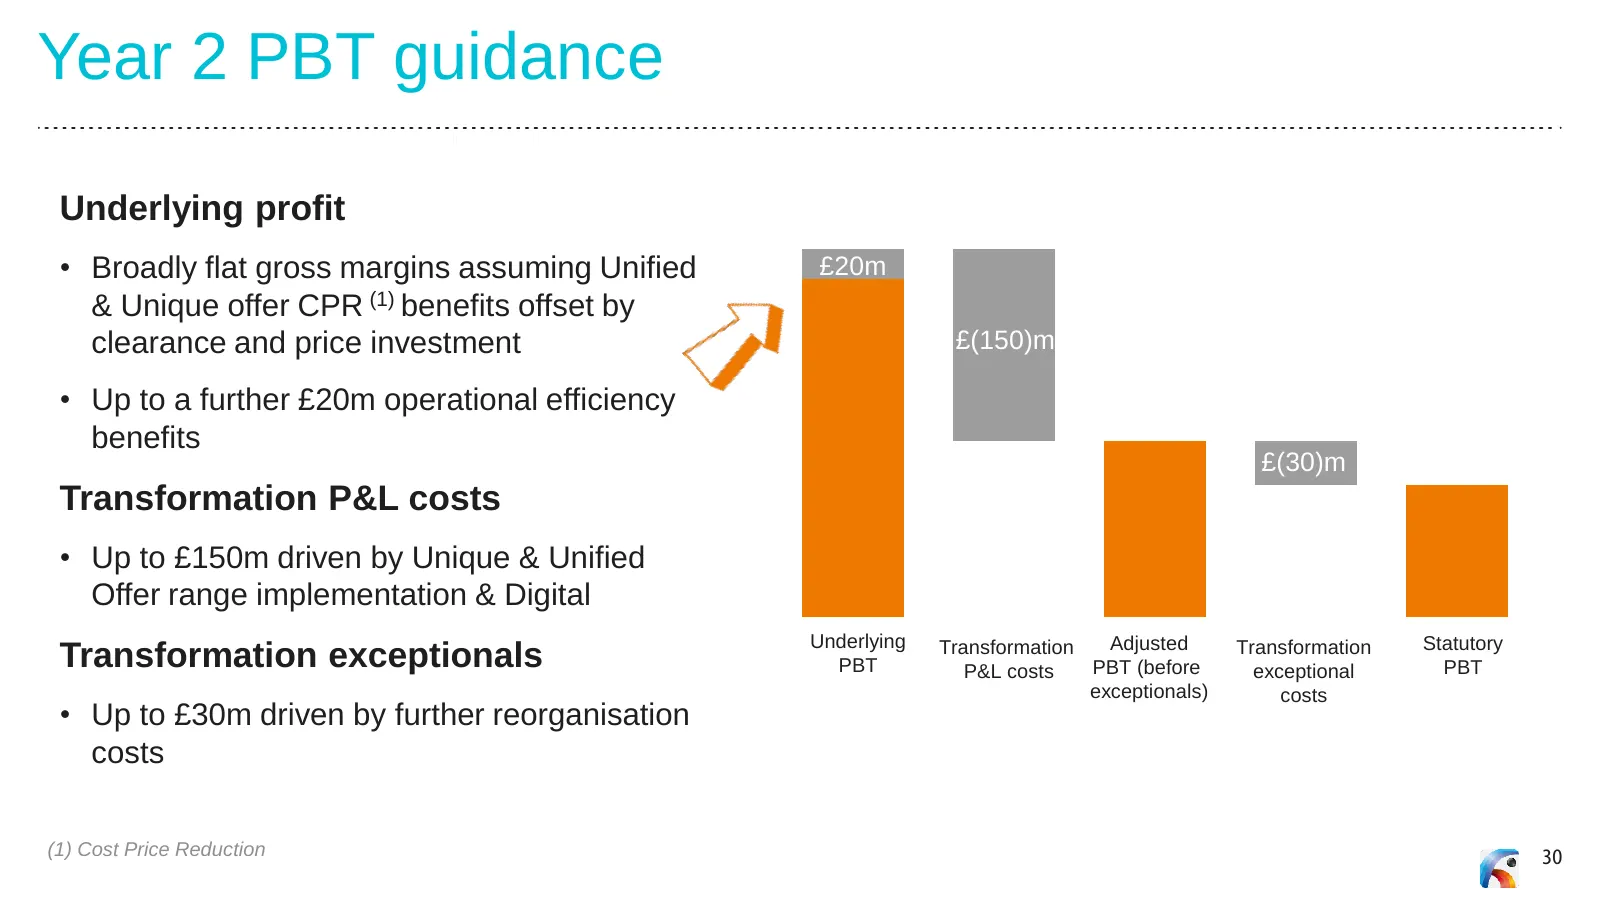
Year 2 PBT guidance Underlying profit • Broadly flat gross margins assuming Unified £20m & Unique offer CPR (1) benefits offset by clearance and price investment £(150)m • Up to a further £20m operational efficiency benefits £(30)m Transformation P&L costs • Up to £150m driven by Unique & Unified Of
Slide 31: Year 2 total capex guidance
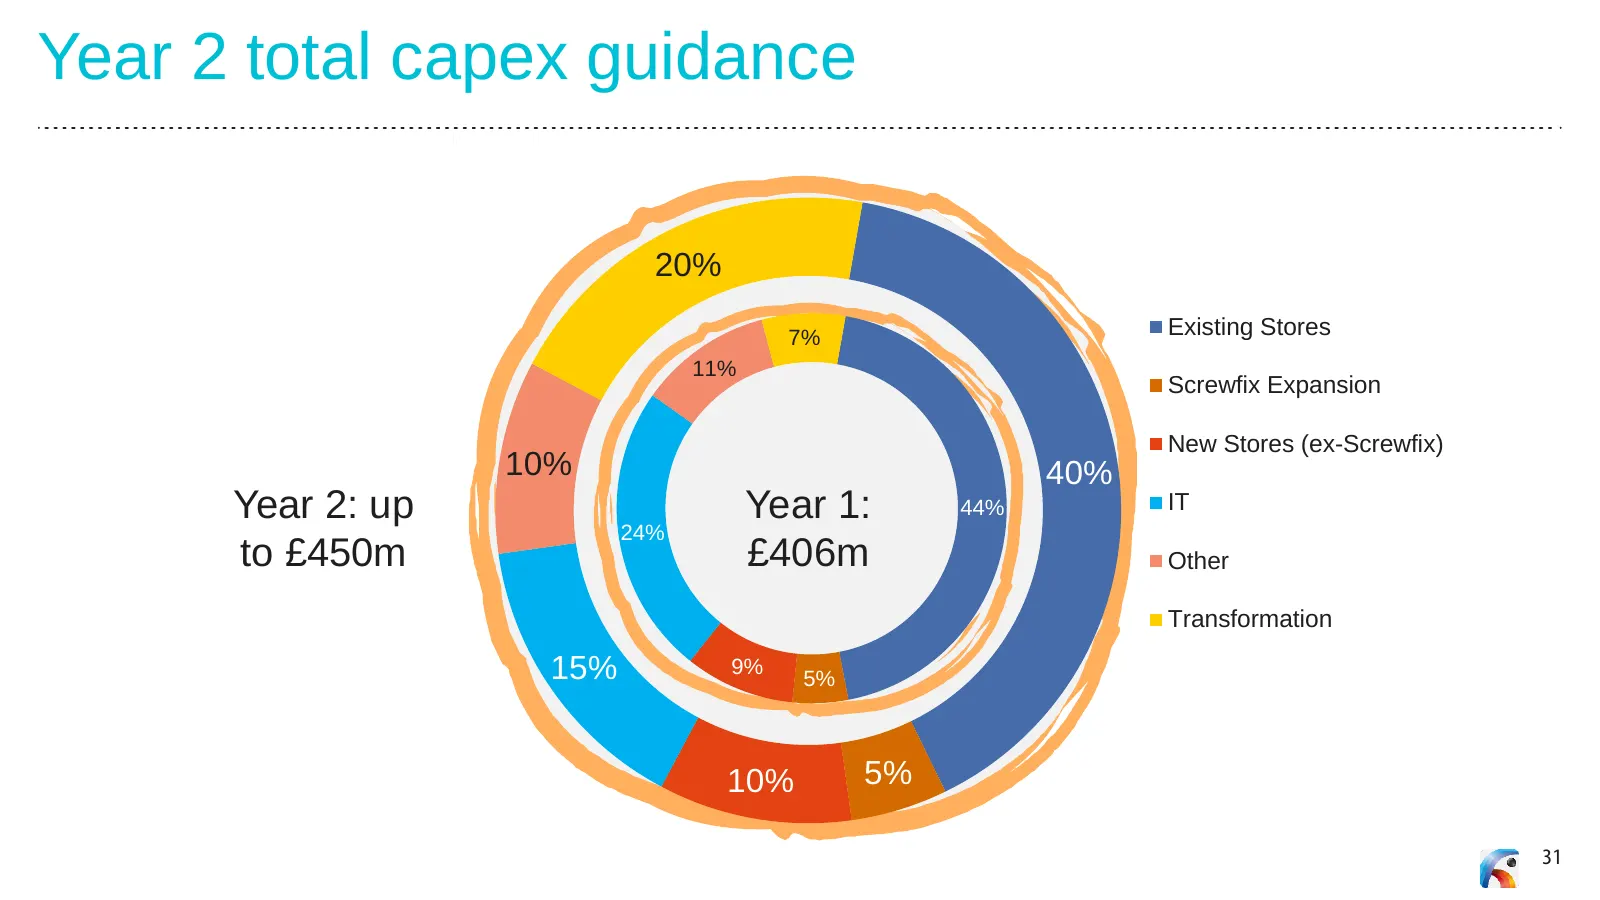
Year 2 total capex guidance 20% 7% Existing Stores 11% Screwfix Expansion New Stores (ex-Screwfix) 10% 40% Year 2: up Year 1: 30% 44% IT 24% to £450m £406m Other Transformation 15% 9% 5% 10% 5% 31
Slide 32: Reaffirming 5 Year plan targets
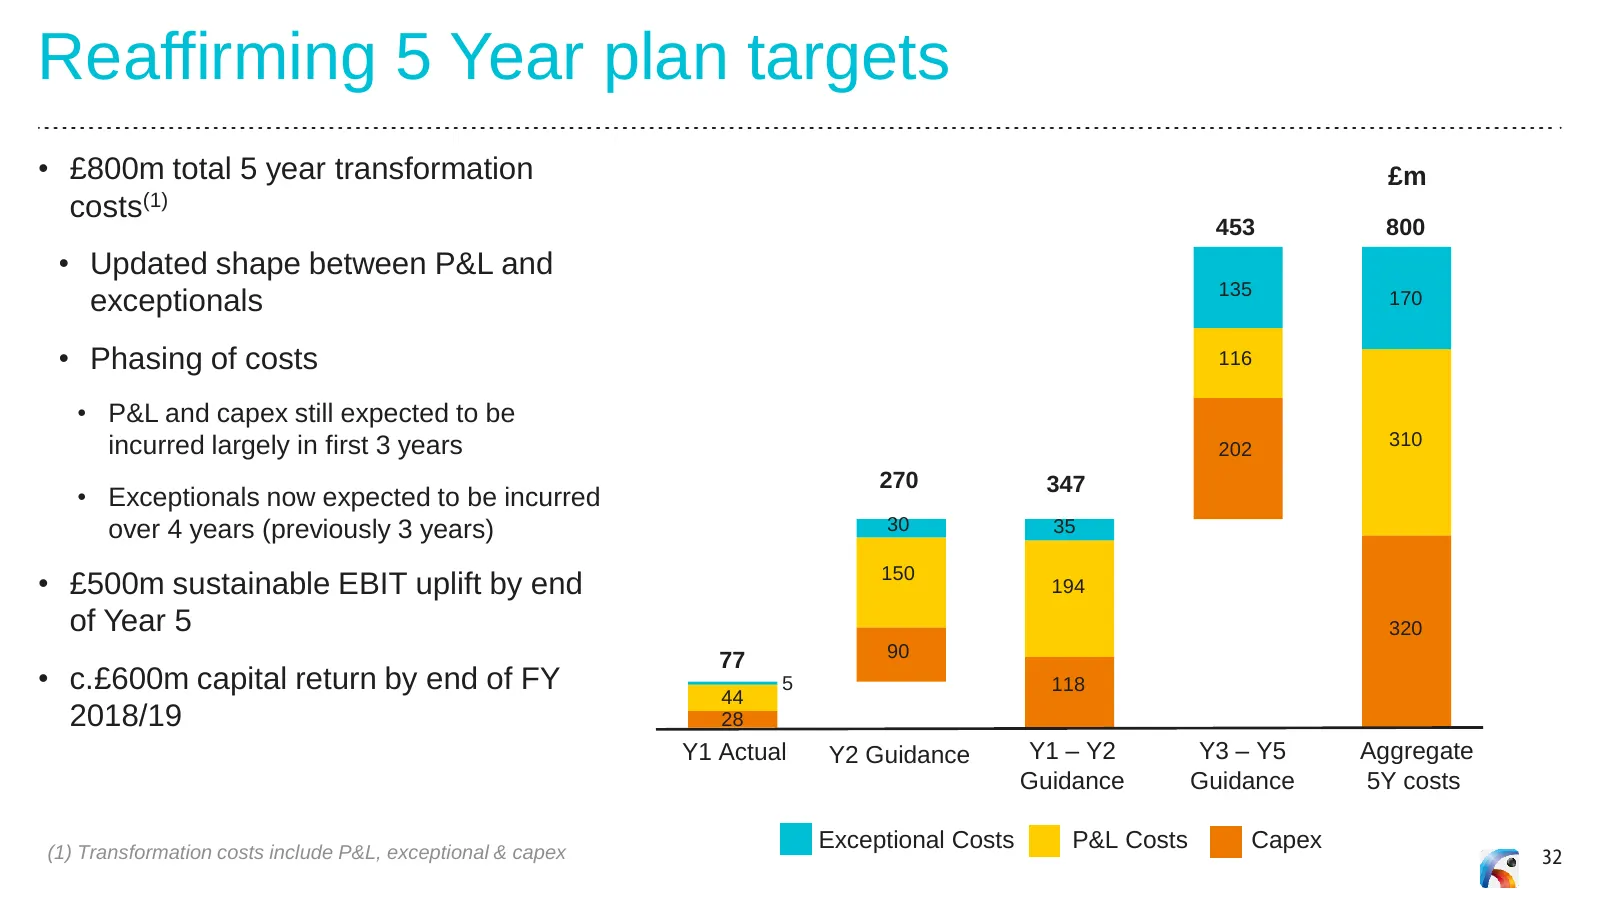
Reaffirming 5 Year plan targets • £800m total 5 year transformation £m costs(1) 453 800 • Updated shape between P&L and 135 exceptionals 170 • Phasing of costs 116 • P&L and capex still expected to be incurred largely in first 3 years 202 310 270 347 • Exceptionals now expected to be incurred over 4
Slide 33: Where we are, one year in
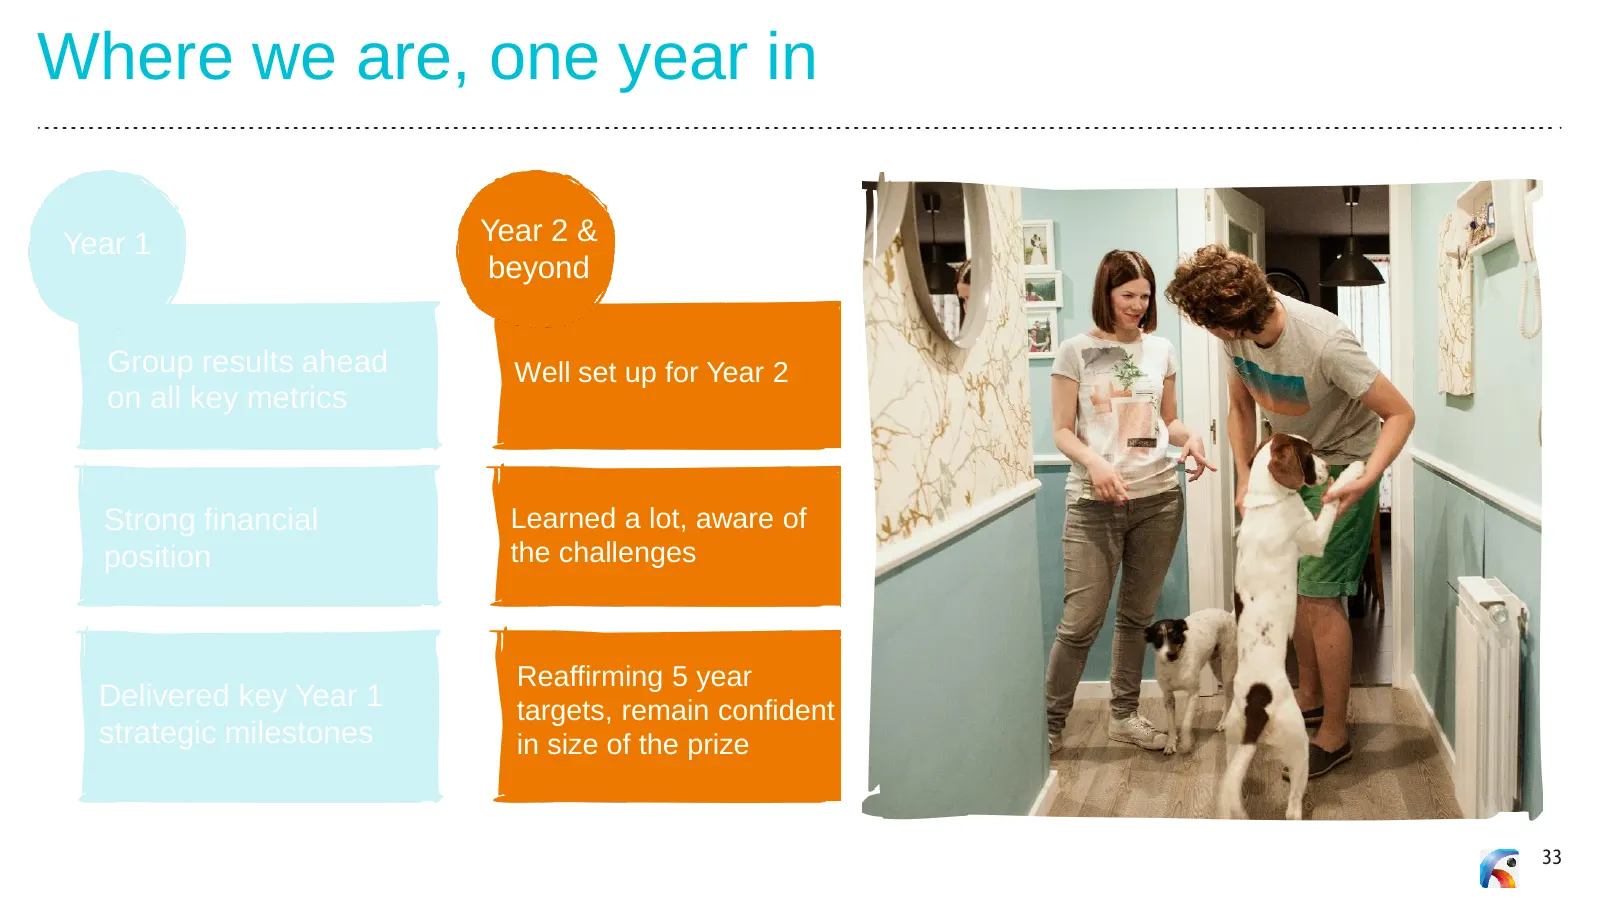
Where we are, one year in Year 1 Year 2 & beyond Group results ahead Well set up for Year 2 on all key metrics Strong financial Learned a lot, aware of position the challenges Reaffirming 5 year Delivered key Year 1 targets, remain confident strategic milestones in size of the prize 33
Slide 34: Summary
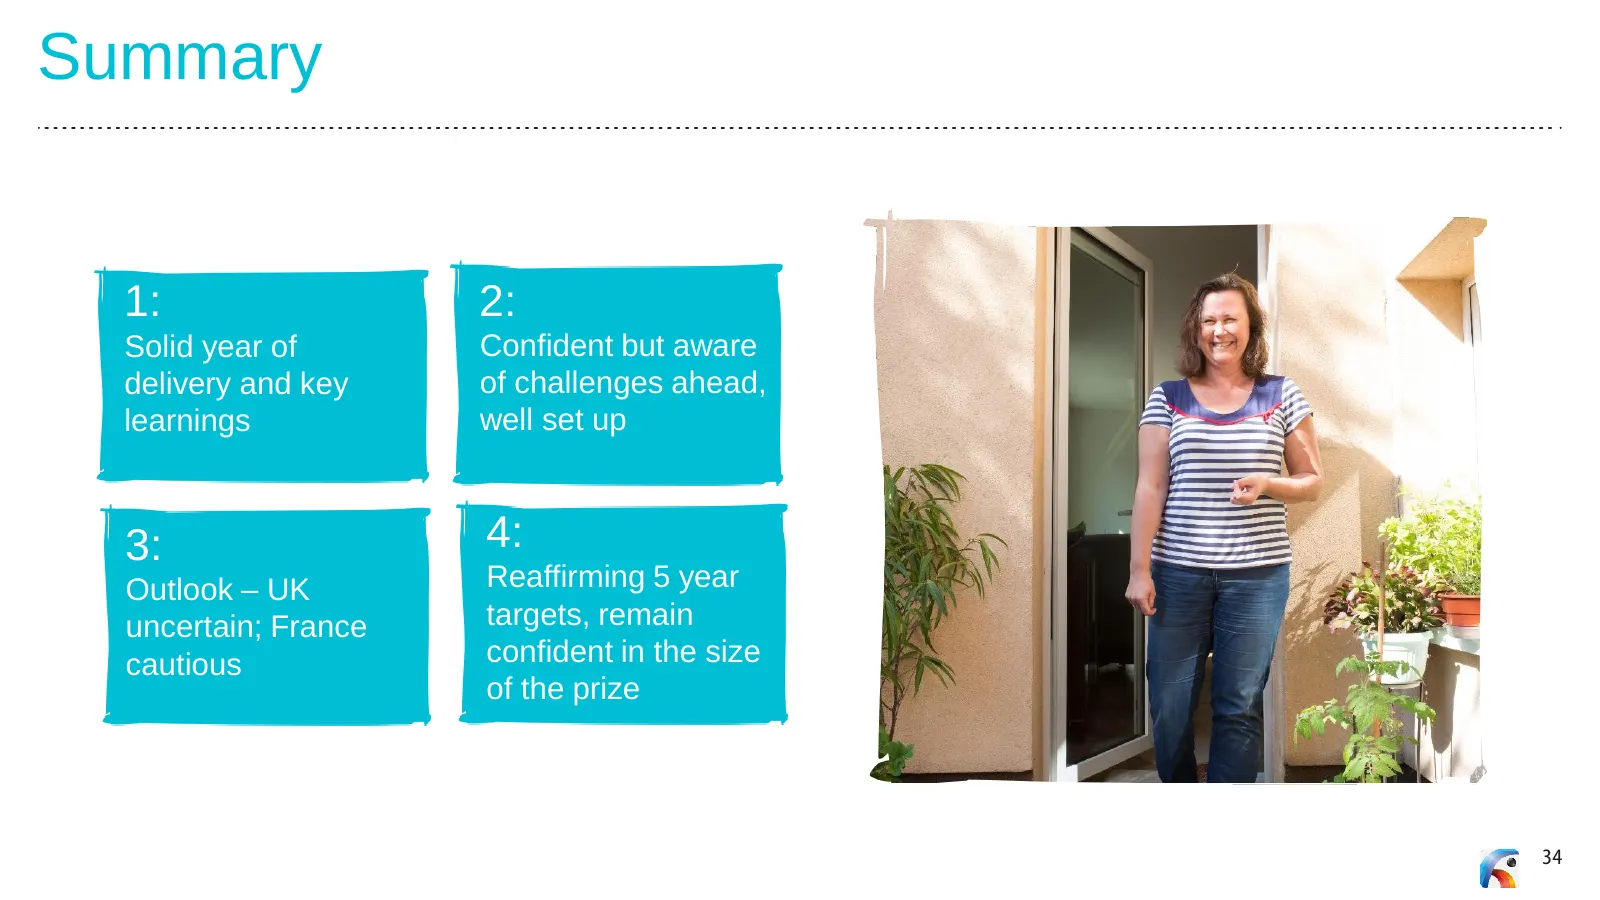
Summary 1: 2: Solid year of Confident but aware delivery and key of challenges ahead, learnings well set up 3: 4: Outlook – UK Reaffirming 5 year uncertain; France targets, remain cautious confident in the size of the prize 34
Slide 35: Cautionary note regarding forward looking statements
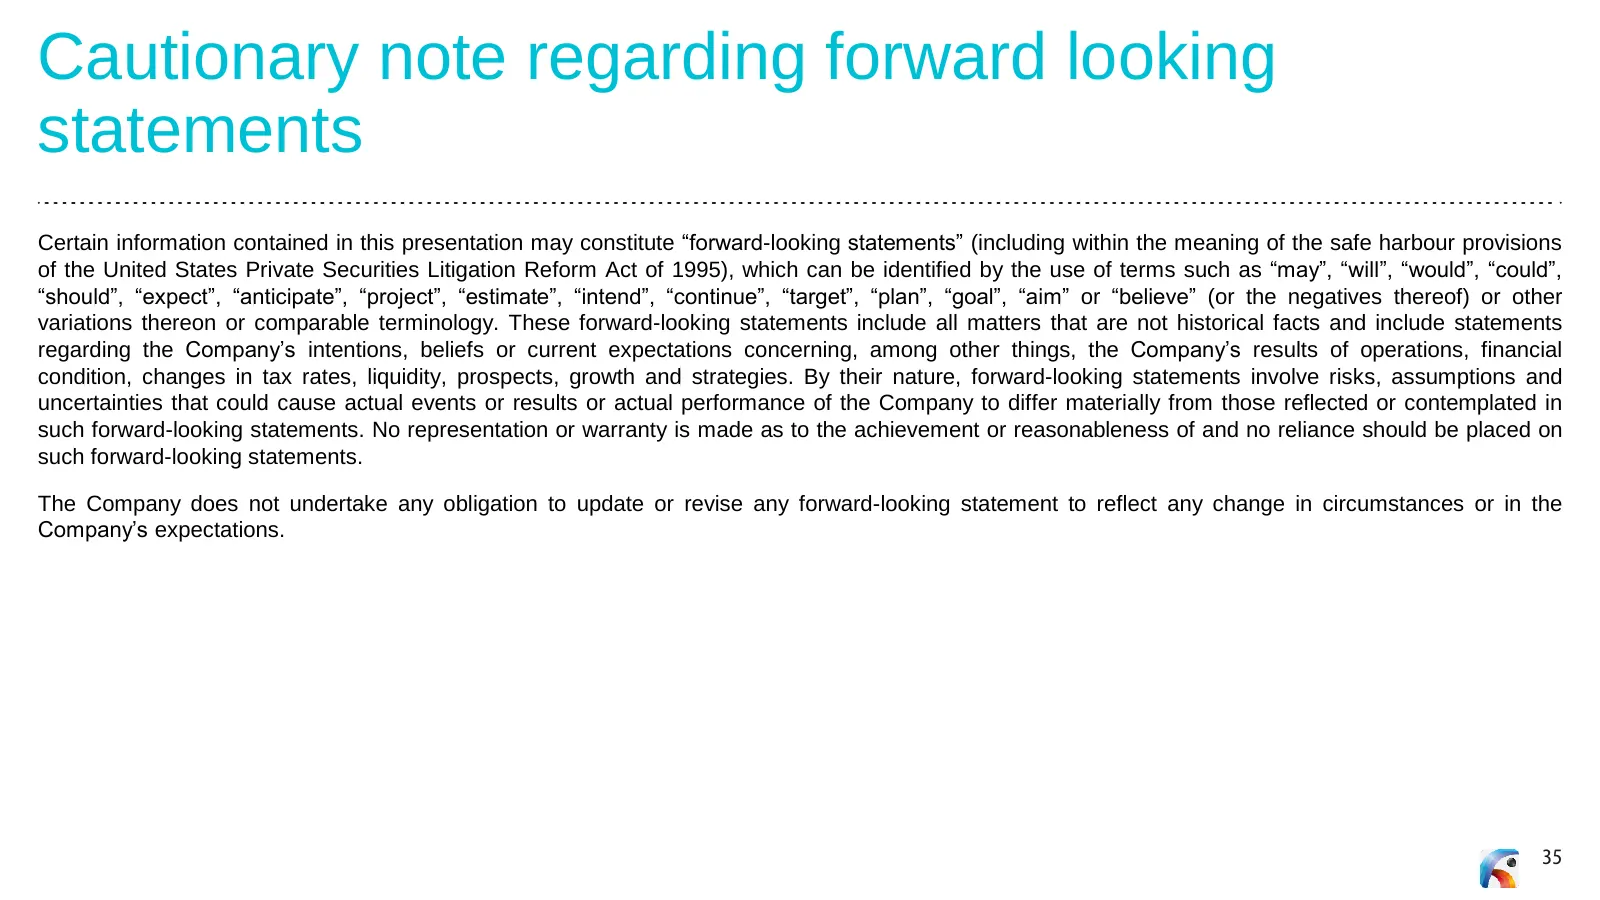
Cautionary note regarding forward looking statements Certain information contained in this presentation may constitute “forward-looking statements” (including within the meaning of the safe harbour provisions of the United States Private Securities Litigation Reform Act of 1995), which can be identi

Slide 36: Questions
Questions 36
Slide 37: FY 17/18 technical guidance
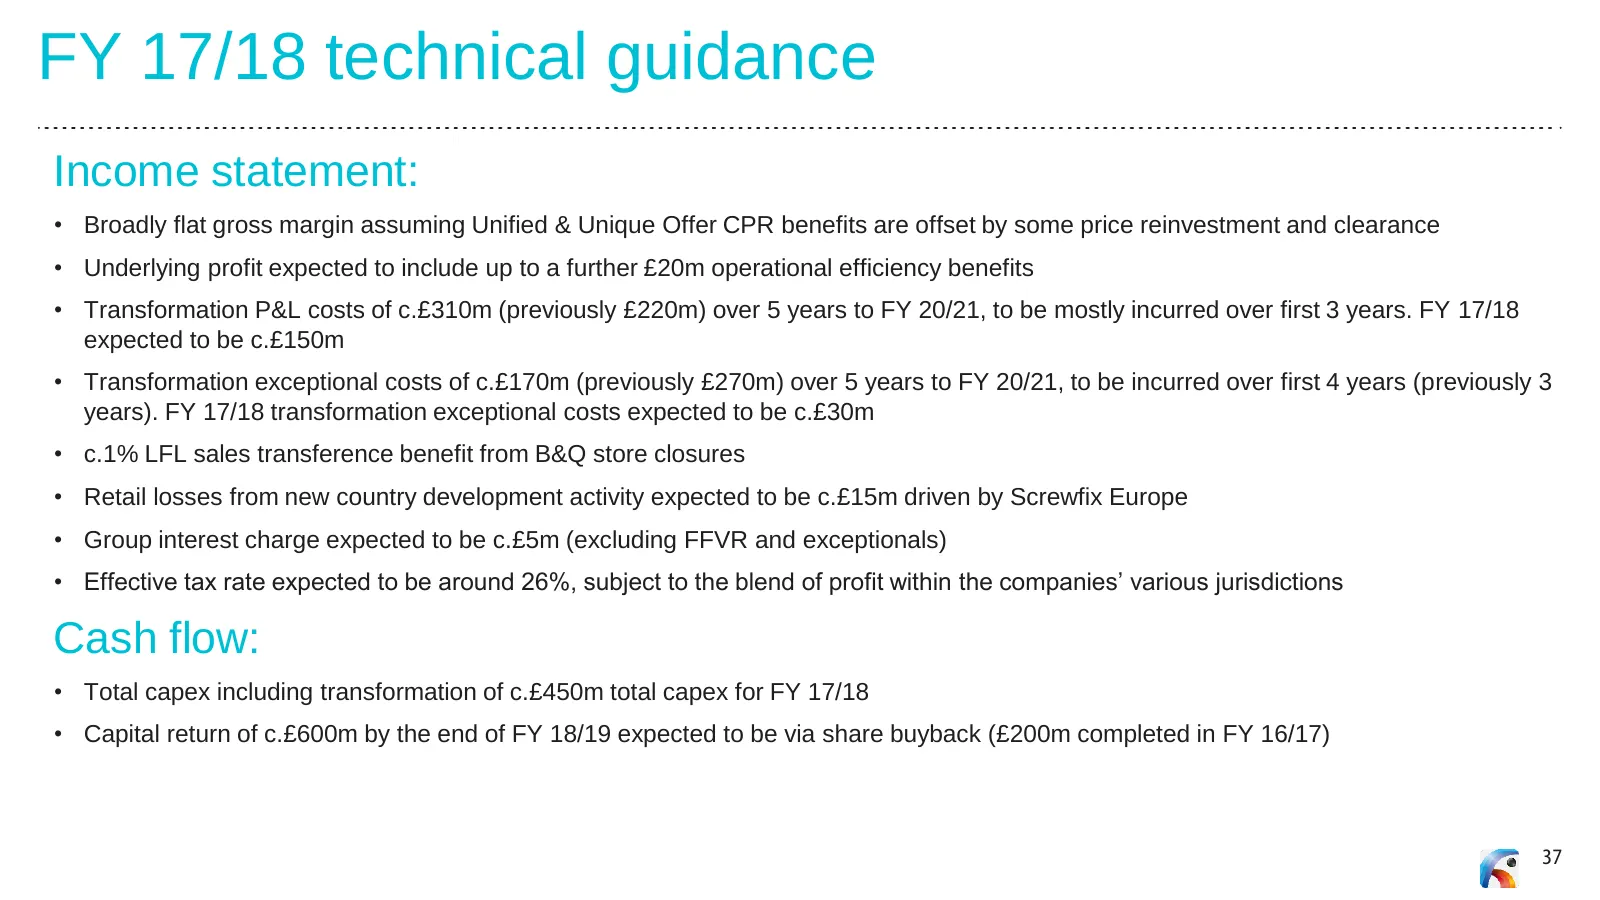
FY 17/18 technical guidance Income statement: • Broadly flat gross margin assuming Unified & Unique Offer CPR benefits are offset by some price reinvestment and clearance • Underlying profit expected to include up to a further £20m operational efficiency benefits • Transformation P&L costs of c.£310
Slide 38: Net debt to EBITDAR reconciliation
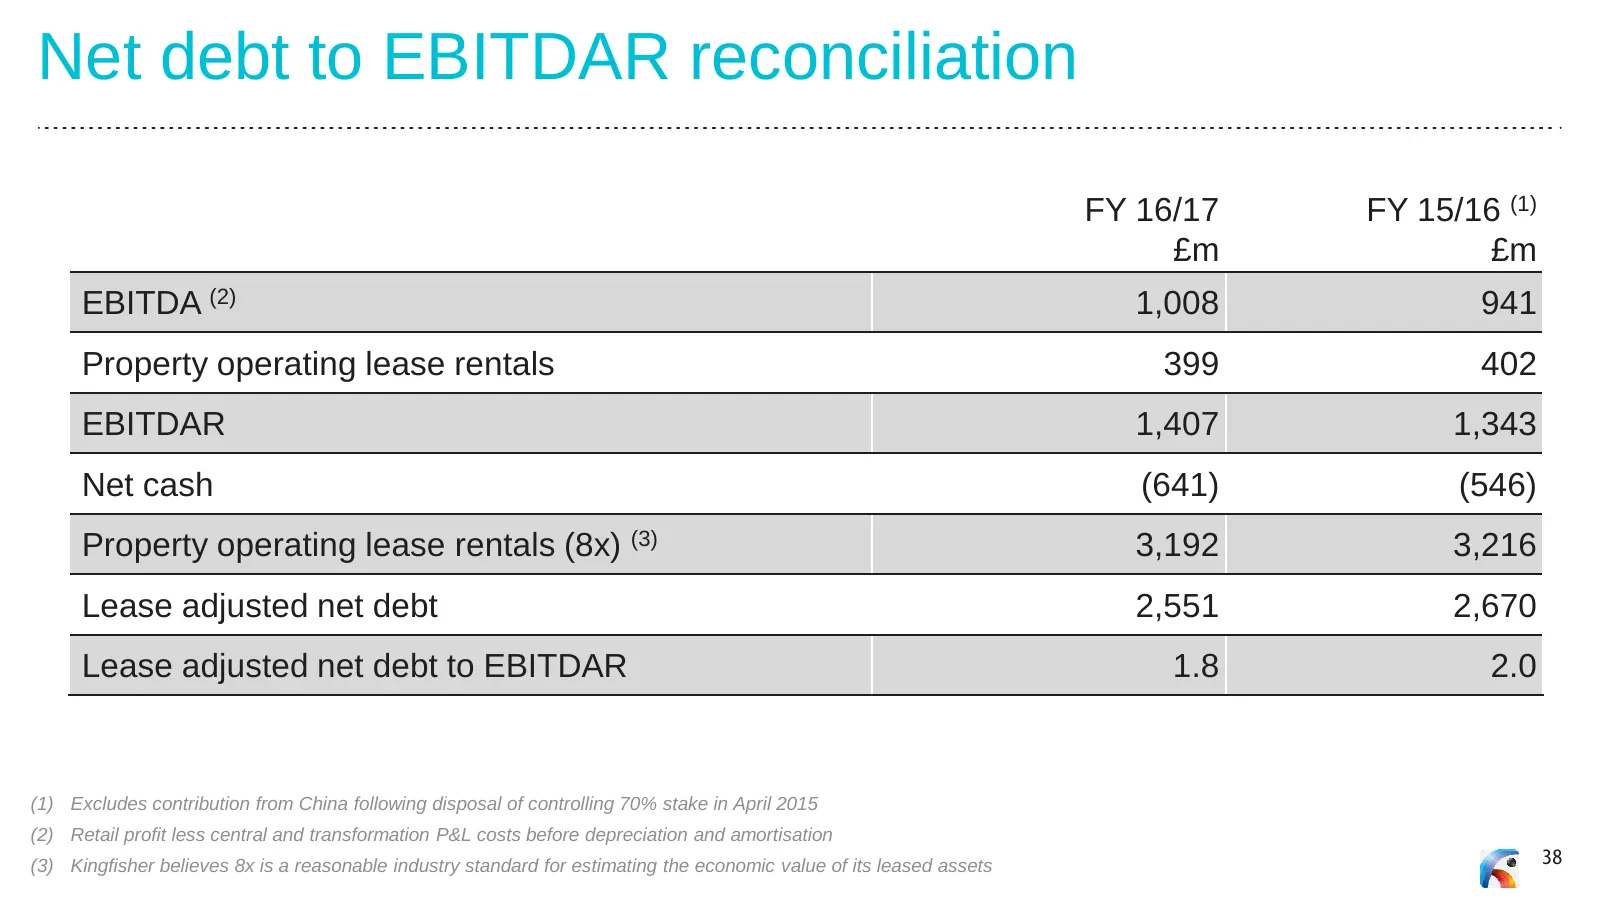
Net debt to EBITDAR reconciliation FY 16/17 FY 15/16 (1) £m £m EBITDA (2) 1,008 941 Property operating lease rentals 399 402 EBITDAR 1,407 1,343 Net cash (641) (546) Property operating lease rentals (8x) (3) 3,192 3,216 Lease adjusted net debt 2,551 2,670 Lease adjusted net debt to EBITDAR 1.8 2.0 (
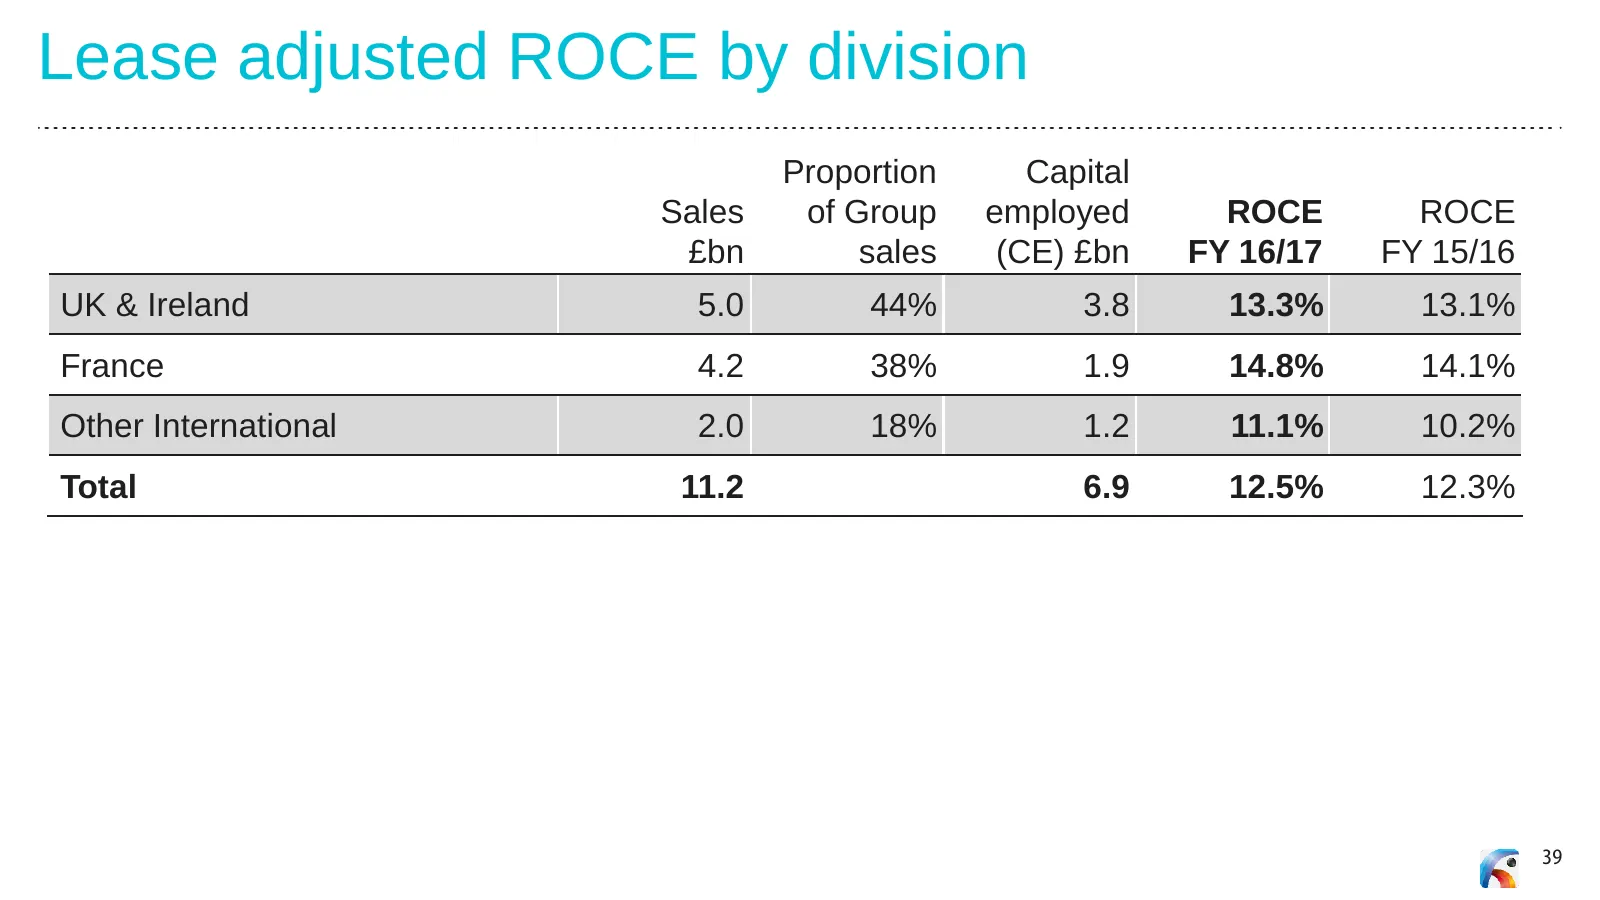
Slide 39: Lease adjusted ROCE by division
Lease adjusted ROCE by division Proportion Capital Sales of Group employed ROCE ROCE £bn sales (CE) £bn FY 16/17 FY 15/16 UK & Ireland 5.0 44% 3.8 13.3% 13.1% France 4.2 38% 1.9 14.8% 14.1% Other International 2.0 18% 1.2 11.1% 10.2% Total 11.2 6.9 12.5% 12.3% 39
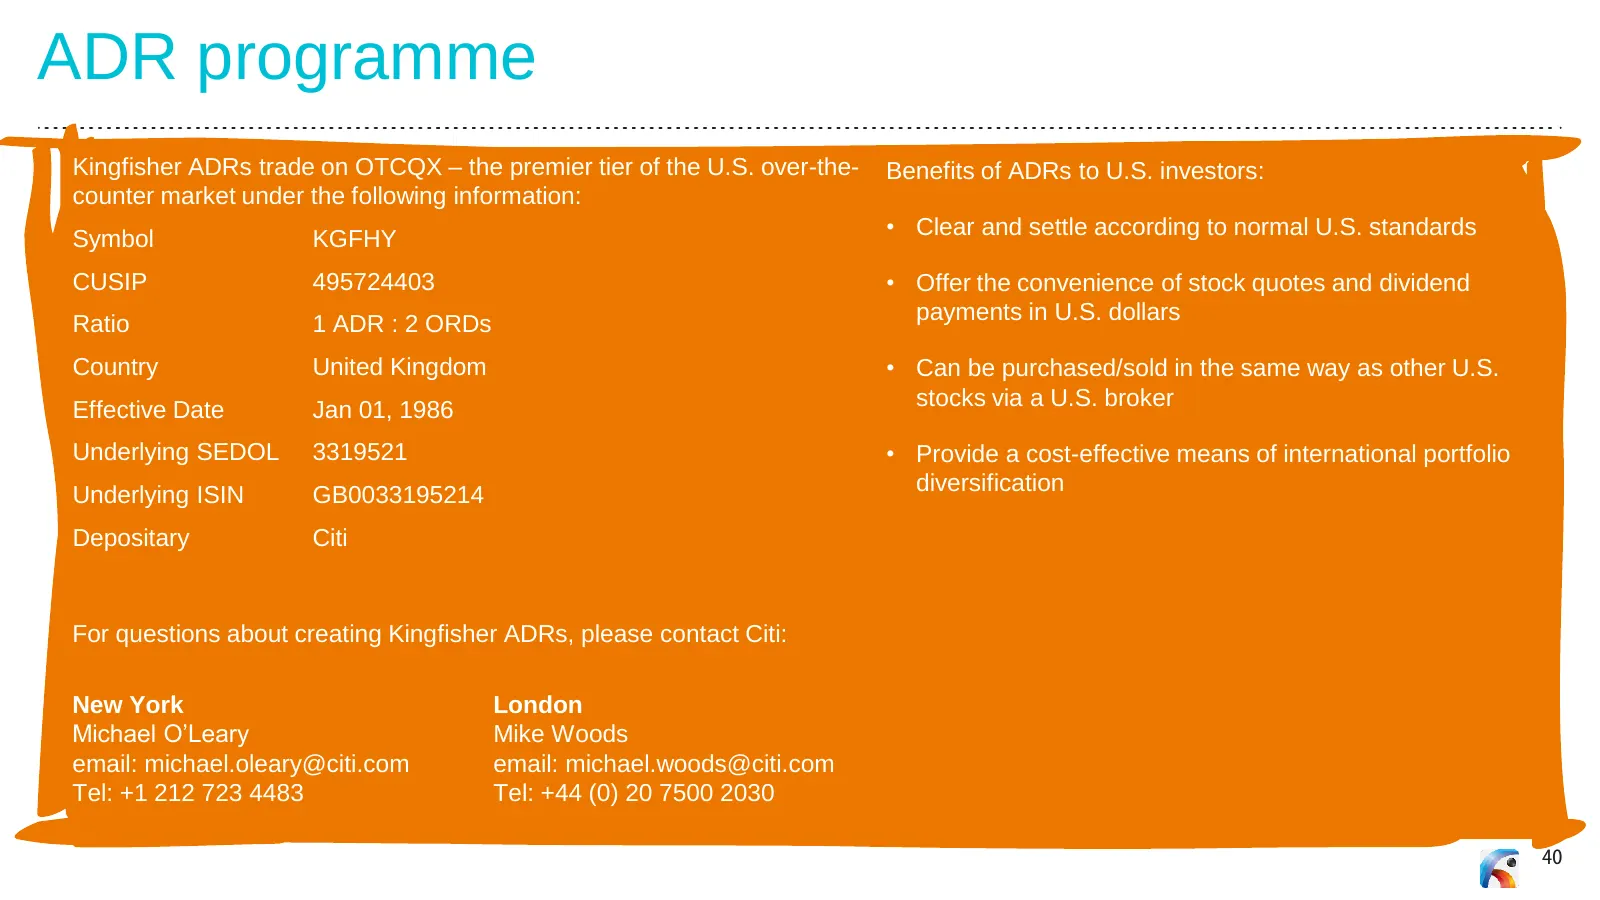
Slide 40: ADR programme
ADR programme Kingfisher ADRs trade on OTCQX – the premier tier of the U.S. over-the- Benefits of ADRs to U.S. investors: counter market under the following information: Symbol KGFHY • Clear and settle according to normal U.S. standards CUSIP 495724403 • Offer the convenience of stock quotes and div
Slide 41: Contacts
Contacts Investor Relations Media Relations Tel: +44 (0)20 7644 1082 Tel: +44 (0)20 7644 1030 Email: investorenquiries@kingfisher.com Email: nigel.cope@kingfisher.com Teneo Blue Rubicon Tel: +44 (0)20 7260 2700 Email: Kfteam@teneobluerubicon.com 41
Source: Internet Archive copy of kingfisher.com
More decks from Kingfisher PLC
 H1 2026/27 Earnings Presentation33 slides · Sep 22, 2026
 FY2025/26 Earnings Presentation39 slides · Mar 24, 2026
 H1 2025/26 Earnings Presentation38 slides · Sep 23, 2025
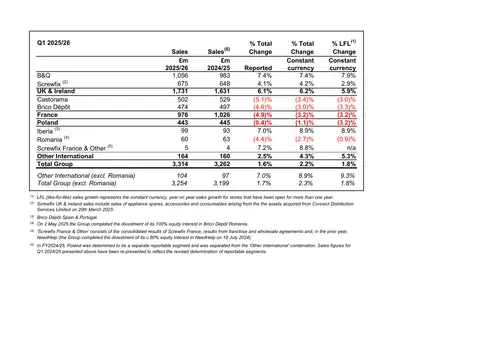 H1 2025/26 Earnings Presentation6 slides · September 2025
 FY2024/25 Earnings Presentation35 slides · Apr 8, 2025
 FY2024/25 Earnings Presentation40 slides · Mar 25, 2025