ICICI Prudential Asset Management Company Ltd. · NSE:ICICIAMC
ICICI Prudential Asset Management — Corporate Update (November 2012)
25 slides from ICICI Prudential Asset Management's corporate update, November 2012
Slide 1: Monthly Market Presentation
Wishing you a very Happy Diwali!!! Monthly Market Presentation Happy Investing in Festivities!!! Mutual Fund investments are subject to market risks, read all scheme related documents carefully. 1 Please refer slide no. 24 for risk factors.
Slide 2: Retrospective October 2012: Ordinary October
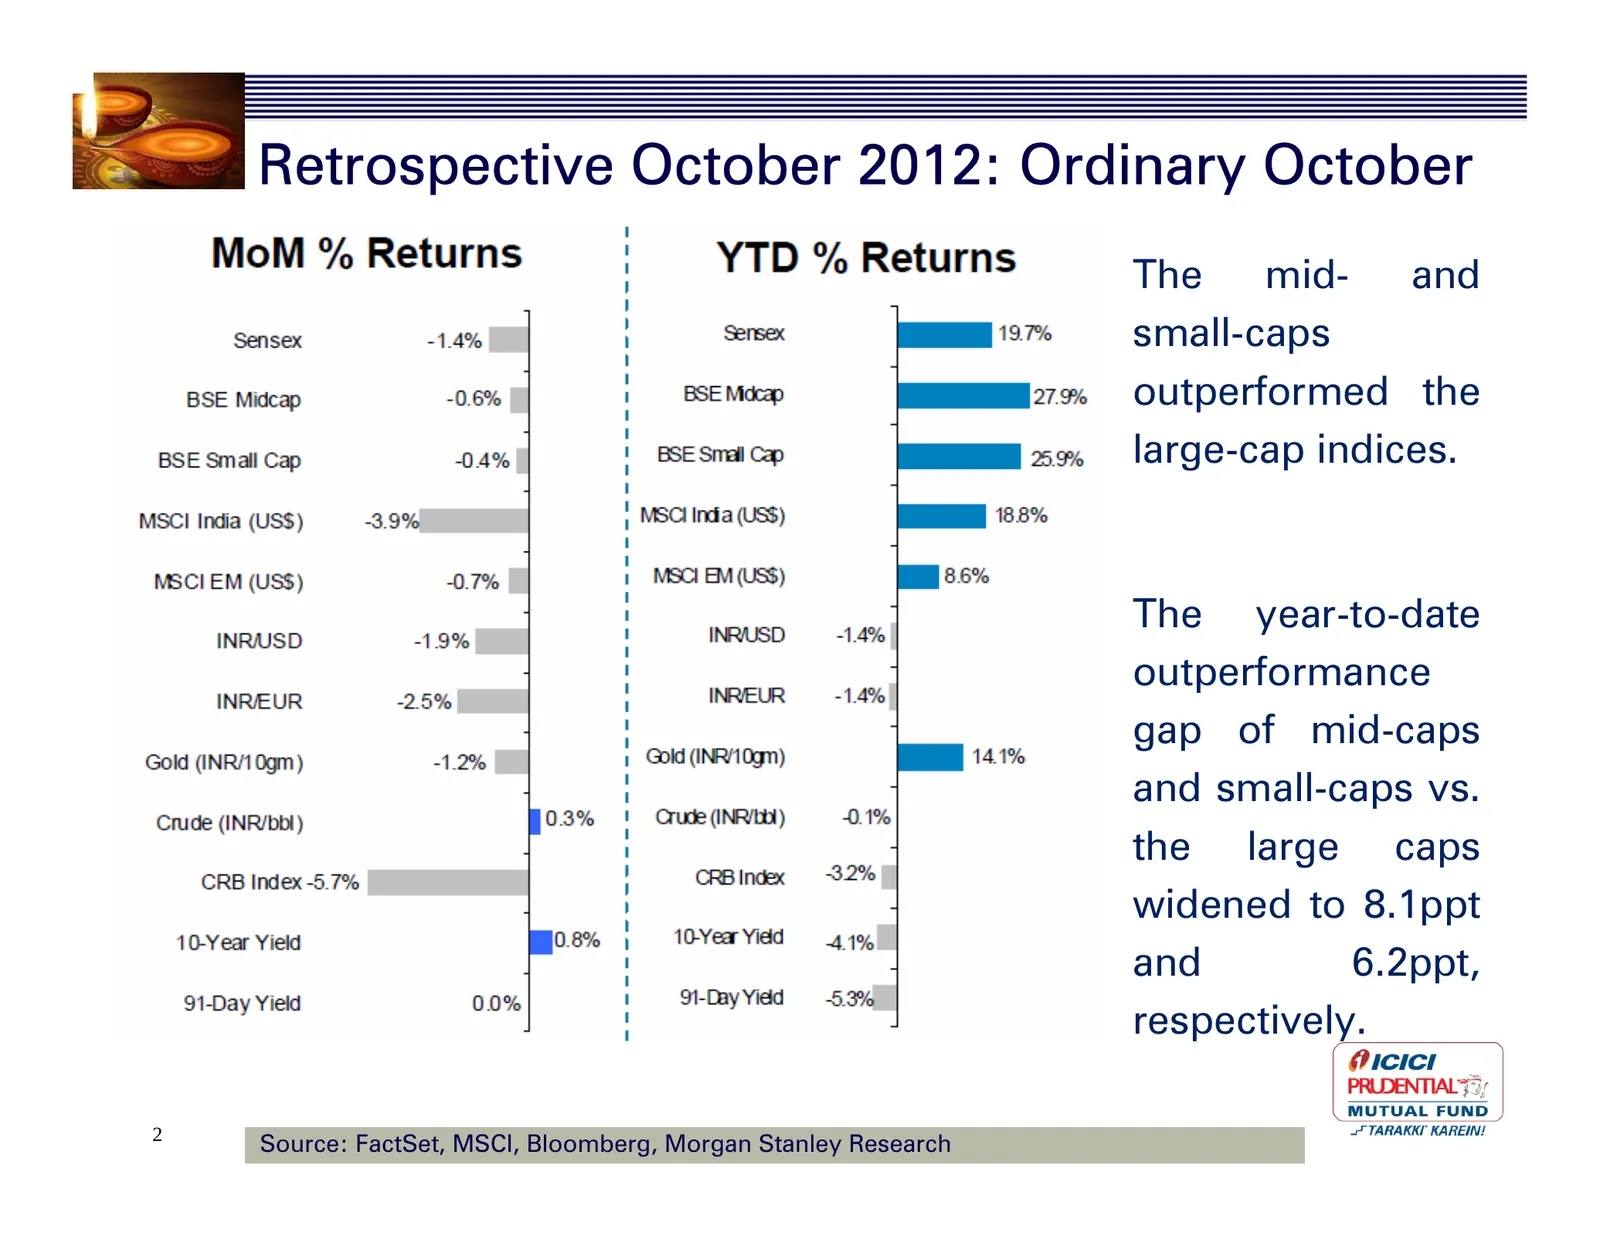
Retrospective October 2012: Ordinary October The mid- and small-caps outperformed the large-cap indices. The year-to-date outperformance gap of mid-caps and small-caps vs. the large caps widened to 8.1ppt and 6.2ppt, respectively. 2 Source: FactSet, MSCI, Bloomberg, Morgan Stanley Research
Slide 3: FII Equity Flows: Strong & STEADY
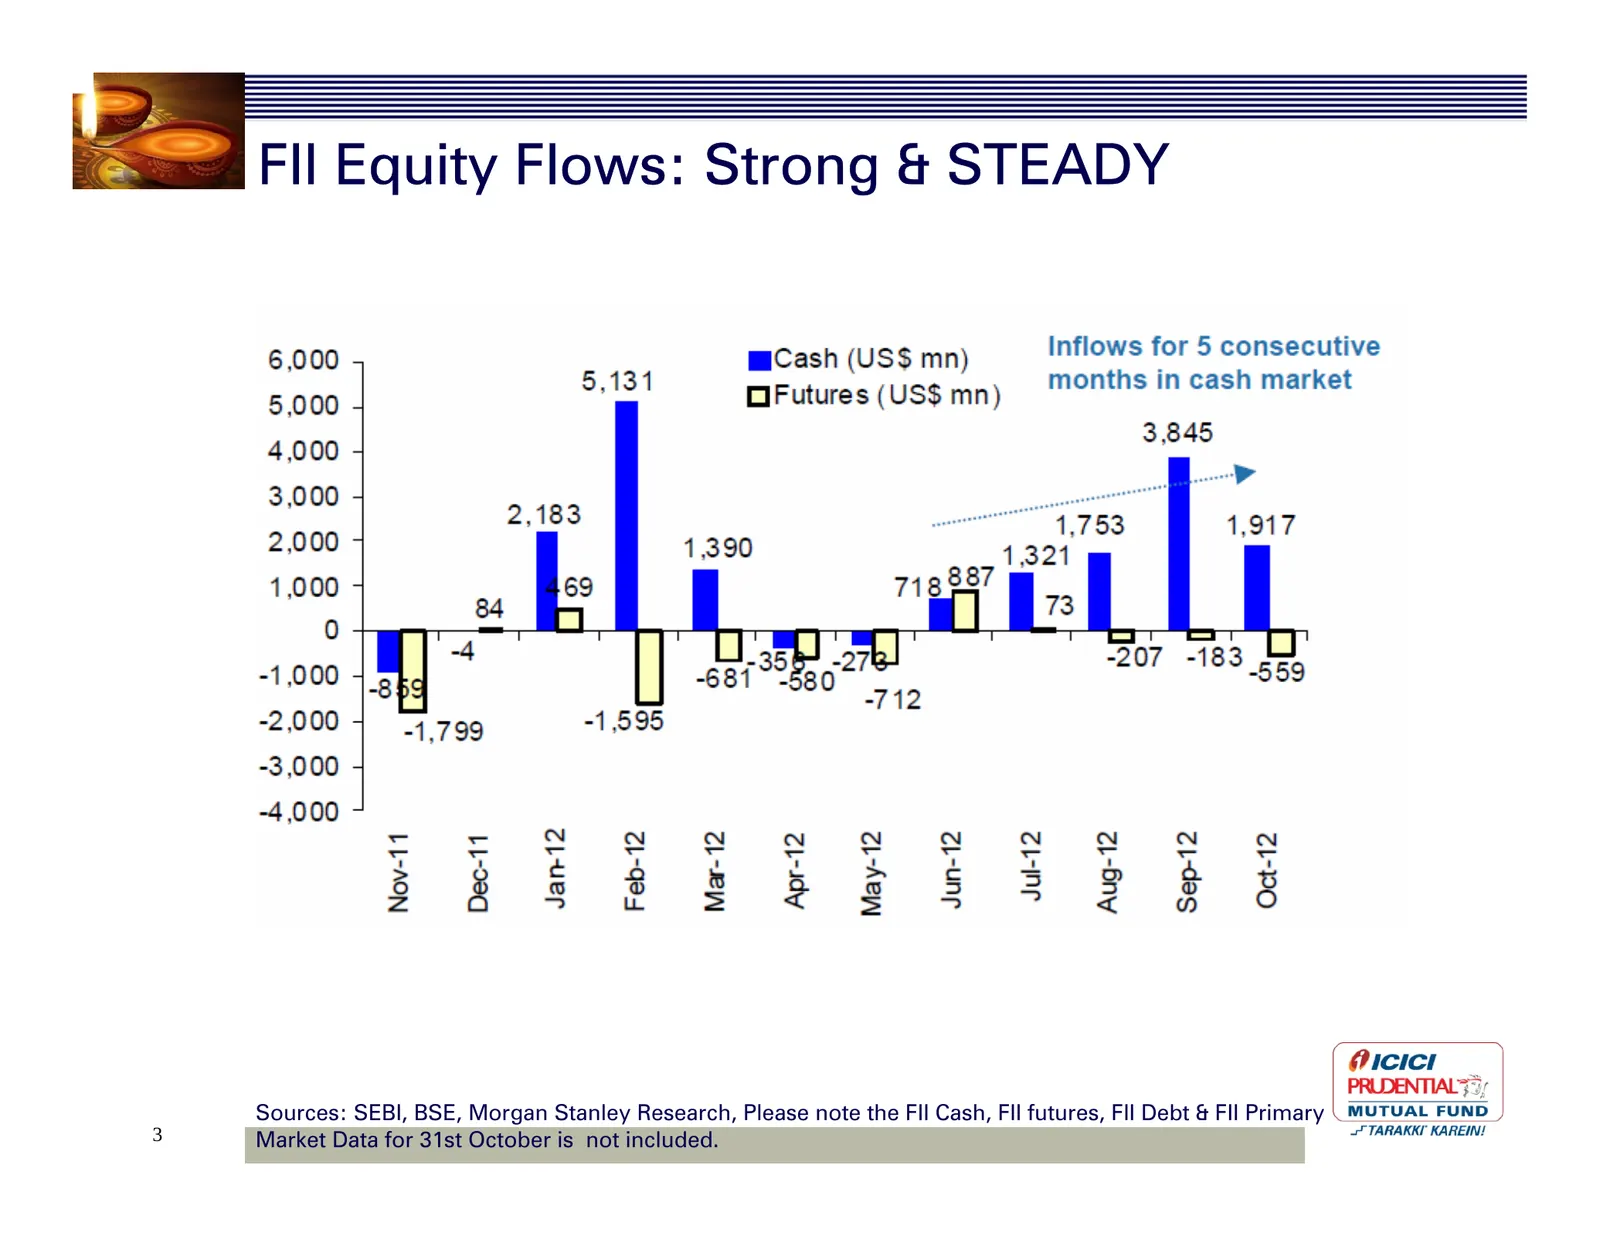
FII Equity Flows: Strong & STEADY Sources: SEBI, BSE, Morgan Stanley Research, Please note the FII Cash, FII futures, FII Debt & FII Primary 3 Market Data for 31st October is not included.
Slide 4: Value of FII Portfolio in India
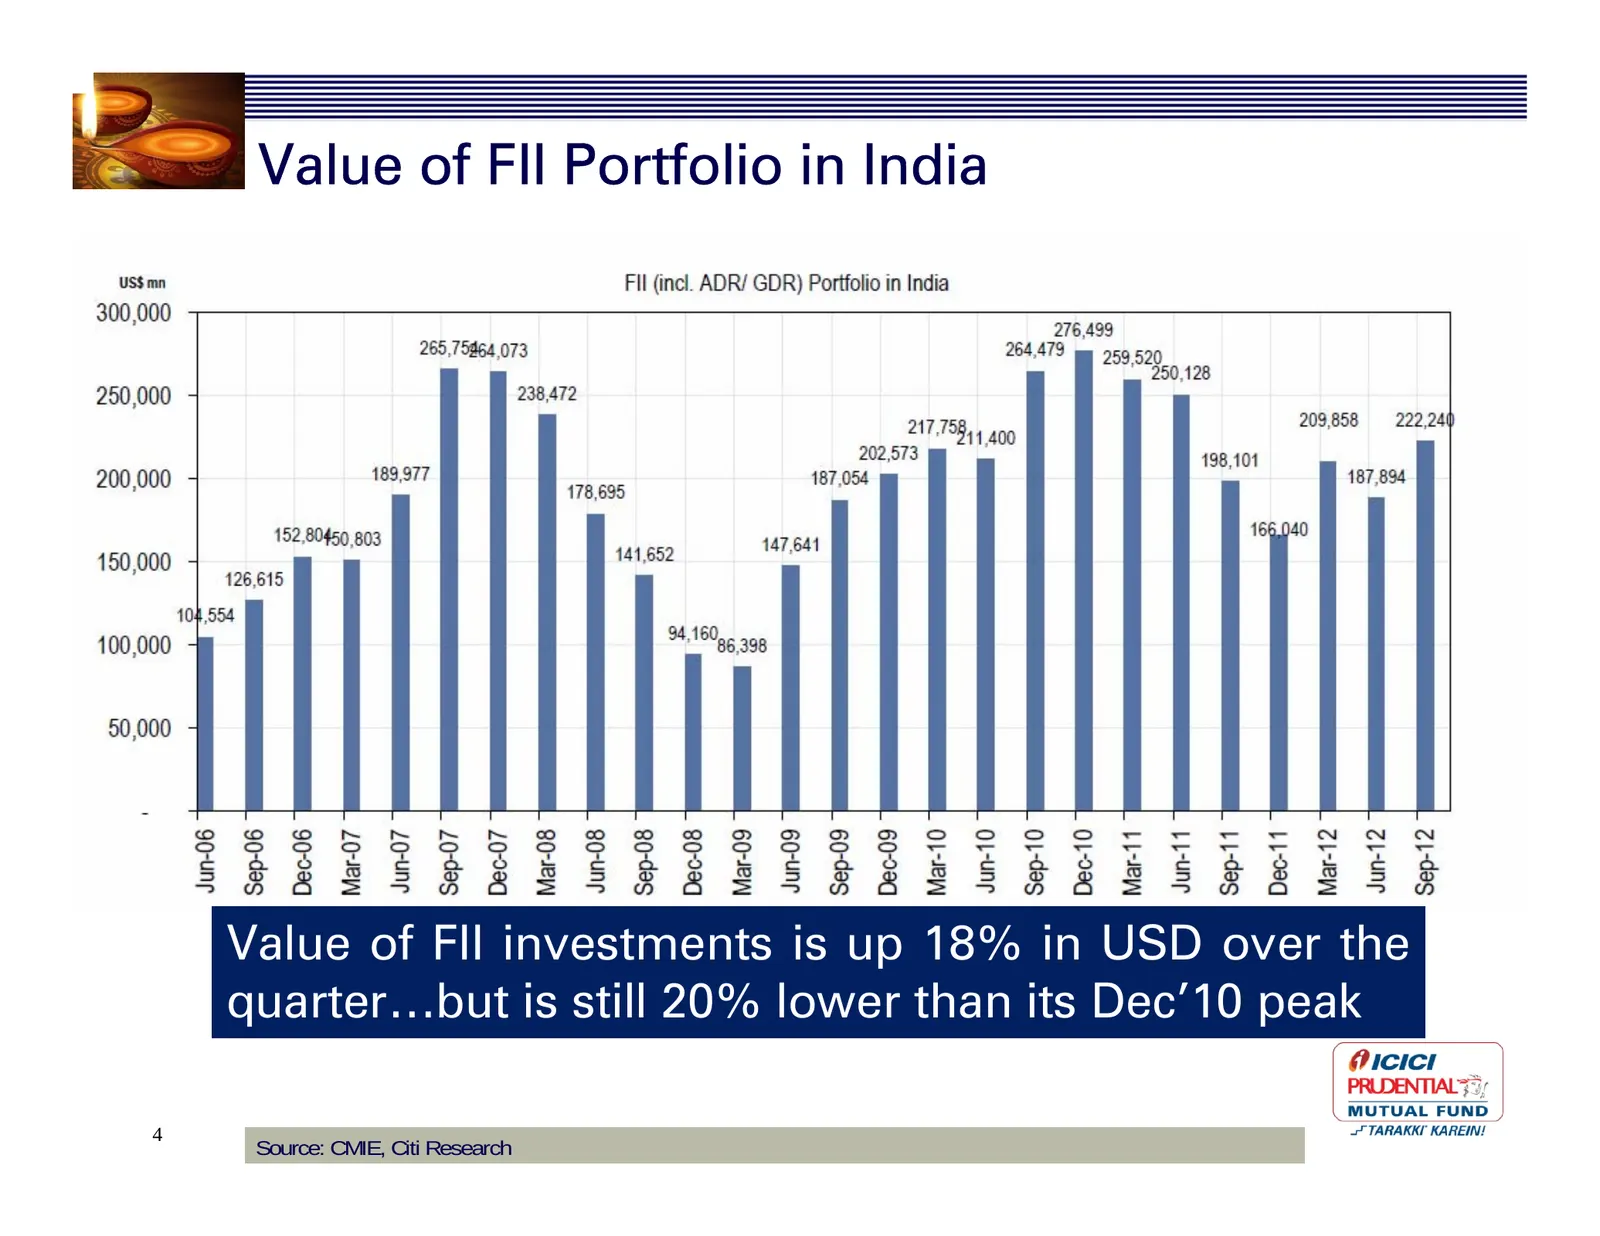
Value of FII Portfolio in India Value of FII investments is up 18% in USD over the quarter…but is still 20% lower than its Dec’10 peak 4 Source: CMIE, Citi Research
Slide 5: Who Owns India Inc?
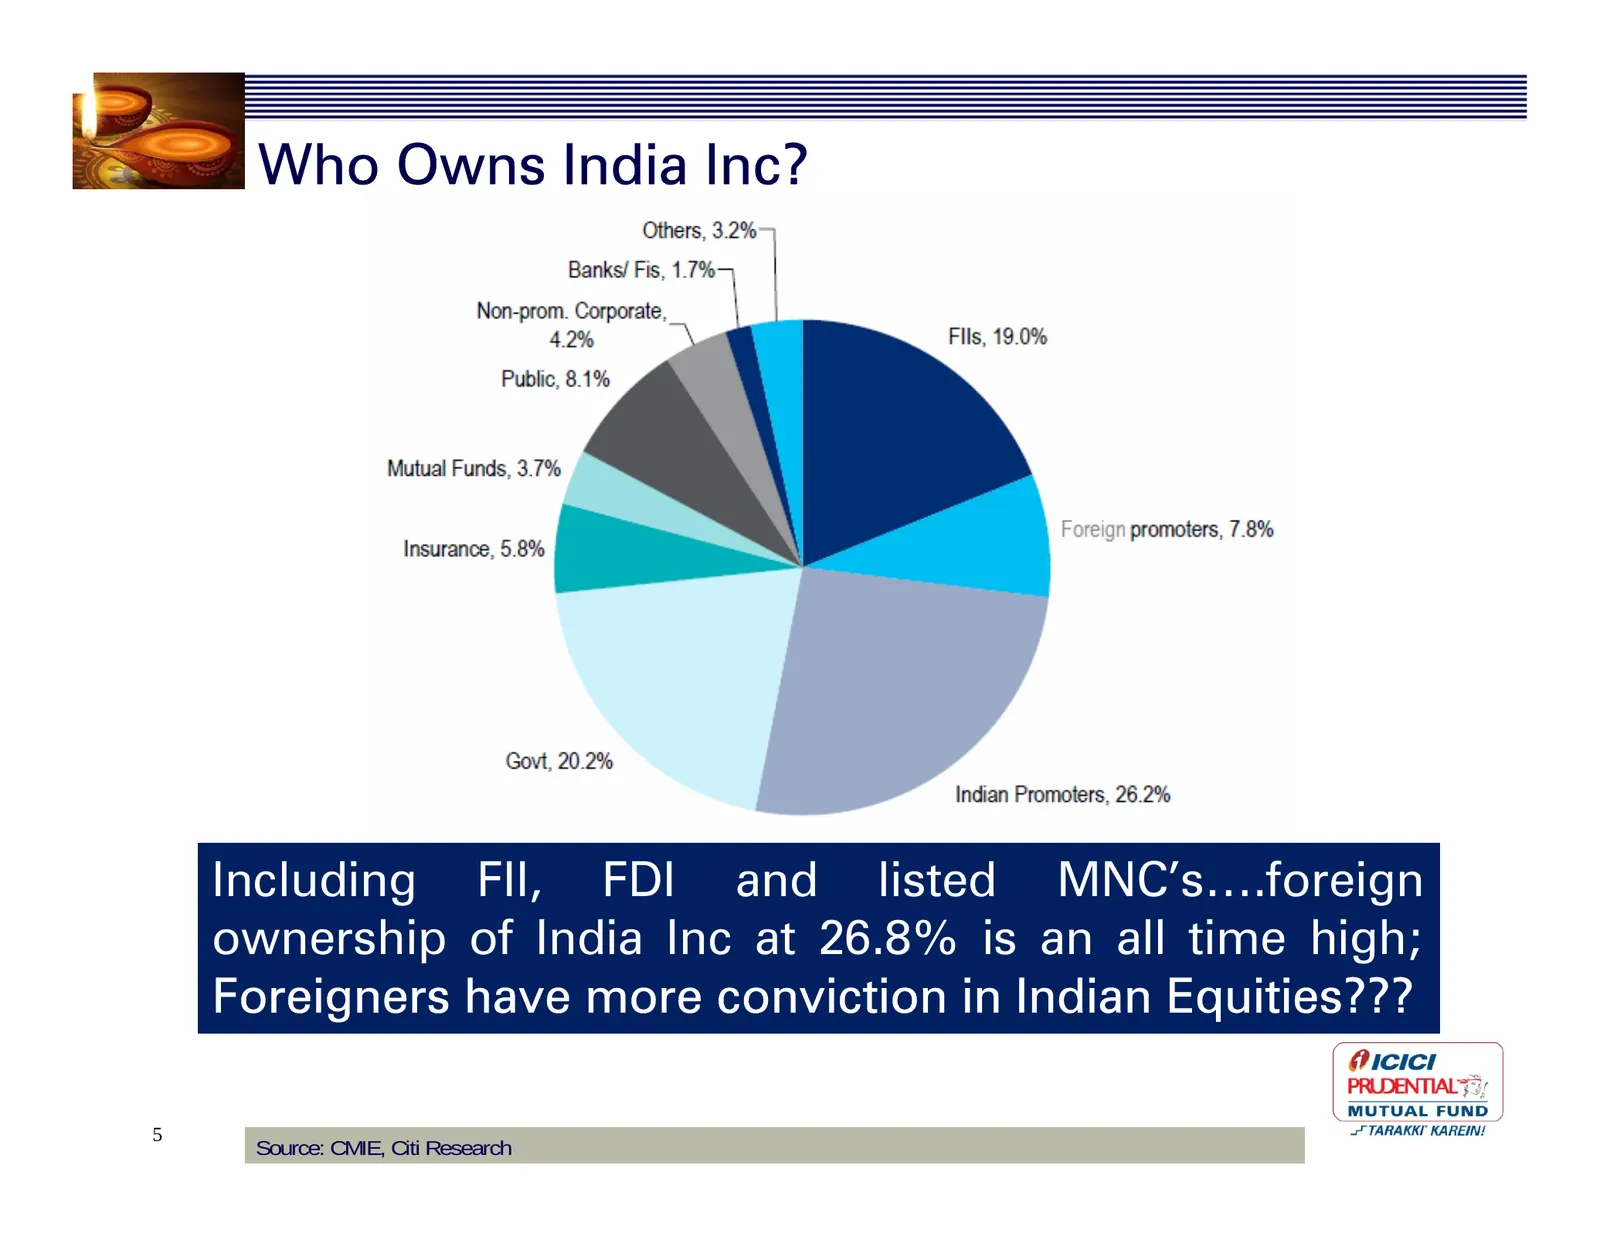
Who Owns India Inc? Including FII, FDI and listed MNC’s….foreign ownership of India Inc at 26.8% is an all time high; Foreigners have more conviction in Indian Equities??? 5 Source: CMIE, Citi Research
Slide 6: FII Ownership concentrated in Top 30
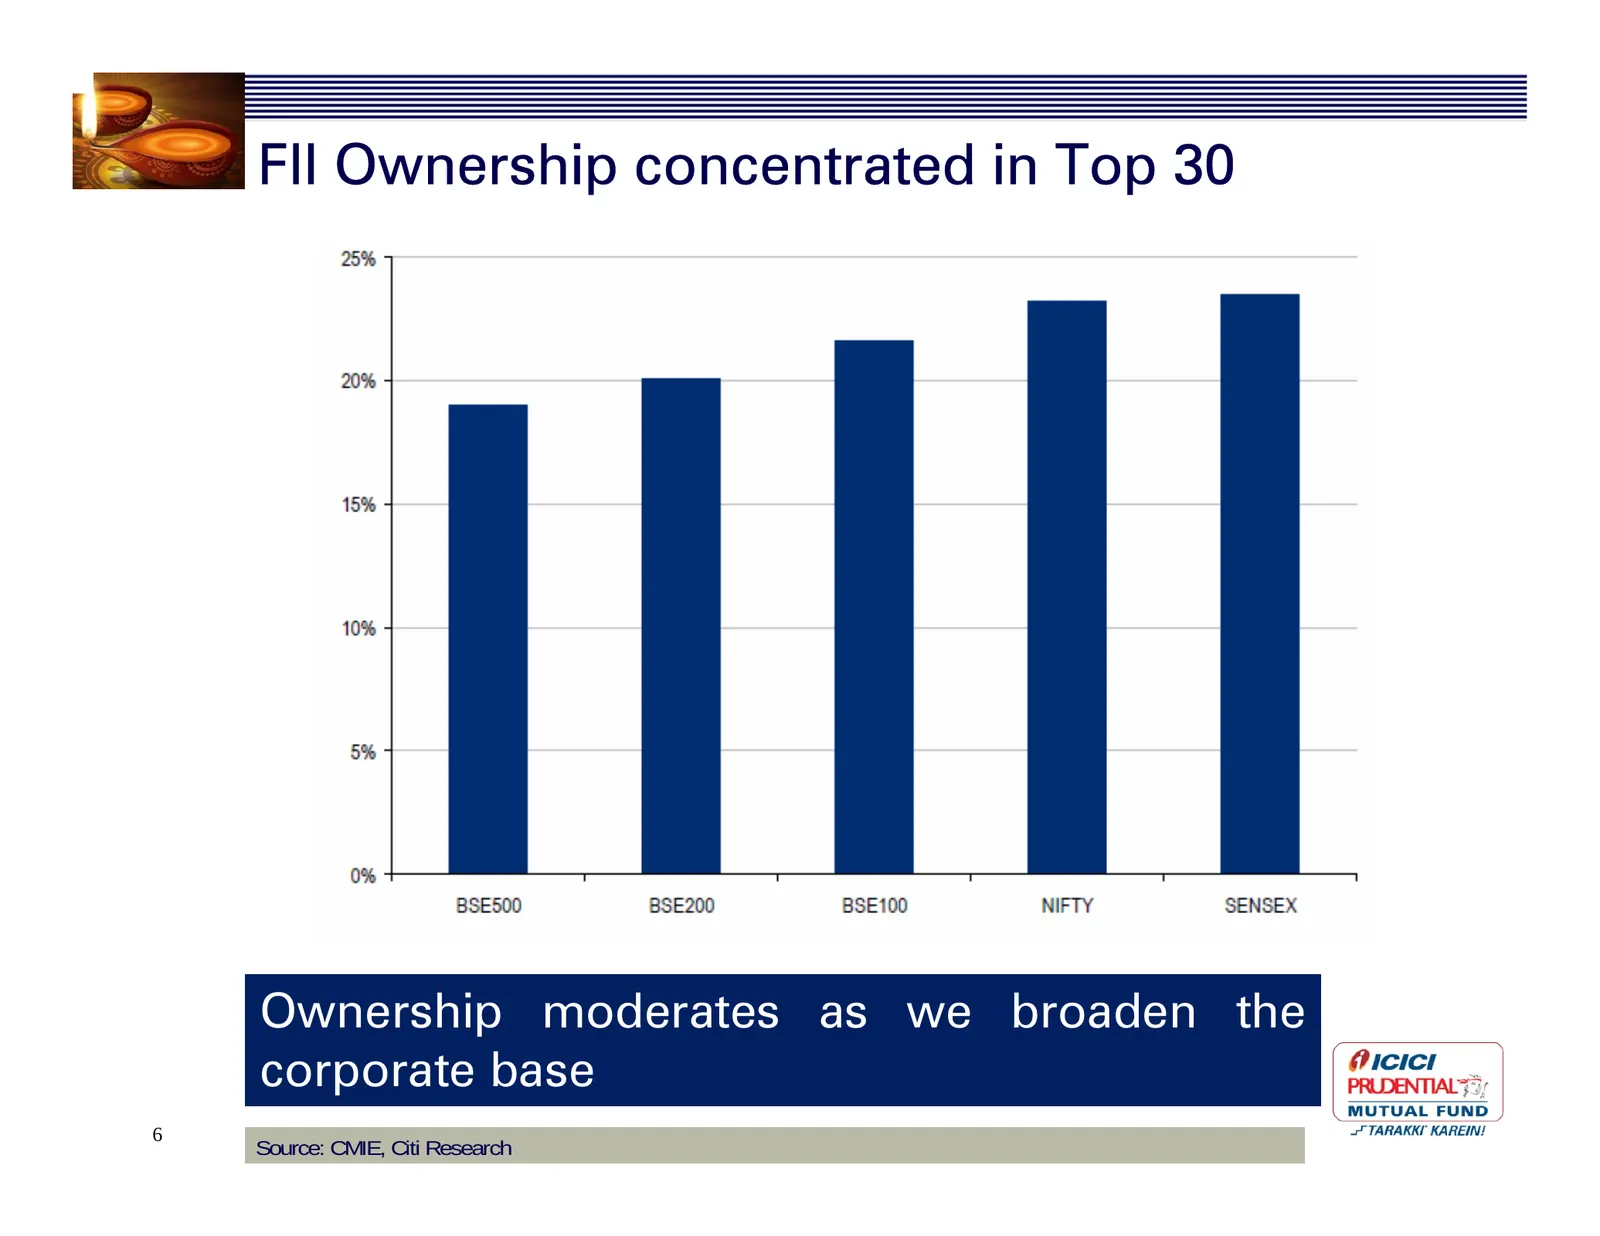
FII Ownership concentrated in Top 30 Ownership moderates as we broaden the corporate base 6 Source: CMIE, Citi Research
Slide 7: Domestic MF: Why Selling Continues?
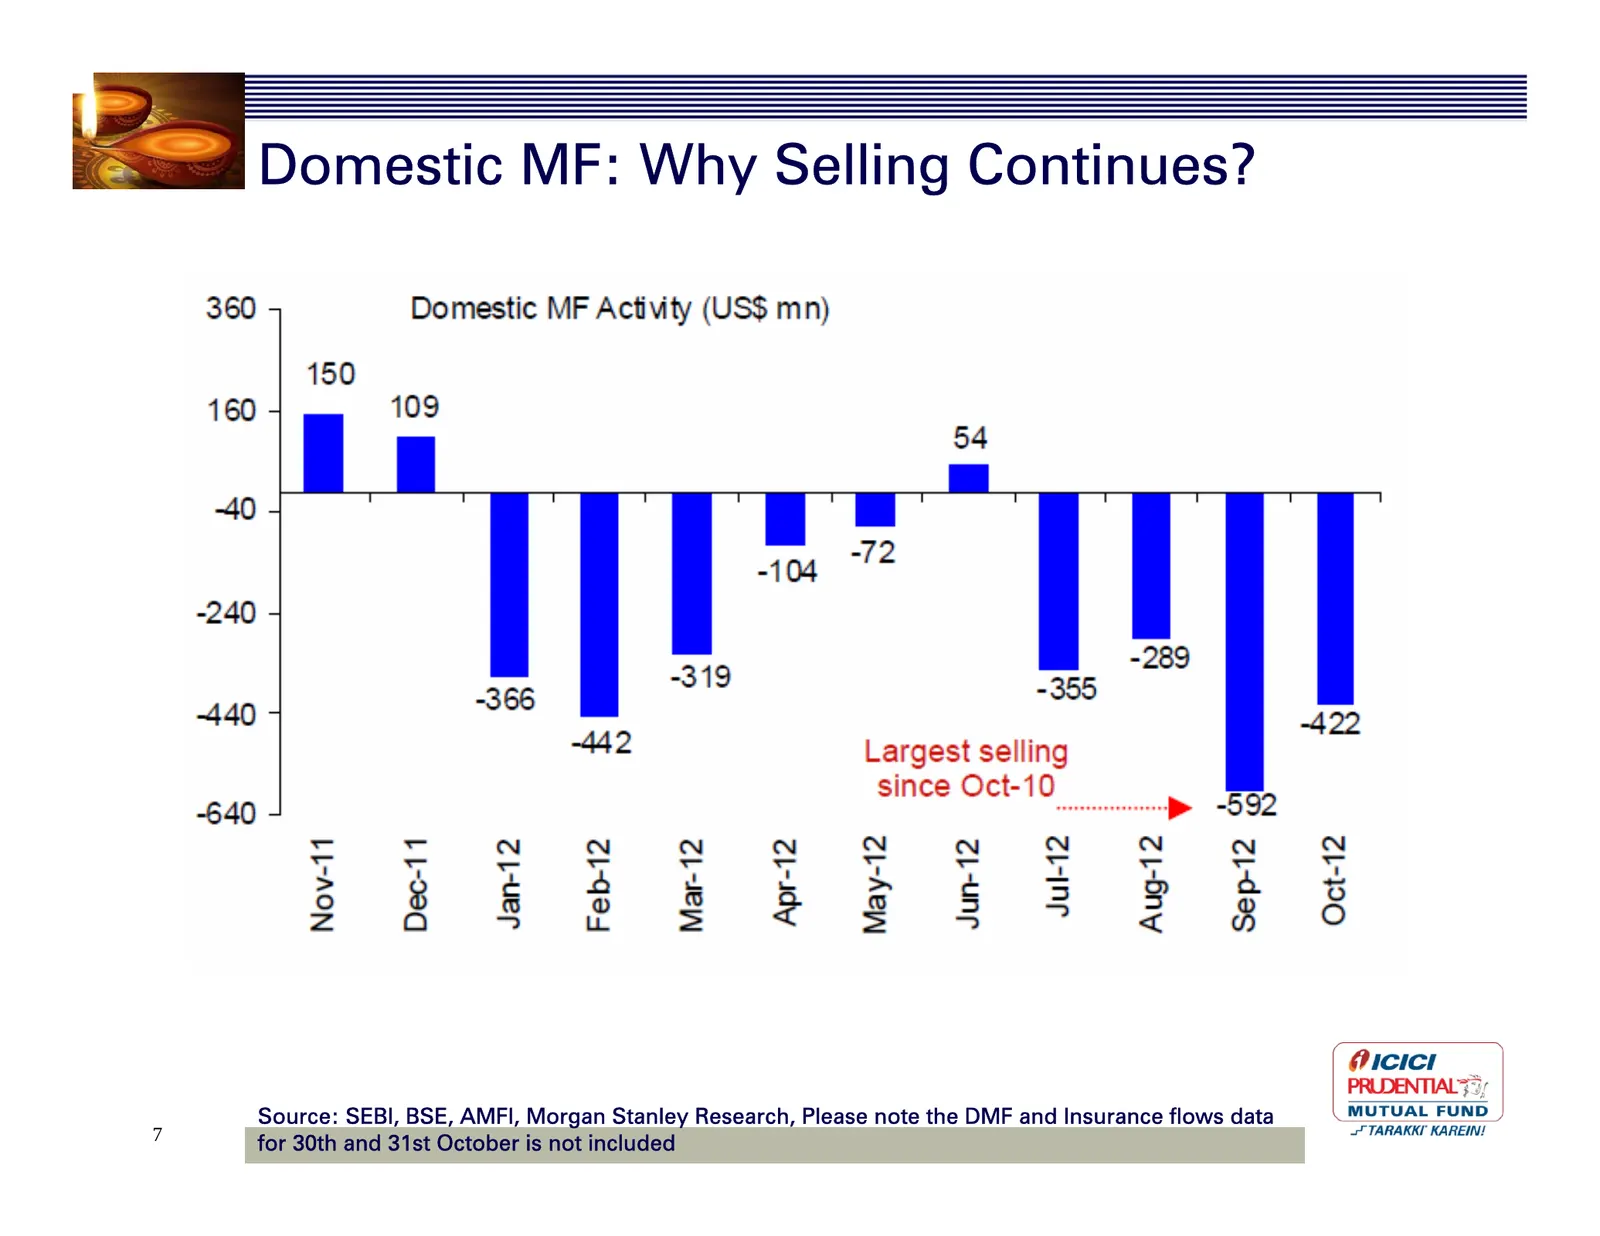
Domestic MF: Why Selling Continues? Source: SEBI, BSE, AMFI, Morgan Stanley Research, Please note the DMF and Insurance flows data 7 for 30th and 31st October is not included
Slide 8: Profit Booking by Retail Investors
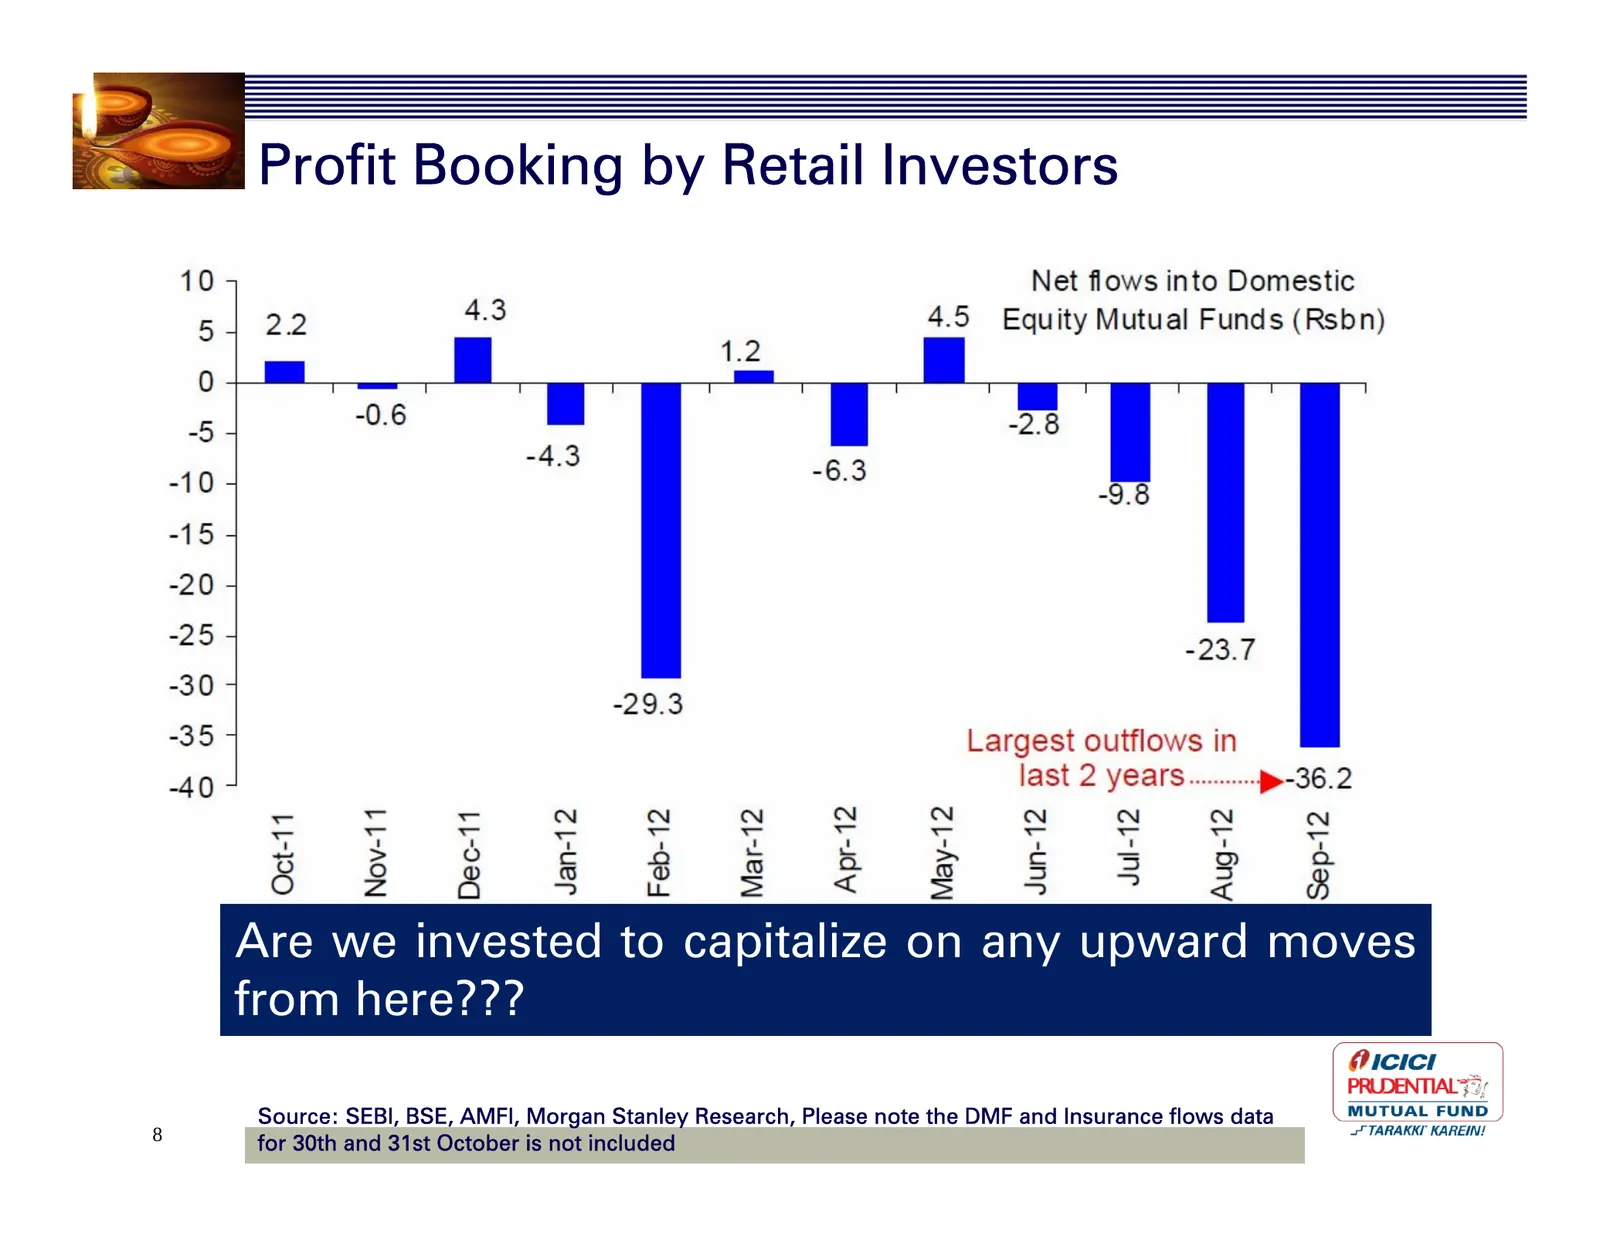
Profit Booking by Retail Investors Are we invested to capitalize on any upward moves from here??? Source: SEBI, BSE, AMFI, Morgan Stanley Research, Please note the DMF and Insurance flows data 8 for 30th and 31st October is not included
Slide 9: Key facets of Equity Investments
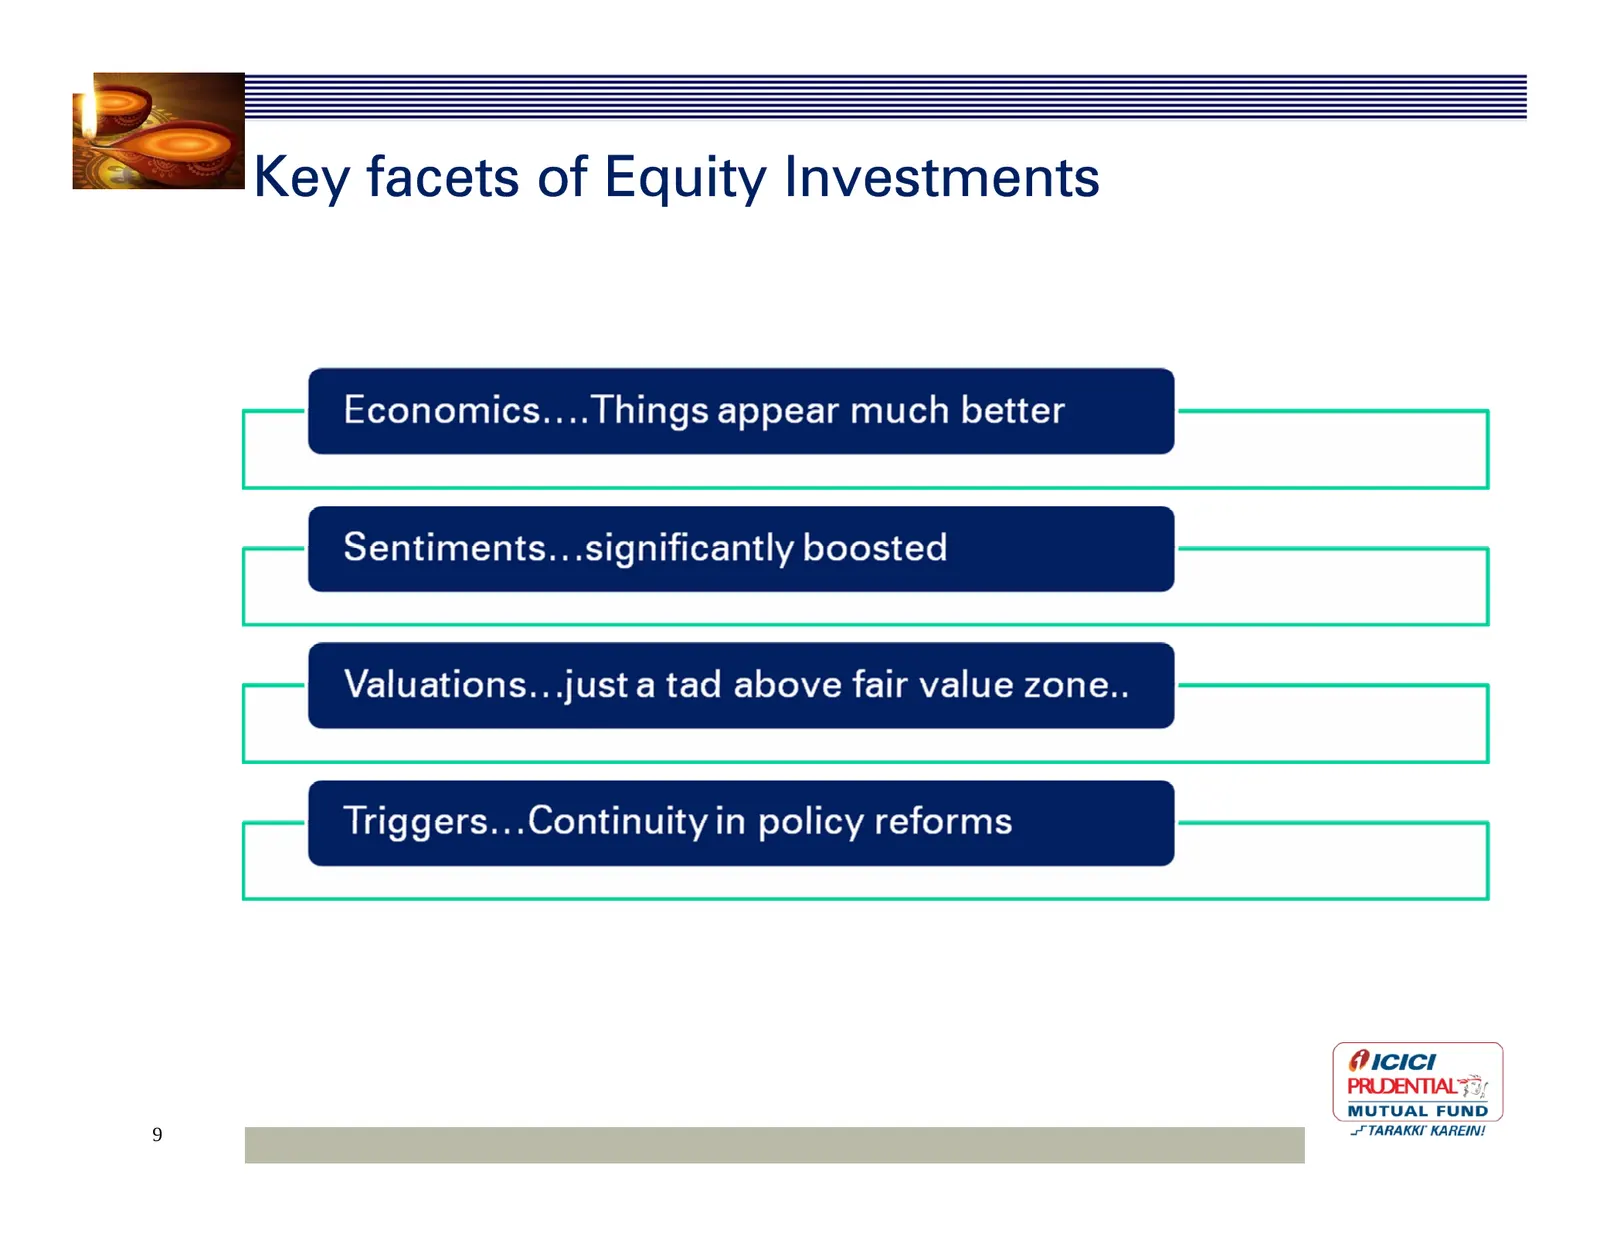
Key facets of Equity Investments 9
Slide 10: Economics
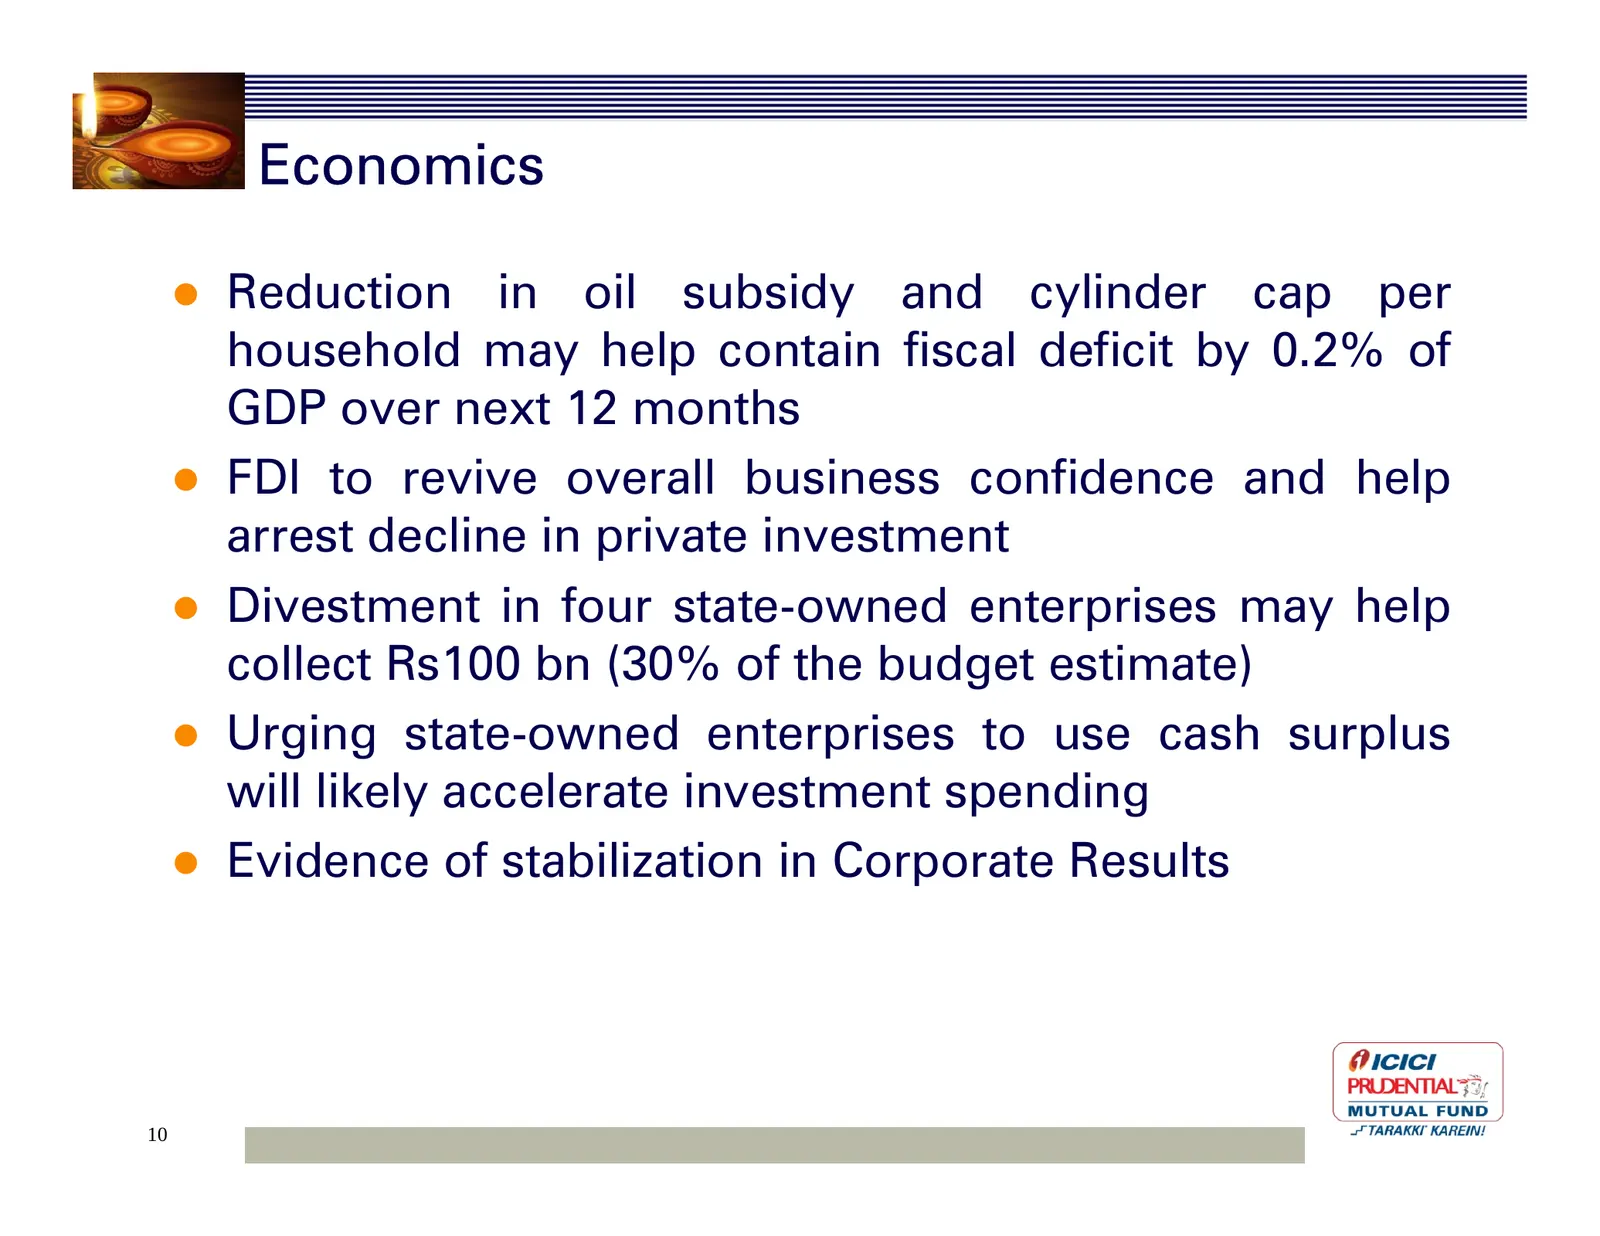
Economics y Reduction in oil subsidy and cylinder cap per household may help contain fiscal deficit by 0.2% of GDP over next 12 months y FDI to revive overall business confidence and help arrest decline in private investment y Divestment in four state-owned enterprises may help collect Rs100 bn (30%
Slide 11: Sentiments
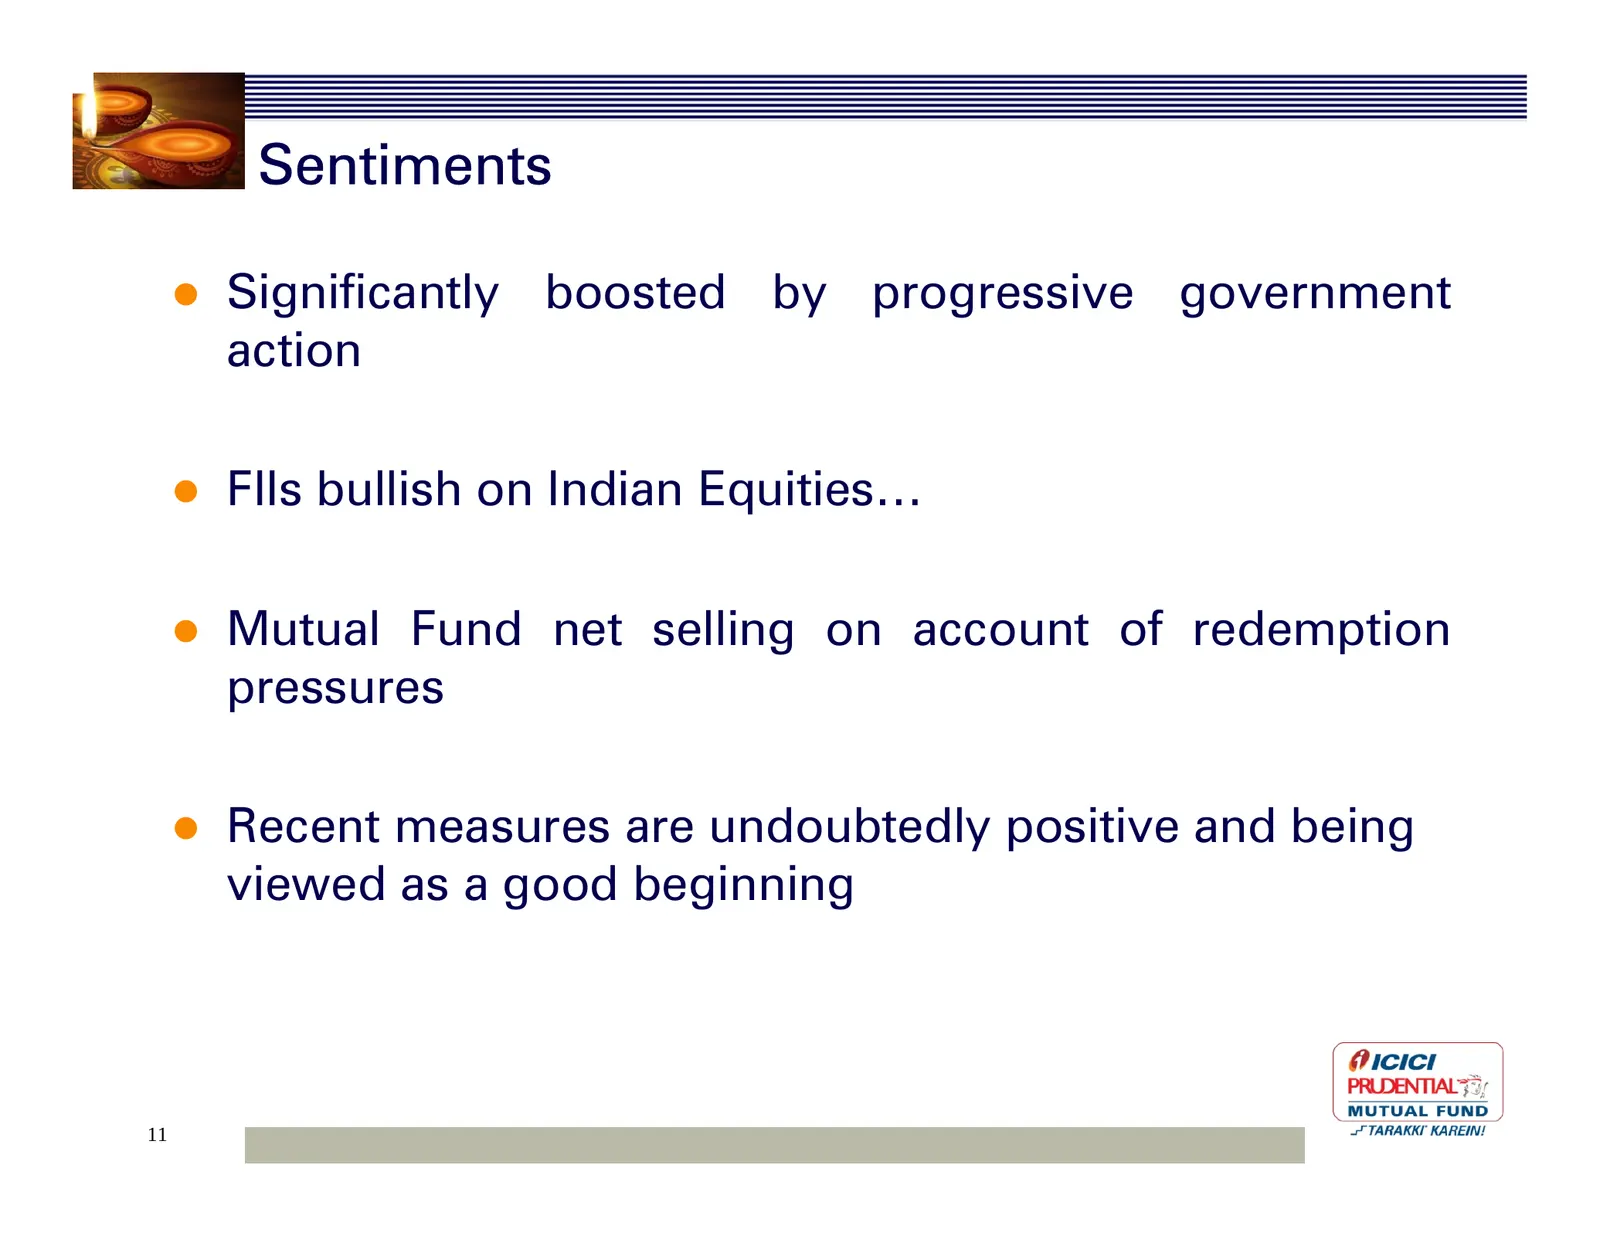
Sentiments y Significantly boosted by progressive government action y FIIs bullish on Indian Equities… y Mutual Fund net selling on account of redemption pressures y Recent measures are undoubtedly positive and being viewed as a good beginning 11
Slide 12: Valuations - Fair value
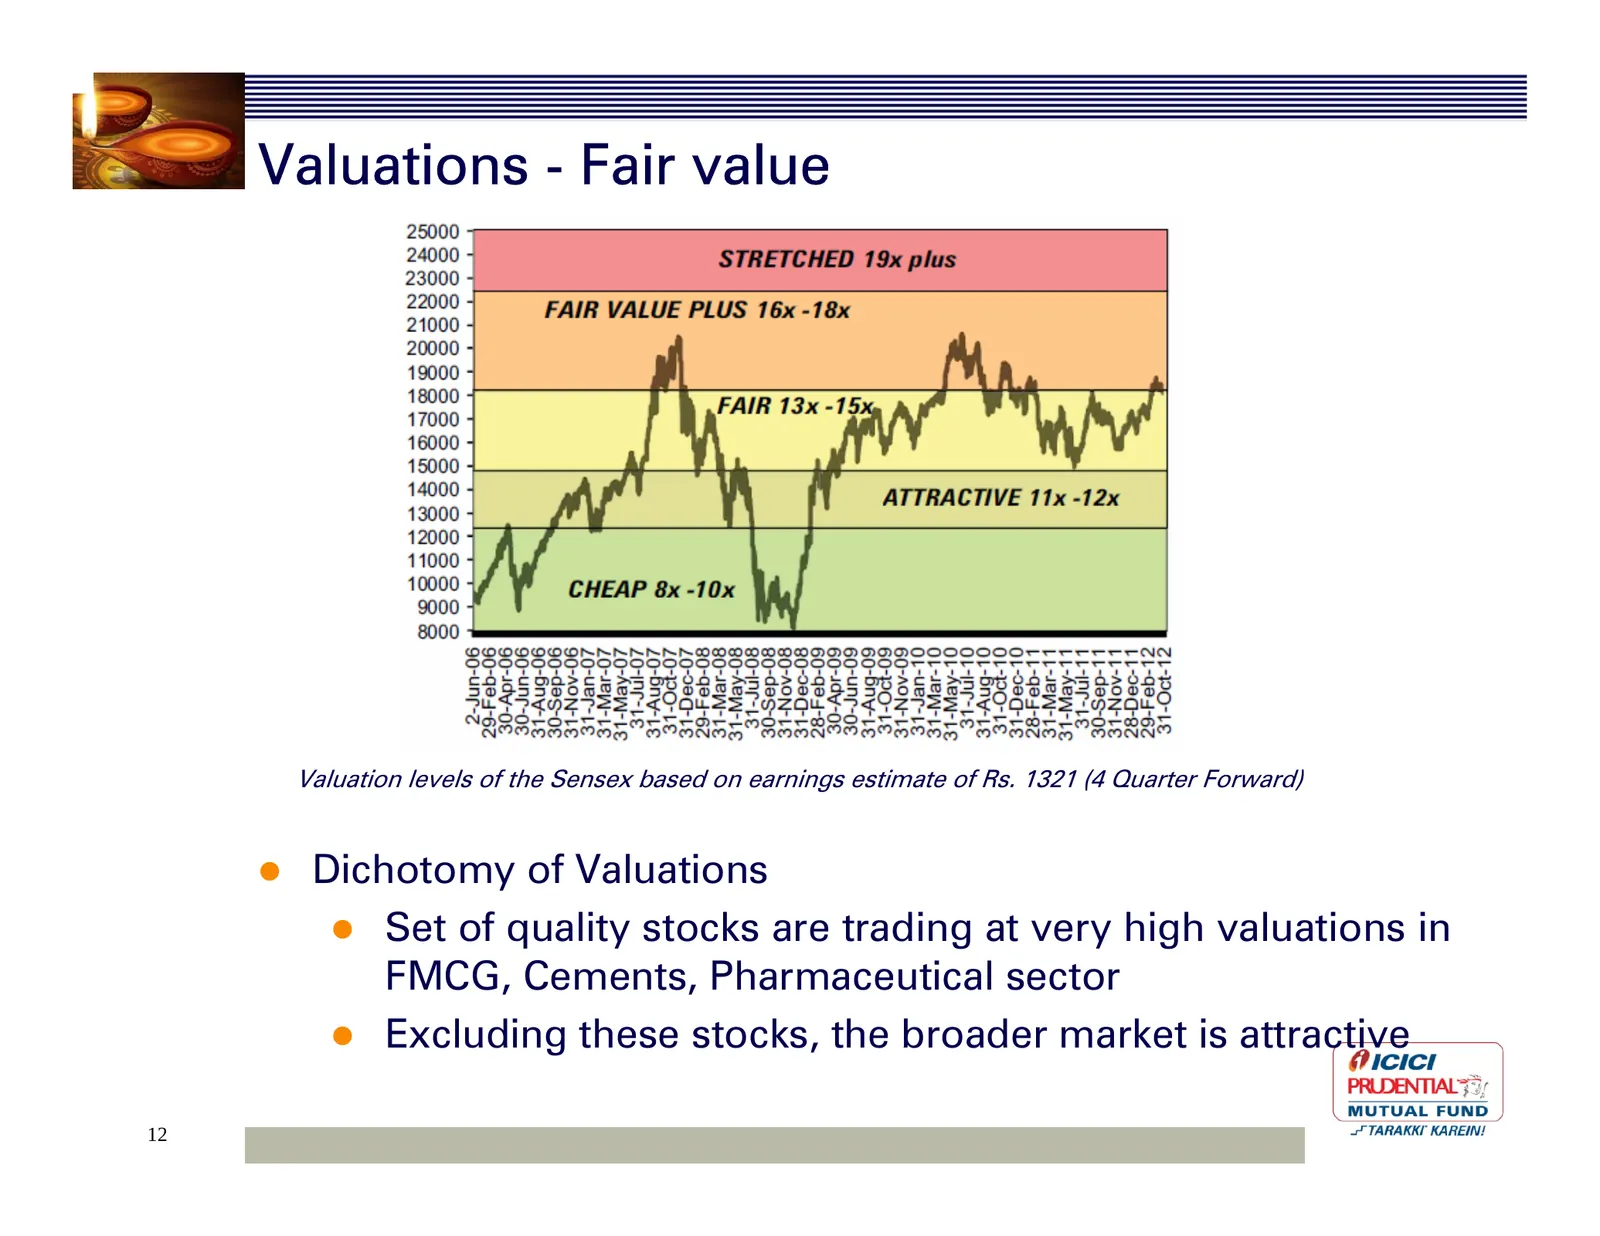
Valuations - Fair value Valuation levels of the Sensex based on earnings estimate of Rs. 1321 (4 Quarter Forward) y Dichotomy of Valuations y Set of quality stocks are trading at very high valuations in FMCG, Cements, Pharmaceutical sector y Excluding these stocks, the broader market is attractive 1
Slide 13: Triggers
Triggers y Follow up on policy reforms - Steps outside divestment like increased taxation and further hike in fuel prices that will likely aid in further fiscal consolidation y Crude prices not having rallied post the liquidity gush, is a positive. Crude below or at US $ 100 per barrel y RBI cutting
Slide 14: Equity Outlook & Recommendation
Equity Outlook & Recommendation y Equity Outlook y Markets likely to continue being volatile with upside potential based on triggers being achieved y More headroom available to RBI for lowering interest rates y Infrastructure as a sector is expected to see positive action y Recommendations y For lum
Slide 15: Fixed Income Outlook
Fixed Income Outlook Rate cut delayed but inevitable….. 15
Slide 16: RBI Policy Rates
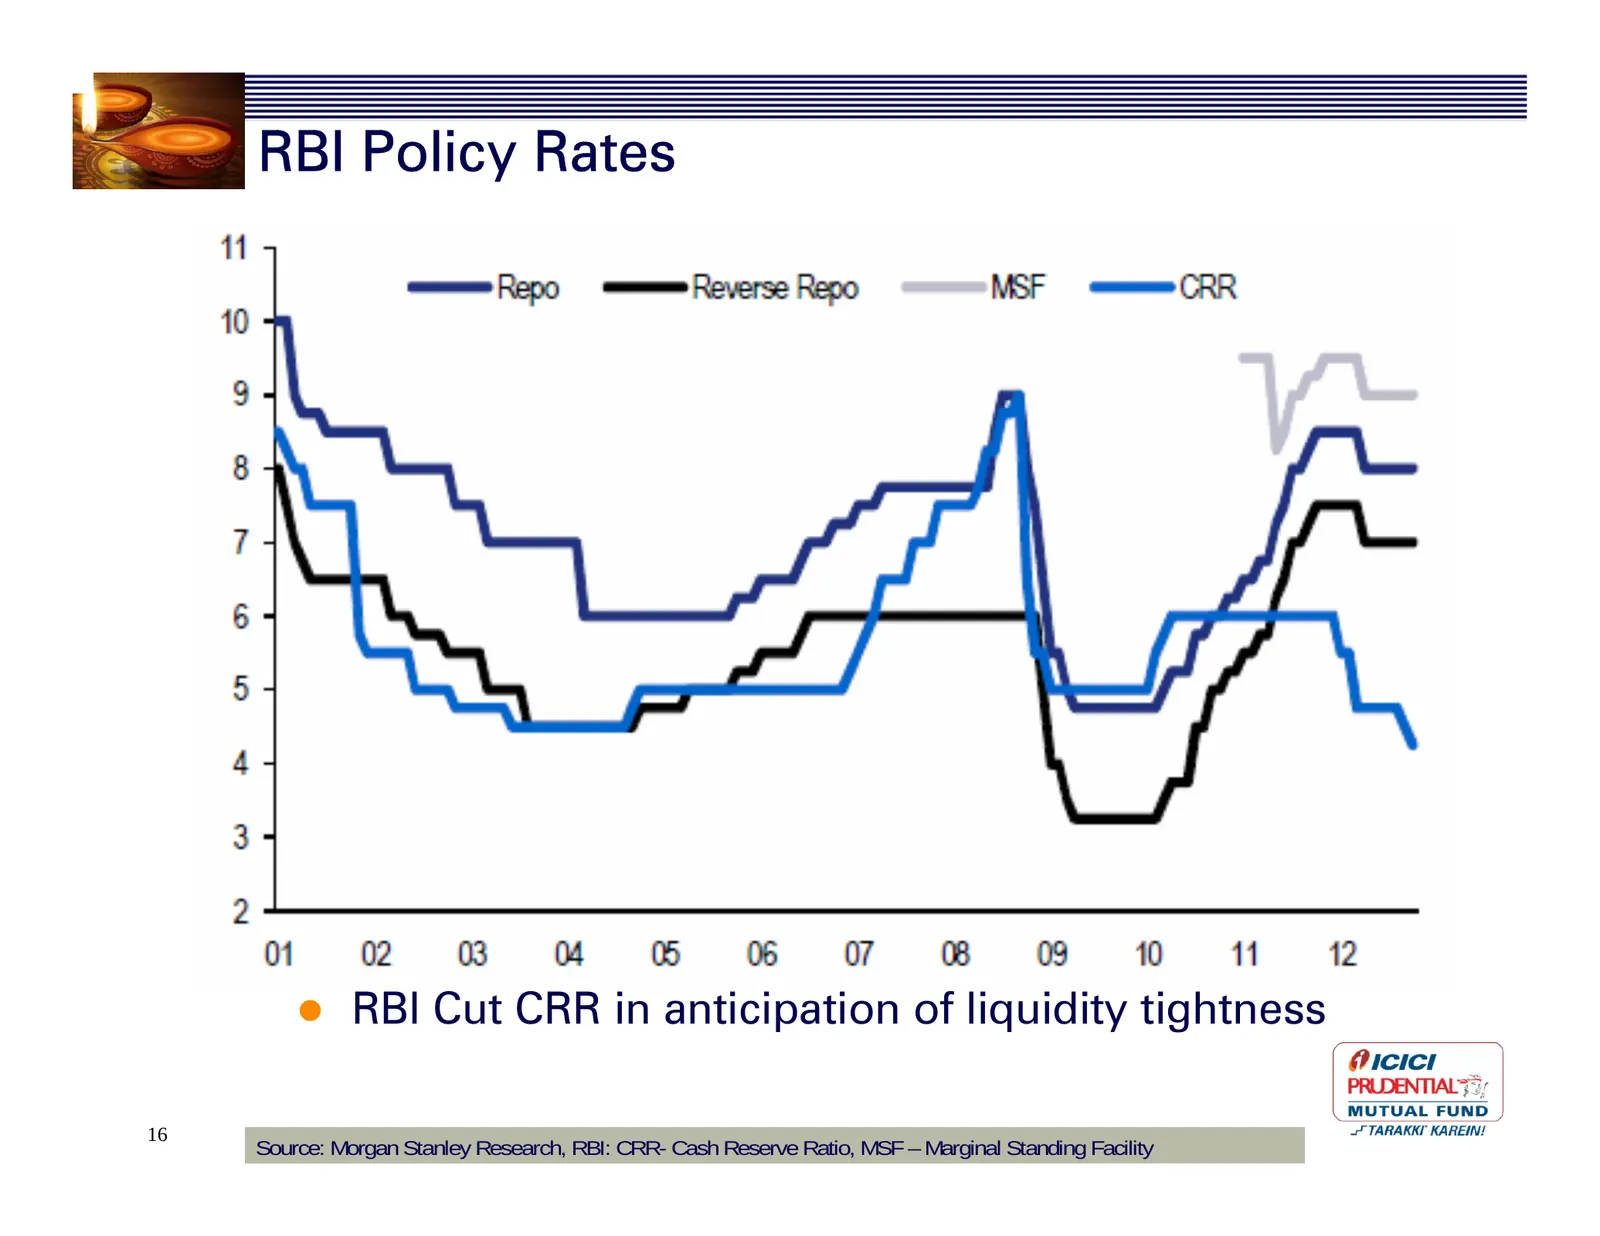
RBI Policy Rates y RBI Cut CRR in anticipation of liquidity tightness 16 Source: Morgan Stanley Research, RBI: CRR- Cash Reserve Ratio, MSF – Marginal Standing Facility
Slide 17: Inflation (WPI)
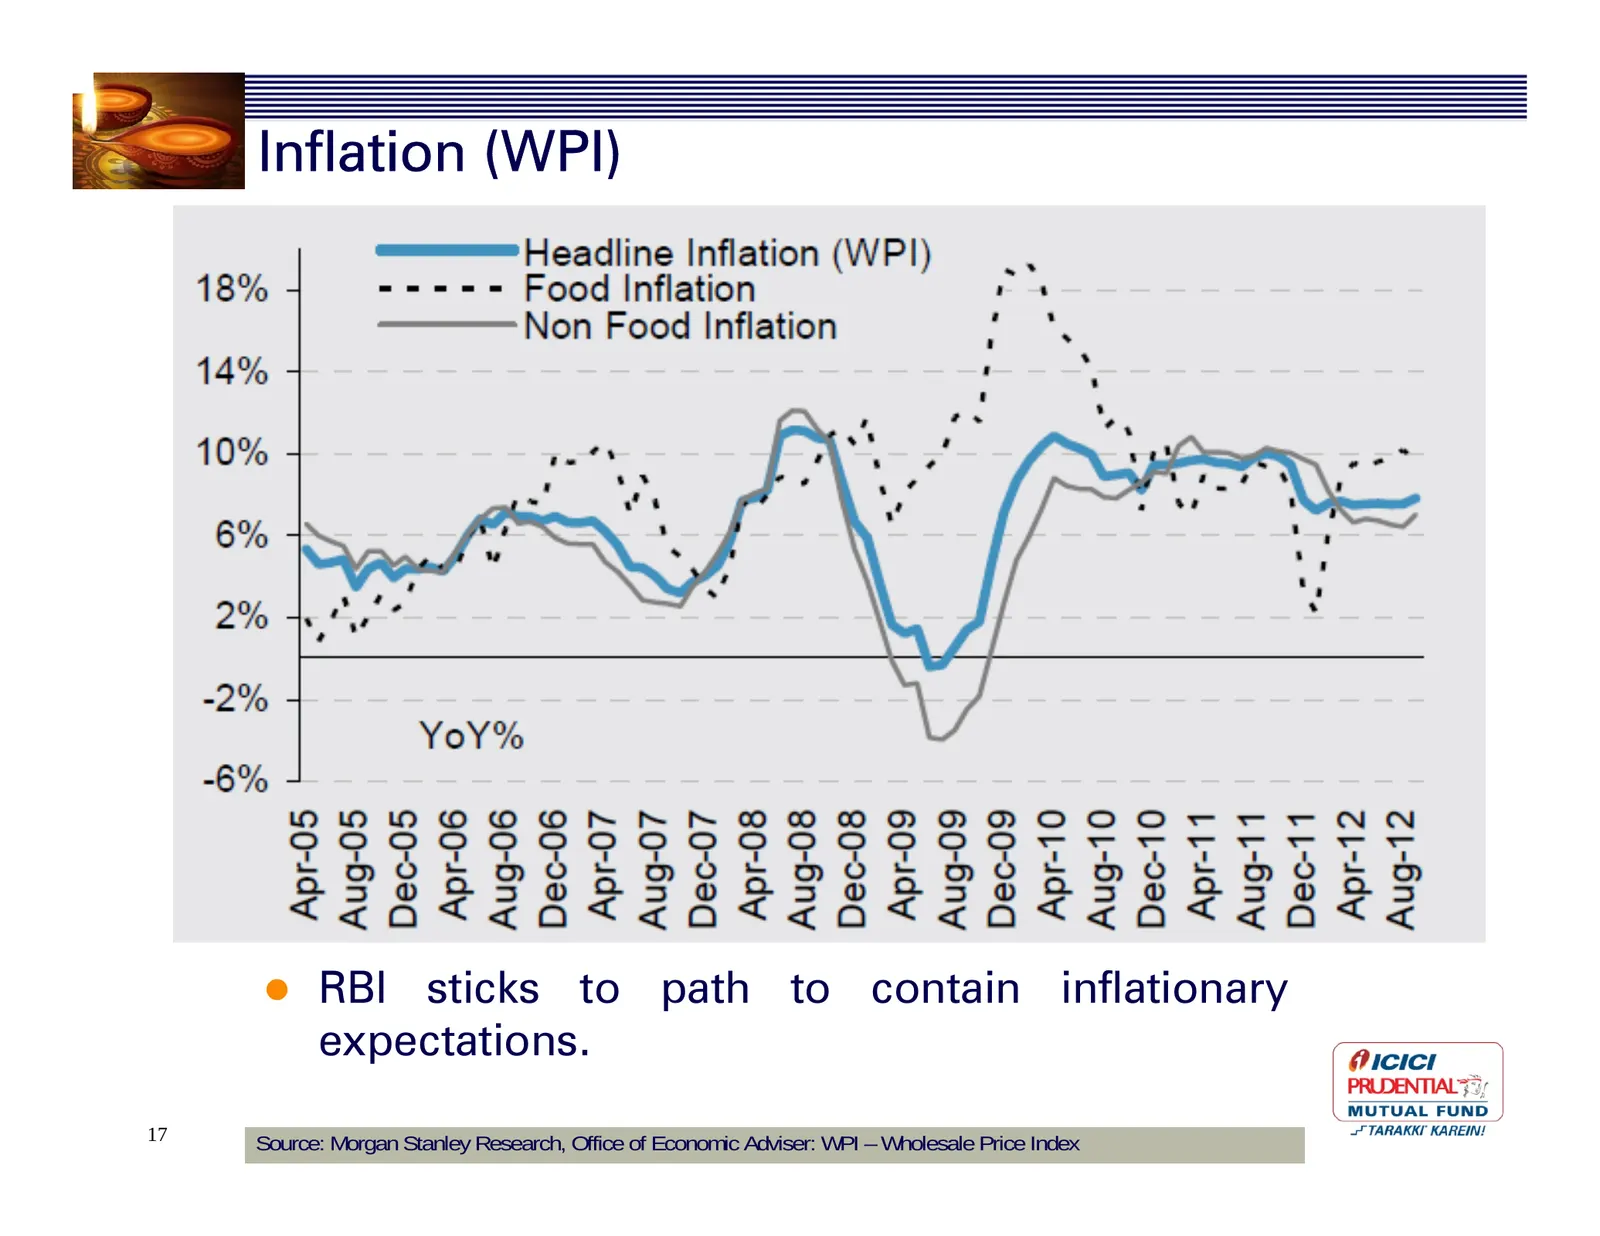
Inflation (WPI) y RBI sticks to path to contain inflationary expectations. 17 Source: Morgan Stanley Research, Office of Economic Adviser: WPI – Wholesale Price Index
Slide 18: Low interest rates a pre-condition for growth revival
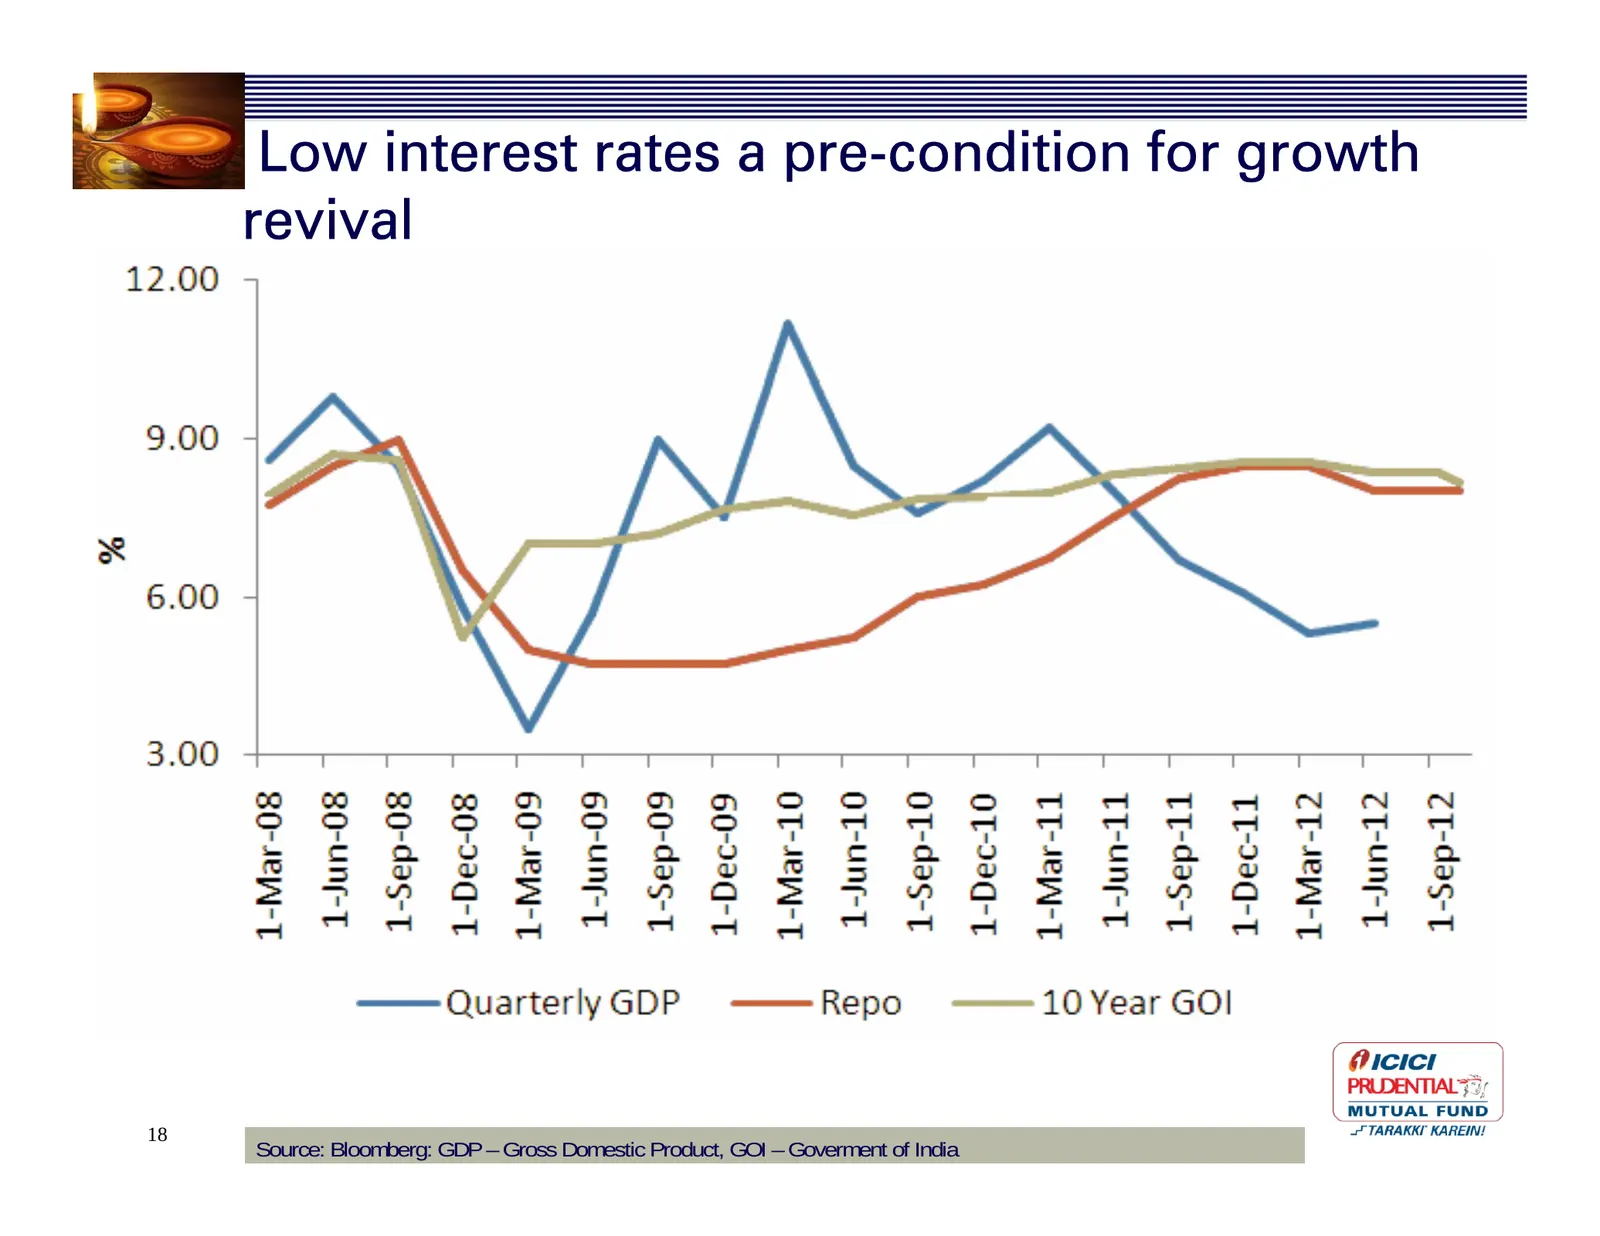
Low interest rates a pre-condition for growth revival 18 Source: Bloomberg: GDP – Gross Domestic Product, GOI – Goverment of India
Slide 19: RBI Policy
RBI Policy y RBI expects Inflation to come down to 7.50% range by January’ 2013 y If Inflation behaves in line with RBI’s expectation with no major fiscal slippage, then high probability of decline in interest rates to the extent of 50-75 bps over next six months. y By that time, better clarity will
Slide 20: Liquidity
Liquidity y By end of Nov’2012 expect liquidity deficit to be in the range of INR 1.25 – 1.35 trillion y CRR cut of 25 bps may not be adequate y Therefore, OMOs will need to be conducted to bring liquidity within RBI’s comfort zone. y In next 3-4 months, expect OMOs to the extent of equivalent of 1%
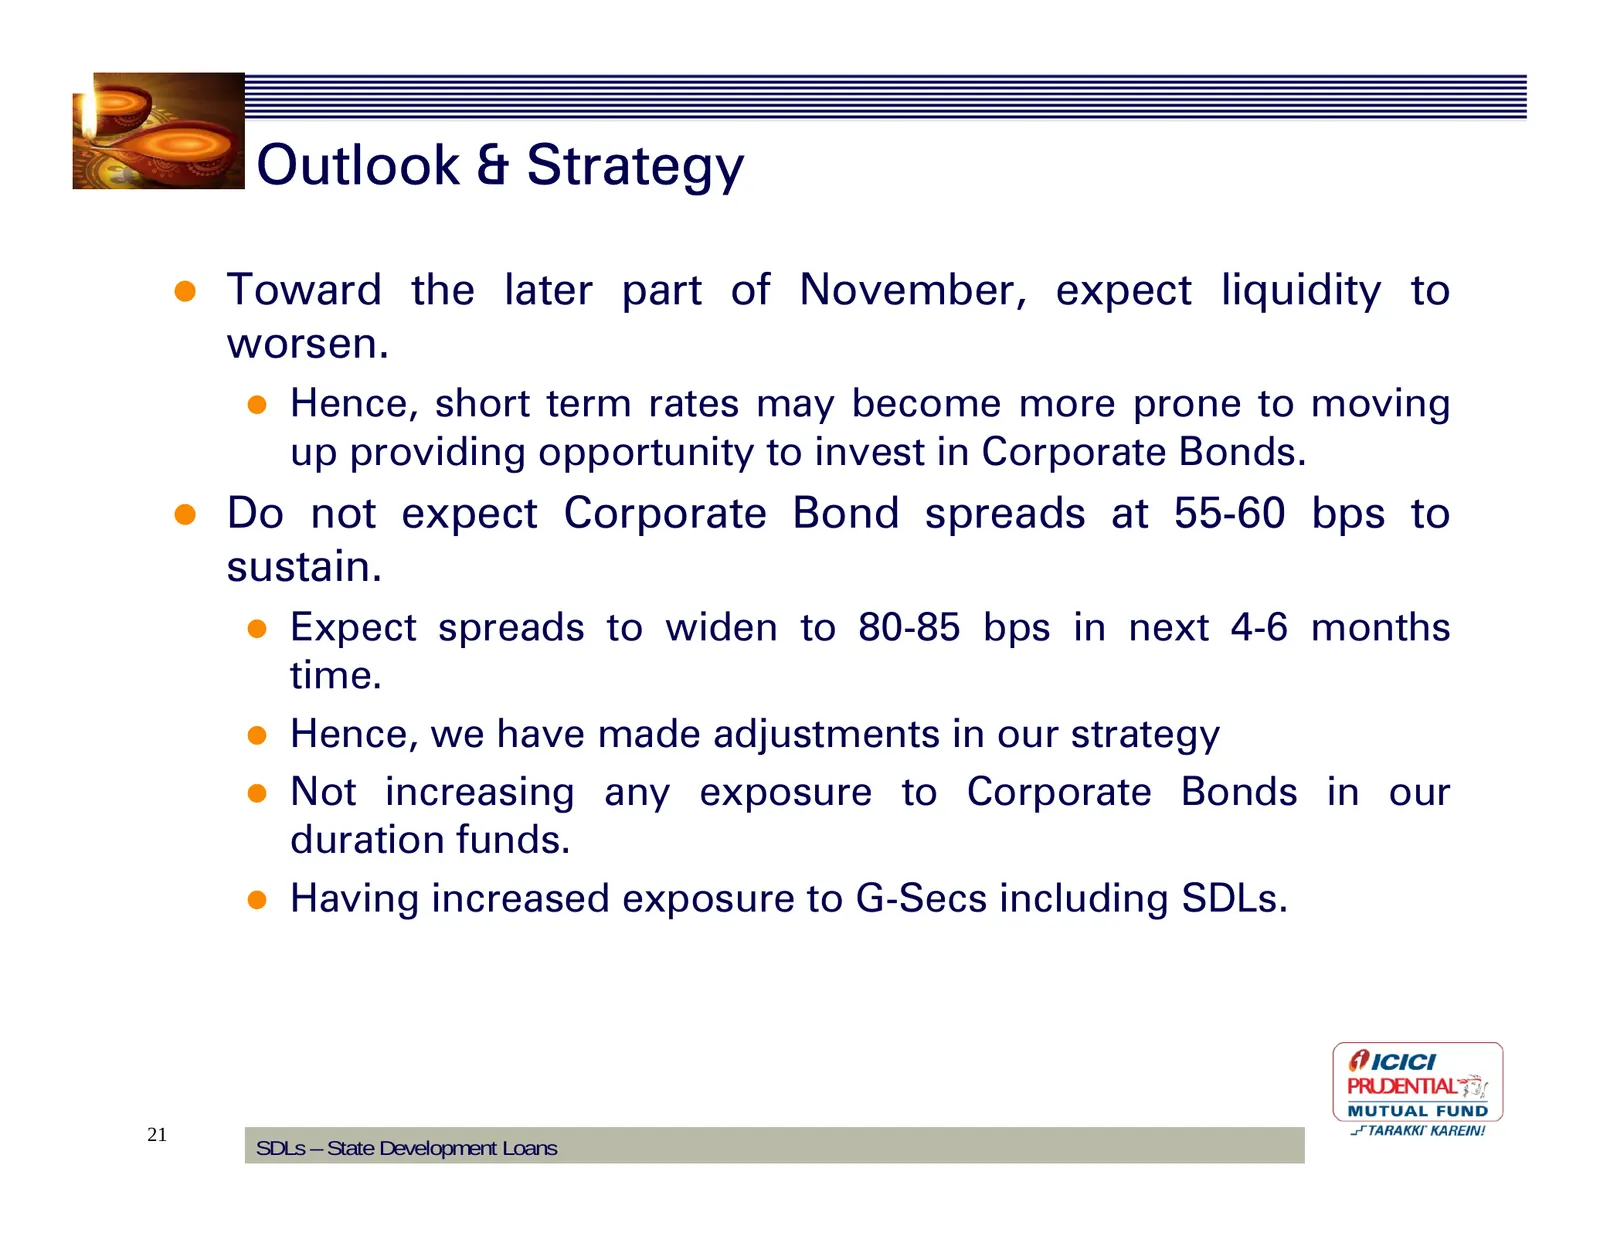
Slide 21: Outlook & Strategy
Outlook & Strategy y Toward the later part of November, expect liquidity to worsen. y Hence, short term rates may become more prone to moving up providing opportunity to invest in Corporate Bonds. y Do not expect Corporate Bond spreads at 55-60 bps to sustain. y Expect spreads to widen to 80-85 bps
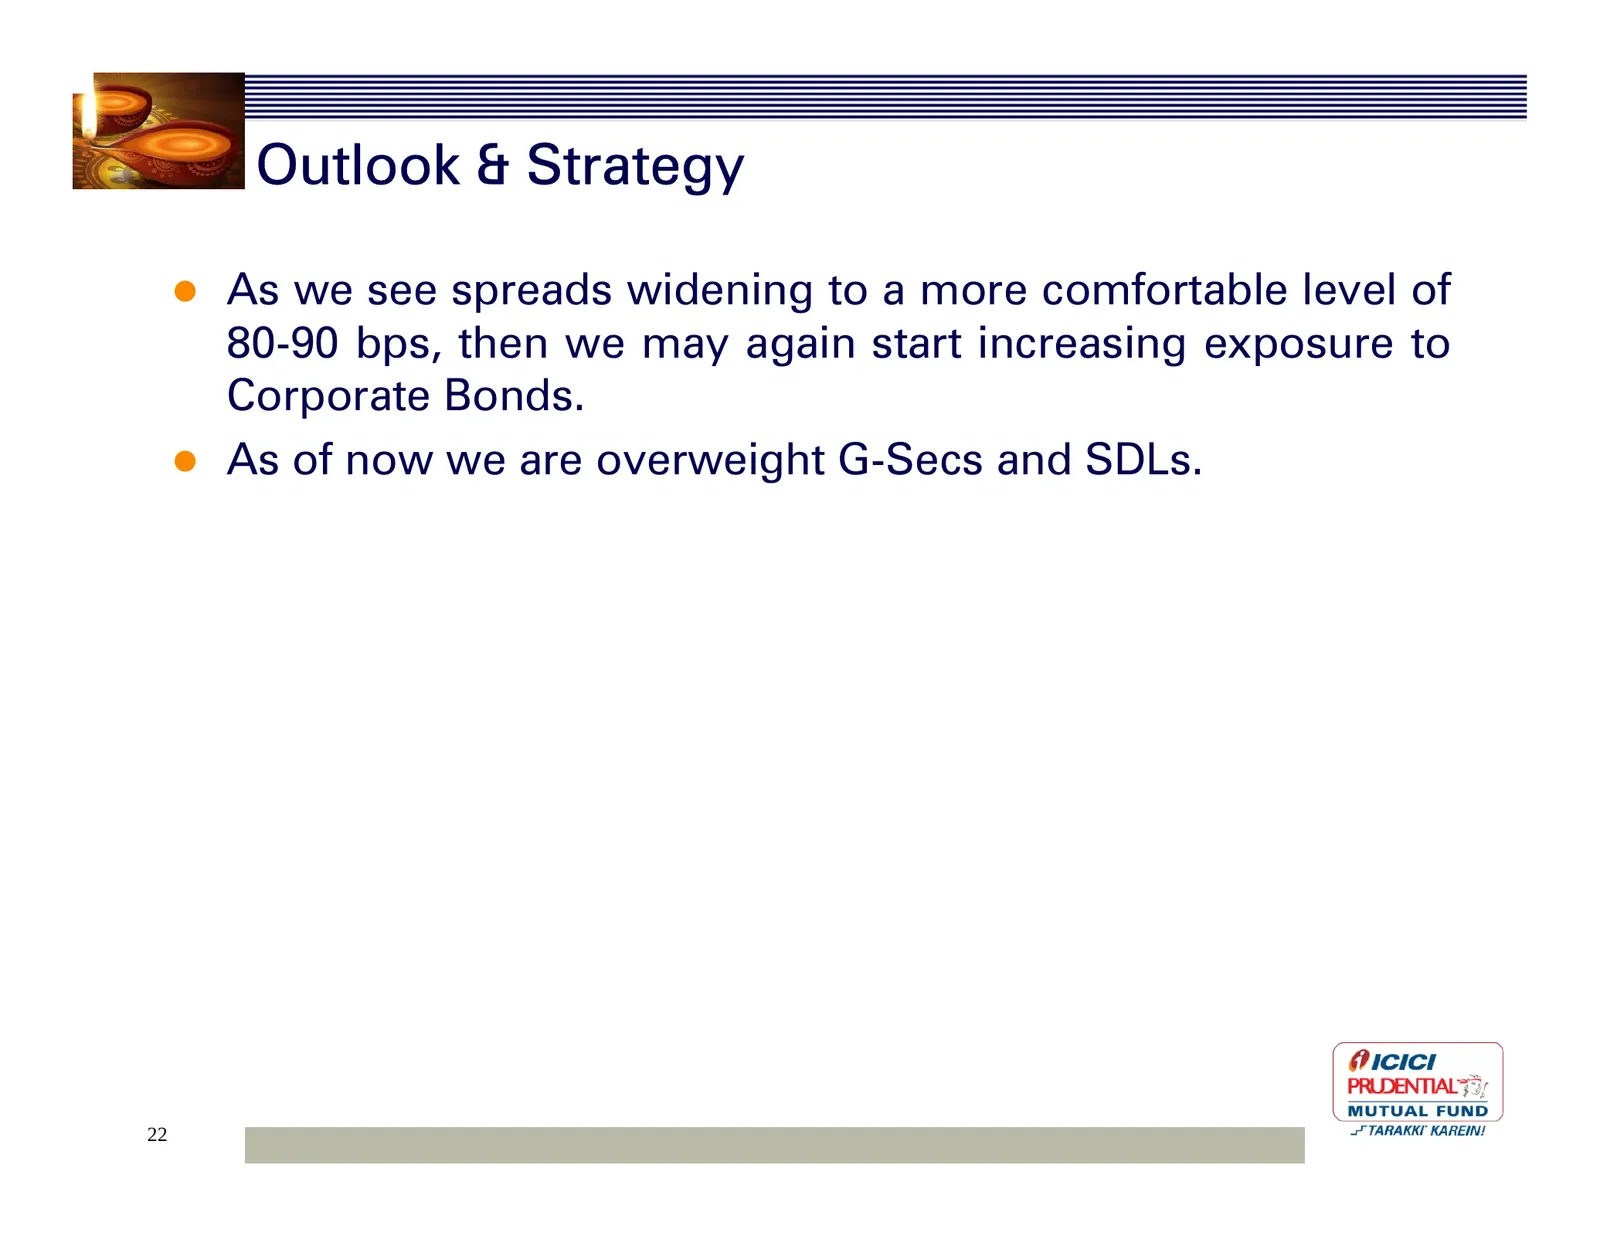
Slide 22: Outlook & Strategy
Outlook & Strategy y As we see spreads widening to a more comfortable level of 80-90 bps, then we may again start increasing exposure to Corporate Bonds. y As of now we are overweight G-Secs and SDLs. 22
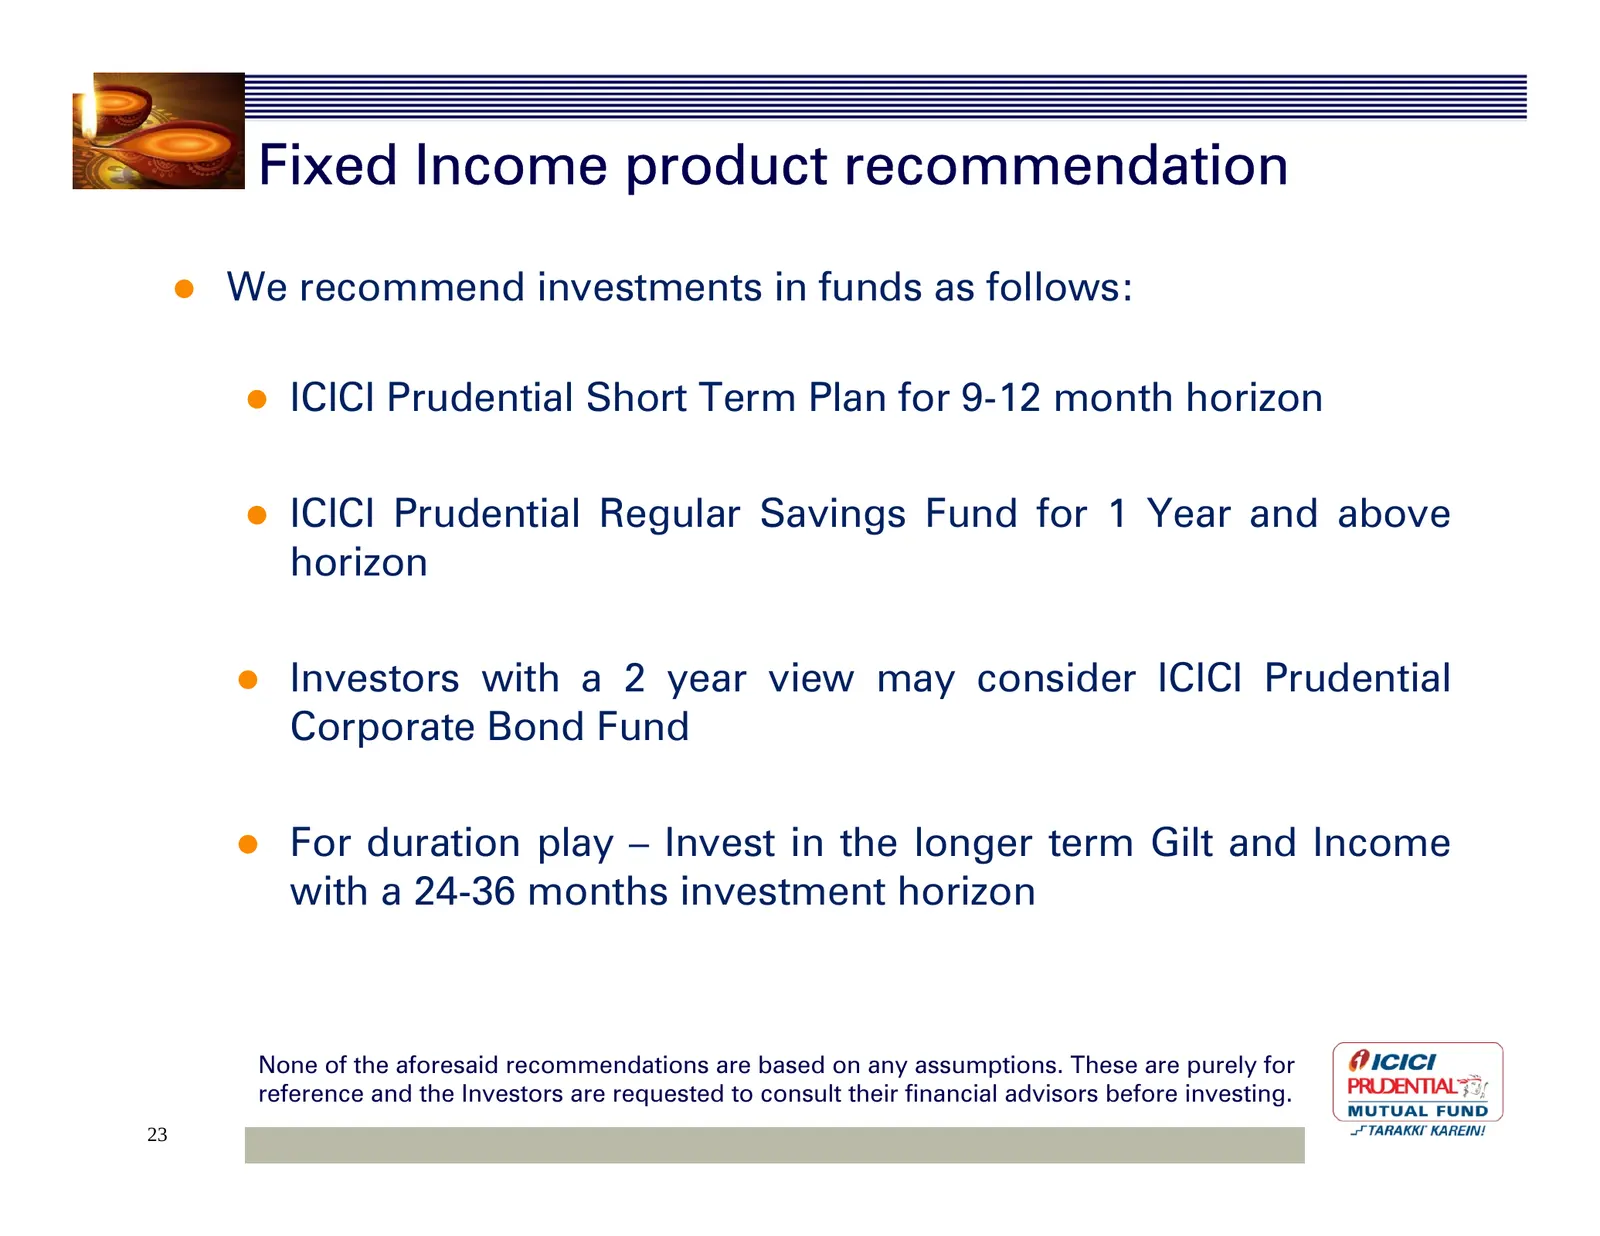
Slide 23: Fixed Income product recommendation
Fixed Income product recommendation y We recommend investments in funds as follows: y ICICI Prudential Short Term Plan for 9-12 month horizon y ICICI Prudential Regular Savings Fund for 1 Year and above horizon y Investors with a 2 year view may consider ICICI Prudential Corporate Bond Fund y For du
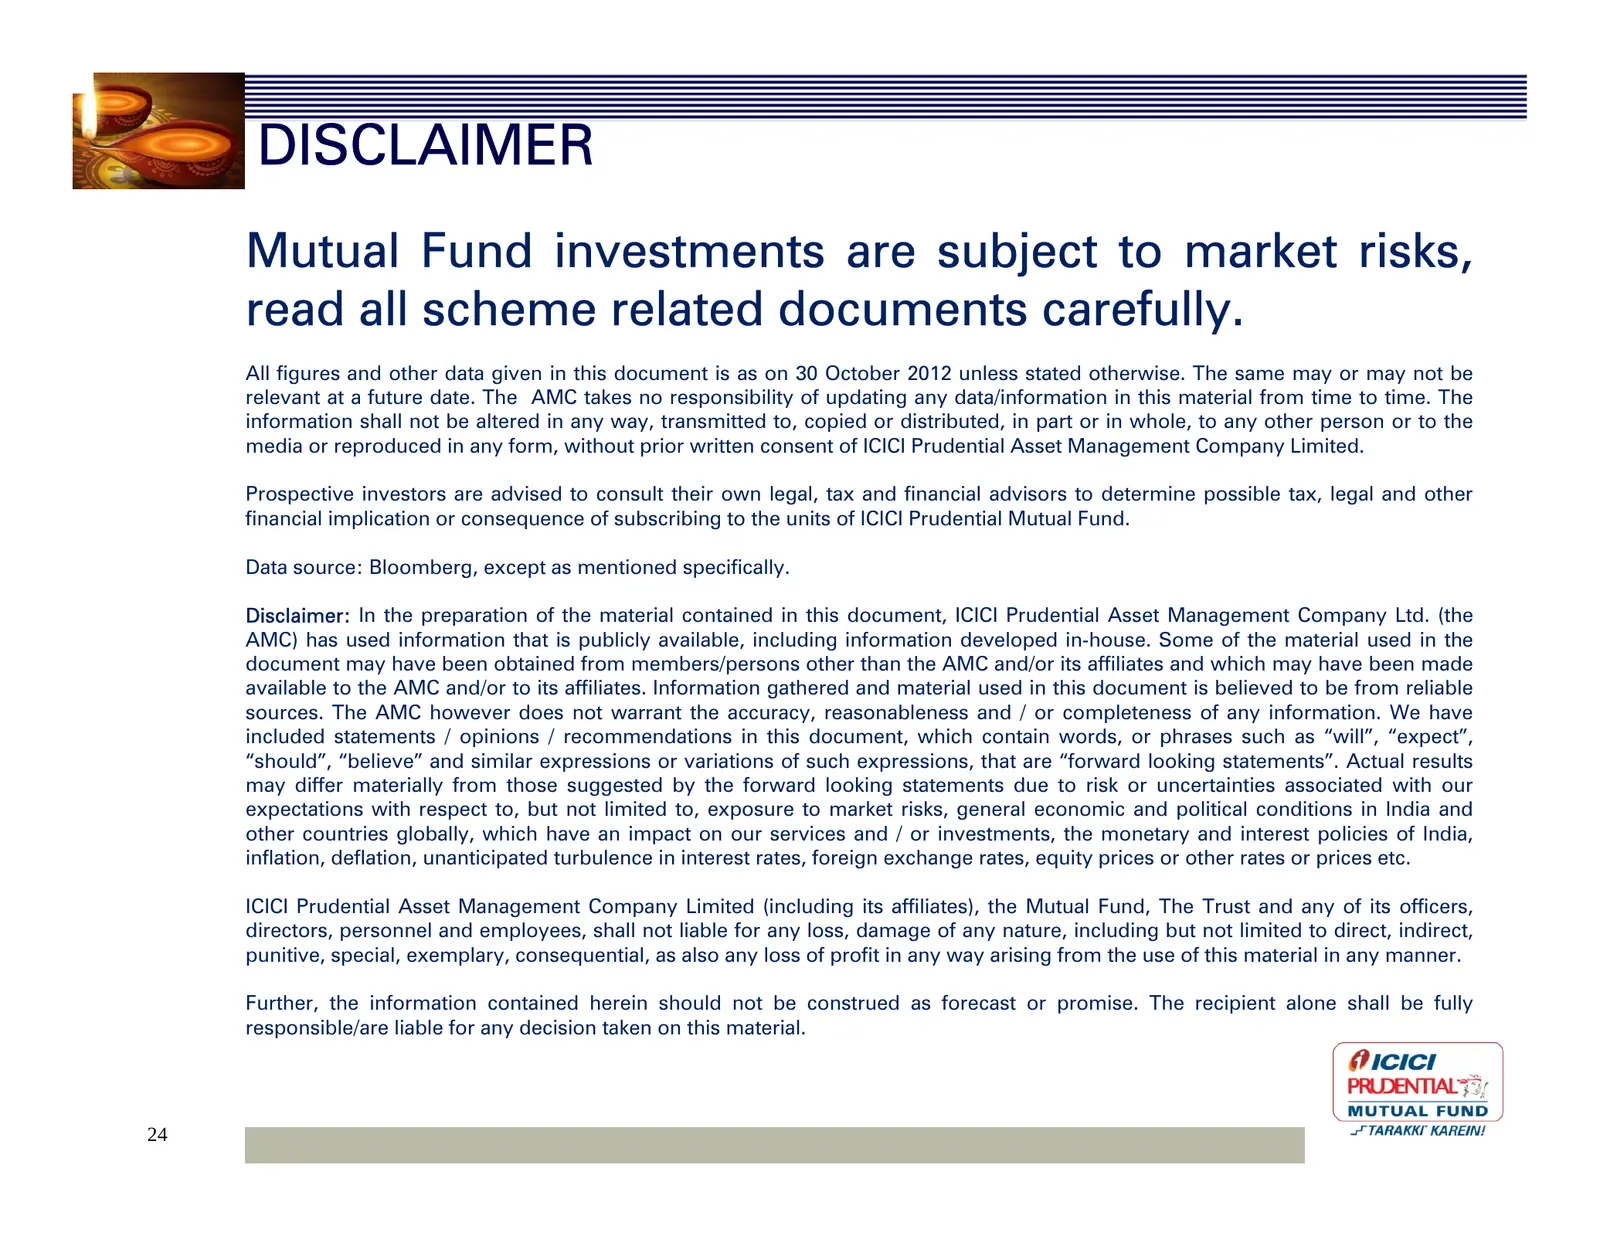
Slide 24: DISCLAIMER
DISCLAIMER Mutual Fund investments are subject to market risks, read all scheme related documents carefully. All figures and other data given in this document is as on 30 October 2012 unless stated otherwise. The same may or may not be relevant at a future date. The AMC takes no responsibility of up
Slide 25: Thank you
Thank you ee ee—“SSCSCi‘:CtstsC(‘(‘(SSE.SCOC;#‘«CURees
Source: Internet Archive copy of icicipruamc.com
More decks from ICICI Prudential Asset Management Company Ltd.
 Q2 FY2027 Earnings Presentation37 slides · Oct 12, 2026
 Q1 FY2027 Earnings Presentation32 slides · Jul 13, 2026
 Q4 FY2026 Earnings Presentation33 slides · Apr 13, 2026
 Q4 FY2026 Earnings Presentation37 slides · Apr 13, 2026
 Investor Presentation (April 2026)28 slides · Apr 6, 2026
 Investor Presentation (April 2026)23 slides · April 2026