Forestar Group Inc · NYSE:FOR
Forestar — Q4 2019 Earnings Presentation
31 slides from Forestar's earnings presentation, November 2019
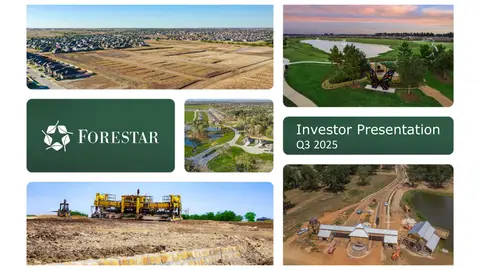
Slide 1: Investor Presentation Q4 2019
I N V E S T O R P R E S E N T A T I O N Q4 2019
Slide 2: Forward Looking Statements
F O R W A R D L O O K I N G S TAT E M E N T S This presentation may include “forward‐looking statements” as defined by the Private Securities Litigation Reform Act of 1995. Although Forestar believes any such statements are based on reasonable assumptions, there is no assurance that actual outcomes
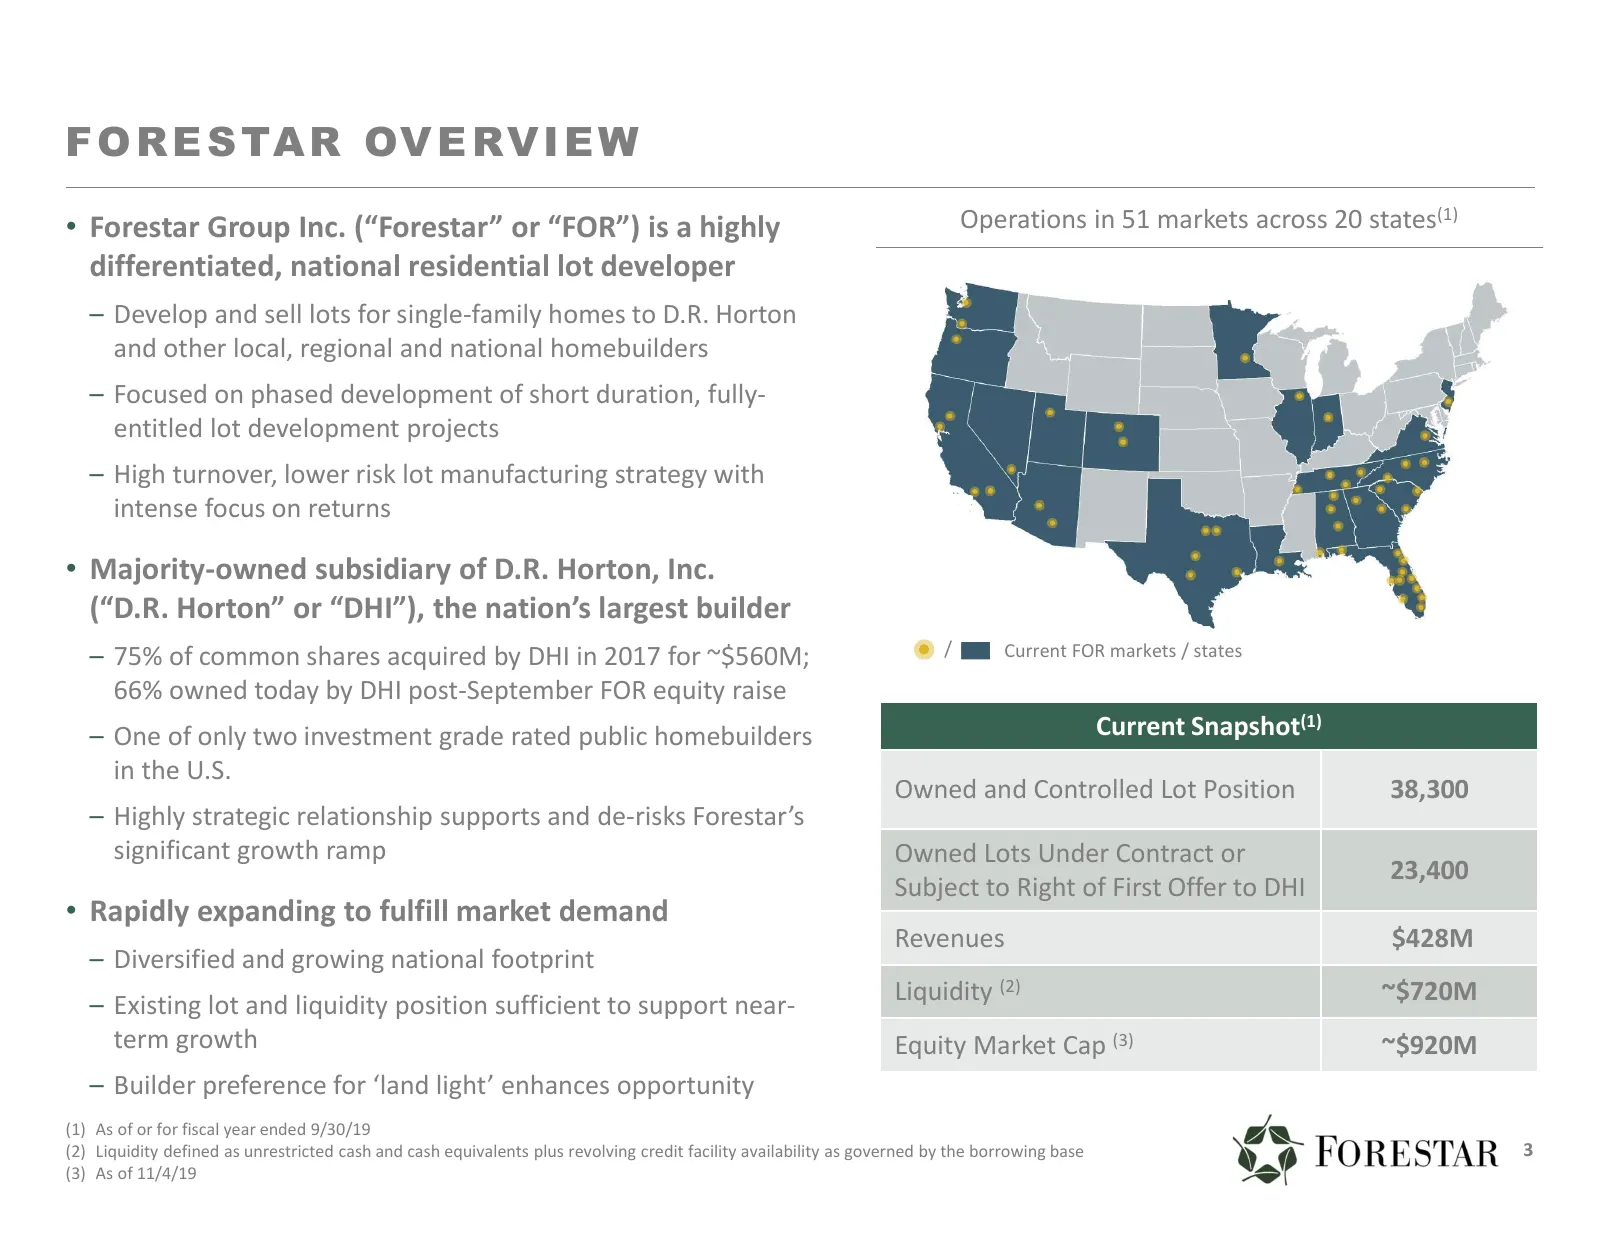
Slide 3: Forestar Overview
F O R E S TA R OV E R V I E W • Forestar Group Inc. (“Forestar” or “FOR”) is a highly Operations in 51 markets across 20 states(1) differentiated, national residential lot developer – Develop and sell lots for single‐family homes to D.R. Horton and other local, regional and national homebuilders – F
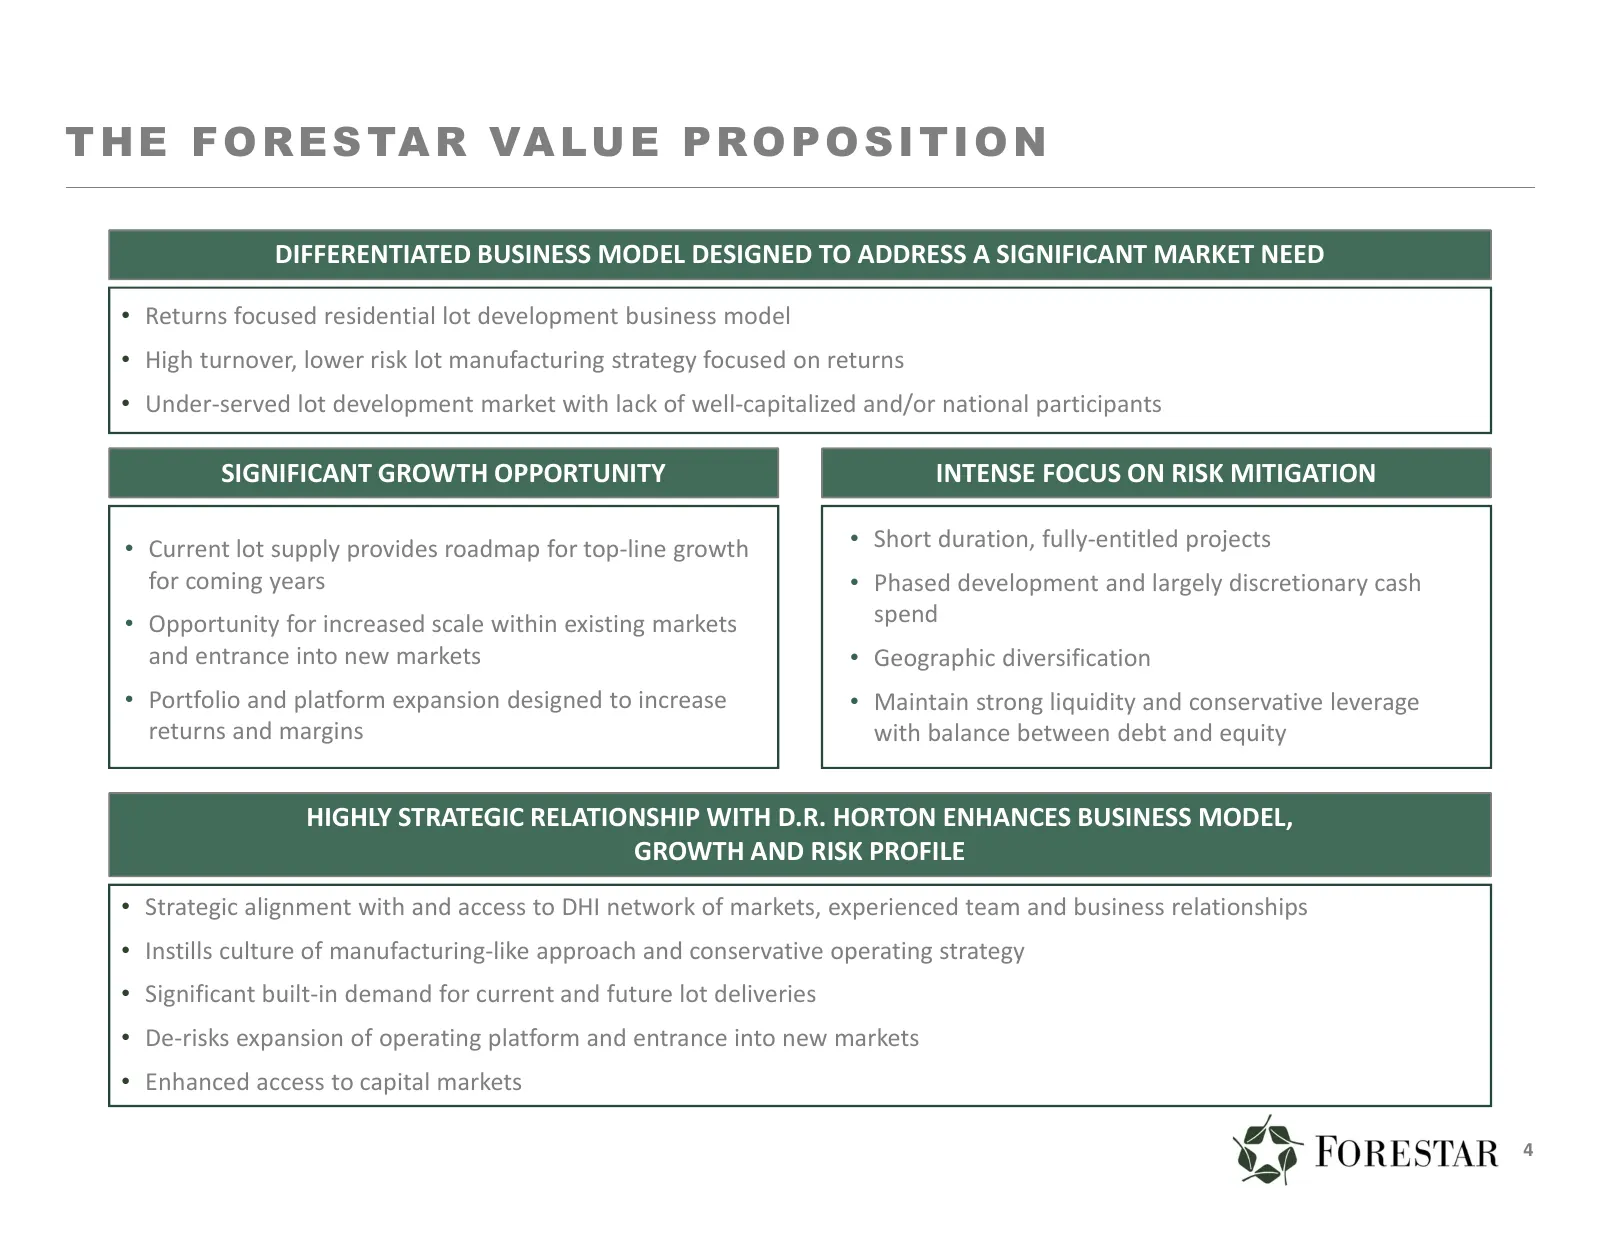
Slide 4: The Forestar Value Proposition
T H E F O R E S TA R VA LU E P R O P O S I T I O N DIFFERENTIATED BUSINESS MODEL DESIGNED TO ADDRESS A SIGNIFICANT MARKET NEED • Returns focused residential lot development business model • High turnover, lower risk lot manufacturing strategy focused on returns • Under‐served lot development market
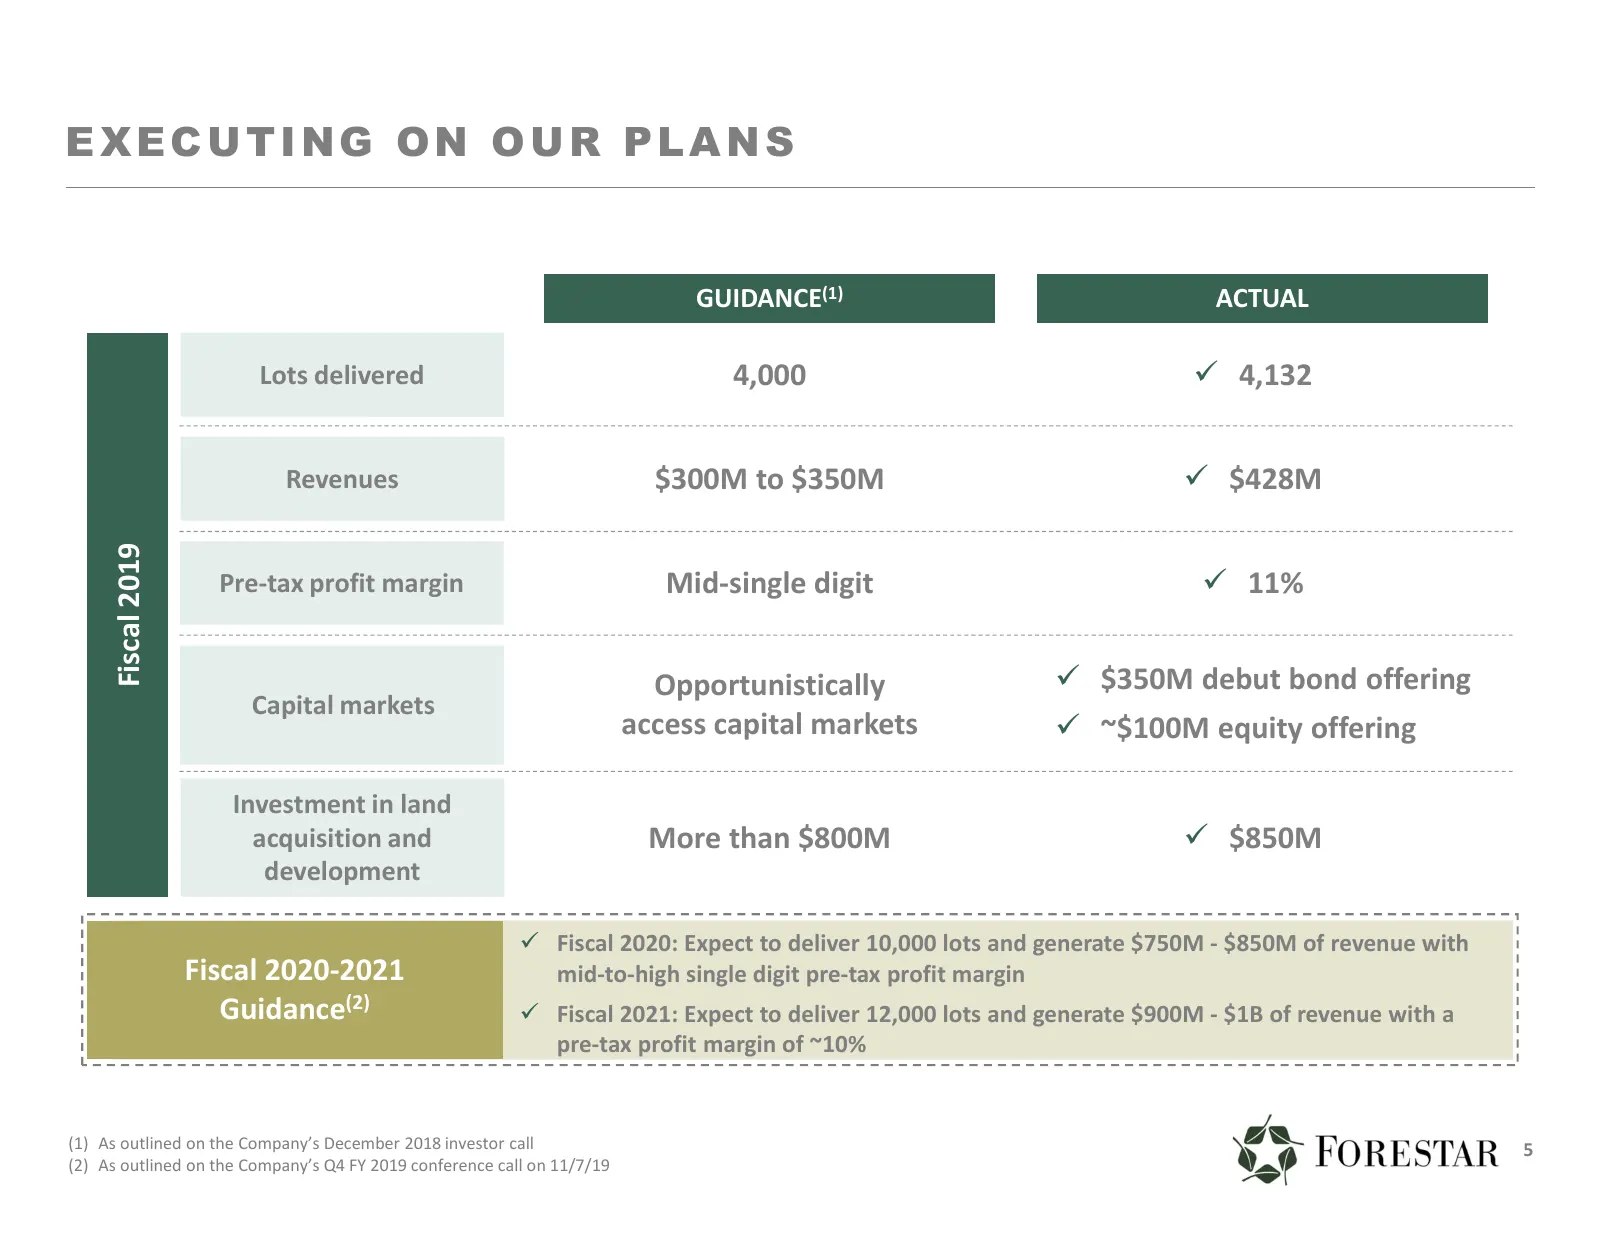
Slide 5: Fiscal 2019 Executing on Our Plans
EXECUTING ON OUR PLANS GUIDANCE(1) ACTUAL Lots delivered 4,000 4,132 Revenues $300M to $350M $428M Fiscal 2019 Pre-tax profit margin Mid-single digit 11% Opportunistically $350M debut bond offering Capital markets access capital markets ~$100M equity offering Investment in land acquisition
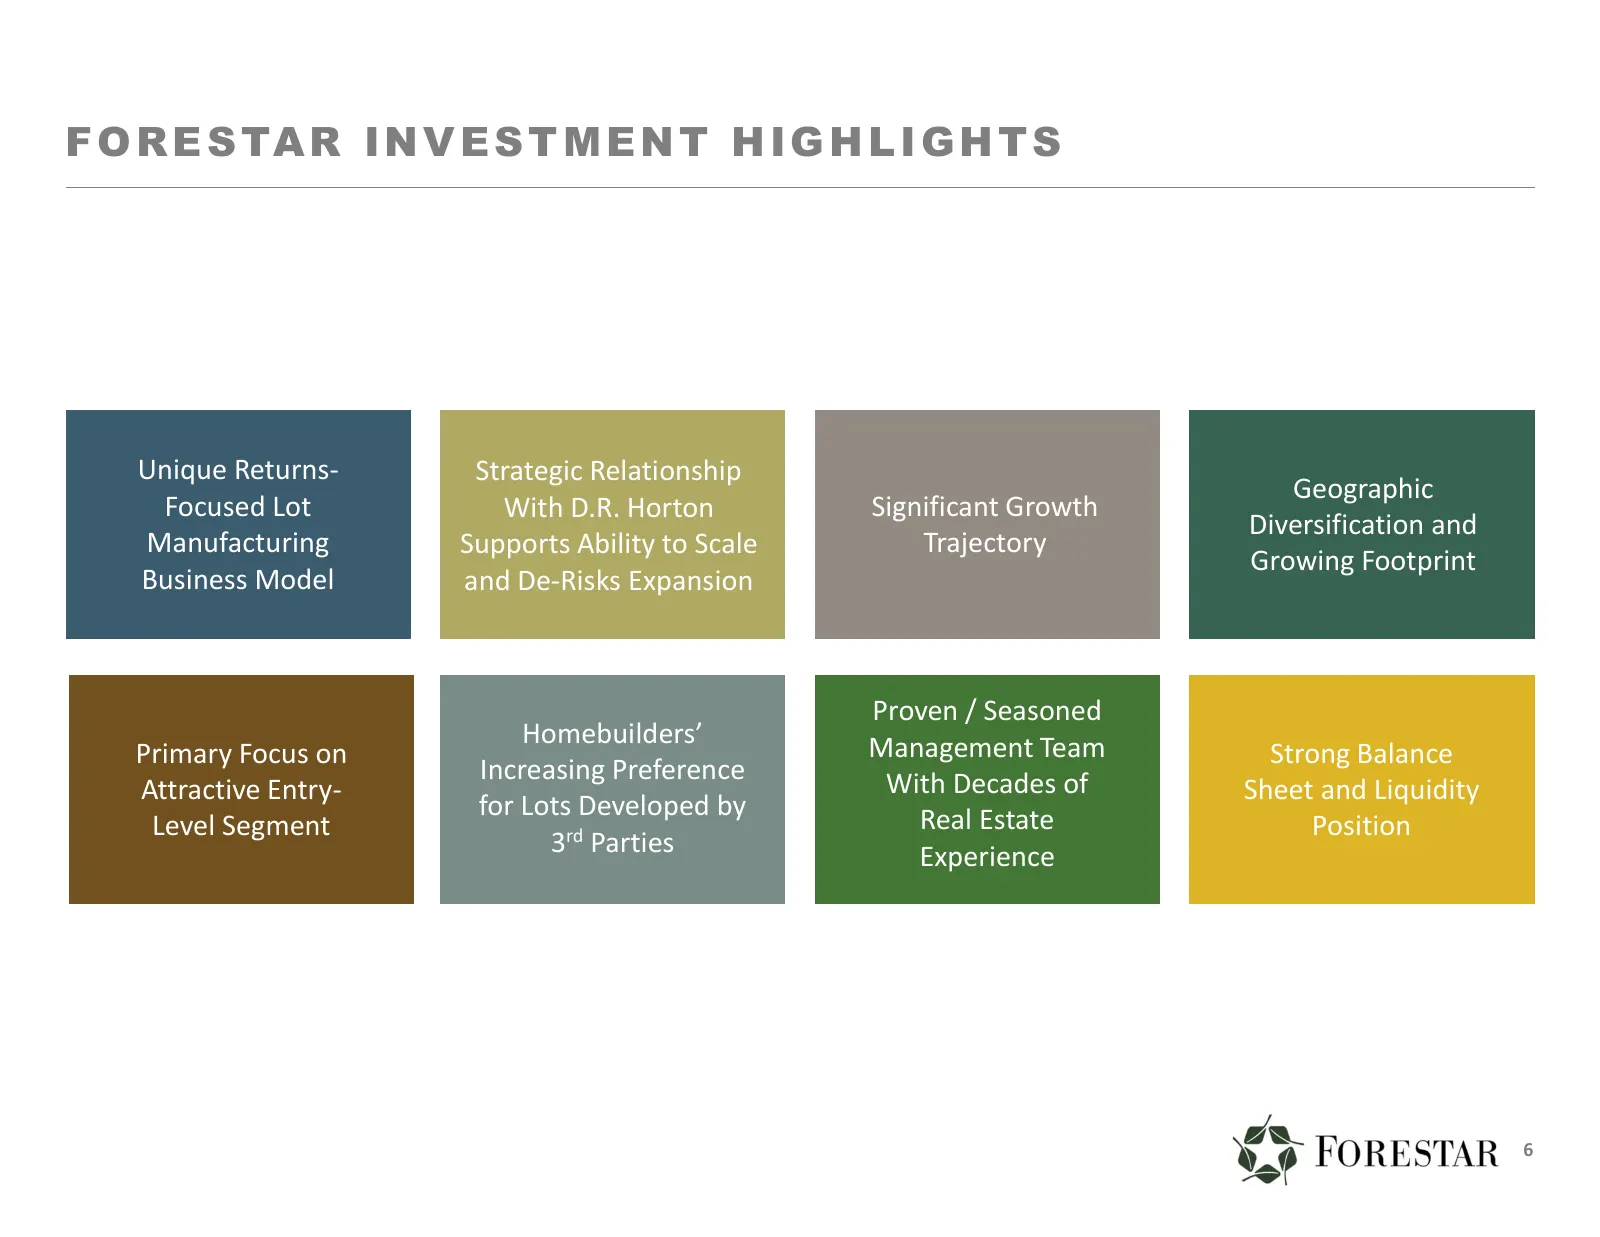
Slide 6: Forestar Investment Highlights
F O R E S TA R I N V E S T M E N T H I G H L I G H T S Unique Returns‐ Strategic Relationship Geographic Focused Lot With D.R. Horton Significant Growth Diversification and Manufacturing Supports Ability to Scale Trajectory Growing Footprint Business Model and De‐Risks Expansion Proven / Seasoned Ho
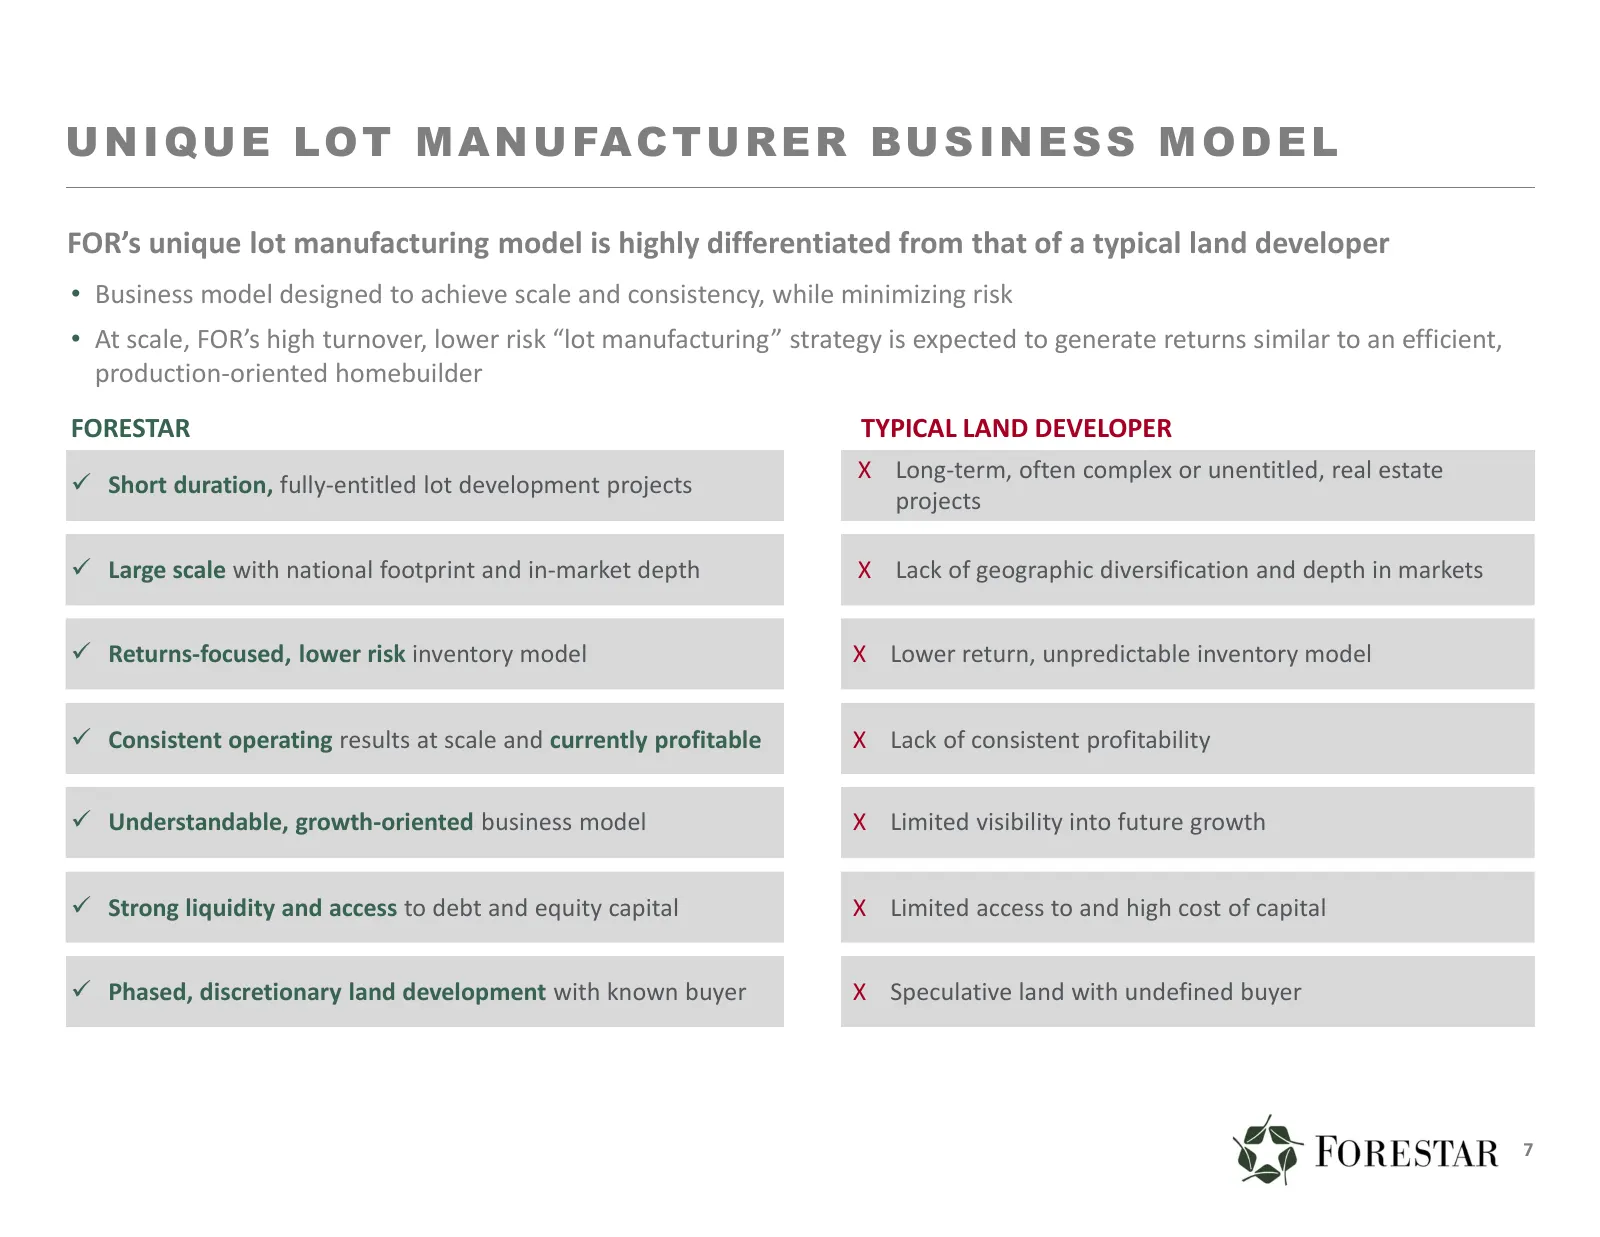
Slide 7: Unique Lot Manufacturer Business Model
U N I Q U E L OT M A N U FA C T U R E R B U S I N E S S M O D E L FOR’s unique lot manufacturing model is highly differentiated from that of a typical land developer • Business model designed to achieve scale and consistency, while minimizing risk • At scale, FOR’s high turnover, lower risk “lot man
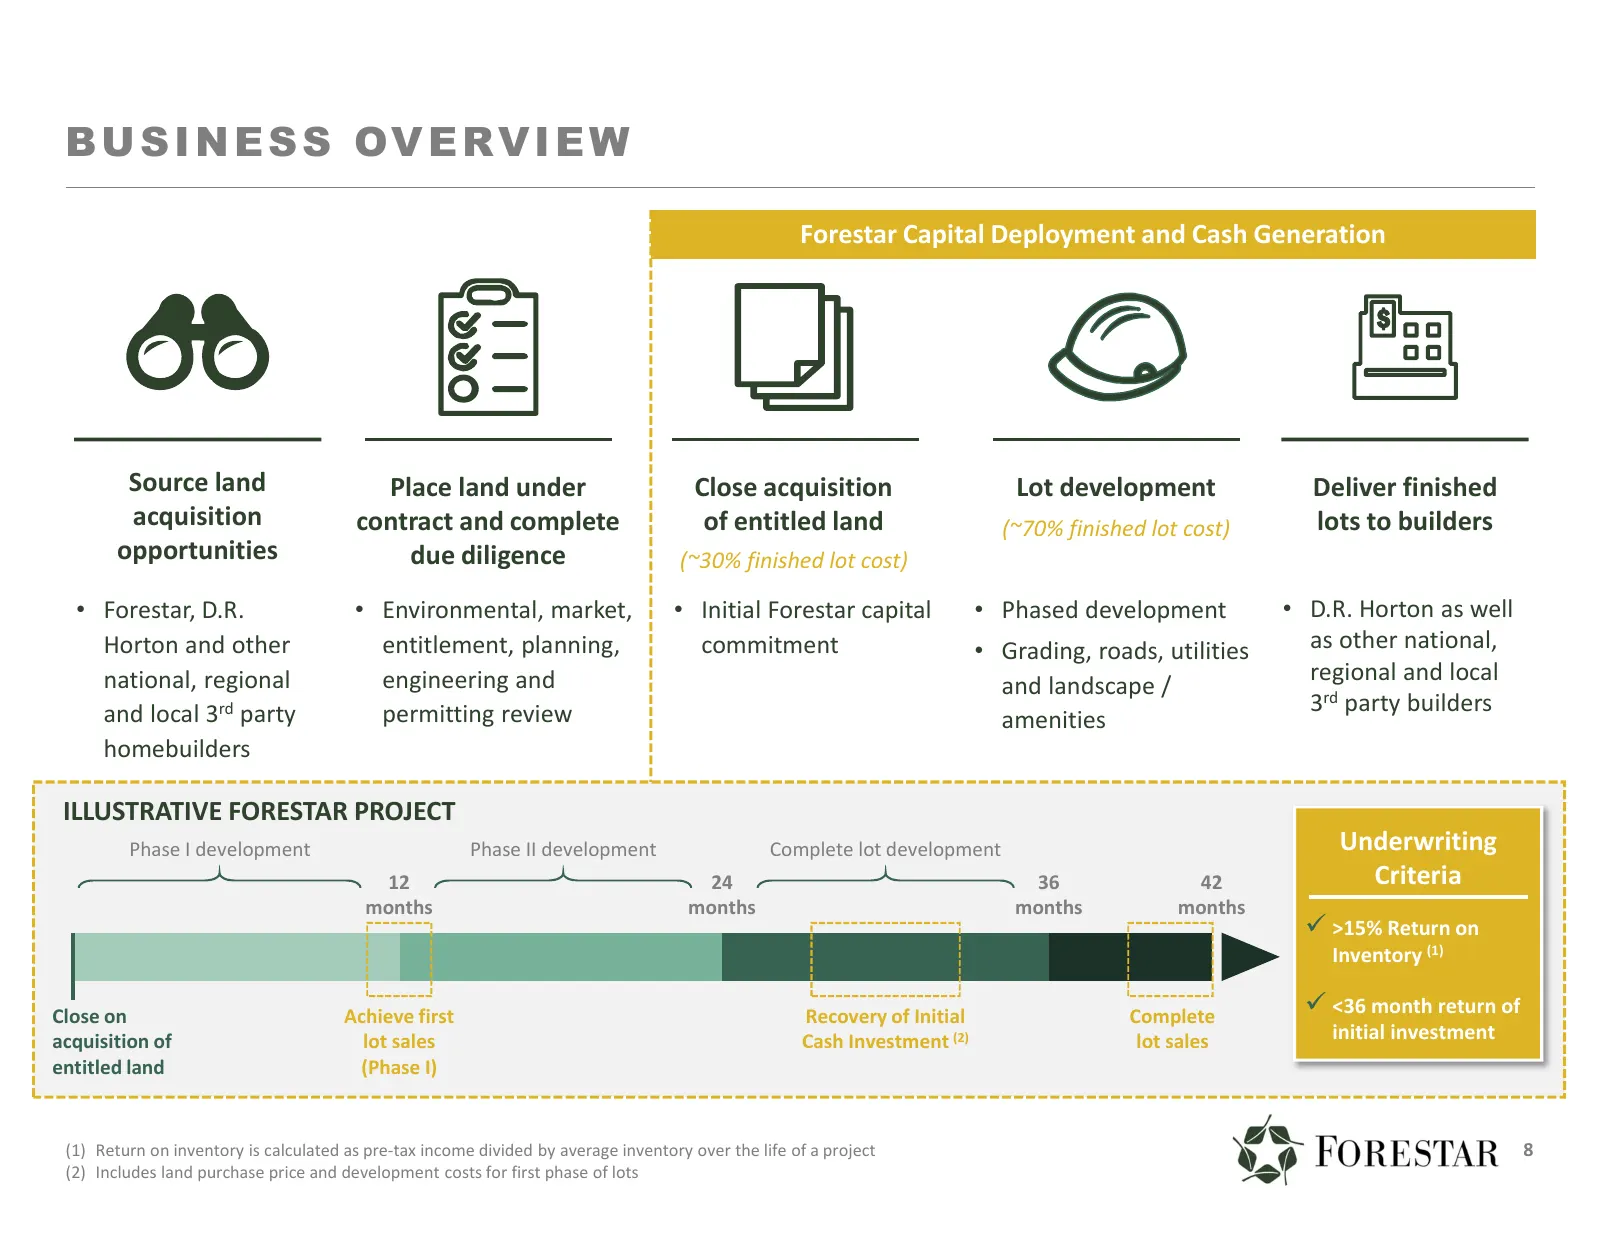
Slide 8: Business Overview
B U S I N E S S OV E R V I E W Forestar Capital Deployment and Cash Generation Source land Place land under Close acquisition Lot development Deliver finished acquisition contract and complete of entitled land (~70% finished lot cost) lots to builders opportunities due diligence (~30% finished lot c
Slide 9: Investment Portfolio
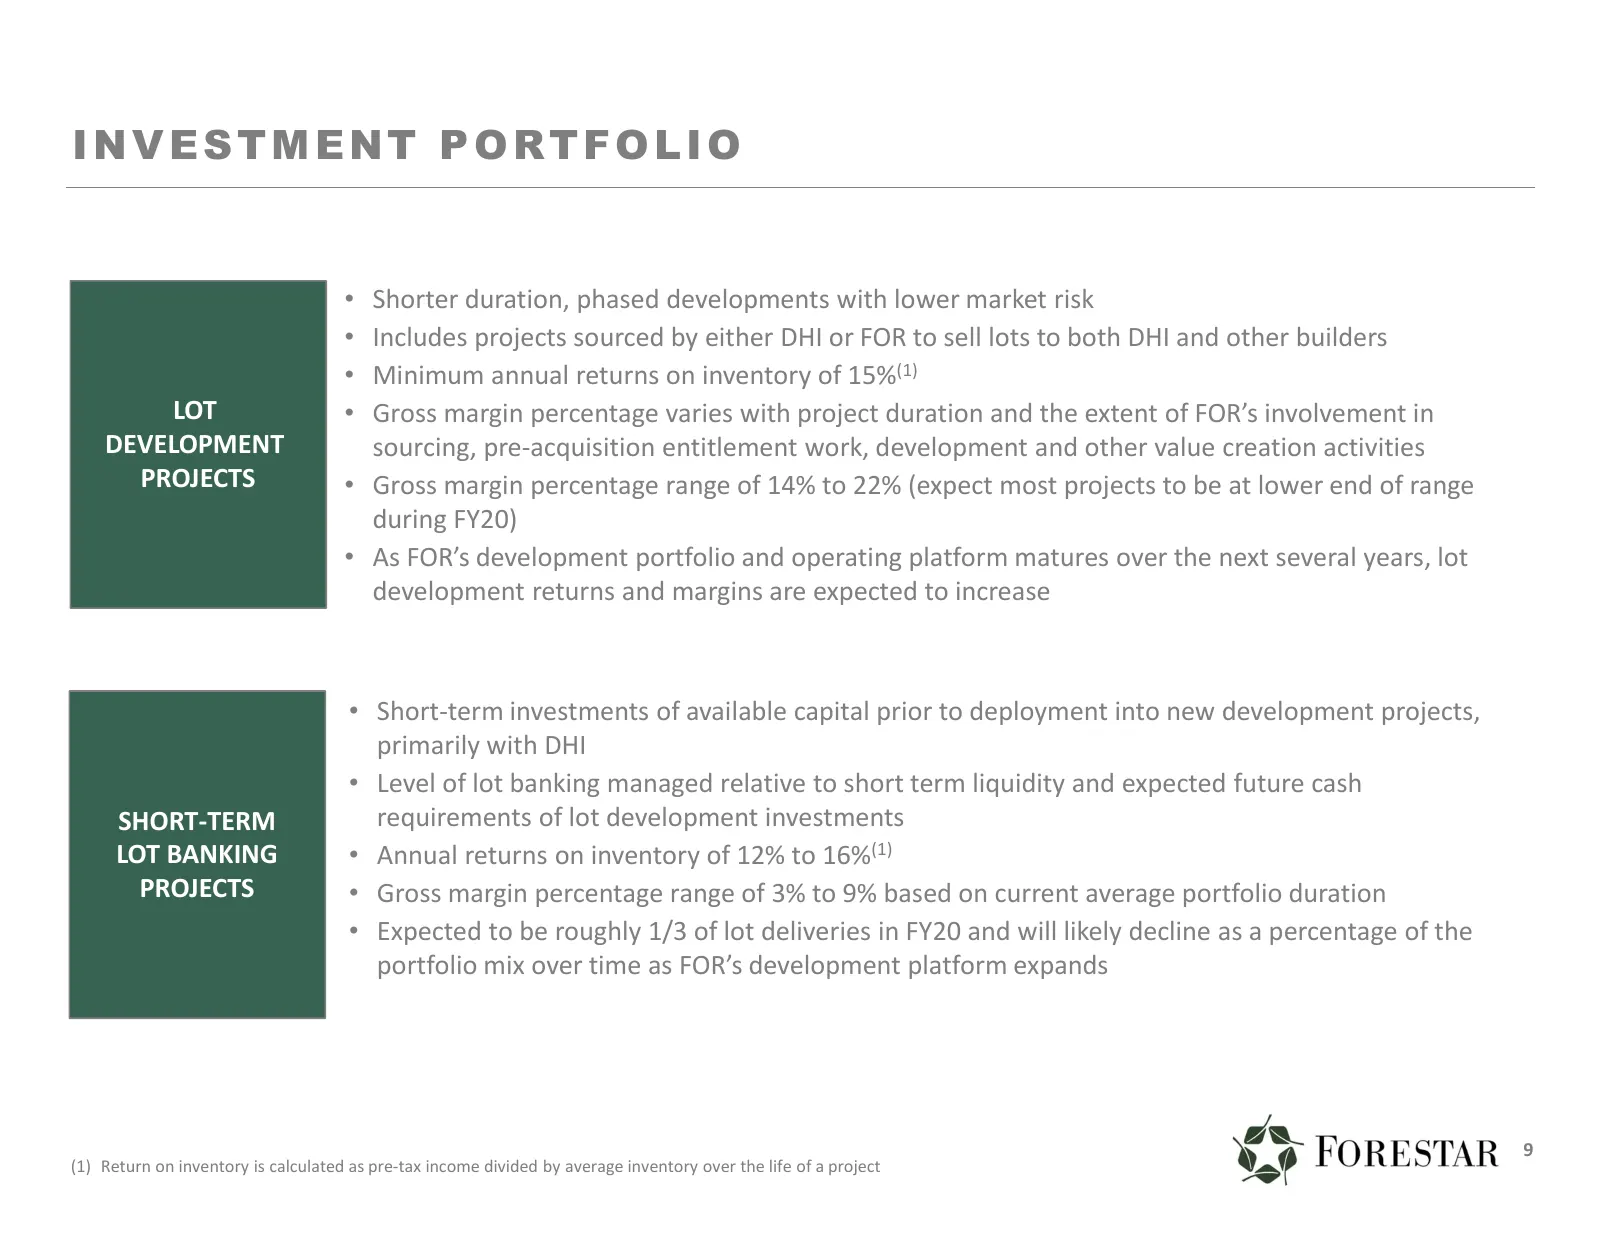
INVESTMENT PORTFOLIO • Shorter duration, phased developments with lower market risk • Includes projects sourced by either DHI or FOR to sell lots to both DHI and other builders • Minimum annual returns on inventory of 15%(1) LOT • Gross margin percentage varies with project duration and the extent o
Slide 10: Benefits of Highly Strategic FOR and DHI Alignment
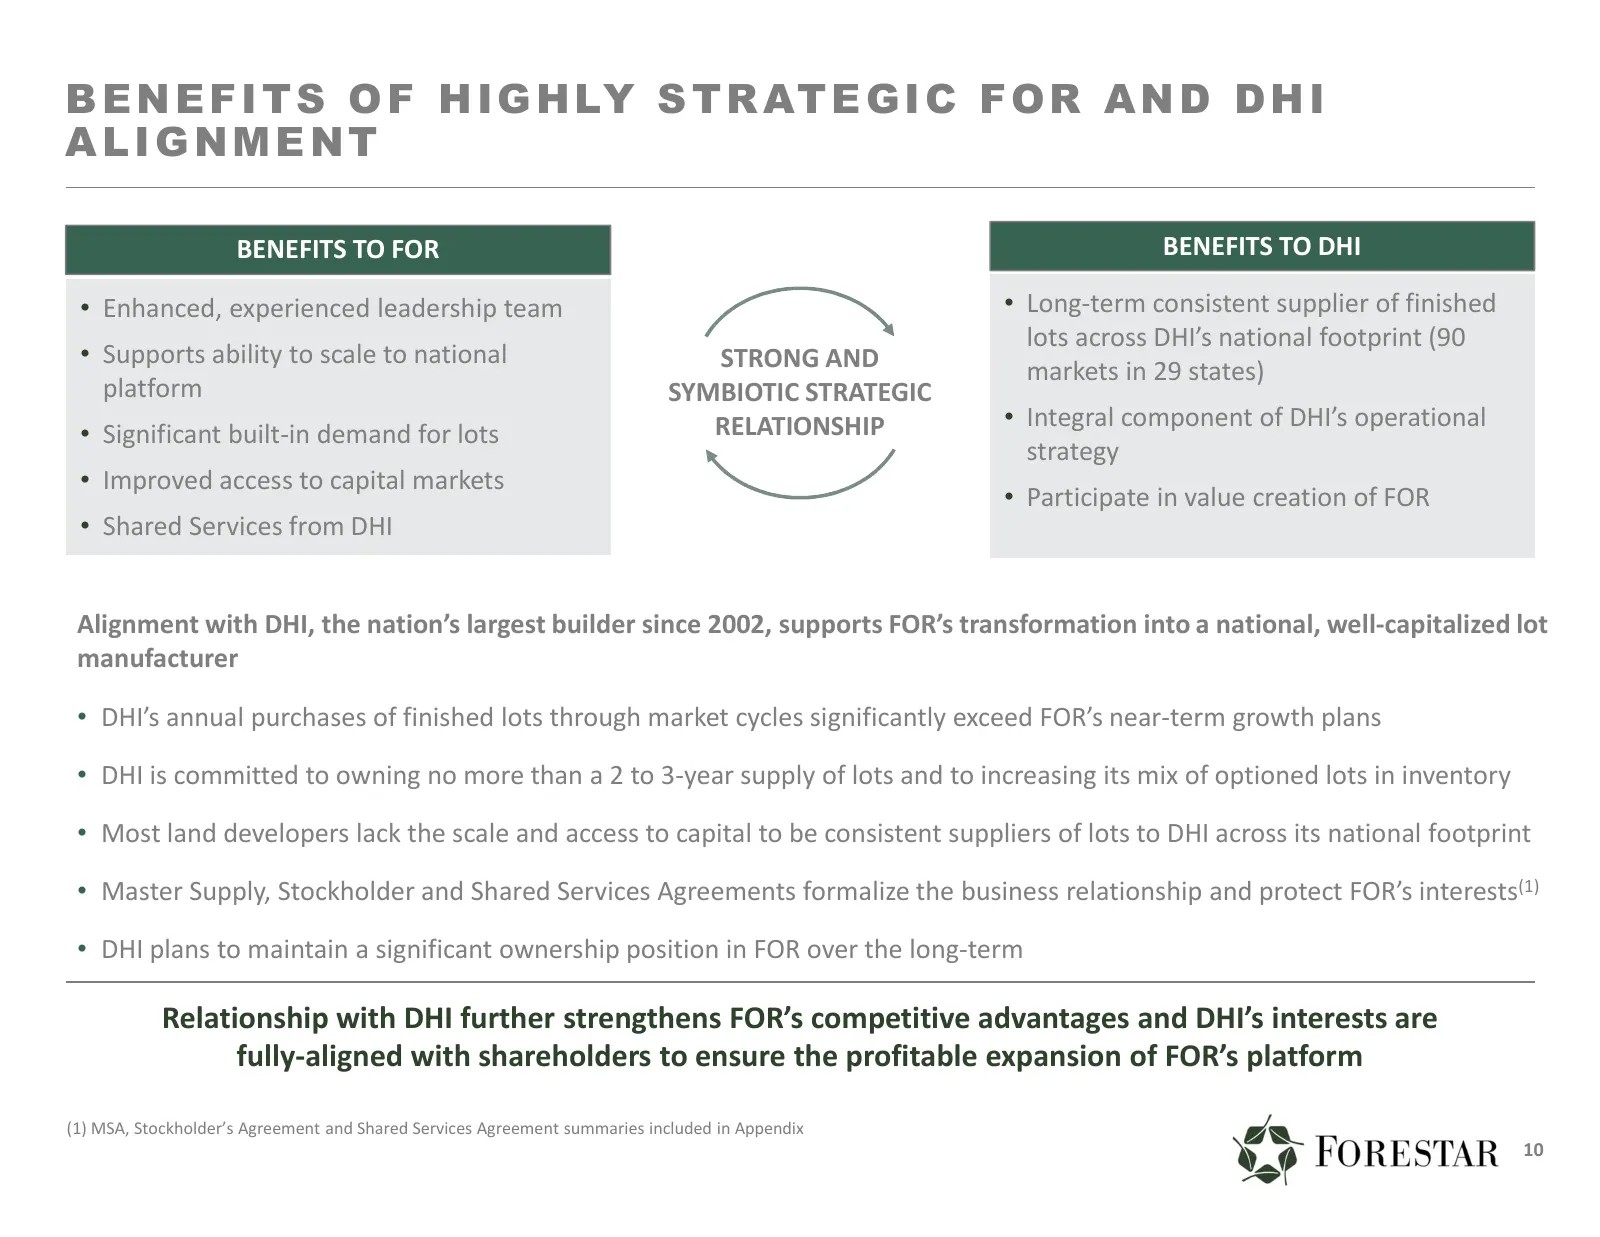
B E N E F I T S O F H I G H LY S T R AT E G I C F O R A N D D H I ALIGNMENT BENEFITS TO FOR BENEFITS TO DHI • Enhanced, experienced leadership team • Long‐term consistent supplier of finished lots across DHI’s national footprint (90 • Supports ability to scale to national STRONG AND markets in 29 st
Slide 11: Significant and Sustainable Growth Through Numerous Levers
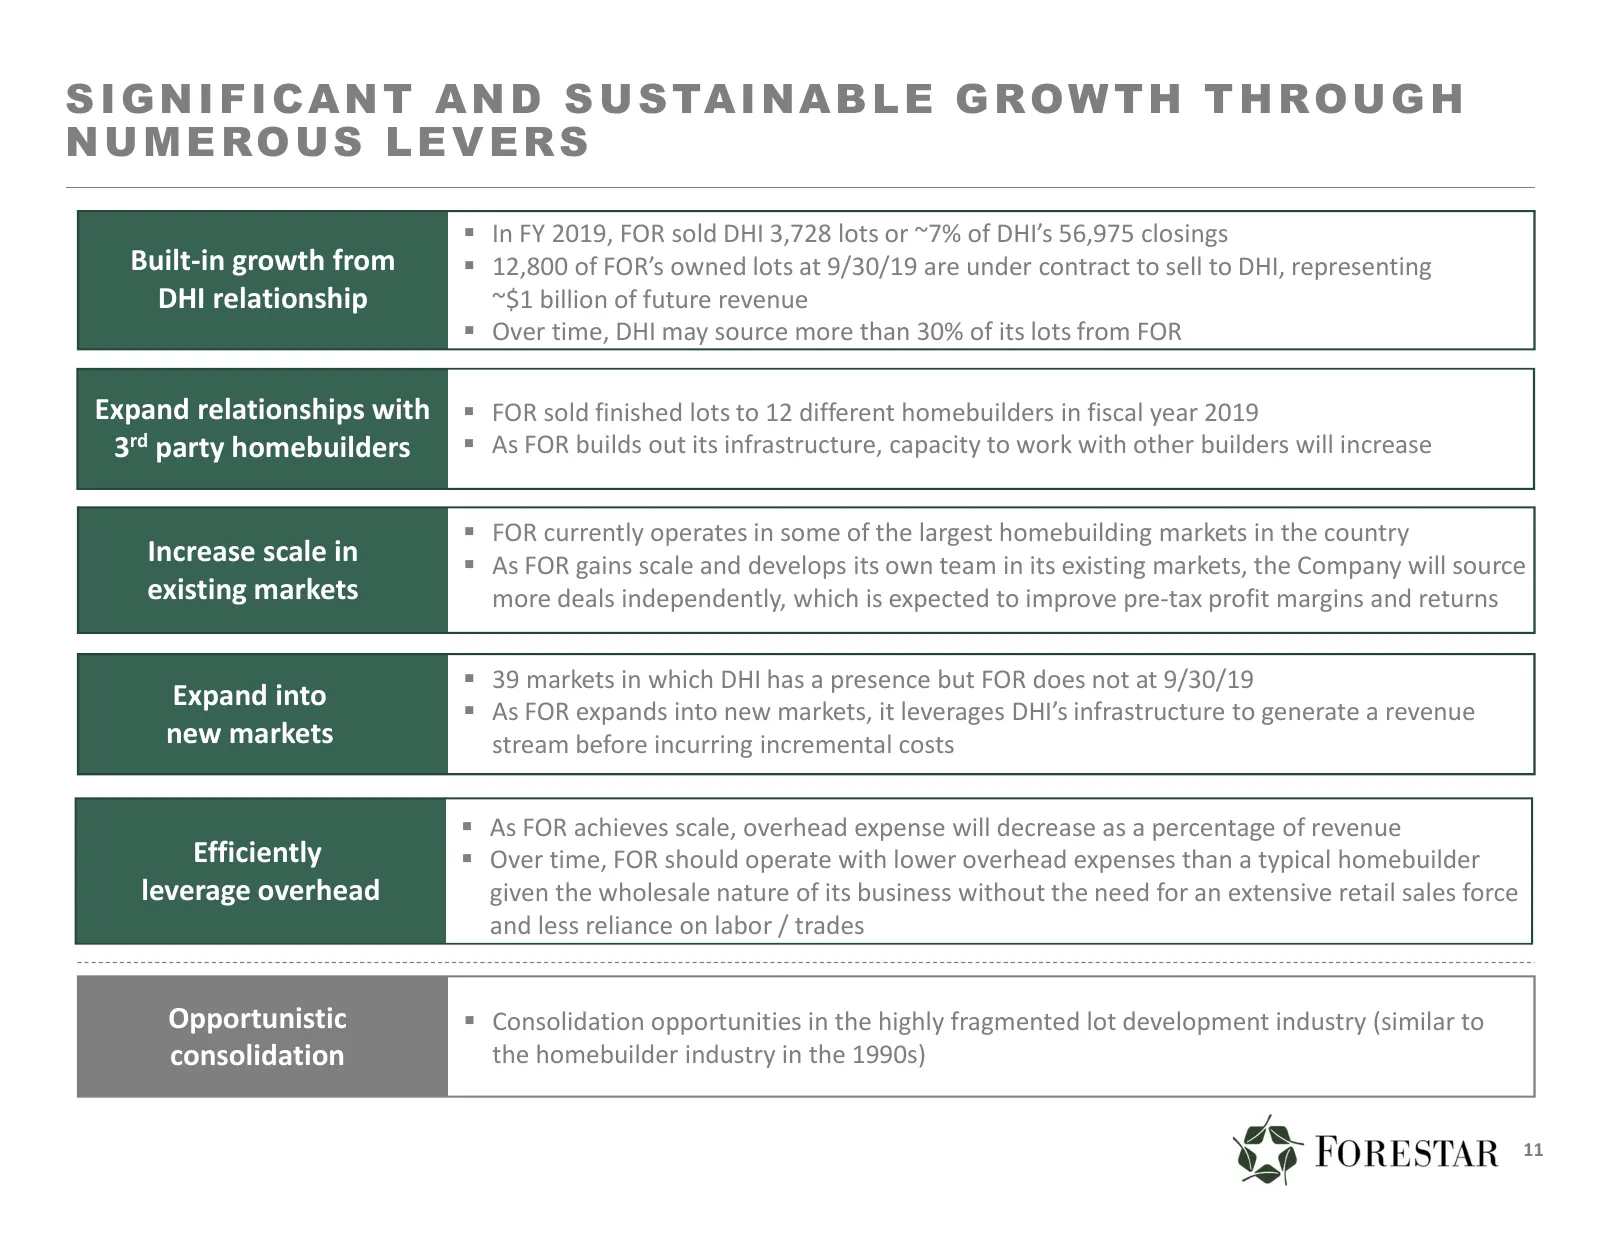
S I G N I F I C A N T A N D S U S TA I N A B L E G R O W T H T H R O U G H NUMEROUS LEVERS In FY 2019, FOR sold DHI 3,728 lots or ~7% of DHI’s 56,975 closings Built-in growth from 12,800 of FOR’s owned lots at 9/30/19 are under contract to sell to DHI, representing DHI relationship ~$1 billion o
Slide 12: Land and Development Investments
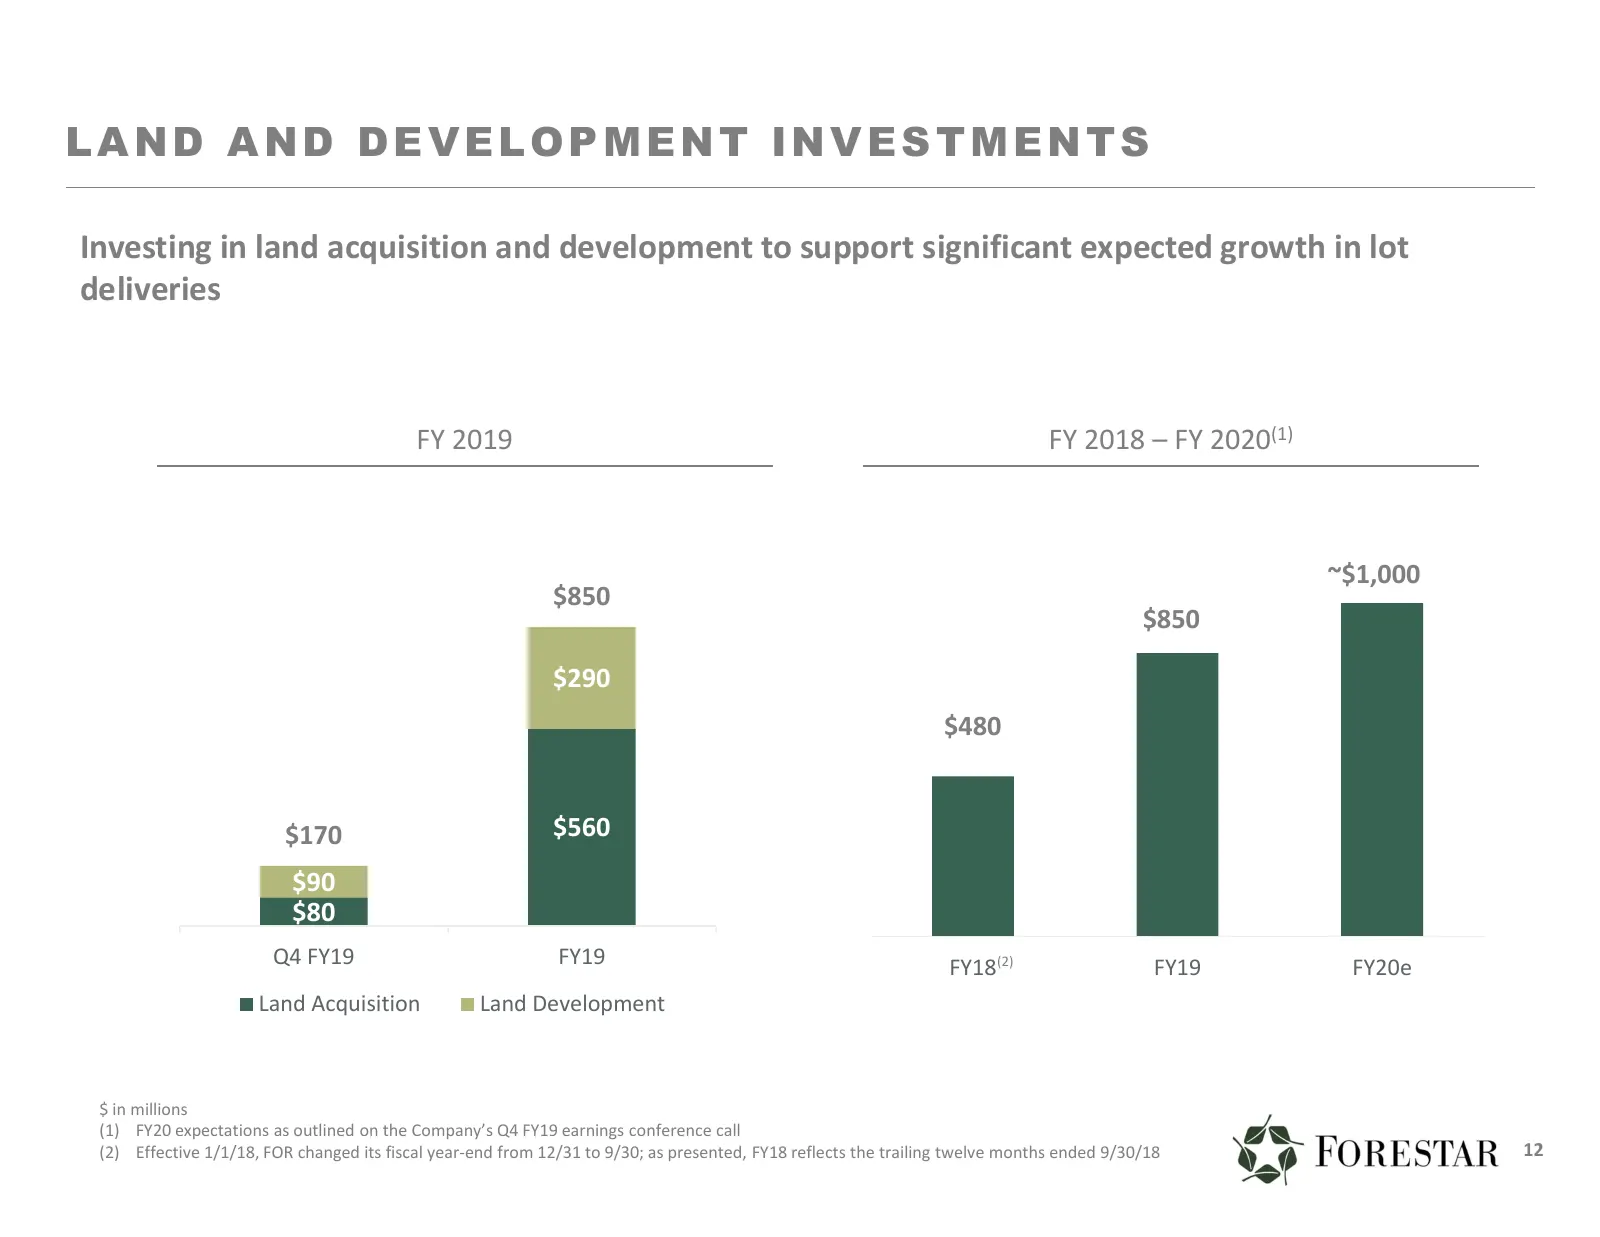
LAND AND DEVELOPMENT INVESTMENTS Investing in land acquisition and development to support significant expected growth in lot deliveries FY 2019 FY 2018 – FY 2020(1) ~$1,000 $850 $850 $290 $480 $170 $560 $90 $80 Q4 FY19 FY19 FY18(2) FY19 FY20e Land Acquisition Land Development $ in millions (1) FY20
Slide 13: Significant Near-Term Growth
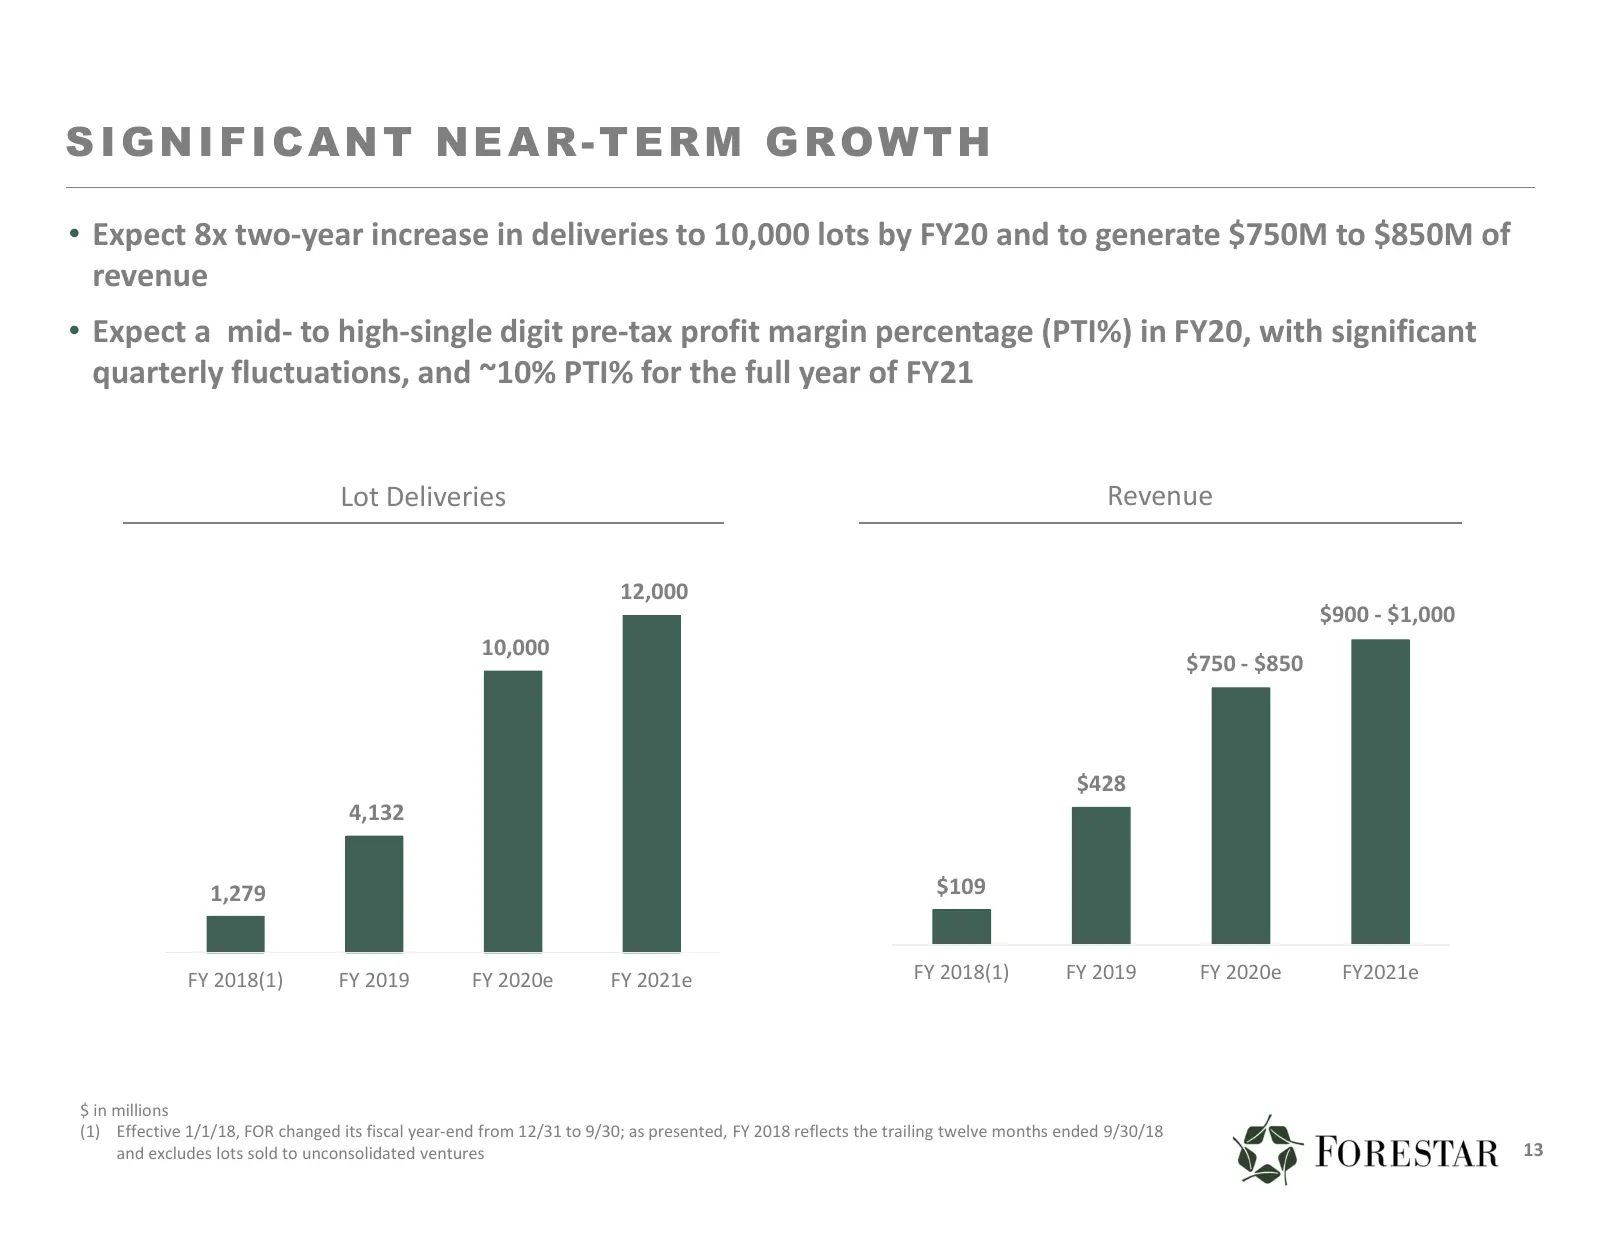
SIGNIFICANT NEAR-TERM GROWTH • Expect 8x two-year increase in deliveries to 10,000 lots by FY20 and to generate $750M to $850M of revenue • Expect a mid- to high-single digit pre-tax profit margin percentage (PTI%) in FY20, with significant quarterly fluctuations, and ~10% PTI% for the full year of
Slide 14: Diversified and Growing Footprint
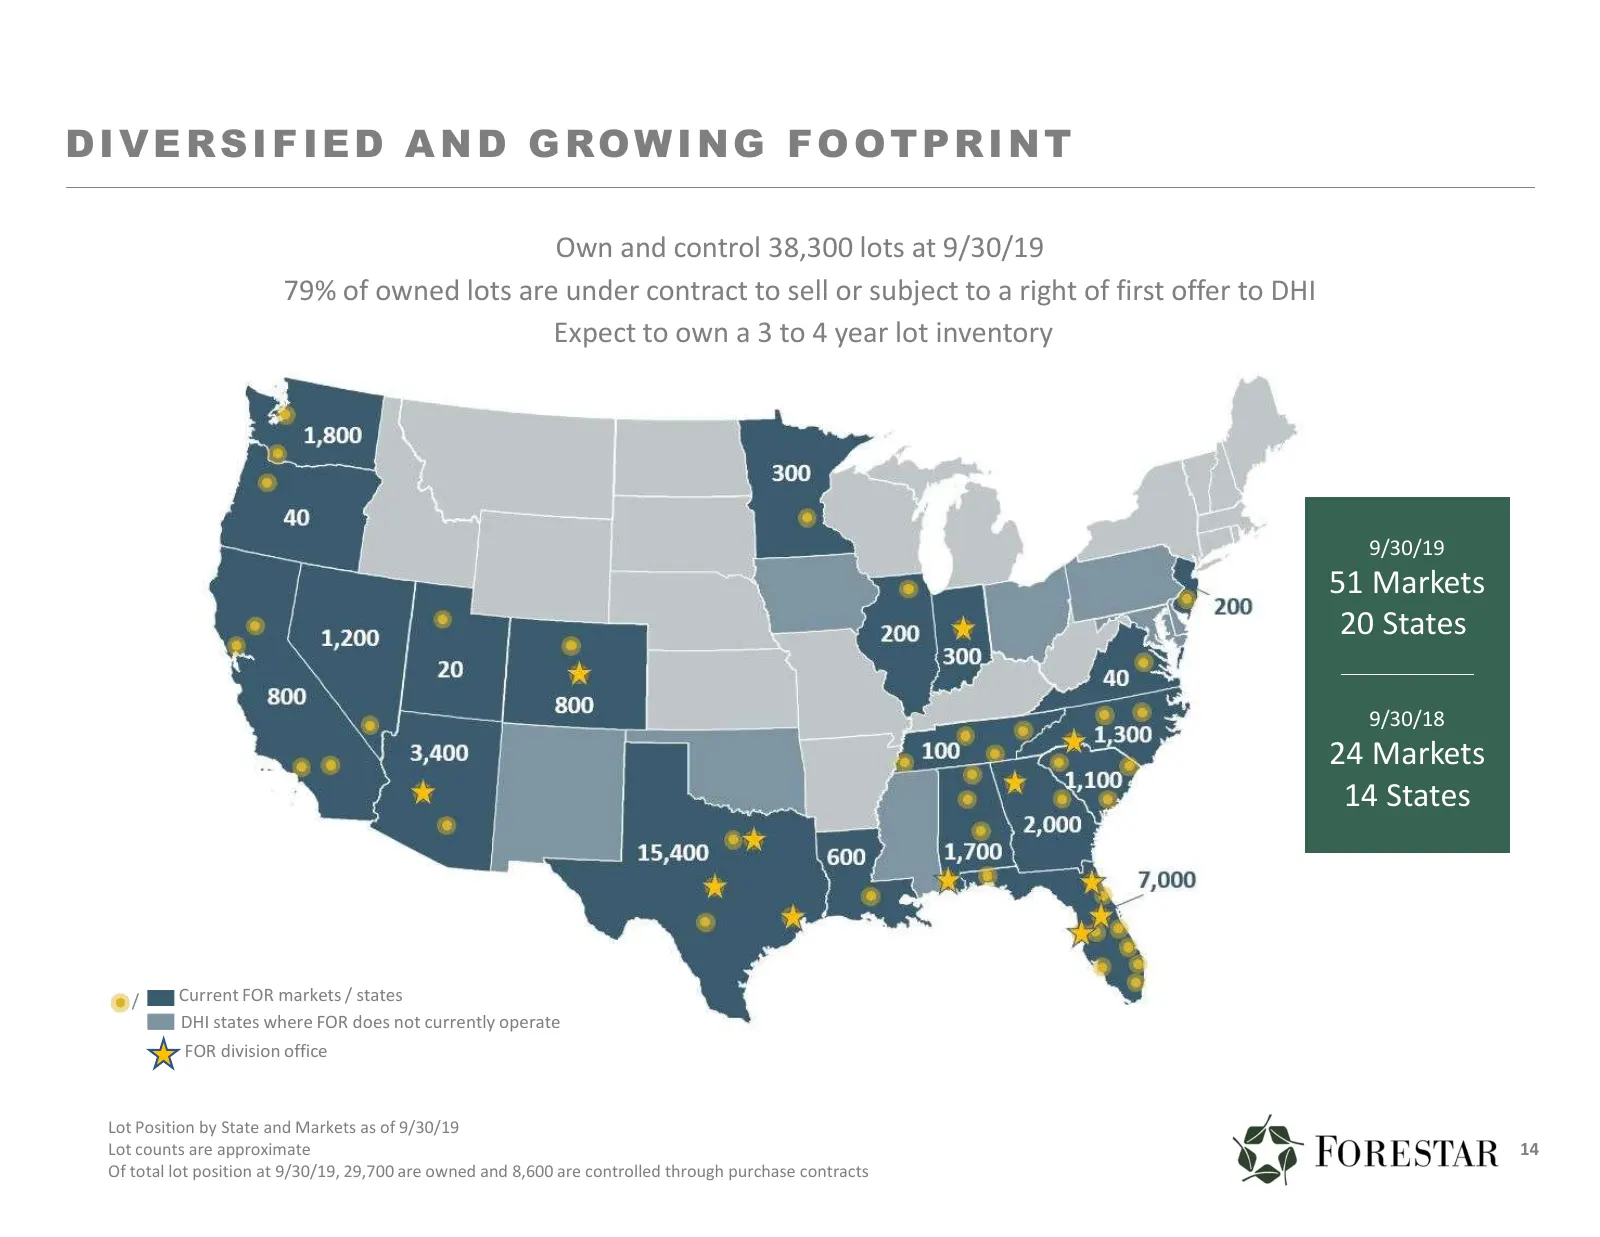
DIVERSIFIED AND GROWING FOOTPRINT Own and control 38,300 lots at 9/30/19 79% of owned lots are under contract to sell or subject to a right of first offer to DHI Expect to own a 3 to 4 year lot inventory 9/30/19 51 Markets 20 States 9/30/18 24 Markets 14 States / Current FOR markets / states DHI sta
Slide 15: Primary Focus on Attractive Entry-Level Segment
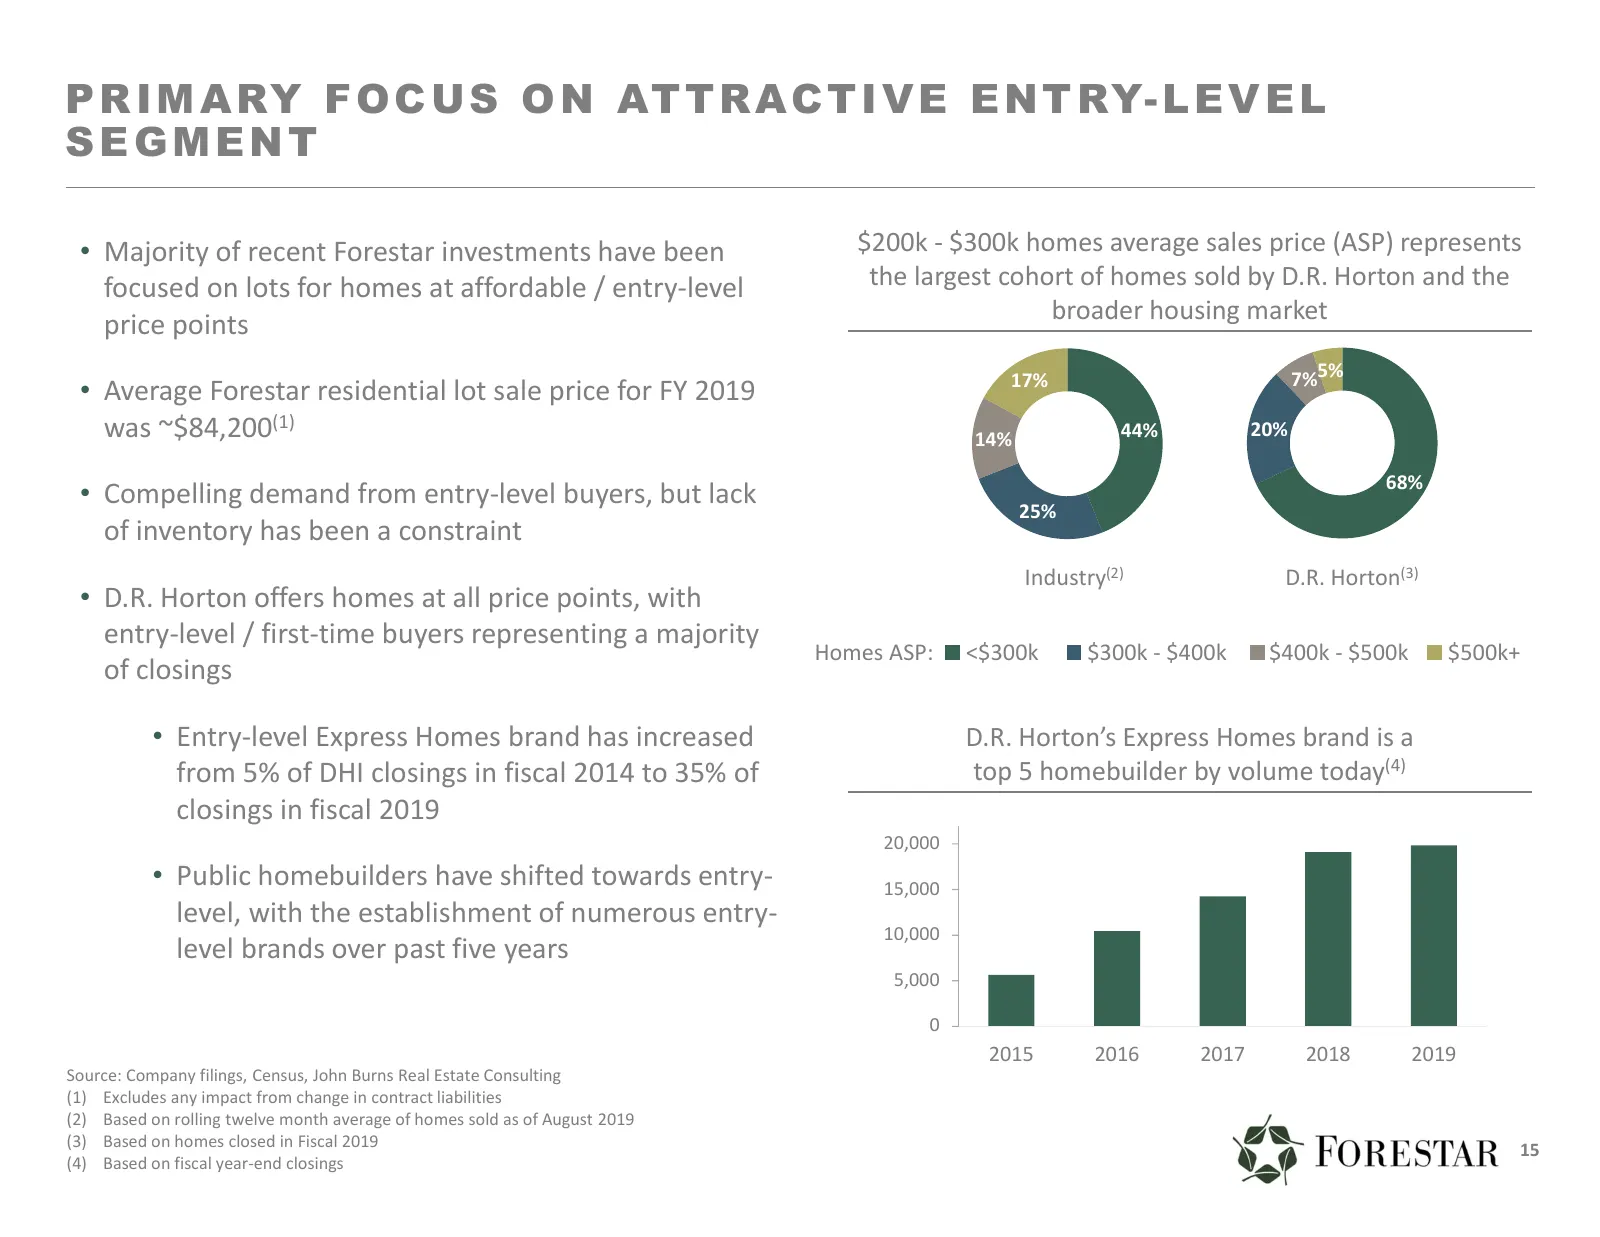
P R I M A RY F O C U S O N AT T R A C T I V E E N T RY- L E V E L SEGMENT • Majority of recent Forestar investments have been $200k ‐ $300k homes average sales price (ASP) represents focused on lots for homes at affordable / entry‐level the largest cohort of homes sold by D.R. Horton and the broader
Slide 16: Builders' Preference for 'Land Lighter' Strategy
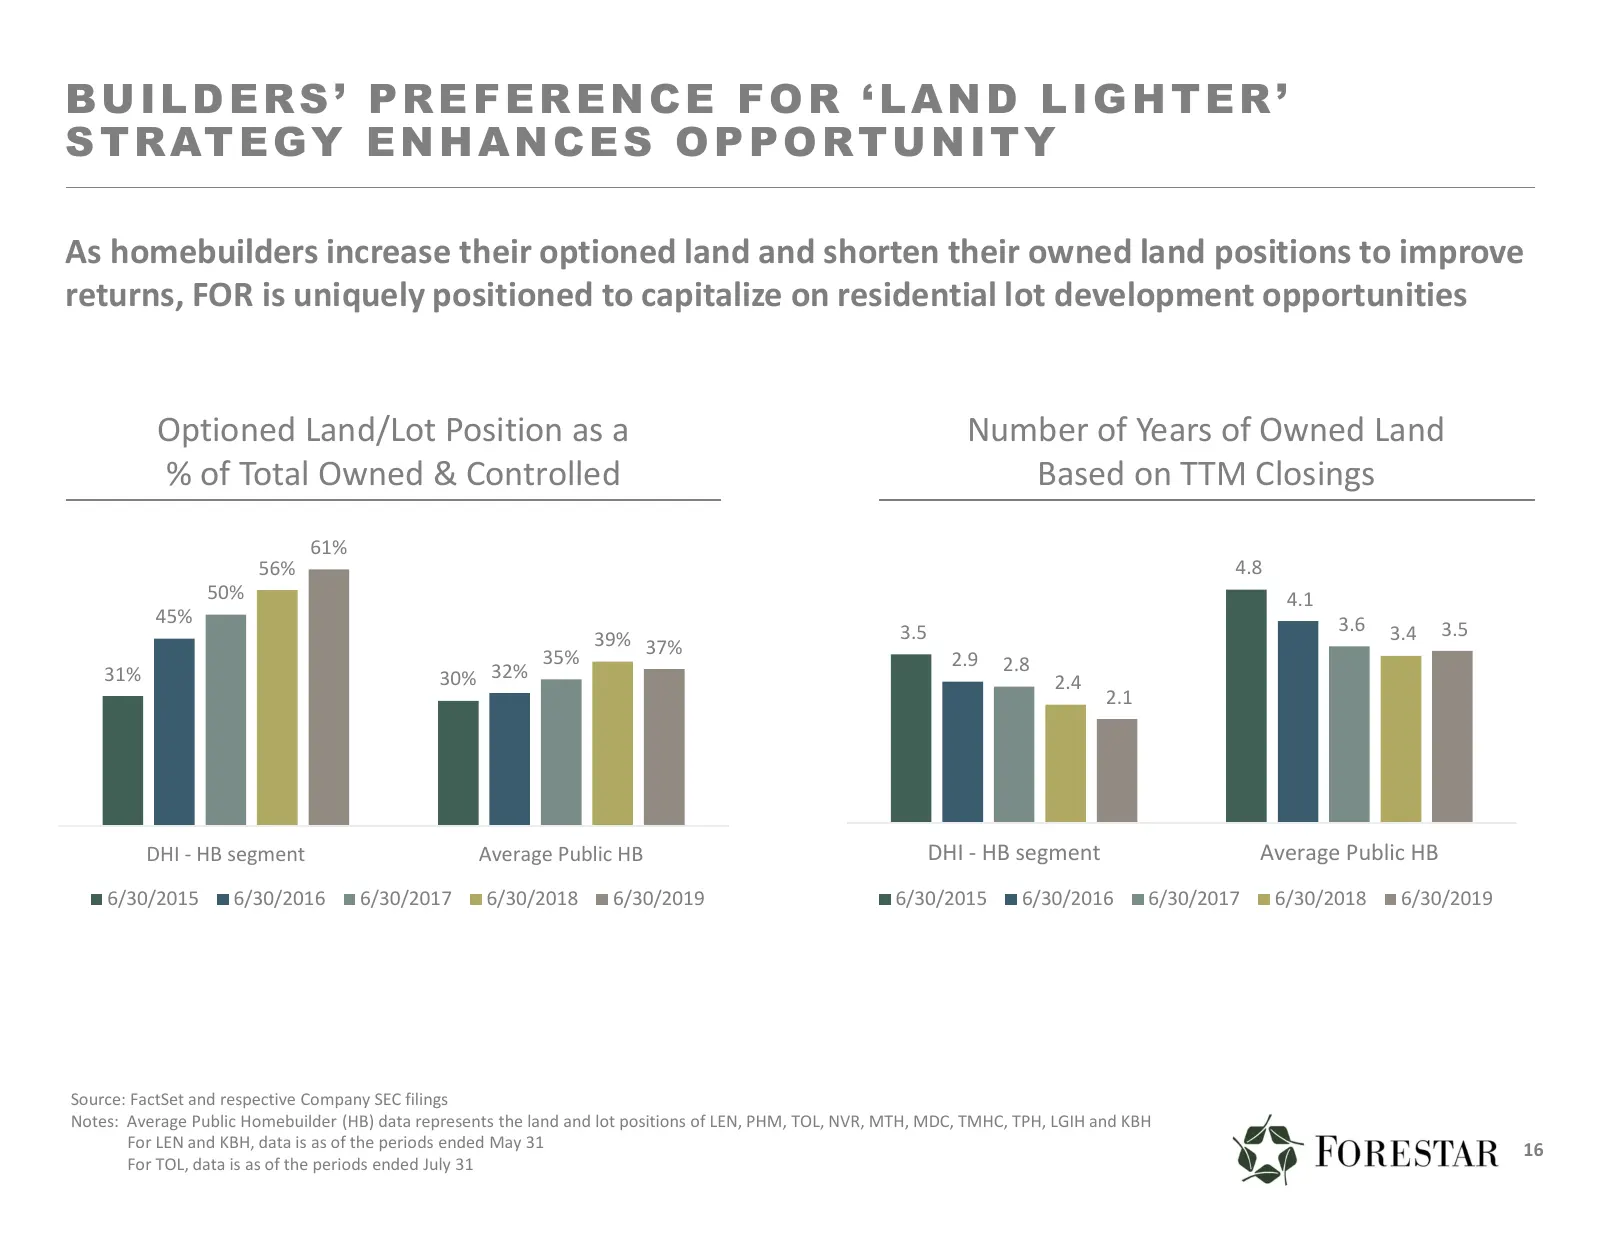
BUILDERS’ PREFERENCE FOR ‘LAND LIGHTER’ S T R AT E G Y E N H A N C E S O P P O R T U N I T Y As homebuilders increase their optioned land and shorten their owned land positions to improve returns, FOR is uniquely positioned to capitalize on residential lot development opportunities Optioned Land/Lot
Slide 17: Seasoned Leaders with Decades of Land Development Experience
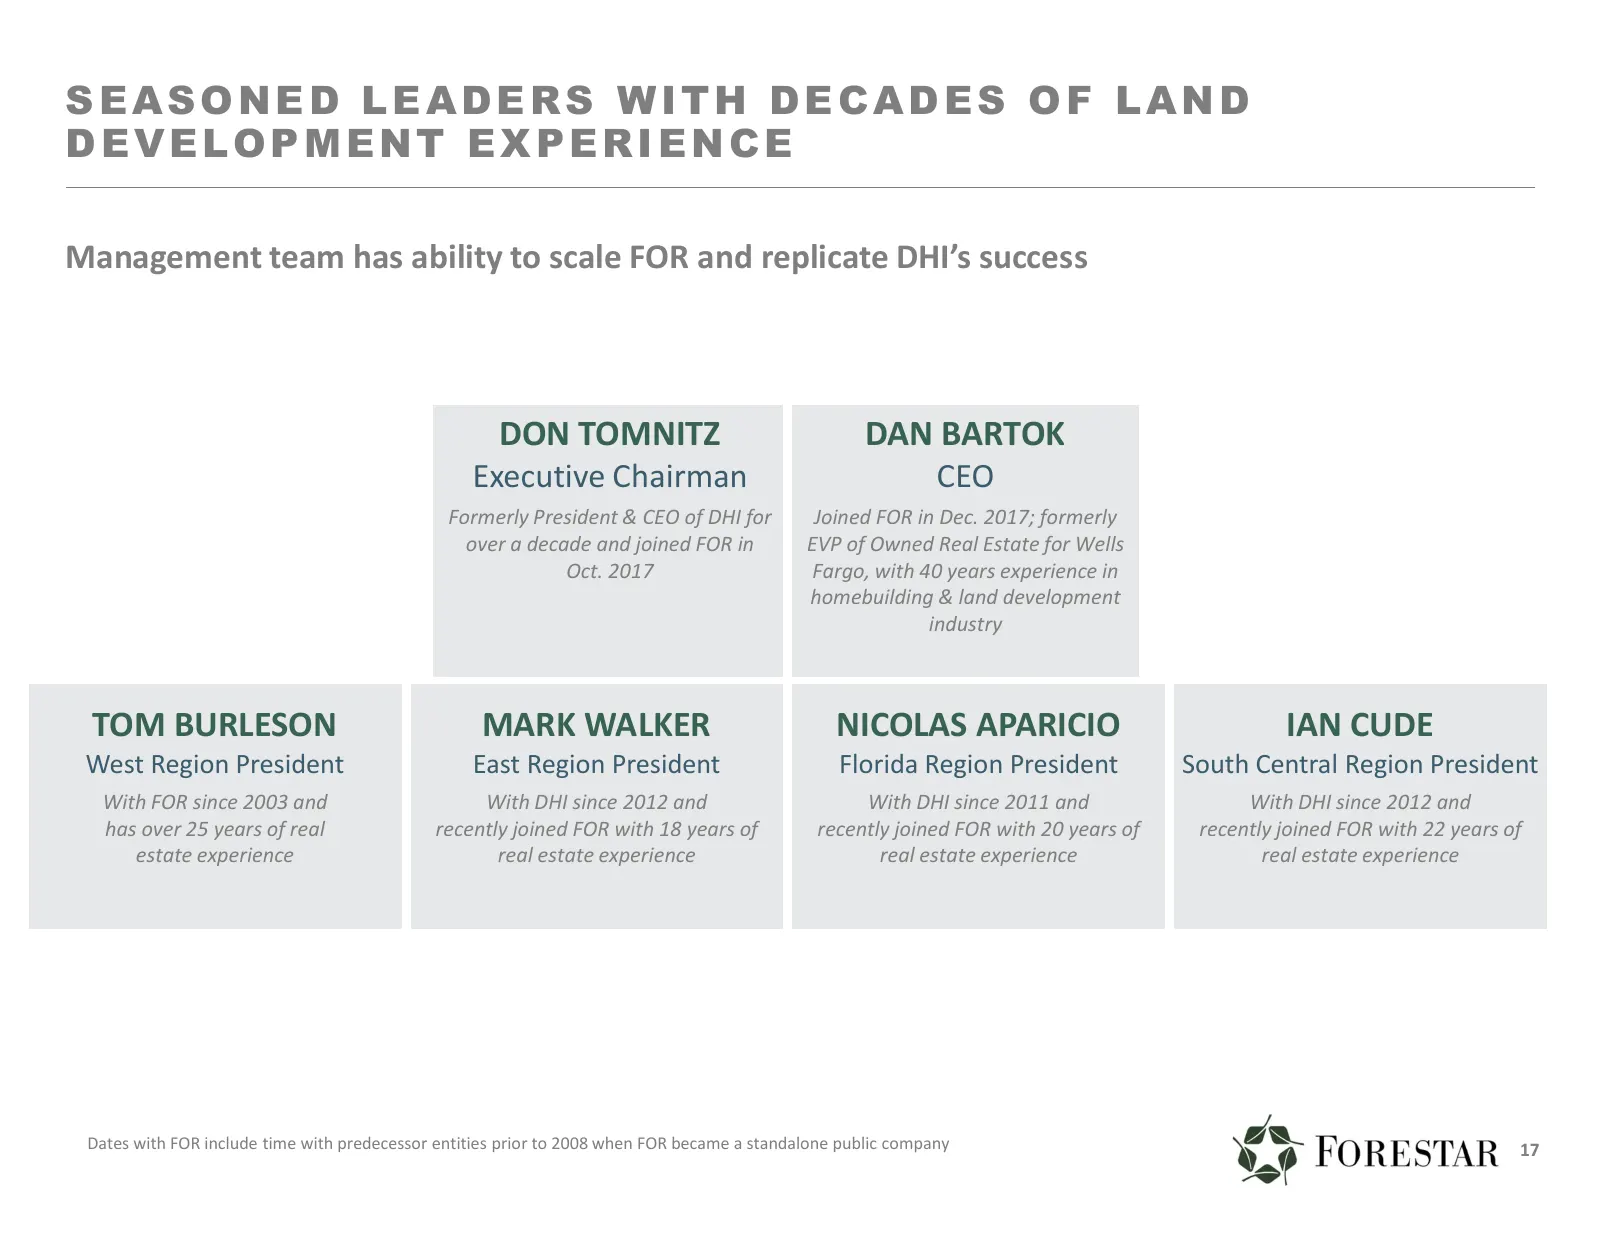
SEASONED LEADERS WITH DECADES OF LAND DEVELOPMENT EXPERIENCE Management team has ability to scale FOR and replicate DHI’s success DON TOMNITZ DAN BARTOK Executive Chairman CEO Formerly President & CEO of DHI for Joined FOR in Dec. 2017; formerly over a decade and joined FOR in EVP of Owned Real Esta
Slide 18: Financial Position and Policy
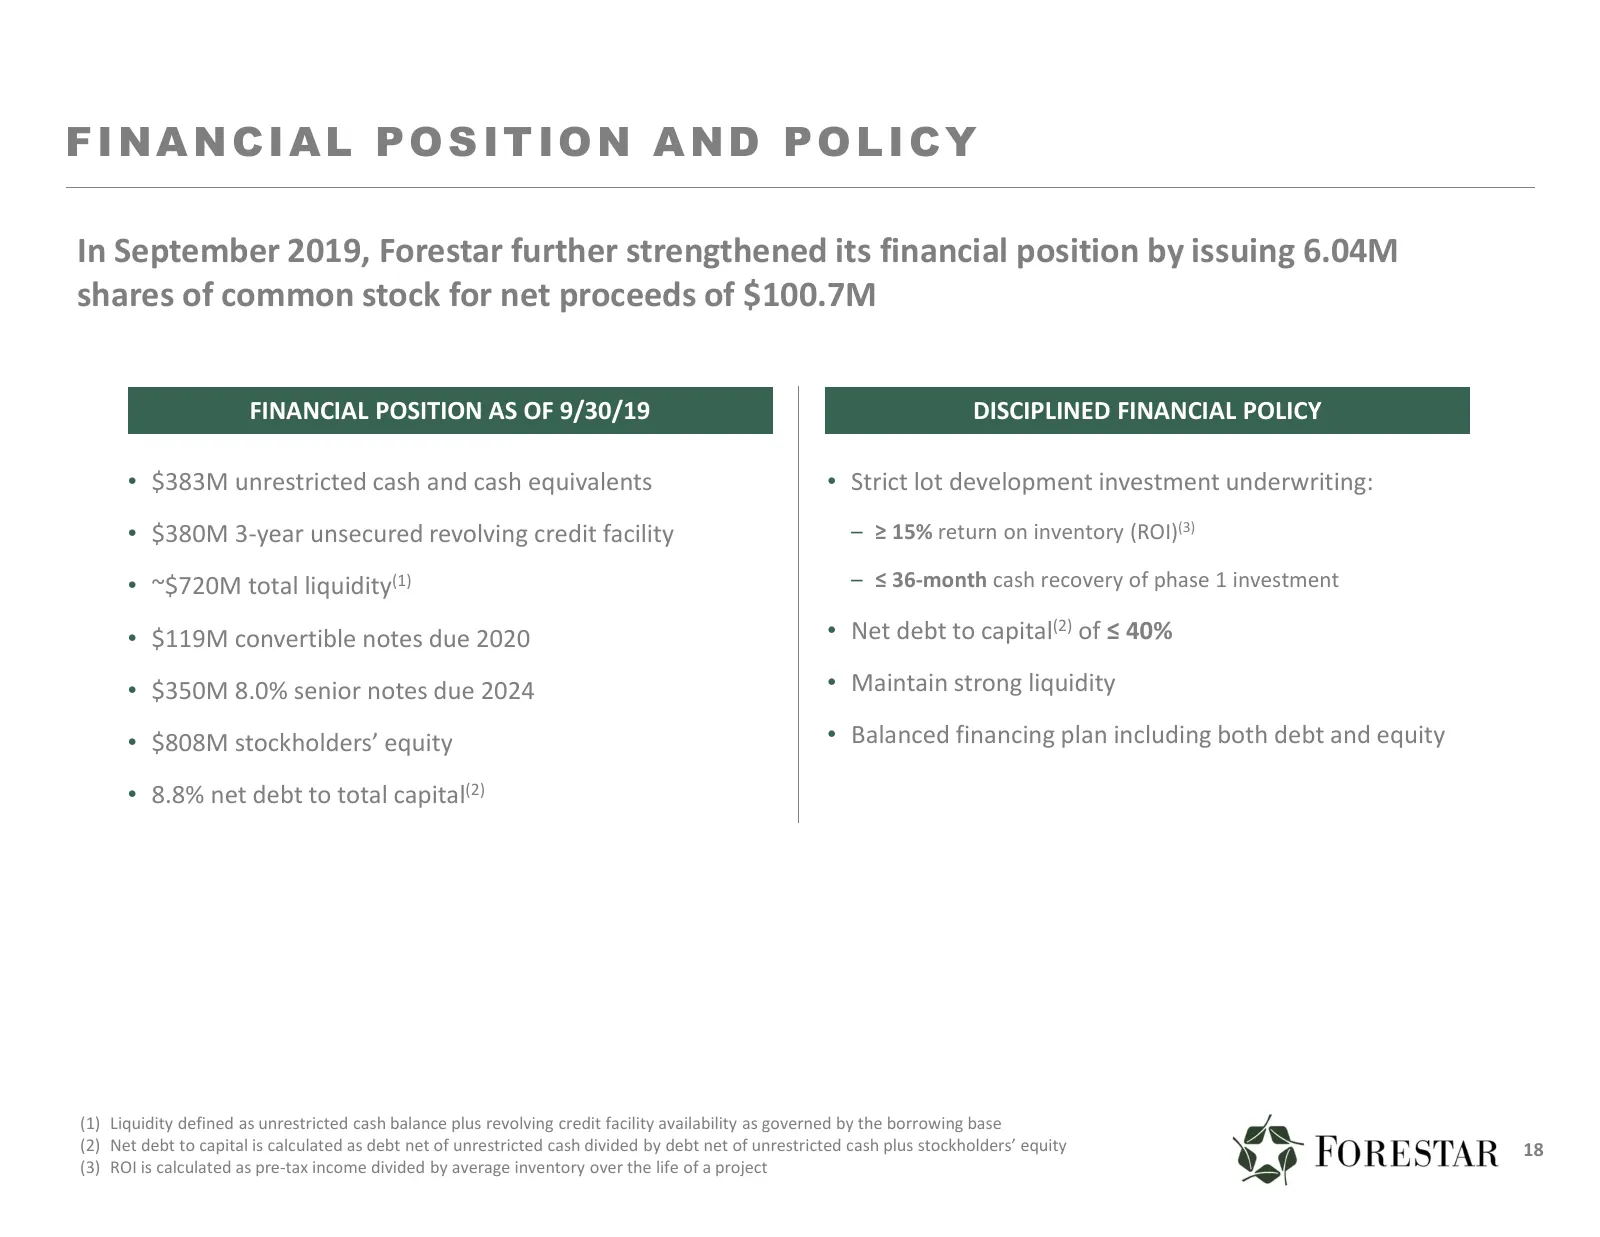
FINANCIAL POSITION AND POLICY In September 2019, Forestar further strengthened its financial position by issuing 6.04M shares of common stock for net proceeds of $100.7M FINANCIAL POSITION AS OF 9/30/19 DISCIPLINED FINANCIAL POLICY • $383M unrestricted cash and cash equivalents • Strict lot developm
Slide 19: Q4 and FY 2019 Highlights
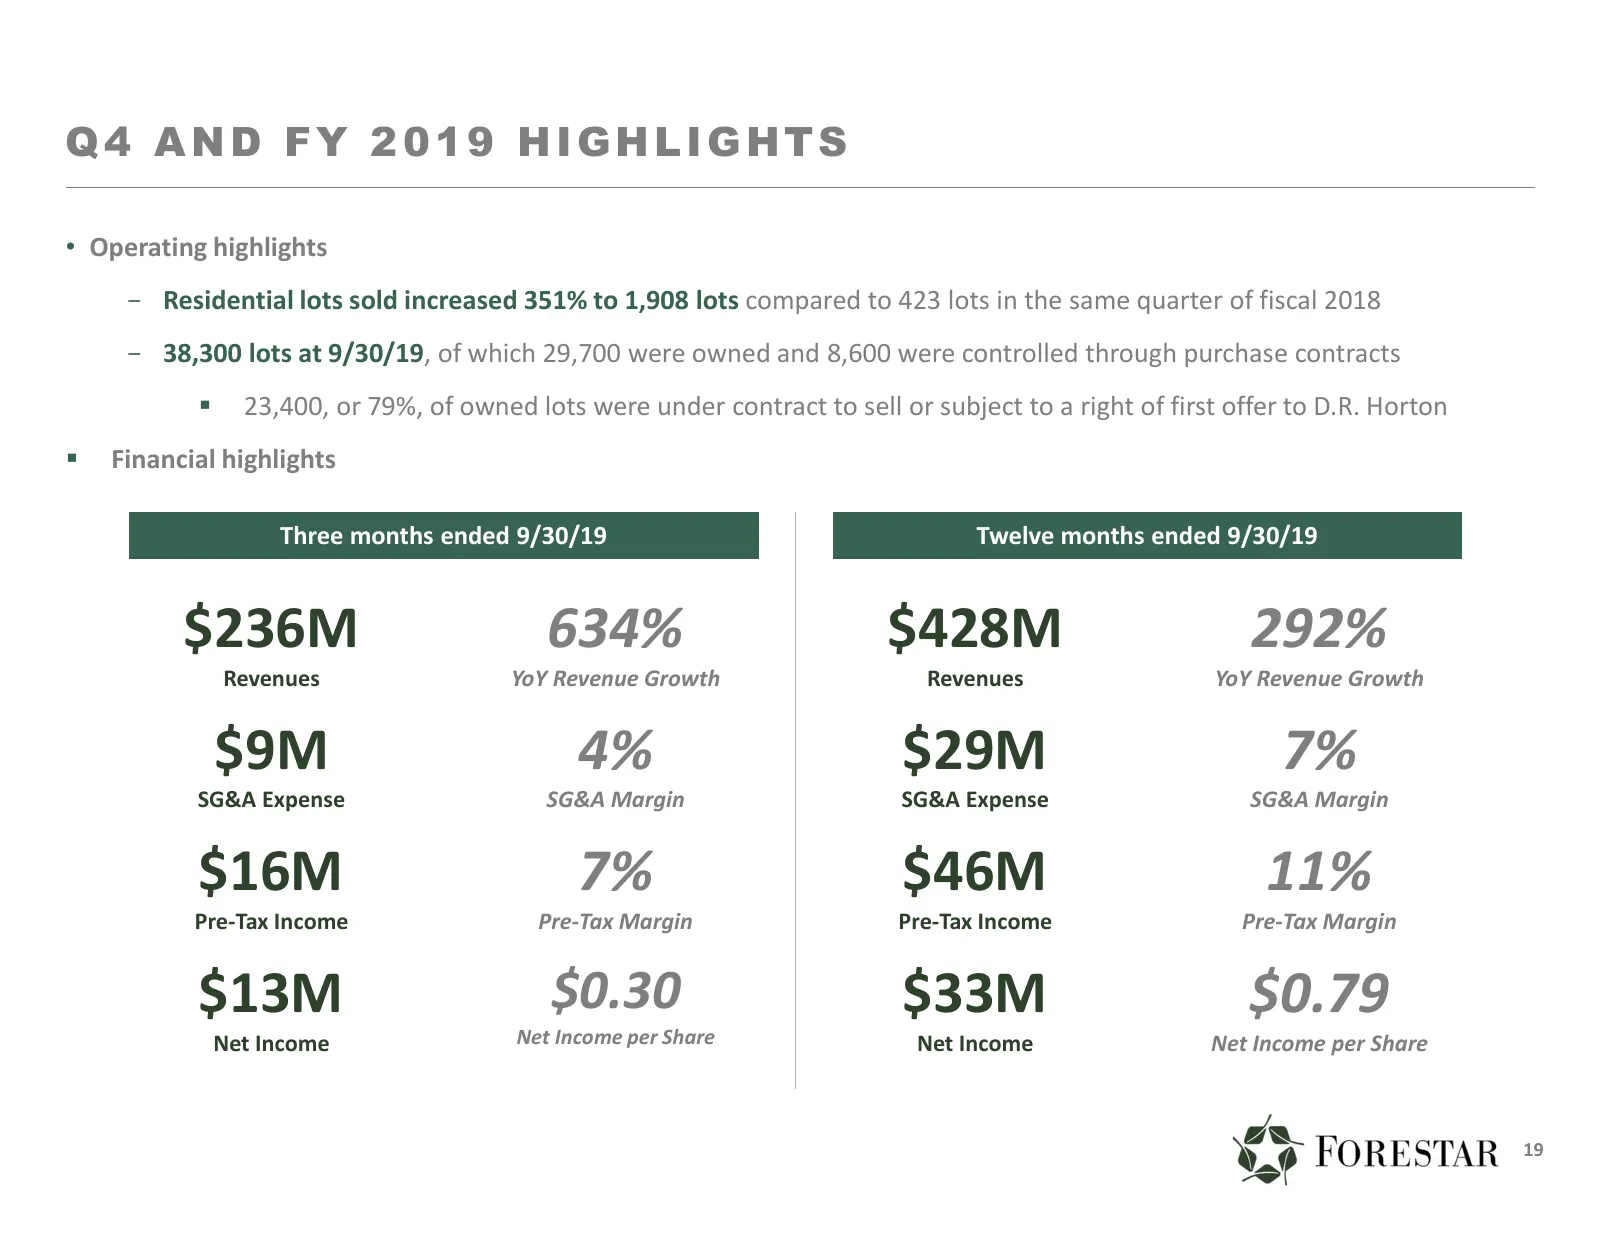
Q4 AND FY 2019 HIGHLIGHTS • Operating highlights - Residential lots sold increased 351% to 1,908 lots compared to 423 lots in the same quarter of fiscal 2018 - 38,300 lots at 9/30/19, of which 29,700 were owned and 8,600 were controlled through purchase contracts 23,400, or 79%, of owned lots were
Slide 20: Forestar Investment Highlights
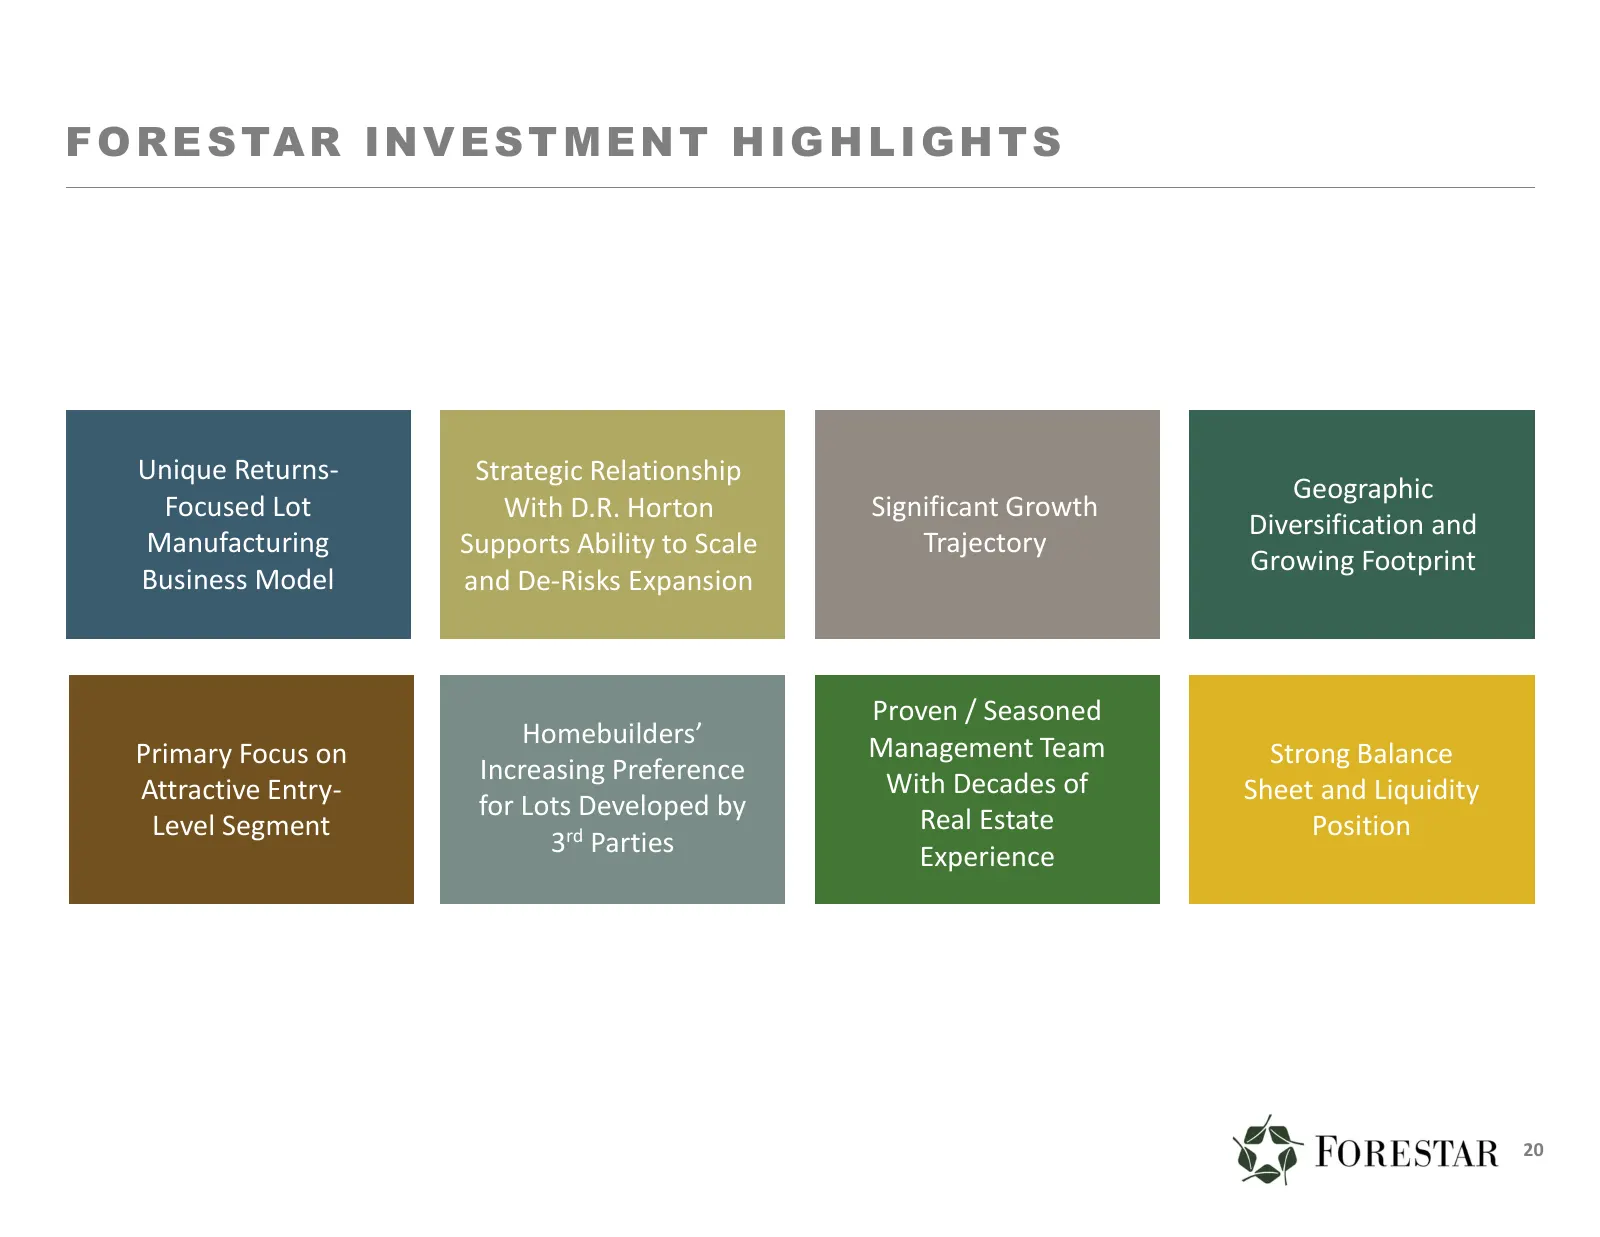
F O R E S TA R I N V E S T M E N T H I G H L I G H T S Unique Returns‐ Strategic Relationship Geographic Focused Lot With D.R. Horton Significant Growth Diversification and Manufacturing Supports Ability to Scale Trajectory Growing Footprint Business Model and De‐Risks Expansion Proven / Seasoned Ho
Slide 21: Appendix
APPENDIX ky FORESTAR
Slide 22: Solid Long-Term Industry Fundamentals
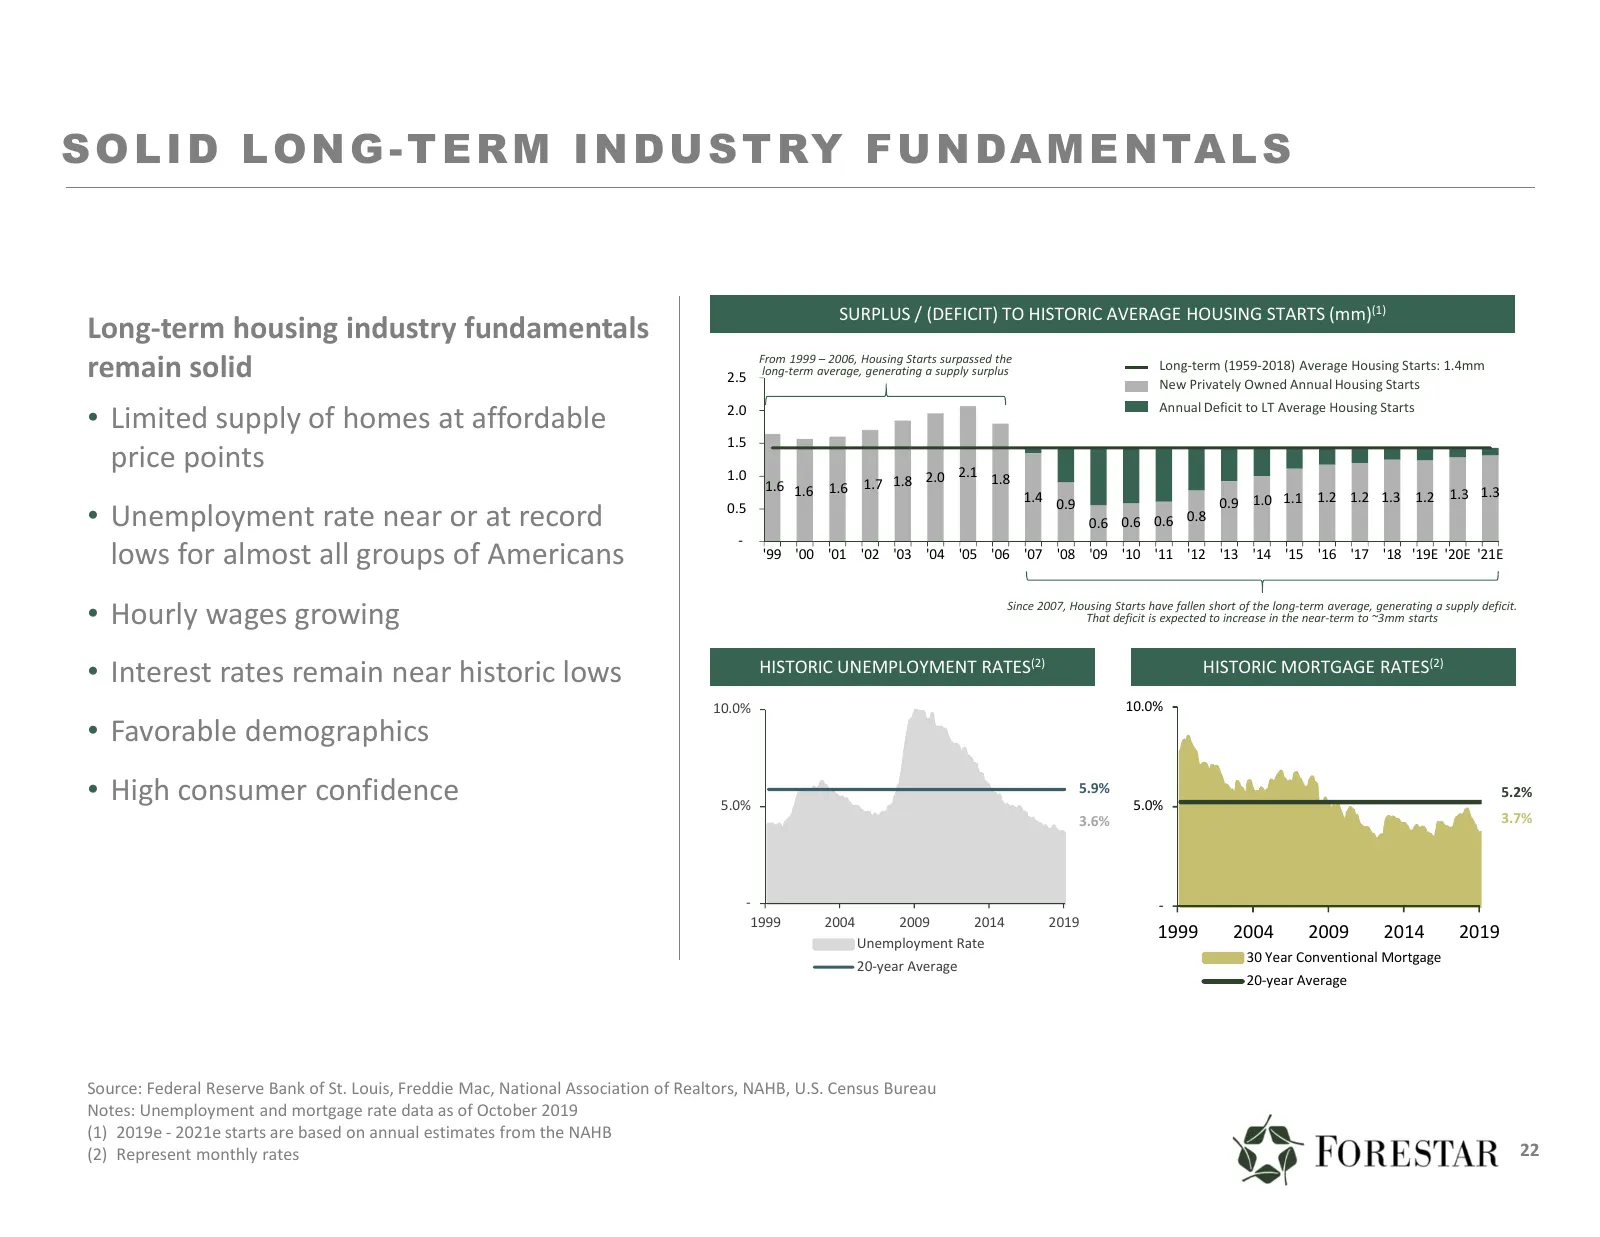
S O L I D L O N G - T E R M I N D U S T RY F U N DA M E N TA L S SURPLUS / (DEFICIT) TO HISTORIC AVERAGE HOUSING STARTS (mm)(1) Long-term housing industry fundamentals remain solid 2.5 From 1999 – 2006, Housing Starts surpassed the long-term average, generating a supply surplus Long‐term (1959‐2018)
Slide 23: DHI Growth, Consolidation and Market Share Gains Provide Roadmap for Forestar
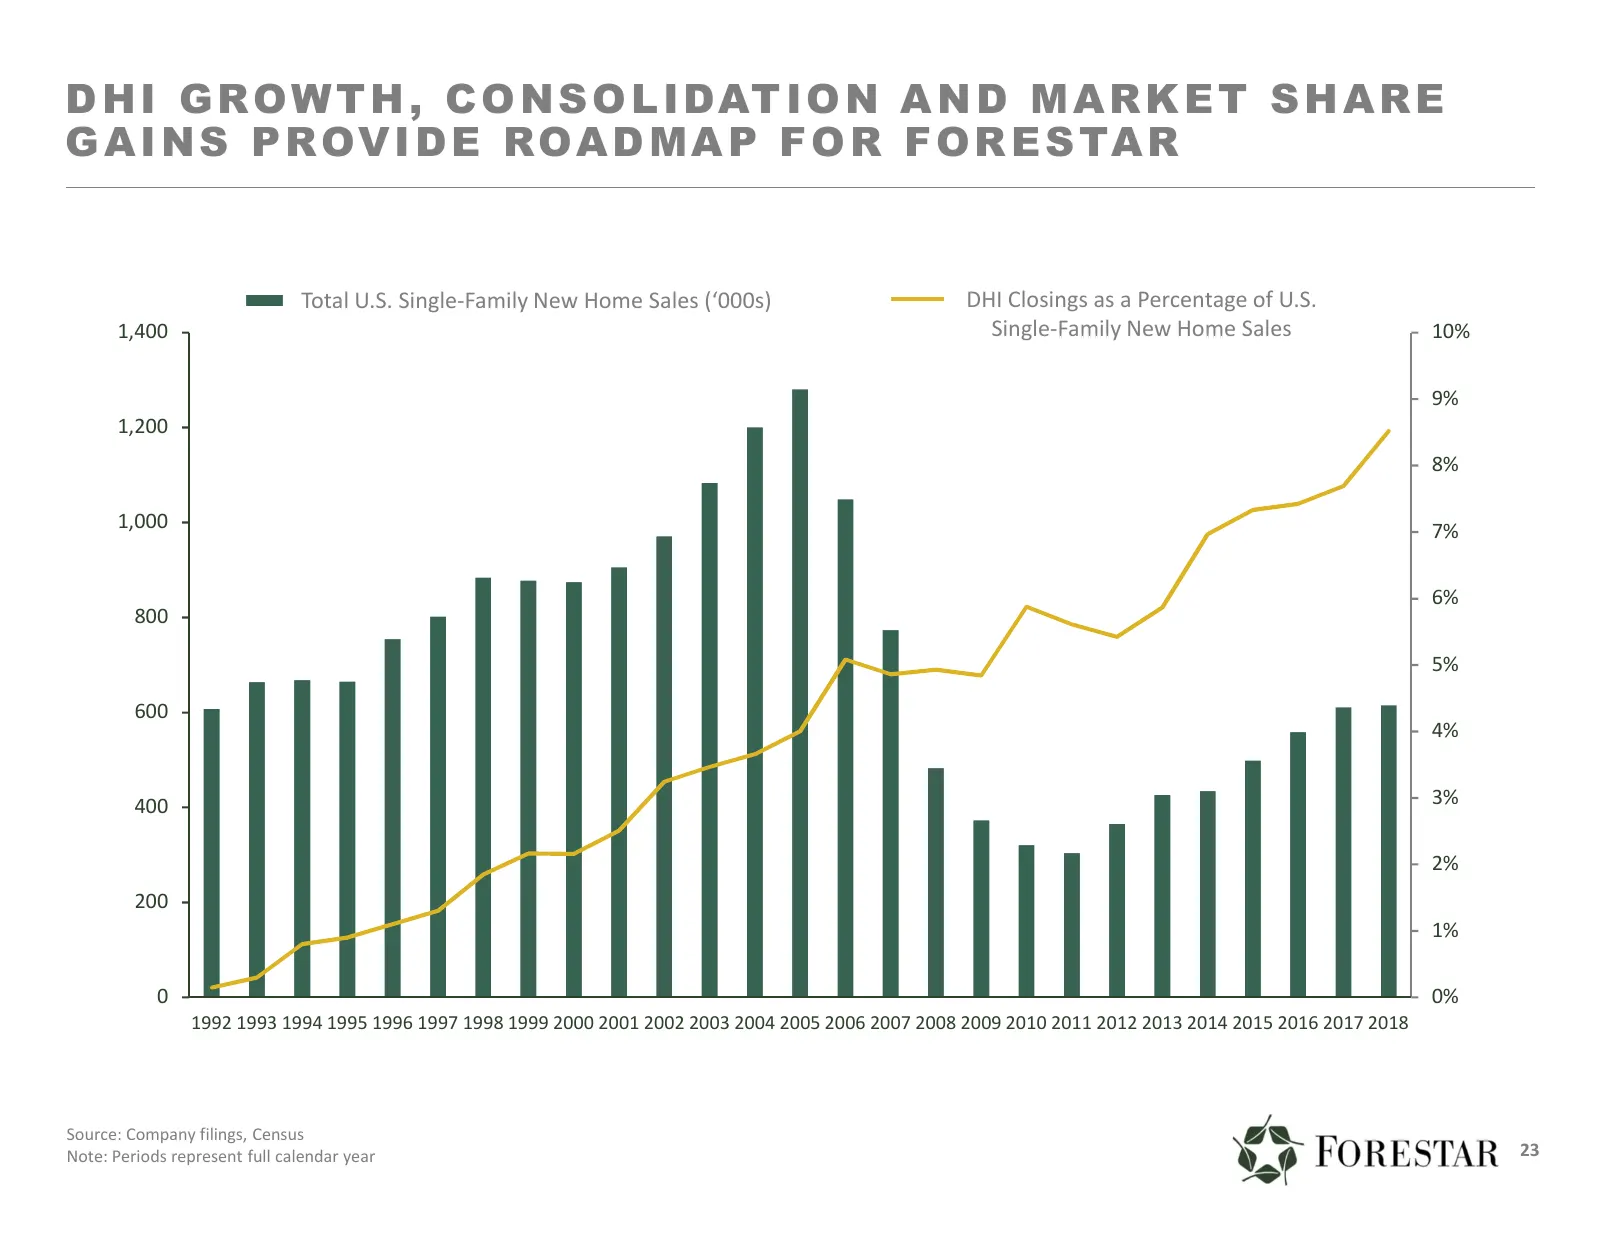
D H I G R O W T H , C O N S O L I DAT I O N A N D M A R K E T S H A R E G A I N S P R OV I D E R OA D M A P F O R F O R E S TA R Total TotalNew U.S. U.S. Single‐Family Single‐Family NewHouses Sold ('000s) Home Sales (‘000s) Series DHI 3 as a Percentage of U.S. Closings 1,400 Single‐Family New Home S
Slide 24: Income Statement
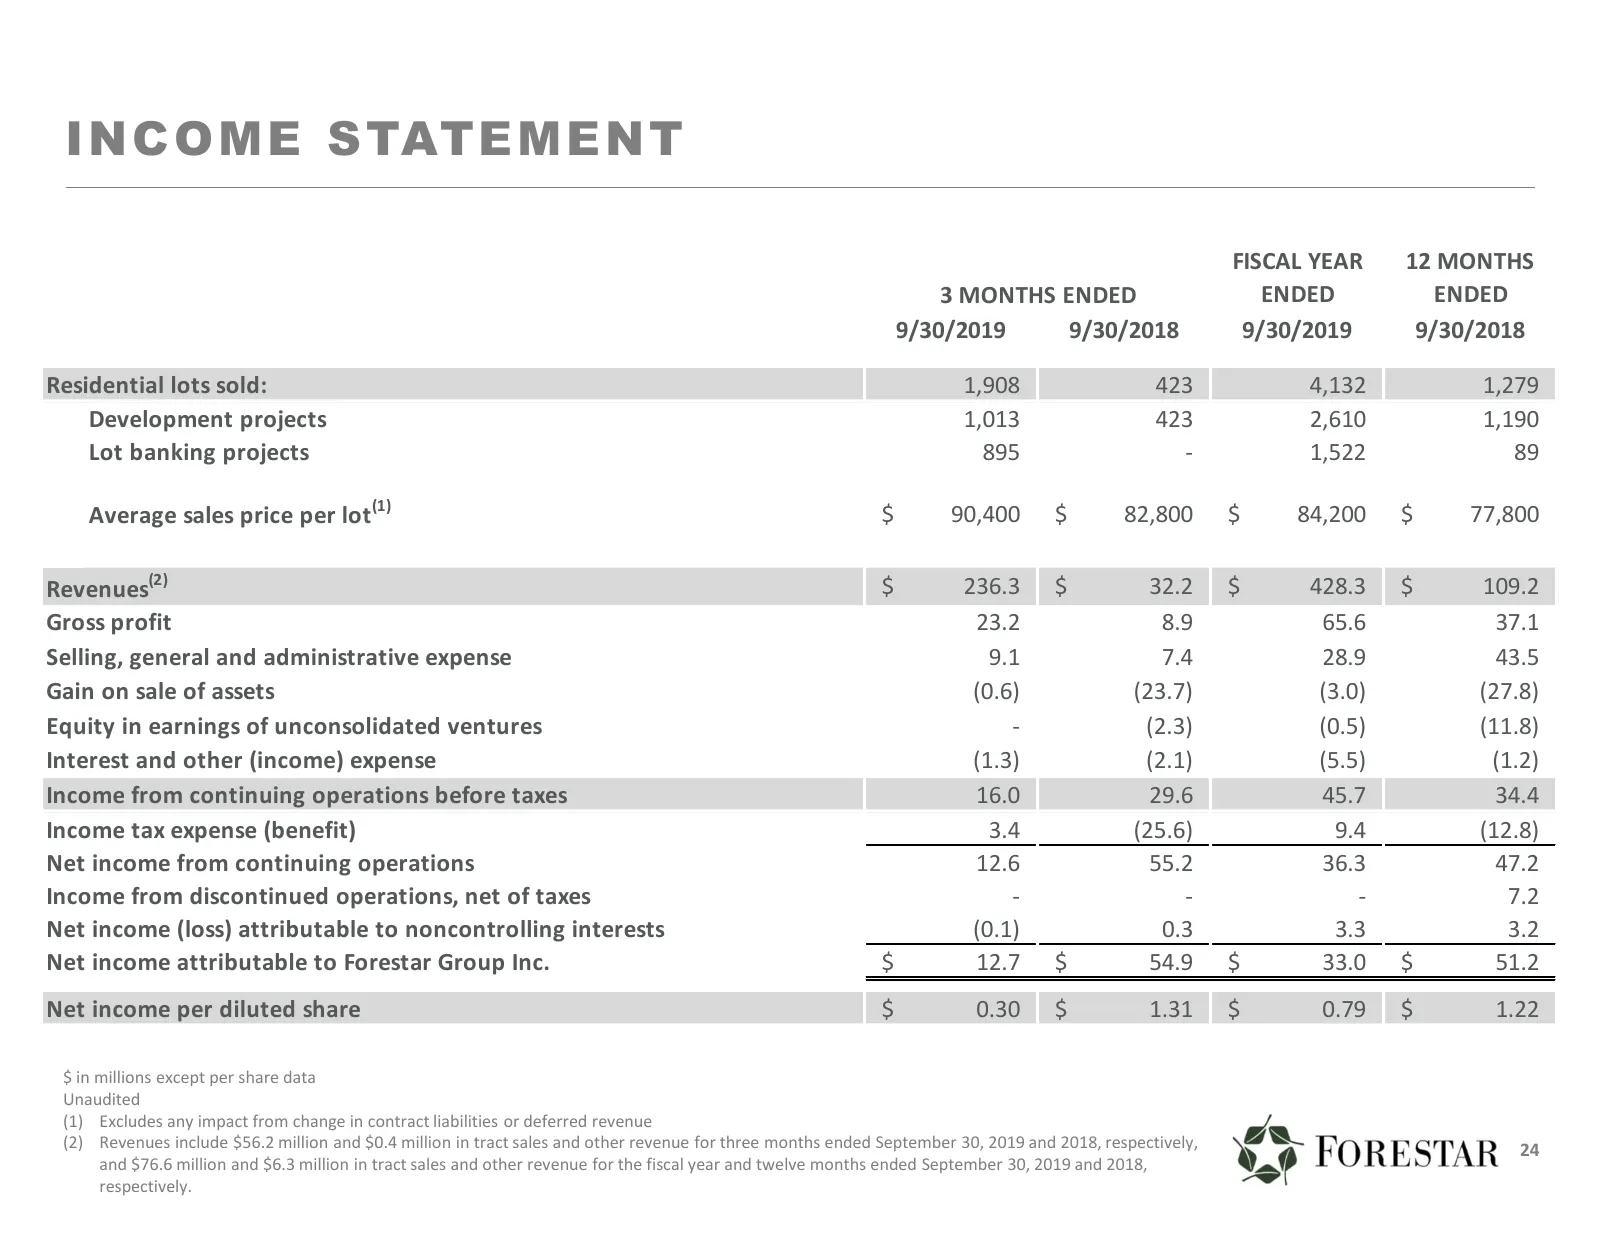
I N C O ME S TATE ME N T FISCAL YEAR 12 MONTHS 3 MONTHS ENDED ENDED ENDED 9/30/2019 9/30/2018 9/30/2019 9/30/2018 Residential lots sold: 1,908 423 4,132 1,279 Development projects 1,013 423 2,610 1,190 Lot banking projects 895 ‐ 1,522 89 Average sales price per lot (1) $ 90,400 $ 82,800 $ 84,200 $ 7
Slide 25: Balance Sheet
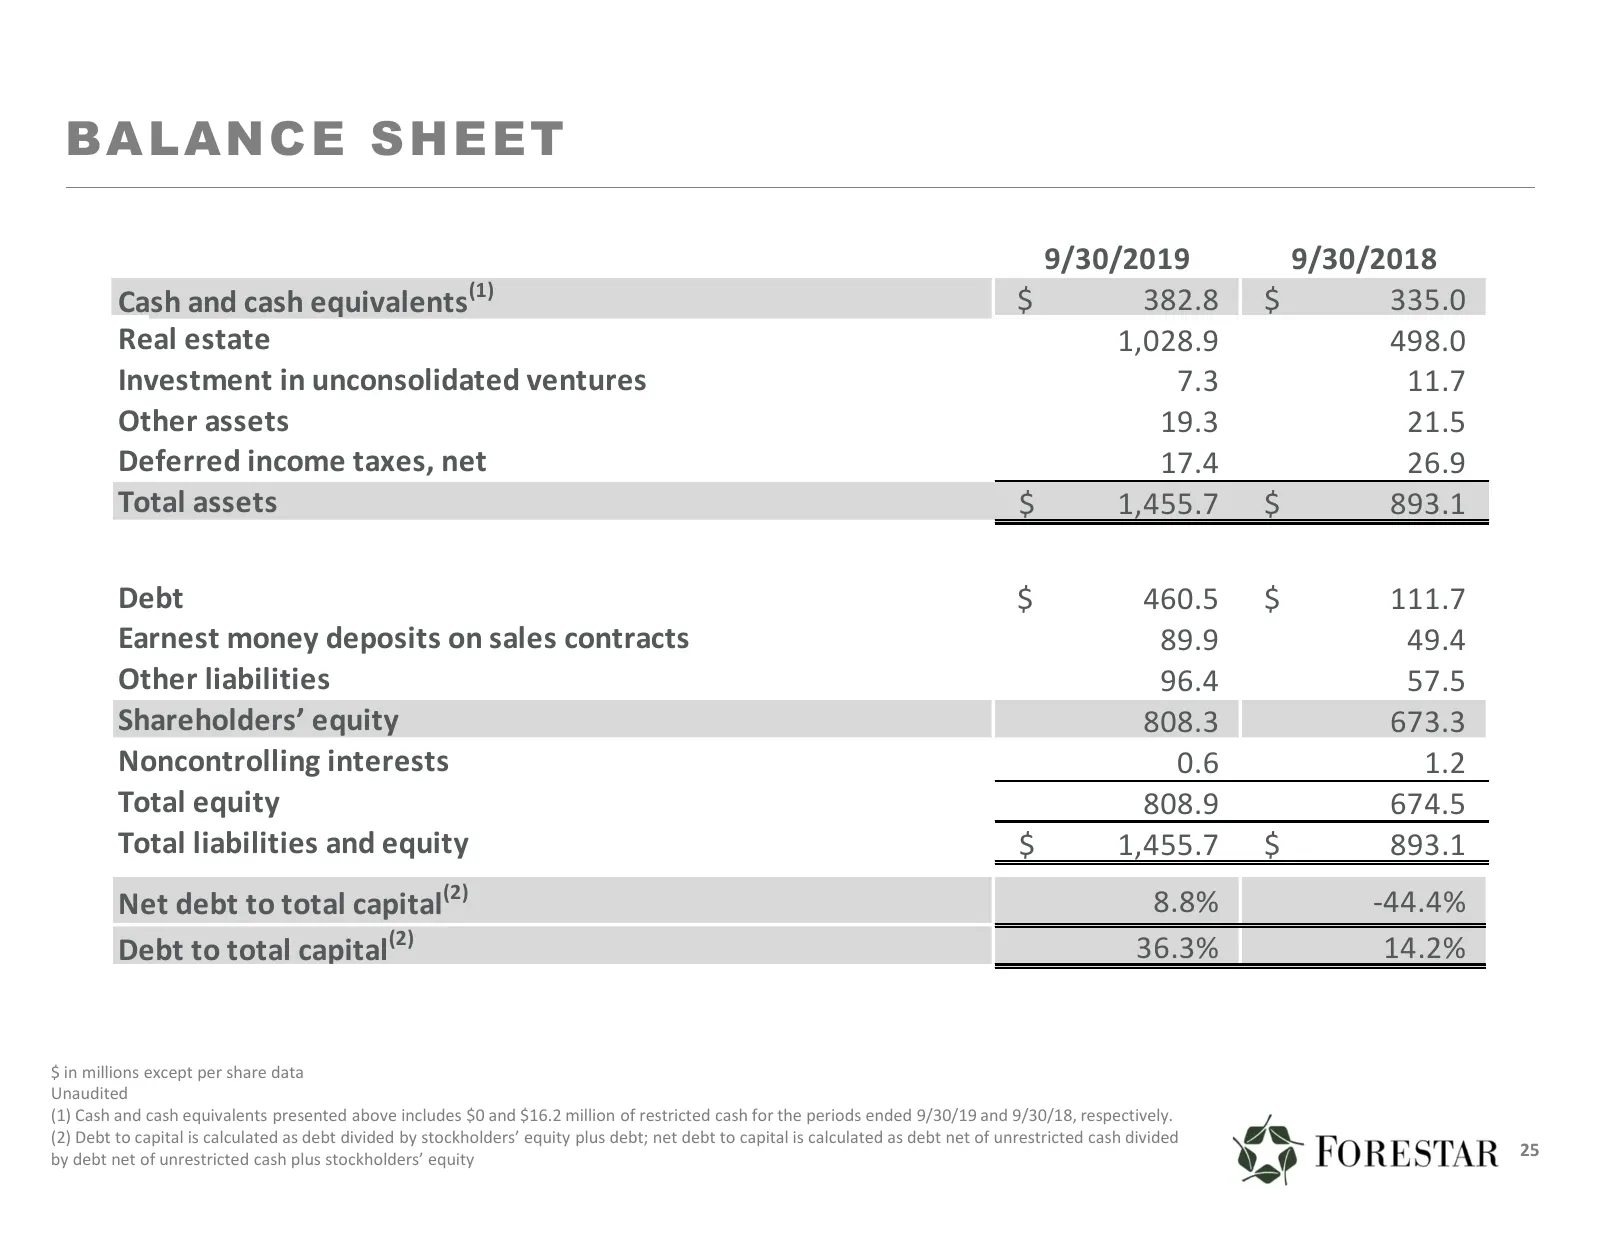
BA L A NC E SH E ET 9/30/2019 9/30/2018 (1) Cash and cash equivalents $ 382.8 $ 335.0 Real estate 1,028.9 498.0 Investment in unconsolidated ventures 7.3 11.7 Other assets 19.3 21.5 Deferred income taxes, net 17.4 26.9 Total assets $ 1,455.7 $ 893.1 Debt $ 460.5 $ 111.7 Earnest money deposits on sal
Slide 26: Illustrative Forestar Project Cash Flows & Return
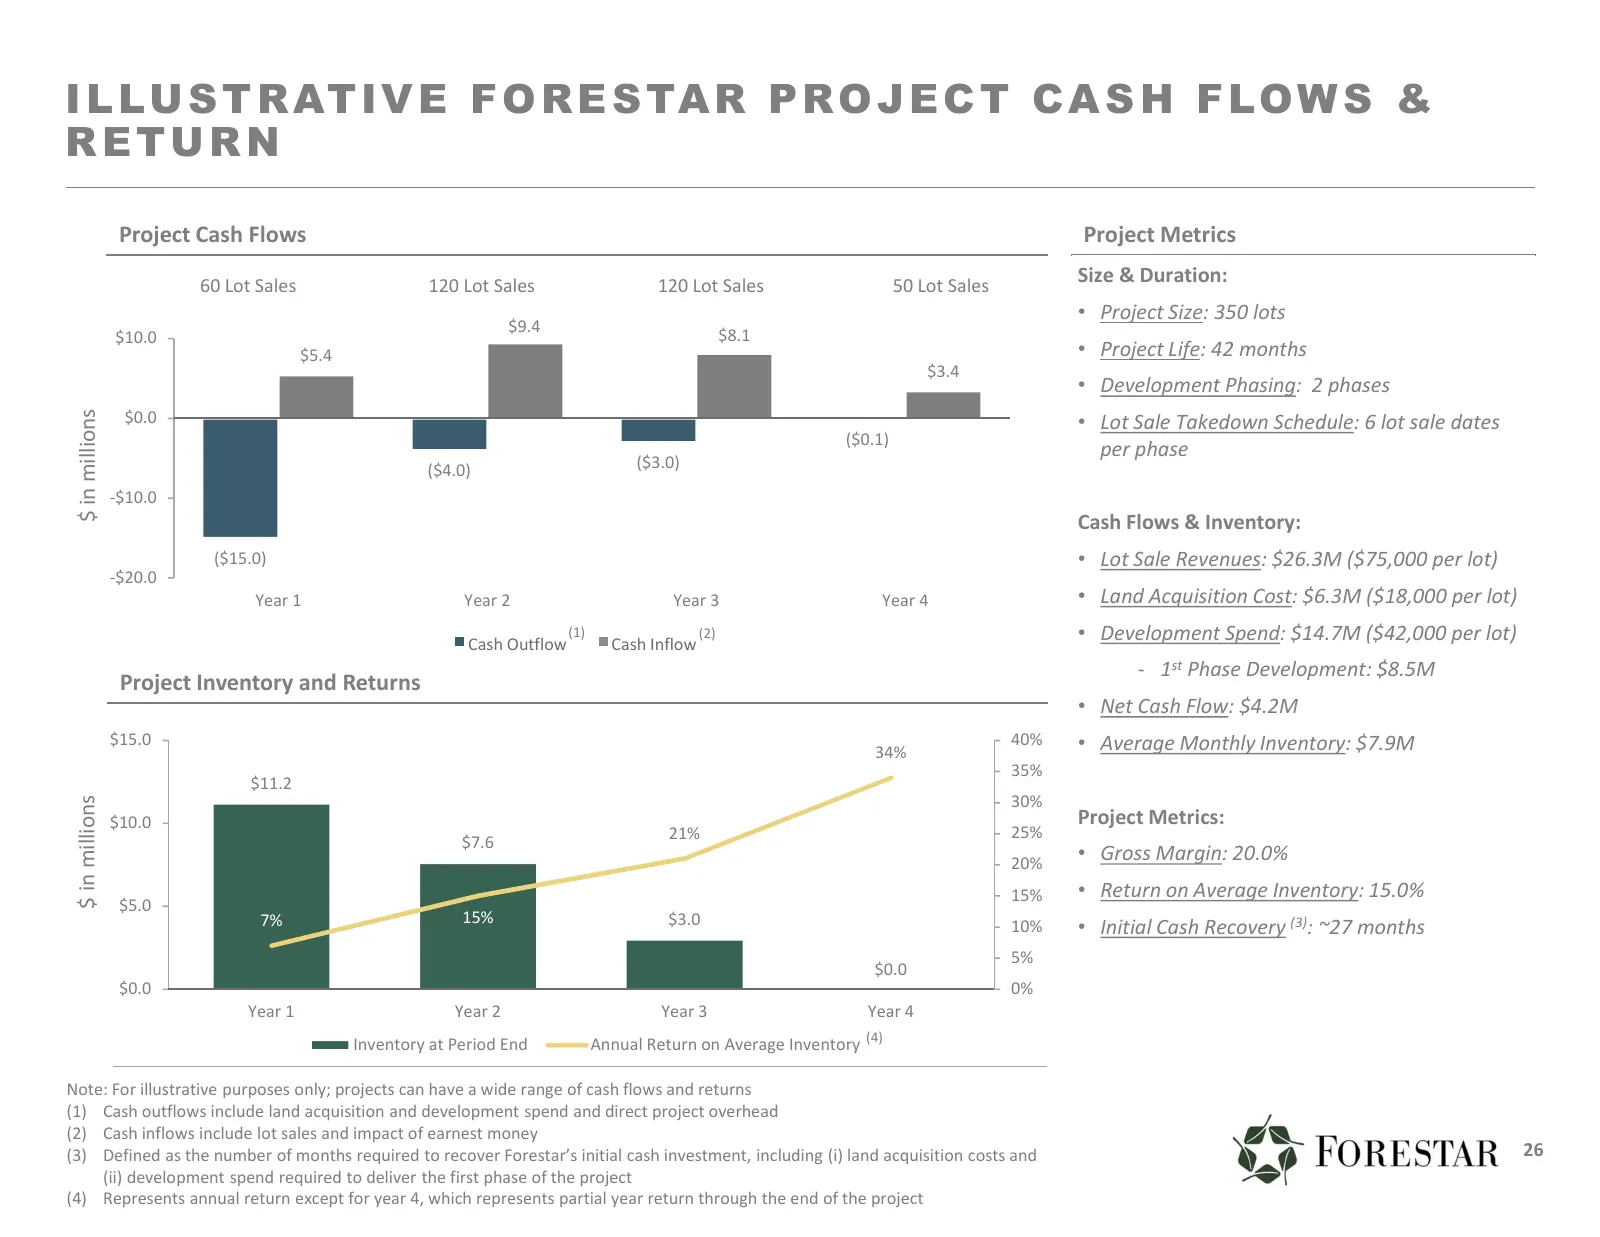
I L LU S T R AT I V E F O R E S TA R P R O J E C T C A S H F L O W S & RETURN Project Cash Flows Project Metrics 60 Lot Sales 120 Lot Sales 120 Lot Sales 50 Lot Sales Size & Duration: • Project Size: 350 lots $9.4 $8.1 $10.0 $5.4 • Project Life: 42 months $3.4 • Development Phasing: 2 phases $0.0 •
Slide 27: Illustrative Homebuilder vs. Lot Manufacturer Project Economics
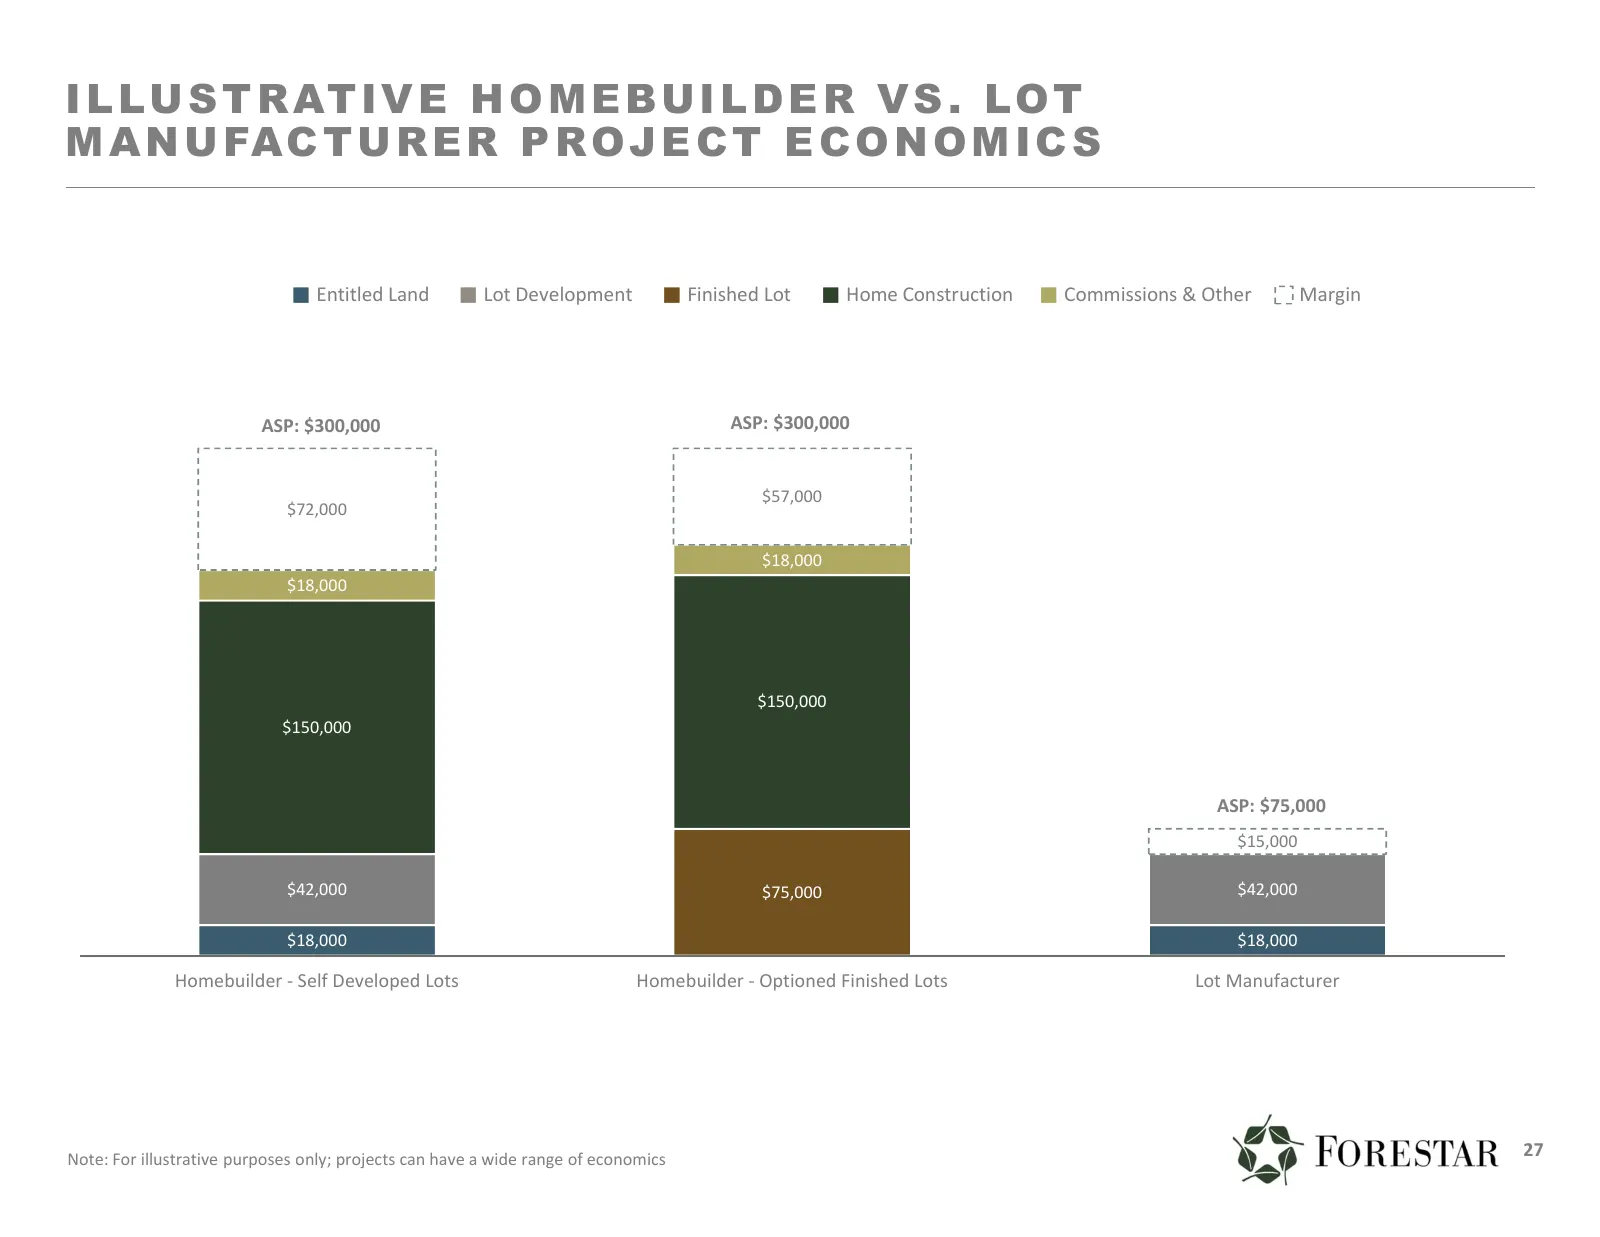
I L LU S T R AT I V E H O M E B U I L D E R V S . L OT M A N U FA C T U R E R P R O J E C T E C O N O M I C S Entitled Land Lot Development Finished Lot Home Construction Commissions & Other Margin ASP: $300,000 ASP: $300,000 $57,000 $72,000 $18,000 $18,000 $150,000 $150,000 ASP: $75,000 $15,000 $42
Slide 28: FOR & DHI Relationship Overview
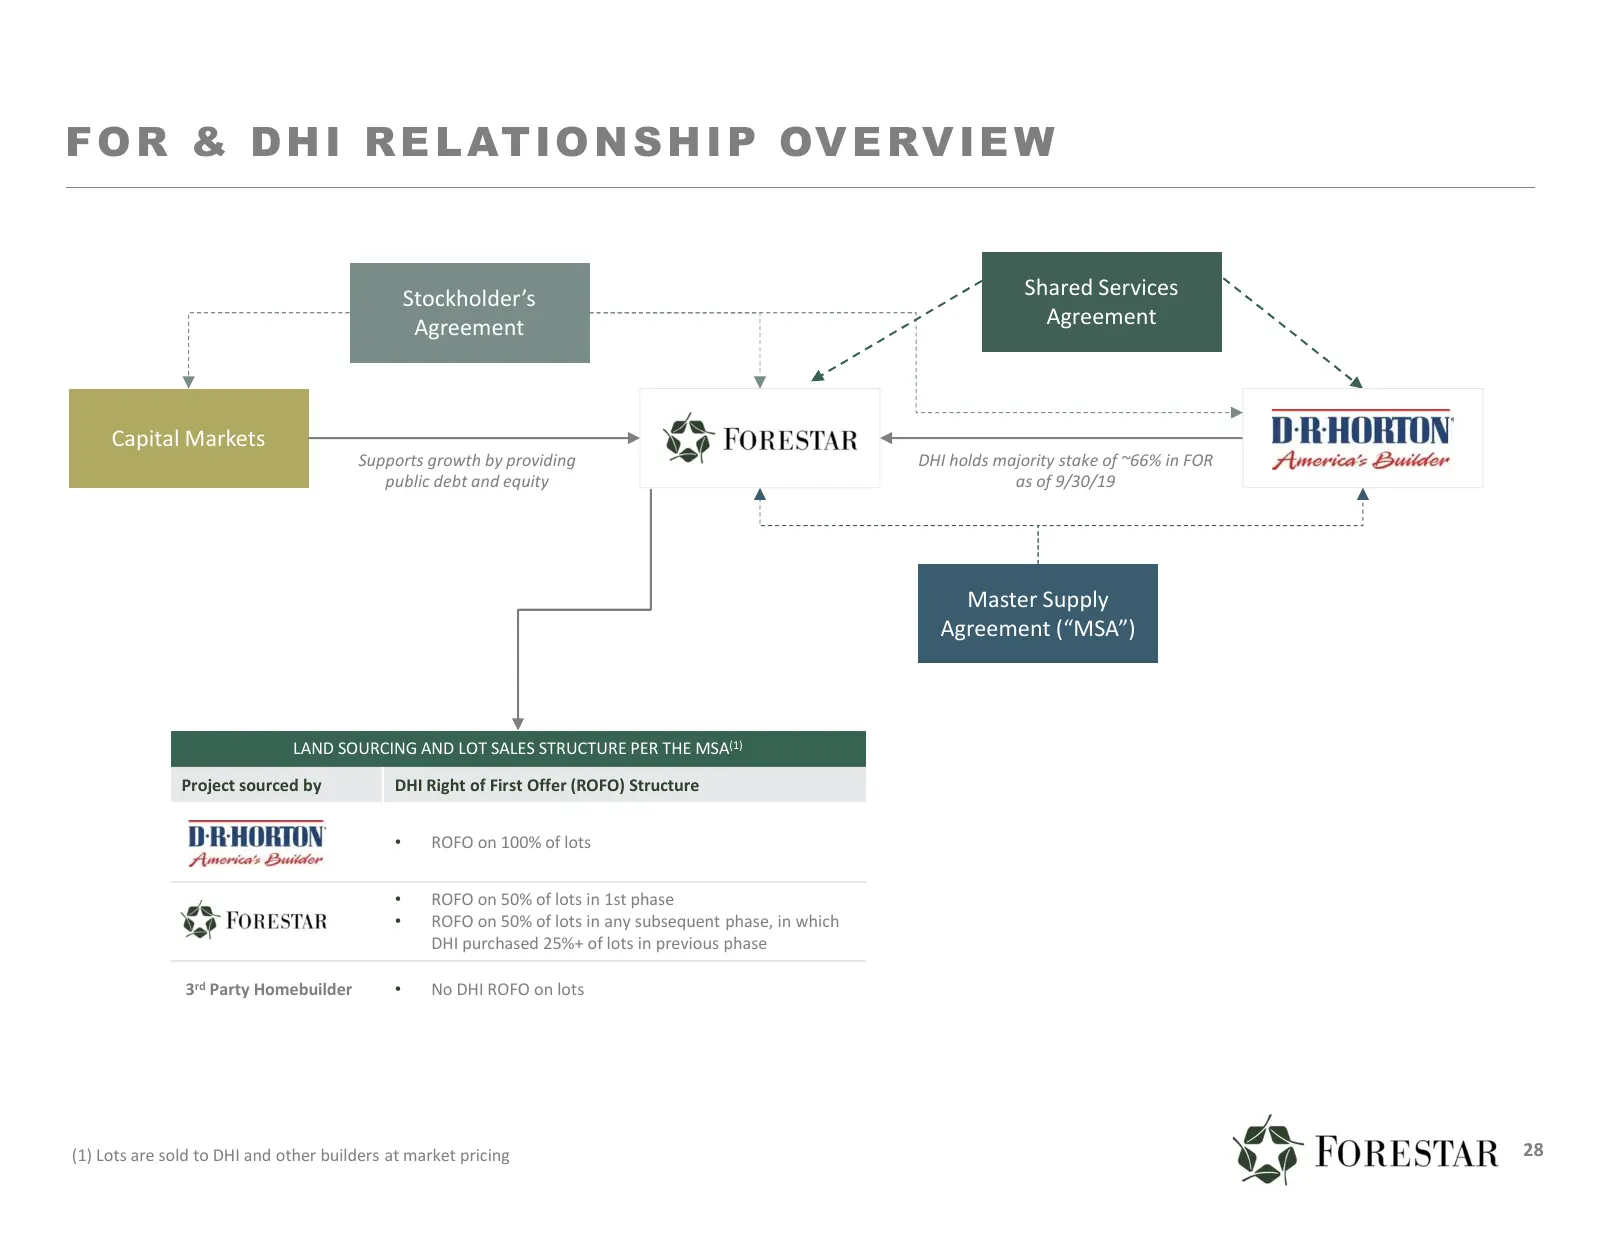
F O R & D H I R E L AT I O N S H I P OV E R V I E W Stockholder’s Shared Services Agreement Agreement Capital Markets Supports growth by providing DHI holds majority stake of ~66% in FOR public debt and equity as of 9/30/19 Master Supply Agreement (“MSA”) LAND SOURCING AND LOT SALES STRUCTURE PER TH
Slide 29: Master Supply Agreement (MSA)
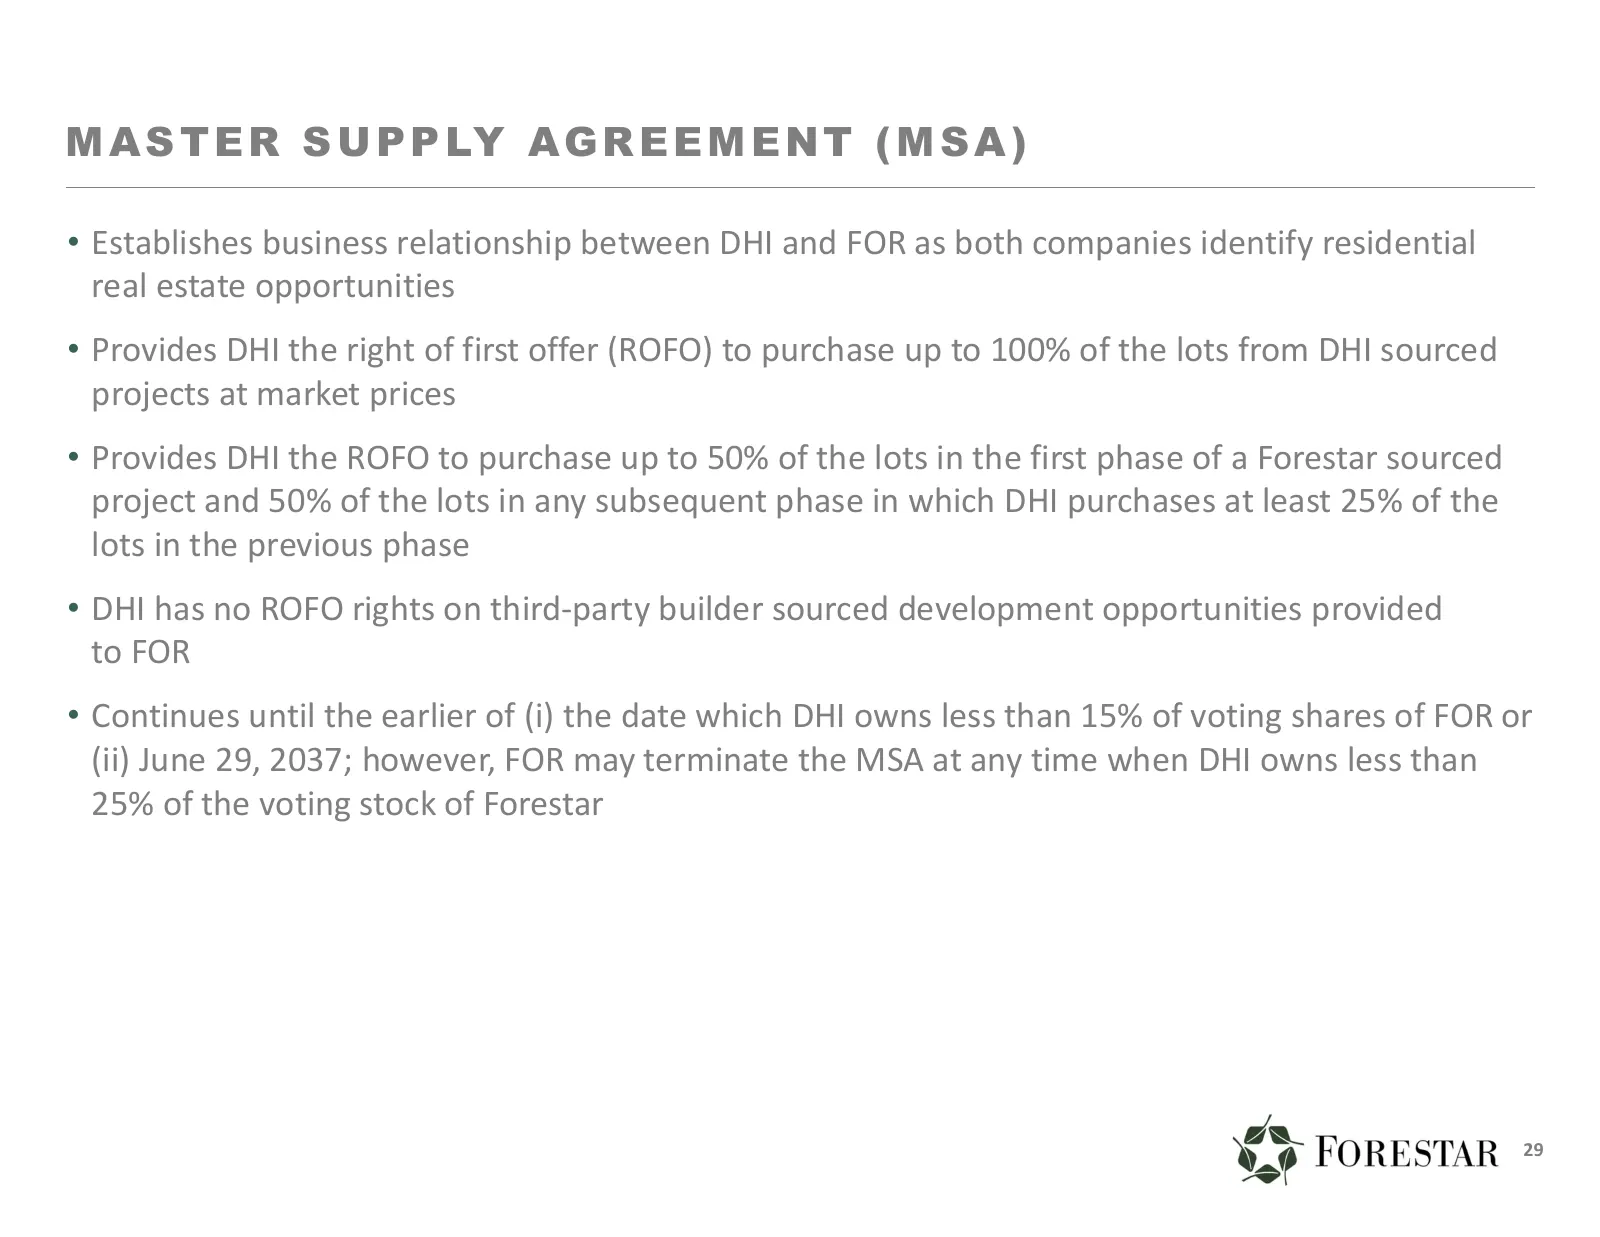
M A S T E R S U P P LY A G R E E M E N T ( M S A ) • Establishes business relationship between DHI and FOR as both companies identify residential real estate opportunities • Provides DHI the right of first offer (ROFO) to purchase up to 100% of the lots from DHI sourced projects at market prices • P
Slide 30: Stockholder's Agreement
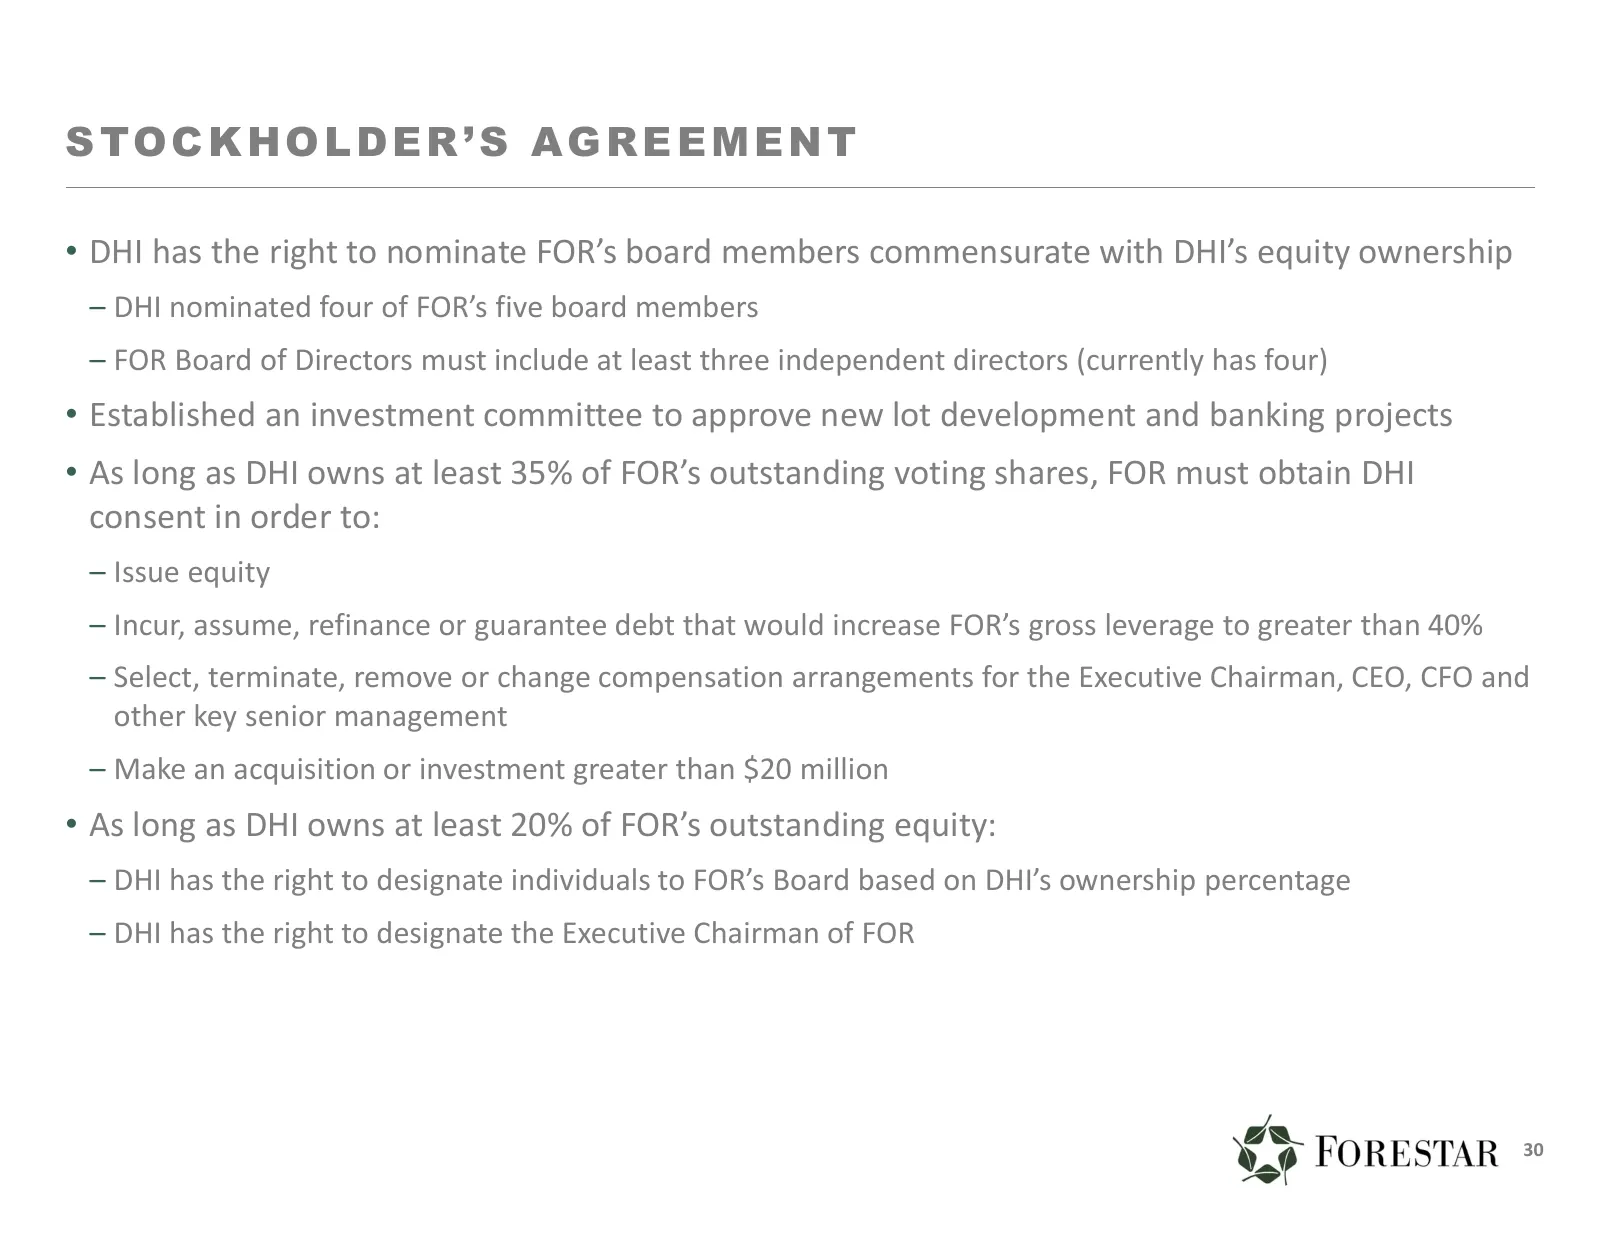
S TO C K H O L D E R ’ S A G R E E M E N T • DHI has the right to nominate FOR’s board members commensurate with DHI’s equity ownership – DHI nominated four of FOR’s five board members – FOR Board of Directors must include at least three independent directors (currently has four) • Established an in
Slide 31: Shared Services Agreement
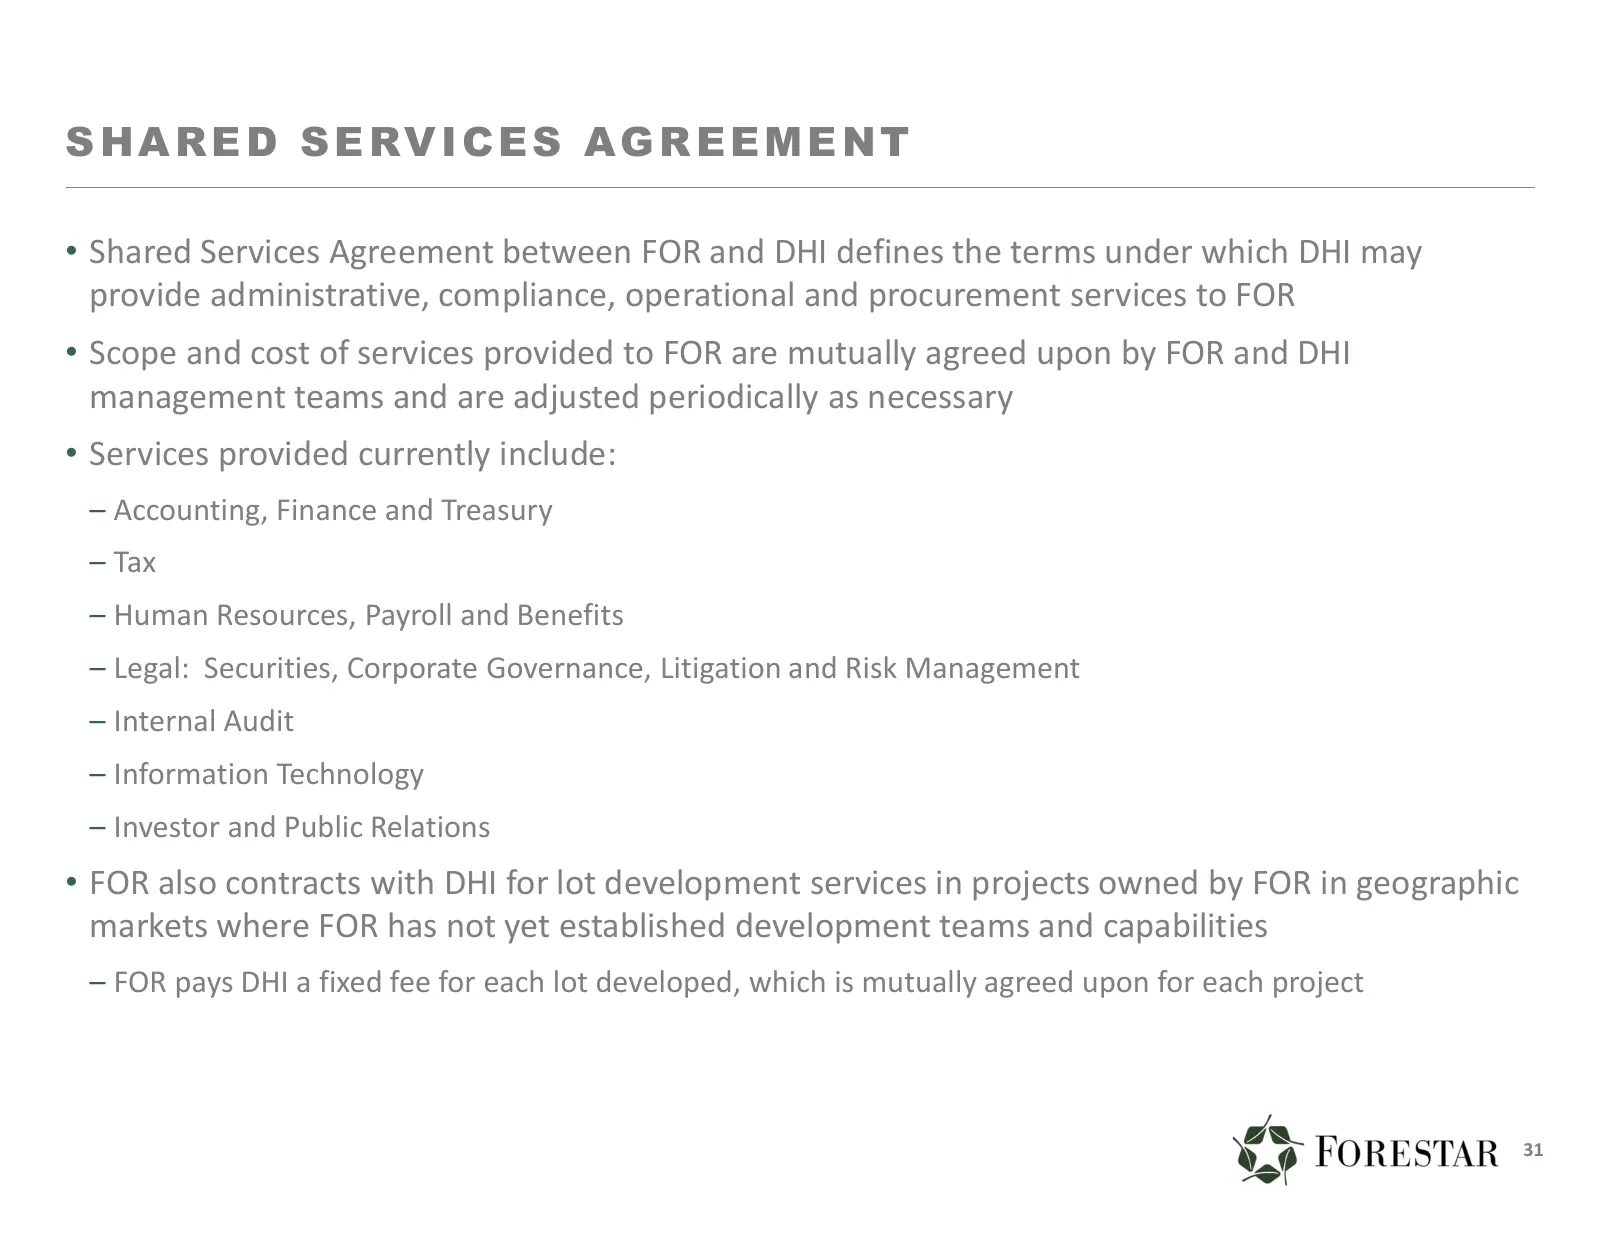
SHARED SERVICES AGREEMENT • Shared Services Agreement between FOR and DHI defines the terms under which DHI may provide administrative, compliance, operational and procurement services to FOR • Scope and cost of services provided to FOR are mutually agreed upon by FOR and DHI management teams and ar
Source: Internet Archive copy of investor.forestar.com
More decks from Forestar Group Inc
 Q4 2026 Earnings Presentation31 slides · October 2026
 Q3 2026 Earnings Presentation30 slides · Jul 21, 2026
 Q2 2026 Earnings Presentation30 slides · Apr 21, 2026
 Q1 2026 Earnings Presentation30 slides · Jan 20, 2026
 Q4 2025 Earnings Presentation31 slides · Oct 28, 2025
 Q3 2025 Earnings Presentation29 slides · Jul 22, 2025