Barratt Redrow plc · LSE:BTRW
Barratt Redrow — Barratt Developments — FY2010 Earnings Presentation
61 slides from Barratt Redrow's earnings presentation, Sep 8, 2010
Slide 1: Results presentation for the year ended 30 June 2010
Full Year 2010 Results presentation for the year ended 30 June 2010 8 September 2010 1
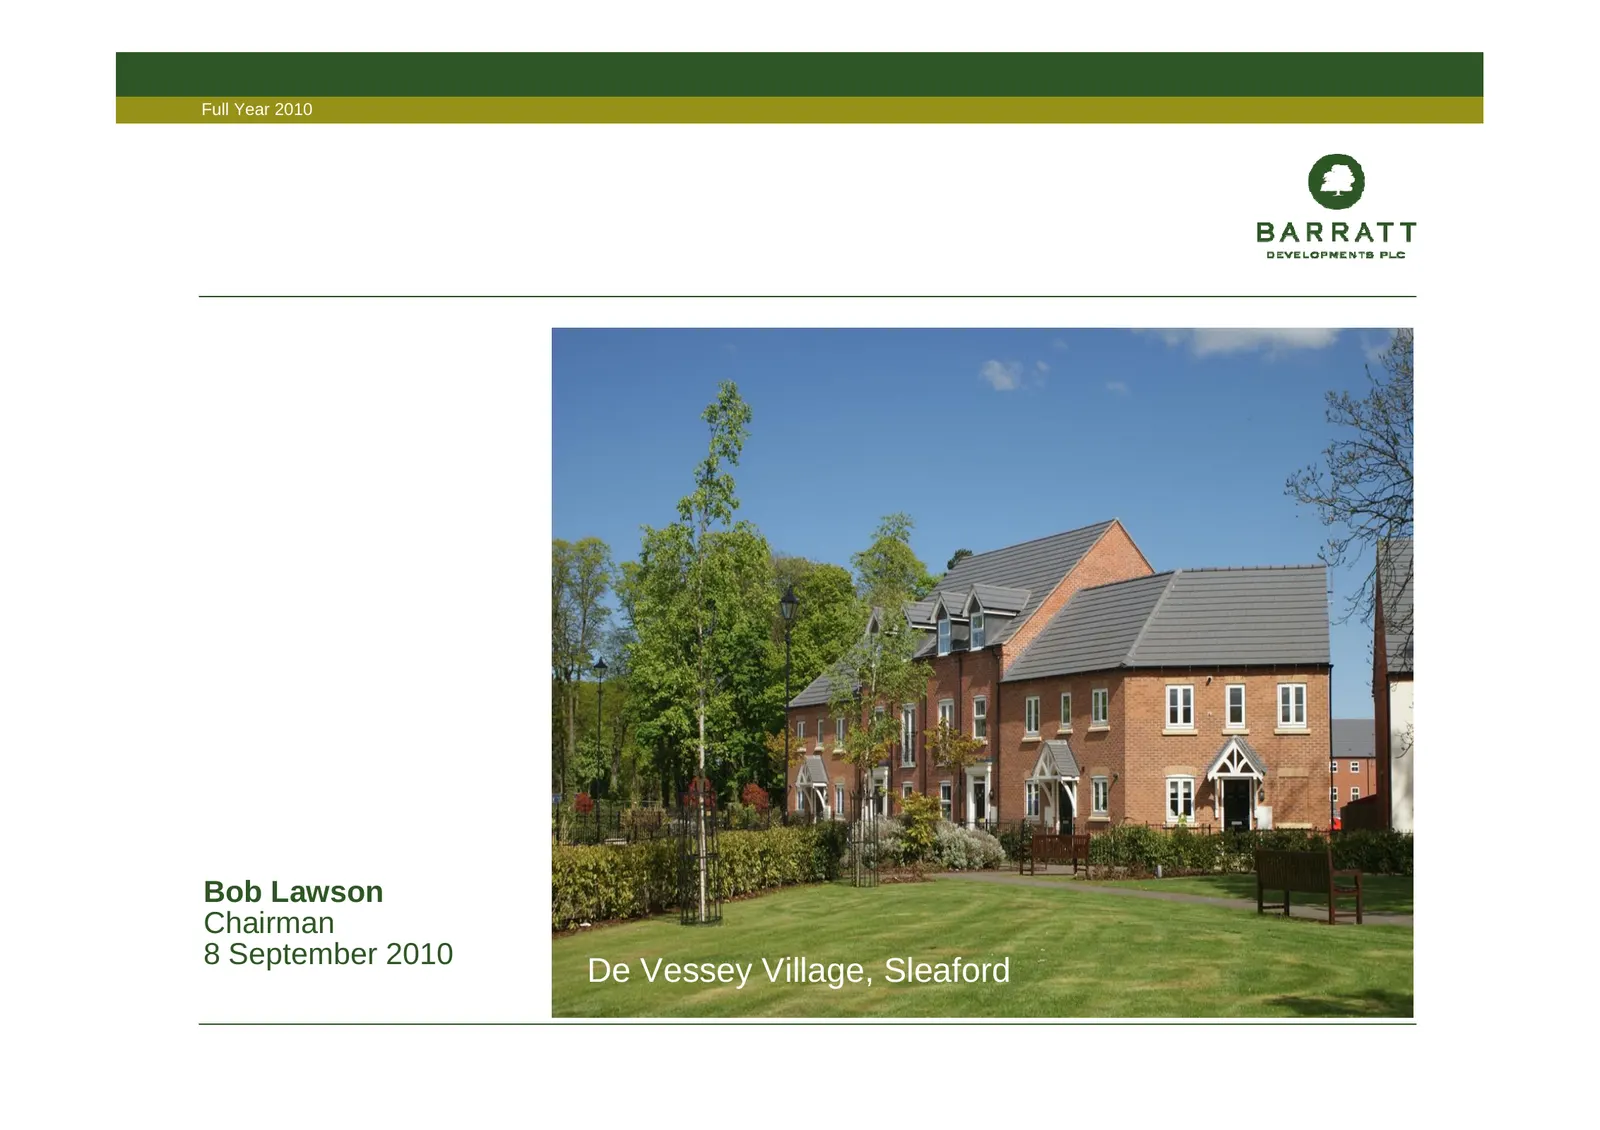
Slide 2: Bob Lawson, Chairman
Full Year 2010 Bob Lawson Chairman 8 September 2010 De Vessey Village, Sleaford 1
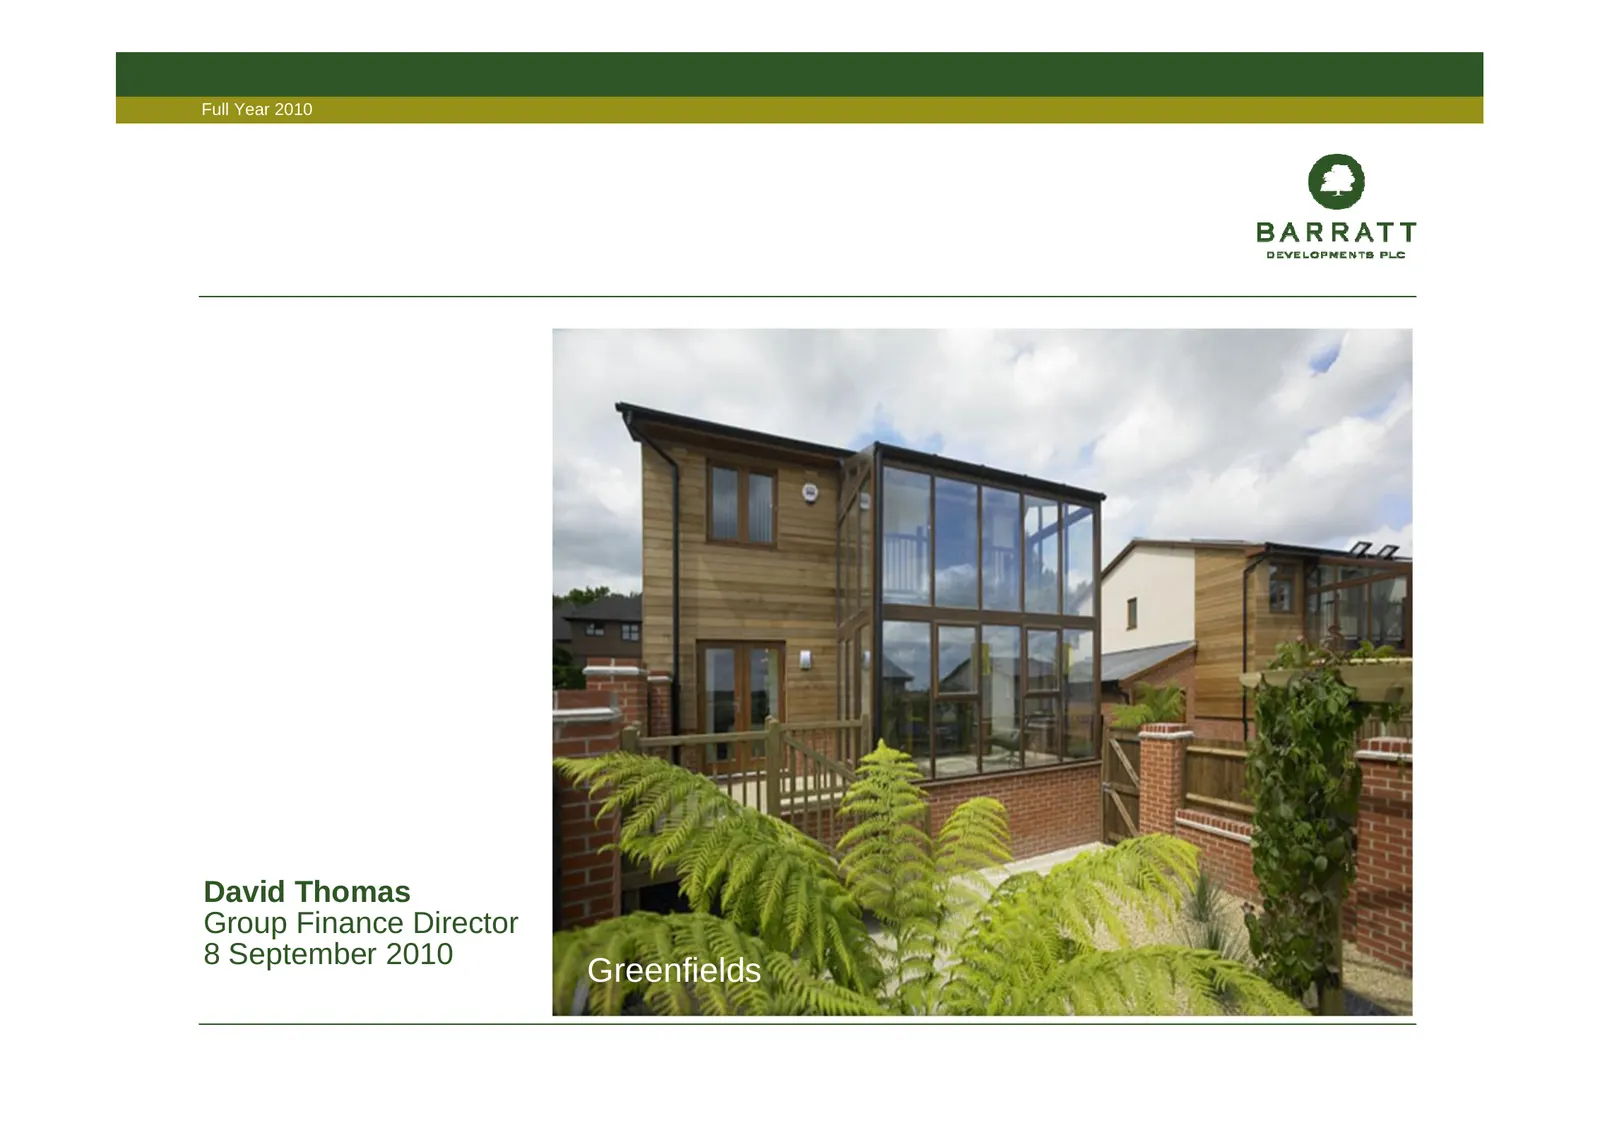
Slide 3: David Thomas, Group Finance Director
Full Year 2010 David Thomas Group Finance Director 8 September 2010 Greenfields 1
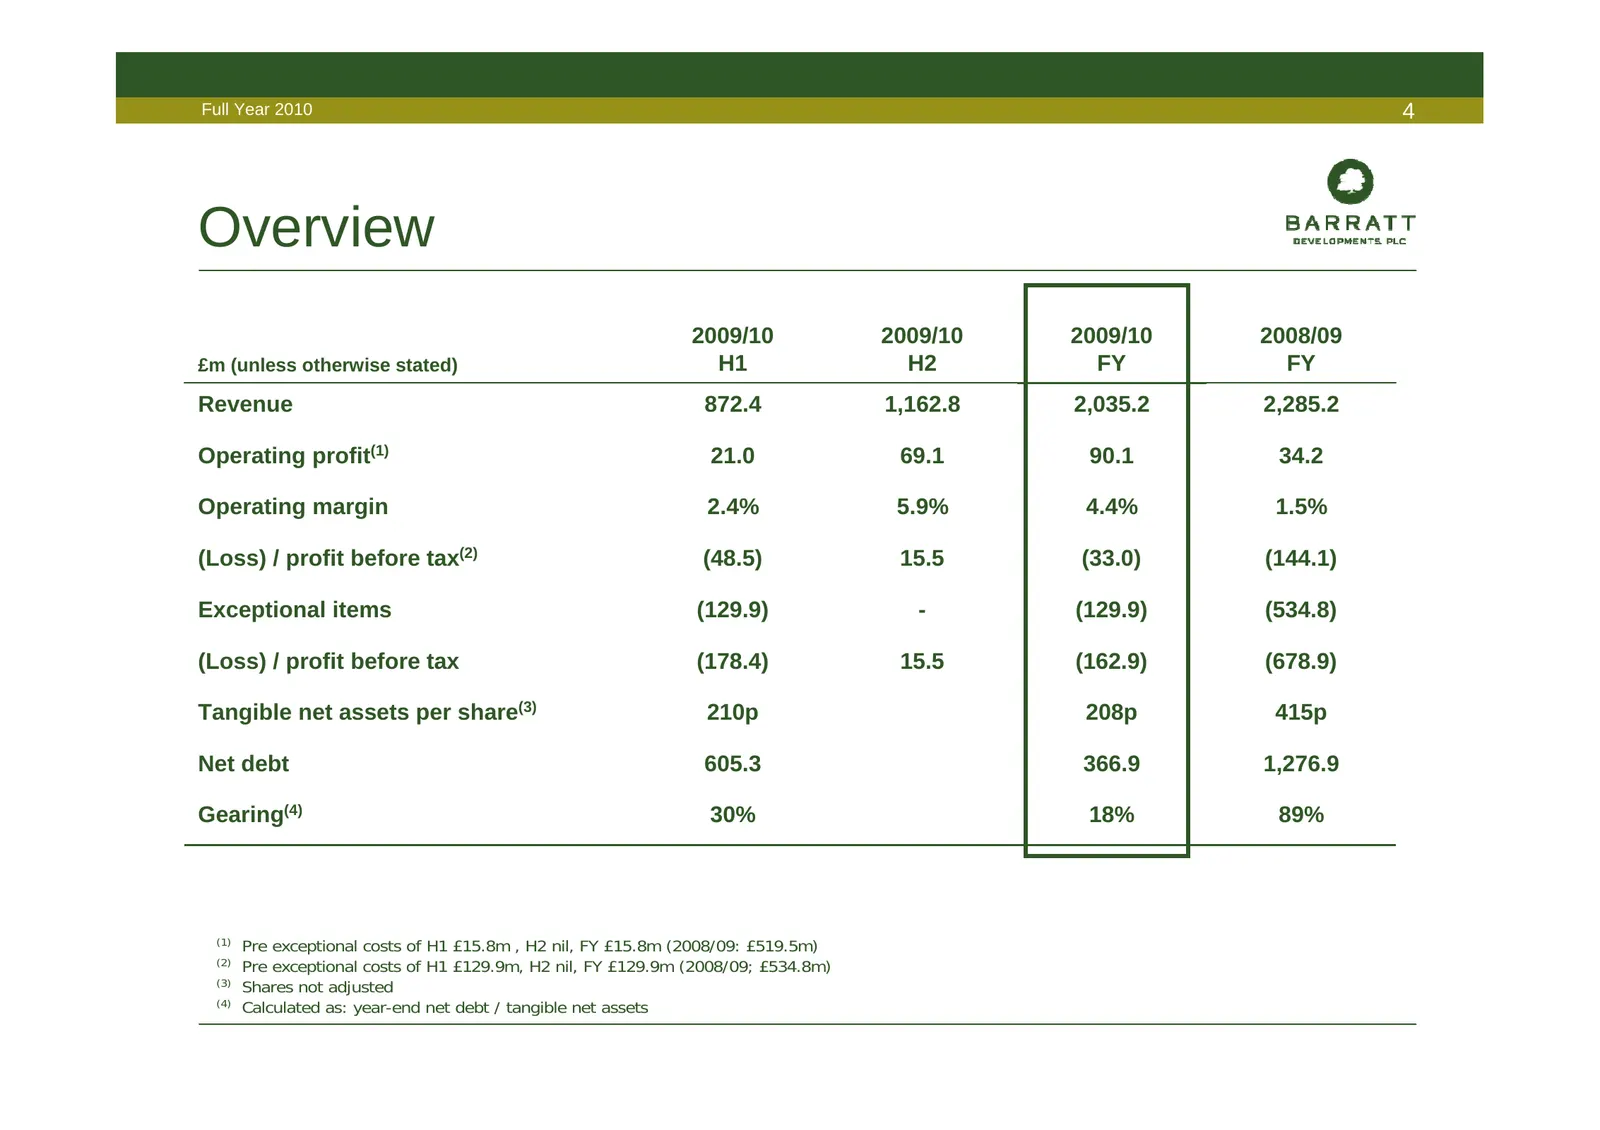
Slide 4: Overview
Full Year 2010 4 Overview 2009/10 2009/10 2009/10 2008/09 £m (unless otherwise stated) H1 H2 FY FY Revenue 872.4 1,162.8 2,035.2 2,285.2 Operating profit(1) 21.0 69.1 90.1 34.2 Operating margin 2.4% 5.9% 4.4% 1.5% (Loss) / profit before tax(2) (48.5) 15.5 (33.0) (144.1) Exceptional items (129.9) - (
Slide 5: Revenue drivers
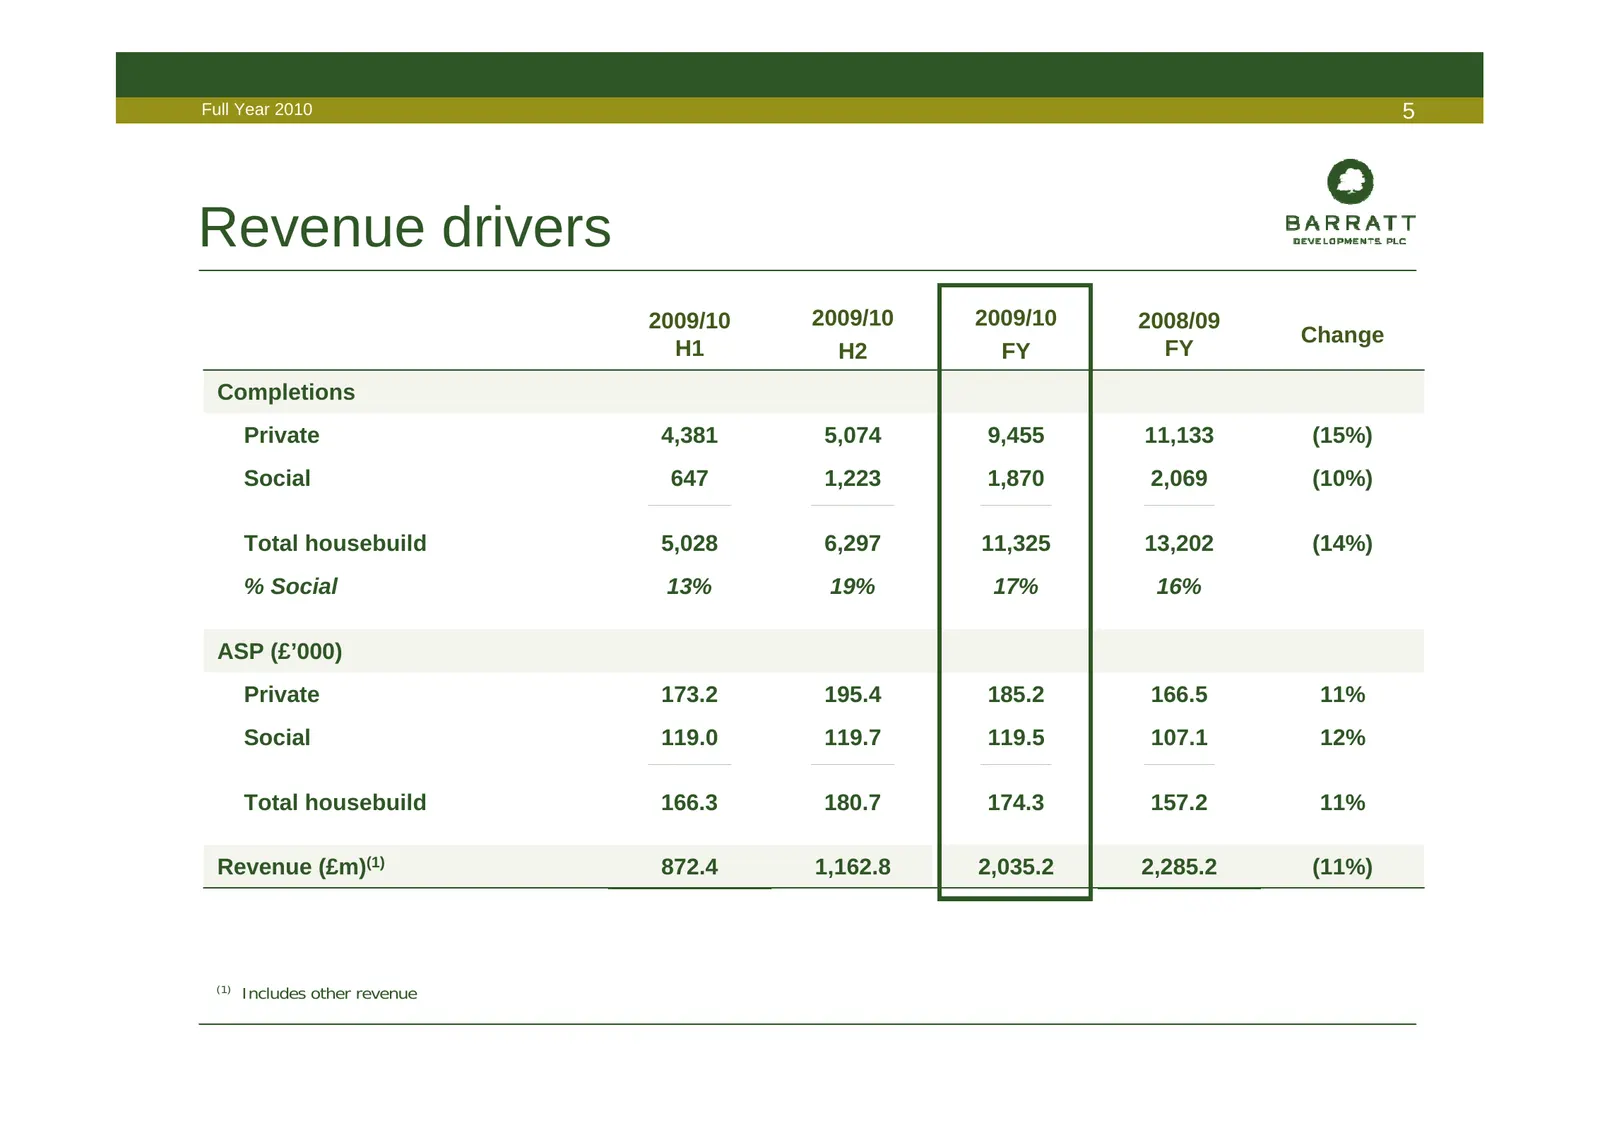
Full Year 2010 5 Revenue drivers 2009/10 2009/10 2009/10 2008/09 Change H1 H2 FY FY Completions Private 4,381 5,074 9,455 11,133 (15%) Social 647 1,223 1,870 2,069 (10%) ___________________________ ___________________________ _______________________ _______________________ Total housebuild 5,028 6,2
Slide 6: Completions: houses v flats
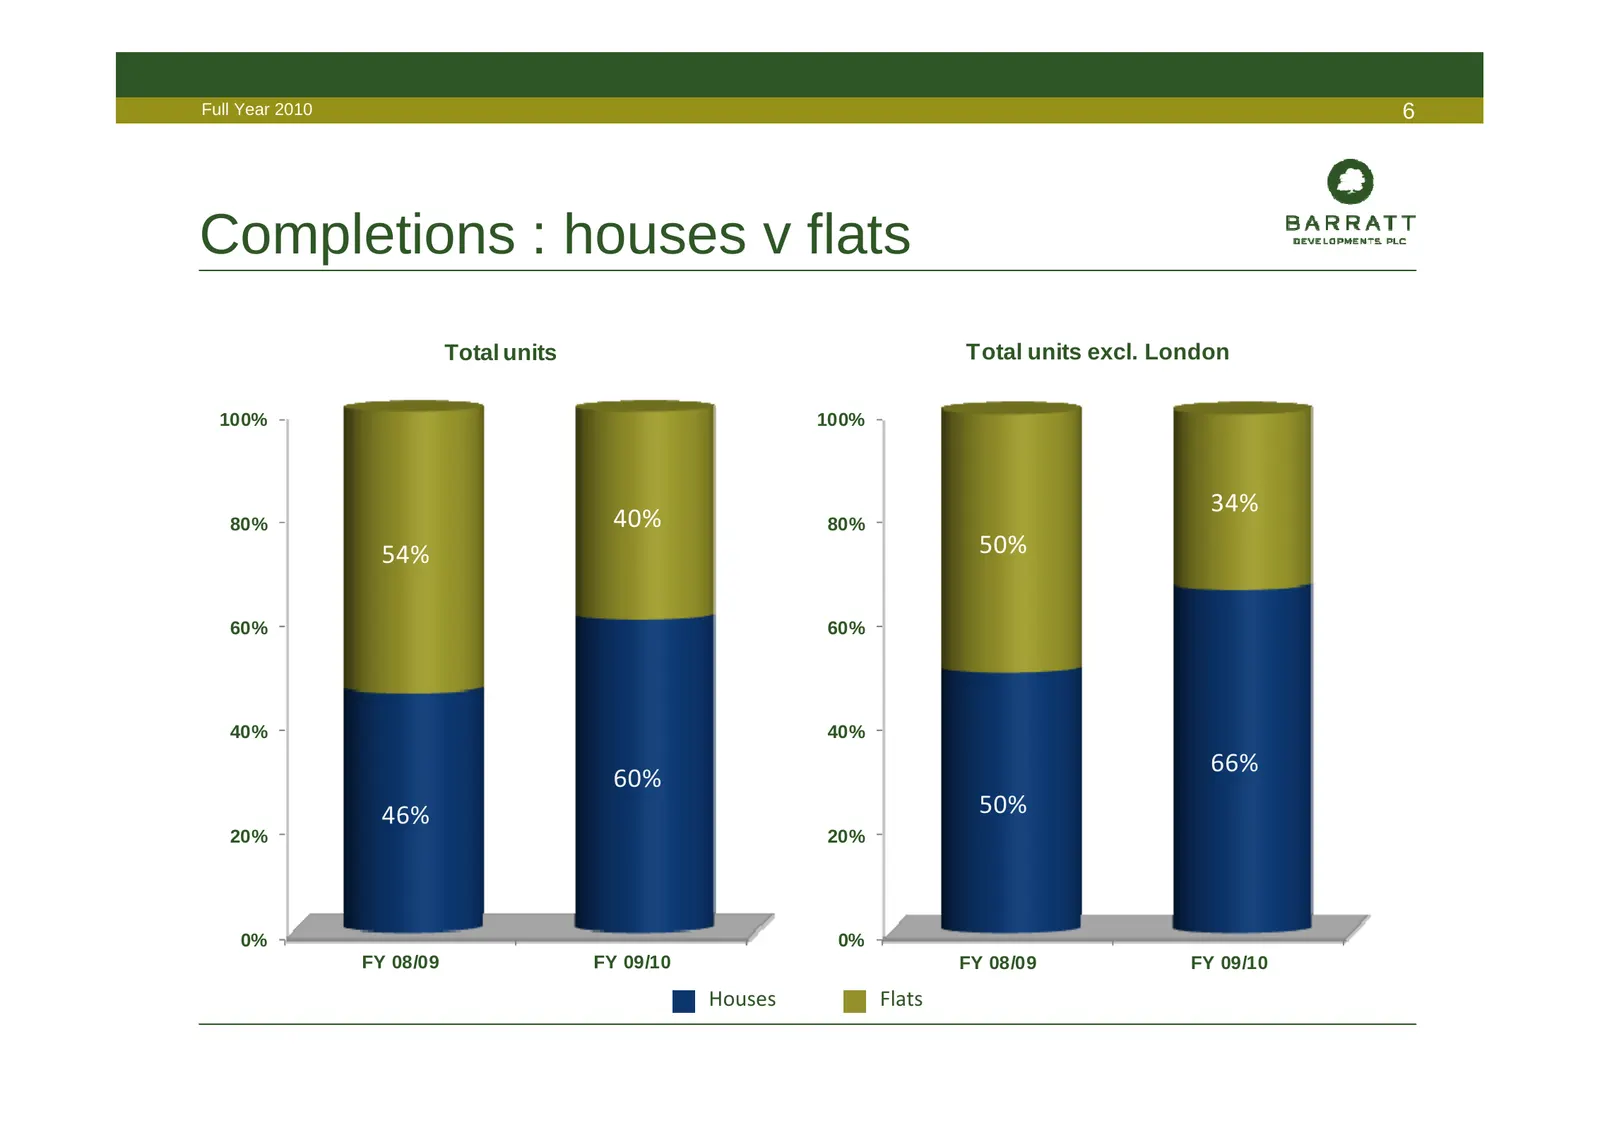
Full Year 2010 6 Completions : houses v flats Total units Total units excl. London 100% 100% 34% 80% 40% 80% 54% 50% 60% 60% 40% 40% 66% 60% 46% 50% 20% 20% 0% 0% FY 08/09 FY 09/10 FY 08/09 FY 09/10 Houses Flats
Slide 7: Revenue analysis - product mix
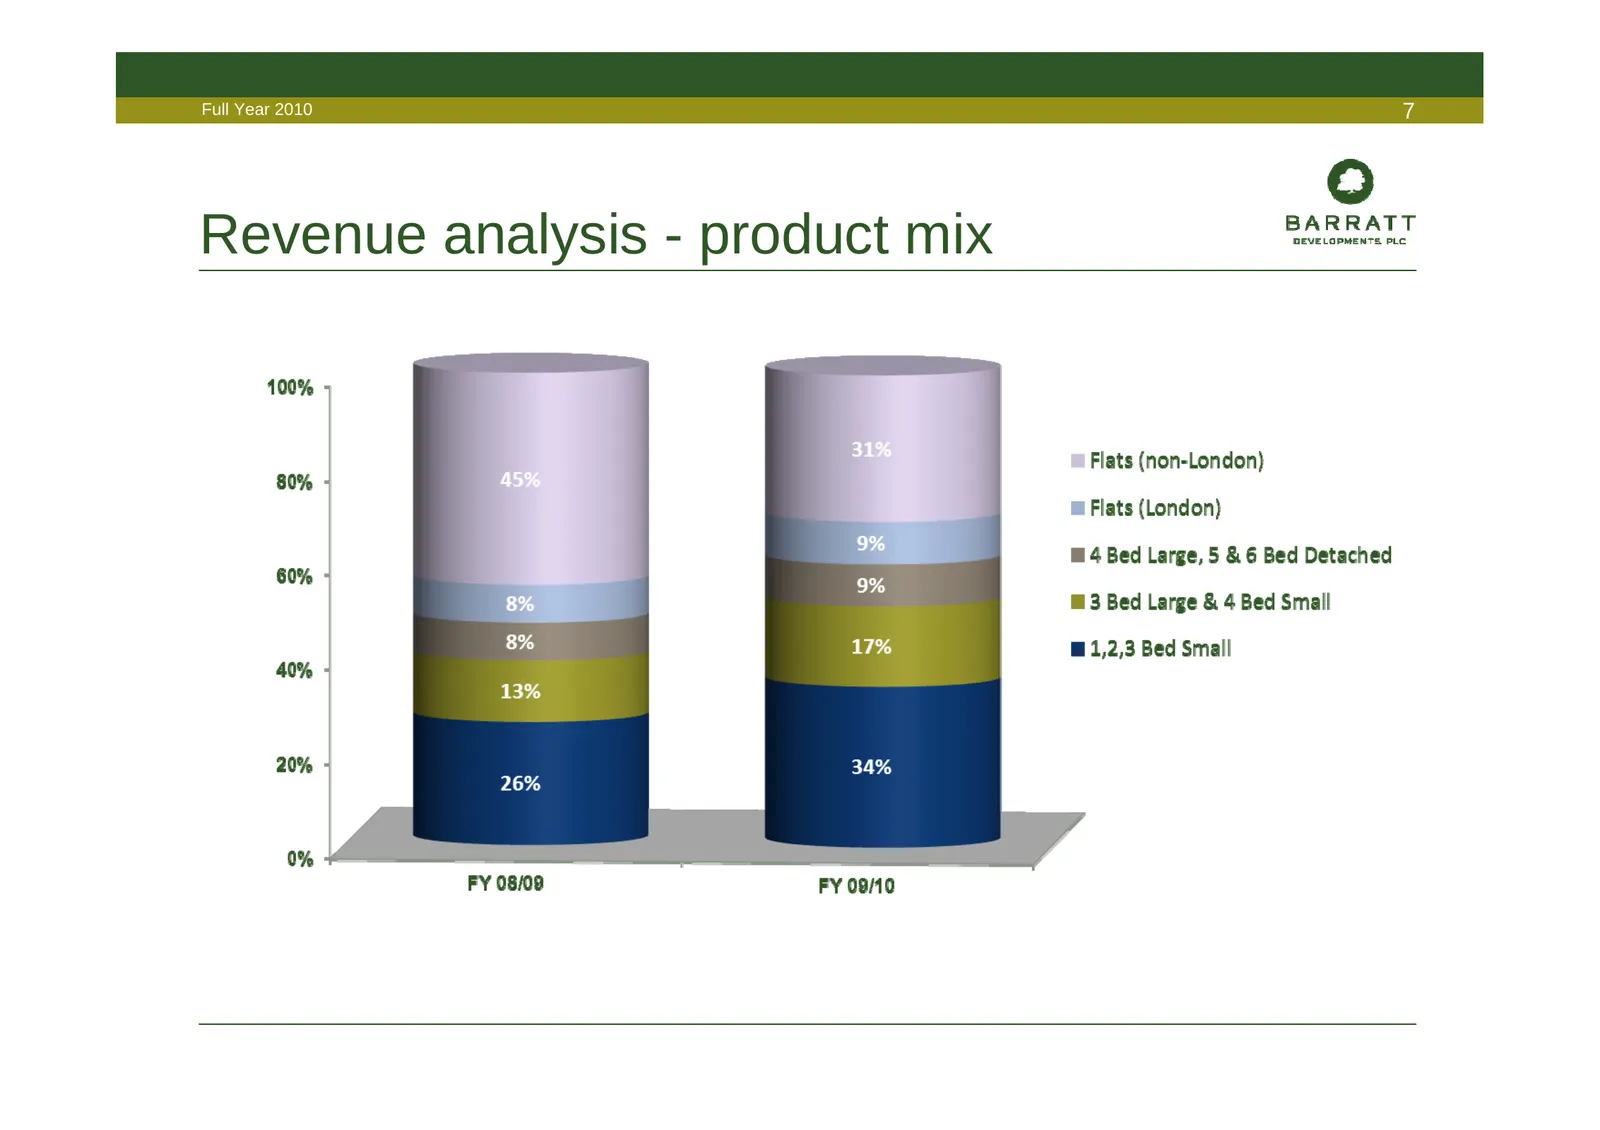
Full Year 2010 7 Revenue analysis - product mix
Slide 8: Private revenue analysis – price segments
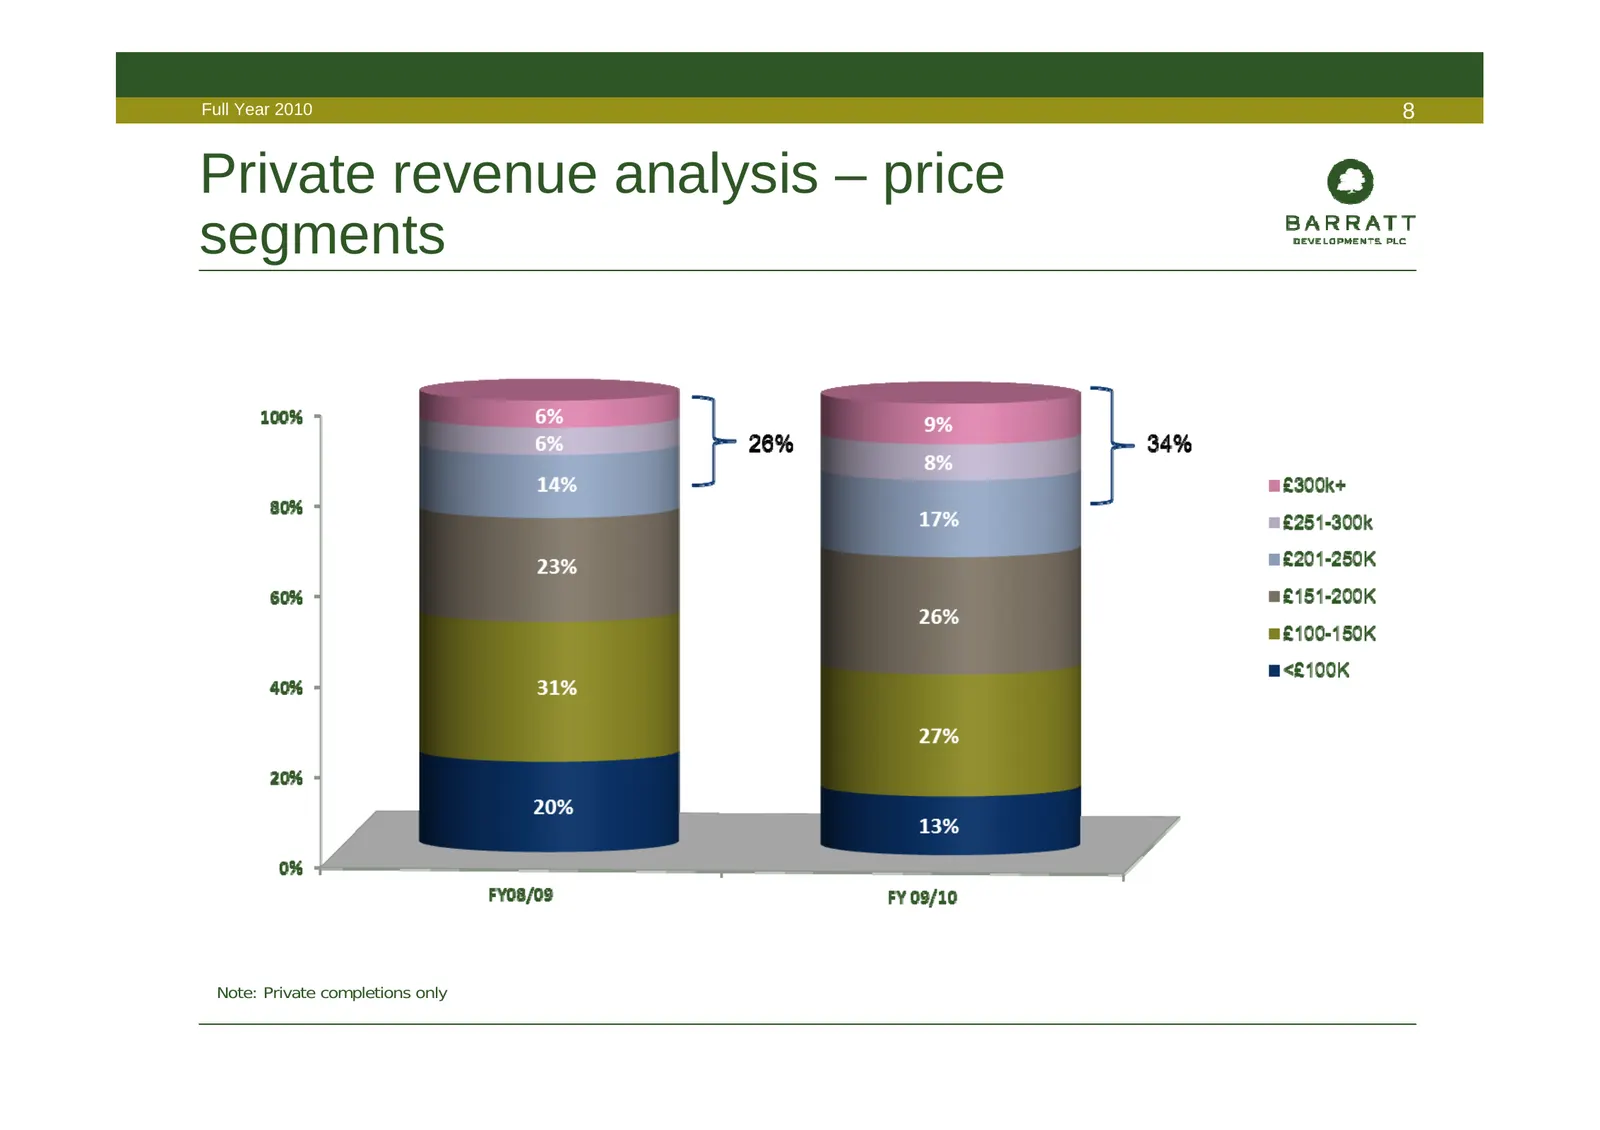
Full Year 2010 8 Private revenue analysis – price segments Note: Private completions only
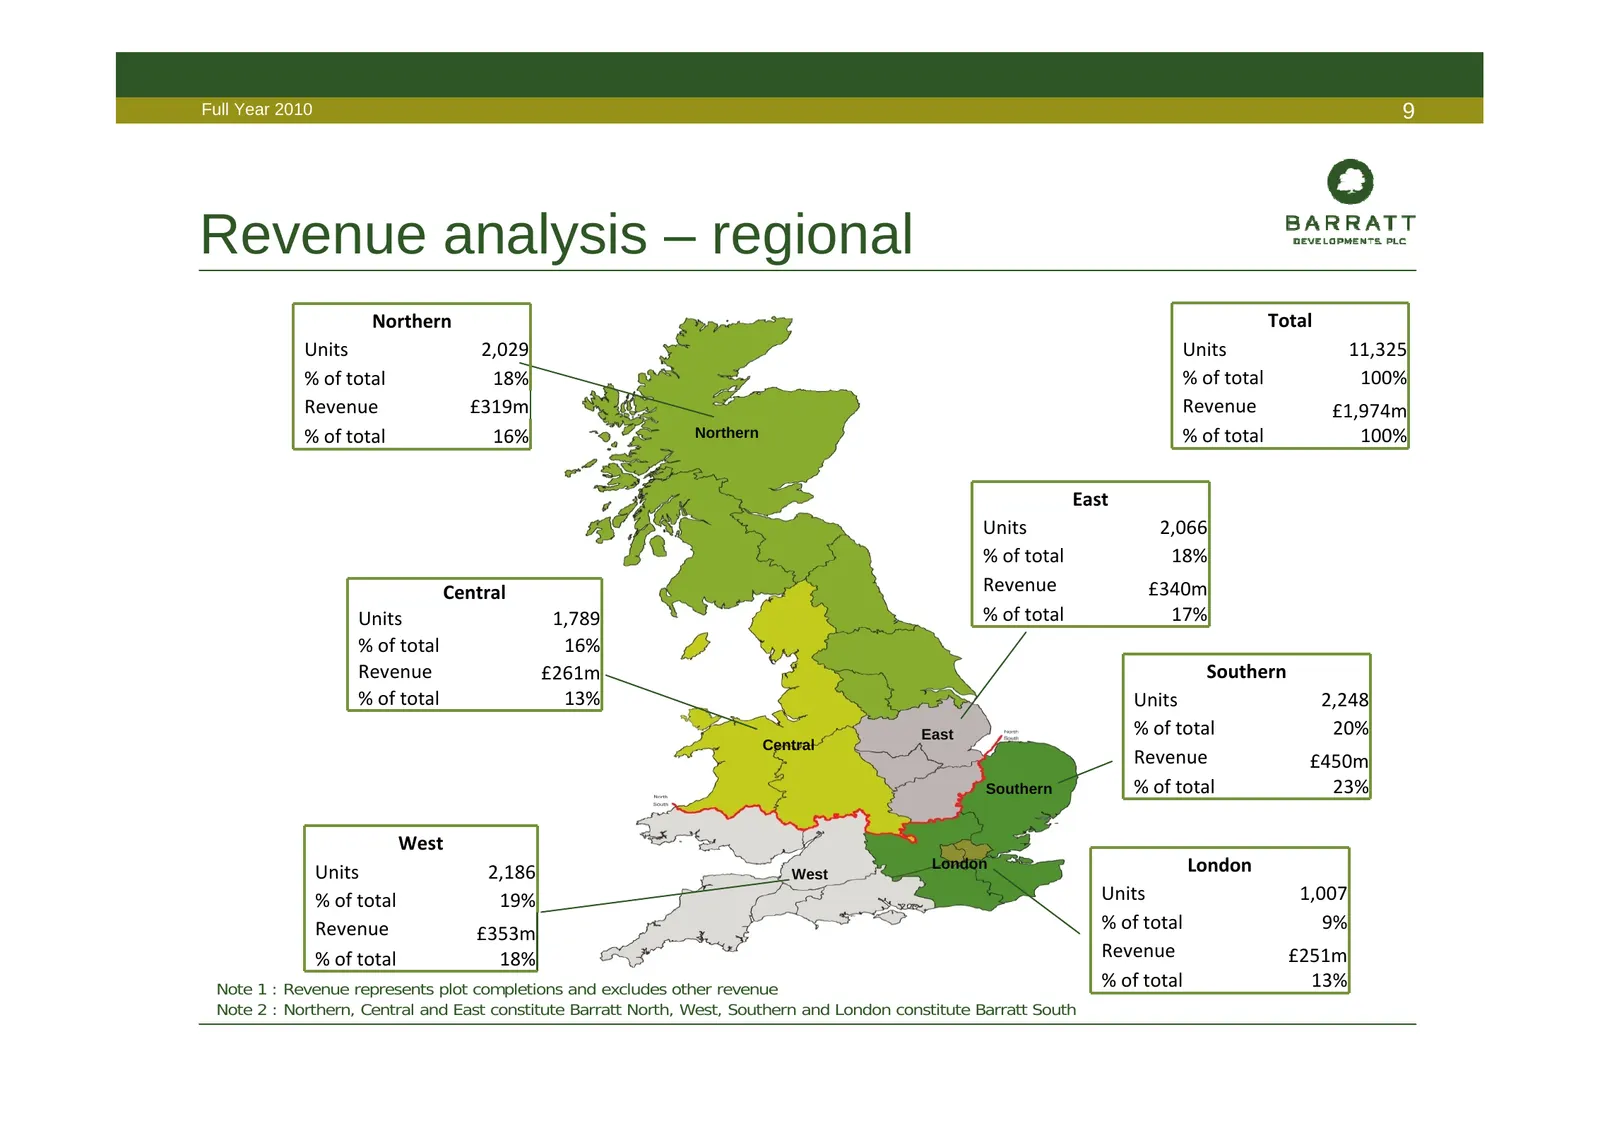
Slide 9: Revenue analysis – regional
Full Year 2010 9 Revenue analysis – regional Northern Total Units 2,029 Units 11,325 % of total 18% % of total 100% Revenue £319m Revenue £1,974m % of total 16% Northern % of total 100% East Units 2,066 % of total 18% Central Revenue £340m Units 1,789 % of total 17% % of total 16% Revenue £261m Sout
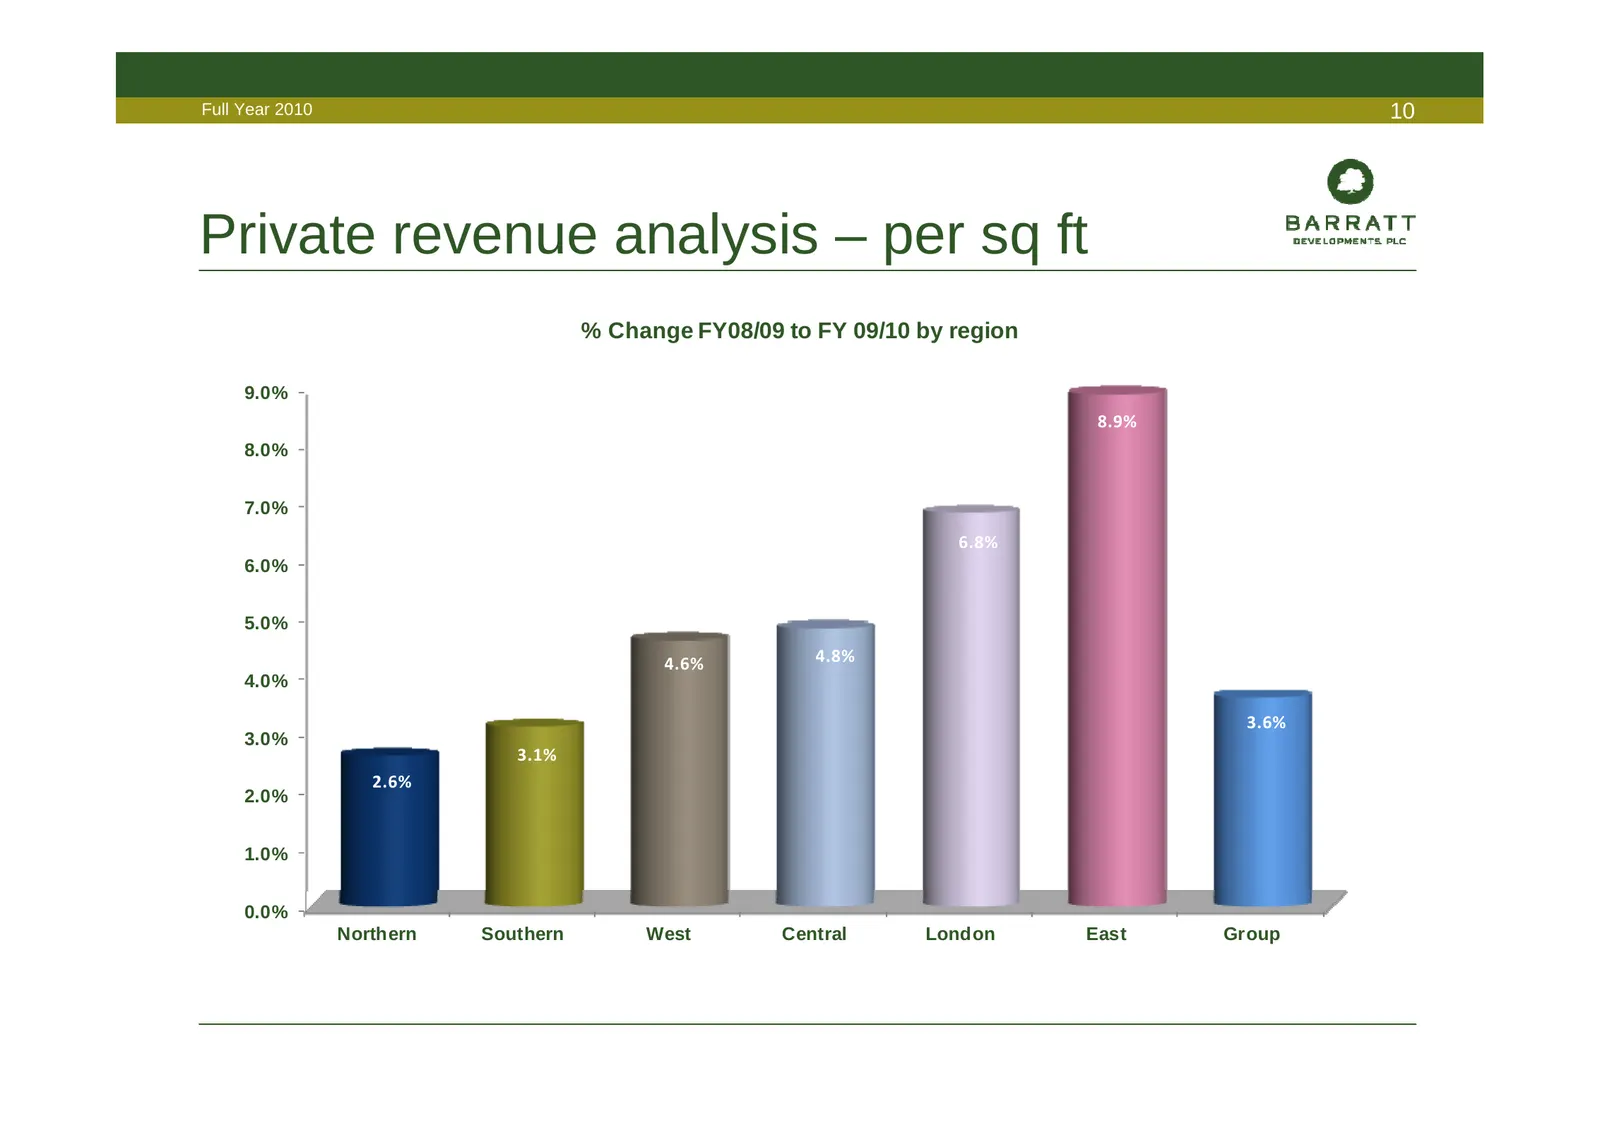
Slide 10: Private revenue analysis – per sq ft
Full Year 2010 10 Private revenue analysis – per sq ft % Change FY08/09 to FY 09/10 by region 9.0% 8.9% 8.0% 7.0% 6.8% 6.0% 5.0% 4.6% 4.8% 4.0% 3.6% 3.0% 3.1% 2.6% 2.0% 1.0% 0.0% Northern Southern West Central London East Group
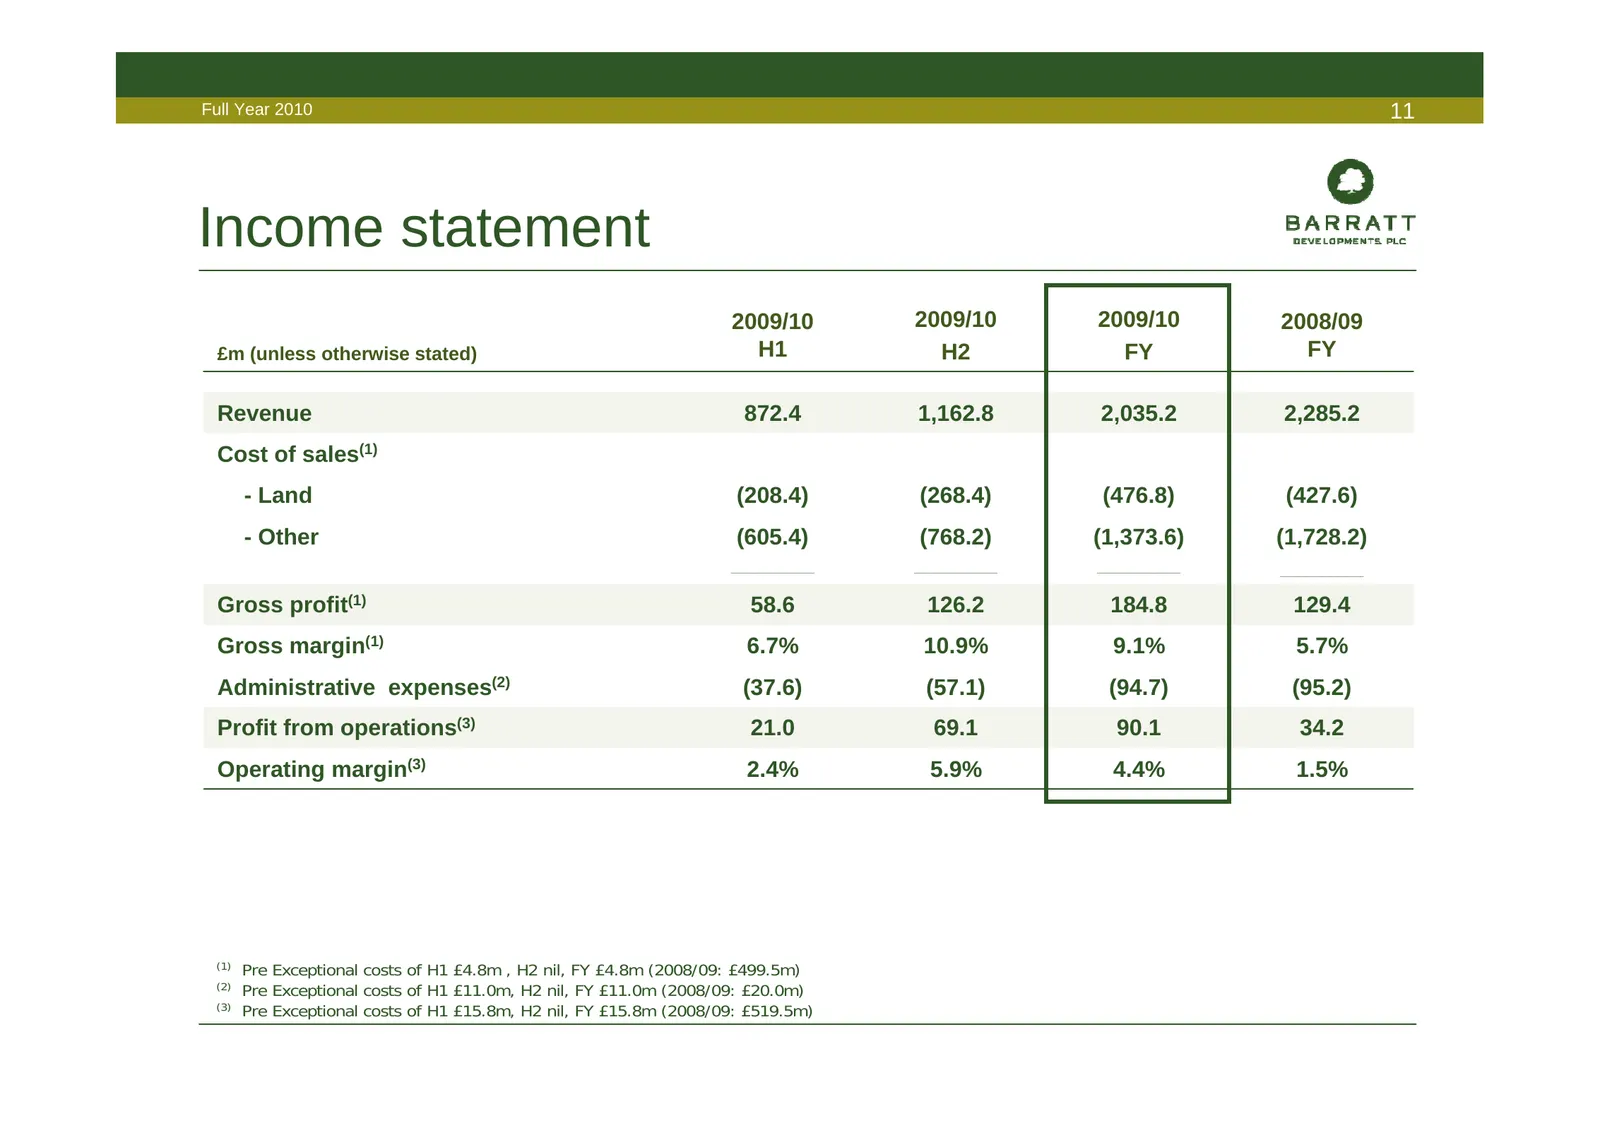
Slide 11: Income statement
Full Year 2010 11 Income statement 2009/10 2009/10 2009/10 2008/09 £m (unless otherwise stated) H1 H2 FY FY Revenue 872.4 1,162.8 2,035.2 2,285.2 Cost of sales(1) - Land (208.4) (268.4) (476.8) (427.6) - Other (605.4) (768.2) (1,373.6) (1,728.2) ___________________________ __________________________
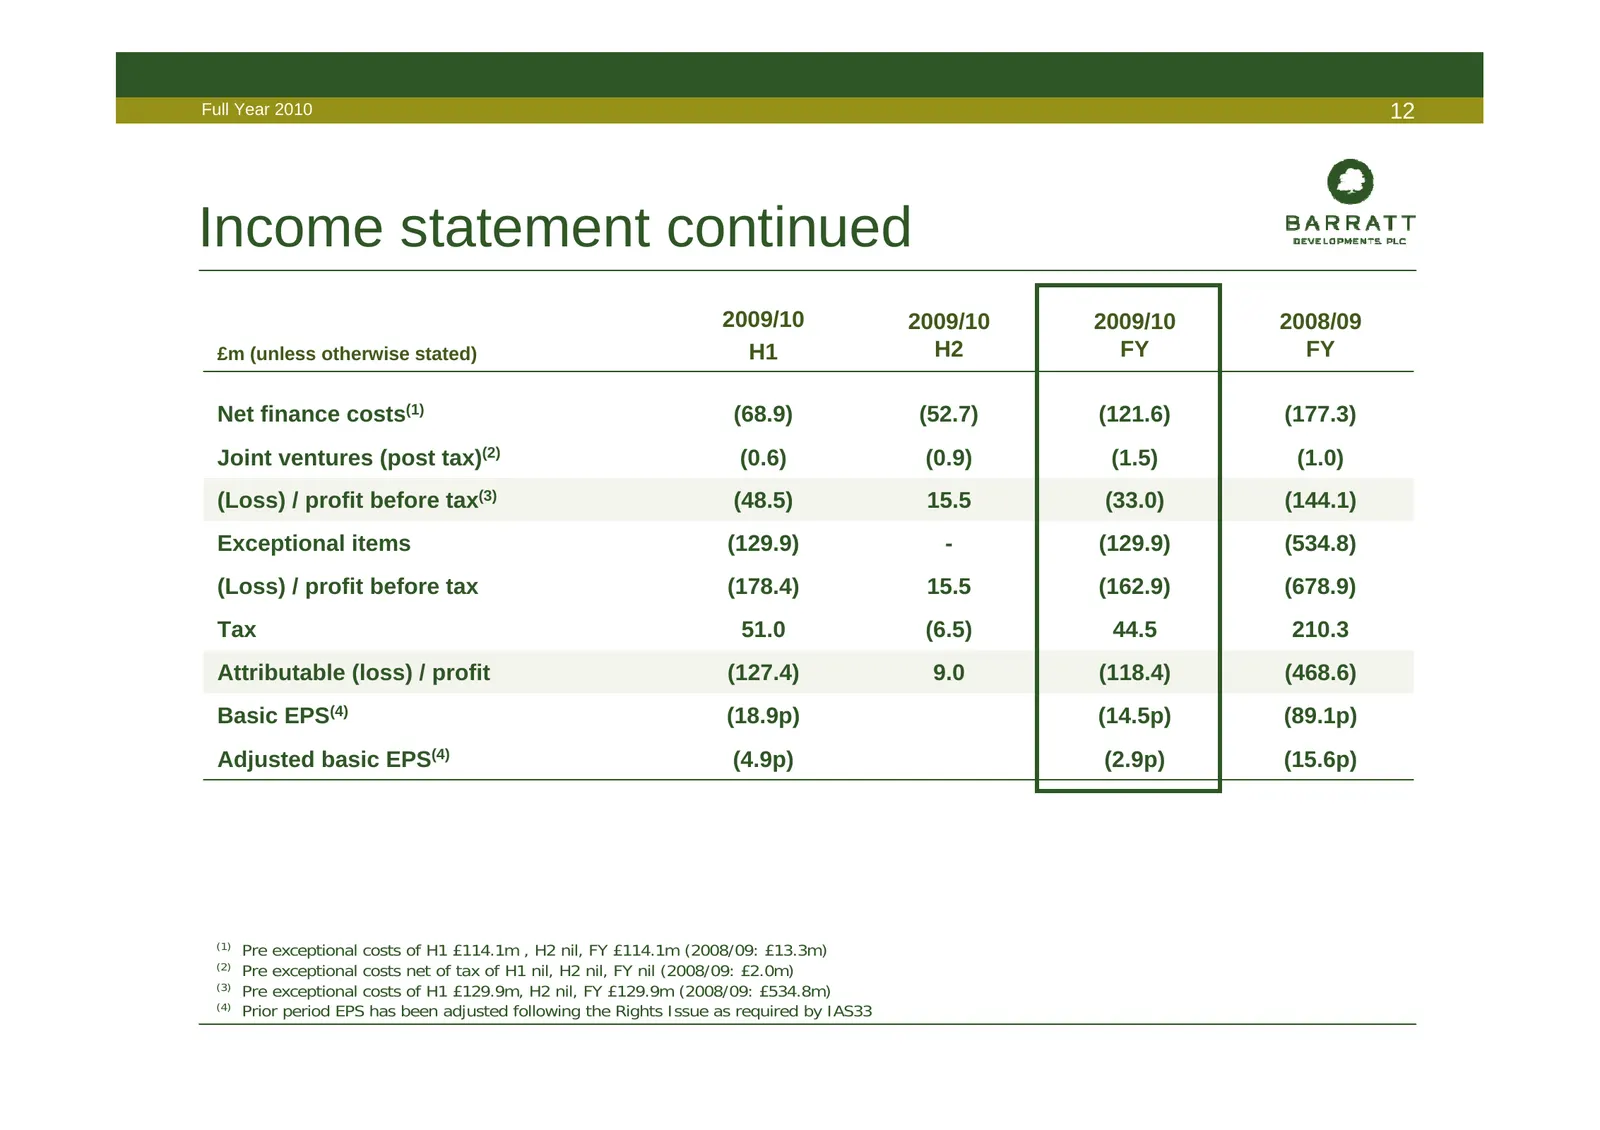
Slide 12: Income statement continued
Full Year 2010 12 Income statement continued 2009/10 2009/10 2009/10 2008/09 £m (unless otherwise stated) H1 H2 FY FY Net finance costs(1) (68.9) (52.7) (121.6) (177.3) Joint ventures (post tax)(2) (0.6) (0.9) (1.5) (1.0) (Loss) / profit before tax(3) (48.5) 15.5 (33.0) (144.1) Exceptional items (12
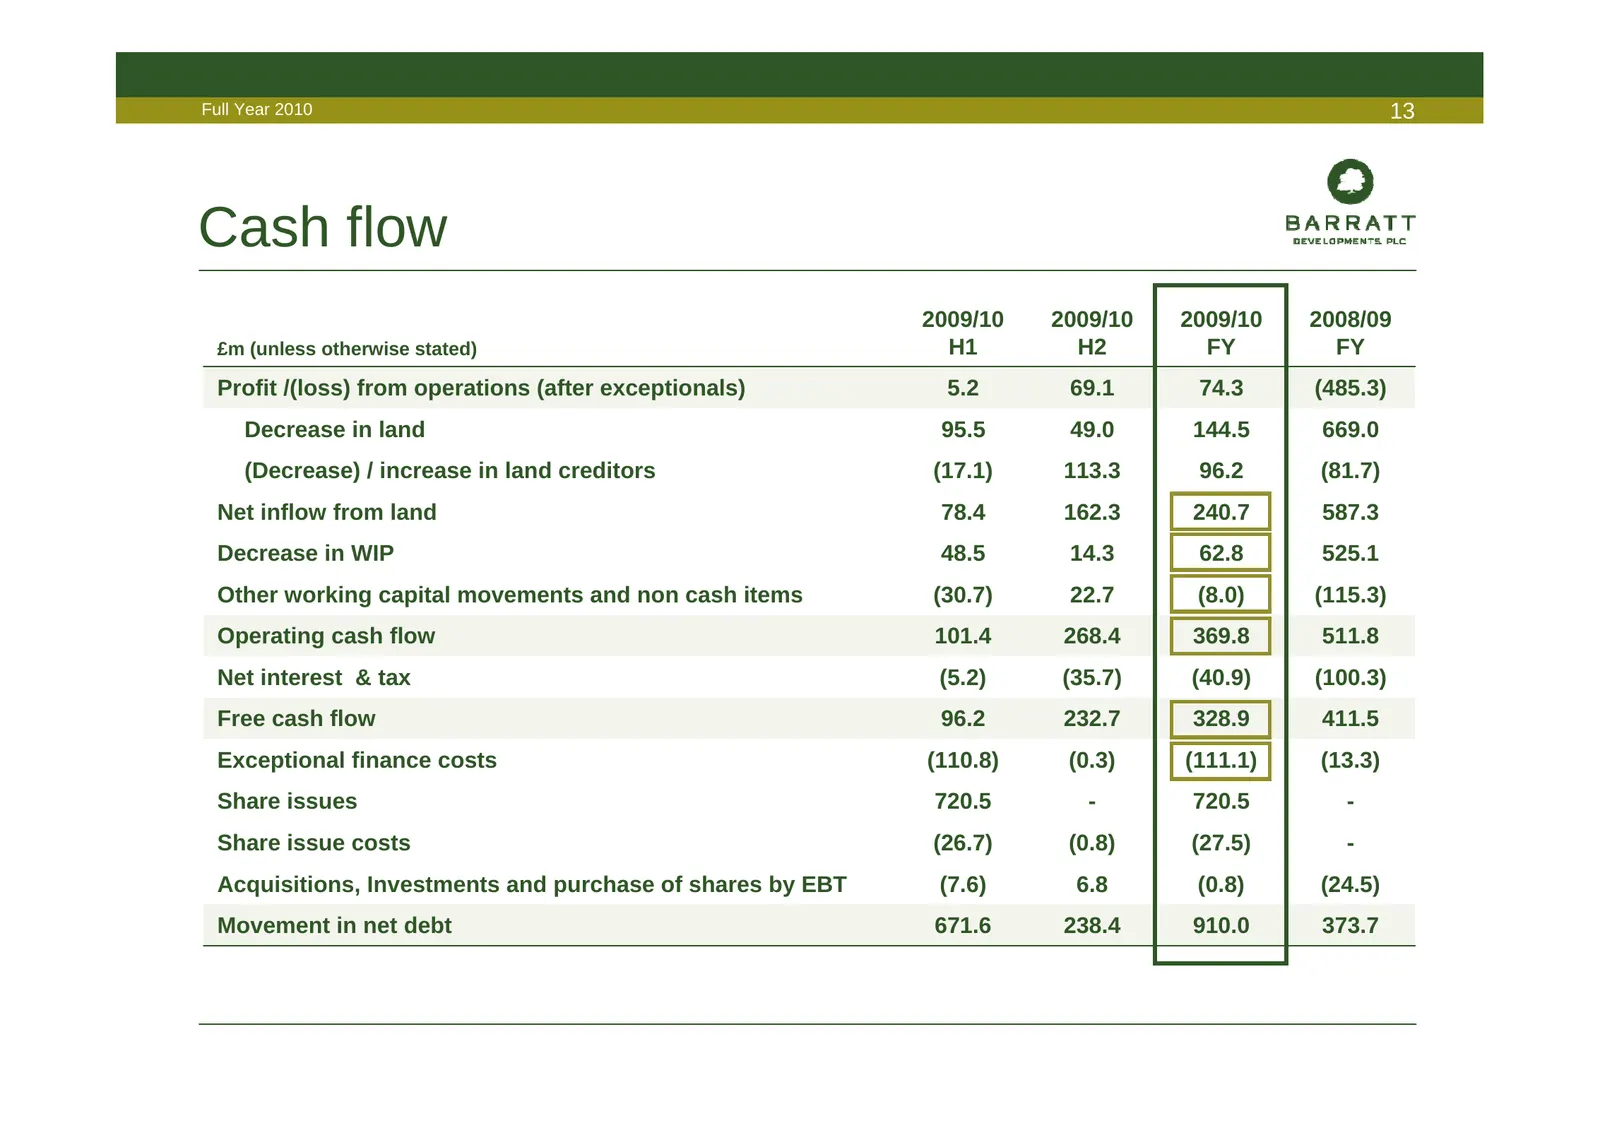
Slide 13: Cash flow
Full Year 2010 13 Cash flow 2009/10 2009/10 2009/10 2008/09 £m (unless otherwise stated) H1 H2 FY FY Profit /(loss) from operations (after exceptionals) 5.2 69.1 74.3 (485.3) Decrease in land 95.5 49.0 144.5 669.0 (Decrease) / increase in land creditors (17.1) 113.3 96.2 (81.7) Net inflow from land
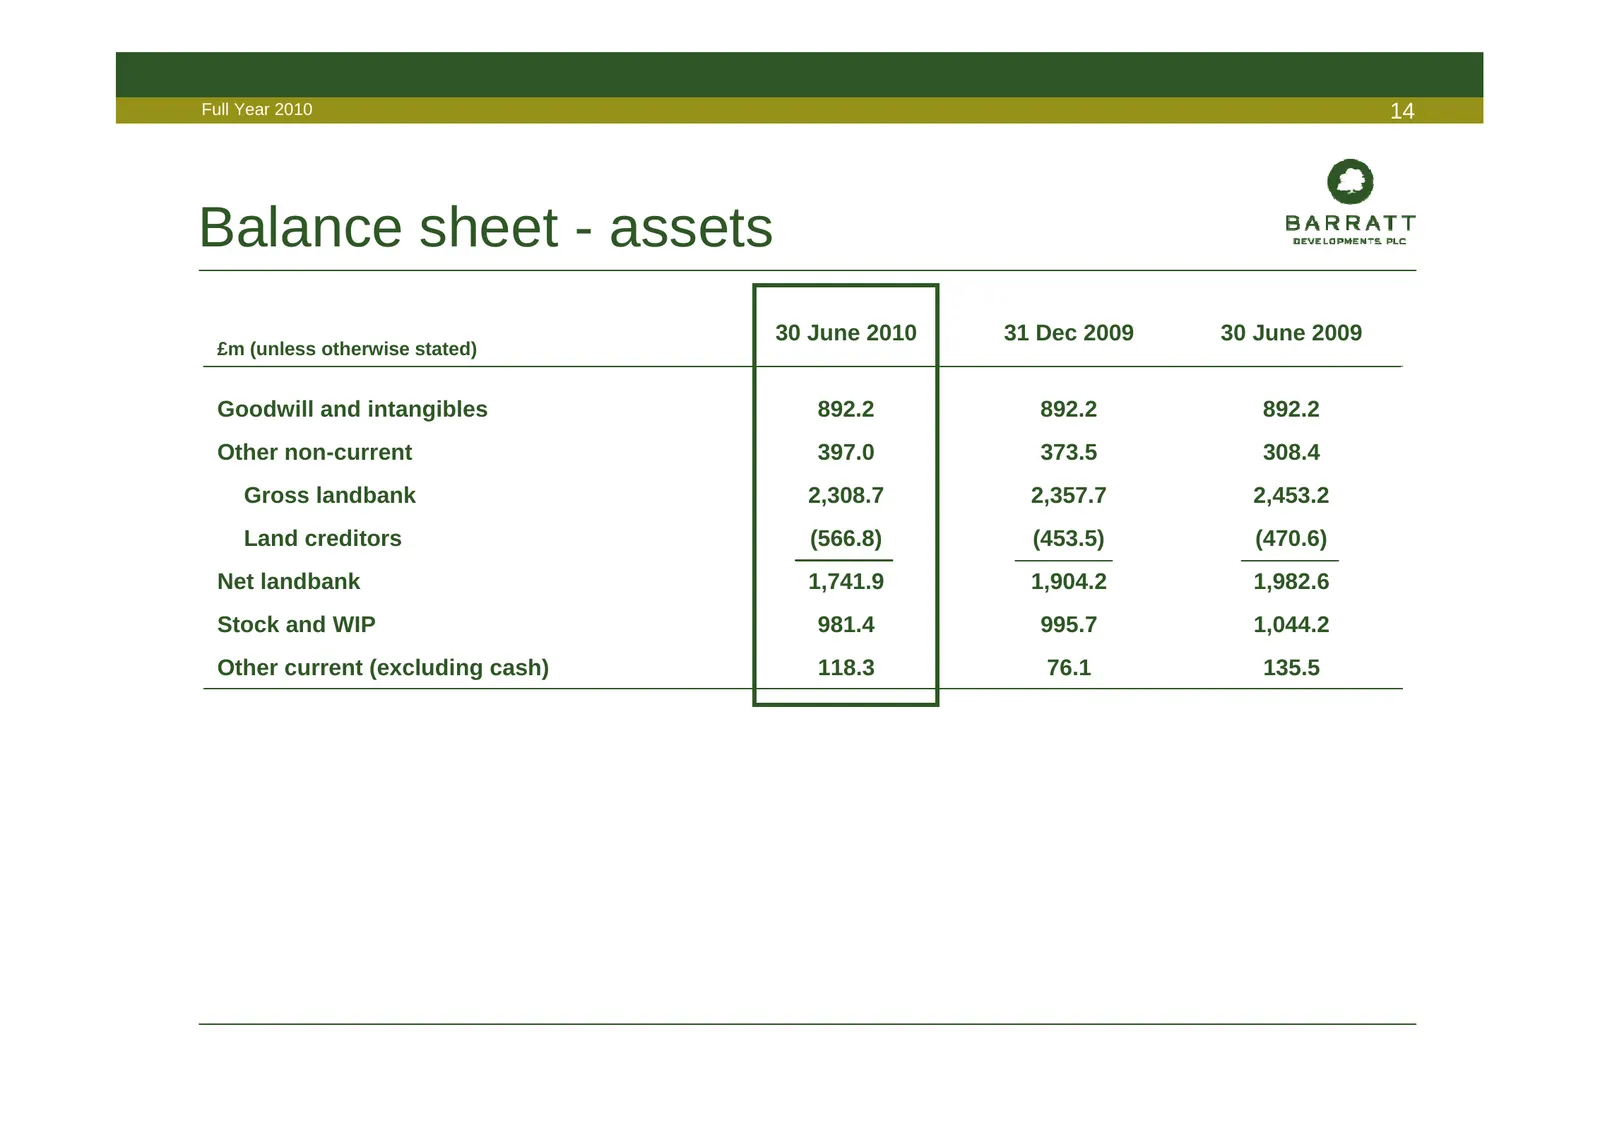
Slide 14: Balance sheet - assets
Full Year 2010 14 Balance sheet - assets 30 June 2010 31 Dec 2009 30 June 2009 £m (unless otherwise stated) Goodwill and intangibles 892.2 892.2 892.2 Other non-current 397.0 373.5 308.4 Gross landbank 2,308.7 2,357.7 2,453.2 Land creditors (566.8) (453.5) (470.6) Net landbank 1,741.9 1,904.2 1,982.
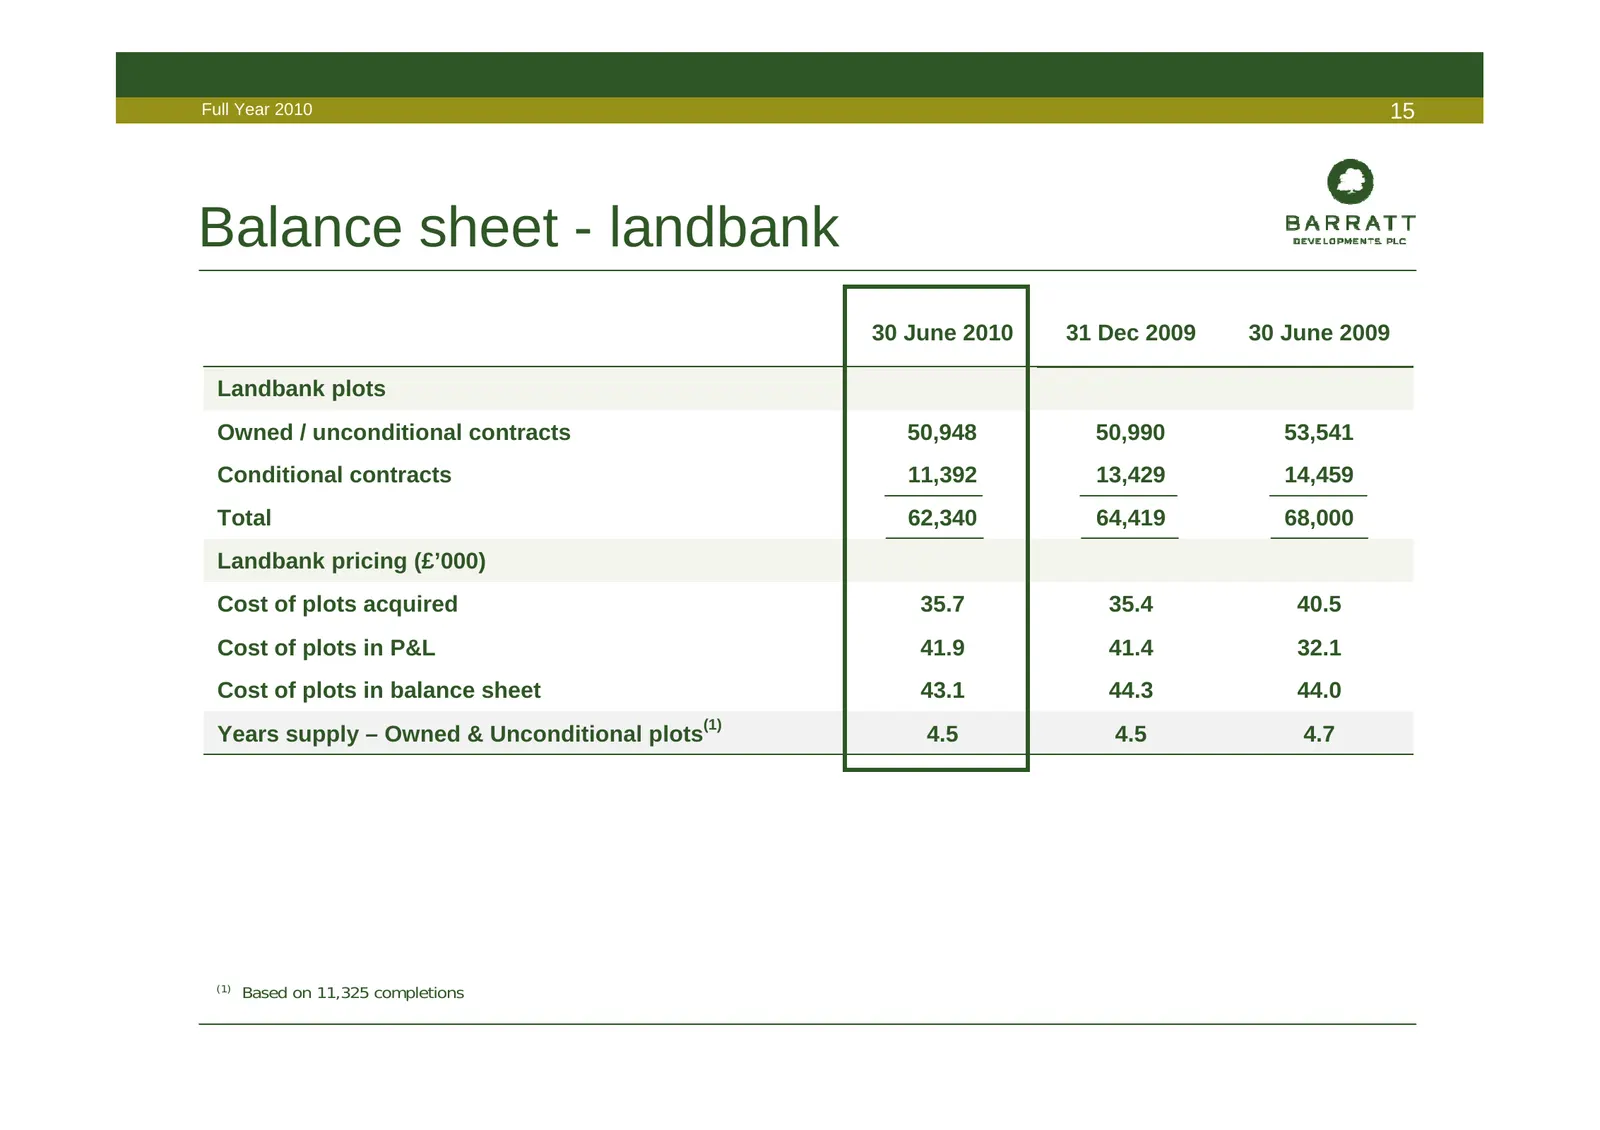
Slide 15: Balance sheet - landbank
Full Year 2010 15 Balance sheet - landbank 30 June 2010 31 Dec 2009 30 June 2009 Landbank plots Owned / unconditional contracts 50,948 50,990 53,541 Conditional contracts 11,392 13,429 14,459 Total 62,340 64,419 68,000 Landbank pricing (£’000) Cost of plots acquired 35.7 35.4 40.5 Cost of plots in P
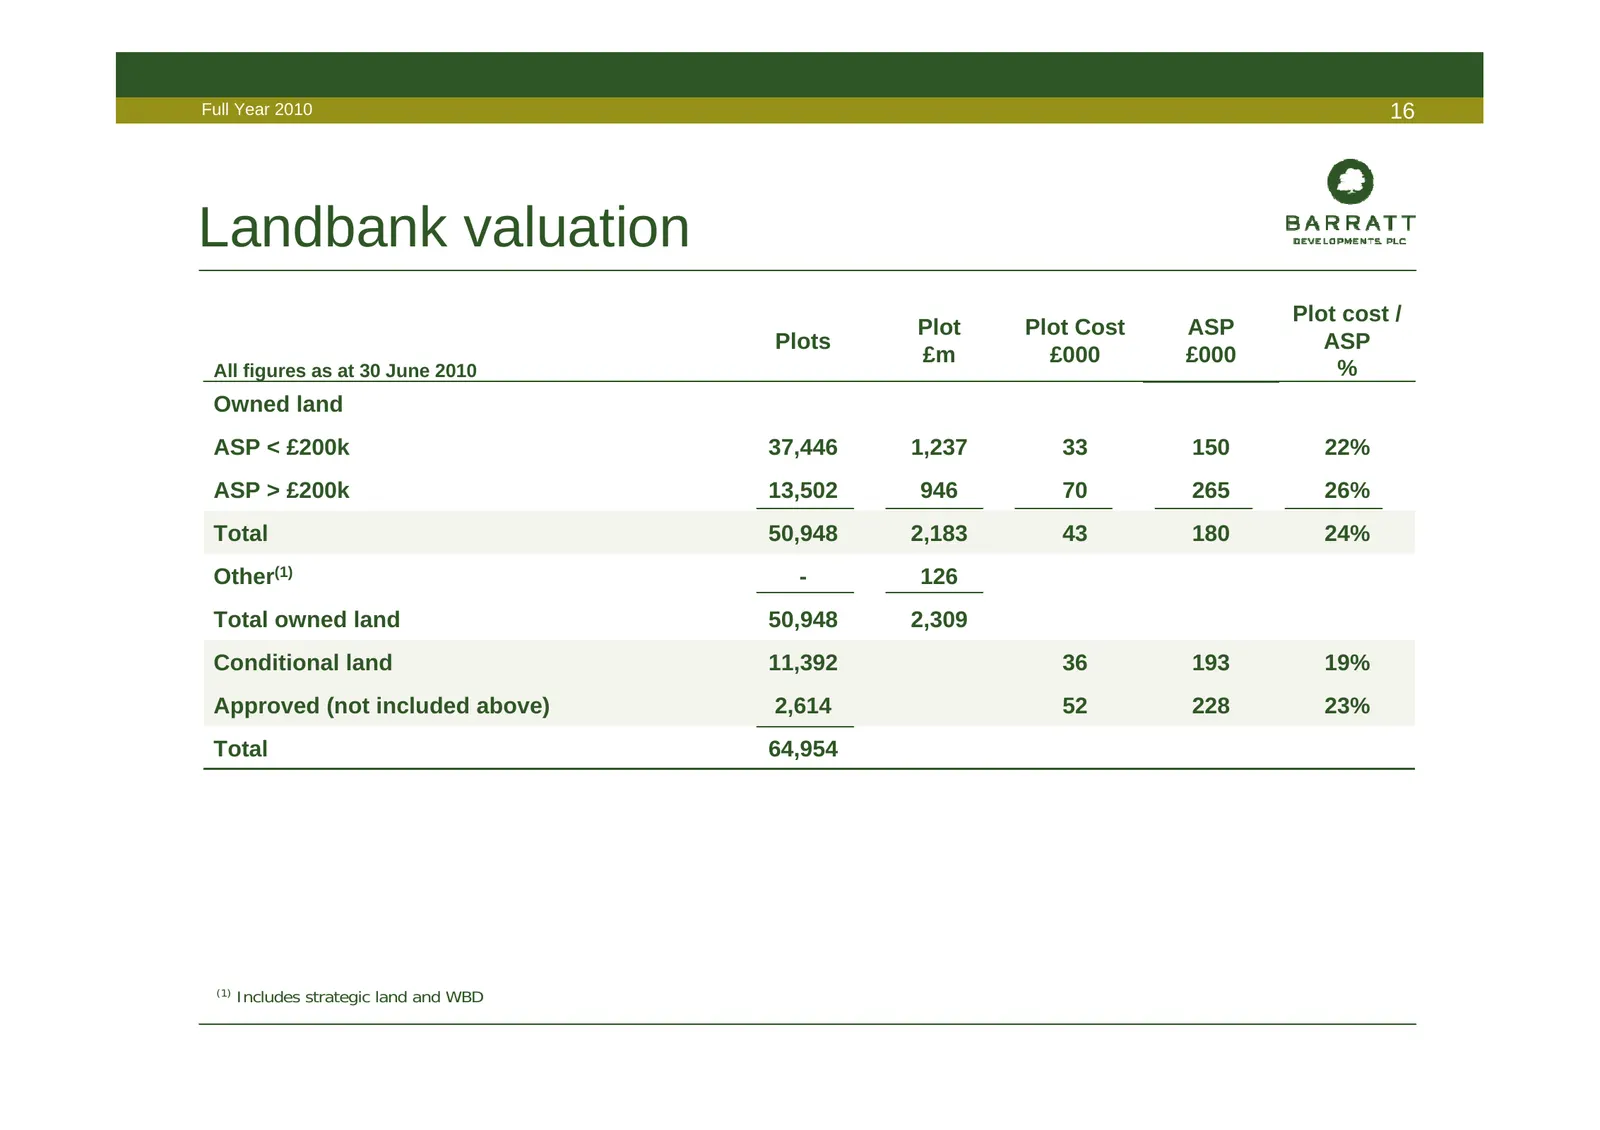
Slide 16: Landbank valuation
Full Year 2010 16 Landbank valuation Plot cost / Plot Plot Cost ASP Plots ASP £m £000 £000 All figures as at 30 June 2010 % Owned land ASP < £200k 37,446 1,237 33 150 22% ASP > £200k 13,502 946 70 265 26% Total 50,948 2,183 43 180 24% Other(1) - 126 Total owned land 50,948 2,309 Conditional land 11,
Slide 17: Balance sheet – liabilities
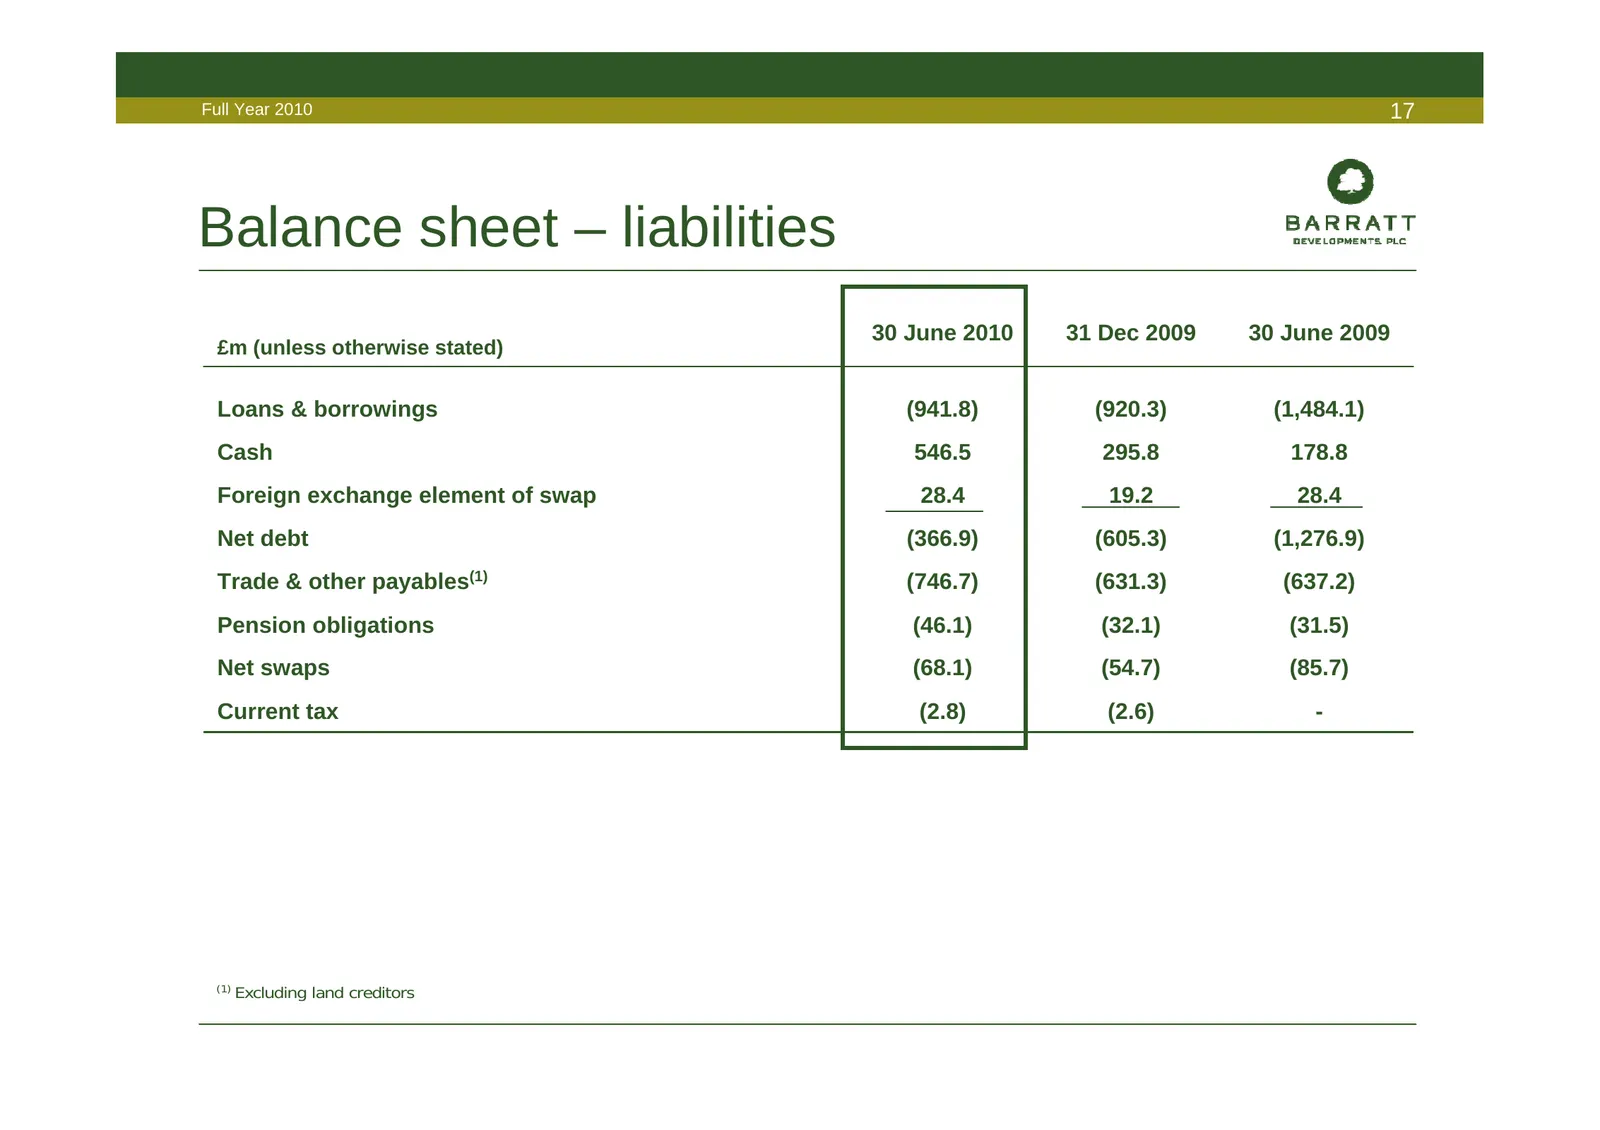
Full Year 2010 17 Balance sheet – liabilities 30 June 2010 31 Dec 2009 30 June 2009 £m (unless otherwise stated) Loans & borrowings (941.8) (920.3) (1,484.1) Cash 546.5 295.8 178.8 Foreign exchange element of swap 28.4 19.2 28.4 Net debt (366.9) (605.3) (1,276.9) Trade & other payables(1) (746.7) (6
Slide 18: Financing arrangements
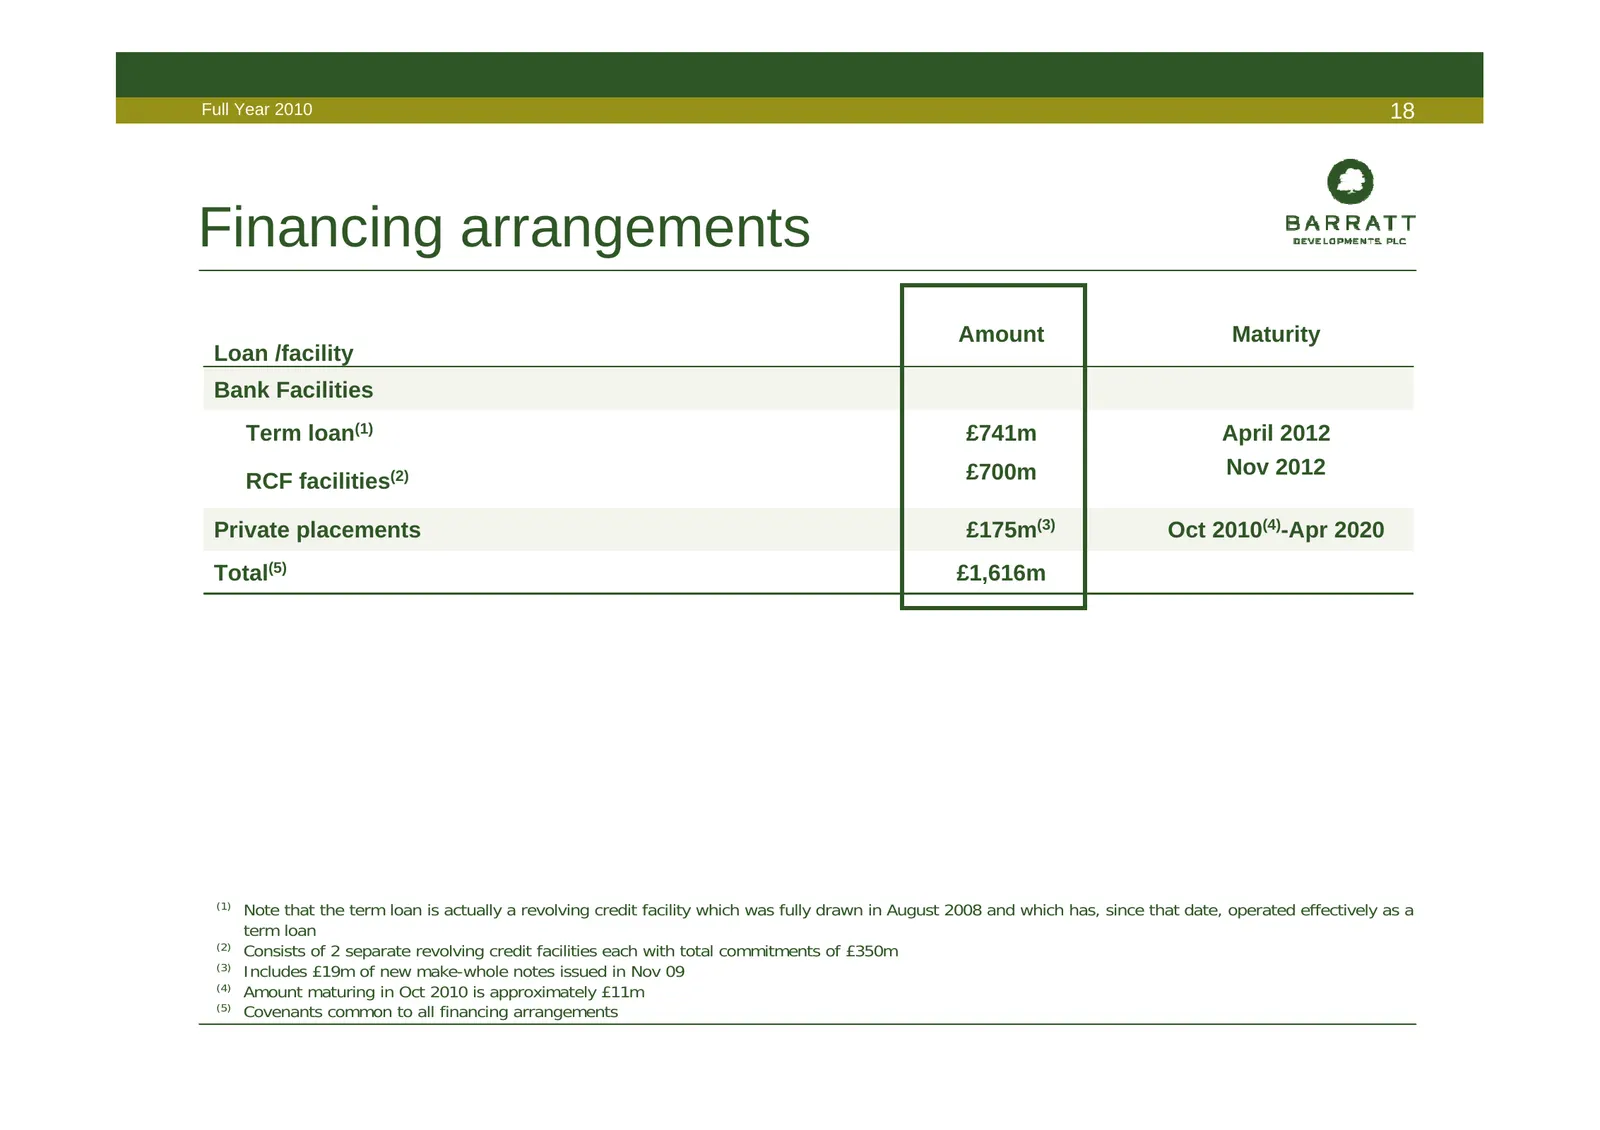
Full Year 2010 18 Financing arrangements Amount Maturity Loan /facility Bank Facilities Term loan(1) £741m April 2012 £700m Nov 2012 RCF facilities(2) Private placements £175m(3) Oct 2010(4)-Apr 2020 Total(5) £1,616m (1) Note that the term loan is actually a revolving credit facility which was fully
Slide 19: Interest charge analysis
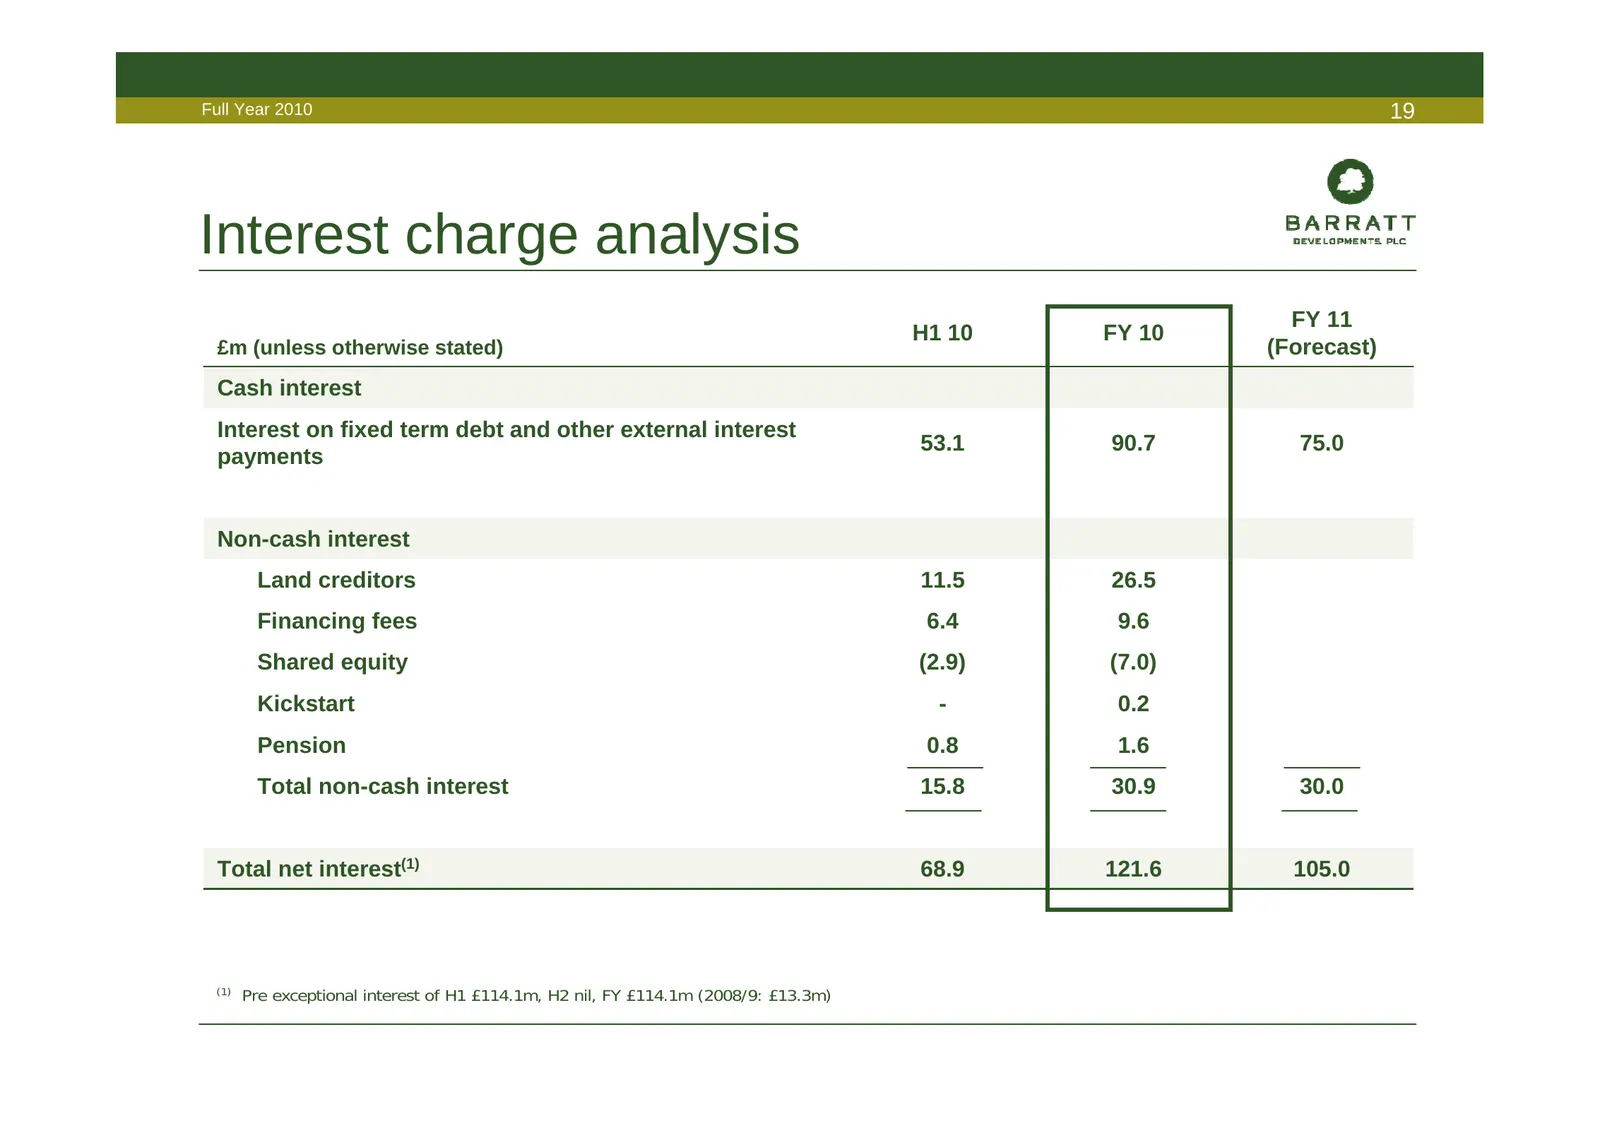
Full Year 2010 19 Interest charge analysis FY 11 H1 10 FY 10 £m (unless otherwise stated) (Forecast) Cash interest Interest on fixed term debt and other external interest 53.1 90.7 75.0 payments Non-cash interest Land creditors 11.5 26.5 Financing fees 6.4 9.6 Shared equity (2.9) (7.0) Kickstart - 0
Slide 20: Net debt/Land creditors analysis
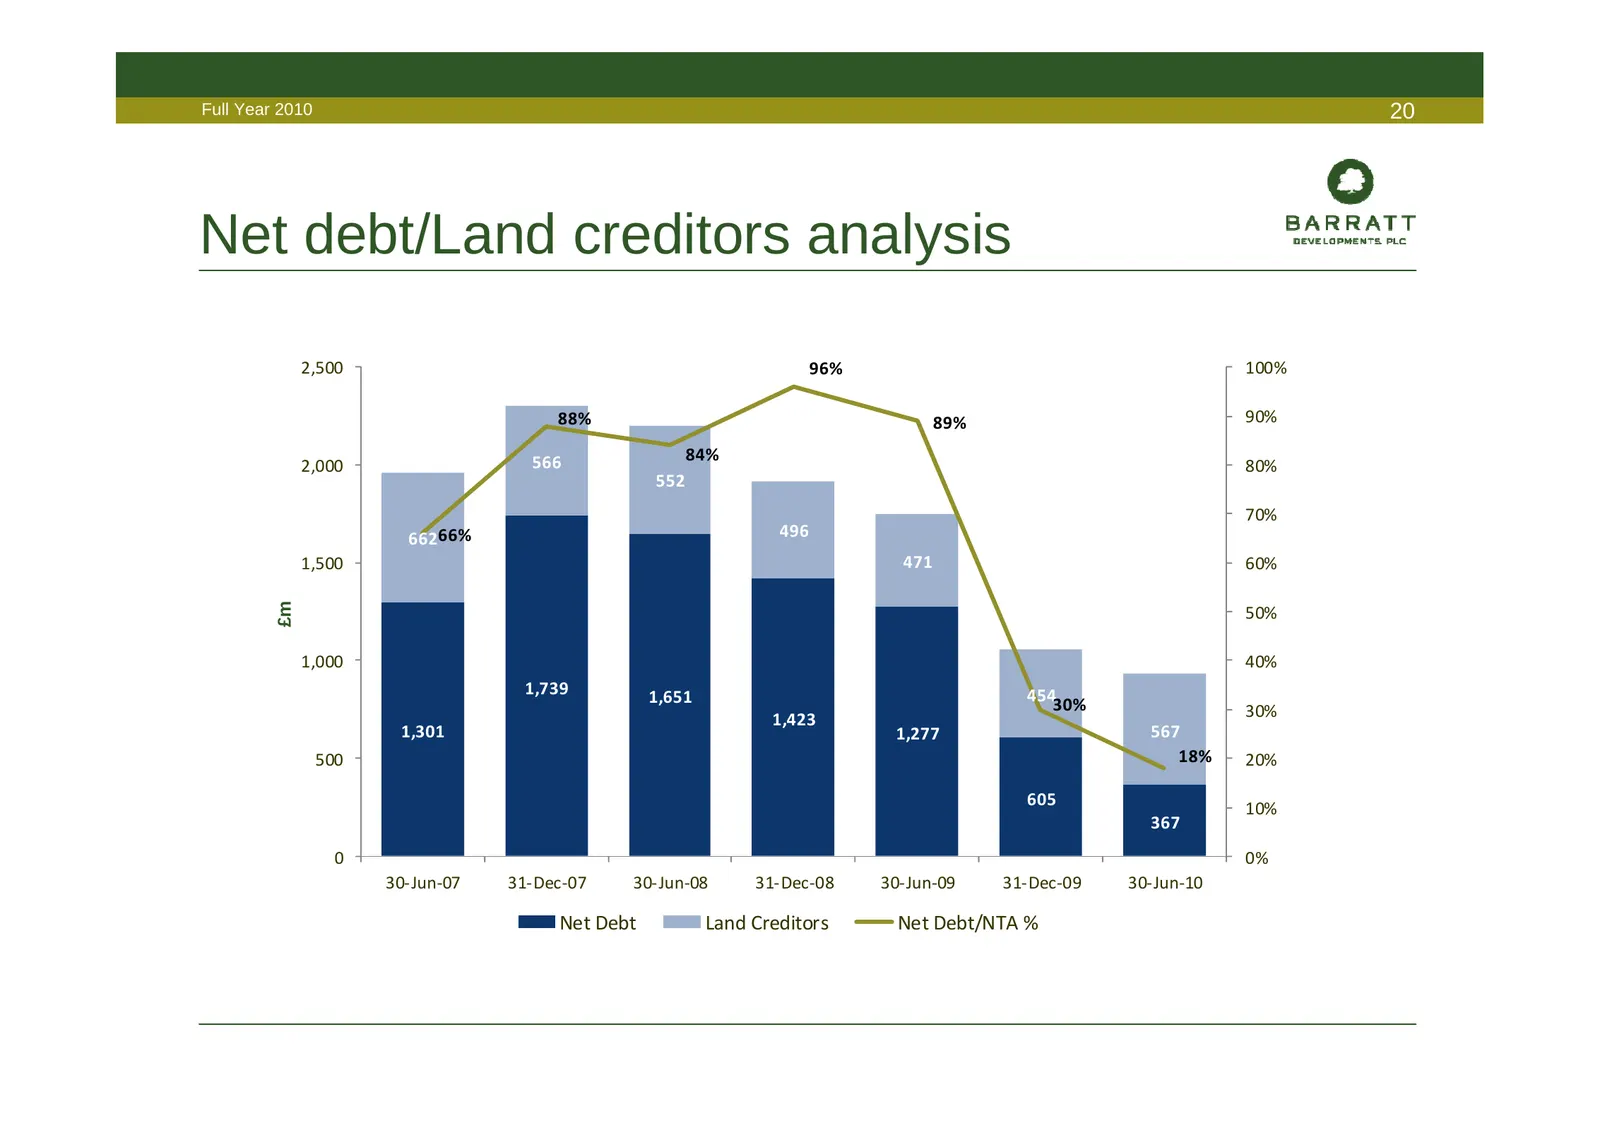
Full Year 2010 20 Net debt/Land creditors analysis 2,500 96% 100% 88% 89% 90% 566 84% 2,000 80% 552 70% 66266% 496 1,500 471 60% £m 50% 1,000 40% 1,739 1,651 45430% 1,423 30% 1,301 1,277 567 500 18% 20% 605 10% 367 0 0% 30‐Jun‐07 31‐Dec‐07 30‐Jun‐08 31‐Dec‐08 30‐Jun‐09 31‐Dec‐09 30‐Jun‐10 Net Debt L
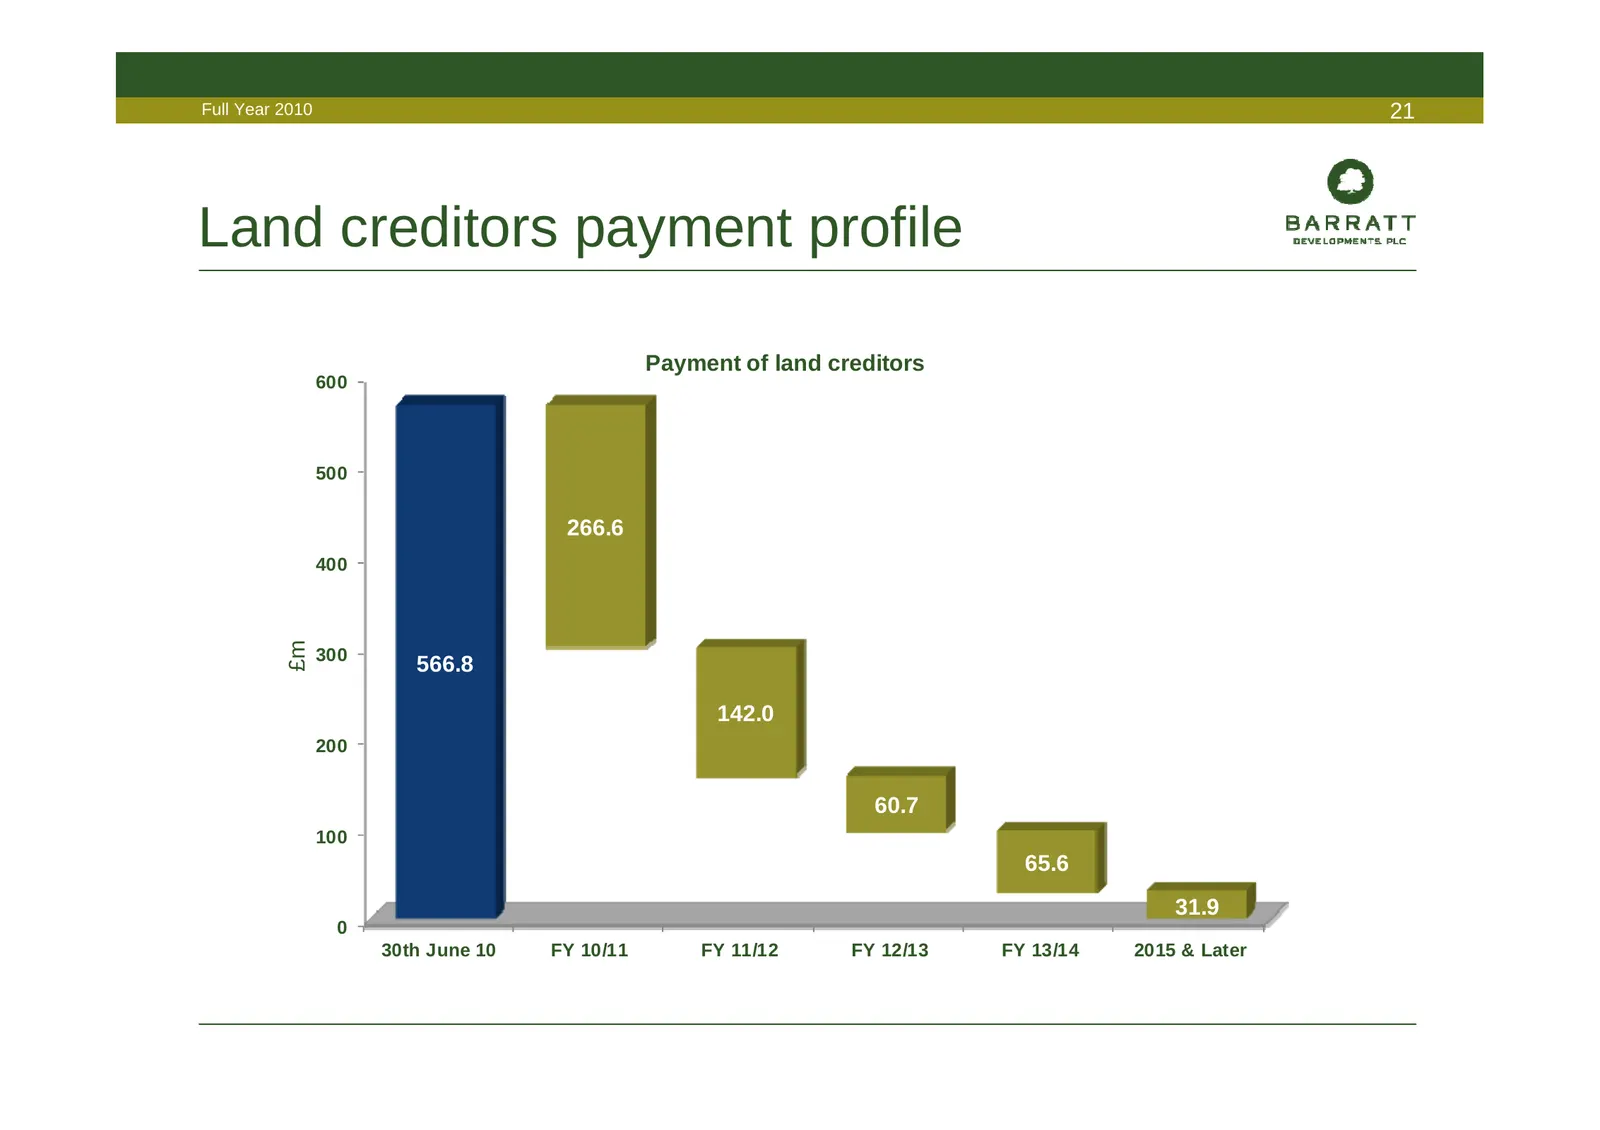
Slide 21: Land creditors payment profile
Full Year 2010 21 Land creditors payment profile Payment of land creditors 600 500 266.6 400 £m 300 566.8 142.0 200 60.7 100 65.6 31.9 0 30th June 10 FY 10/11 FY 11/12 FY 12/13 FY 13/14 2015 & Later
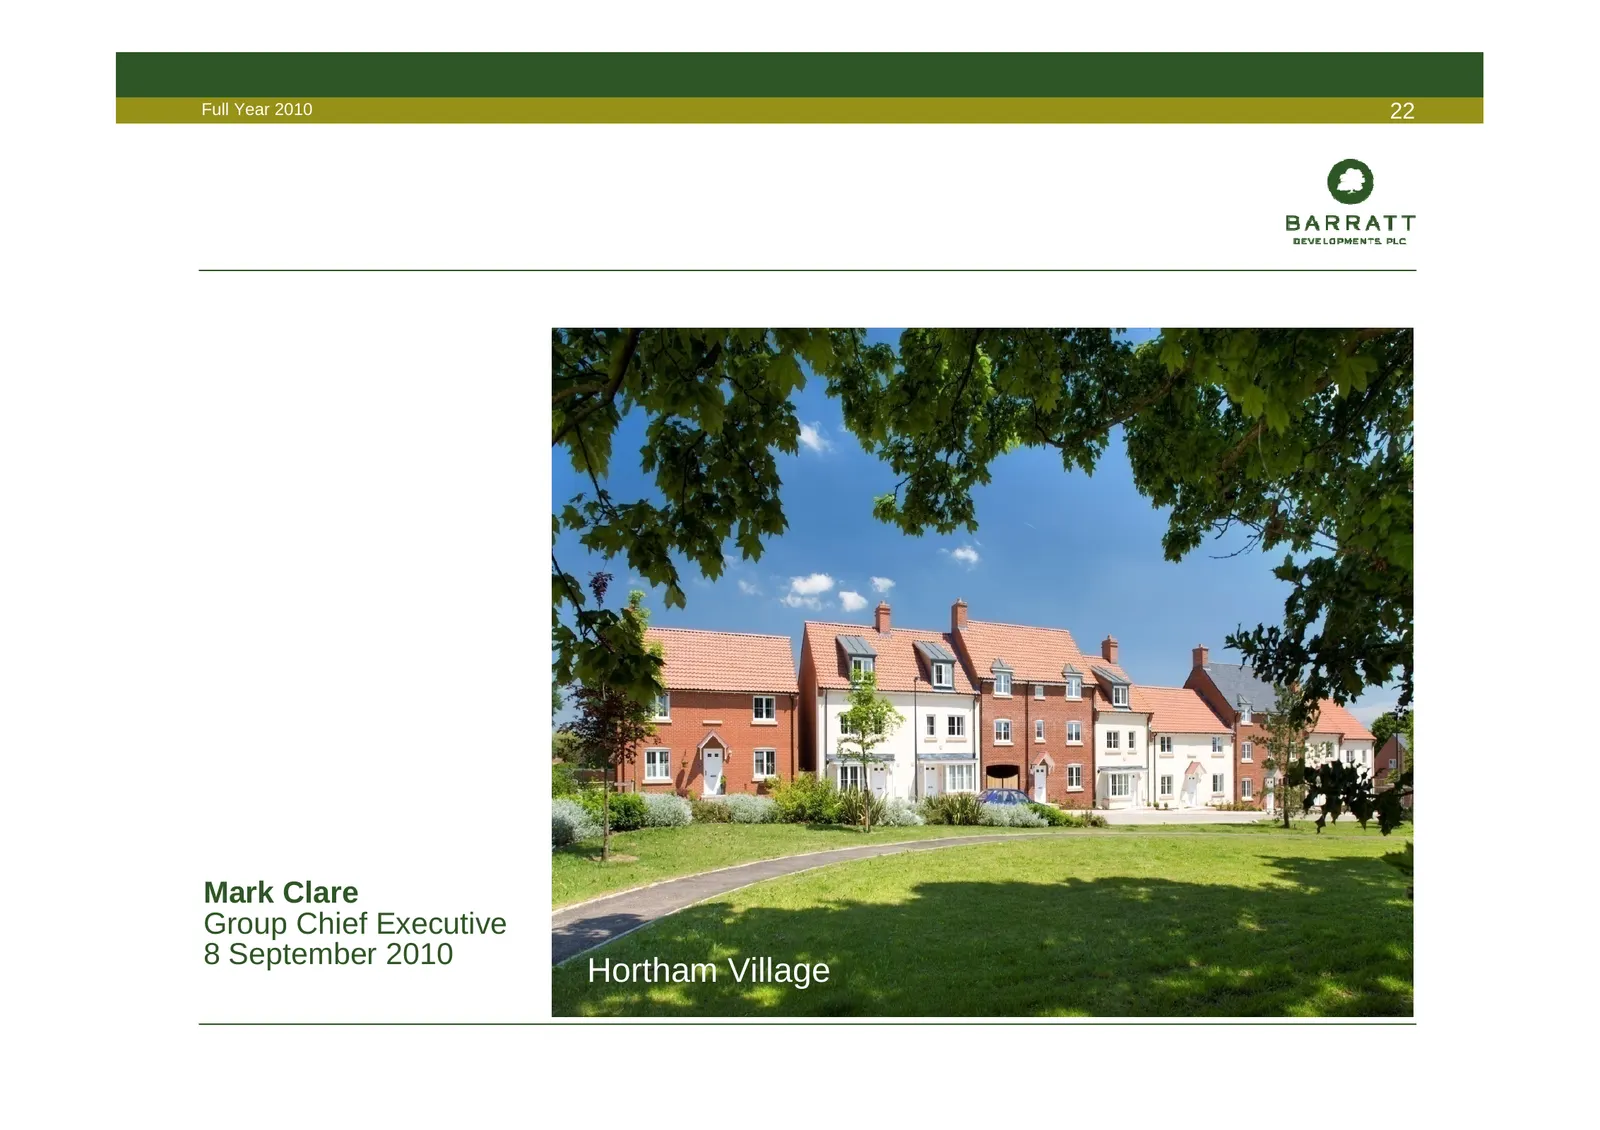
Slide 22: Mark Clare, Group Chief Executive
Full Year 2010 22 Mark Clare Group Chief Executive 8 September 2010 Hortham Village
Slide 23: Overview
Full Year 2010 23 Overview • Market trends • Sales performance • Key priorities • Government framework • Current trading • Outlook
Slide 24: Key achievements
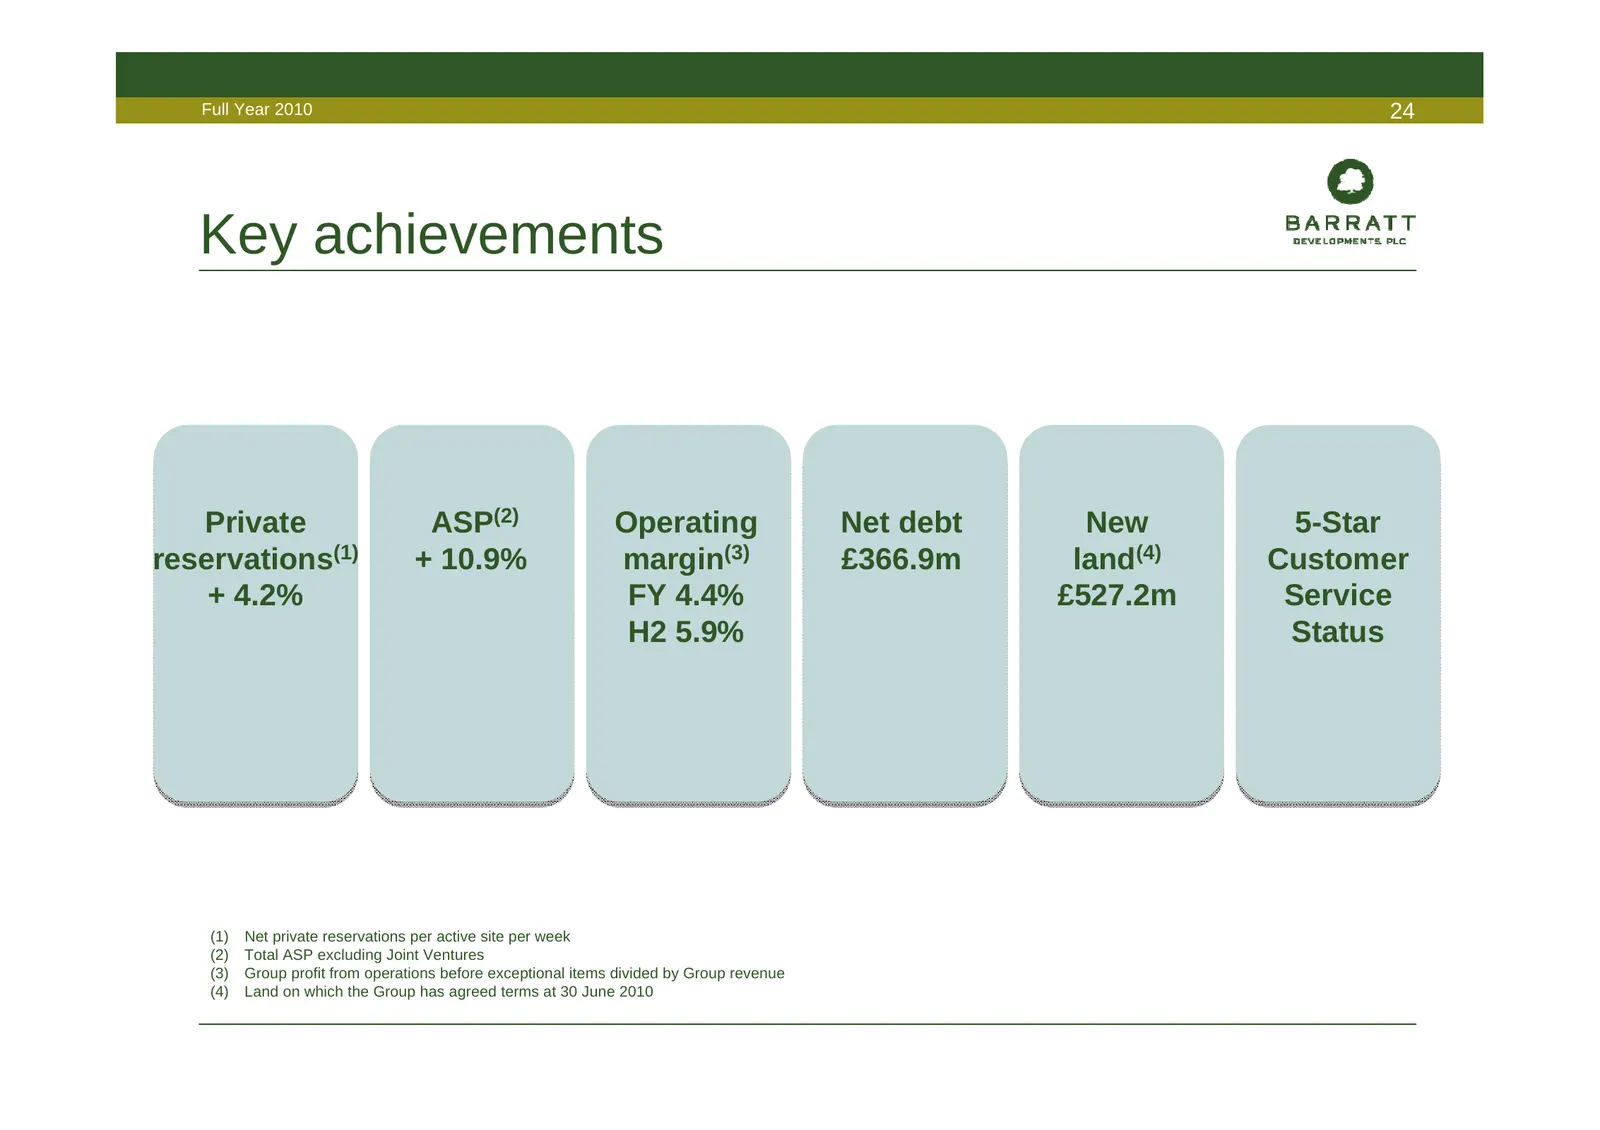
Full Year 2010 24 Key achievements Private ASP(2) Operating Net debt New 5-Star reservations(1) + 10.9% margin(3) £366.9m land(4) Customer + 4.2% FY 4.4% £527.2m Service H2 5.9% Status (1) Net private reservations per active site per week (2) Total ASP excluding Joint Ventures (3) Group profit from
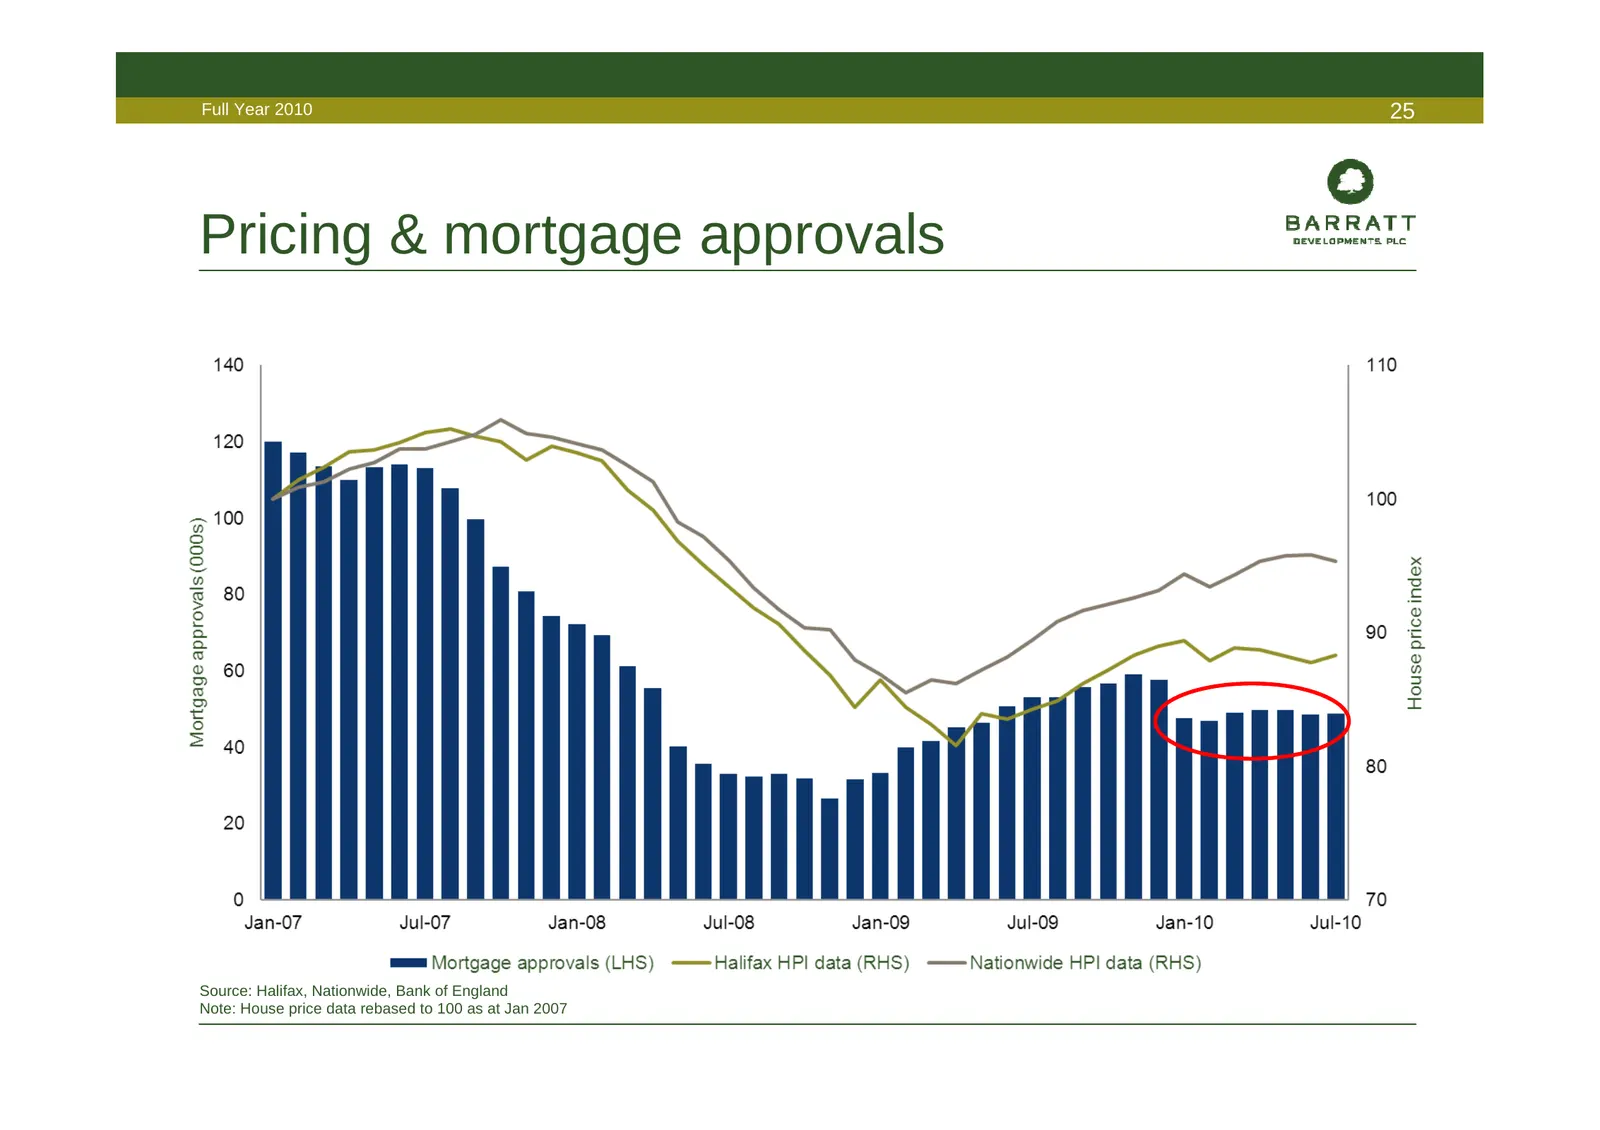
Slide 25: Pricing & mortgage approvals
Full Year 2010 25 Pricing & mortgage approvals Source: Halifax, Nationwide, Bank of England Note: House price data rebased to 100 as at Jan 2007
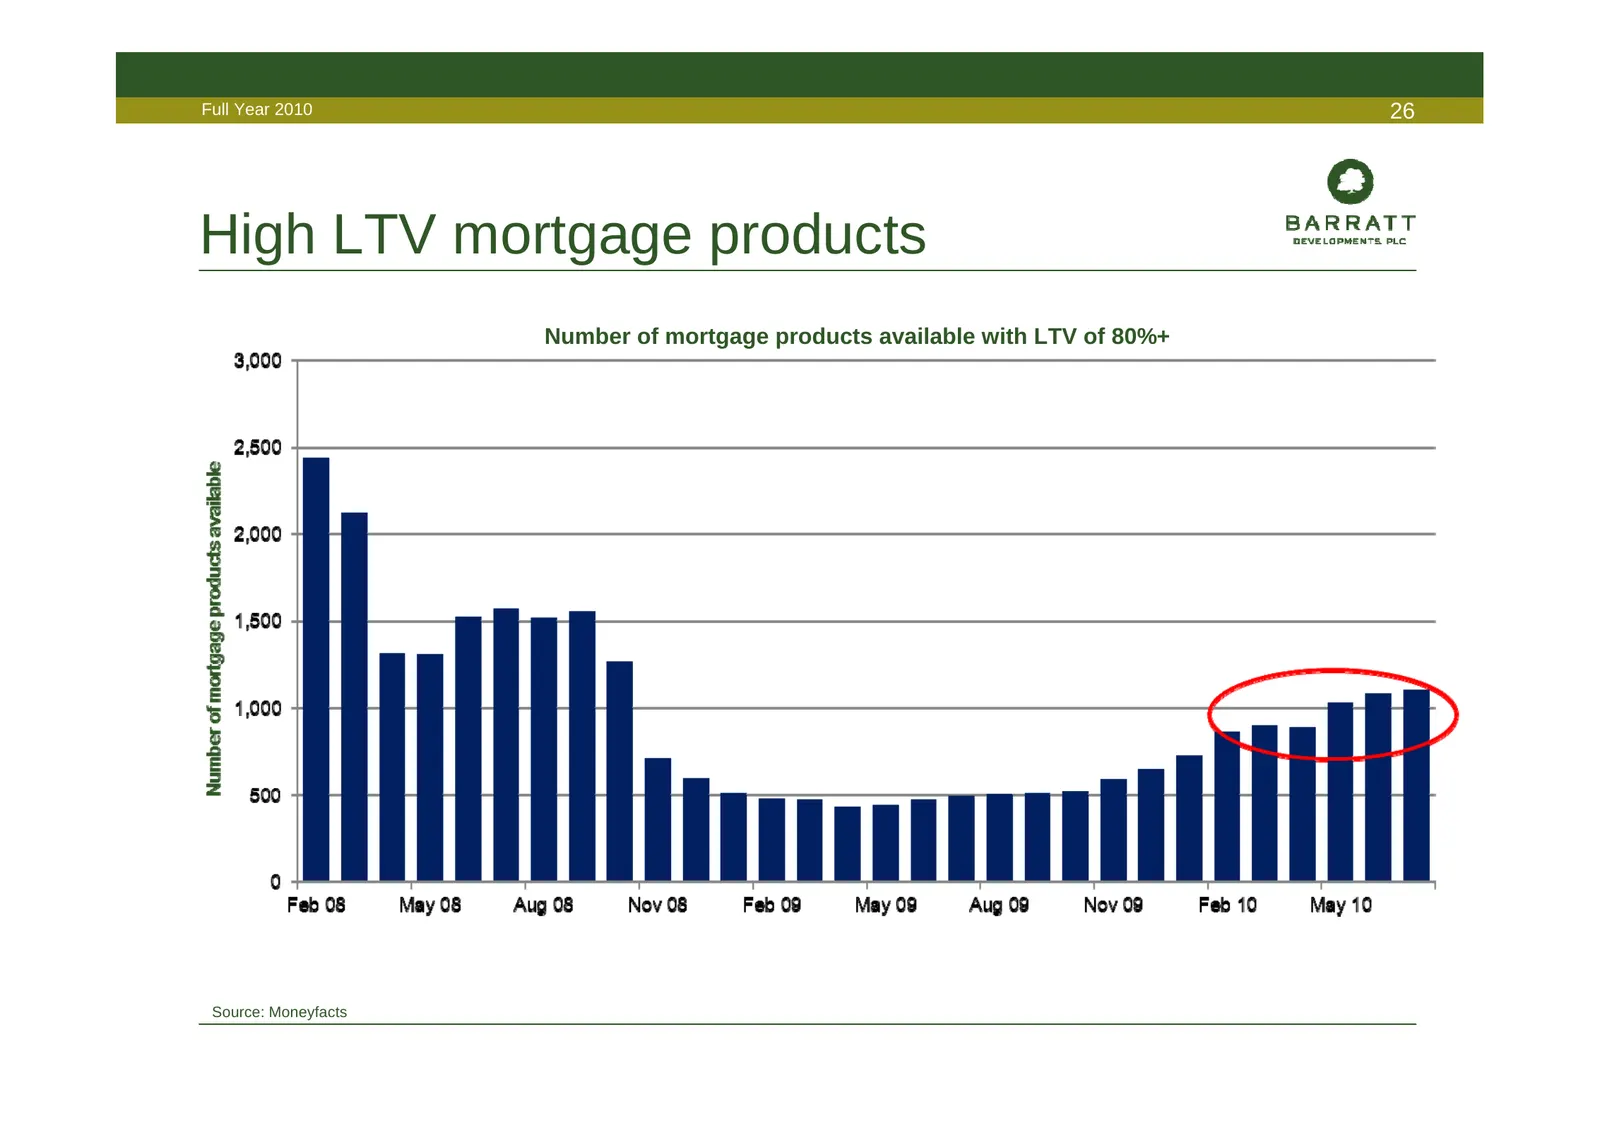
Slide 26: High LTV mortgage products
Full Year 2010 26 High LTV mortgage products Number of mortgage products available with LTV of 80%+ Source: Moneyfacts
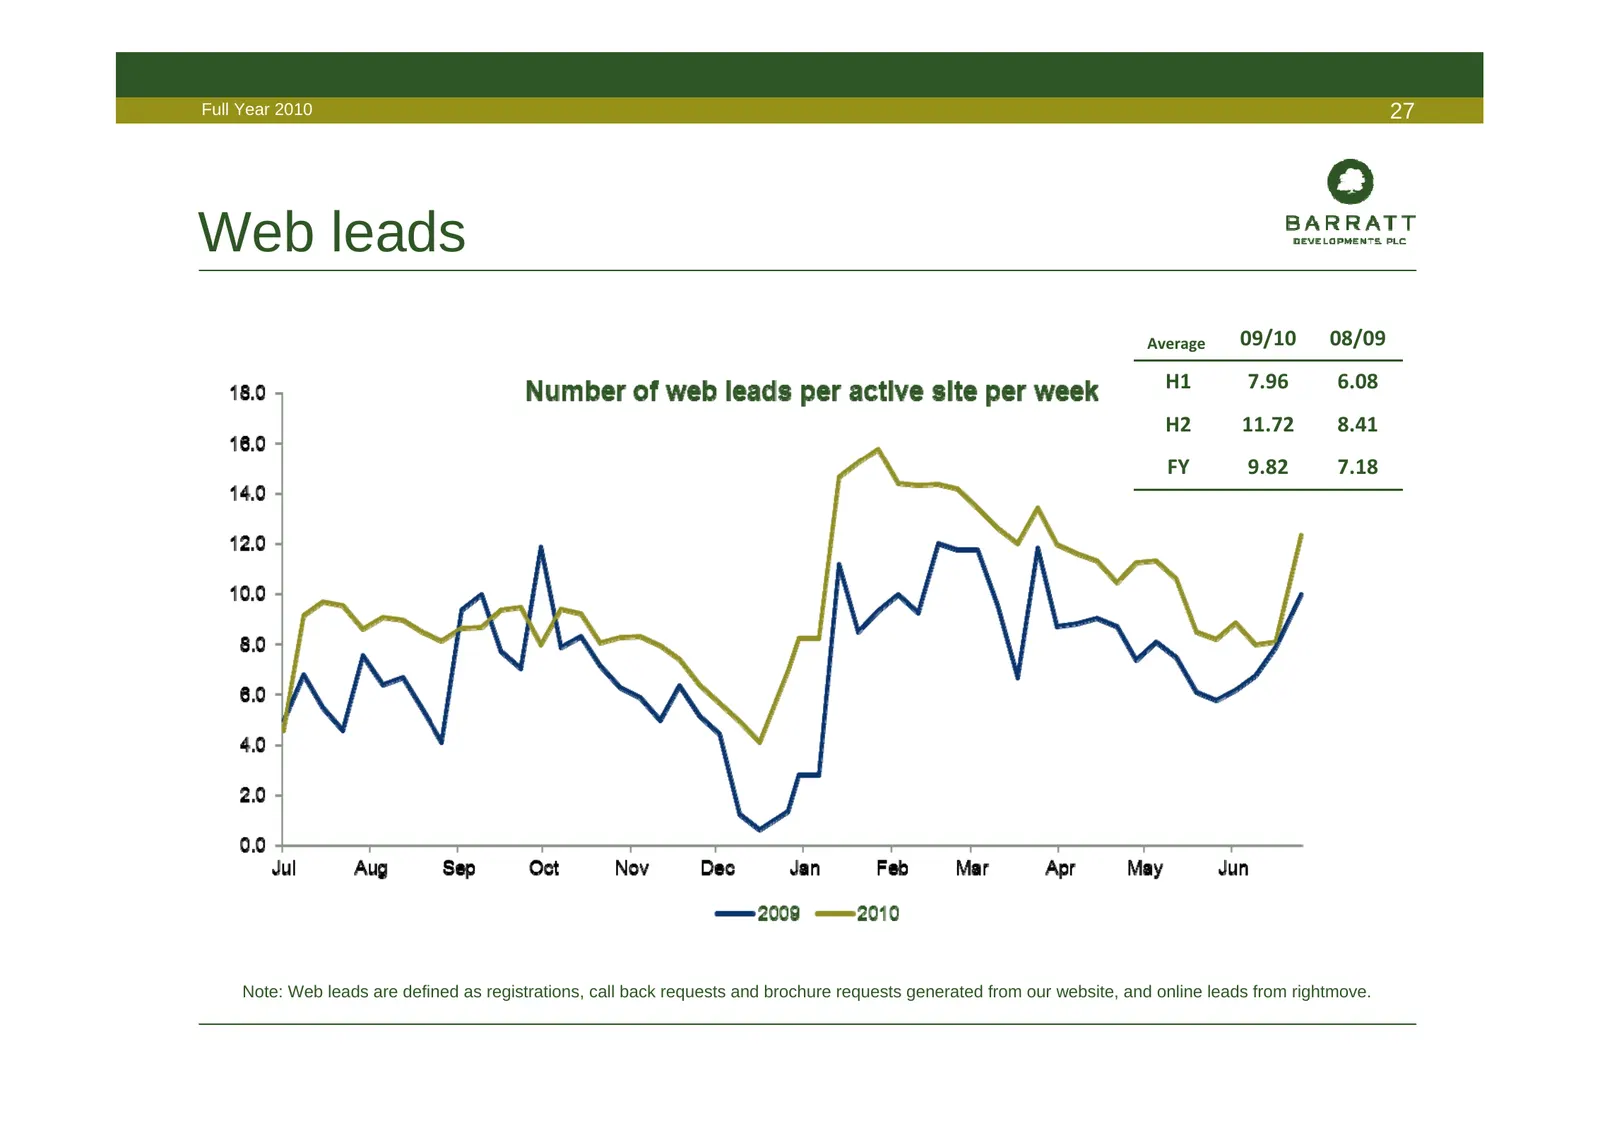
Slide 27: Web leads
Full Year 2010 27 Web leads Average 09/10 08/09 H1 7.96 6.08 H2 11.72 8.41 FY 9.82 7.18 Note: Web leads are defined as registrations, call back requests and brochure requests generated from our website, and online leads from rightmove.
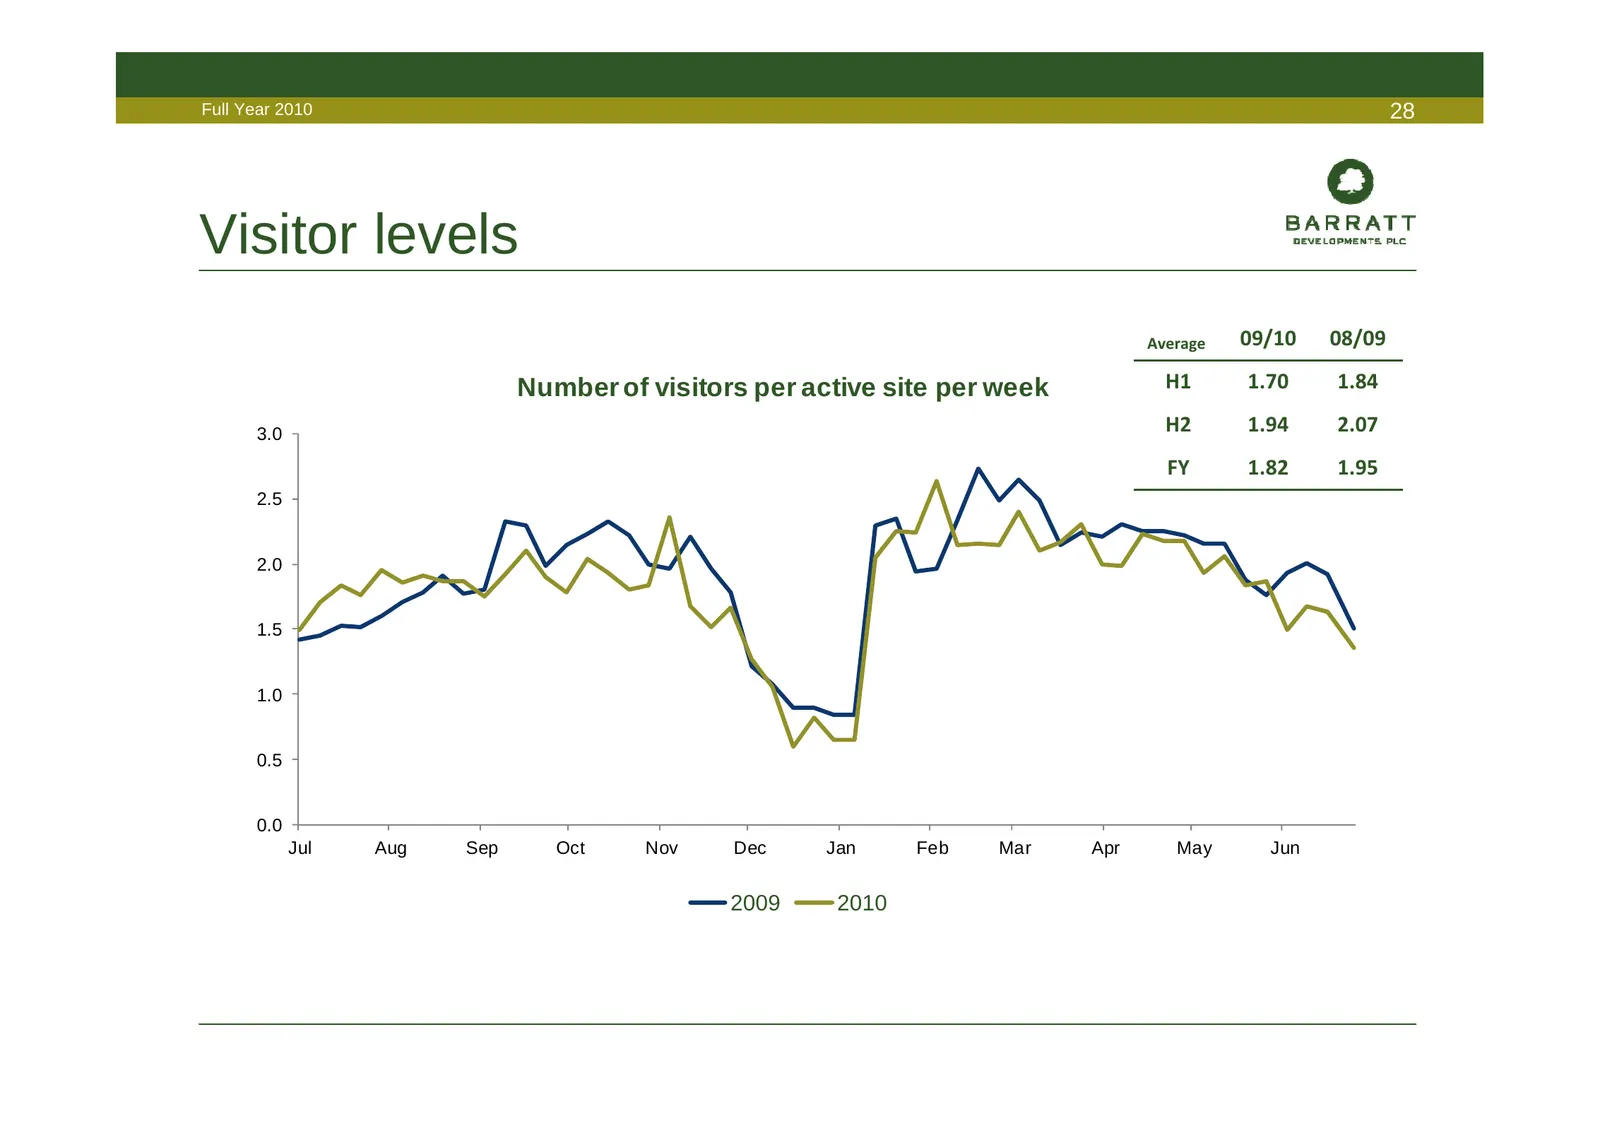
Slide 28: Visitor levels
Full Year 2010 28 Visitor levels Average 09/10 08/09 Number of visitors per active site per week H1 1.70 1.84 3.0 H2 1.94 2.07 FY 1.82 1.95 2.5 2.0 1.5 1.0 0.5 0.0 Jul Aug Sep Oct Nov Dec Jan Feb Mar Apr May Jun 2009 2010
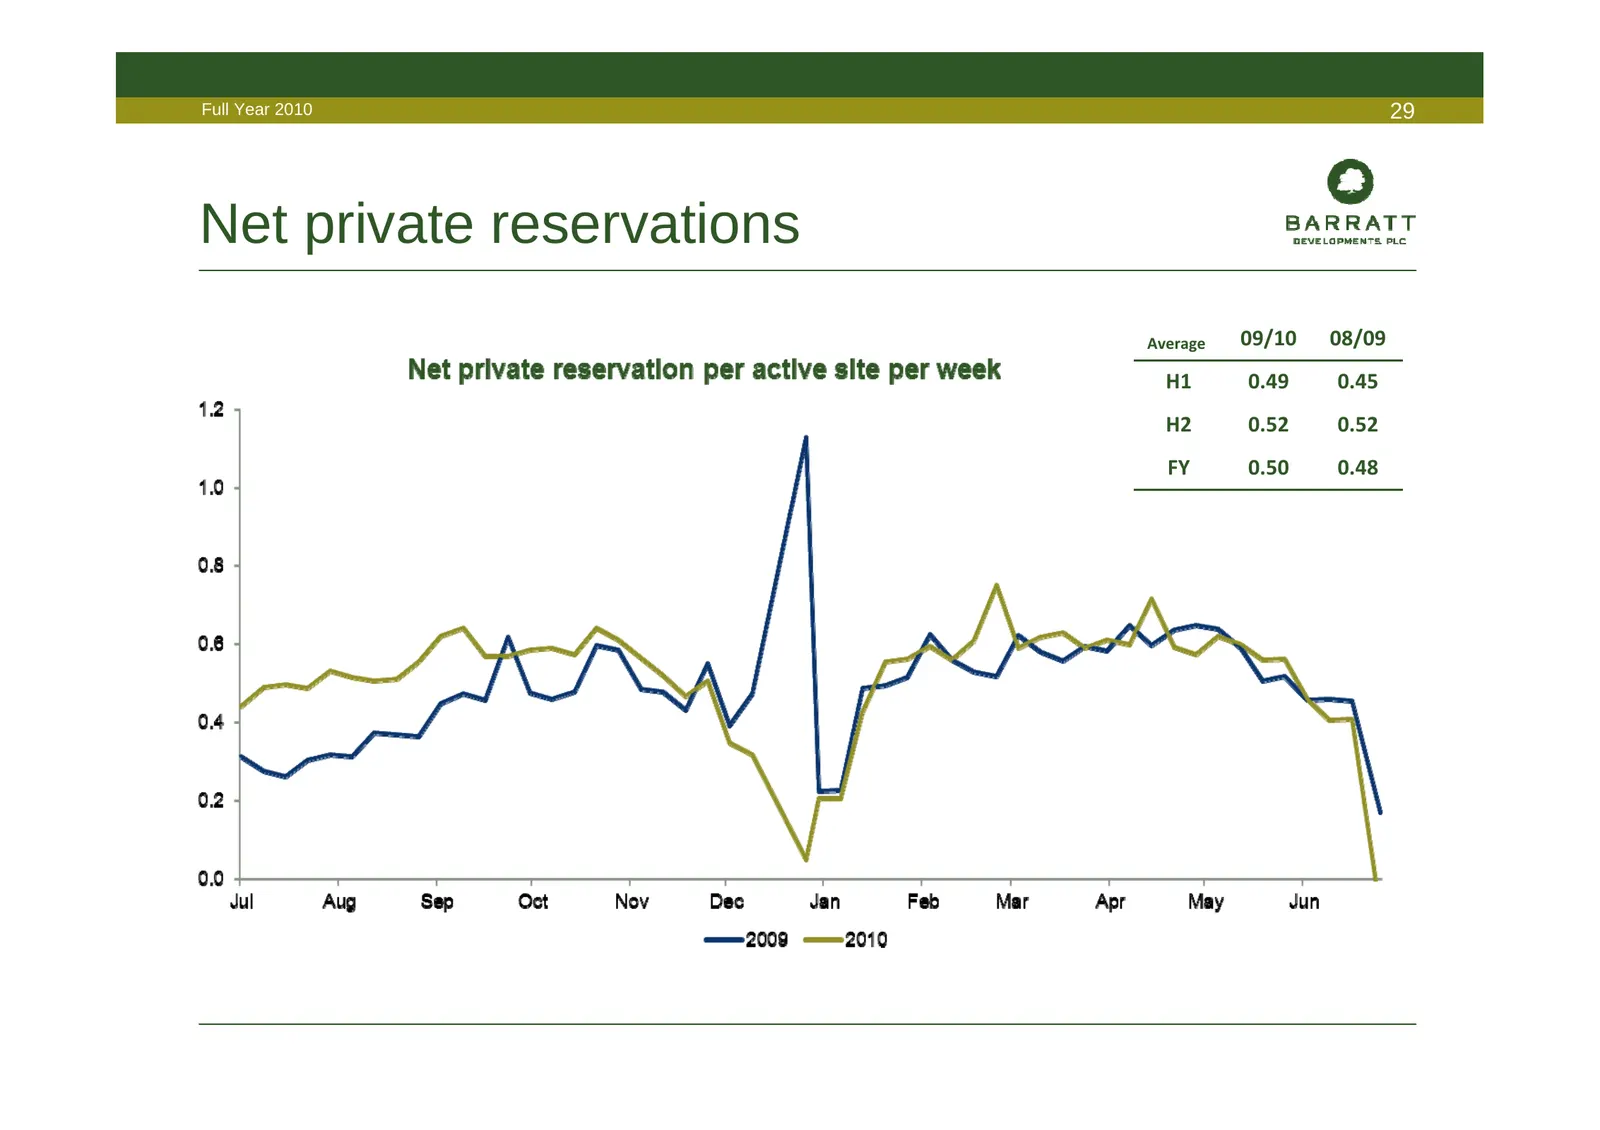
Slide 29: Net private reservations
Full Year 2010 29 Net private reservations Average 09/10 08/09 H1 0.49 0.45 H2 0.52 0.52 FY 0.50 0.48
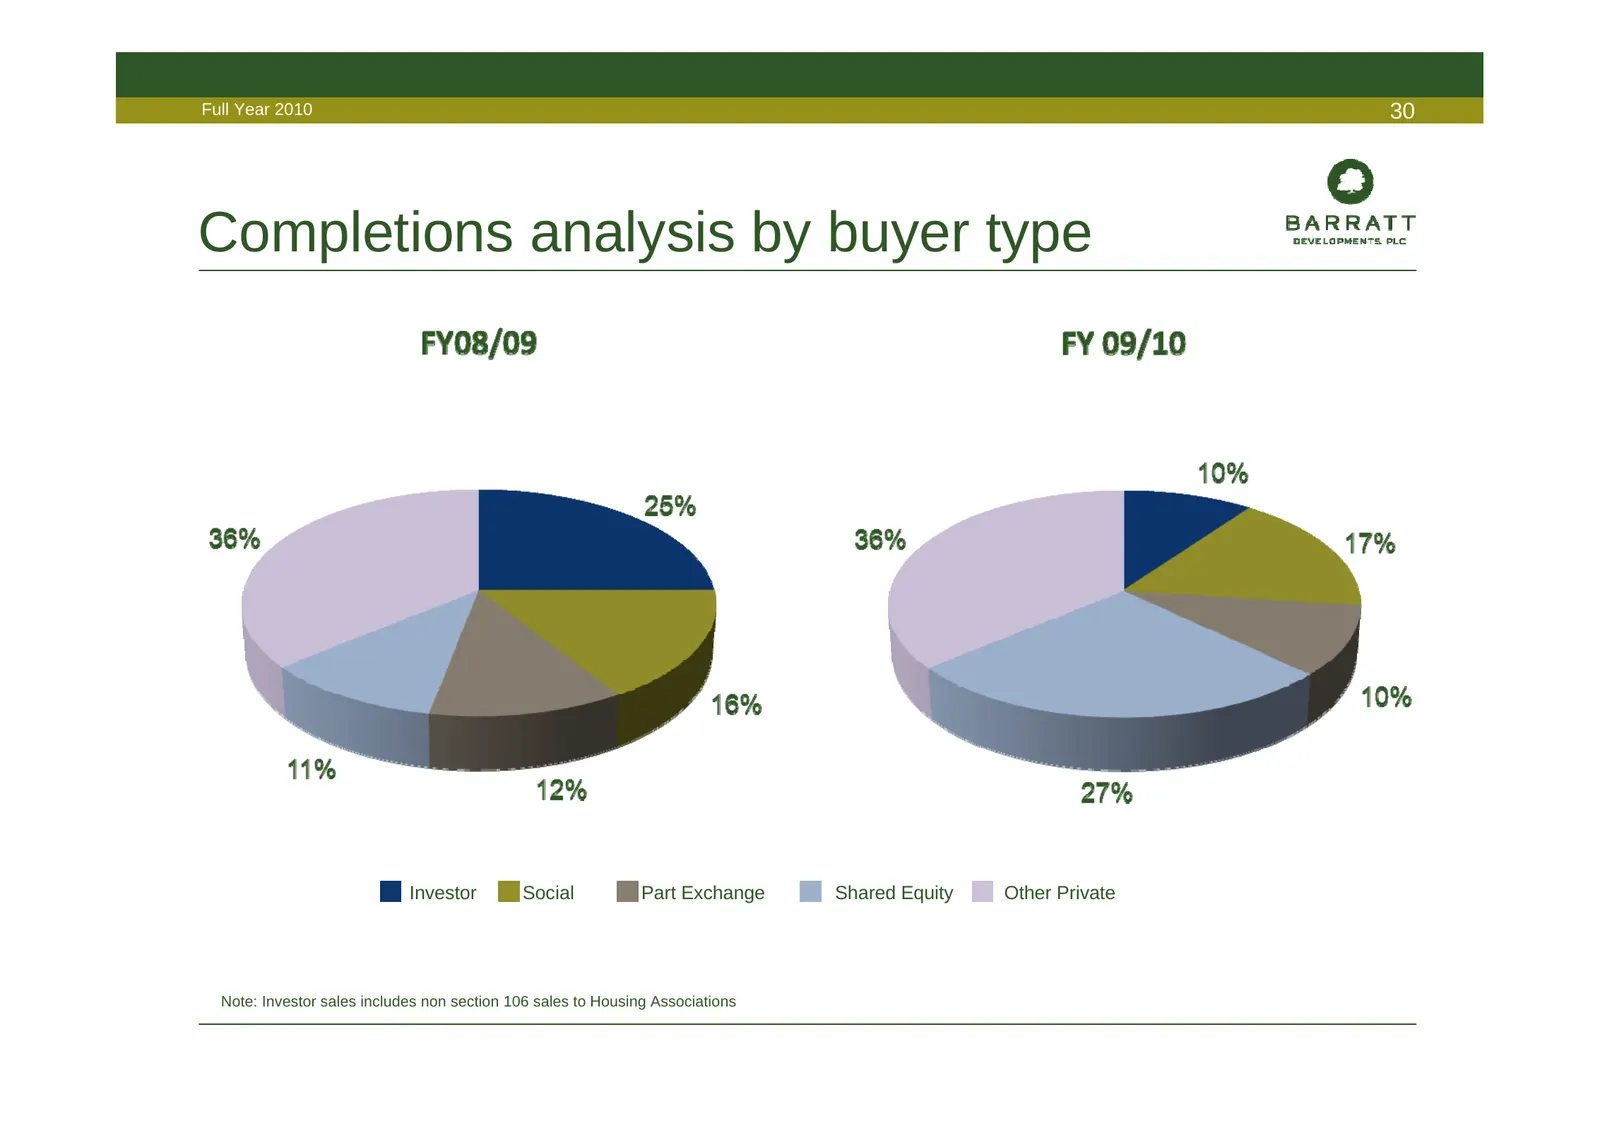
Slide 30: Completions analysis by buyer type
Full Year 2010 30 Completions analysis by buyer type Investor Social Part Exchange Shared Equity Other Private Note: Investor sales includes non section 106 sales to Housing Associations
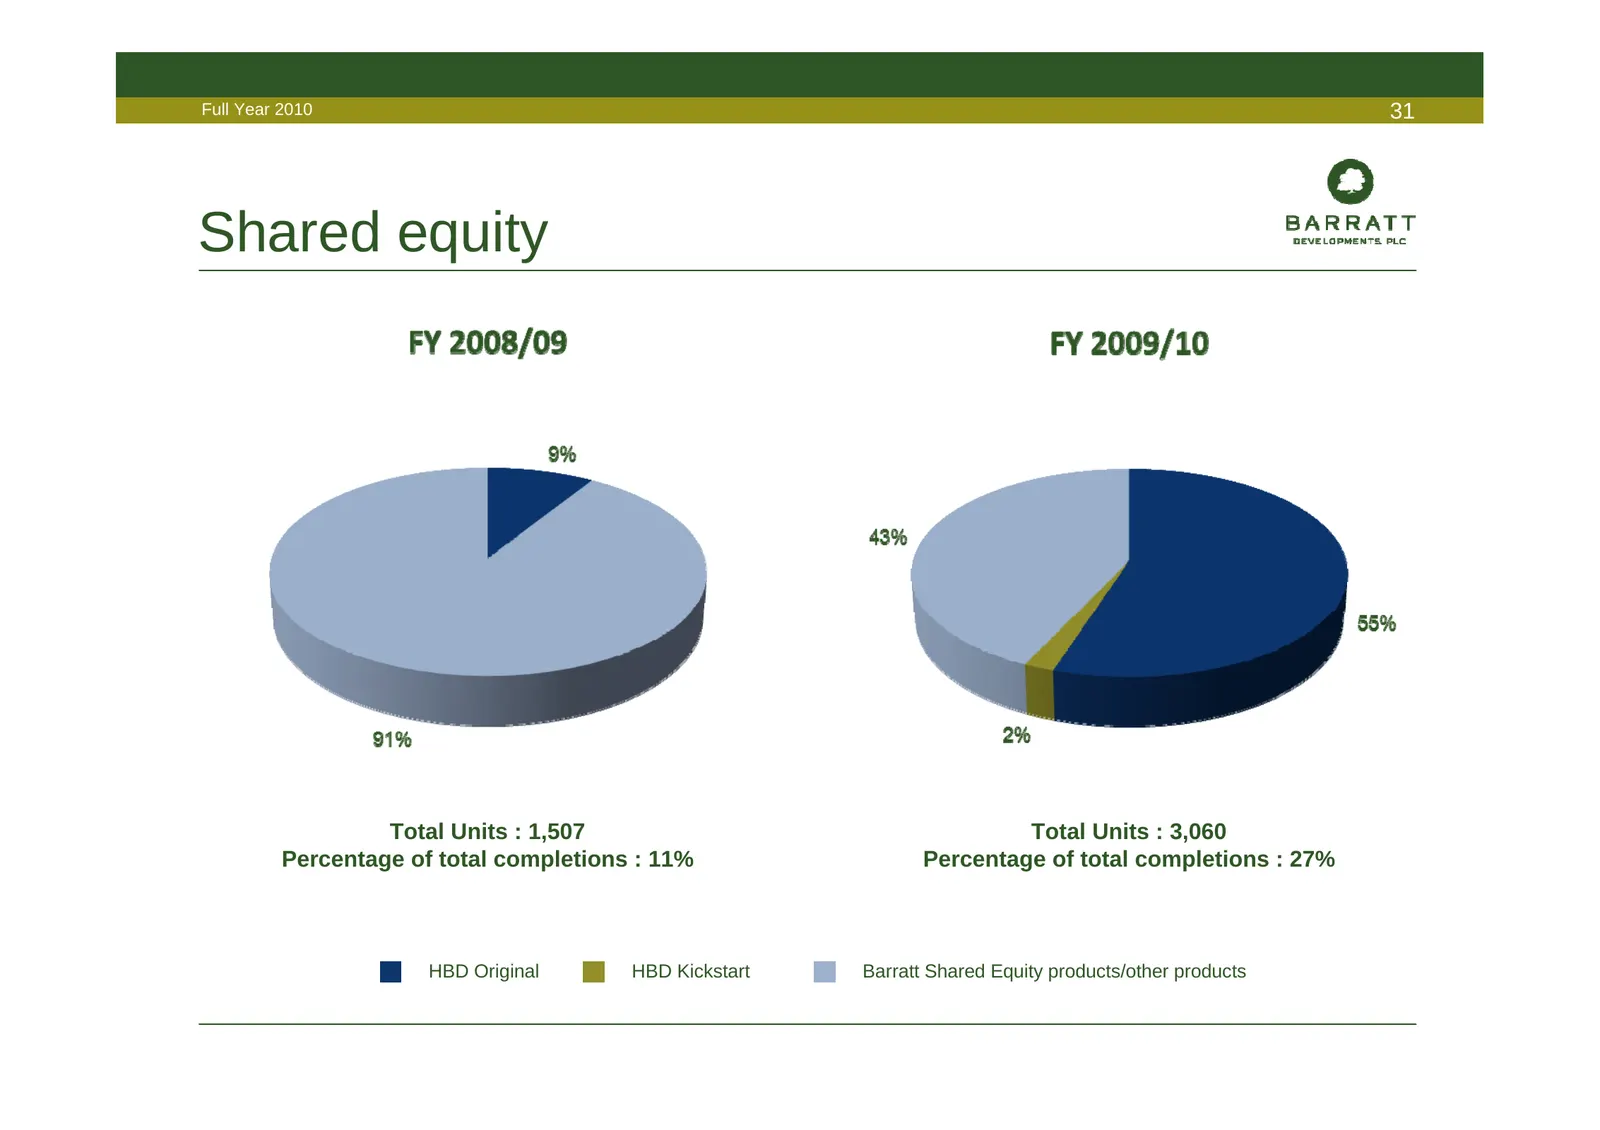
Slide 31: Shared equity
Full Year 2010 31 Shared equity Total Units : 1,507 Total Units : 3,060 Percentage of total completions : 11% Percentage of total completions : 27% HBD Original HBD Kickstart Barratt Shared Equity products/other products
Slide 32: Driving profitability
Full Year 2010 32 Driving profitability • Price optimisation • Outlet growth • Operational efficiency • Targeted land buying
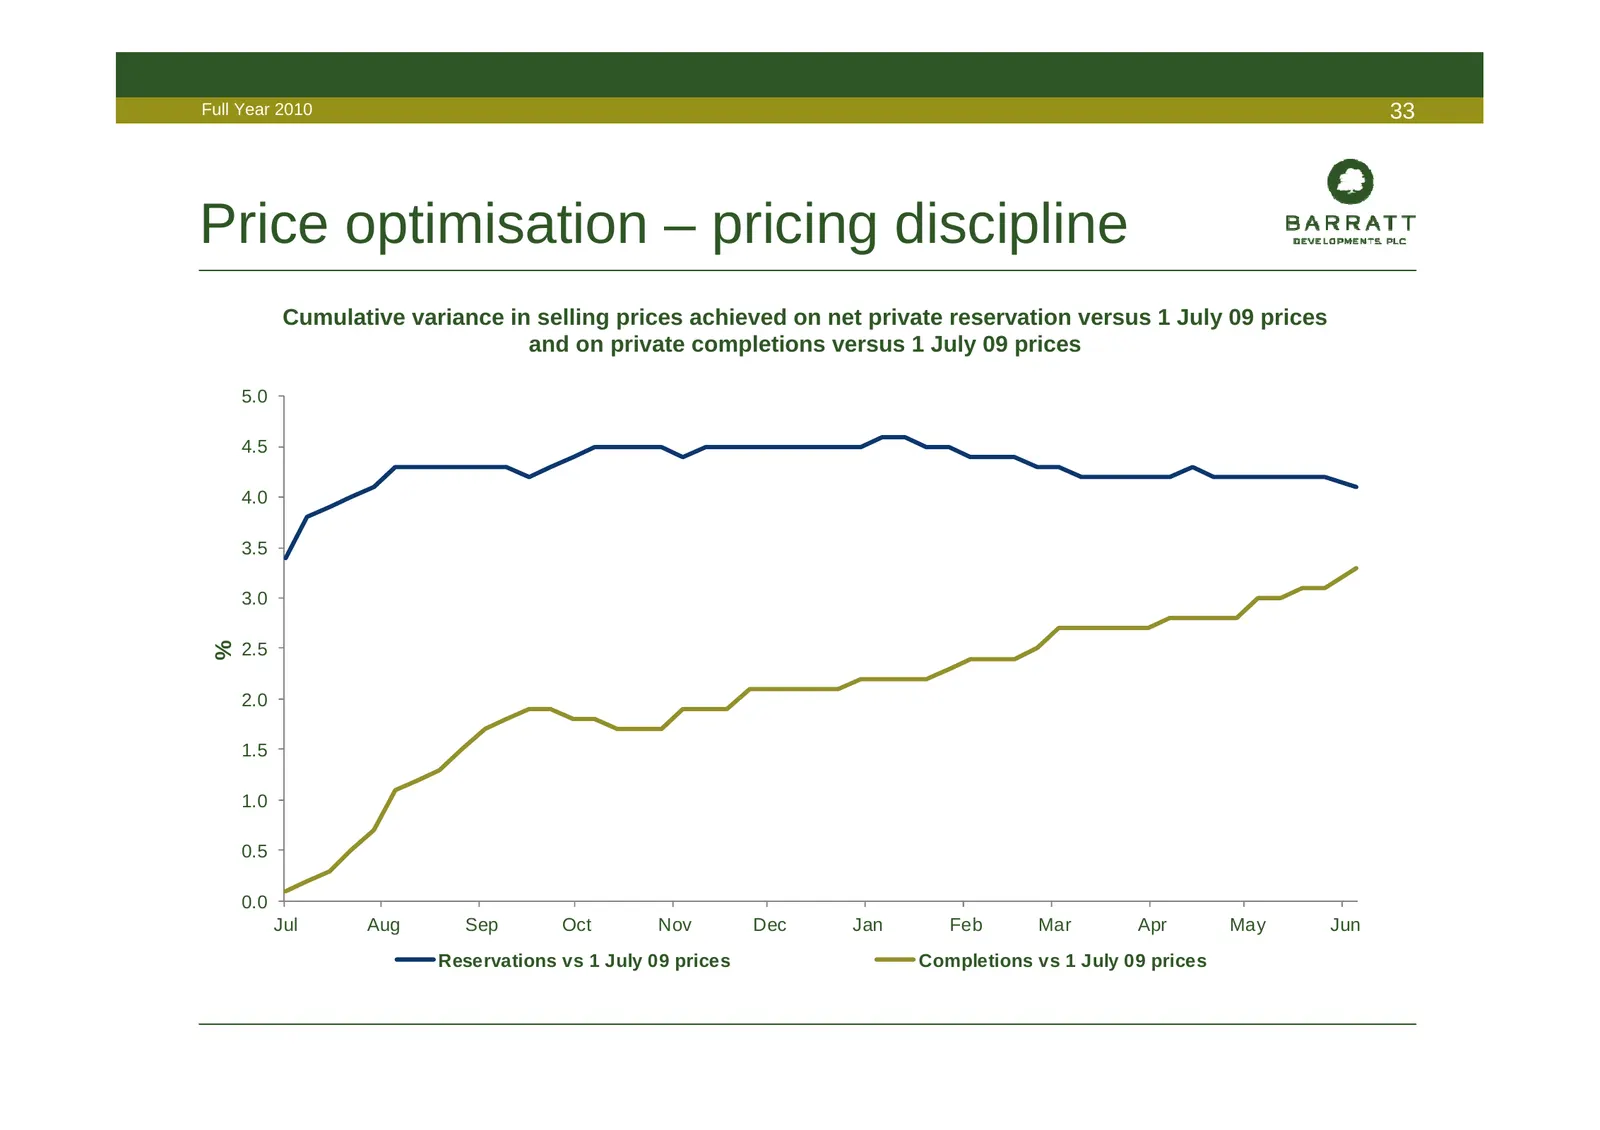
Slide 33: Price optimisation – pricing discipline
Full Year 2010 33 Price optimisation – pricing discipline Cumulative variance in selling prices achieved on net private reservation versus 1 July 09 prices and on private completions versus 1 July 09 prices 5.0 4.5 4.0 3.5 3.0 % 2.5 2.0 1.5 1.0 0.5 0.0 Jul Aug Sep Oct Nov Dec Jan Feb Mar Apr May Jun
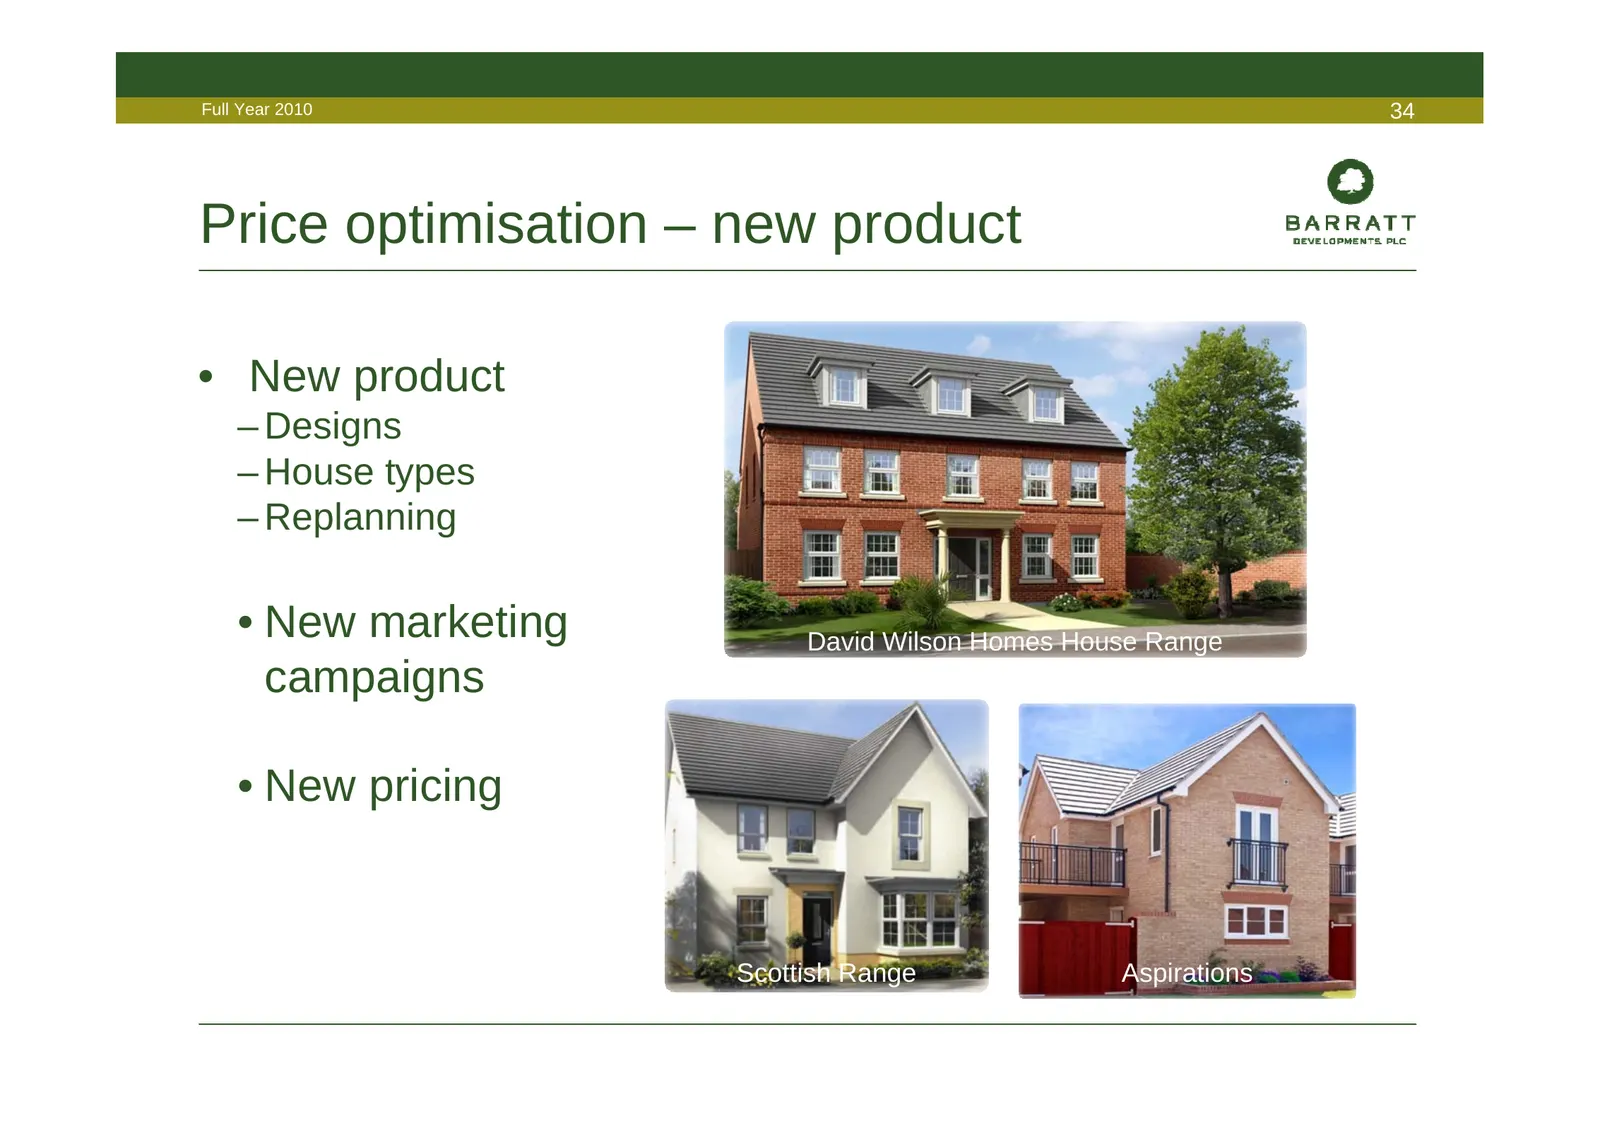
Slide 34: Price optimisation – new product
Full Year 2010 34 Price optimisation – new product • New product – Designs – House types – Replanning • New marketing David Wilson Homes House Range campaigns • New pricing Scottish Range Aspirations
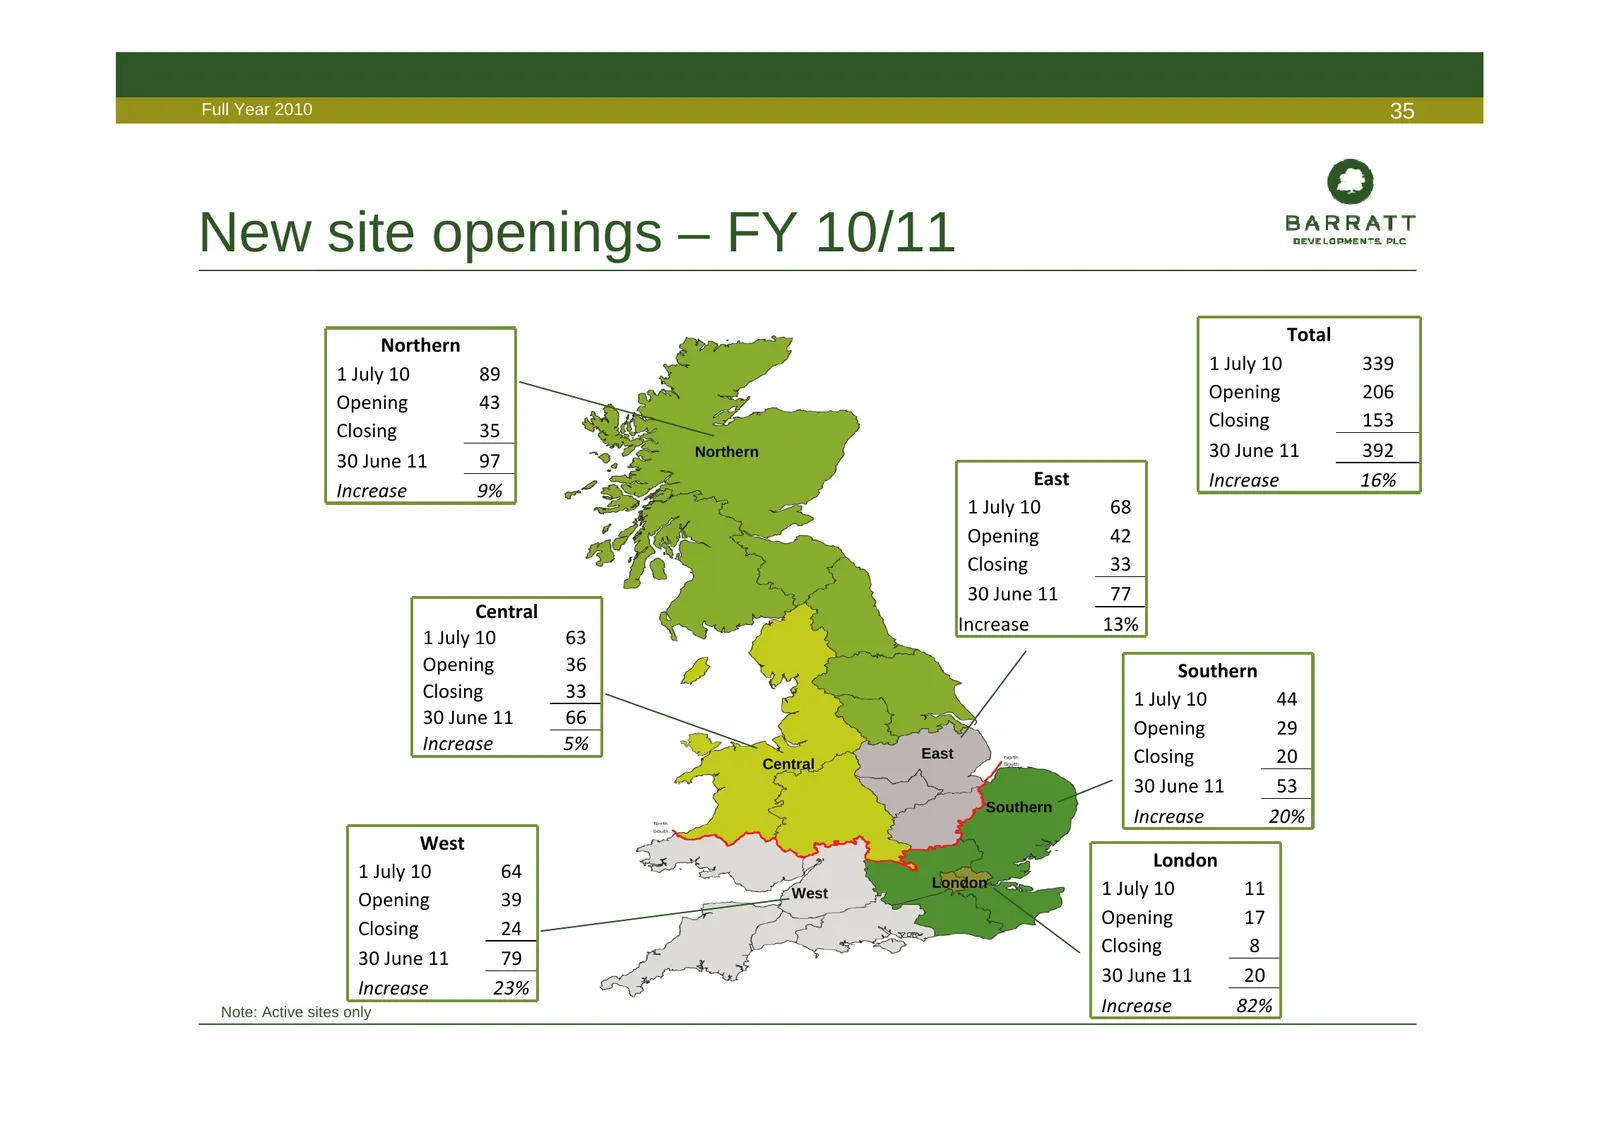
Slide 35: New site openings – FY 10/11
Full Year 2010 35 New site openings – FY 10/11 Total Northern 1 July 10 339 1 July 10 89 Opening 206 Opening 43 Closing 153 Closing 35 Northern 30 June 11 392 30 June 11 97 East Increase 16% Increase 9% 1 July 10 68 Opening 42 Closing 33 30 June 11 77 Central Increase 13% 1 July 10 63 Opening 36 Sou
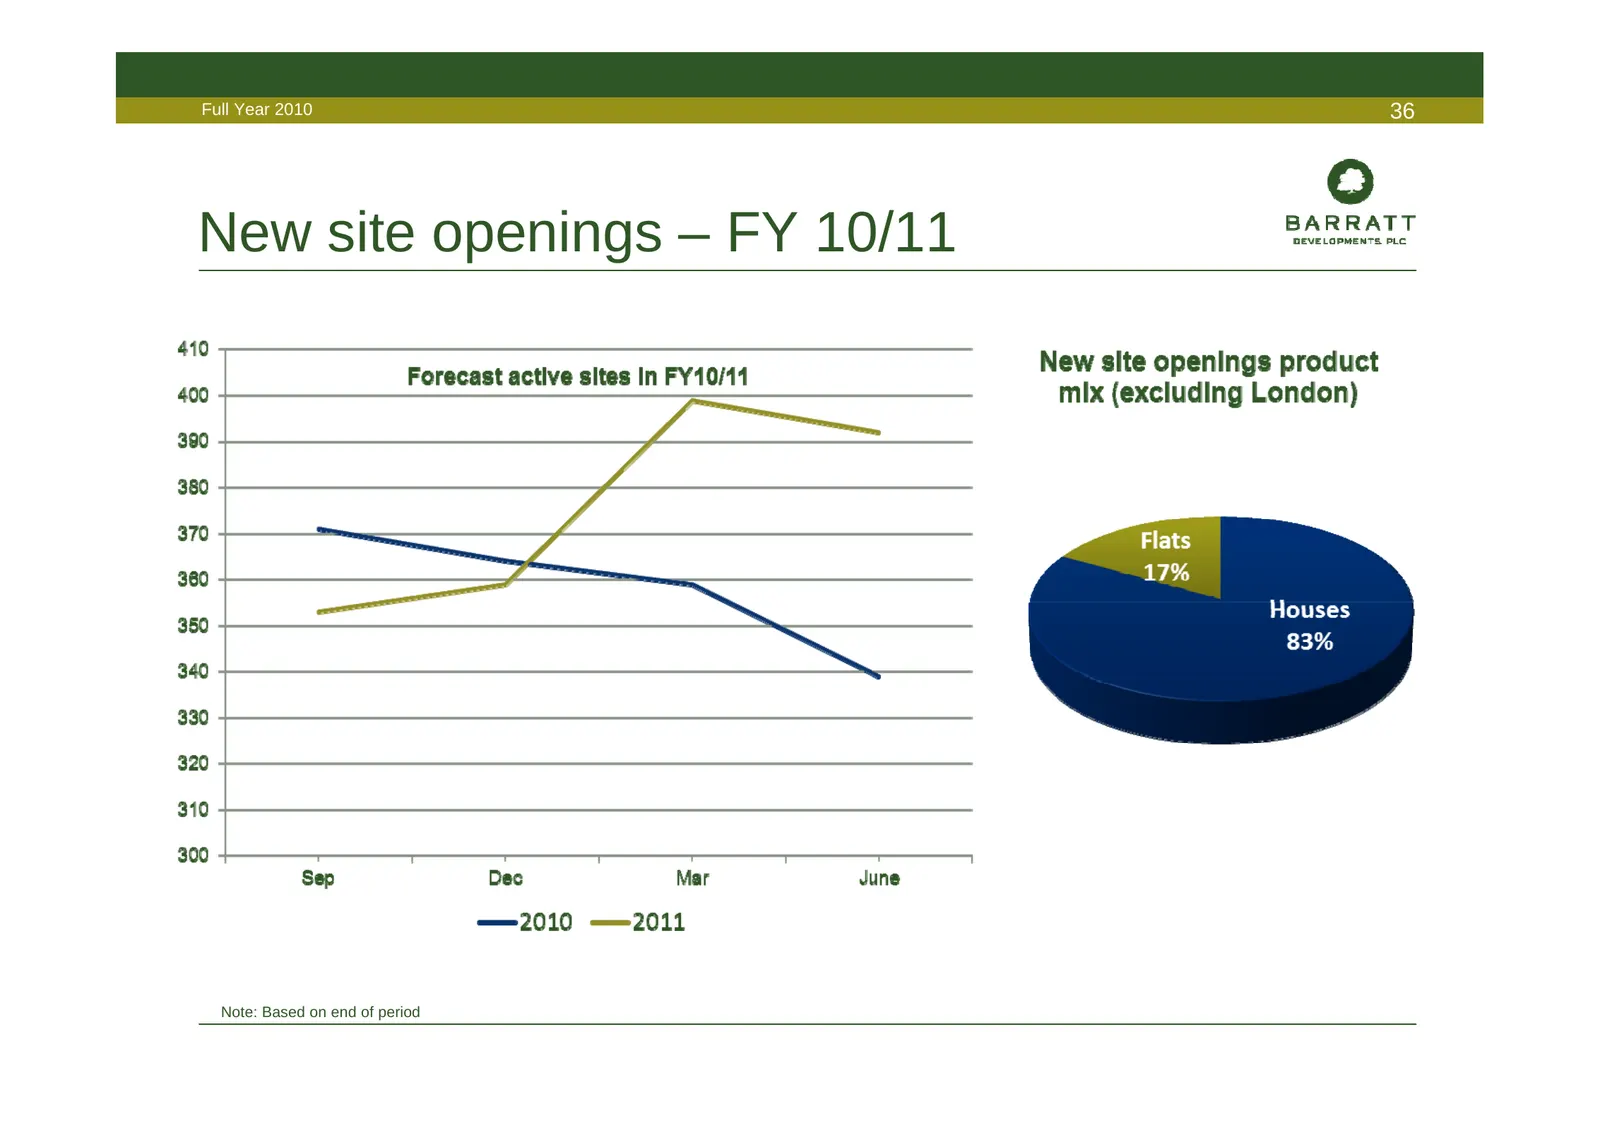
Slide 36: New site openings – FY 10/11
Full Year 2010 36 New site openings – FY 10/11 Note: Based on end of period
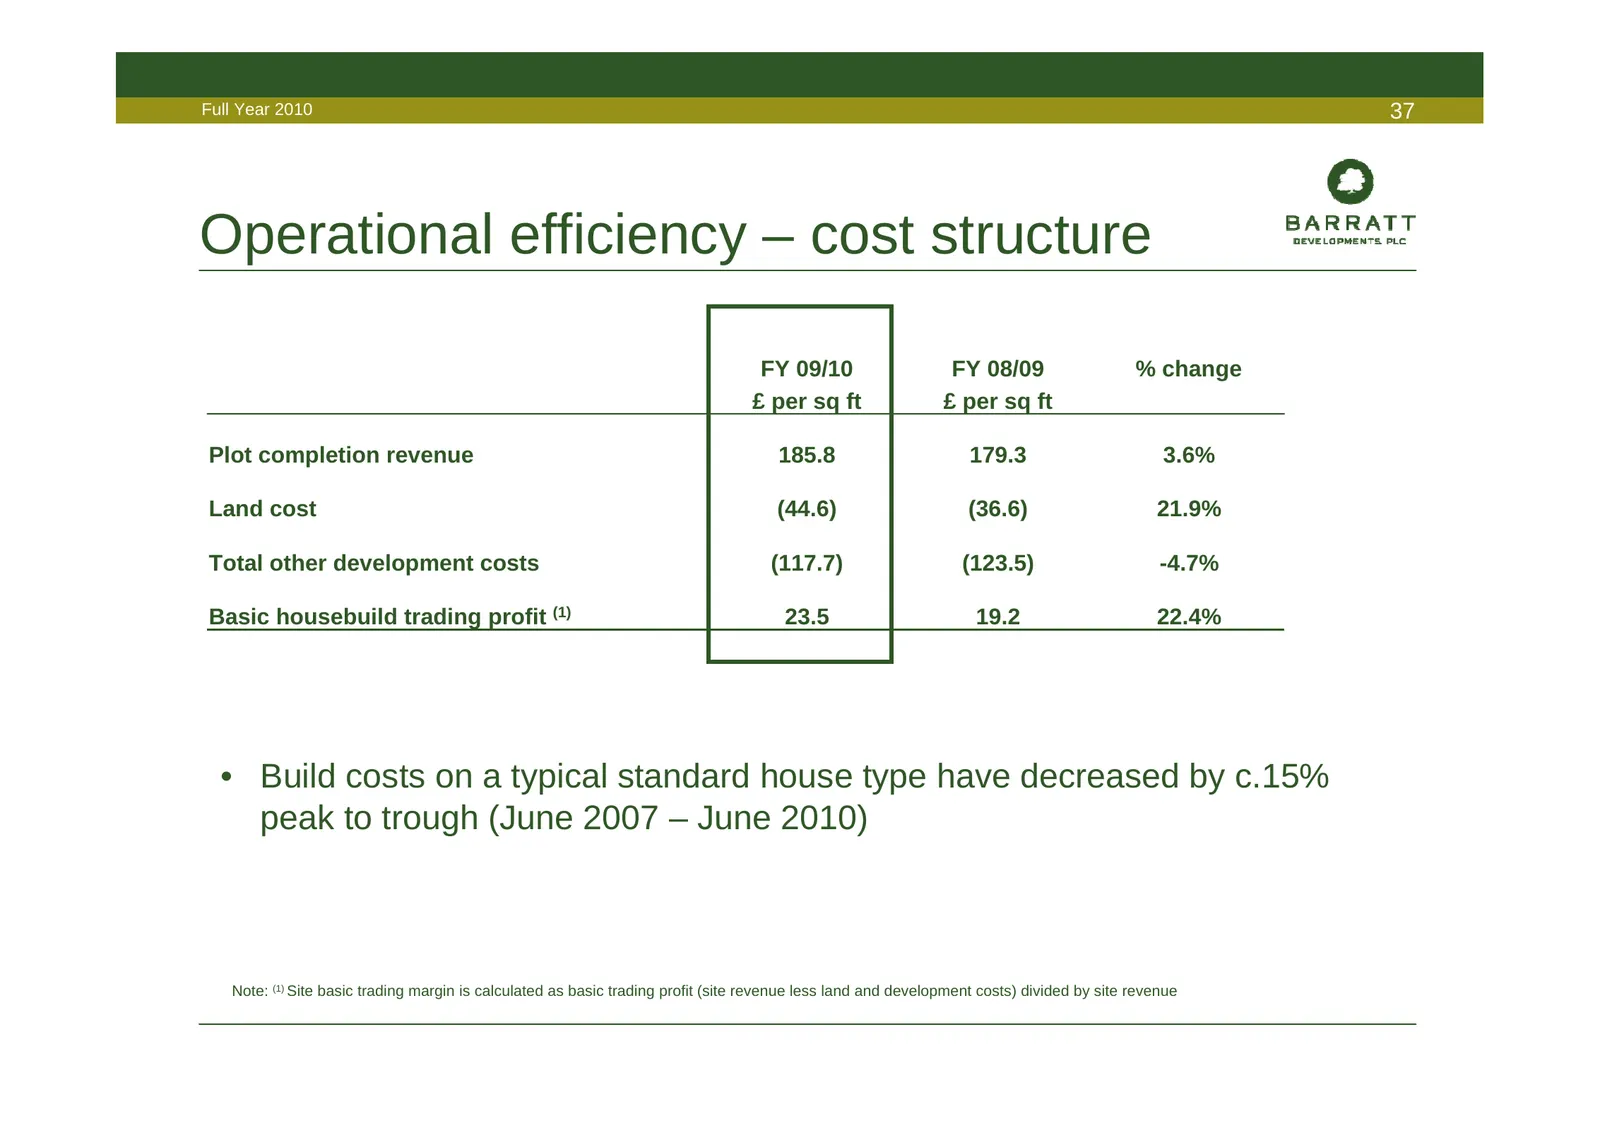
Slide 37: Operational efficiency – cost structure
Full Year 2010 37 Operational efficiency – cost structure FY 09/10 FY 08/09 % change £ per sq ft £ per sq ft Plot completion revenue 185.8 179.3 3.6% Land cost (44.6) (36.6) 21.9% Total other development costs (117.7) (123.5) -4.7% Basic housebuild trading profit (1) 23.5 19.2 22.4% • Build costs on
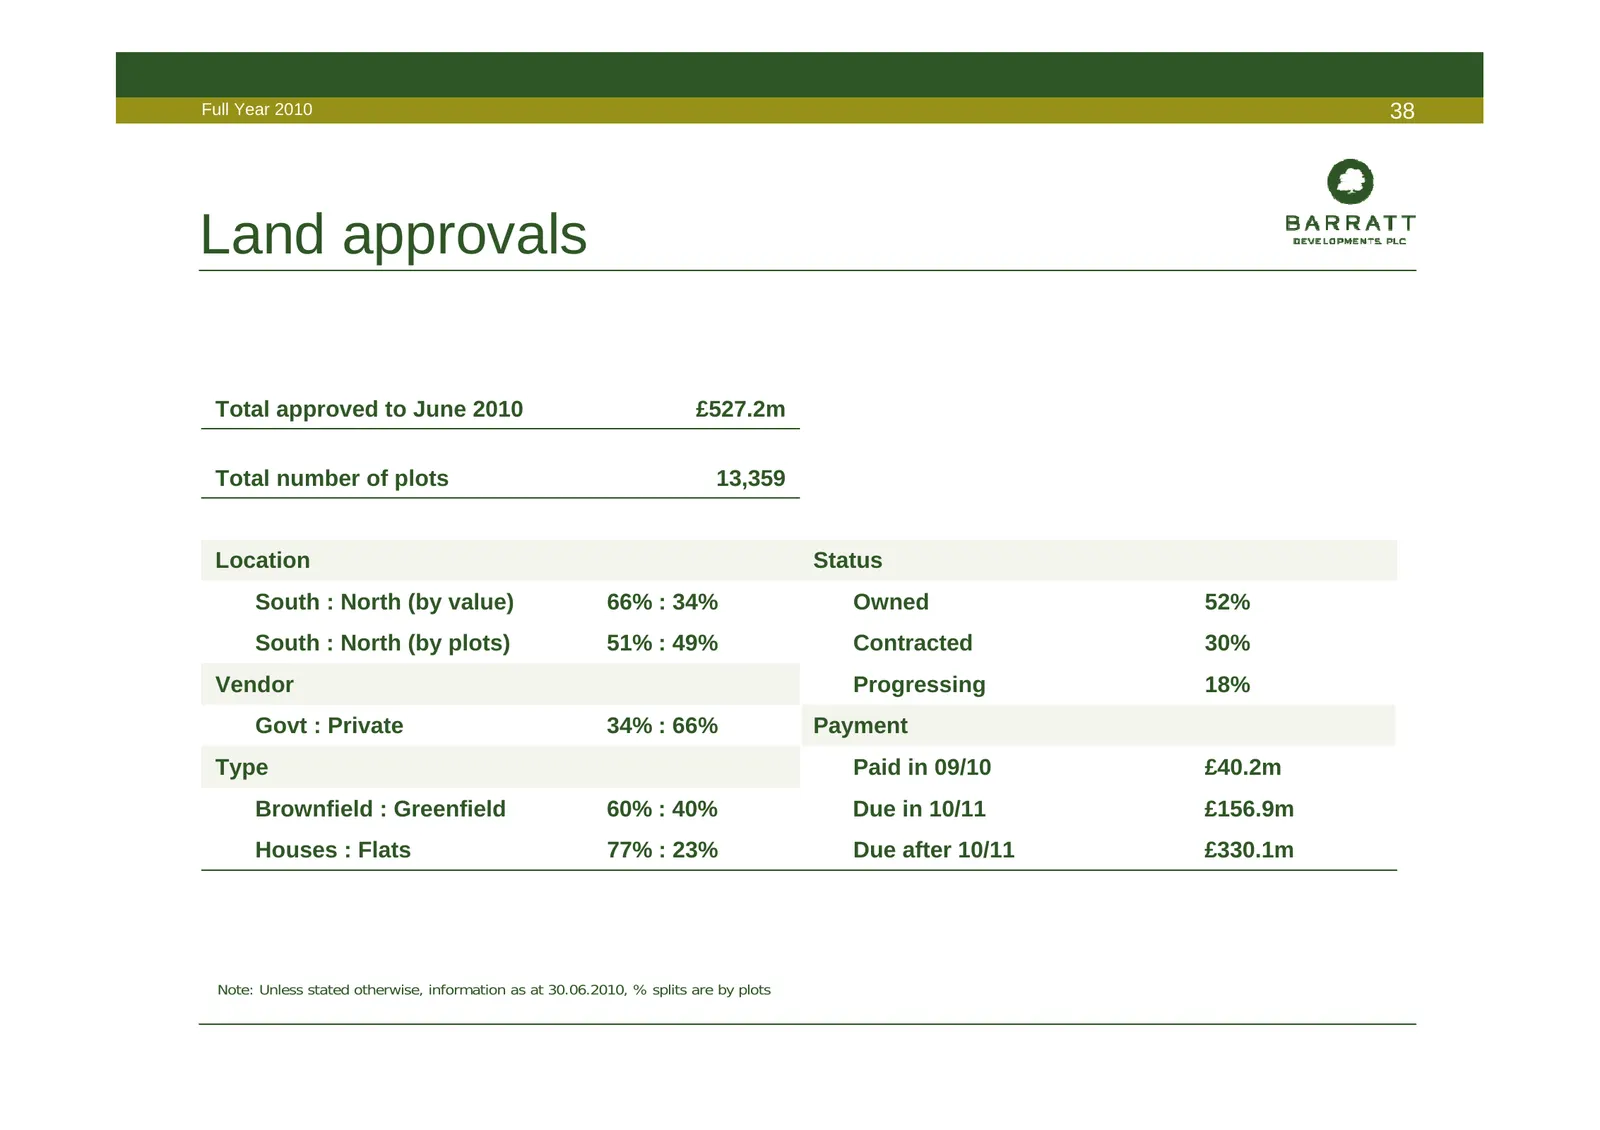
Slide 38: Land approvals
Full Year 2010 38 Land approvals Total approved to June 2010 £527.2m Total number of plots 13,359 Location Status South : North (by value) 66% : 34% Owned 52% South : North (by plots) 51% : 49% Contracted 30% Vendor Progressing 18% Govt : Private 34% : 66% Payment Type Paid in 09/10 £40.2m Brownfiel
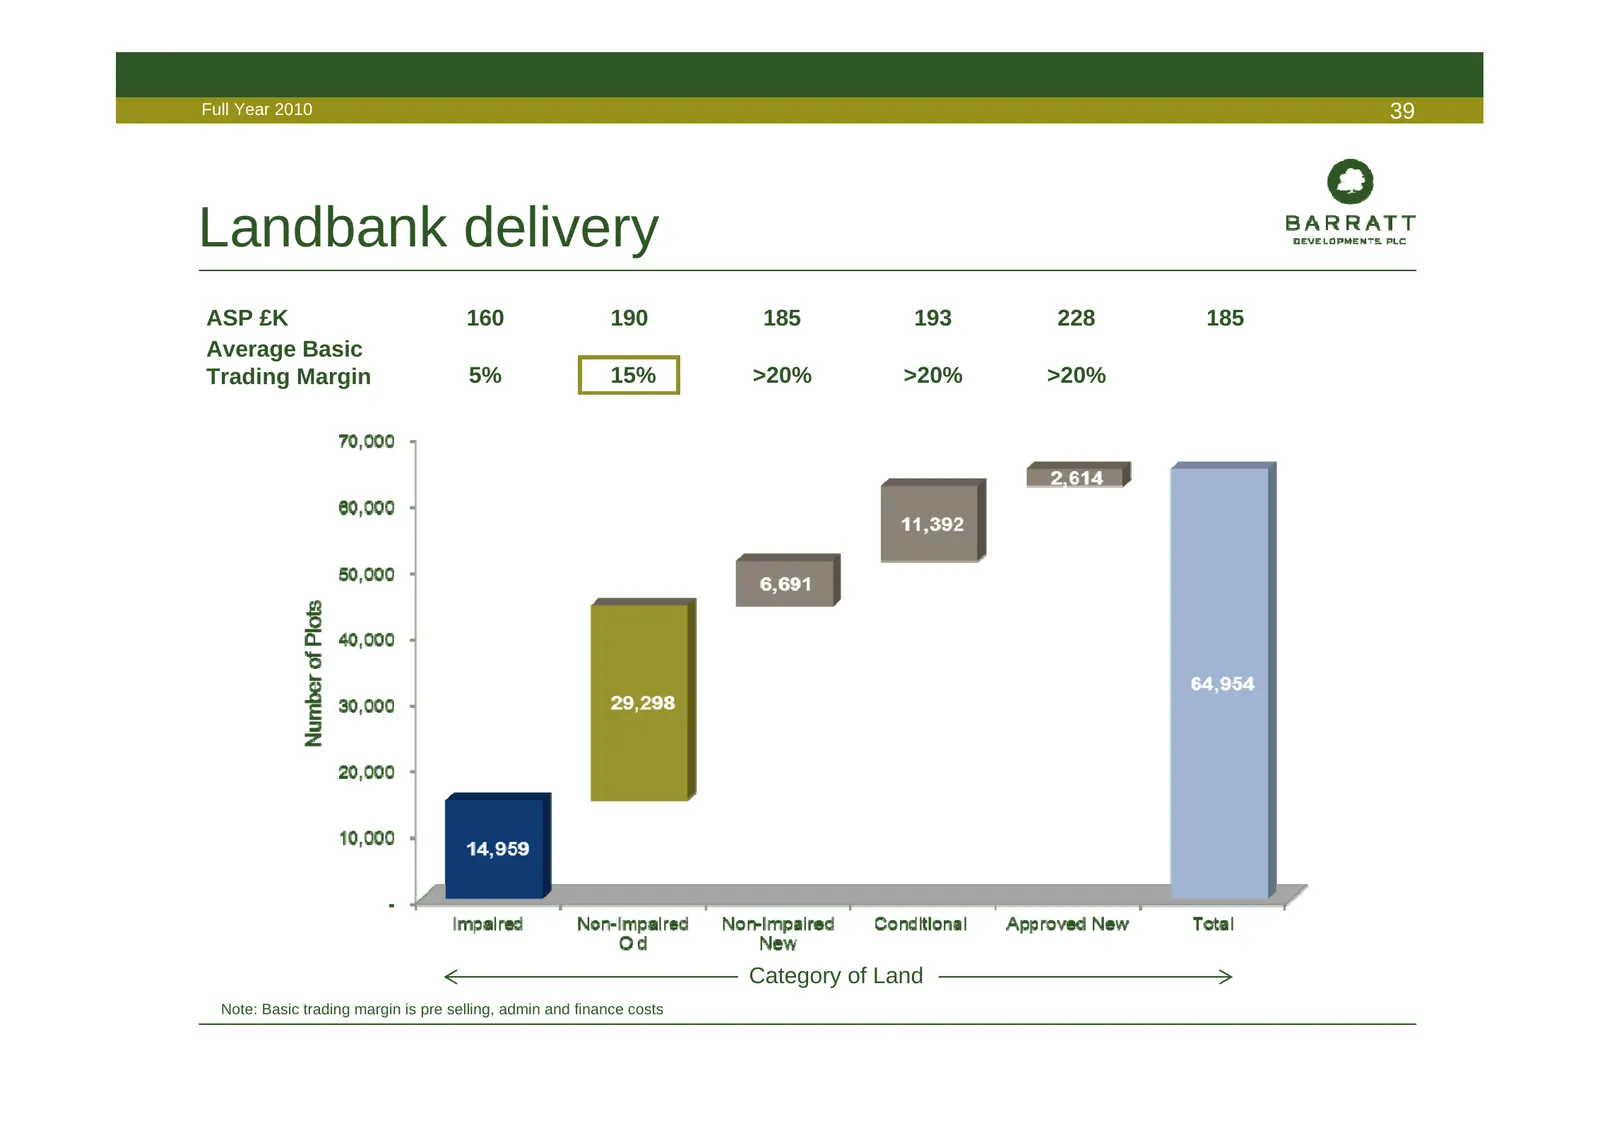
Slide 39: Landbank delivery
Full Year 2010 39 Landbank delivery ASP £K 160 190 185 193 228 185 Average Basic Trading Margin 5% 15% >20% >20% >20% Category of Land Note: Basic trading margin is pre selling, admin and finance costs
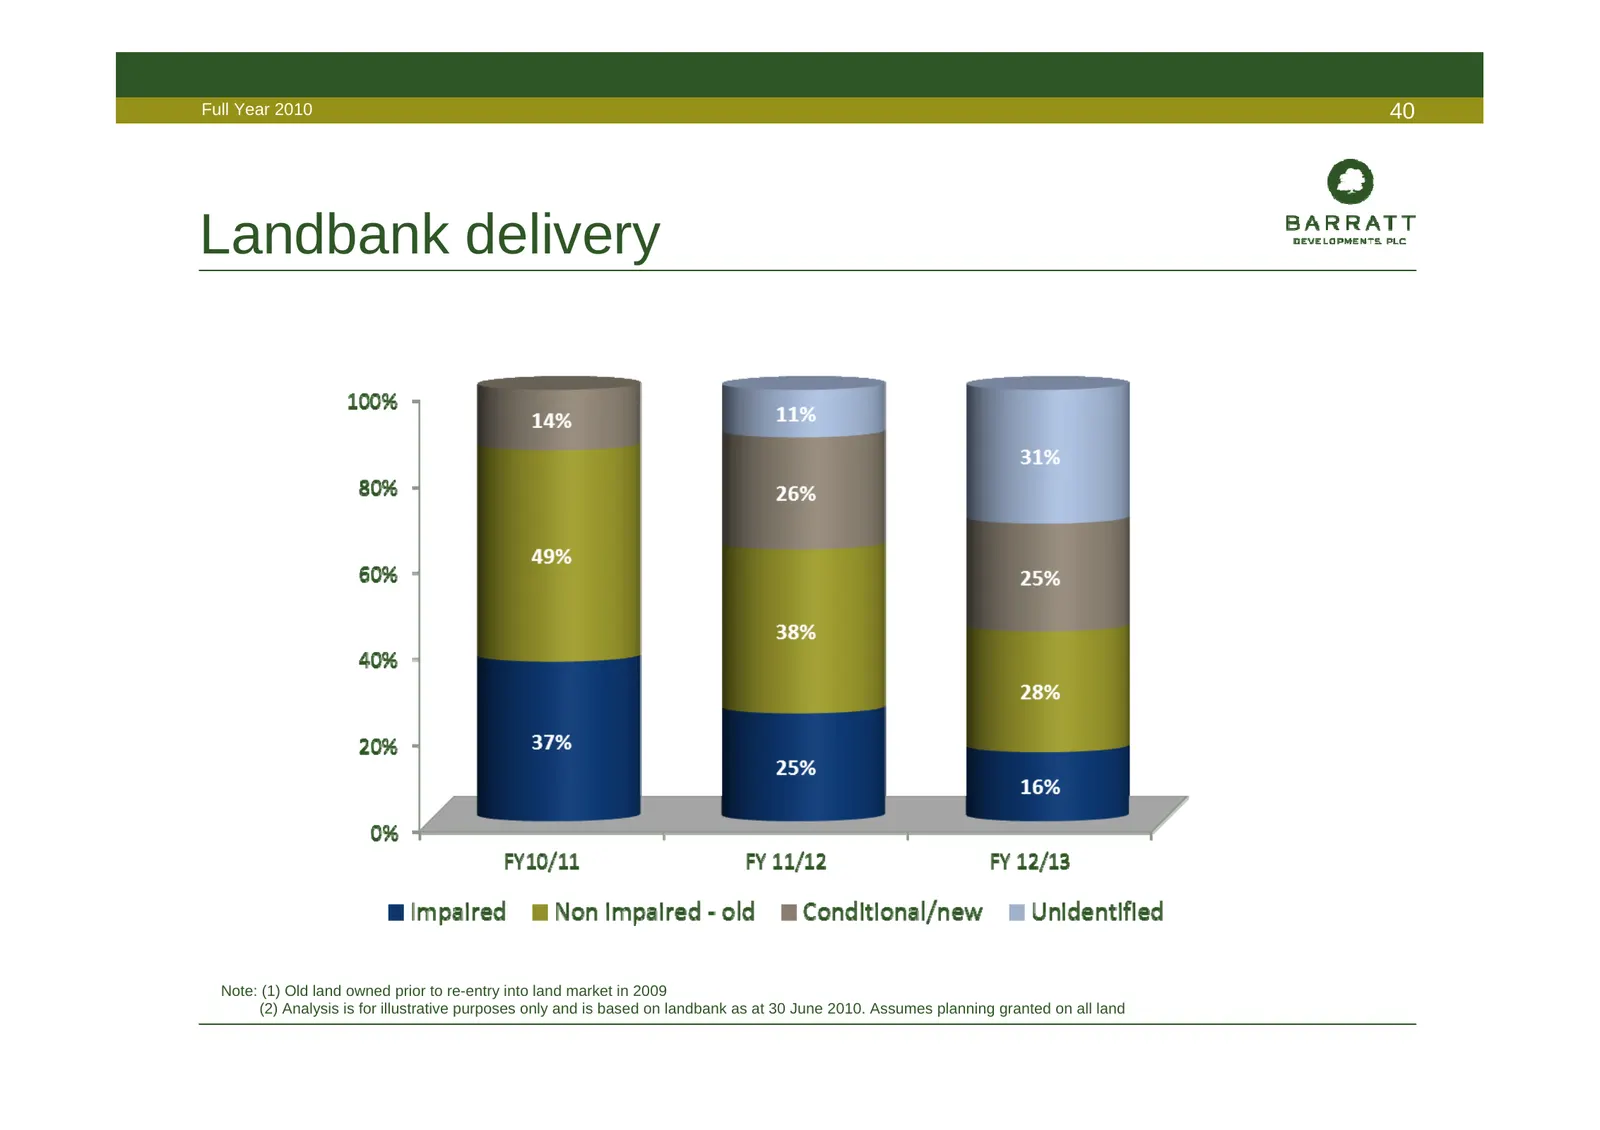
Slide 40: Landbank delivery
Full Year 2010 40 Landbank delivery Note: (1) Old land owned prior to re-entry into land market in 2009 (2) Analysis is for illustrative purposes only and is based on landbank as at 30 June 2010. Assumes planning granted on all land
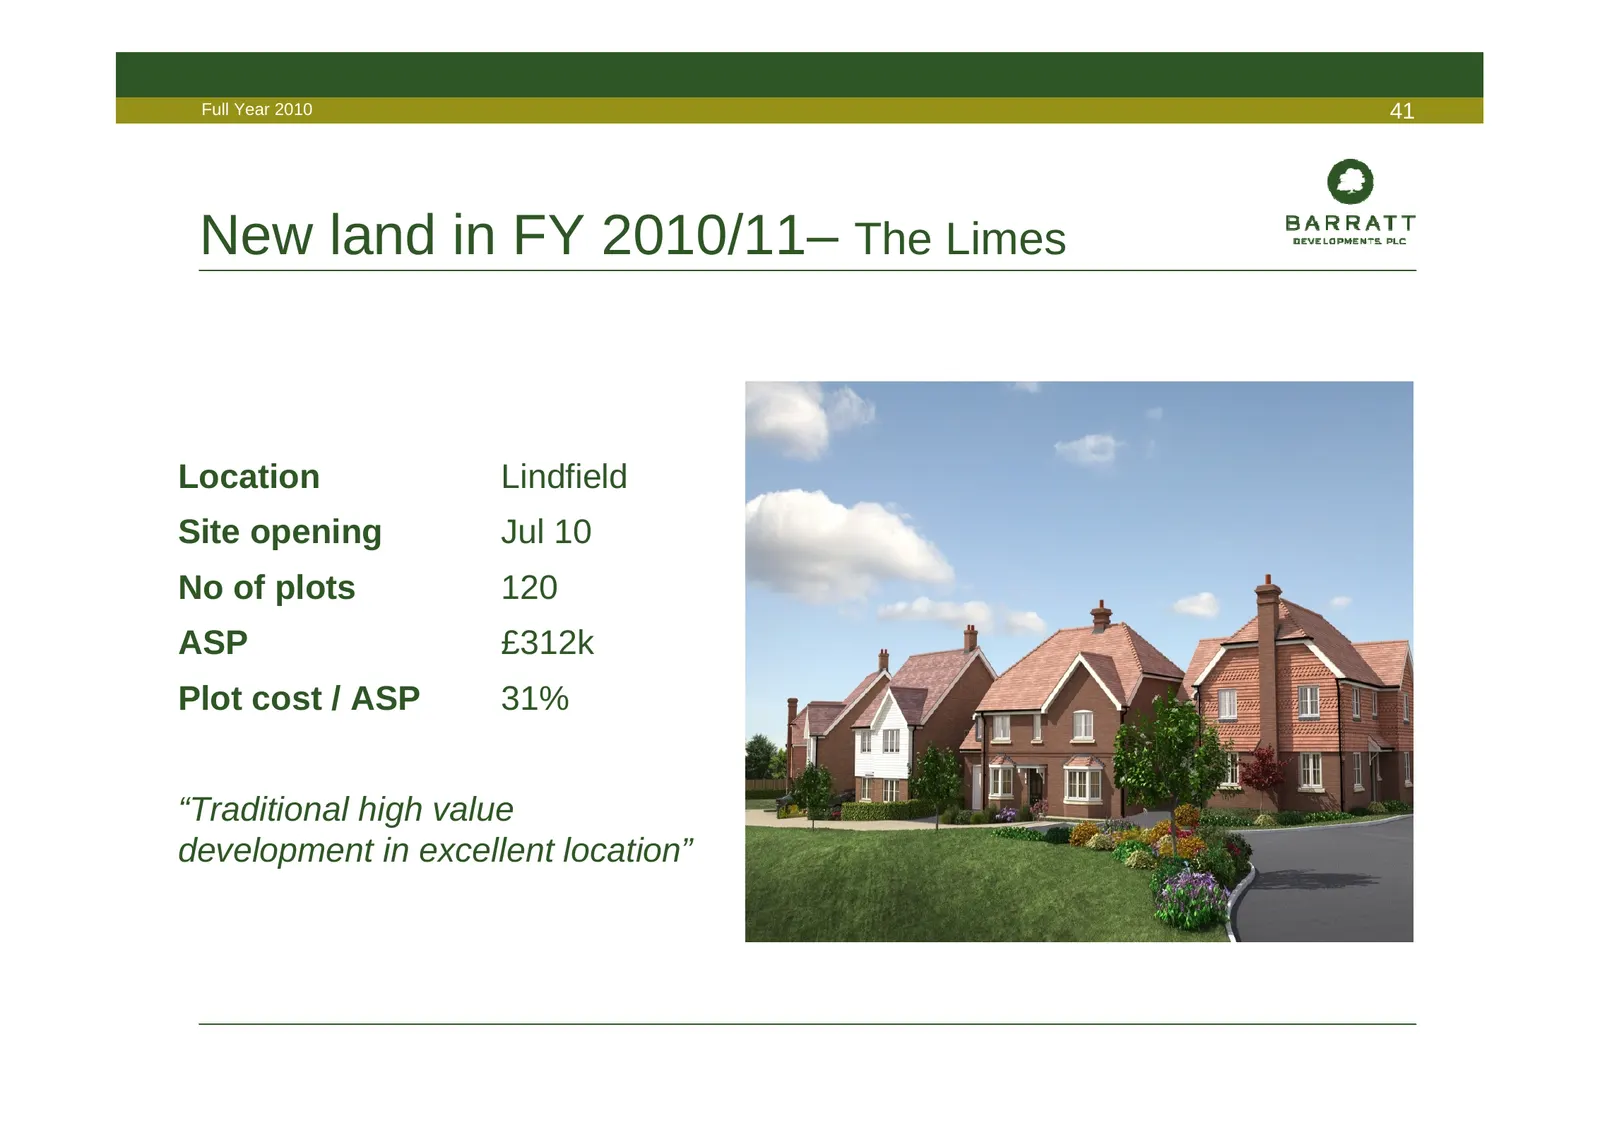
Slide 41: New land in FY 2010/11 – The Limes
Full Year 2010 41 New land in FY 2010/11– The Limes Location Lindfield Site opening Jul 10 No of plots 120 ASP £312k Plot cost / ASP 31% “Traditional high value development in excellent location”
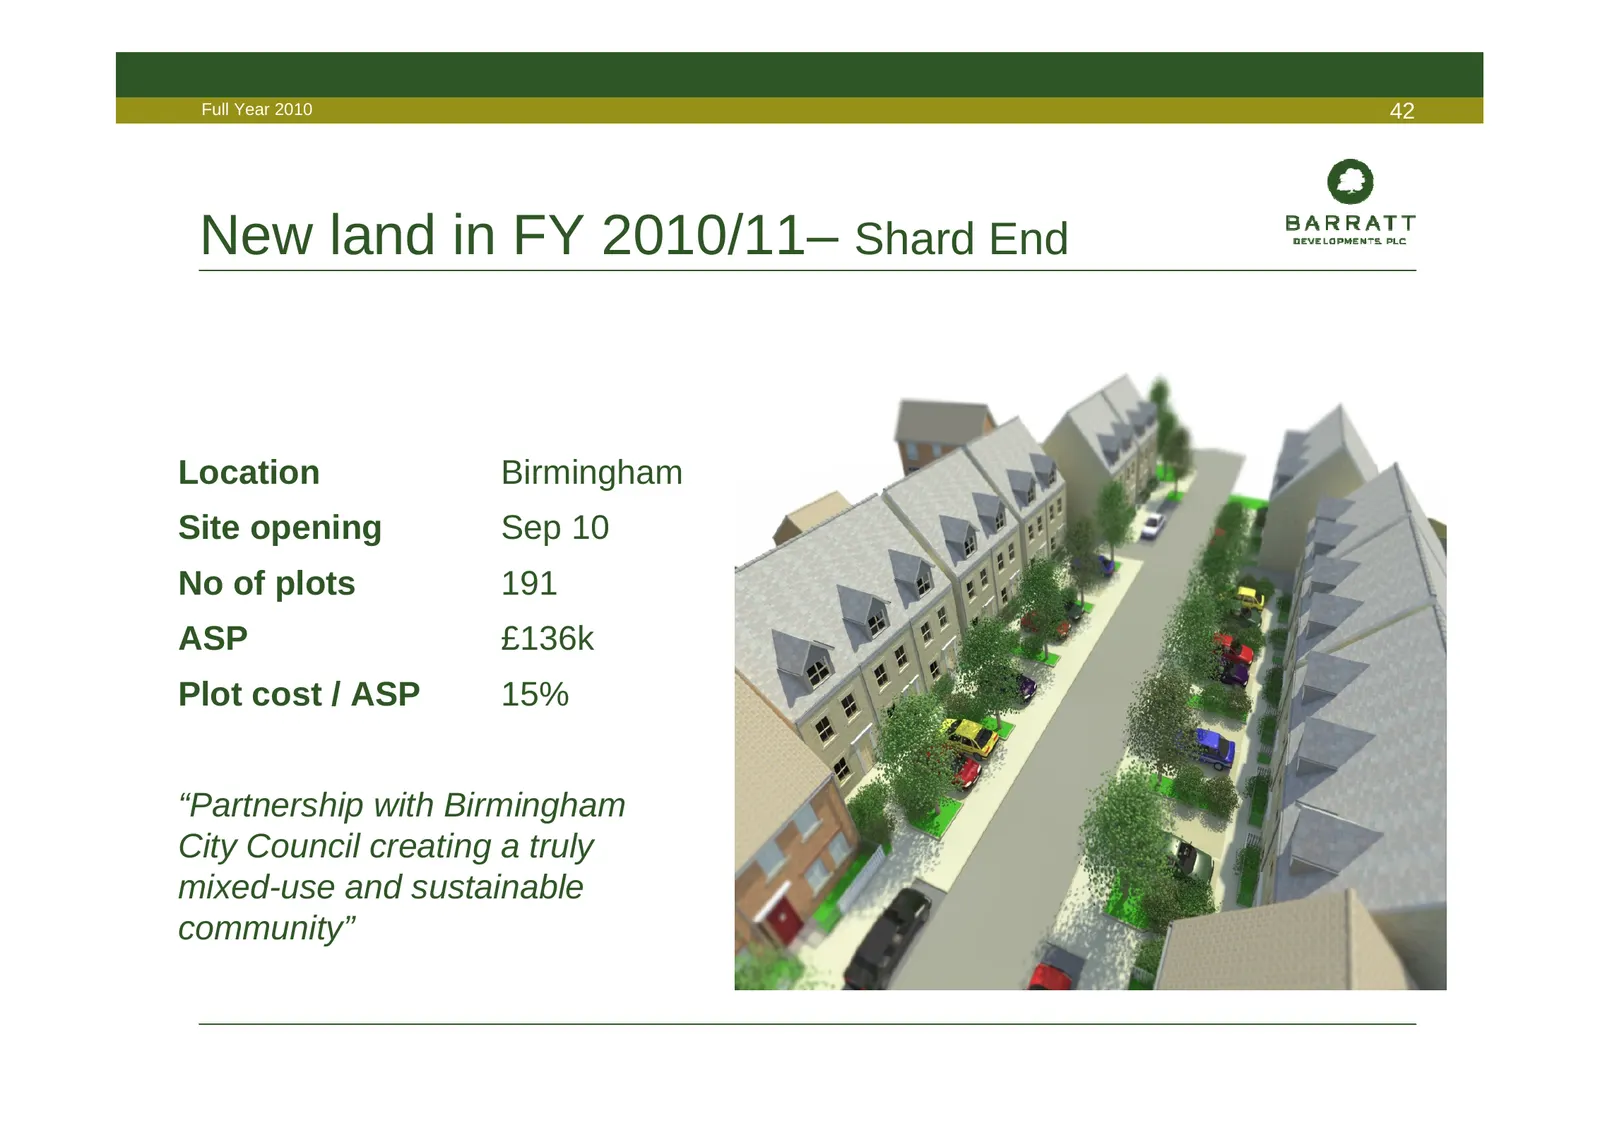
Slide 42: New land in FY 2010/11 – Shard End
Full Year 2010 42 New land in FY 2010/11– Shard End Location Birmingham Site opening Sep 10 No of plots 191 ASP £136k Plot cost / ASP 15% “Partnership with Birmingham City Council creating a truly mixed-use and sustainable community”
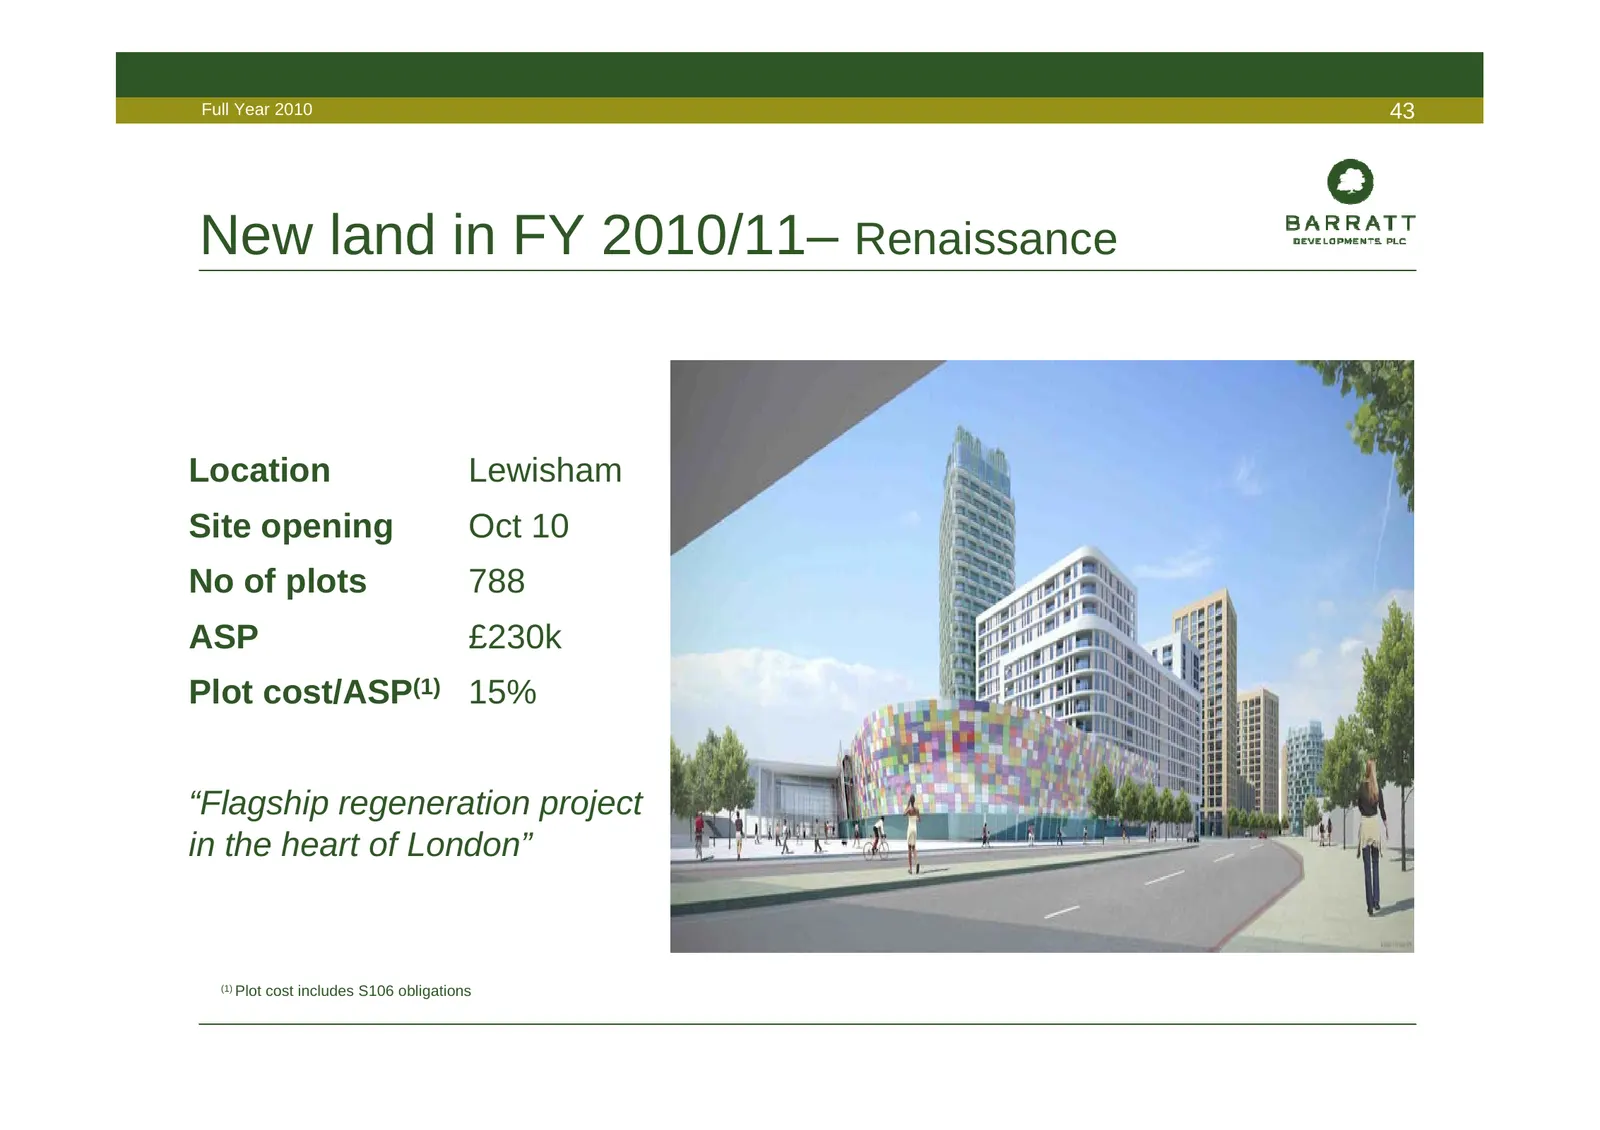
Slide 43: New land in FY 2010/11 – Renaissance
Full Year 2010 43 New land in FY 2010/11– Renaissance Location Lewisham Site opening Oct 10 No of plots 788 ASP £230k Plot cost/ASP(1) 15% “Flagship regeneration project in the heart of London” (1) Plot cost includes S106 obligations
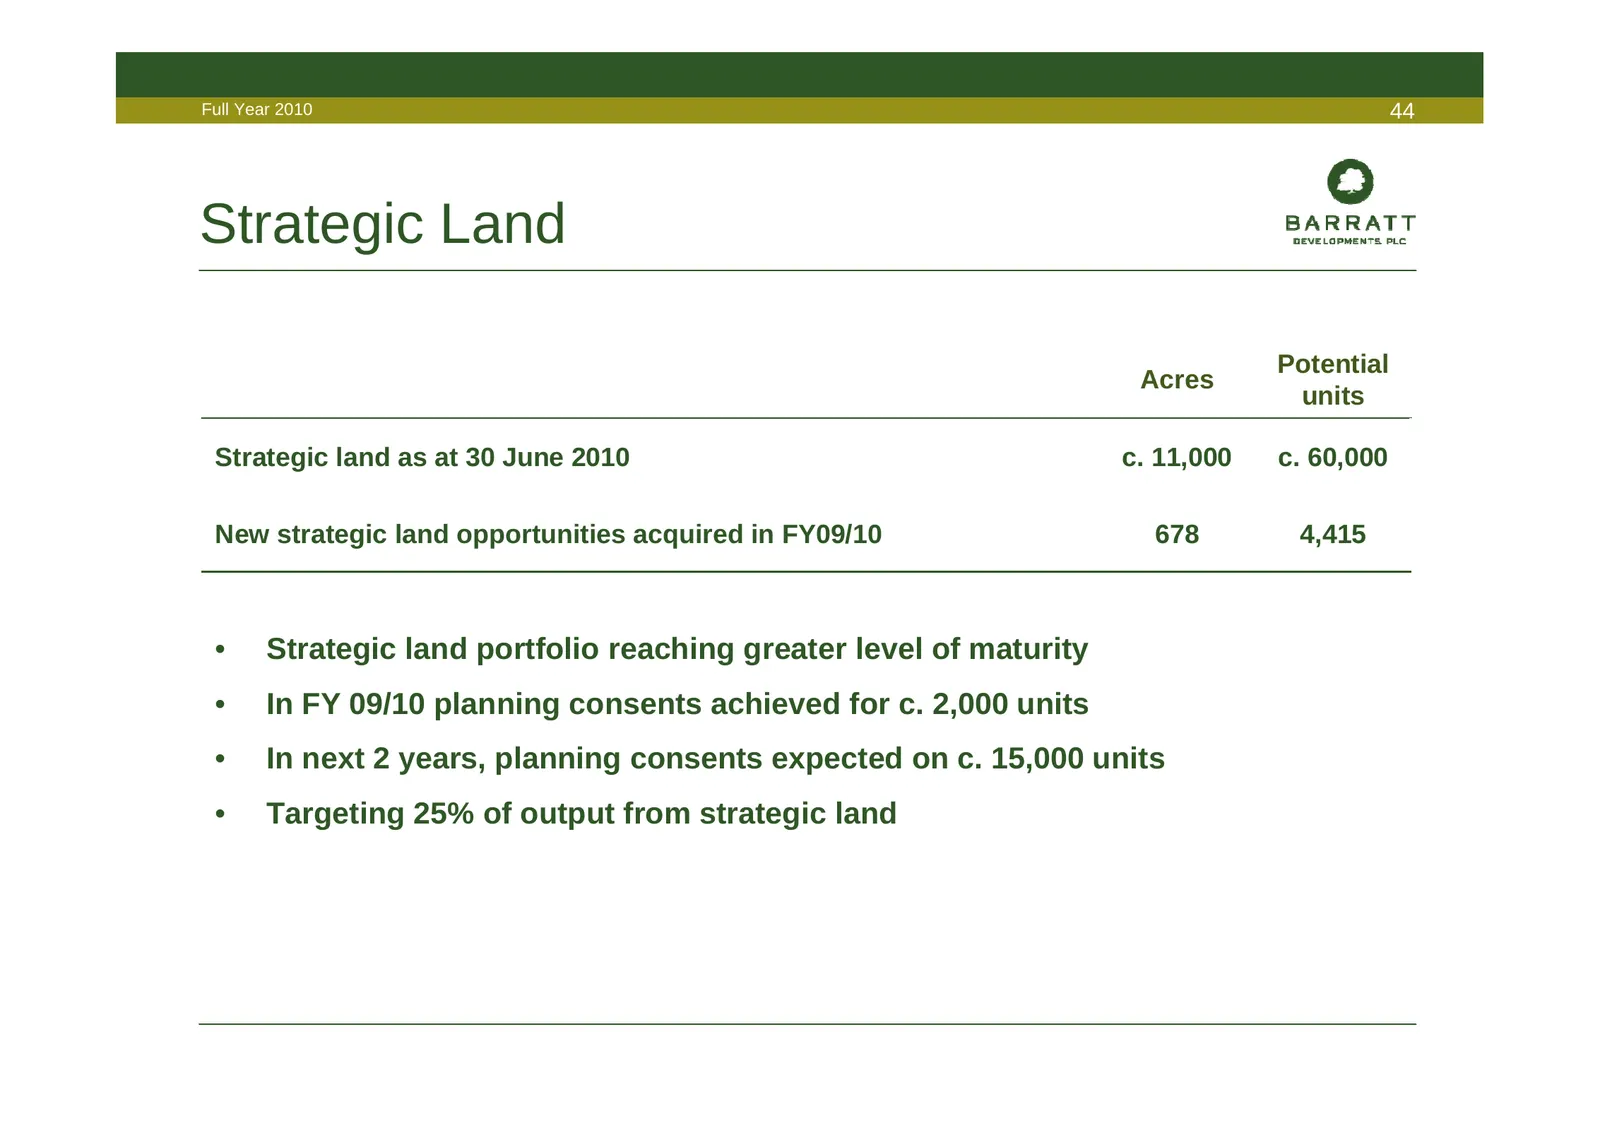
Slide 44: Strategic Land
Full Year 2010 44 Strategic Land Potential Acres units Strategic land as at 30 June 2010 c. 11,000 c. 60,000 New strategic land opportunities acquired in FY09/10 678 4,415 • Strategic land portfolio reaching greater level of maturity • In FY 09/10 planning consents achieved for c. 2,000 units • In n
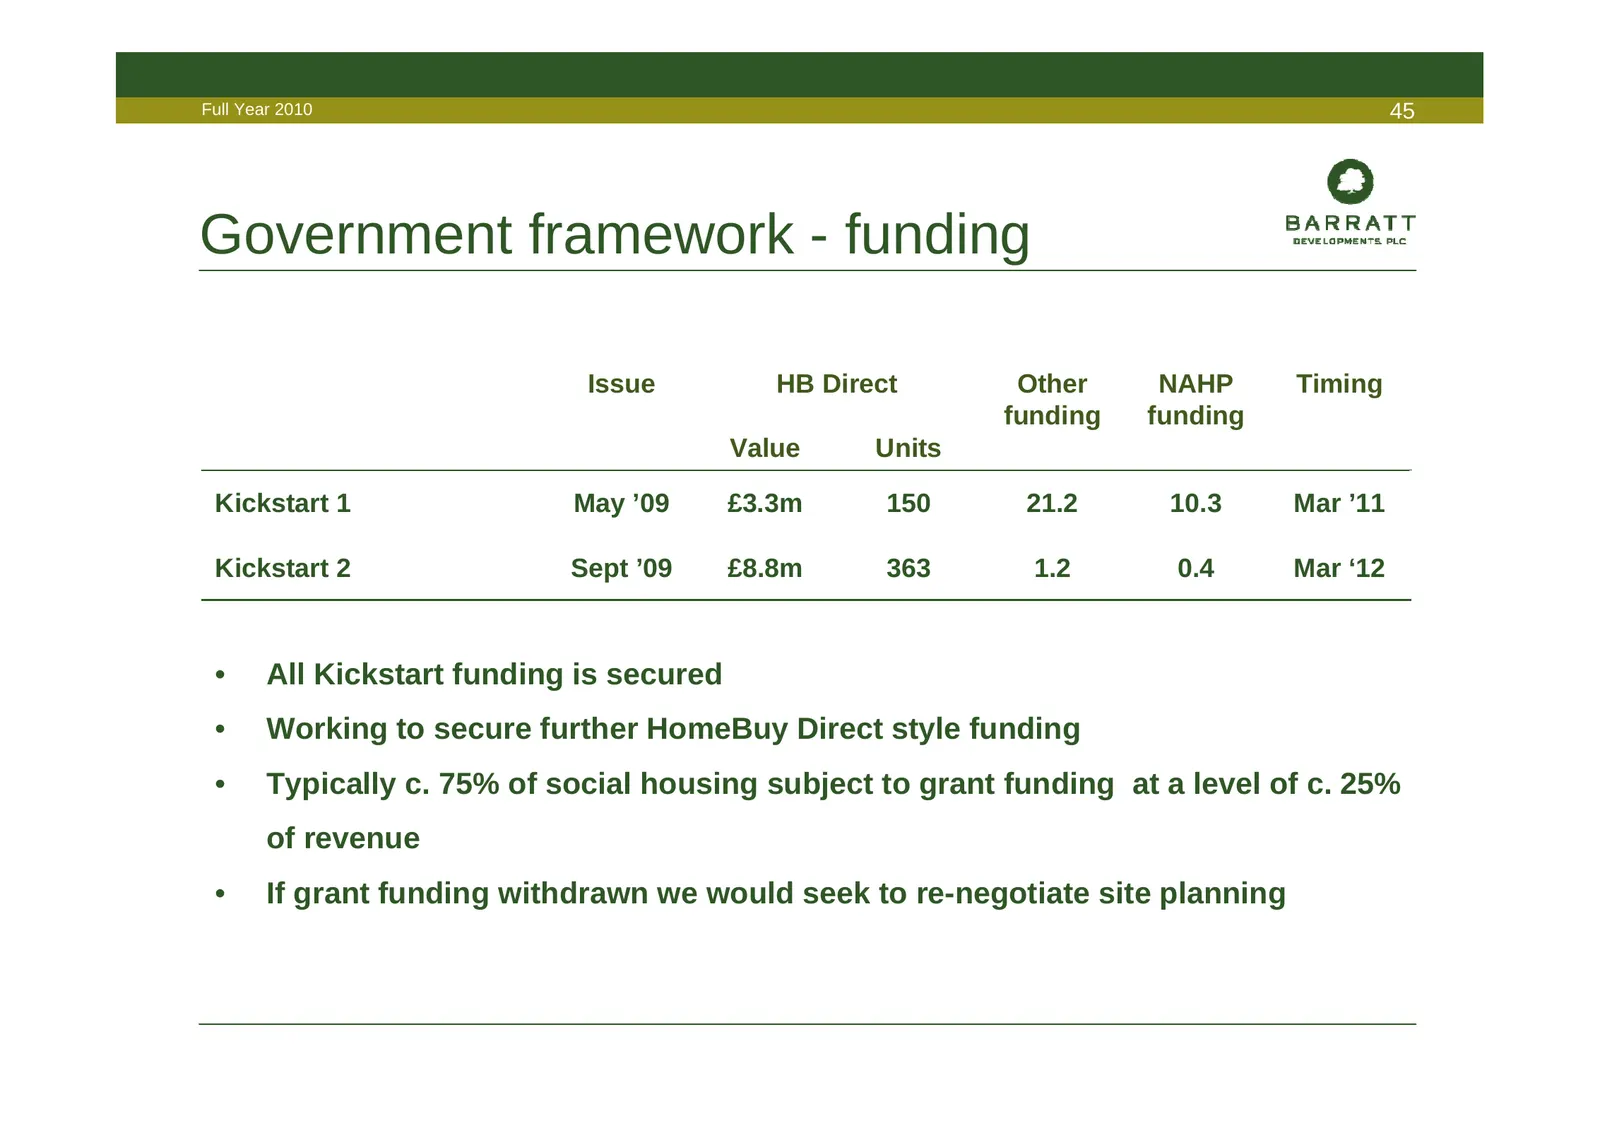
Slide 45: Government framework - funding
Full Year 2010 45 Government framework - funding Issue HB Direct Other NAHP Timing funding funding Value Units Kickstart 1 May ’09 £3.3m 150 21.2 10.3 Mar ’11 Kickstart 2 Sept ’09 £8.8m 363 1.2 0.4 Mar ‘12 • All Kickstart funding is secured • Working to secure further HomeBuy Direct style funding •
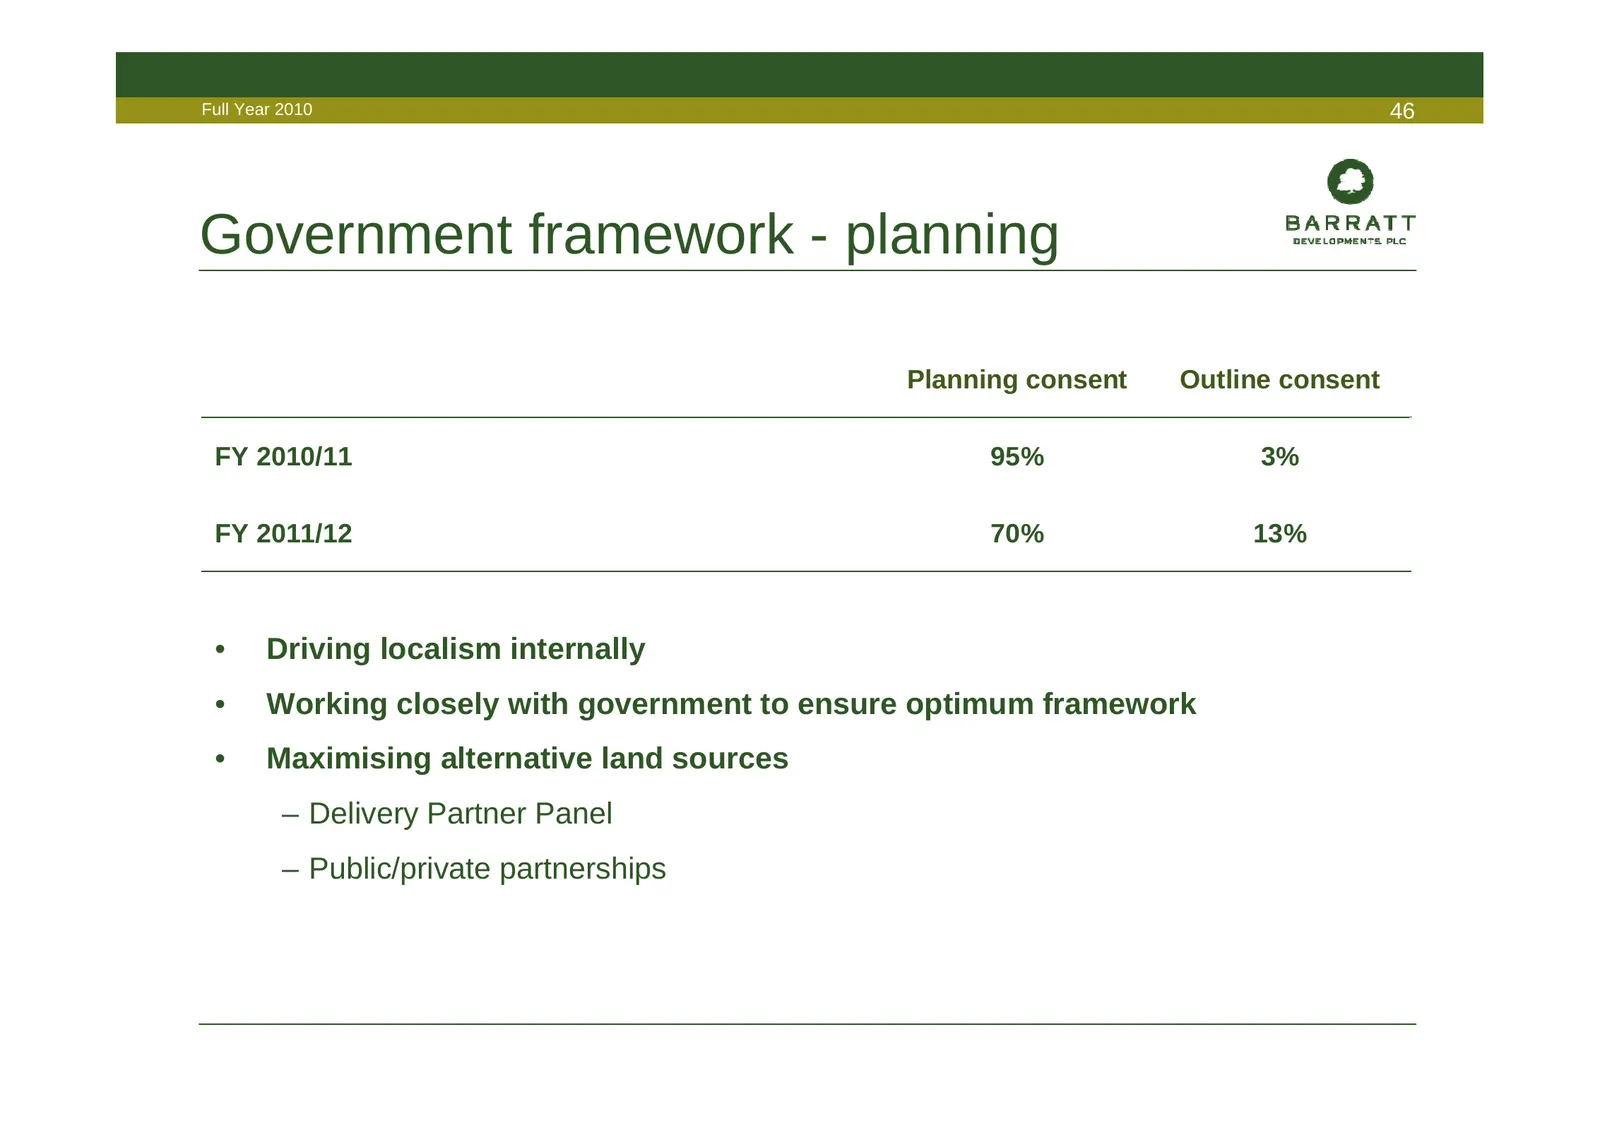
Slide 46: Government framework - planning
Full Year 2010 46 Government framework - planning Planning consent Outline consent FY 2010/11 95% 3% FY 2011/12 70% 13% • Driving localism internally • Working closely with government to ensure optimum framework • Maximising alternative land sources – Delivery Partner Panel – Public/private partners
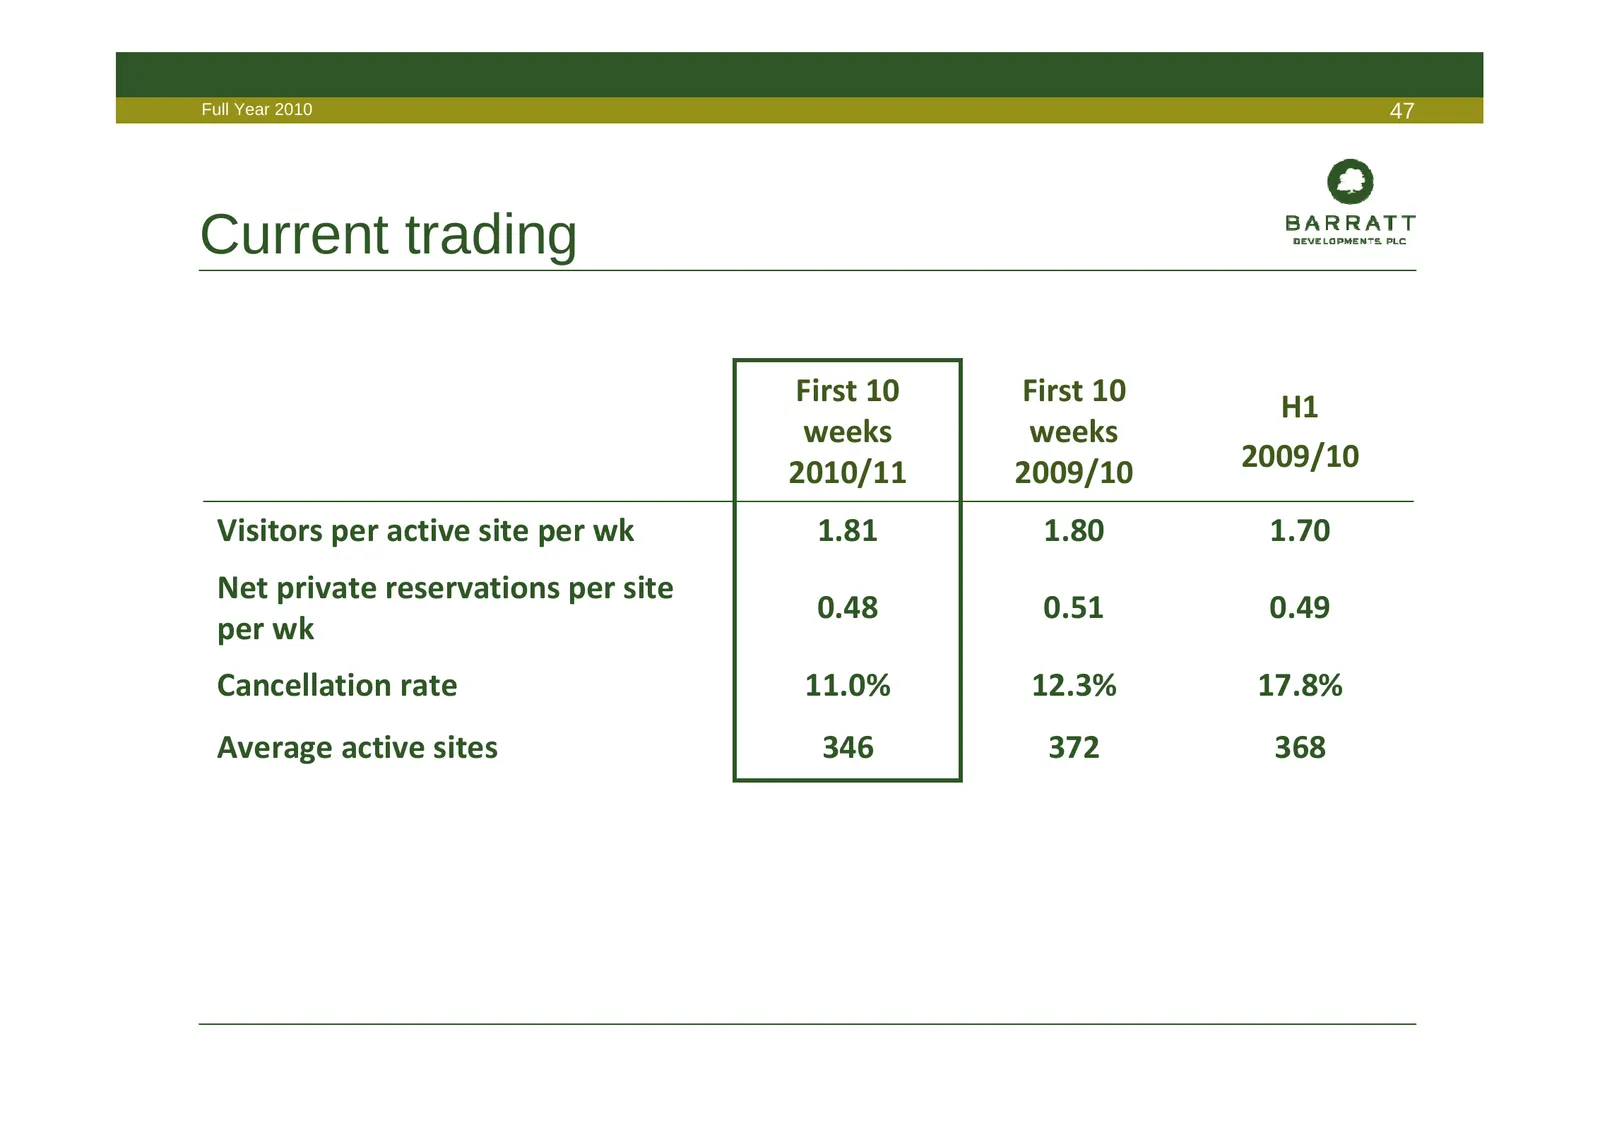
Slide 47: Current trading
Full Year 2010 47 Current trading First 10 First 10 H1 weeks weeks 2010/11 2009/10 2009/10 Visitors per active site per wk 1.81 1.80 1.70 Net private reservations per site 0.48 0.51 0.49 per wk Cancellation rate 11.0% 12.3% 17.8% Average active sites 346 372 368
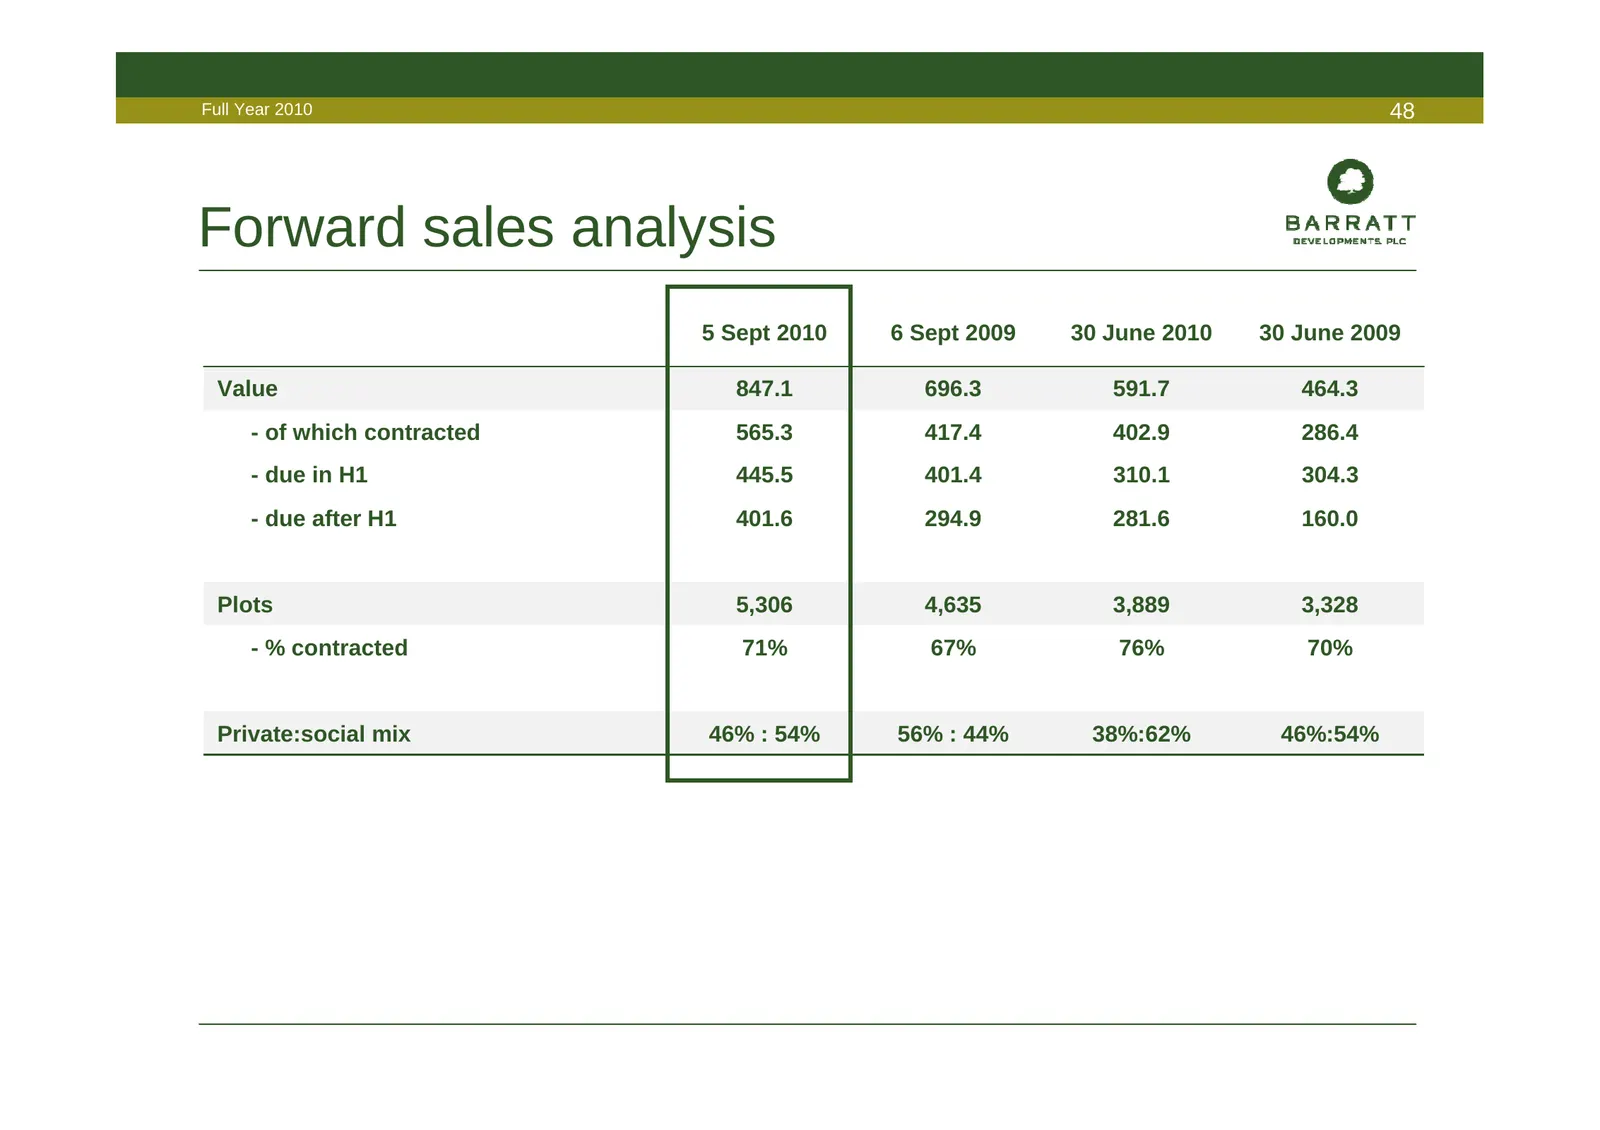
Slide 48: Forward sales analysis
Full Year 2010 48 Forward sales analysis 5 Sept 2010 6 Sept 2009 30 June 2010 30 June 2009 Value 847.1 696.3 591.7 464.3 - of which contracted 565.3 417.4 402.9 286.4 - due in H1 445.5 401.4 310.1 304.3 - due after H1 401.6 294.9 281.6 160.0 Plots 5,306 4,635 3,889 3,328 - % contracted 71% 67% 76% 7
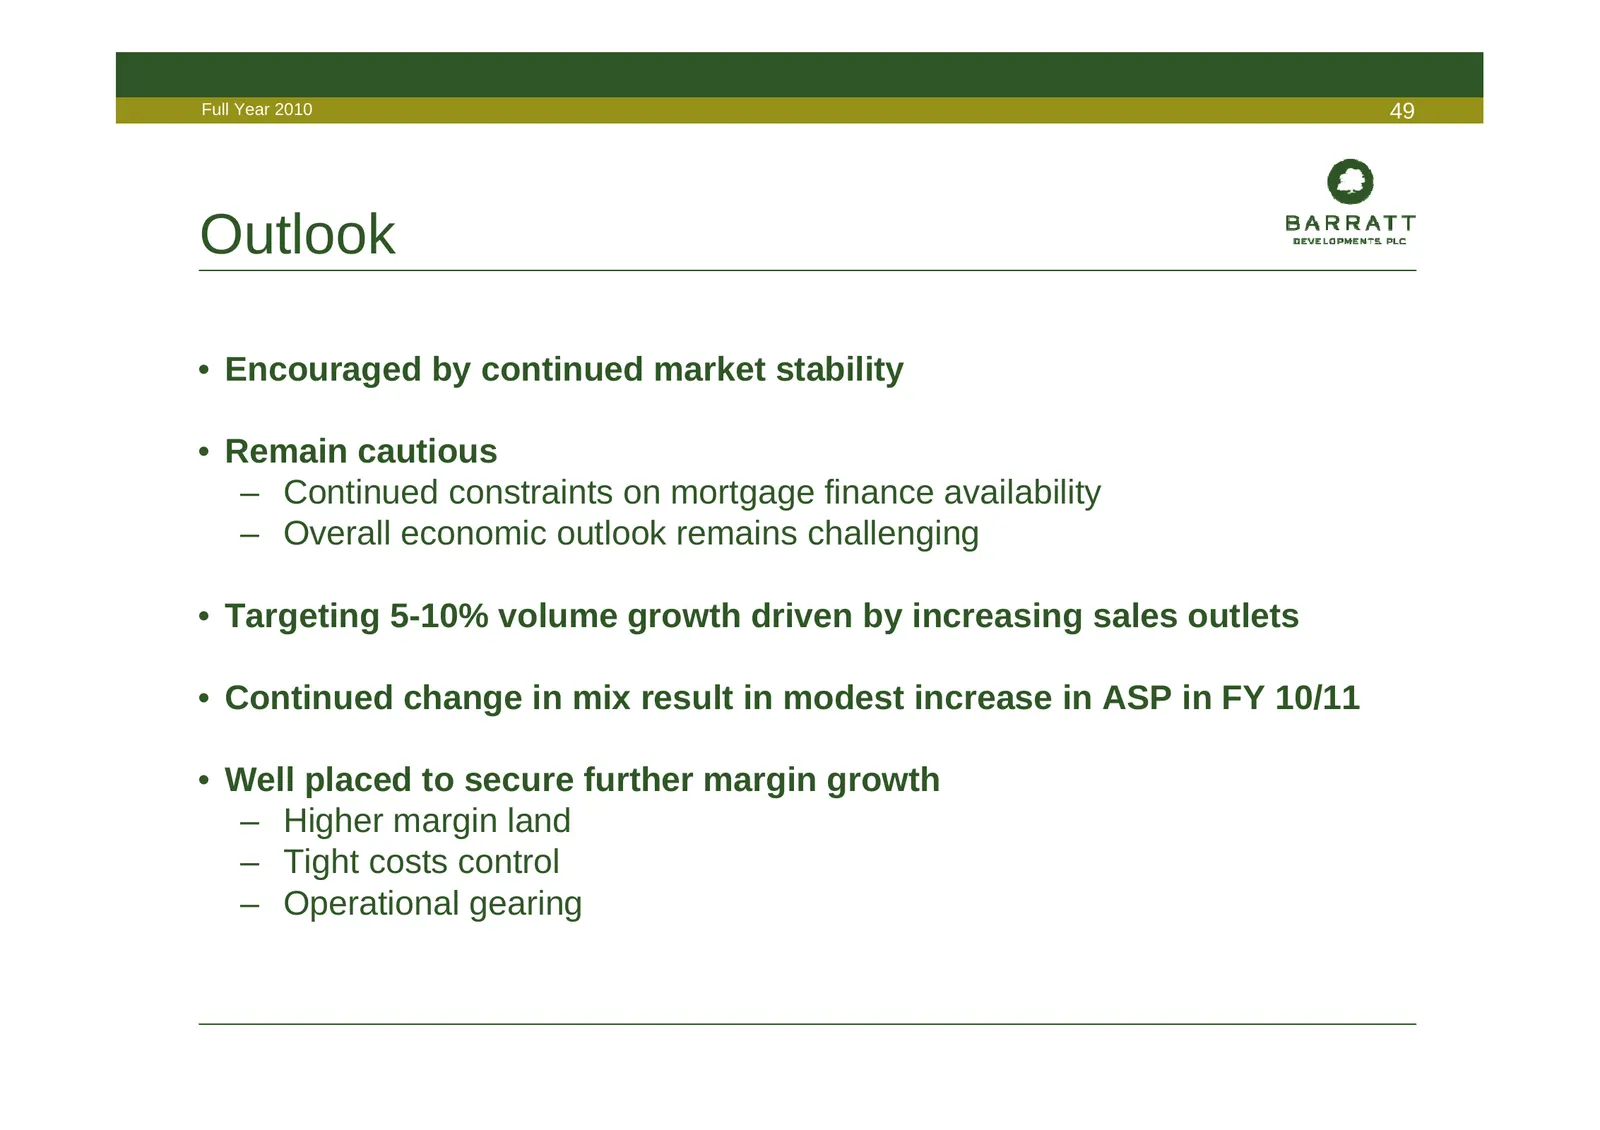
Slide 49: Outlook
Full Year 2010 49 Outlook • Encouraged by continued market stability • Remain cautious – Continued constraints on mortgage finance availability – Overall economic outlook remains challenging • Targeting 5-10% volume growth driven by increasing sales outlets • Continued change in mix result in modest
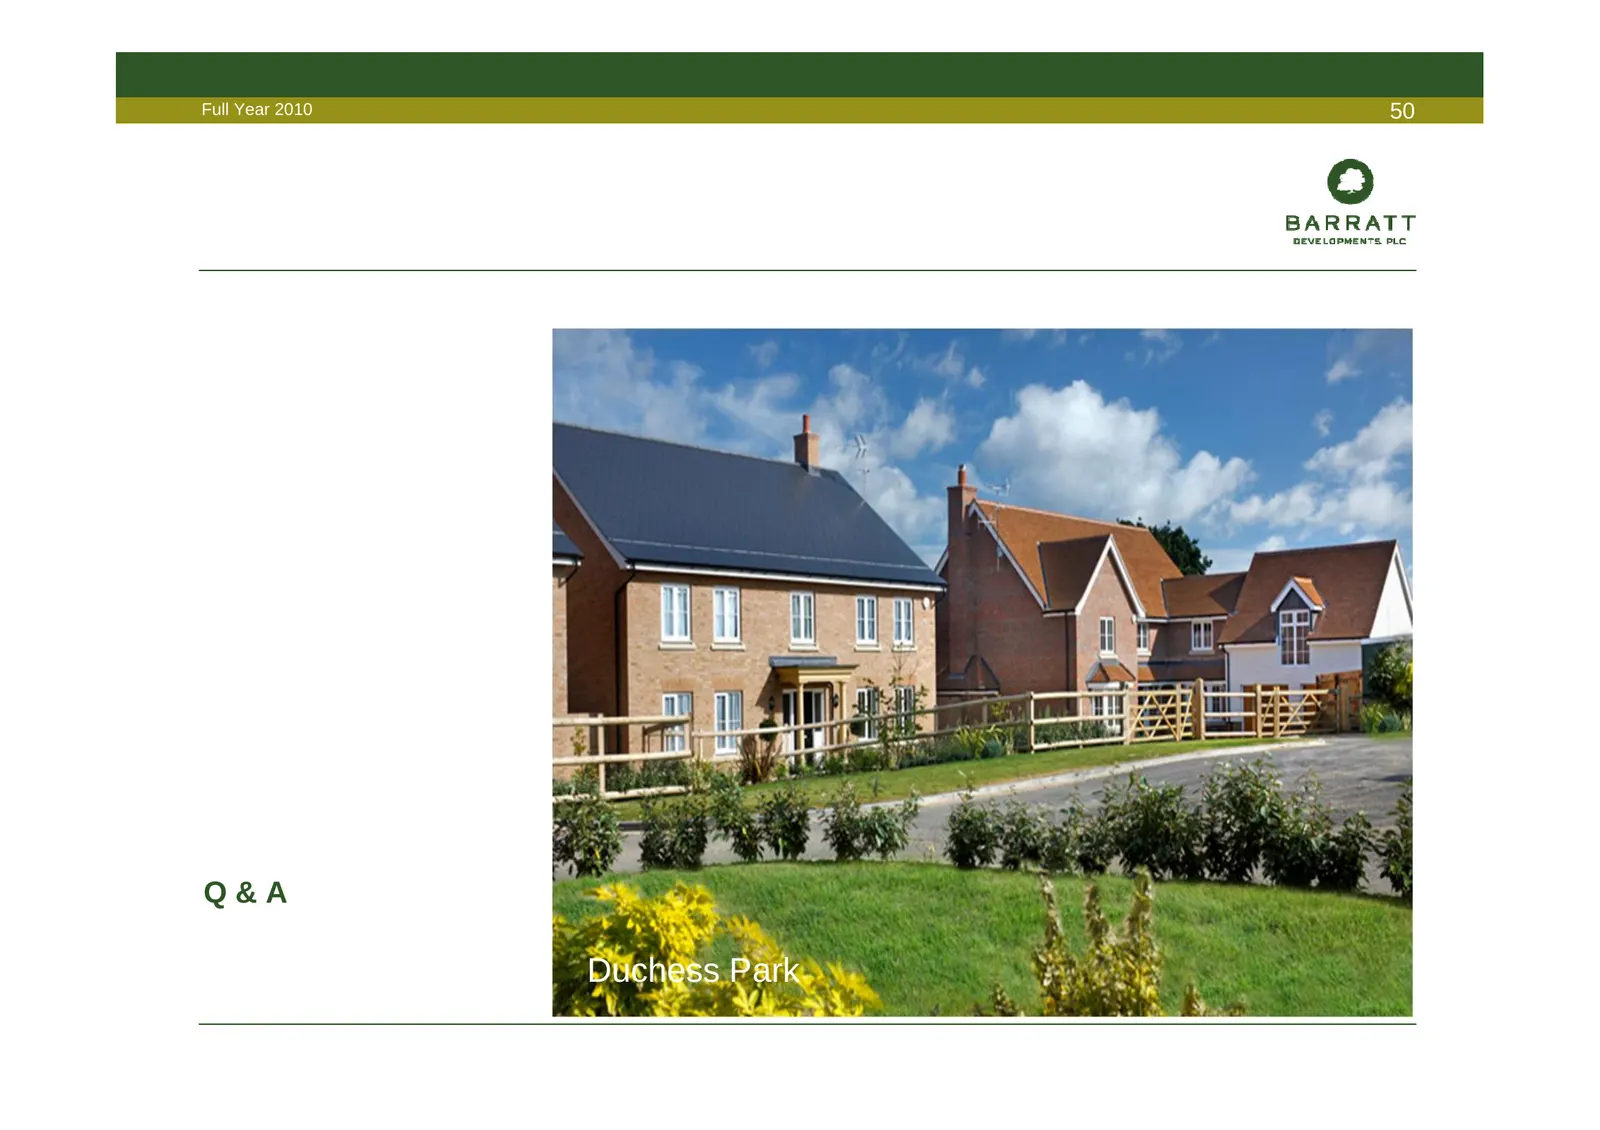
Slide 50: Q&A
Full Year 2010 50 Q&A Calcos Place Park Duchess
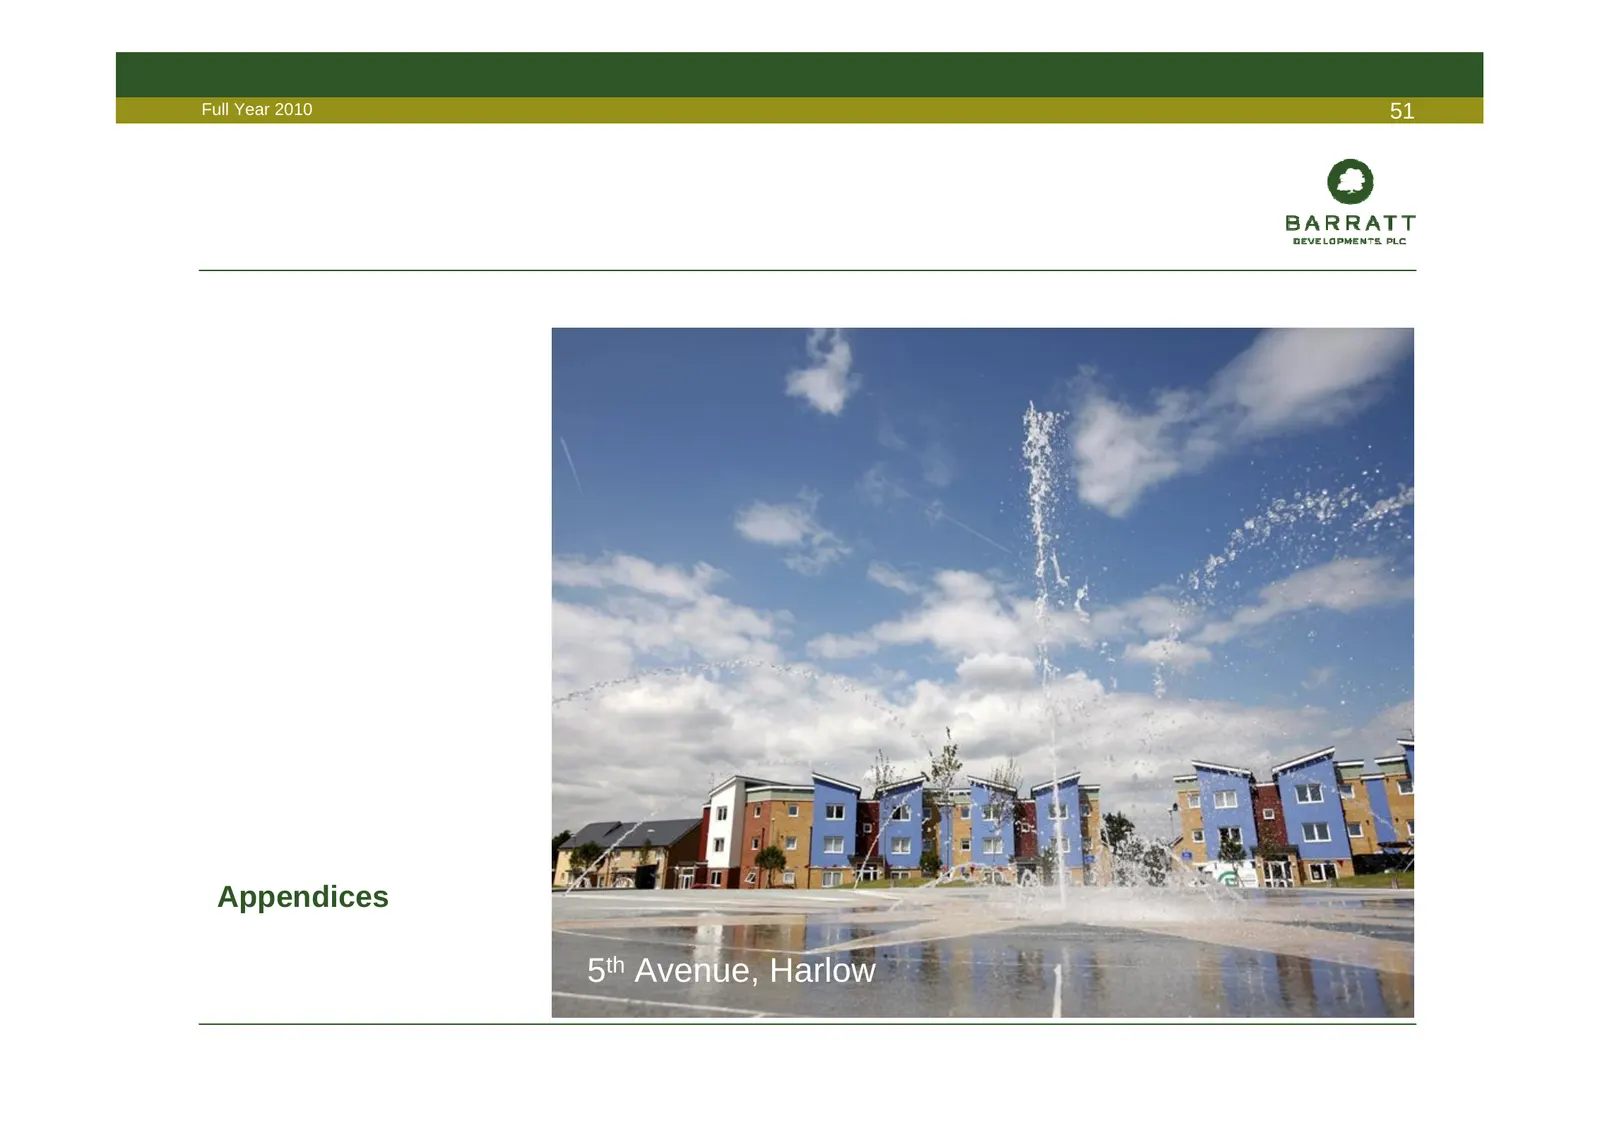
Slide 51: Appendices
Full Year 2010 51 Appendices 5th Avenue, Harlow
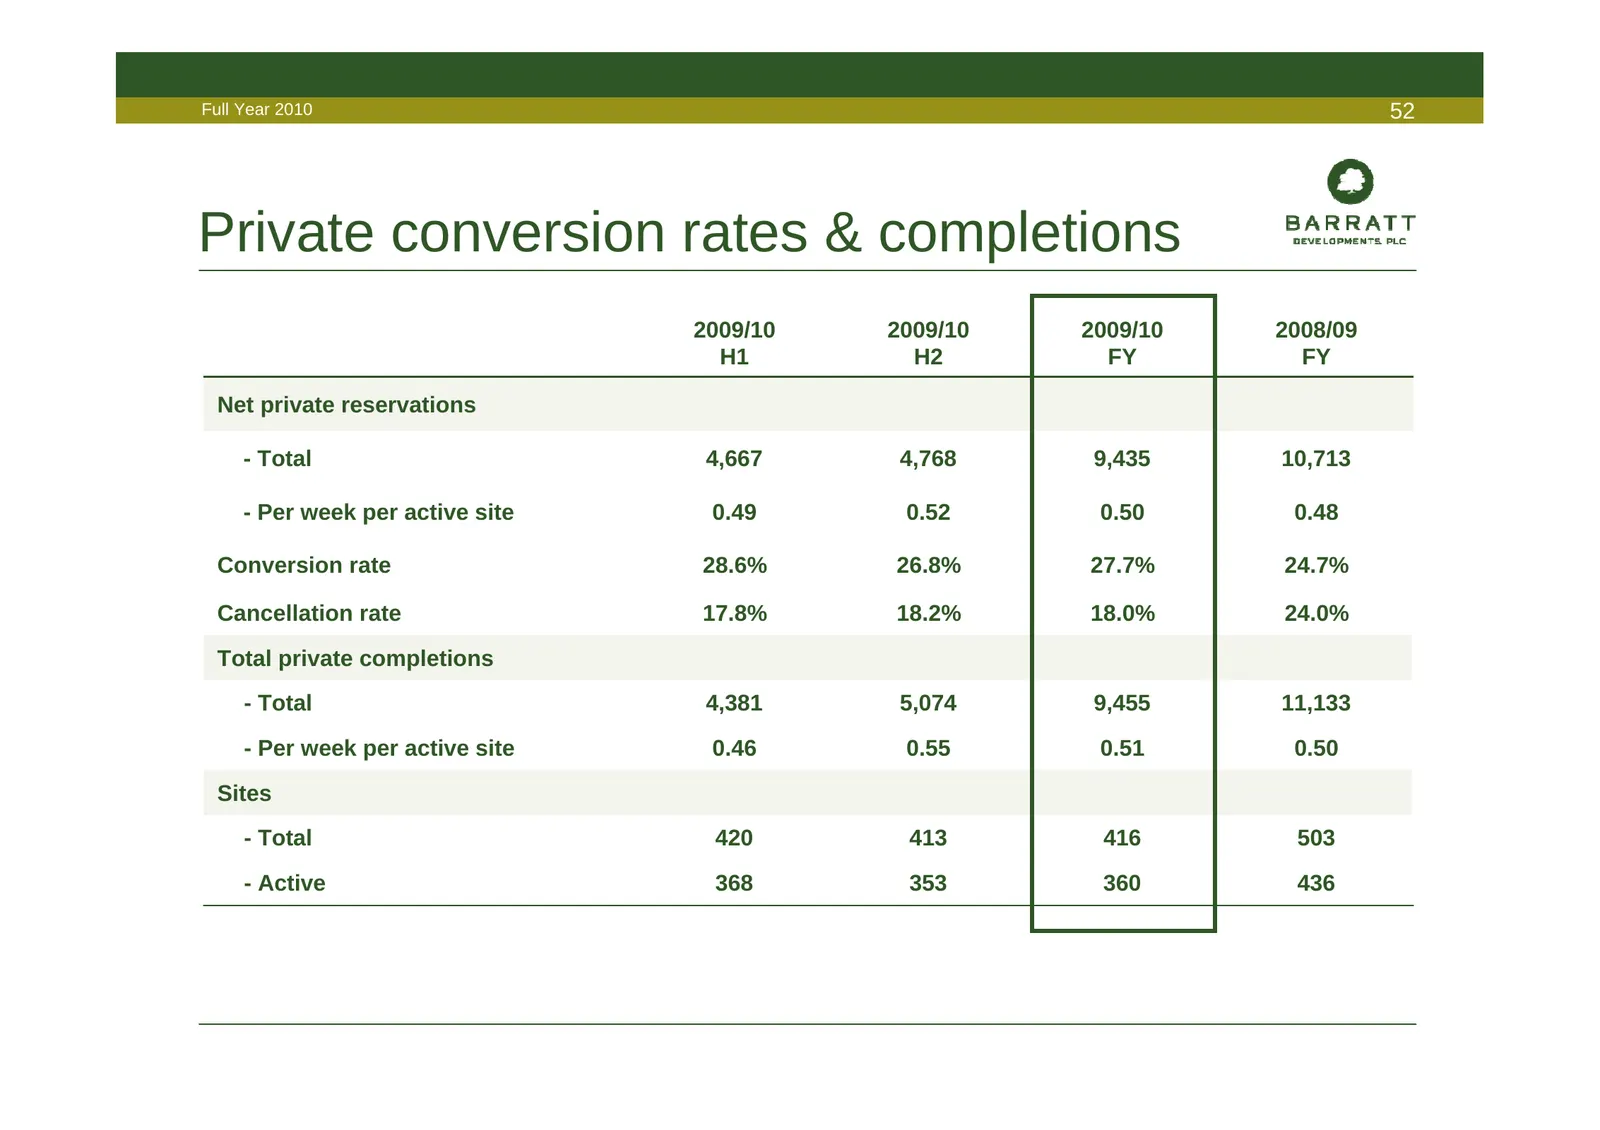
Slide 52: Private conversion rates & completions
Full Year 2010 52 Private conversion rates & completions 2009/10 2009/10 2009/10 2008/09 H1 H2 FY FY Net private reservations - Total 4,667 4,768 9,435 10,713 - Per week per active site 0.49 0.52 0.50 0.48 Conversion rate 28.6% 26.8% 27.7% 24.7% Cancellation rate 17.8% 18.2% 18.0% 24.0% Total privat
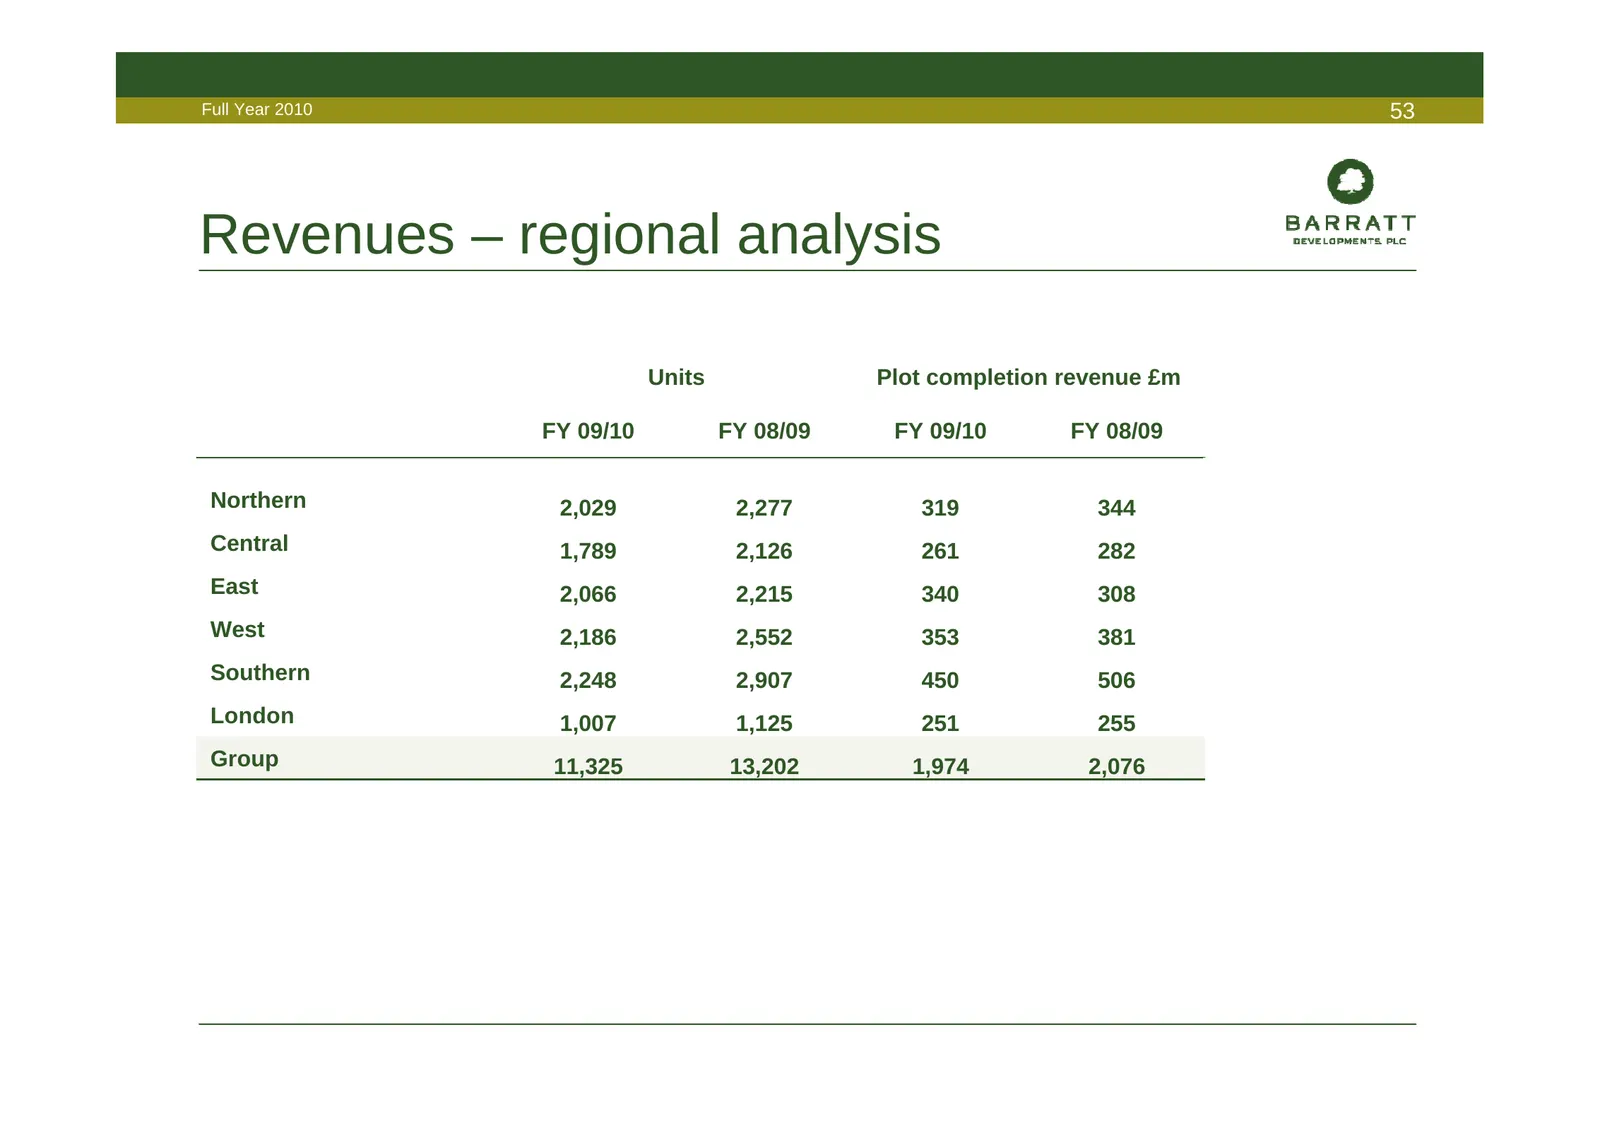
Slide 53: Revenues – regional analysis
Full Year 2010 53 Revenues – regional analysis Units Plot completion revenue £m FY 09/10 FY 08/09 FY 09/10 FY 08/09 Northern 2,029 2,277 319 344 Central 1,789 2,126 261 282 East 2,066 2,215 340 308 West 2,186 2,552 353 381 Southern 2,248 2,907 450 506 London 1,007 1,125 251 255 Group 11,325 13,202 1
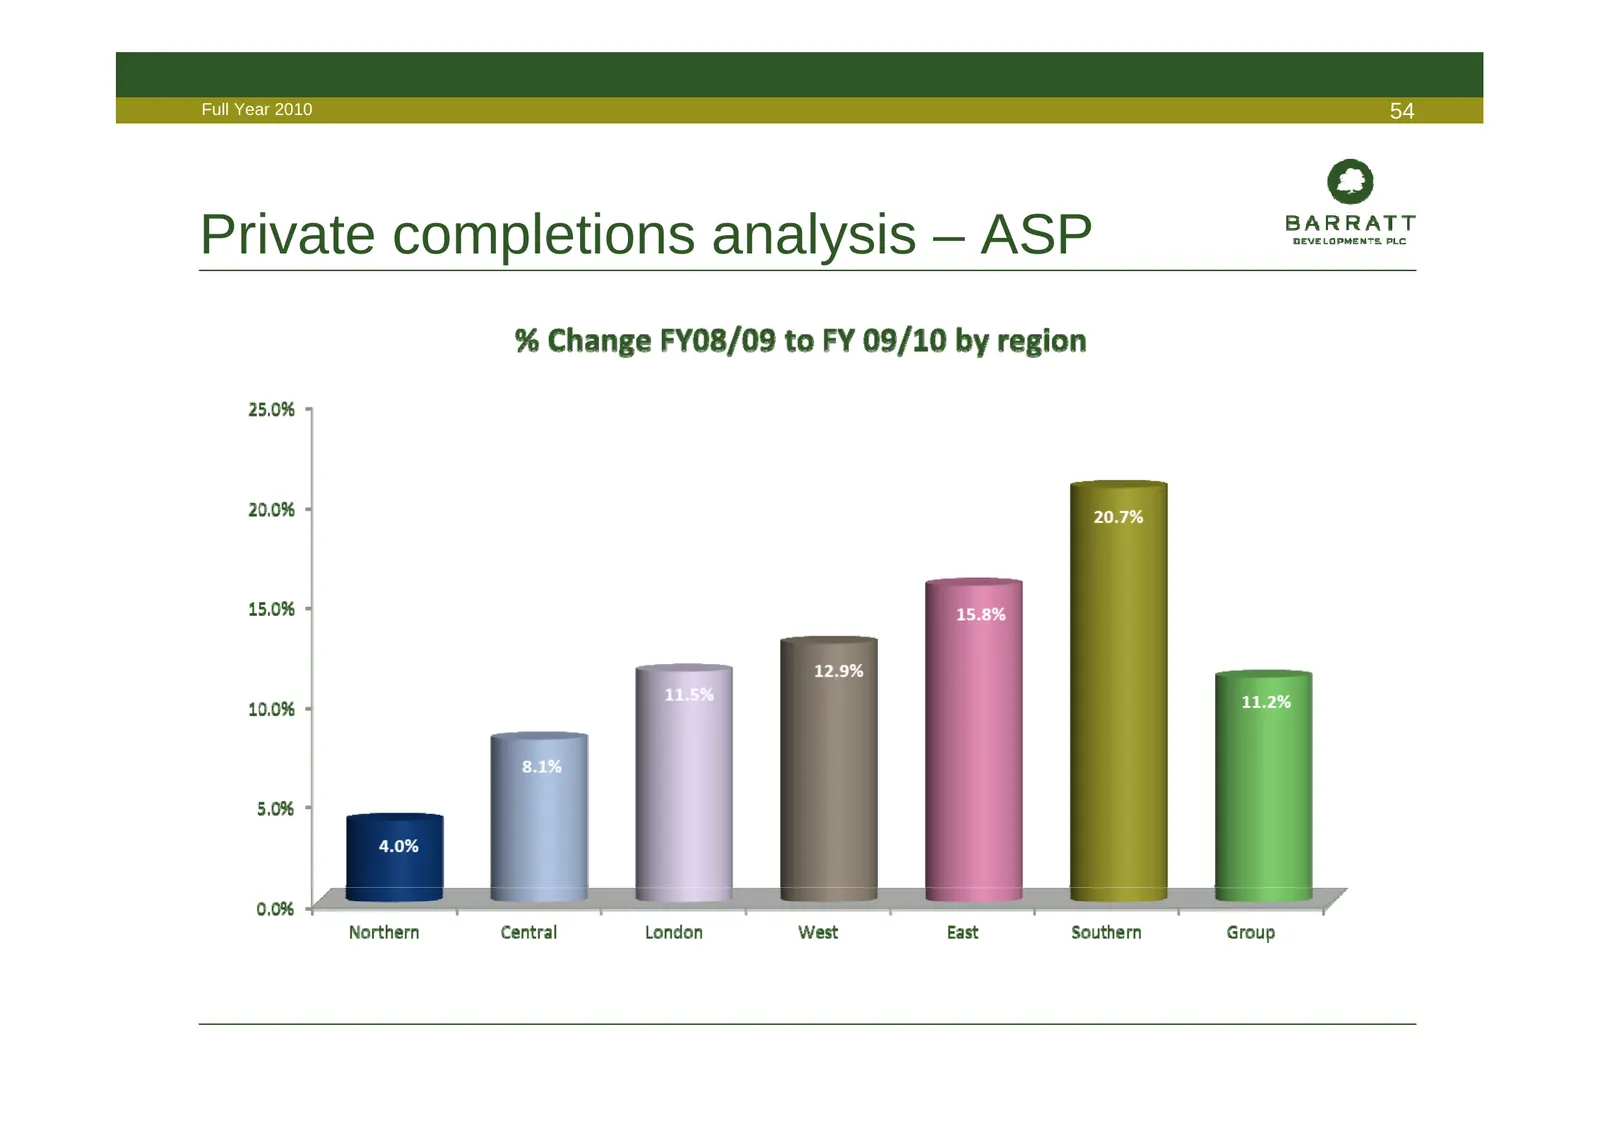
Slide 54: Private completions analysis – ASP
Full Year 2010 54 Private completions analysis – ASP
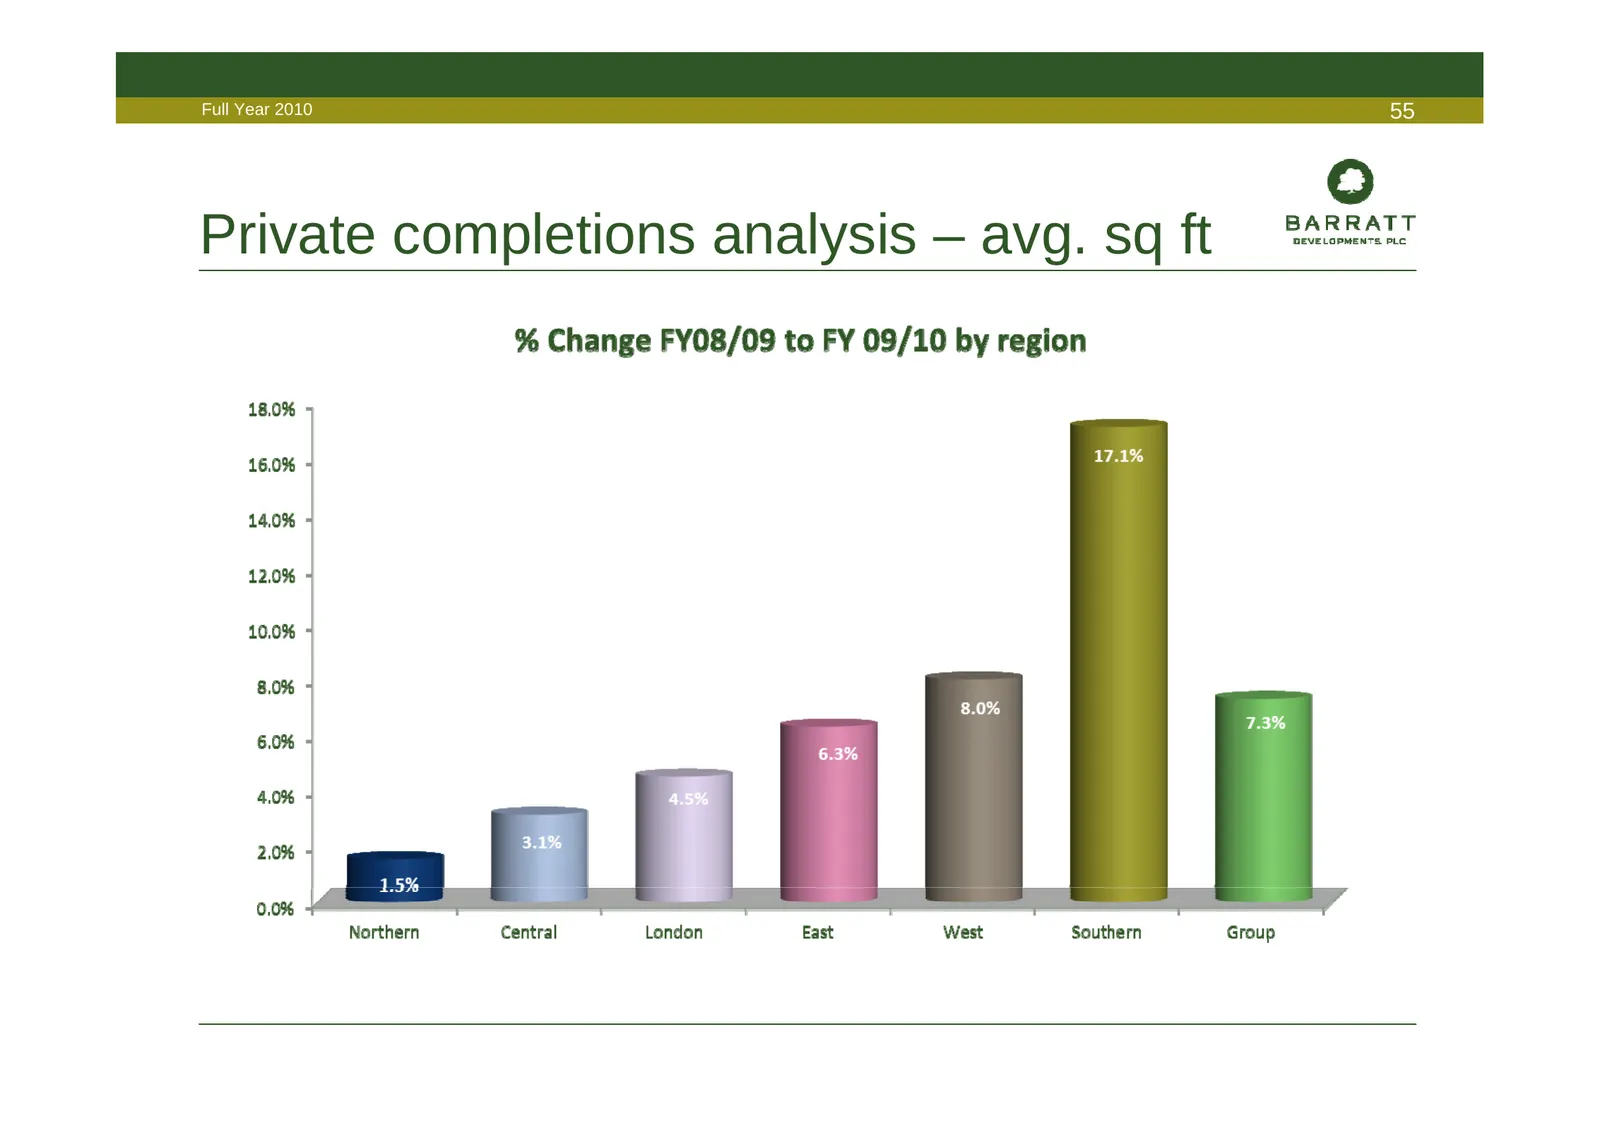
Slide 55: Private completions analysis – avg. sq ft
Full Year 2010 55 Private completions analysis – avg. sq ft
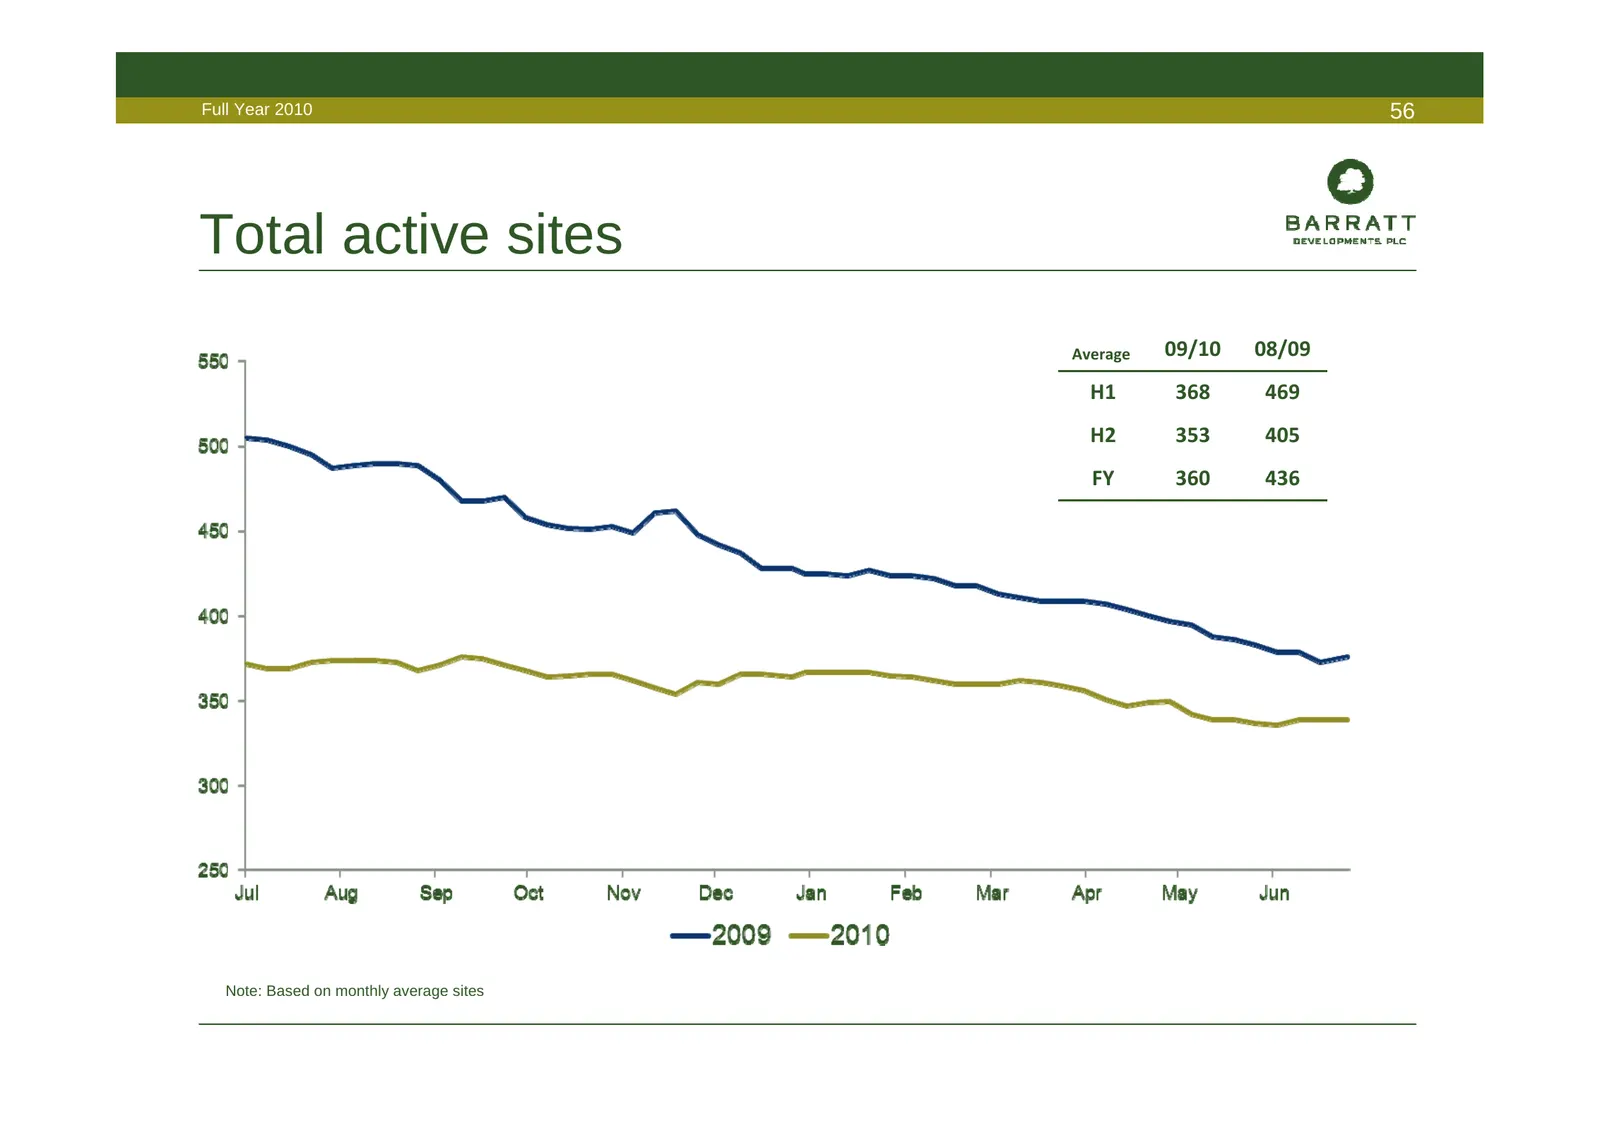
Slide 56: Total active sites
Full Year 2010 56 Total active sites Average 09/10 08/09 H1 368 469 H2 353 405 FY 360 436 Note: Based on monthly average sites
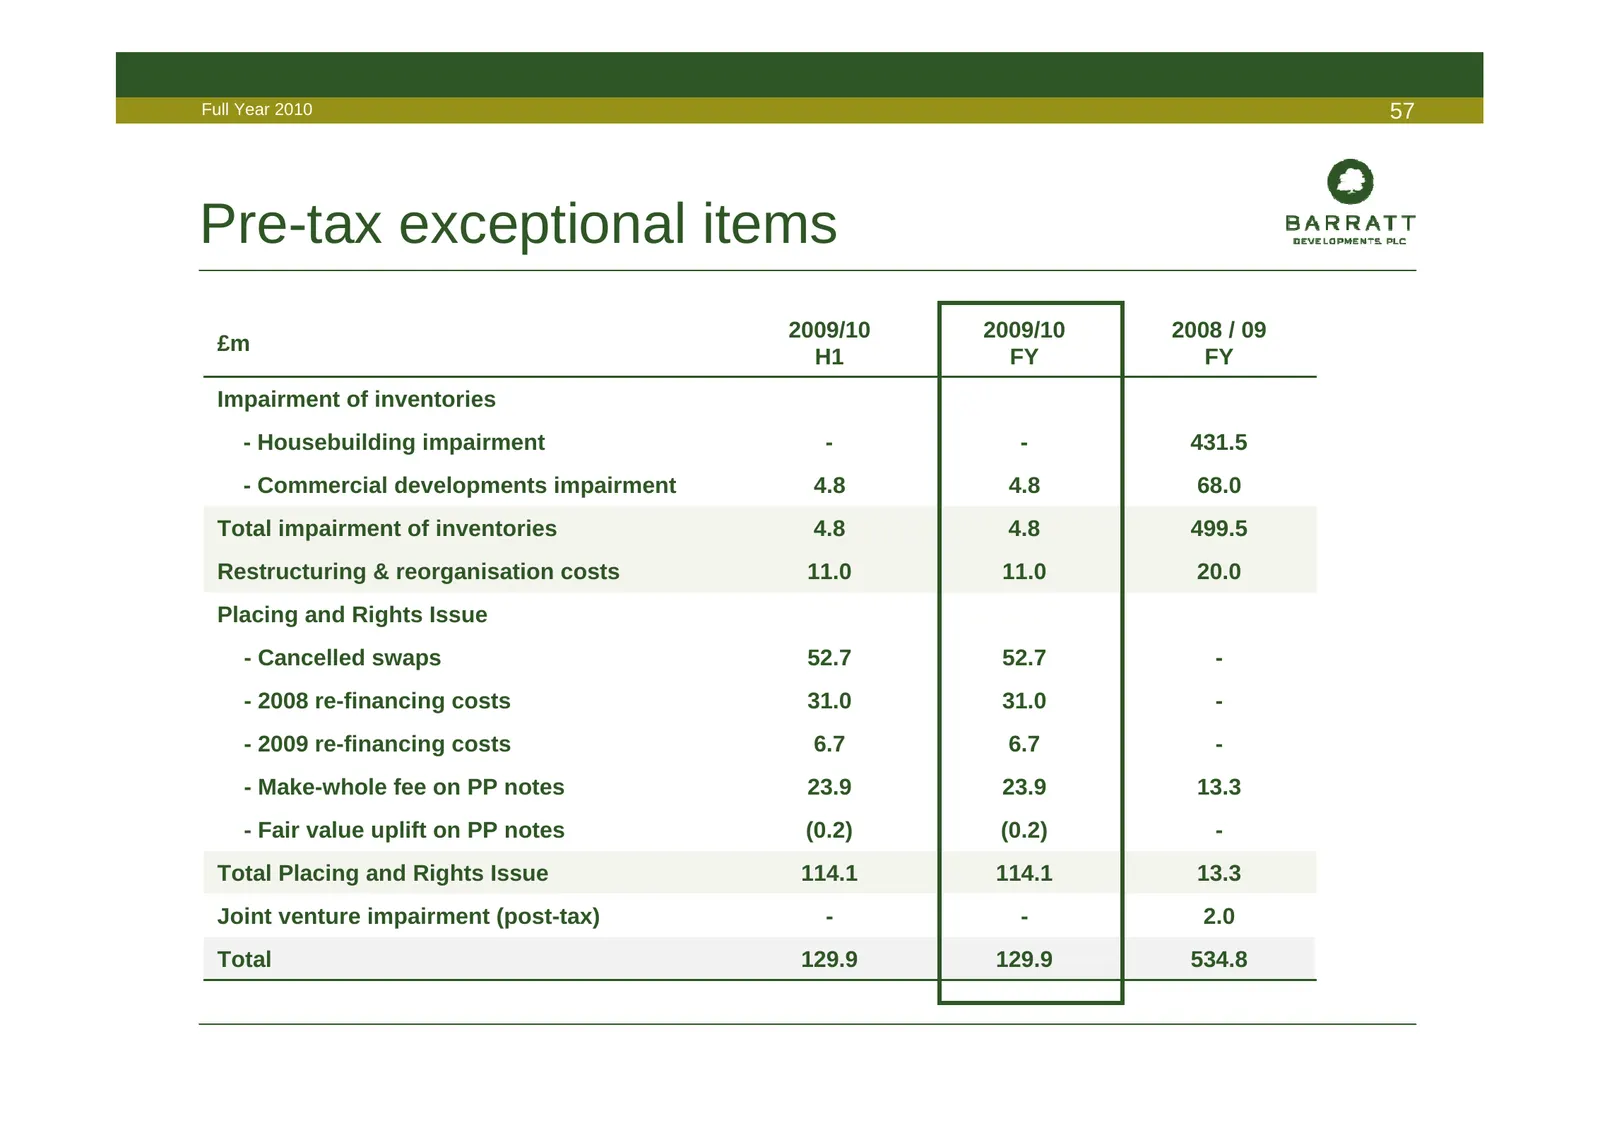
Slide 57: Pre-tax exceptional items
Full Year 2010 57 Pre-tax exceptional items 2009/10 2009/10 2008 / 09 £m H1 FY FY Impairment of inventories - Housebuilding impairment - - 431.5 - Commercial developments impairment 4.8 4.8 68.0 Total impairment of inventories 4.8 4.8 499.5 Restructuring & reorganisation costs 11.0 11.0 20.0 Placing
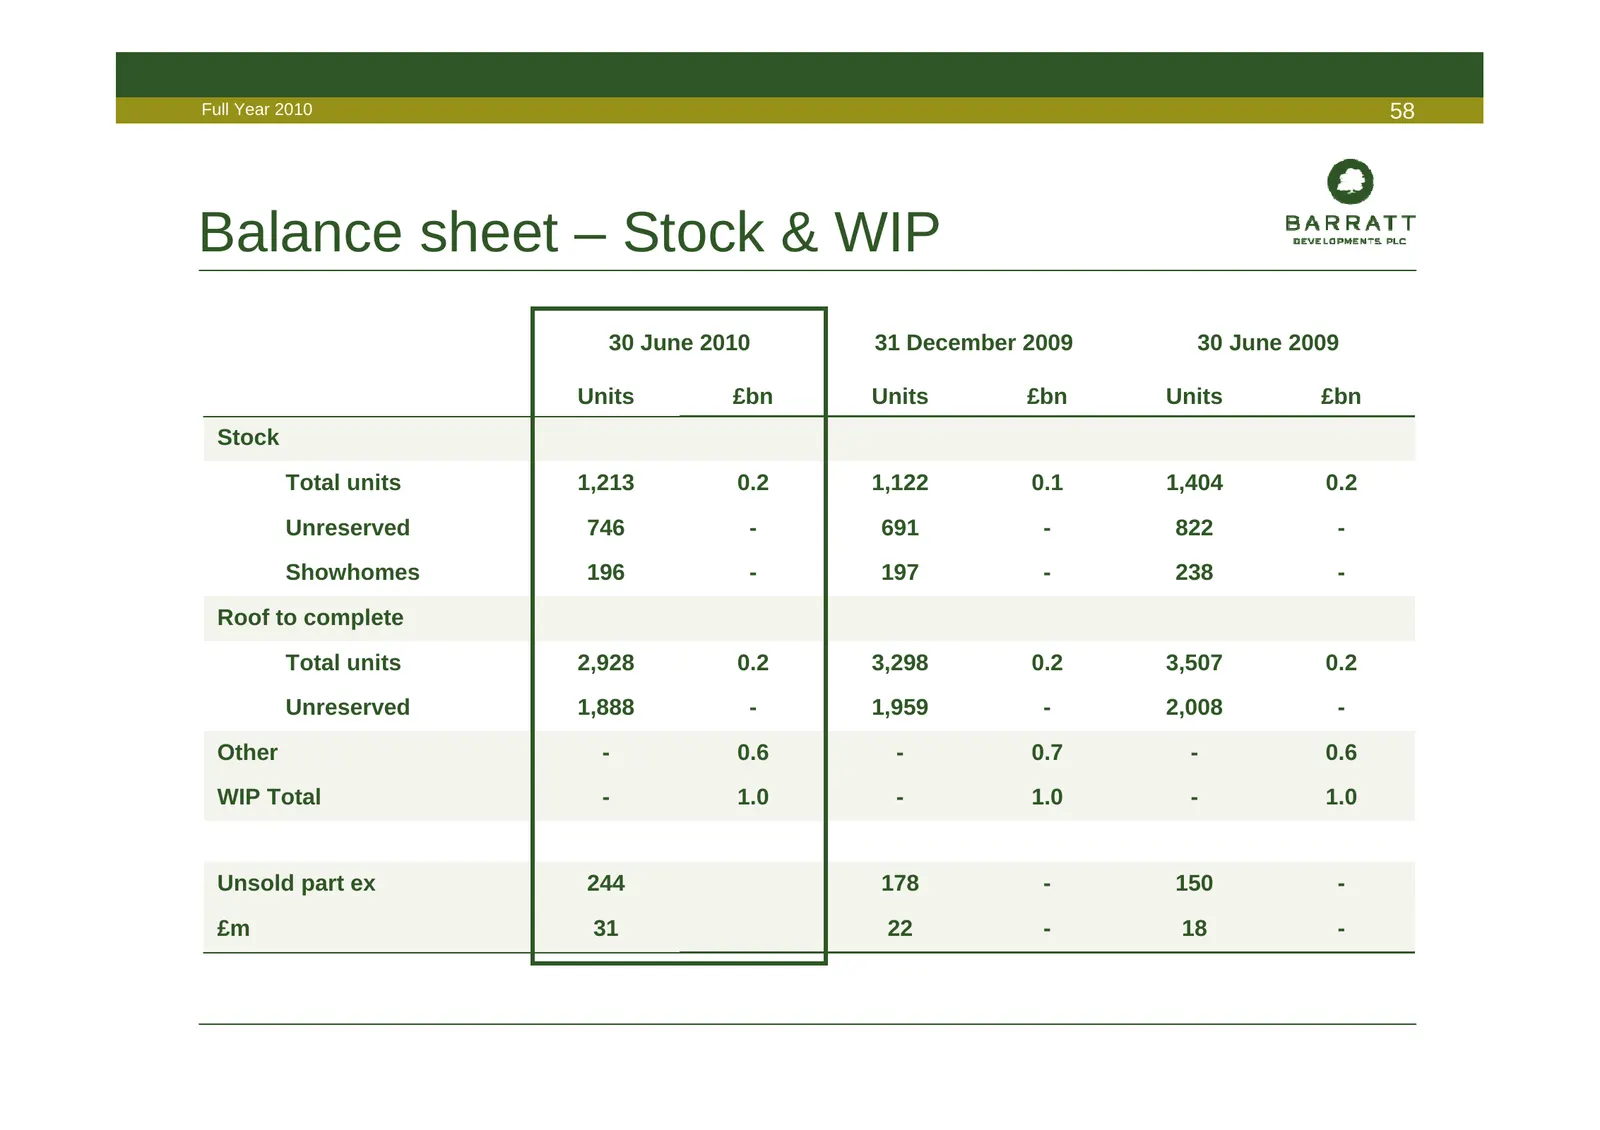
Slide 58: Balance sheet – Stock & WIP
Full Year 2010 58 Balance sheet – Stock & WIP 30 June 2010 31 December 2009 30 June 2009 Units £bn Units £bn Units £bn Stock Total units 1,213 0.2 1,122 0.1 1,404 0.2 Unreserved 746 - 691 - 822 - Showhomes 196 - 197 - 238 - Roof to complete Total units 2,928 0.2 3,298 0.2 3,507 0.2 Unreserved 1,888
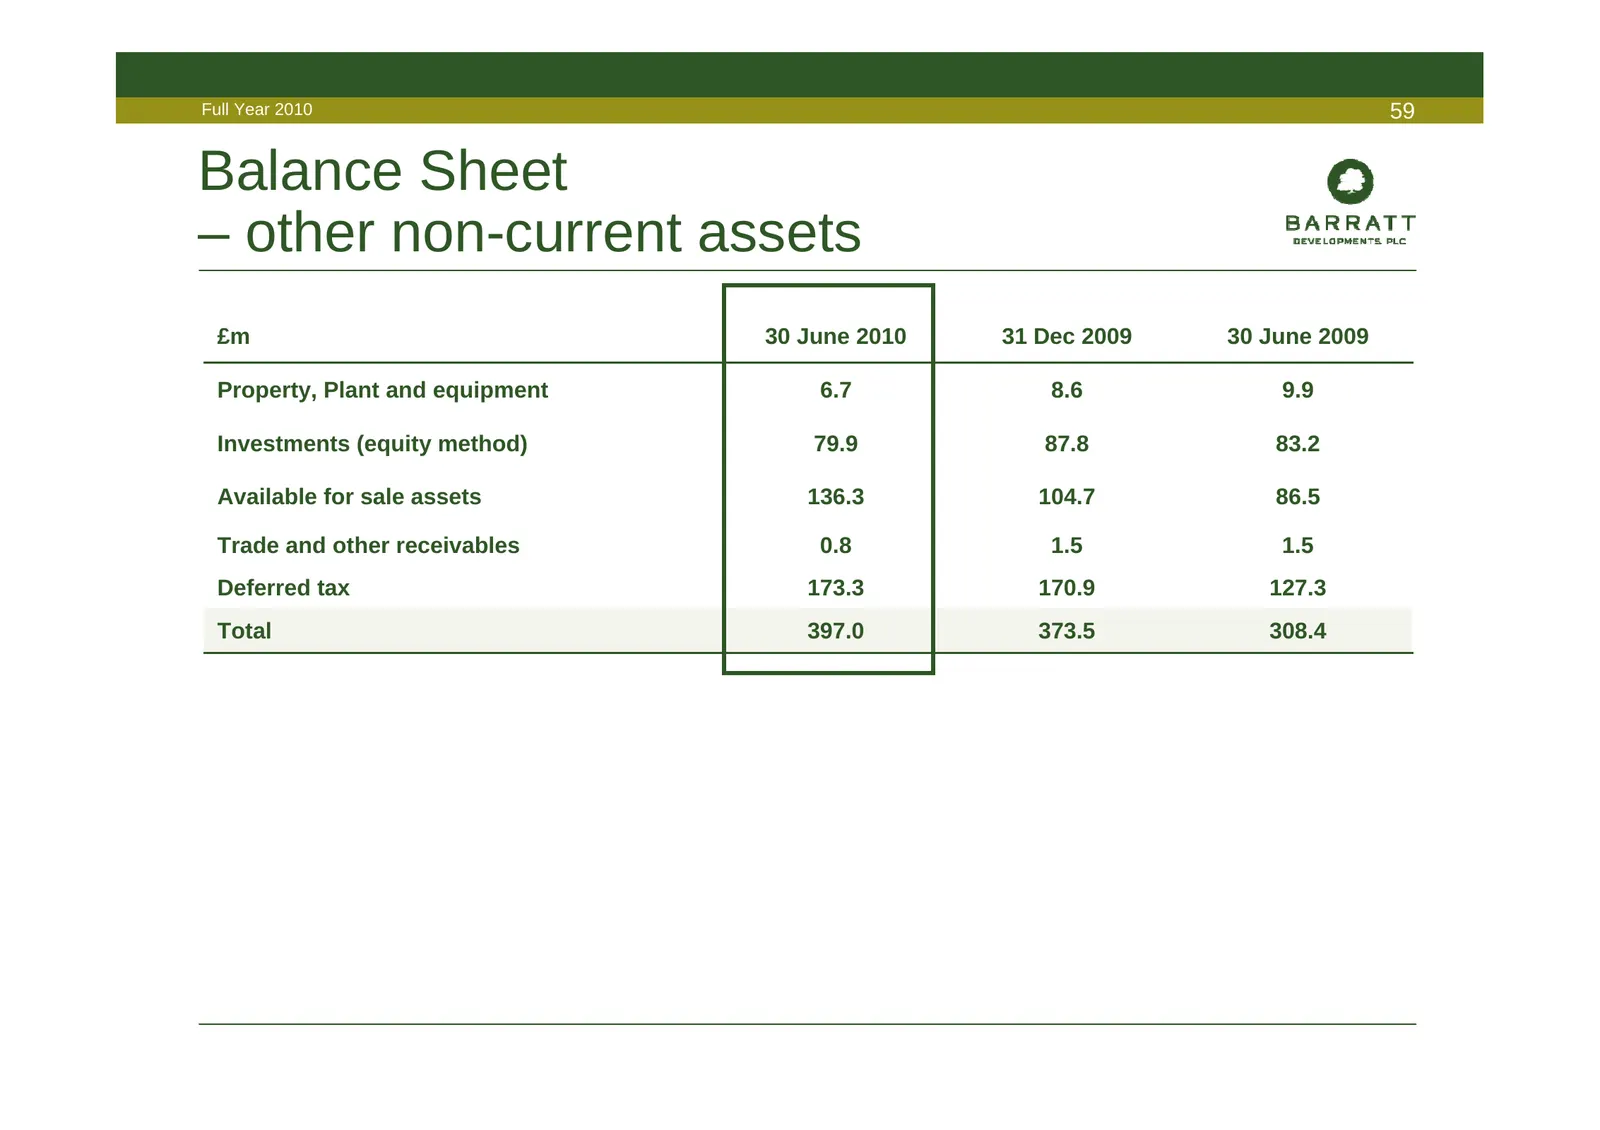
Slide 59: Balance Sheet – other non-current assets
Full Year 2010 59 Balance Sheet – other non-current assets £m 30 June 2010 31 Dec 2009 30 June 2009 Property, Plant and equipment 6.7 8.6 9.9 Investments (equity method) 79.9 87.8 83.2 Available for sale assets 136.3 104.7 86.5 Trade and other receivables 0.8 1.5 1.5 Deferred tax 173.3 170.9 127.3 T
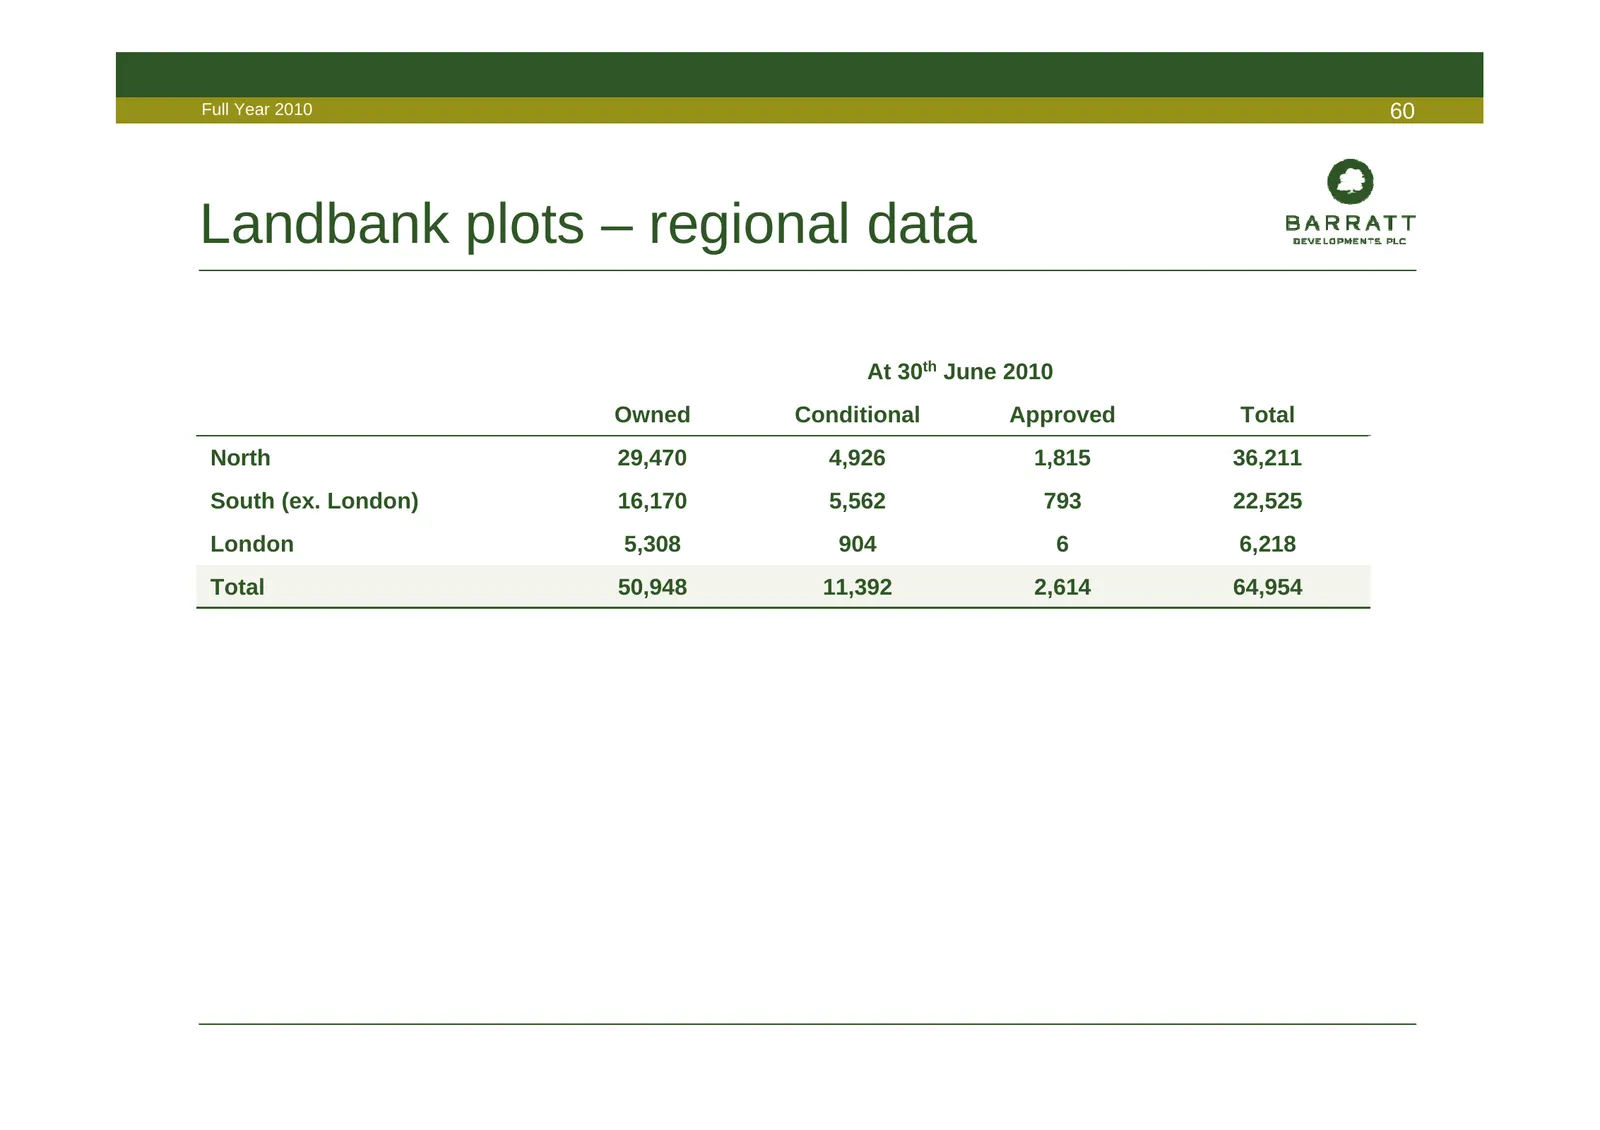
Slide 60: Landbank plots – regional data
Full Year 2010 60 Landbank plots – regional data At 30th June 2010 Owned Conditional Approved Total North 29,470 4,926 1,815 36,211 South (ex. London) 16,170 5,562 793 22,525 London 5,308 904 6 6,218 Total 50,948 11,392 2,614 64,954
Slide 61: Disclaimer
Full Year 2010 61 Disclaimer This document has been prepared by Barratt Developments PLC (the “Company”) solely for use at a presentation in connection with the Company's Annual Results Announcement in respect of the year ended 30 June 2010. For the purposes of this notice, the presentation (the “Pr
Source: Internet Archive copy of barrattdevelopments.co.uk
More decks from Barratt Redrow plc
 FY2026 Earnings Presentation59 slides · Sep 16, 2026
 HY26 Earnings Presentation59 slides · Feb 11, 2026
 FY2025 Earnings Presentation60 slides · Sep 17, 2025
 Corporate Update (May 2025)30 slides · May 1, 2025
 Investor Day (February 2025)40 slides · Feb 12, 2025
 HY25 Earnings Presentation51 slides · Feb 12, 2025