Grenergy Renovables S.A · BME:GRE
Grenergy Renovables — FY2022 Earnings Presentation
30 slides from Grenergy Renovables's earnings presentation, Feb 27, 2023
Slide 1: Results Presentation FY2022
The sky is the limit RESULTS PRESENTATION Jan-Dec FY2022 Madrid, 27th February 2023
Slide 2: Disclaimer
DISCLAIMER By attending this presentation and/or by accepting this presentation you will be cial condition or results of operations by the Company and should not be relied upon taken to have represented, warranted and undertaken that you have read and when making an investment decision. Certain finan
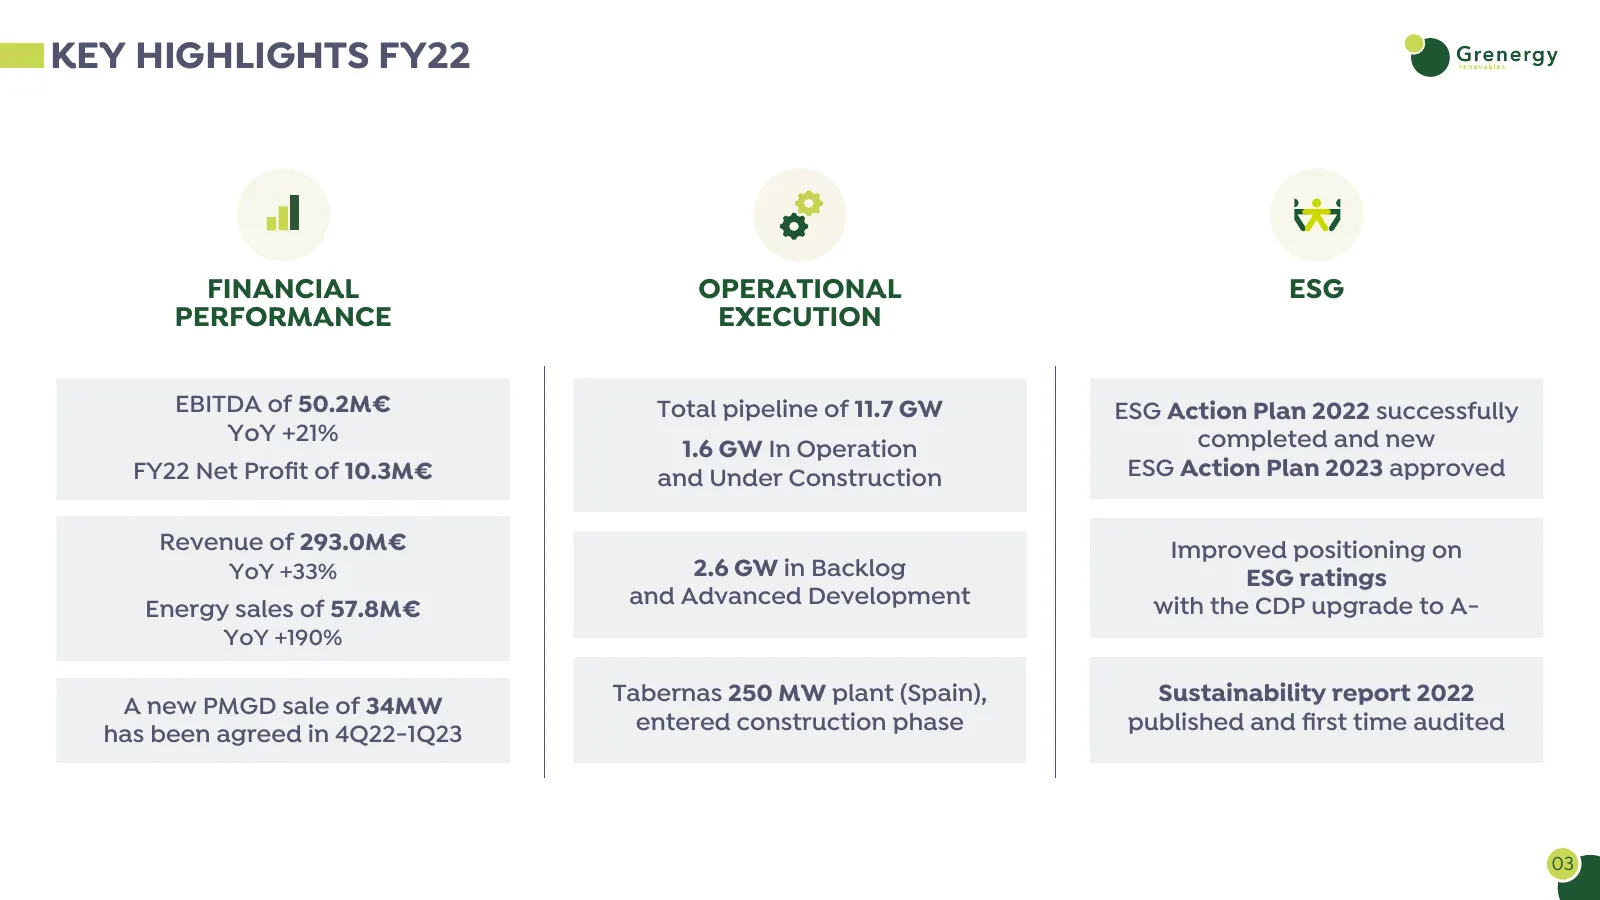
Slide 3: Key Highlights FY22
KEY HIGHLIGHTS FY22 FINANCIAL OPERATIONAL ESG PERFORMANCE EXECUTION EBITDA of 50.2M€ Total pipeline of 11.7 GW ESG Action Plan 2022 successfully YoY +21% completed and new 1.6 GW In Operation FY22 Net Profit of 10.3M€ and Under Construction ESG Action Plan 2023 approved Revenue of 293.0M€ Improved p
Slide 4: Results: Financial
1 RESULTS FINANCIAL Escuderos Solar PV - Spain
Slide 5: Revenue FY22
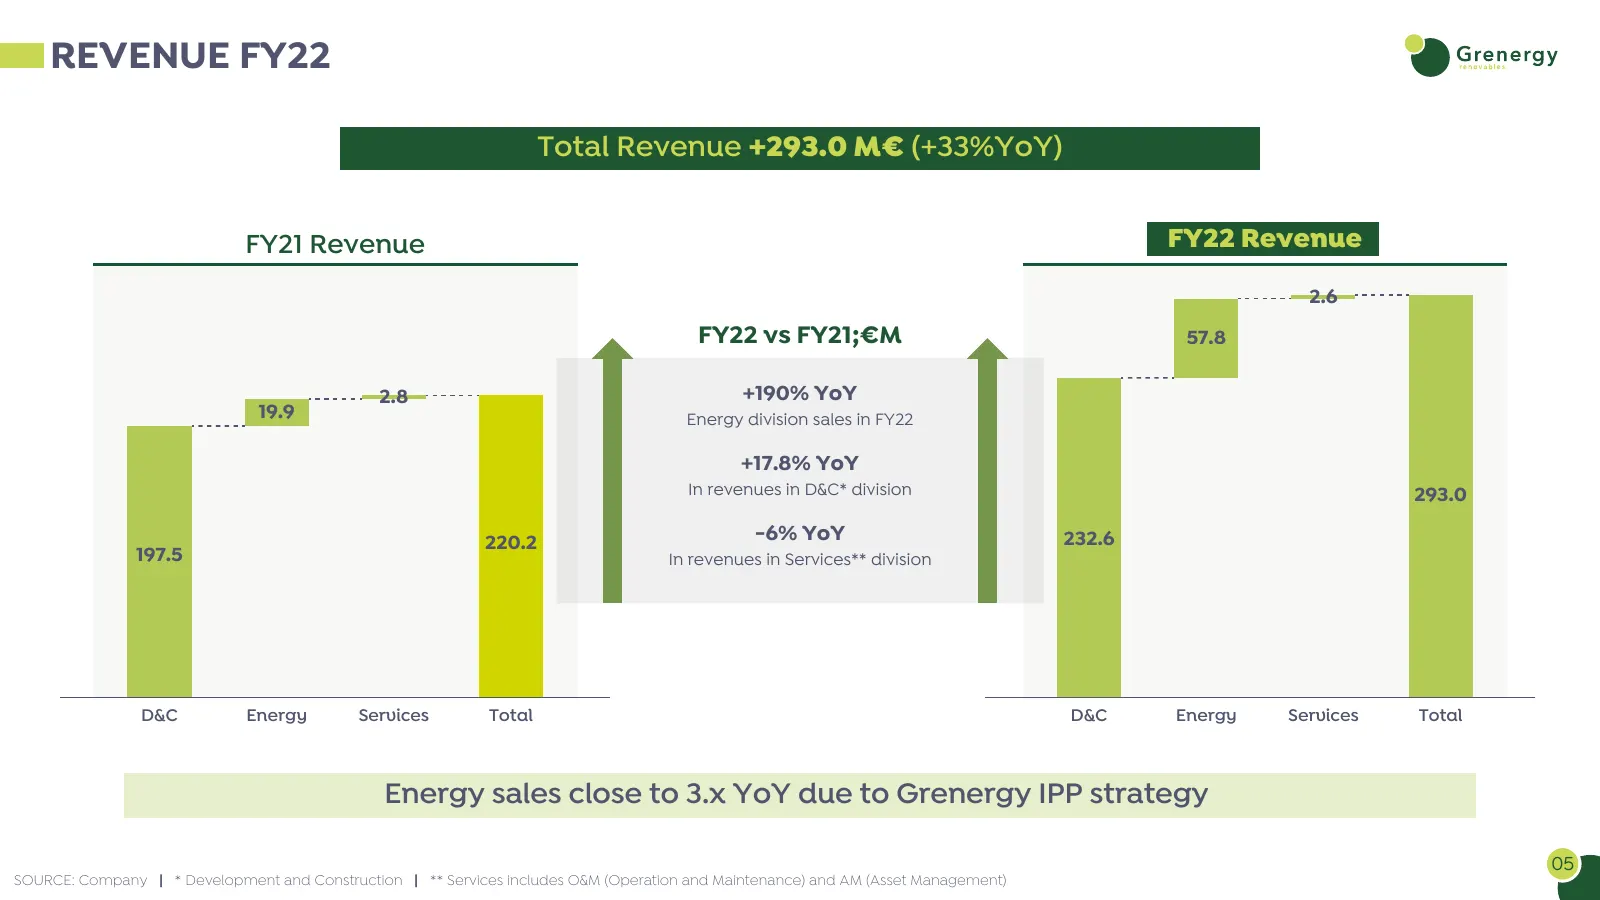
REVENUE FY22 Total Revenue +293.0 M€ (+33%YoY) FY21 Revenue FY22 Revenue 2.6 FY22 vs FY21;€M 57.8 2.8 +190% YoY 19.9 Energy division sales in FY22 +17.8% YoY In revenues in D&C* division 293.0 220.2 -6% YoY 232.6 197.5 In revenues in Services** division D&C Energy Services Total D&C Energy Services
Slide 6: EBITDA FY22
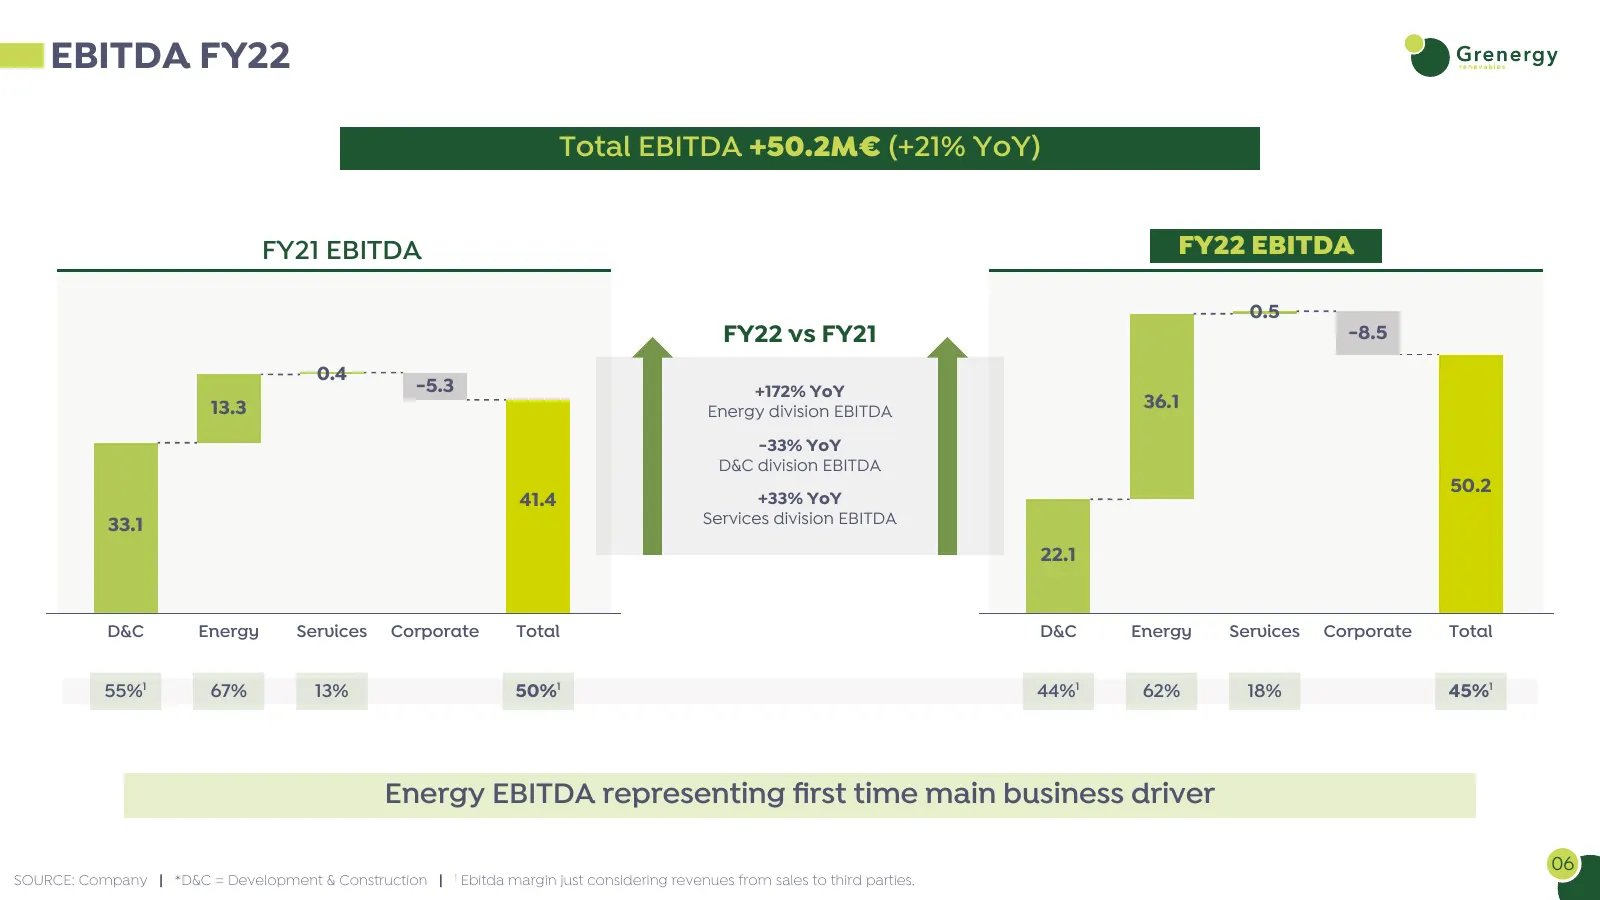
EBITDA FY22 Total EBITDA +50.2M€ (+21% YoY) FY21 EBITDA FY22 EBITDA 0.5 FY22 vs FY21 -8.5 0.4 -5.3 +172% YoY 13.3 Energy division EBITDA 36.1 -33% YoY D&C division EBITDA 50.2 41.4 +33% YoY 33.1 Services division EBITDA 22.1 D&C Energy Services Corporate Total D&C Energy Services Corporate Total 55%
Slide 7: Capex FY22
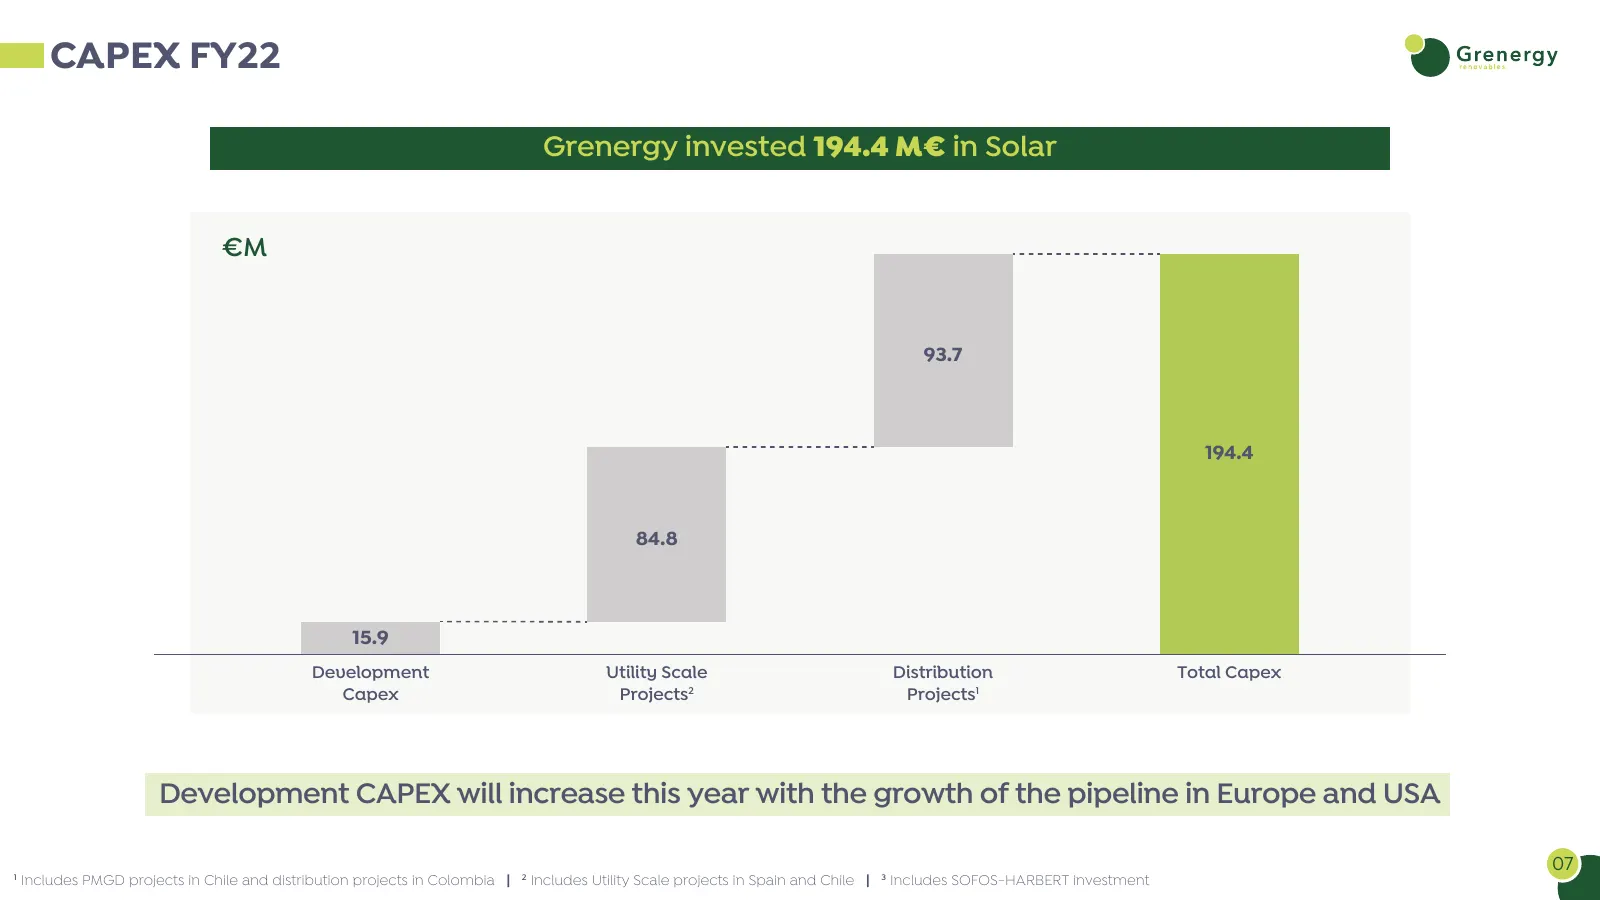
CAPEX FY22 Grenergy invested 194.4 M€ in Solar €M 93.7 194.4 84.8 15.9 Development Utility Scale Distribution Total Capex Capex Projects2 Projects1 Development CAPEX will increase this year with the growth of the pipeline in Europe and USA 07 1 Includes PMGD projects in Chile and distribution projec
Slide 8: Free Cash Flow at Group Level FY22
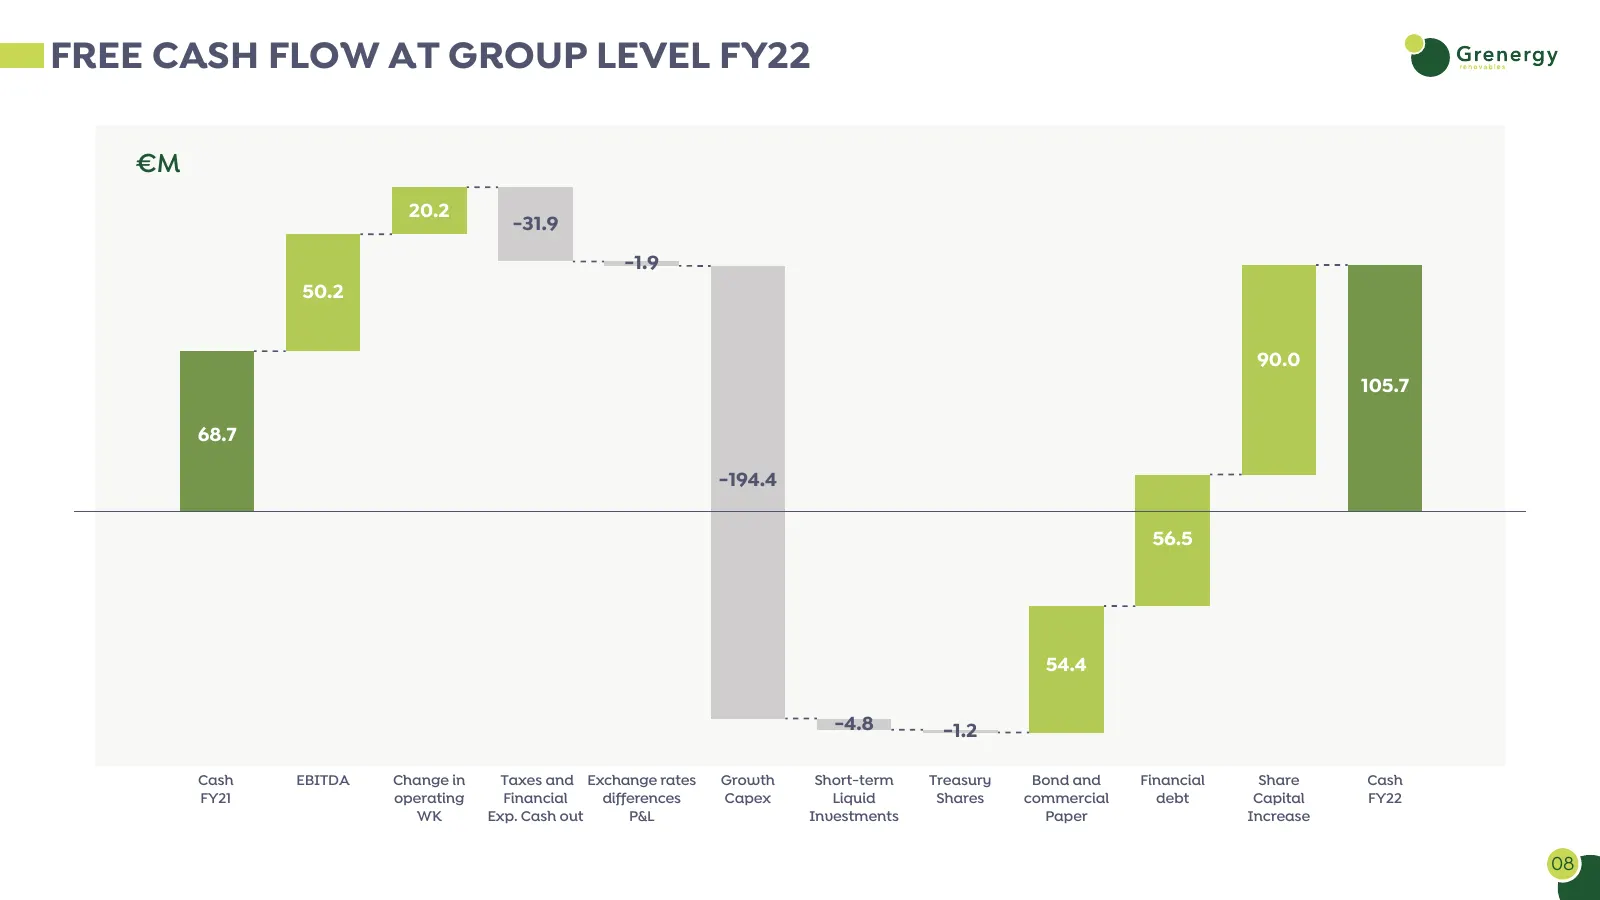
FREE CASH FLOW AT GROUP LEVEL FY22 €M 20.2 -31.9 -1.9 50.2 90.0 105.7 68.7 -194.4 56.5 54.4 -4.8 -1.2 Cash EBITDA Change in Taxes and Exchange rates Growth Short-term Treasury Bond and Financial Share Cash FY21 operating Financial differences Capex Liquid Shares commercial debt Capital FY22 WK Exp.
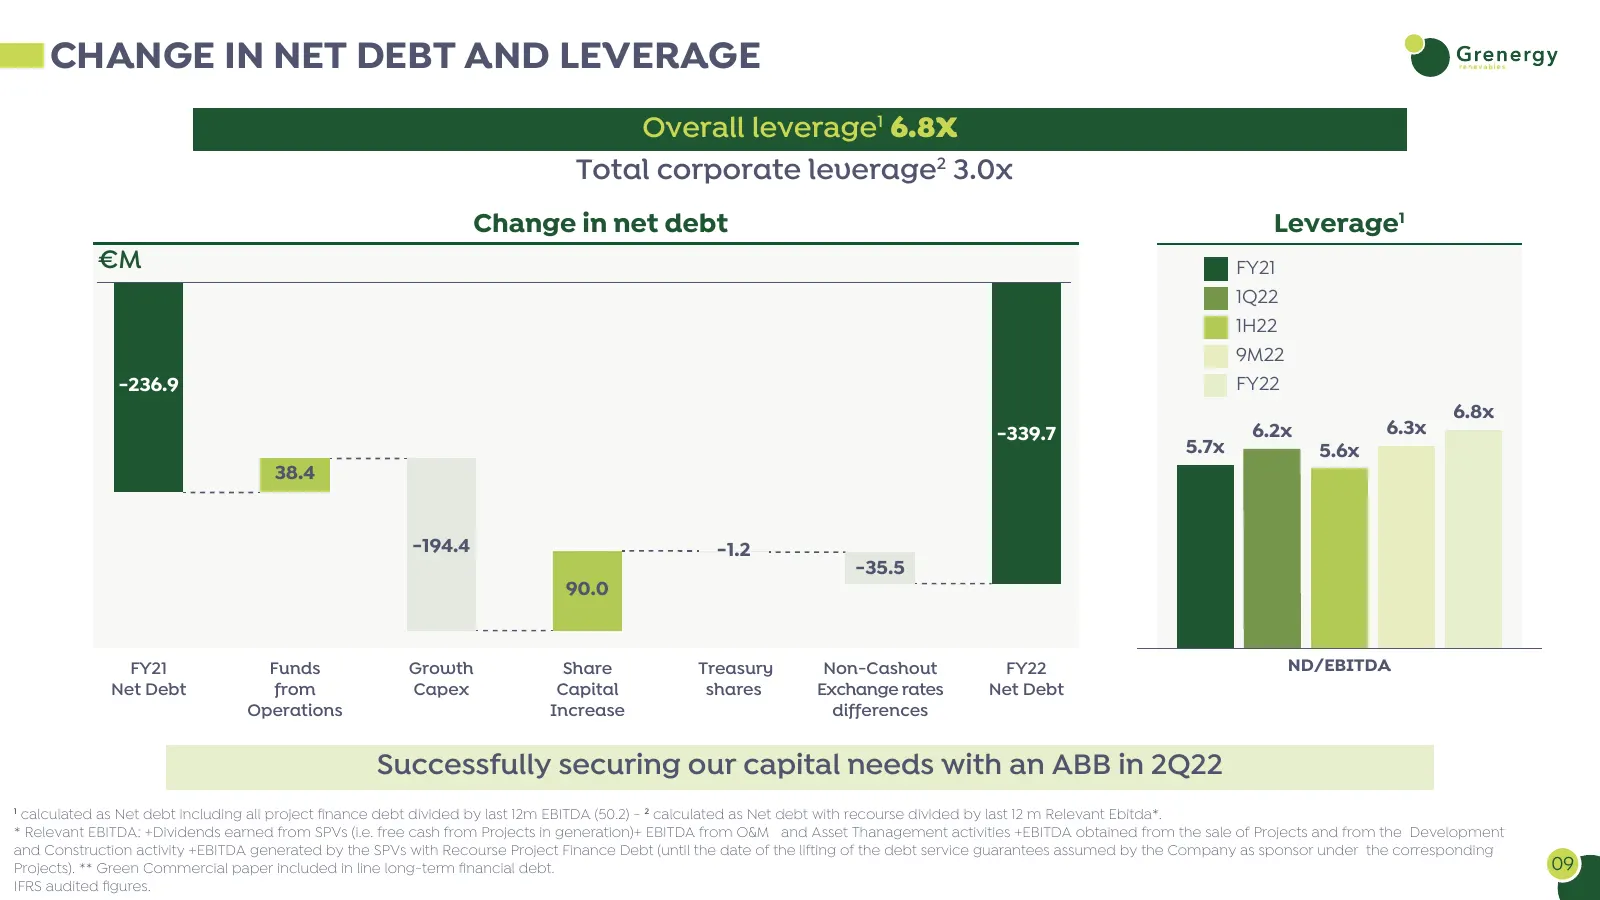
Slide 9: Change in Net Debt and Leverage
CHANGE IN NET DEBT AND LEVERAGE Overall leverage1 6.8X Total corporate leverage2 3.0x Change in net debt Leverage1 €M FY21 1Q22 1H22 9M22 -236.9 FY22 6.8x -339.7 6.2x 6.3x 5.7x 5.6x 38.4 -194.4 -1.2 -35.5 90.0 FY21 Funds Growth Share Treasury Non-Cashout FY22 ND/EBITDA Net Debt from Capex Capital sh
Slide 10: Pipeline & Operations
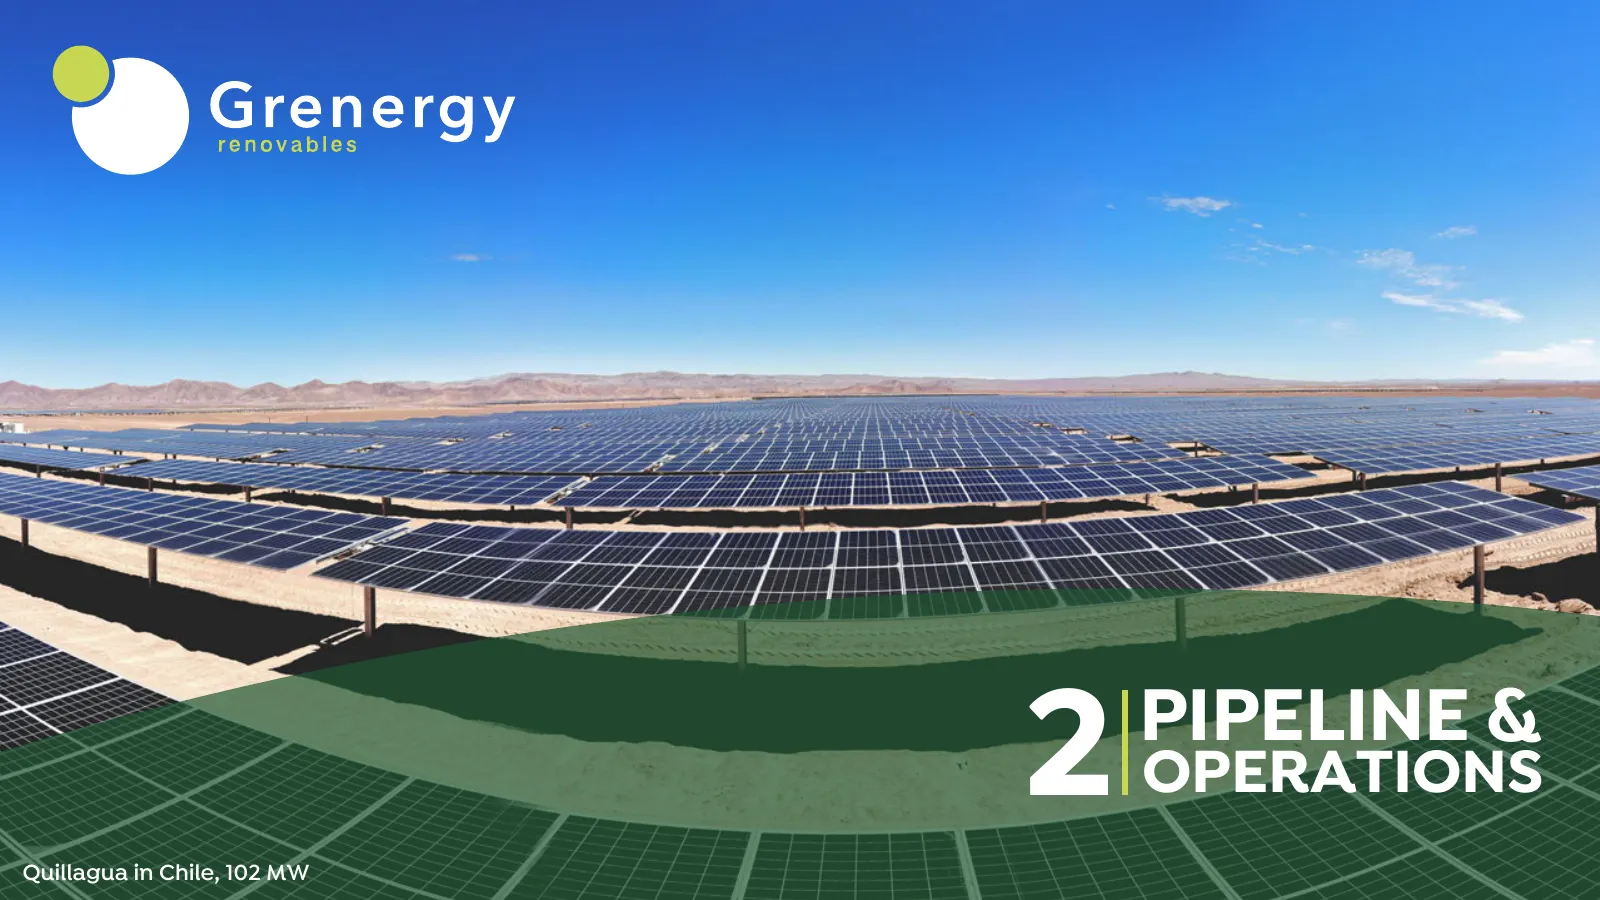
2 PIPELINE & OPERATIONS Quillagua in Chile, 102 MW
Slide 11: Company Platforms Overview
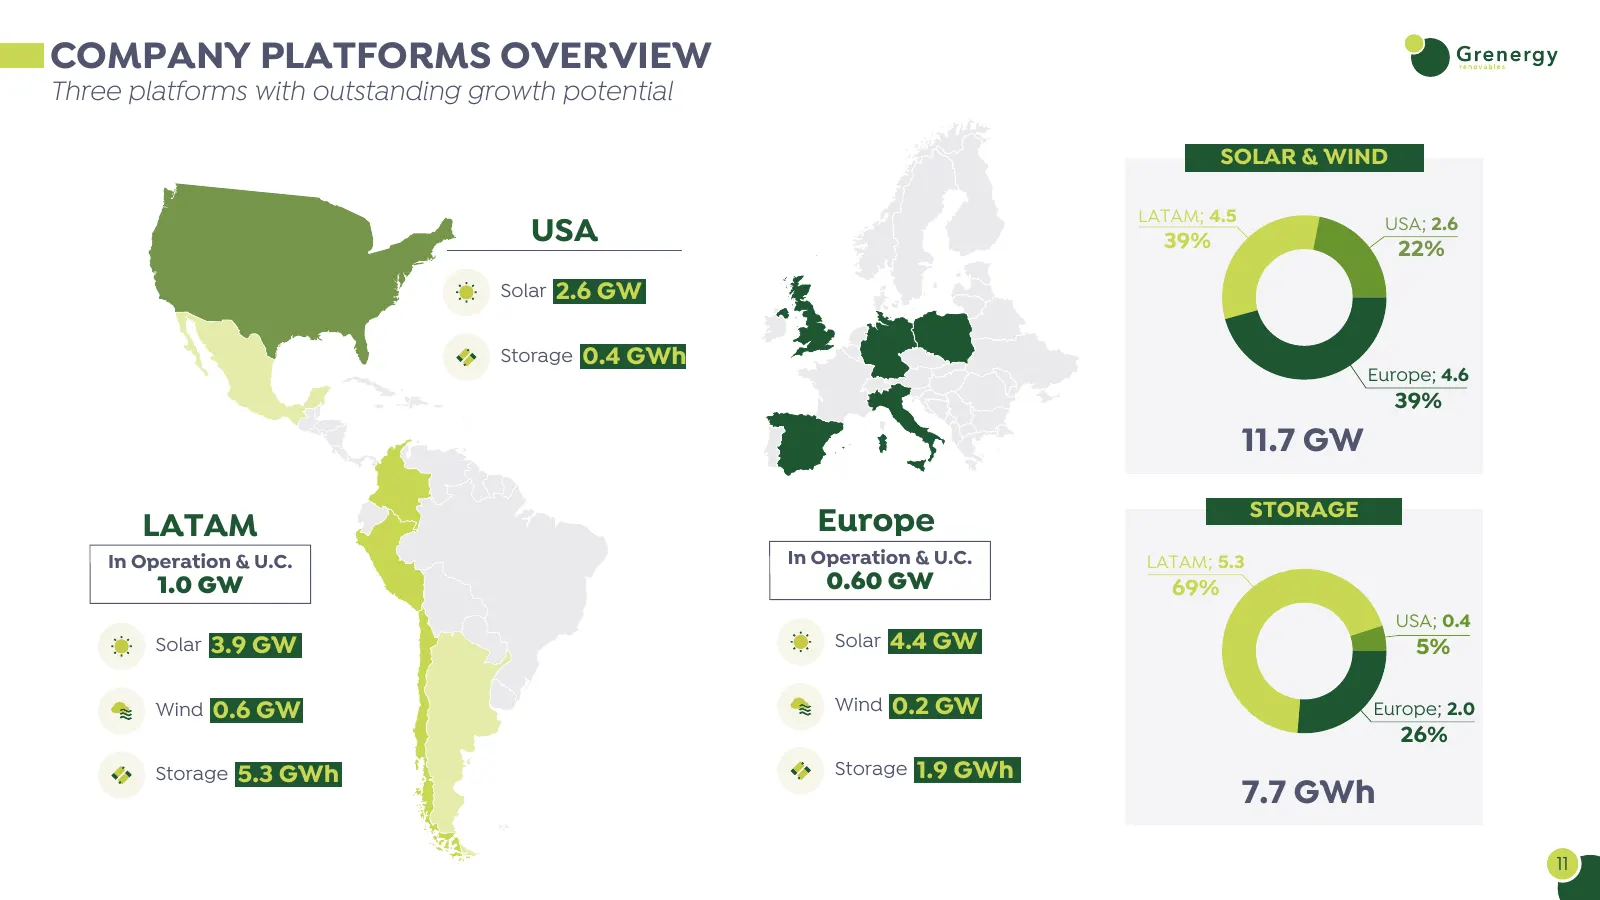
COMPANY PLATFORMS OVERVIEW Three platforms with outstanding growth potential SOLAR & WIND LATAM; 4.5 USA 39% USA; 2.6 22% Solar 2.6 GW Storage 0.4 GWh Europe; 4.6 39% 11.7 GW STORAGE LATAM Europe In Operation & U.C. In Operation & U.C. LATAM; 5.3 1.0 GW 0.60 GW 69% USA; 0.4 Solar 3.9 GW Solar 4.4 GW
Slide 12: Pipeline Update: Project Portfolio
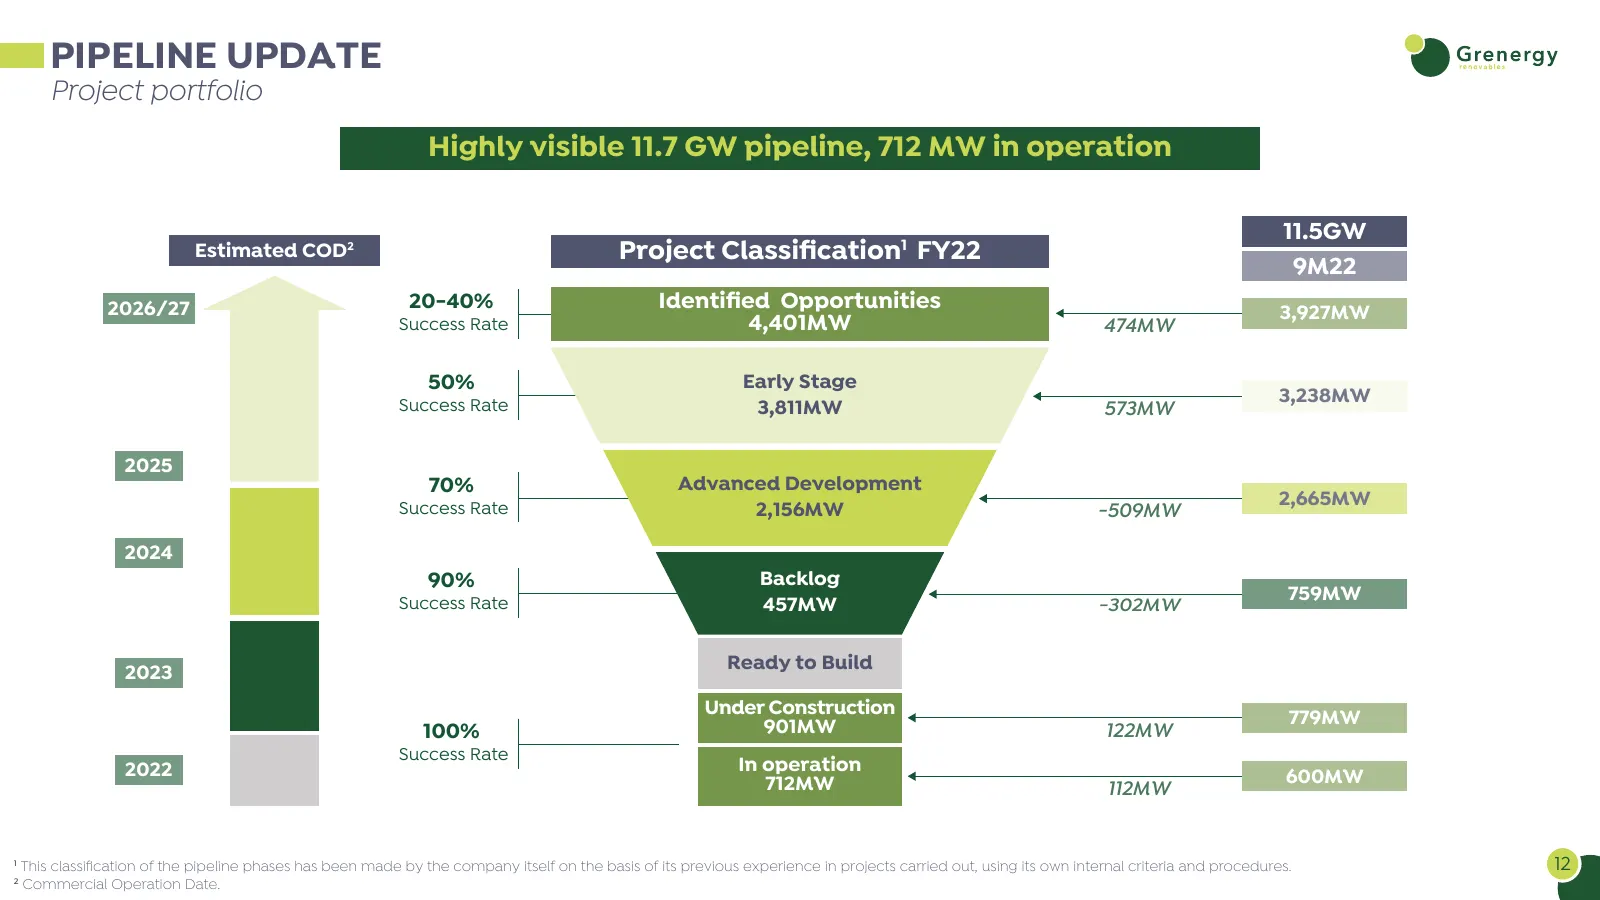
PIPELINE UPDATE Project portfolio Highly visible 11.7 GW pipeline, 712 MW in operation 11.5GW Estimated COD2 Project Classification1 FY22 9M22 2026/27 20-40% Identified Opportunities 3,927MW Success Rate 4,401MW 474MW 50% Early Stage 3,238MW Success Rate 3,811MW 573MW 2025 70% Advanced Development 2,6
Slide 13: Pipeline Update: Total Pipeline 11.7 GW
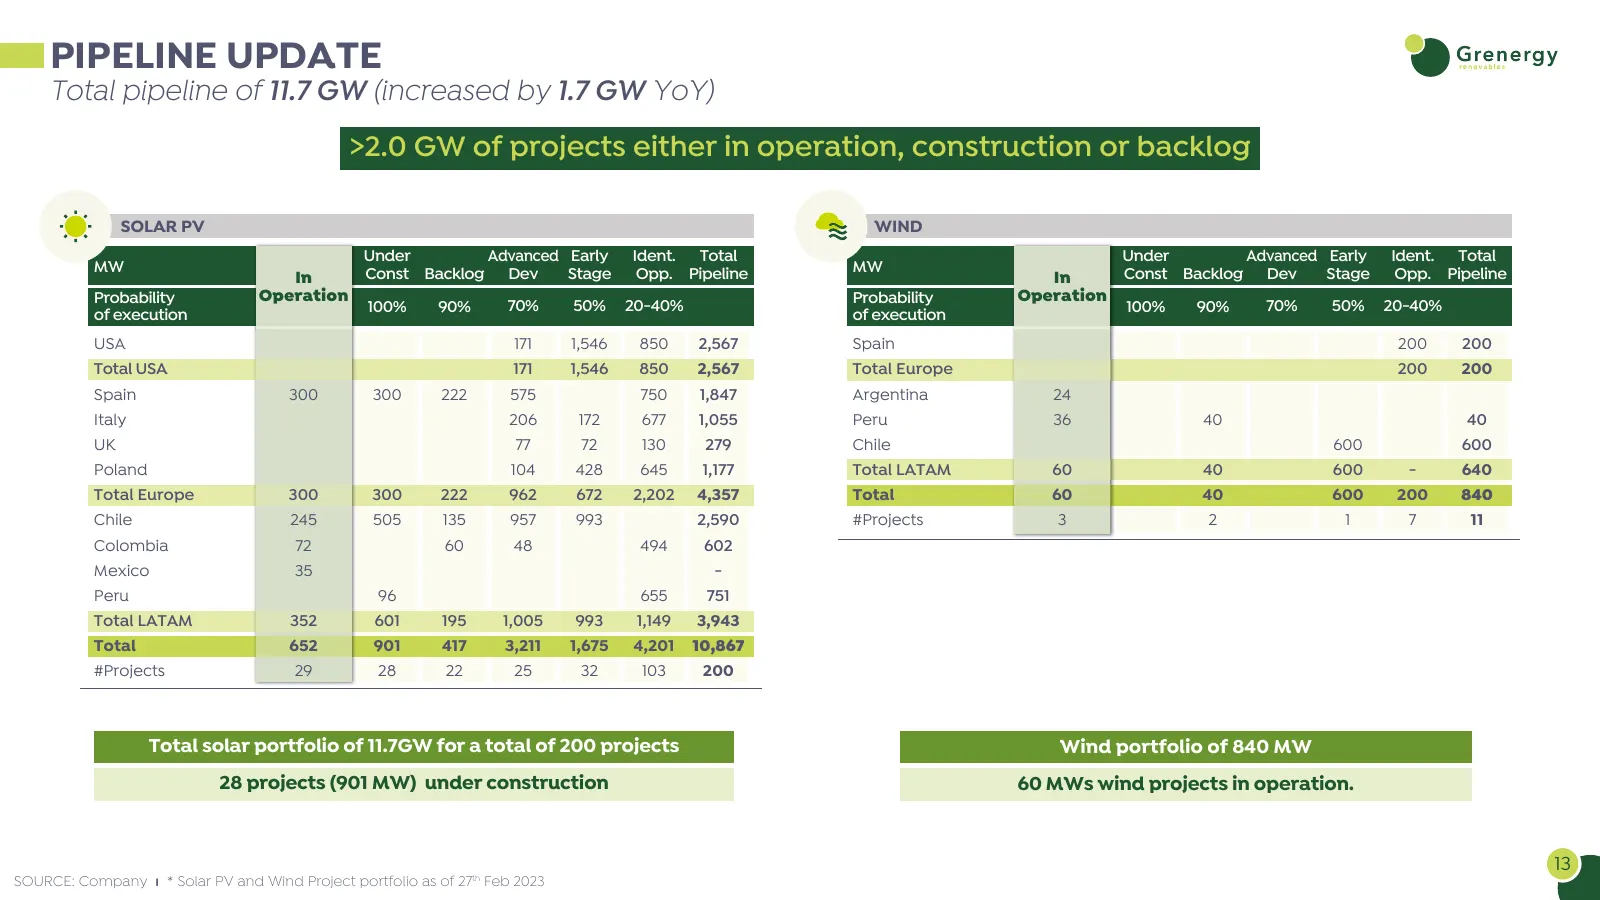
PIPELINE UPDATE Total pipeline of 11.7 GW (increased by 1.7 GW YoY) >2.0 GW of projects either in operation, construction or backlog SOLAR PV WIND Under Advanced Early Ident. Total Under Advanced Early Ident. Total MW Const Backlog Dev Stage Opp. Pipeline MW Const Backlog Dev Stage Opp. Pipeline In
Slide 14: Projects in Operation, Under Construction & Backlog
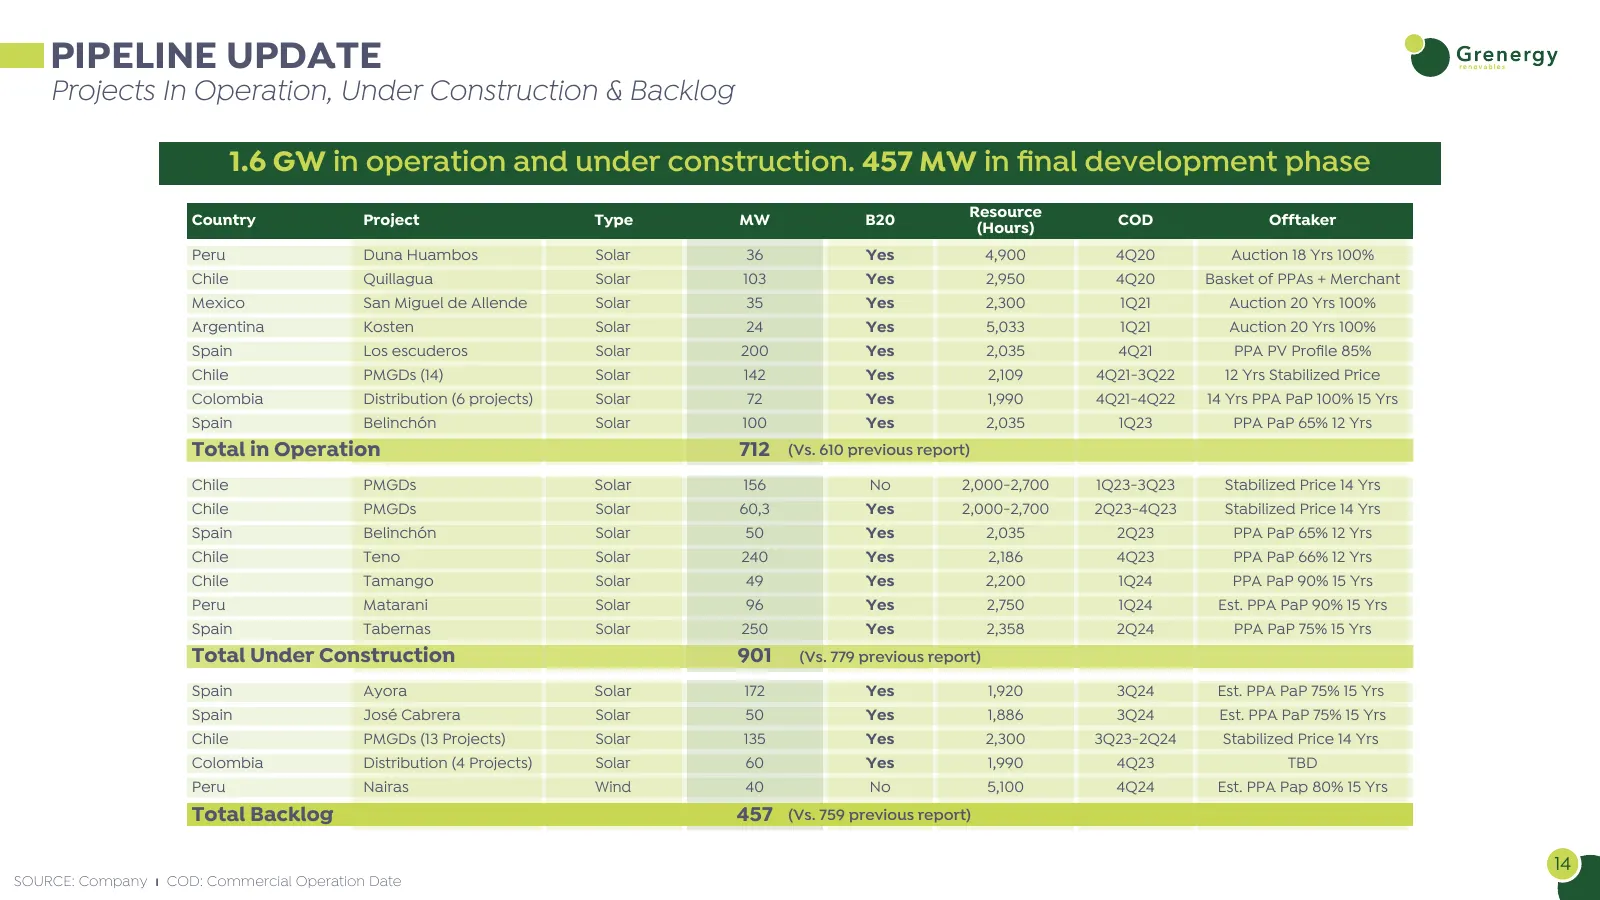
PIPELINE UPDATE Projects In Operation, Under Construction & Backlog 1.6 GW in operation and under construction. 457 MW in final development phase Country Project Type MW B20 Resource COD Offtaker (Hours) Peru Duna Huambos Solar 36 Yes 4,900 4Q20 Auction 18 Yrs 100% Chile Quillagua Solar 103 Yes 2,95
Slide 15: Projects in Advanced Development
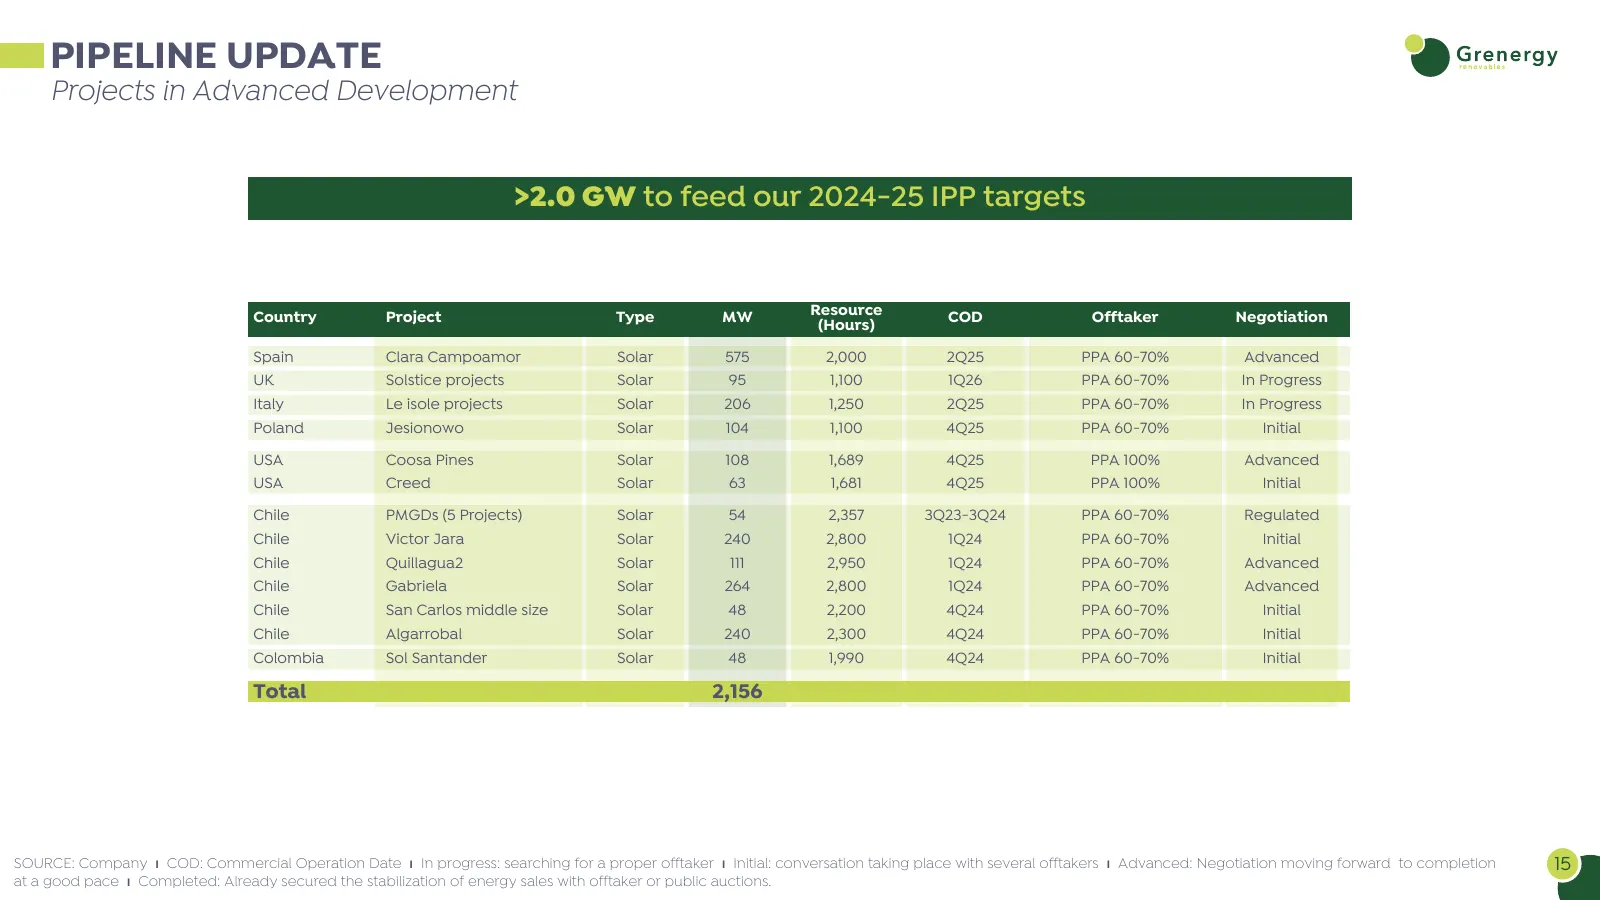
PIPELINE UPDATE Projects in Advanced Development >2.0 GW to feed our 2024-25 IPP targets Resource Country Project Type MW COD Offtaker Negotiation (Hours) Spain Clara Campoamor Solar 575 2,000 2Q25 PPA 60-70% Advanced UK Solstice projects Solar 95 1,100 1Q26 PPA 60-70% In Progress Italy Le isole pro
Slide 16: Strategy and Operational Targets - Storage Capex
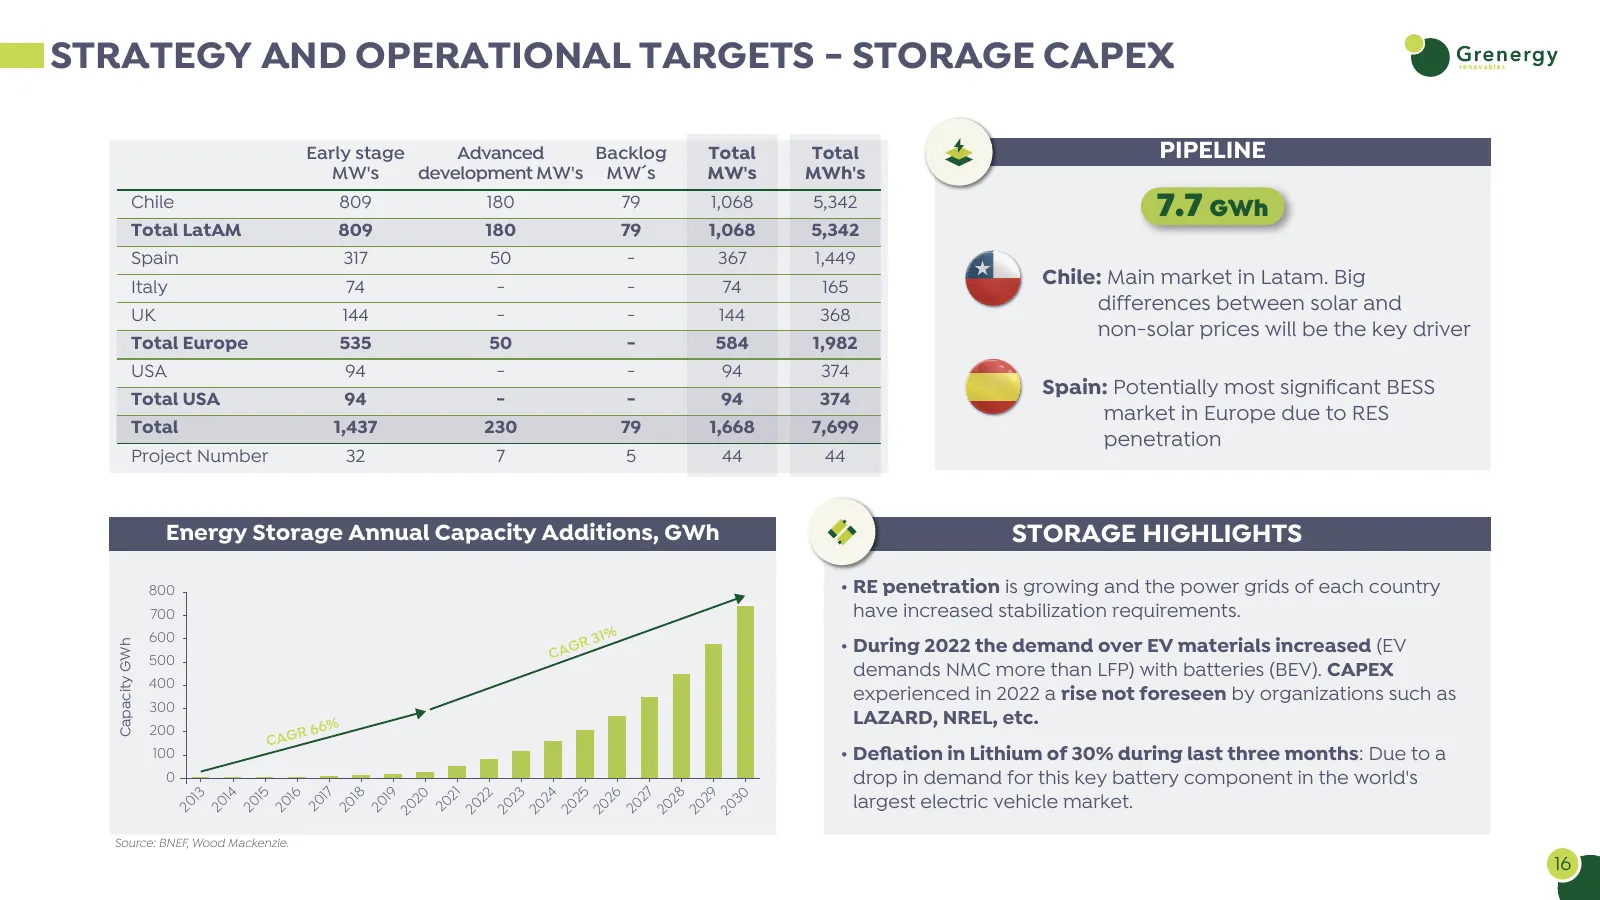
STRATEGY AND OPERATIONAL TARGETS - STORAGE CAPEX Early stage Advanced Backlog Total Total PIPELINE MW's development MW's MW´s MW's MWh's Chile 809 180 79 1,068 5,342 7.7 GWh Total LatAM 809 180 79 1,068 5,342 Spain 317 50 - 367 1,449 Italy 74 - - 74 165 Chile: Main market in Latam. Big UK 144 - - 14
Slide 17: Markets and Business Model
3 MARKETS AND BUSINESS MODEL Colombia
Slide 18: Build to Sell: Story of Success
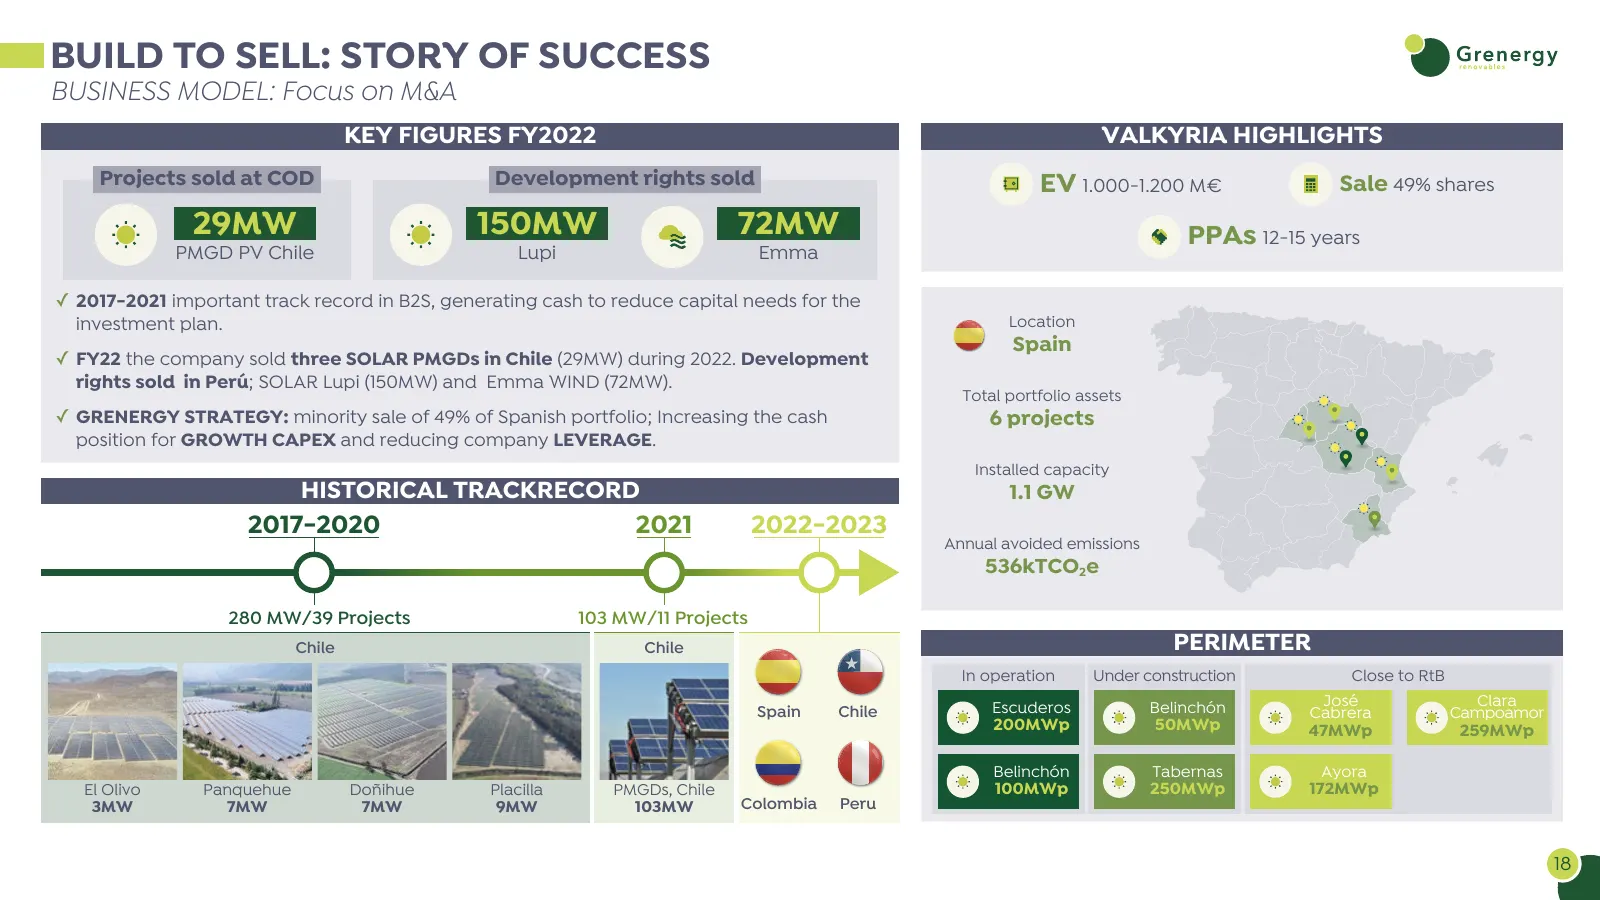
BUILD TO SELL: STORY OF SUCCESS BUSINESS MODEL: Focus on M&A KEY FIGURES FY2022 VALKYRIA HIGHLIGHTS Projects sold at COD Development rights sold EV 1.000-1.200 M€ Sale 49% shares 29MW 150MW 72MW PPAs 12-15 years PMGD PV Chile Lupi Emma ✓ 2017-2021 important track record in B2S, generating cash to re
Slide 19: Unprecedented Opportunity in the US
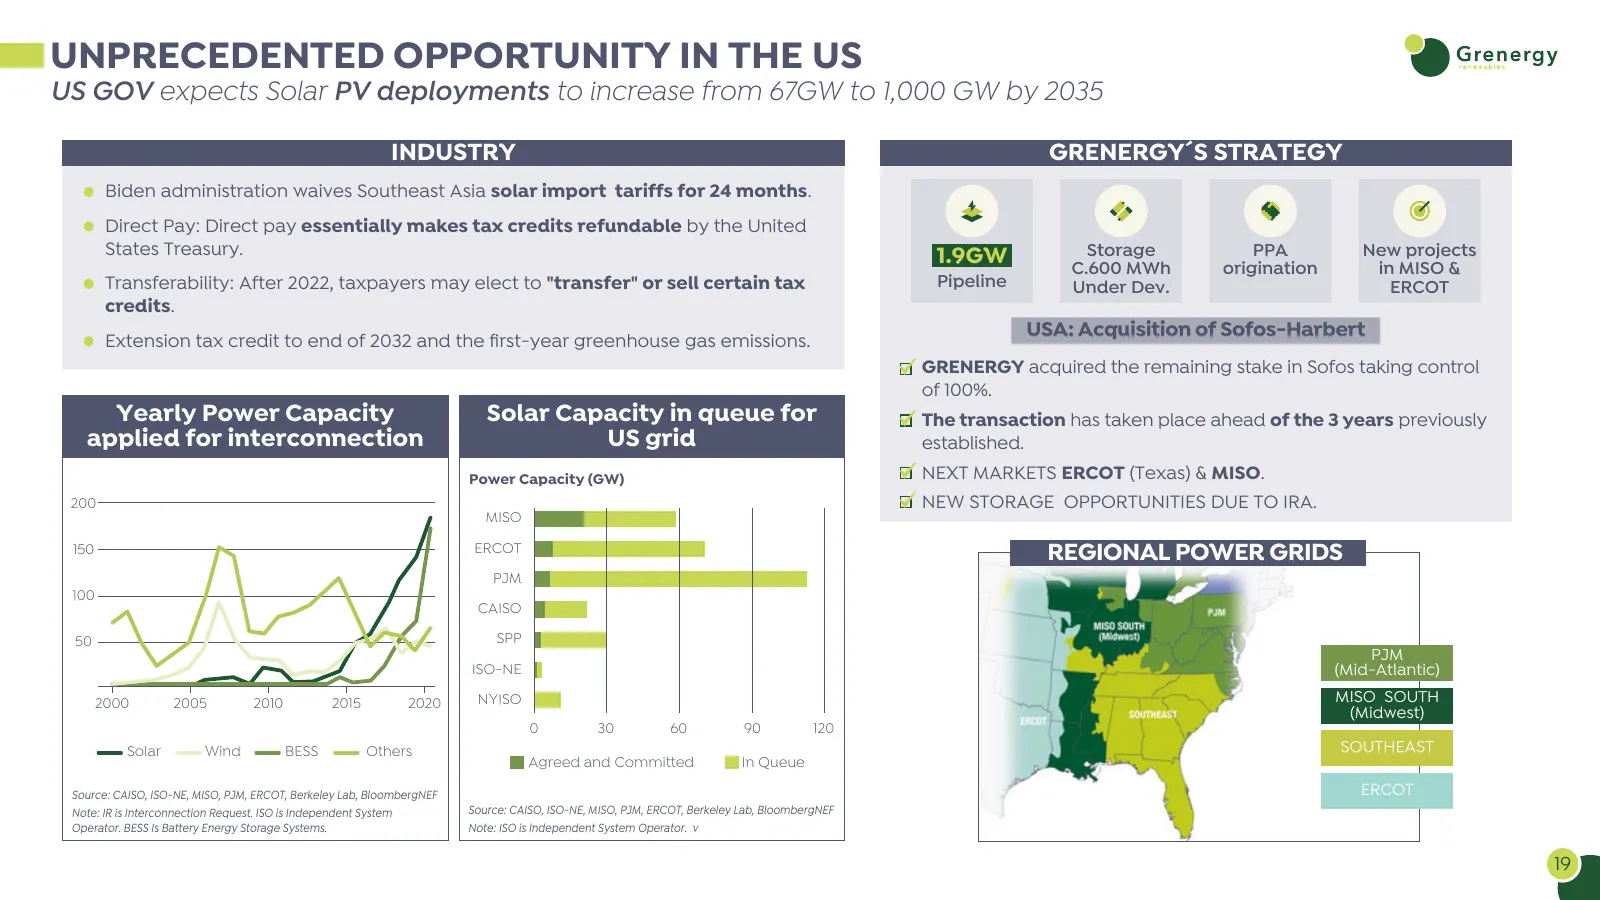
UNPRECEDENTED OPPORTUNITY IN THE US US GOV expects Solar PV deployments to increase from 67GW to 1,000 GW by 2035 INDUSTRY GRENERGY´S STRATEGY Biden administration waives Southeast Asia solar import tariffs for 24 months. Direct Pay: Direct pay essentially makes tax credits refundable by the United
Slide 20: REPowerEU: A plan to fast forward the Green transition
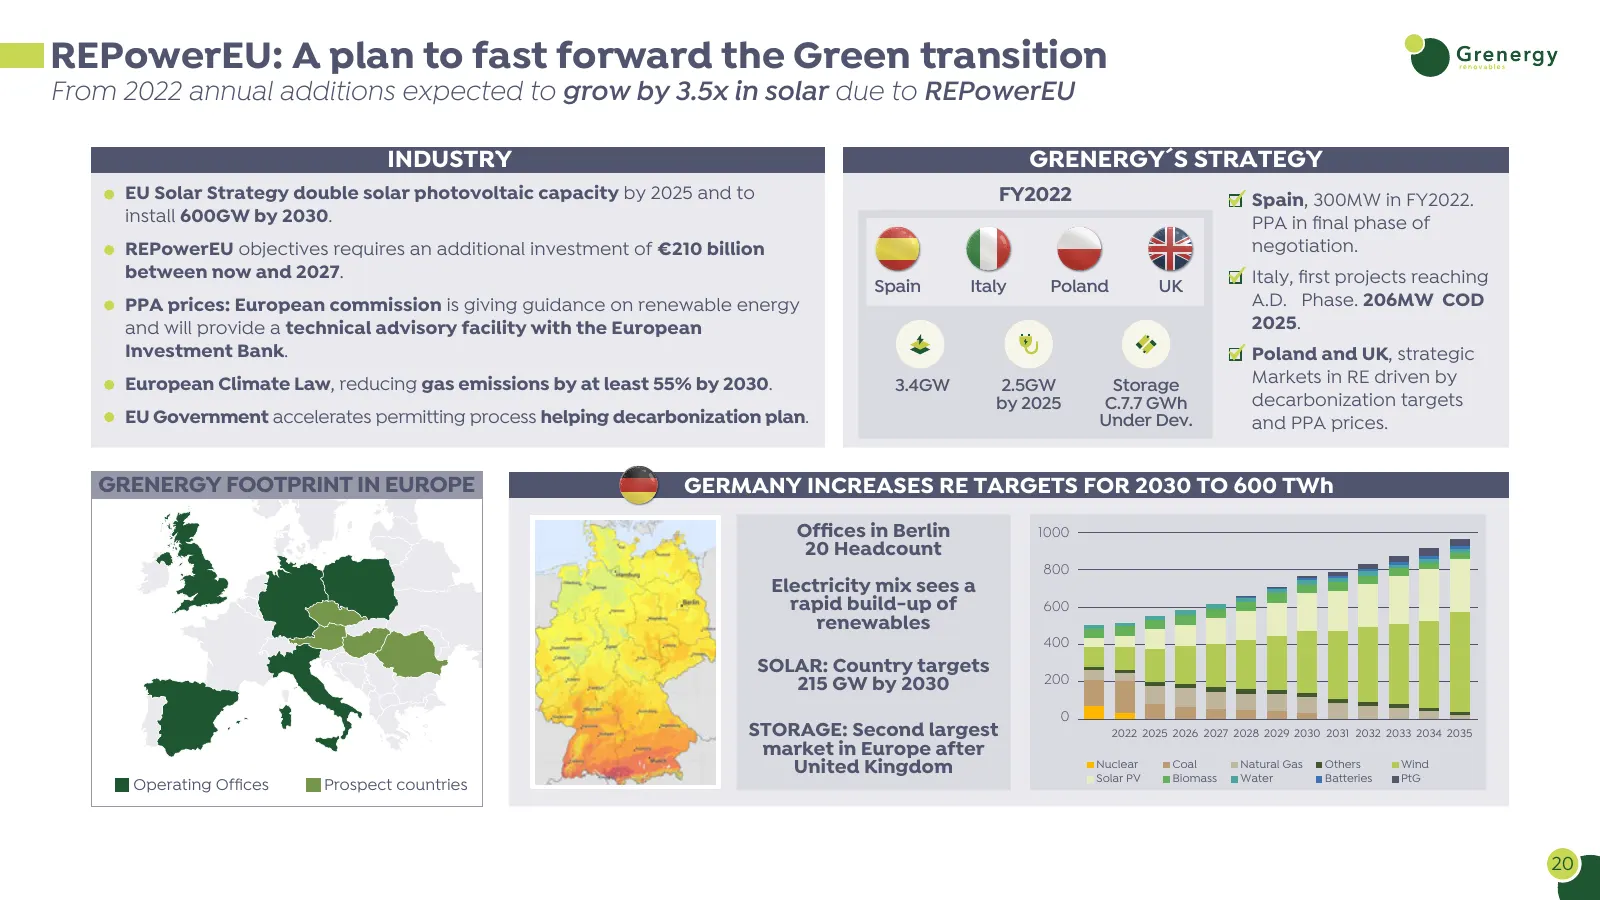
REPowerEU: A plan to fast forward the Green transition From 2022 annual additions expected to grow by 3.5x in solar due to REPowerEU INDUSTRY GRENERGY´S STRATEGY EU Solar Strategy double solar photovoltaic capacity by 2025 and to FY2022 Spain, 300MW in FY2022. install 600GW by 2030. PPA in final pha

Slide 21: ESG Commitments
4 ESG COMMITMENTS Colombia
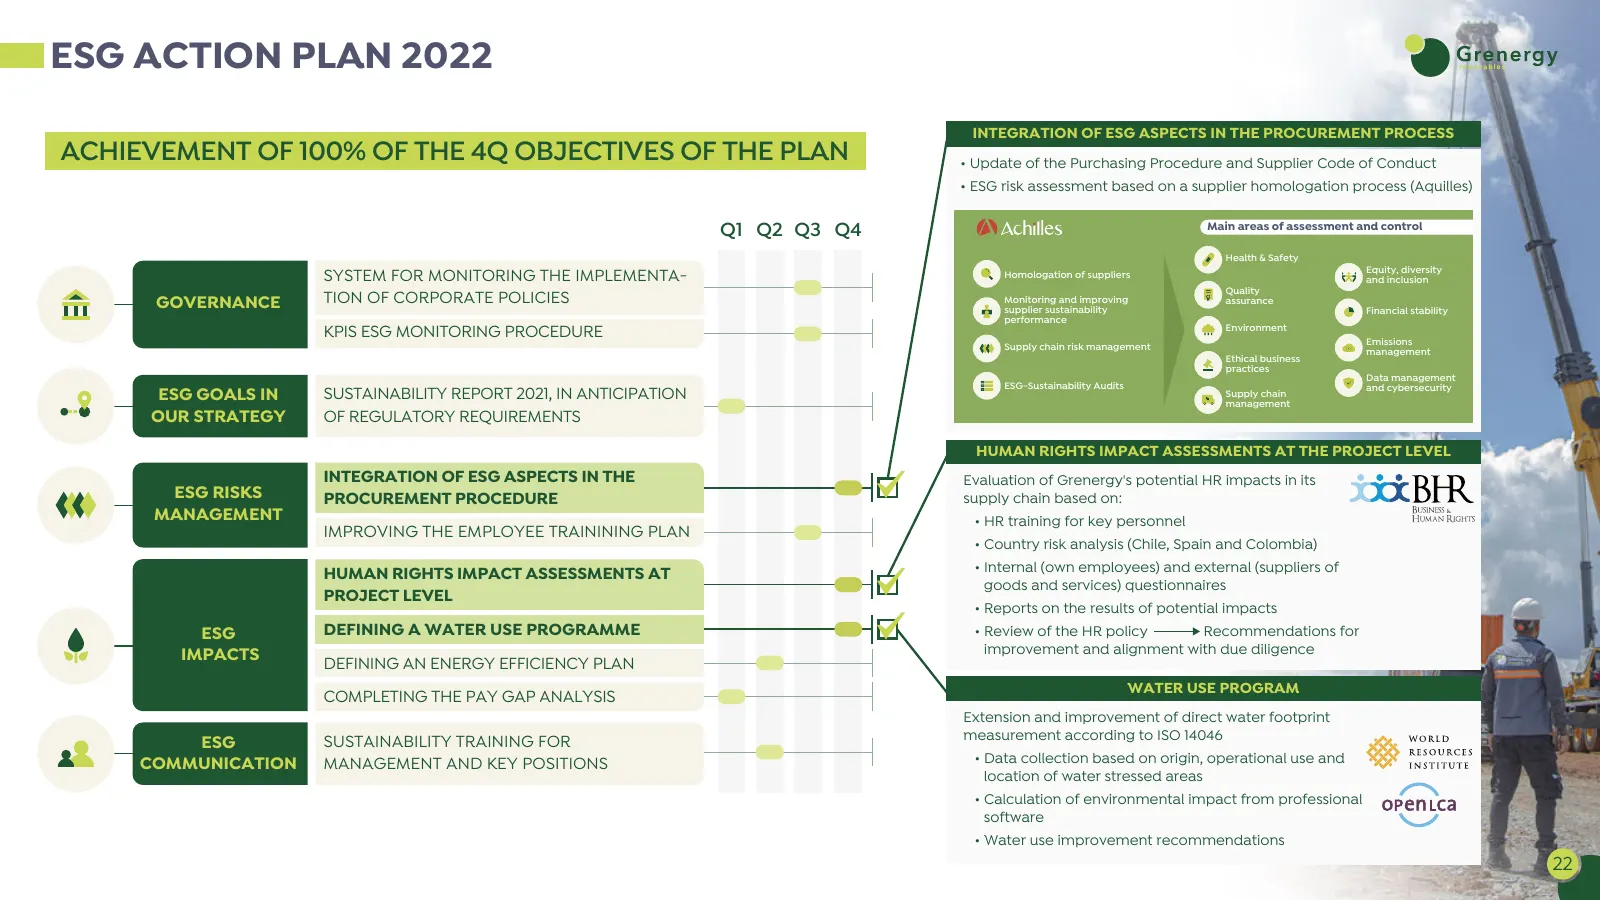
Slide 22: ESG Action Plan 2022
ESG ACTION PLAN 2022 INTEGRATION OF ESG ASPECTS IN THE PROCUREMENT PROCESS ACHIEVEMENT OF 100% OF THE 4Q OBJECTIVES OF THE PLAN • Update of the Purchasing Procedure and Supplier Code of Conduct • ESG risk assessment based on a supplier homologation process (Aquilles) Q1 Q2 Q3 Q4 Main areas of assess
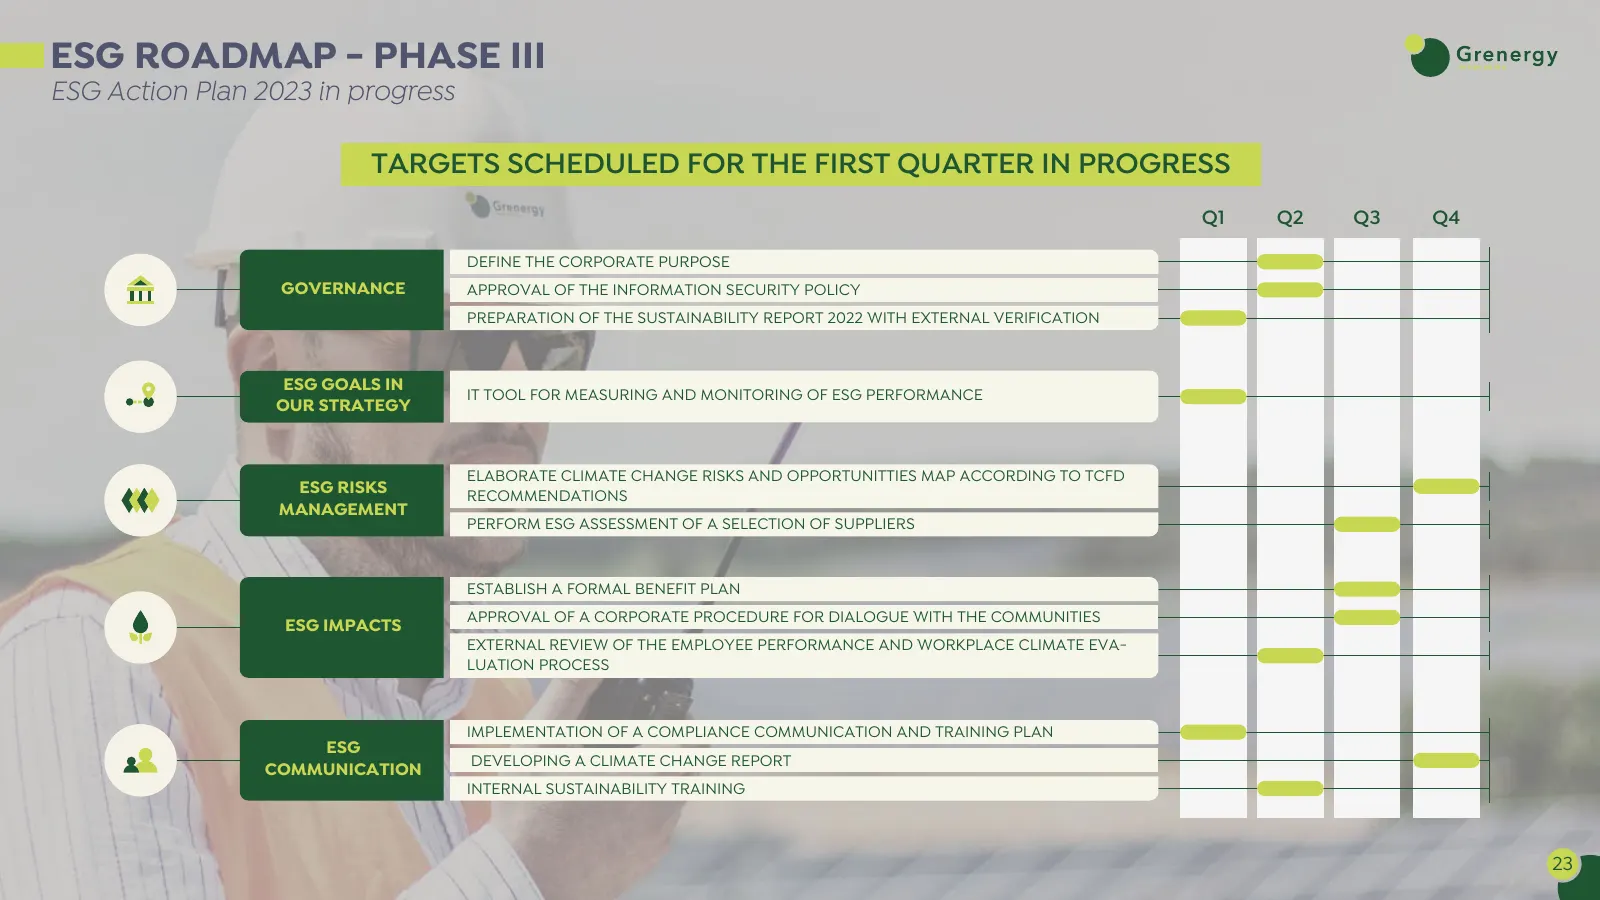
Slide 23: ESG Roadmap - Phase III
ESG ROADMAP - PHASE III ESG Action Plan 2023 in progress TARGETS SCHEDULED FOR THE FIRST QUARTER IN PROGRESS Q1 Q2 Q3 Q4 DEFINE THE CORPORATE PURPOSE GOVERNANCE APPROVAL OF THE INFORMATION SECURITY POLICY PREPARATION OF THE SUSTAINABILITY REPORT 2022 WITH EXTERNAL VERIFICATION ESG GOALS IN IT TOOL F
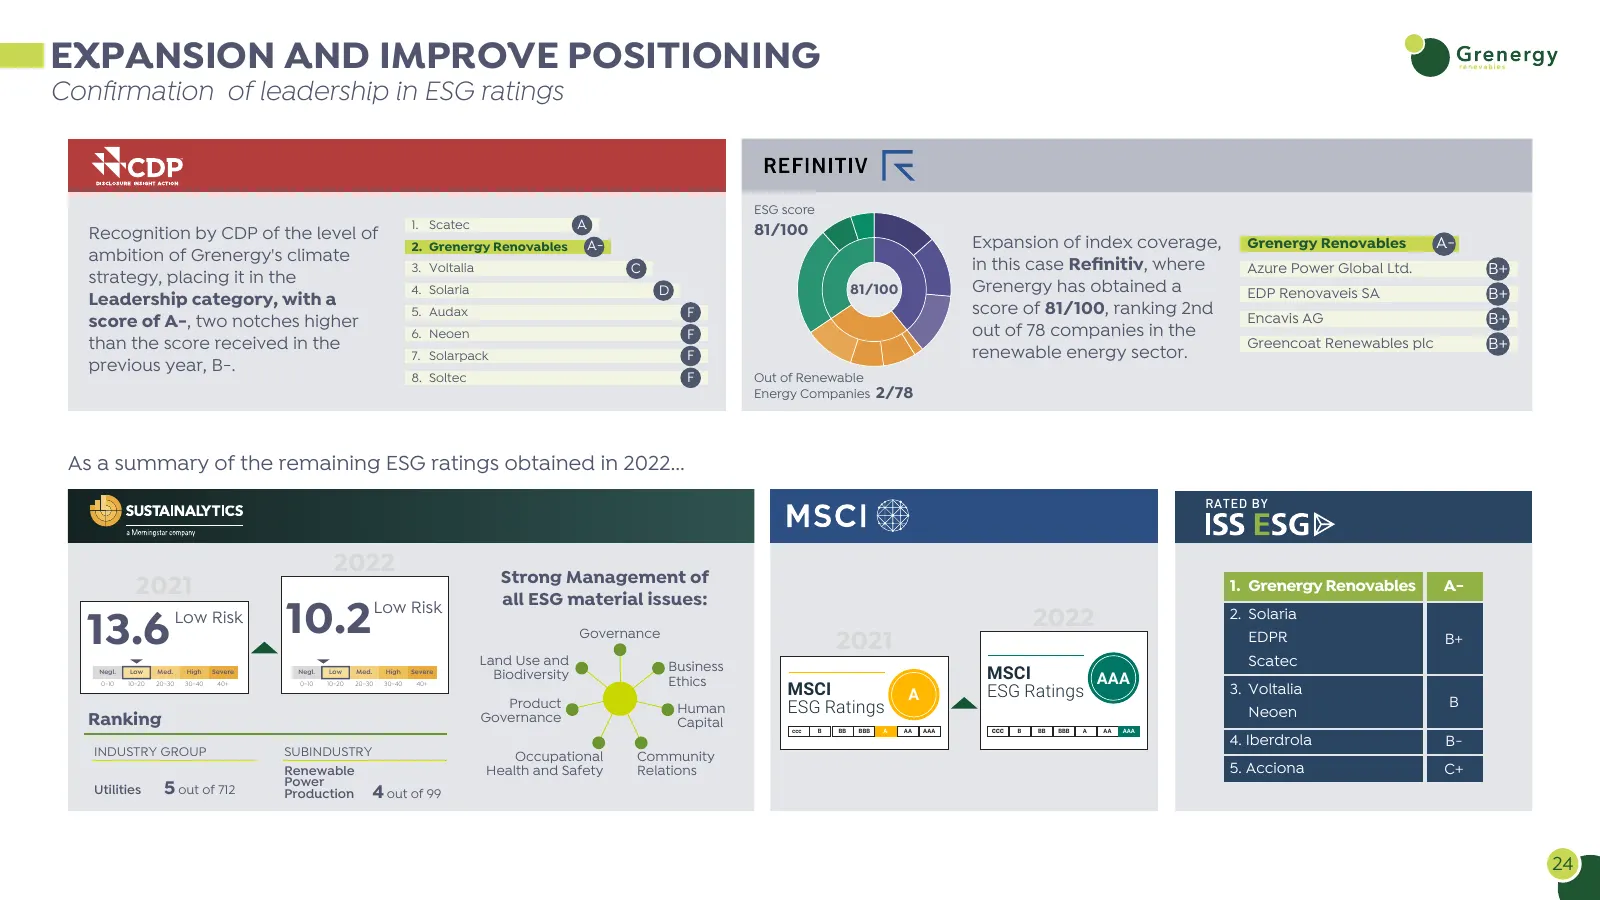
Slide 24: Expansion and Improve Positioning
EXPANSION AND IMPROVE POSITIONING Confirmation of leadership in ESG ratings ESG score 1. Scatec A 81/100 Recognition by CDP of the level of 2. Grenergy Renovables A- Expansion of index coverage, Grenergy Renovables A- ambition of Grenergy's climate 3. Voltalia C in this case Refinitiv, where Azure P
Slide 25: Appendices
APPENDICES
Slide 26: Platform with Relevant Growth Potential
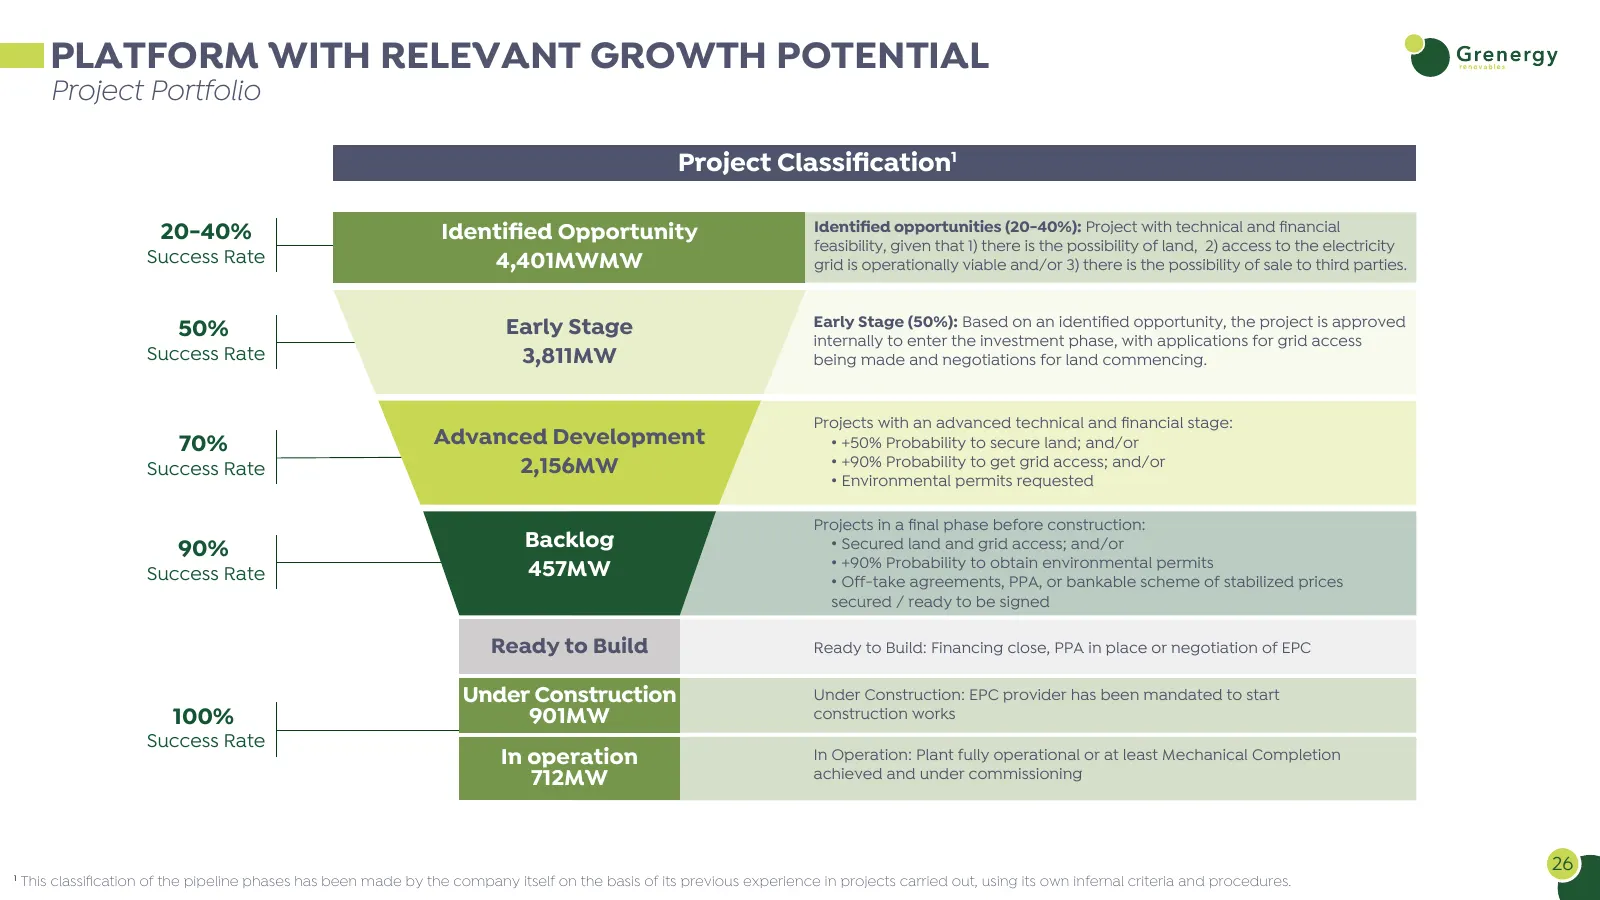
PLATFORM WITH RELEVANT GROWTH POTENTIAL Project Portfolio Project Classification1 20-40% Identified Opportunity Identified opportunities (20-40%): Project with technical and financial feasibility, given that 1) there is the possibility of land, 2) access to the electricity Success Rate 4,401MWMW grid is
Slide 27: FY22 Results: Profit and Losses
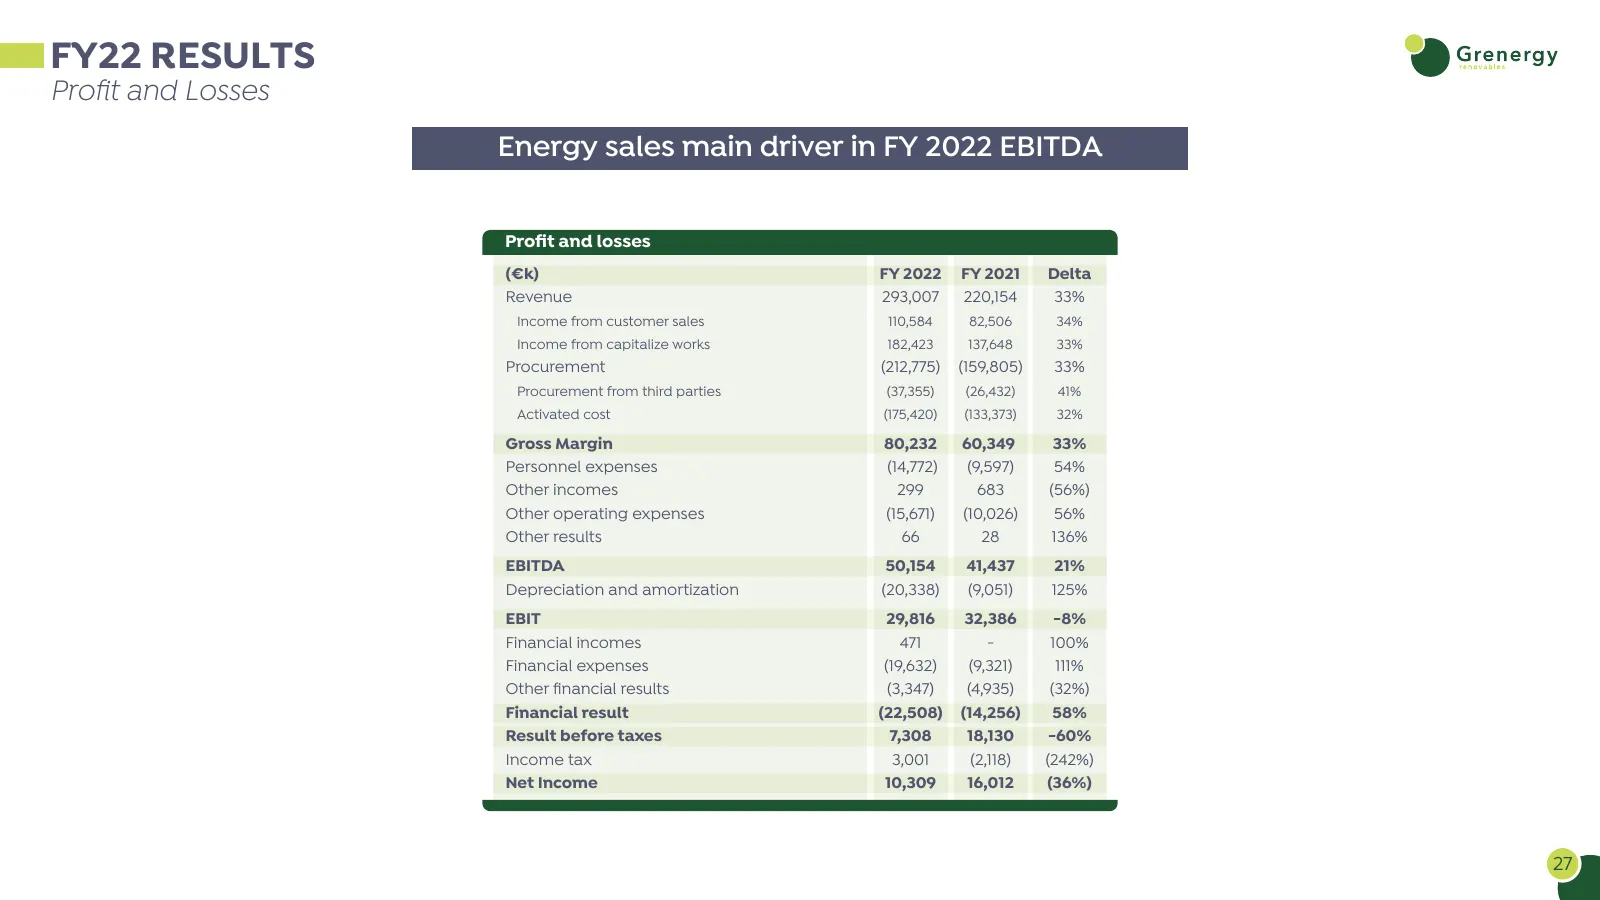
FY22 RESULTS Profit and Losses Energy sales main driver in FY 2022 EBITDA Profit and losses (€k) FY 2022 FY 2021 Delta Revenue 293,007 220,154 33% Income from customer sales 110,584 82,506 34% Income from capitalize works 182,423 137,648 33% Procurement (212,775) (159,805) 33% Procurement from third
Slide 28: FY22 Results: Balance Sheet
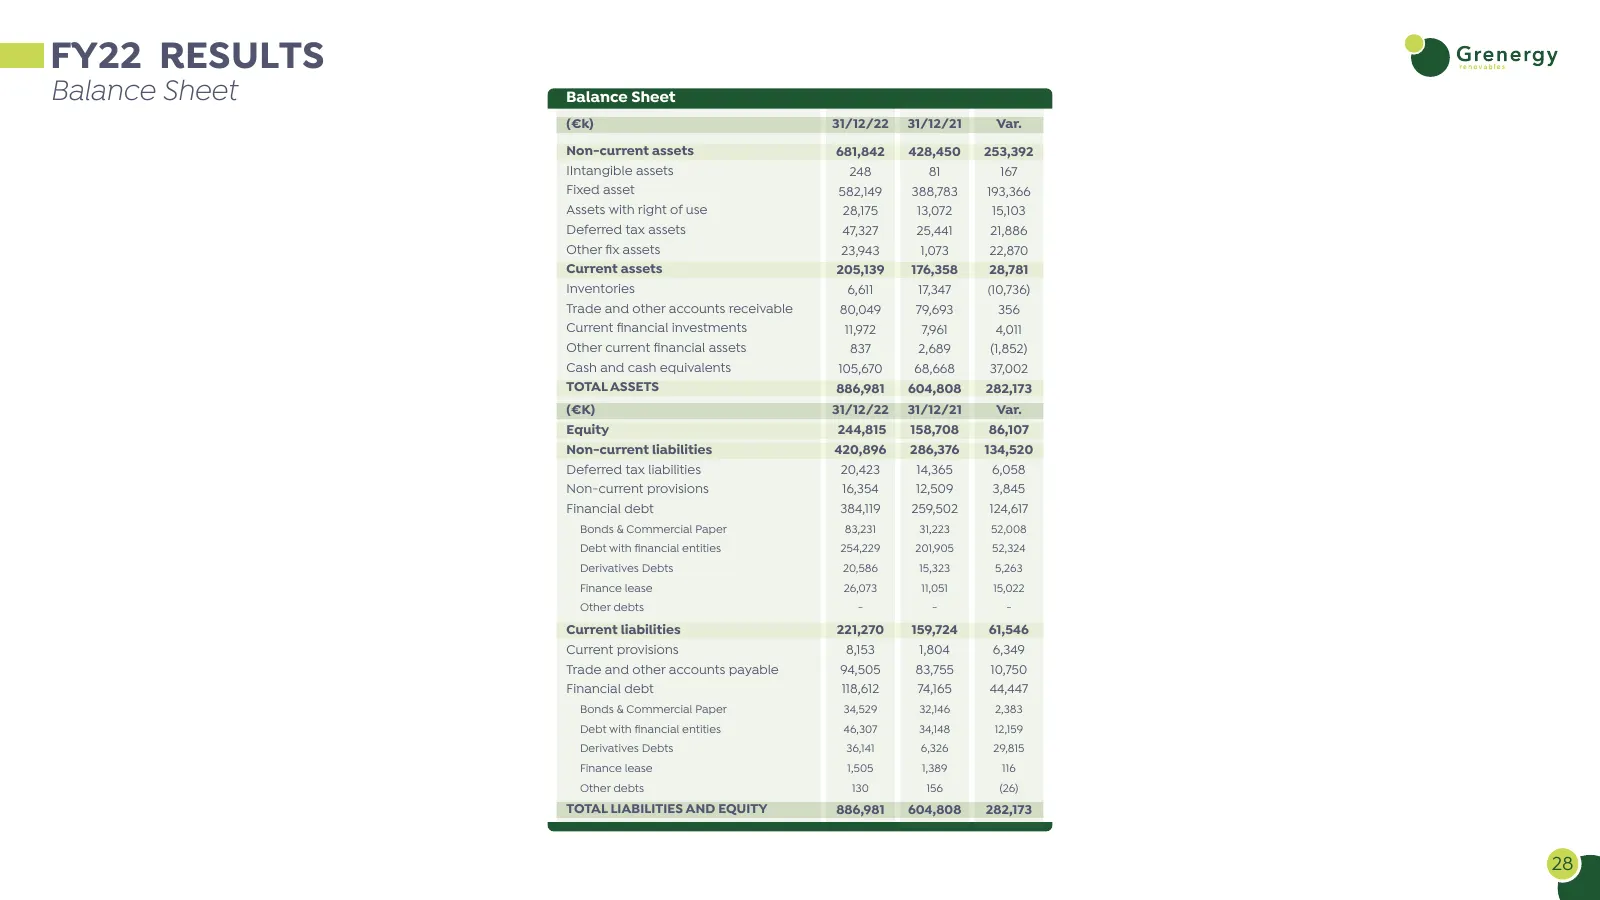
FY22 RESULTS Balance Sheet Balance Sheet (€k) 31/12/22 31/12/21 Var. Non-current assets 681,842 428,450 253,392 IIntangible assets 248 81 167 Fixed asset 582,149 388,783 193,366 Assets with right of use 28,175 13,072 15,103 Deferred tax assets 47,327 25,441 21,886 Other fix assets 23,943 1,073 22,87
Slide 29: FY22 Results: Net Debt
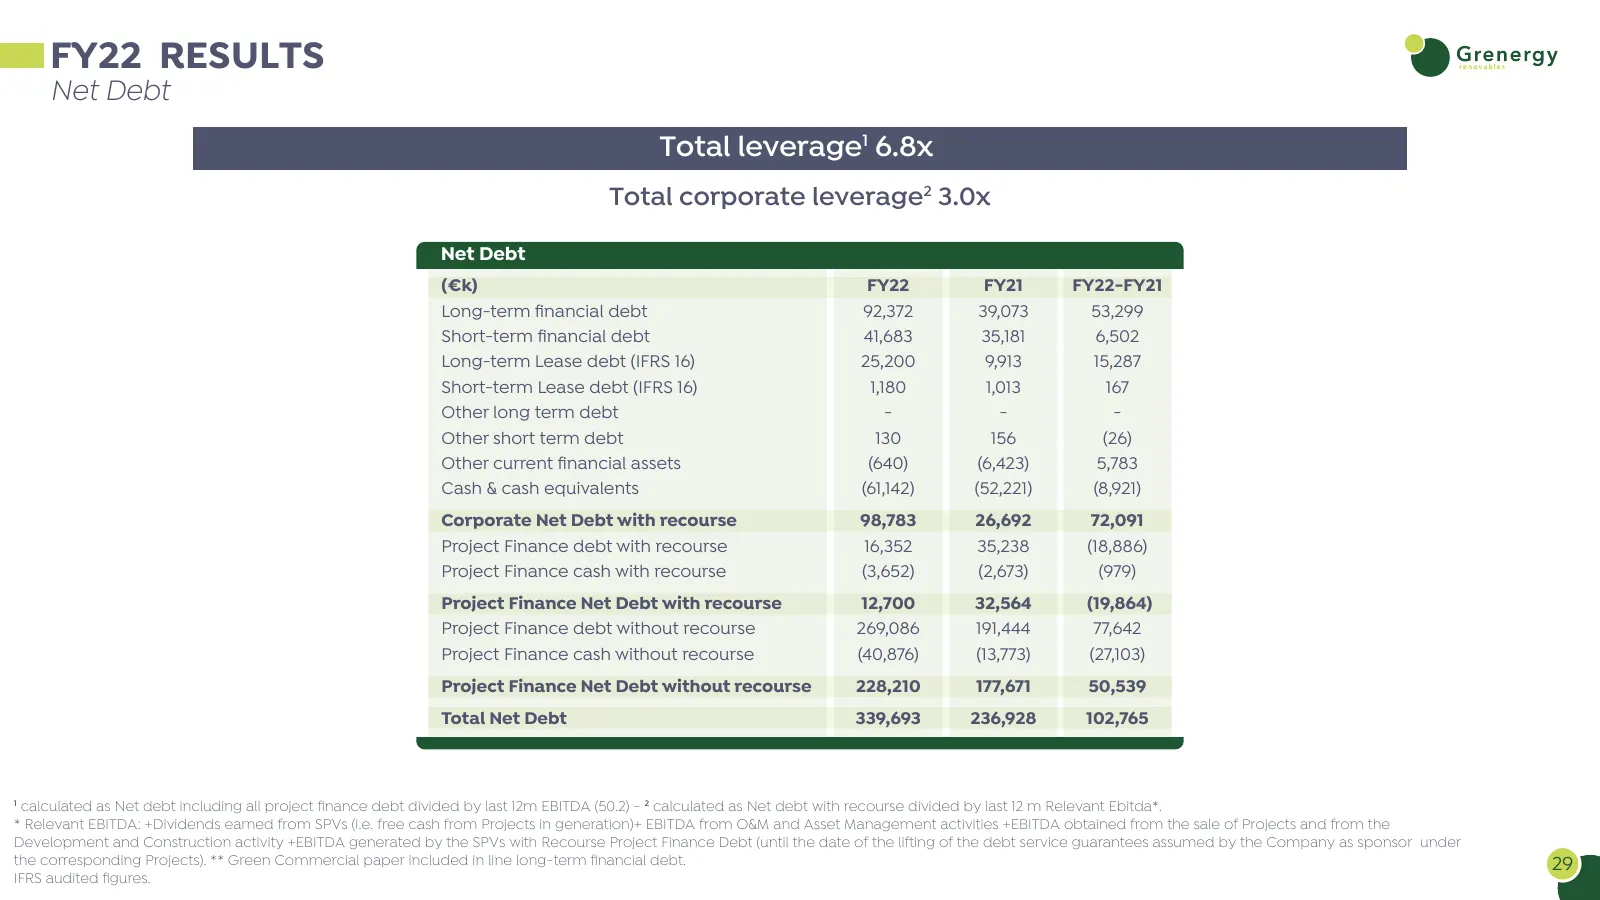
FY22 RESULTS Net Debt Total leverage1 6.8x Total corporate leverage2 3.0x Net Debt (€k) FY22 FY21 FY22-FY21 Long-term financial debt 92,372 39,073 53,299 Short-term financial debt 41,683 35,181 6,502 Long-term Lease debt (IFRS 16) 25,200 9,913 15,287 Short-term Lease debt (IFRS 16) 1,180 1,013 167 O
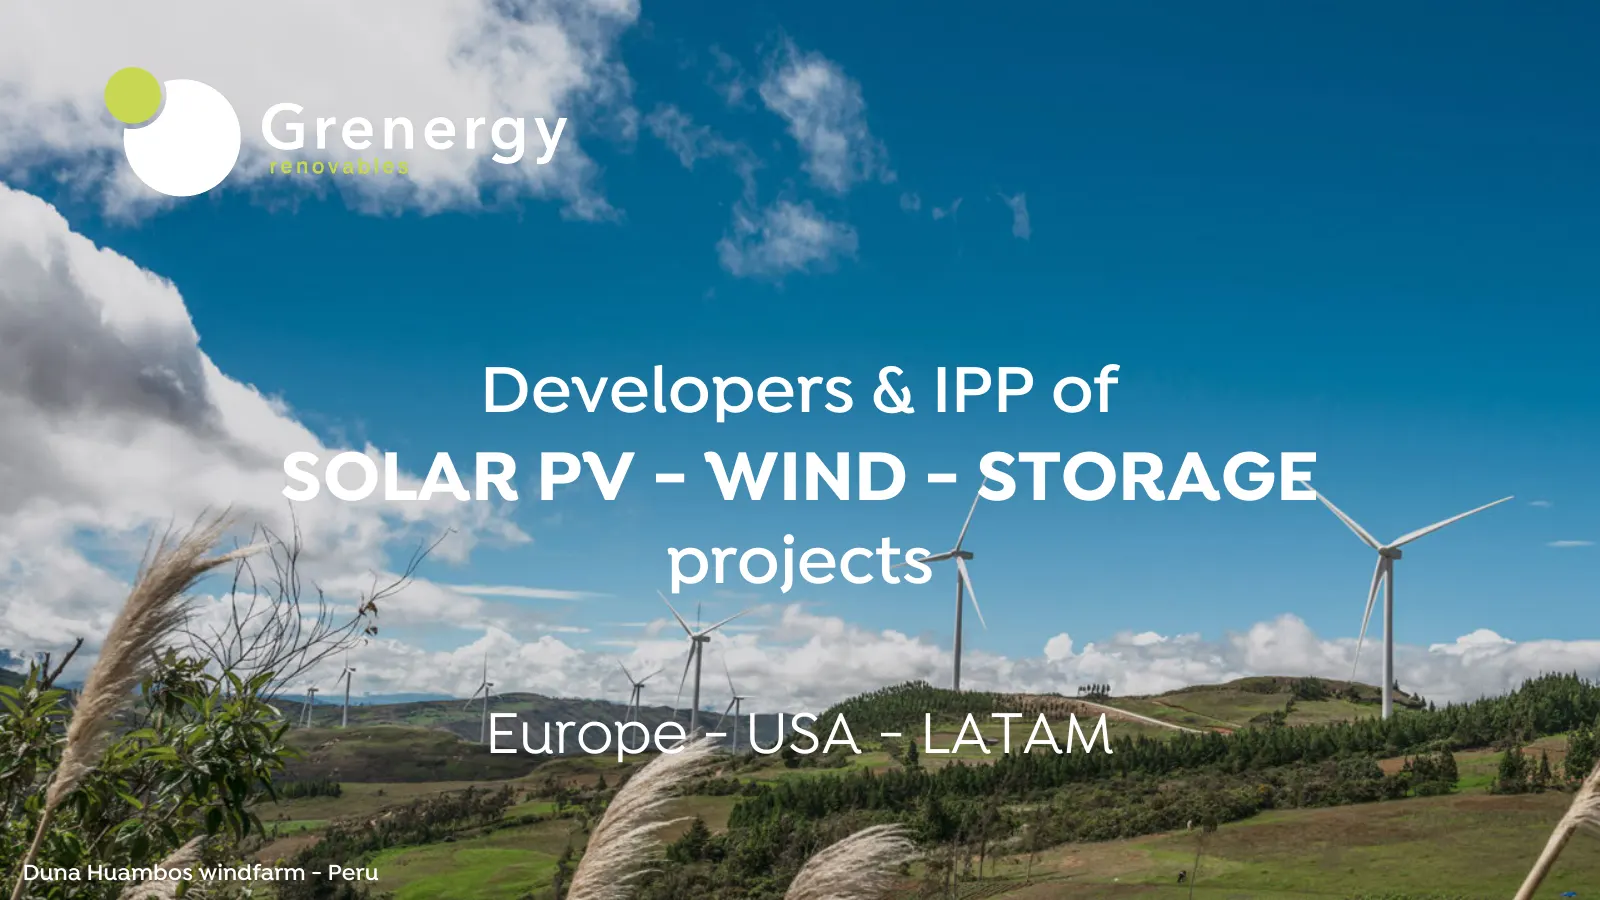
Slide 30: Developers & IPP of Solar PV, Wind, Storage projects
Developers & IPP of SOLAR PV - WIND - STORAGE projects Europe - USA - LATAM Duna Huambos windfarm - Peru
Source: Internet Archive copy of grenergy.eu
More decks from Grenergy Renovables S.A
 H1 2026 Earnings Presentation38 slides · Sep 16, 2026
 Investor Presentation (September 2026)55 slides · September 2026
 Investor Presentation (July 2026)46 slides · July 2026
 Q1 2026 Earnings Presentation50 slides · May 27, 2026
 9M 2025 Earnings Presentation36 slides · Nov 27, 2025
 Investor Day (May 2025)50 slides · May 28, 2025