Endurance Specialty Holdings Ltd
Endurance Specialty — Q1 2009 Earnings Presentation
9 slides from Endurance Specialty's earnings presentation, May 7, 2009
Slide 1: 1st Quarter 2009 Earnings Call
1stQuarter 2009 Earnings Call
Slide 2: Forward looking statements & Regulation G disclaimer
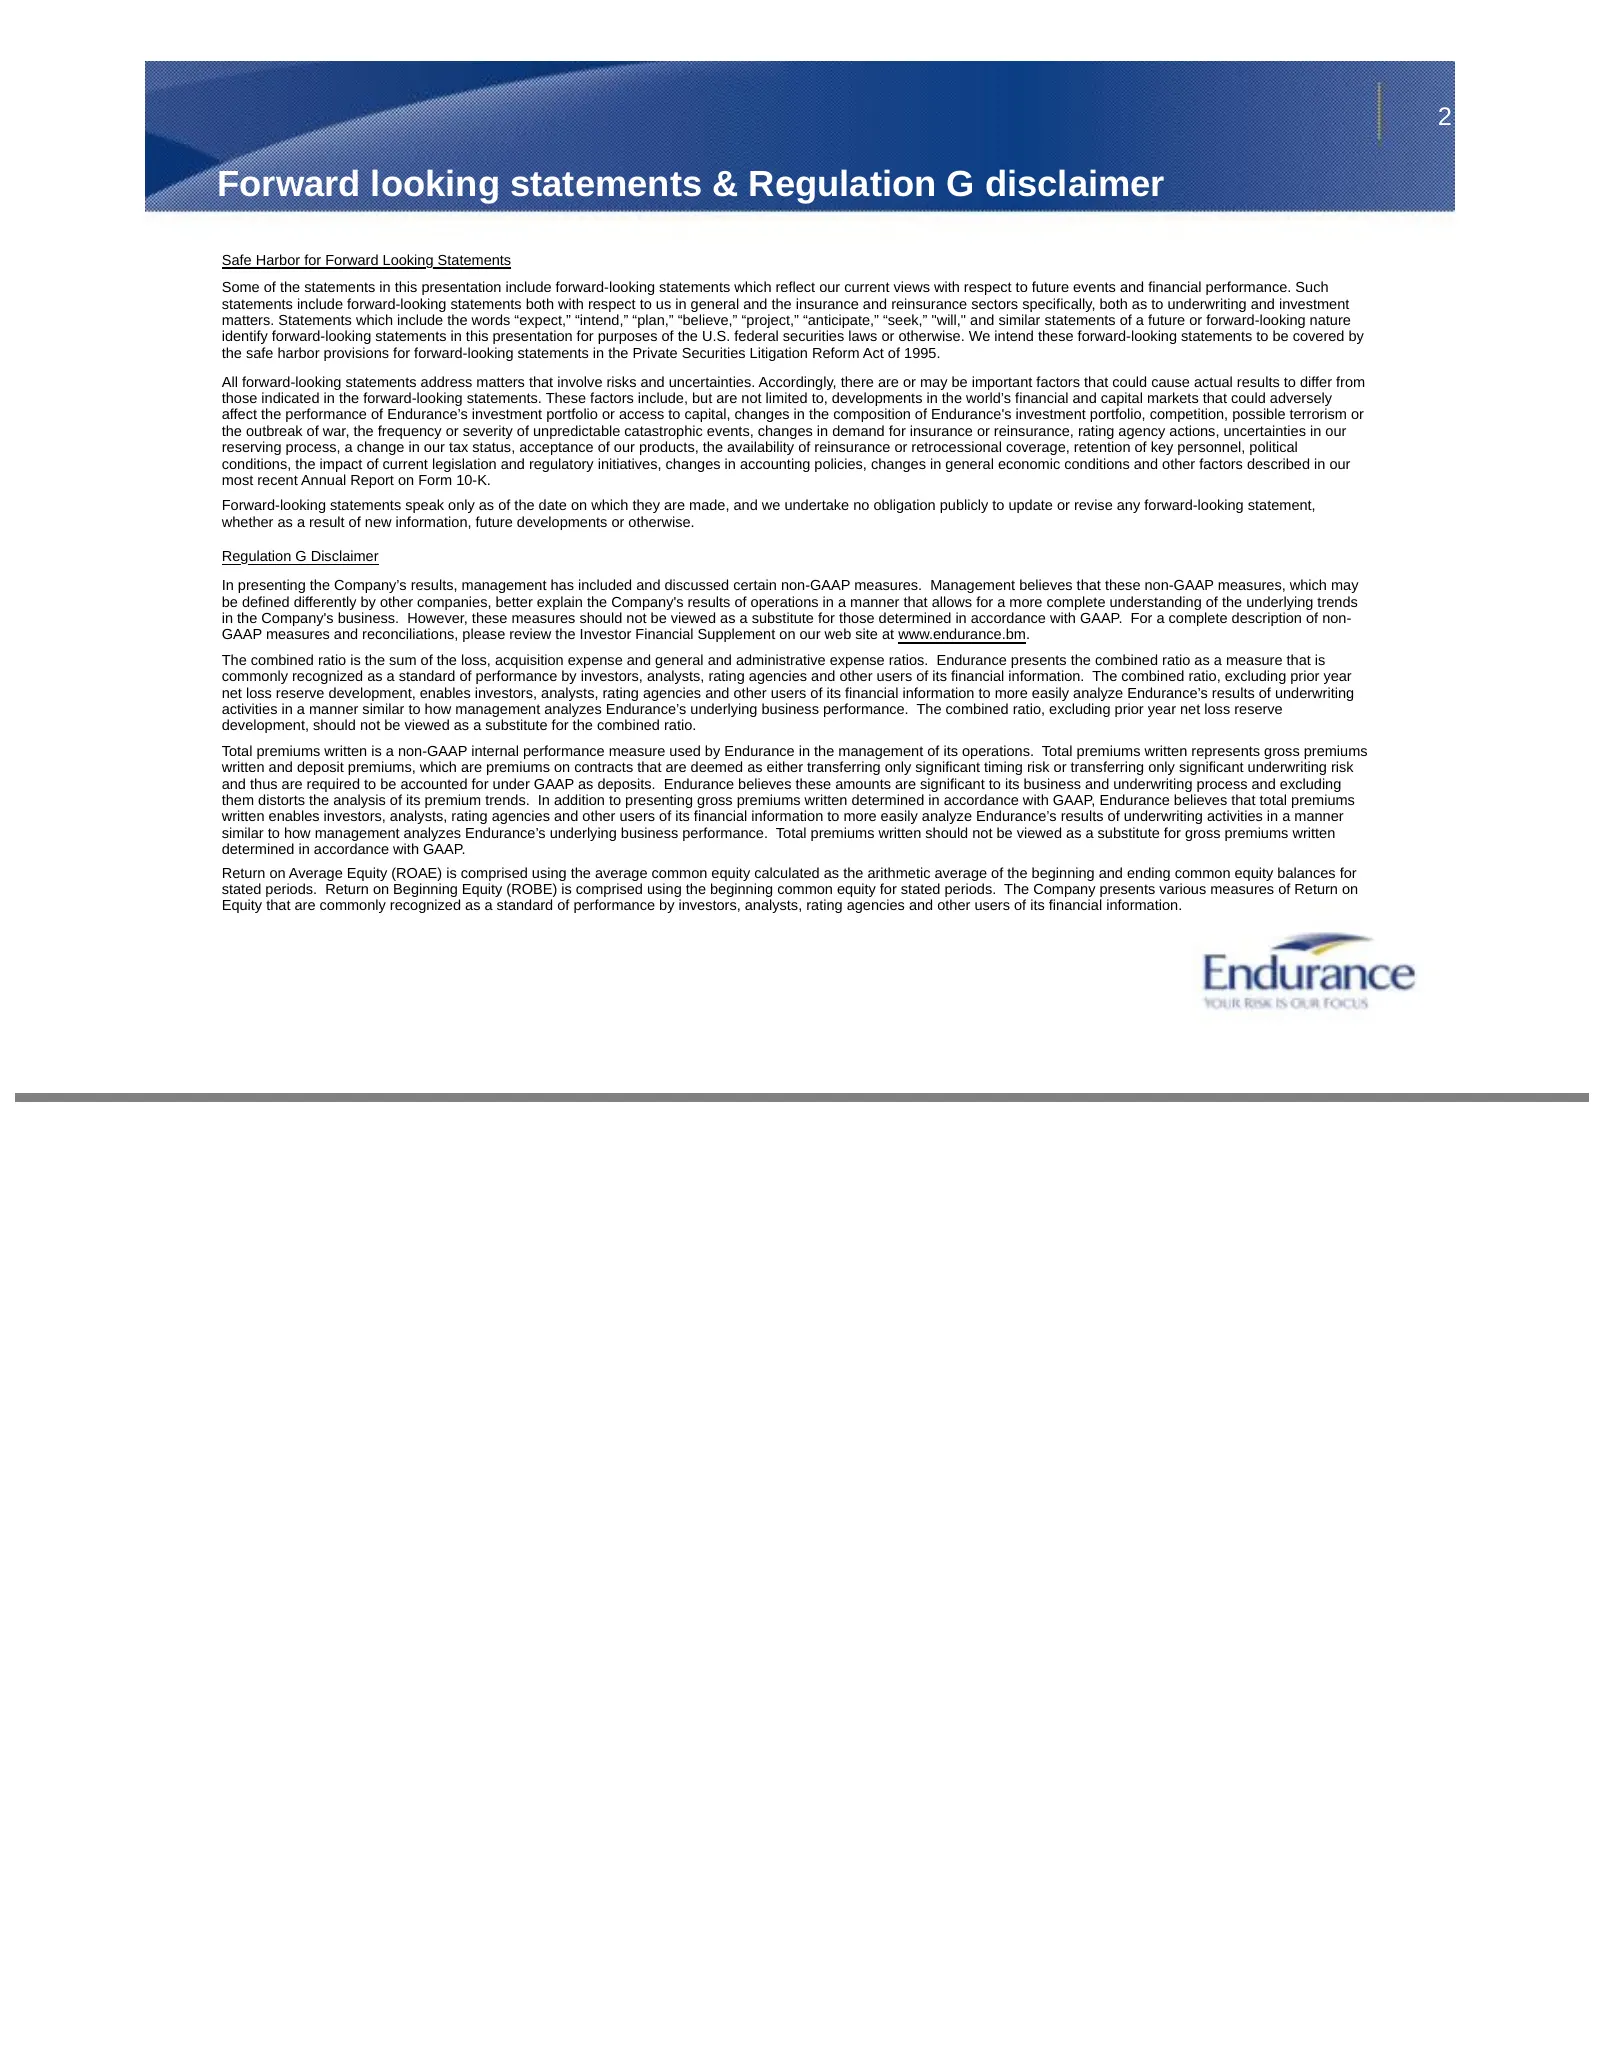
2 Forward looking statements & Regulation G disclaimer Safe Harbor for Forward Looking Statements Some of the statements in this presentation include forward-looking statements which reflect our current views with respect to future events and financial performance. Such statements include forward-lo
Slide 3: First quarter 2009 overview
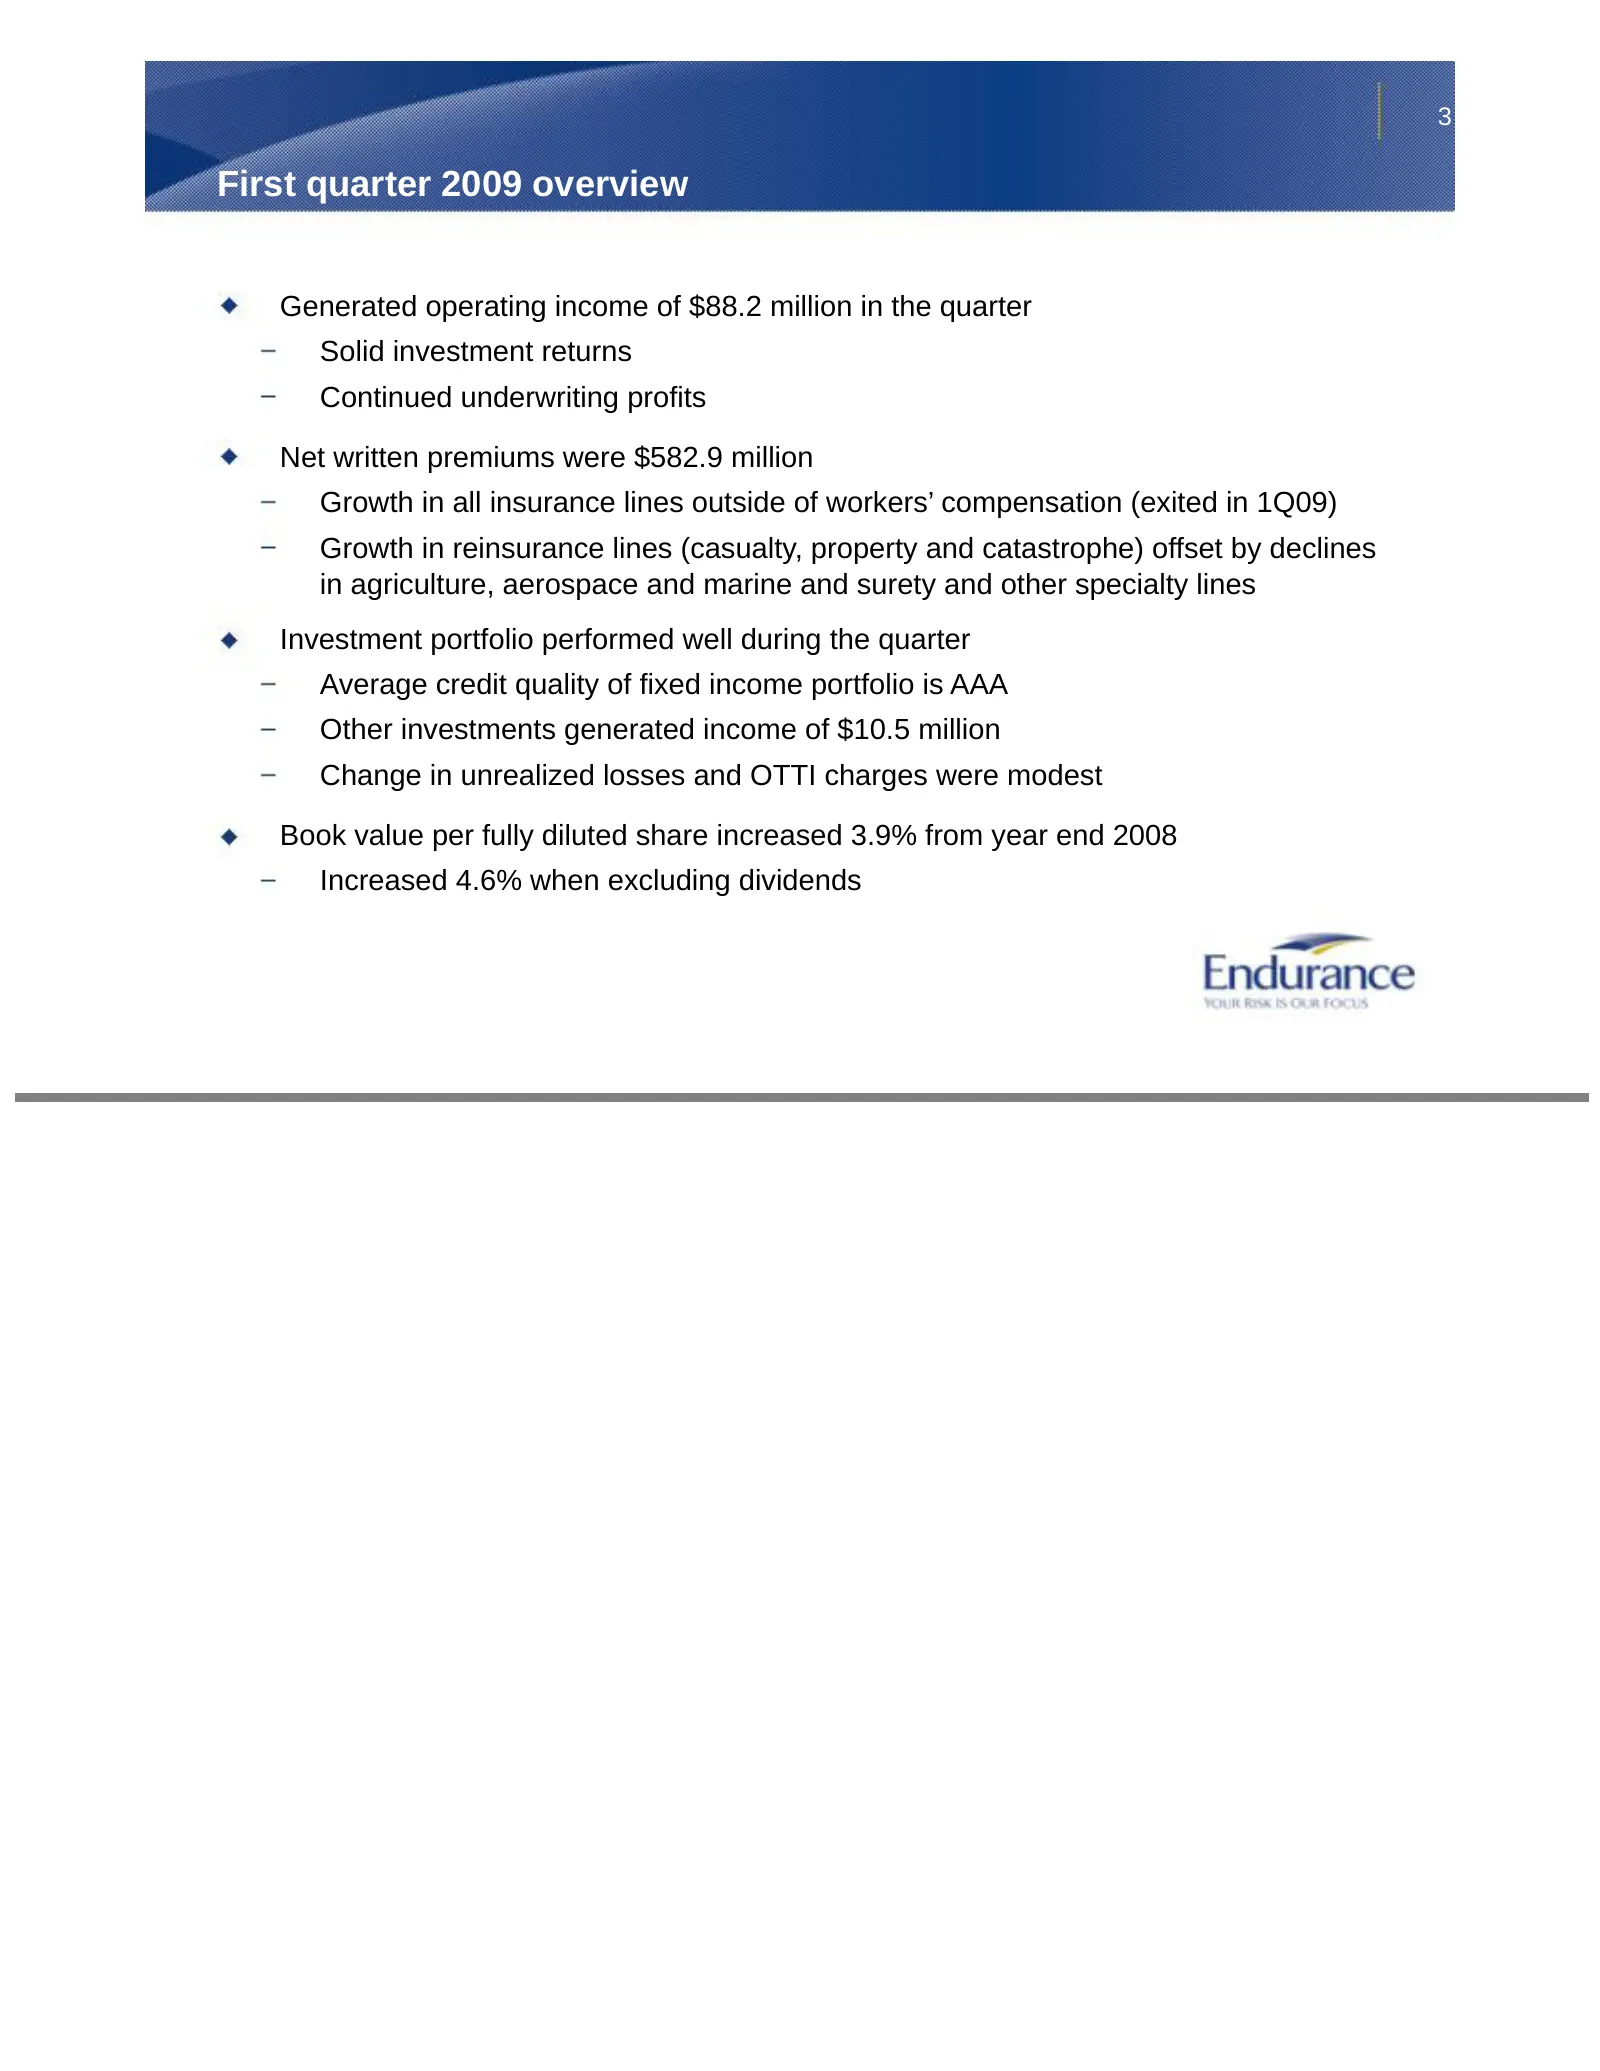
3 First quarter 2009 overview Generated operating income of $88.2 million in the quarter Solid investment returns Continued underwriting profits Net written premiums were $582.9 million Growth in all insurance lines outside of workers’ compensation (exited in 1Q09) Growth in reinsurance lines (casua
Slide 4: Financial results for first quarter 2009
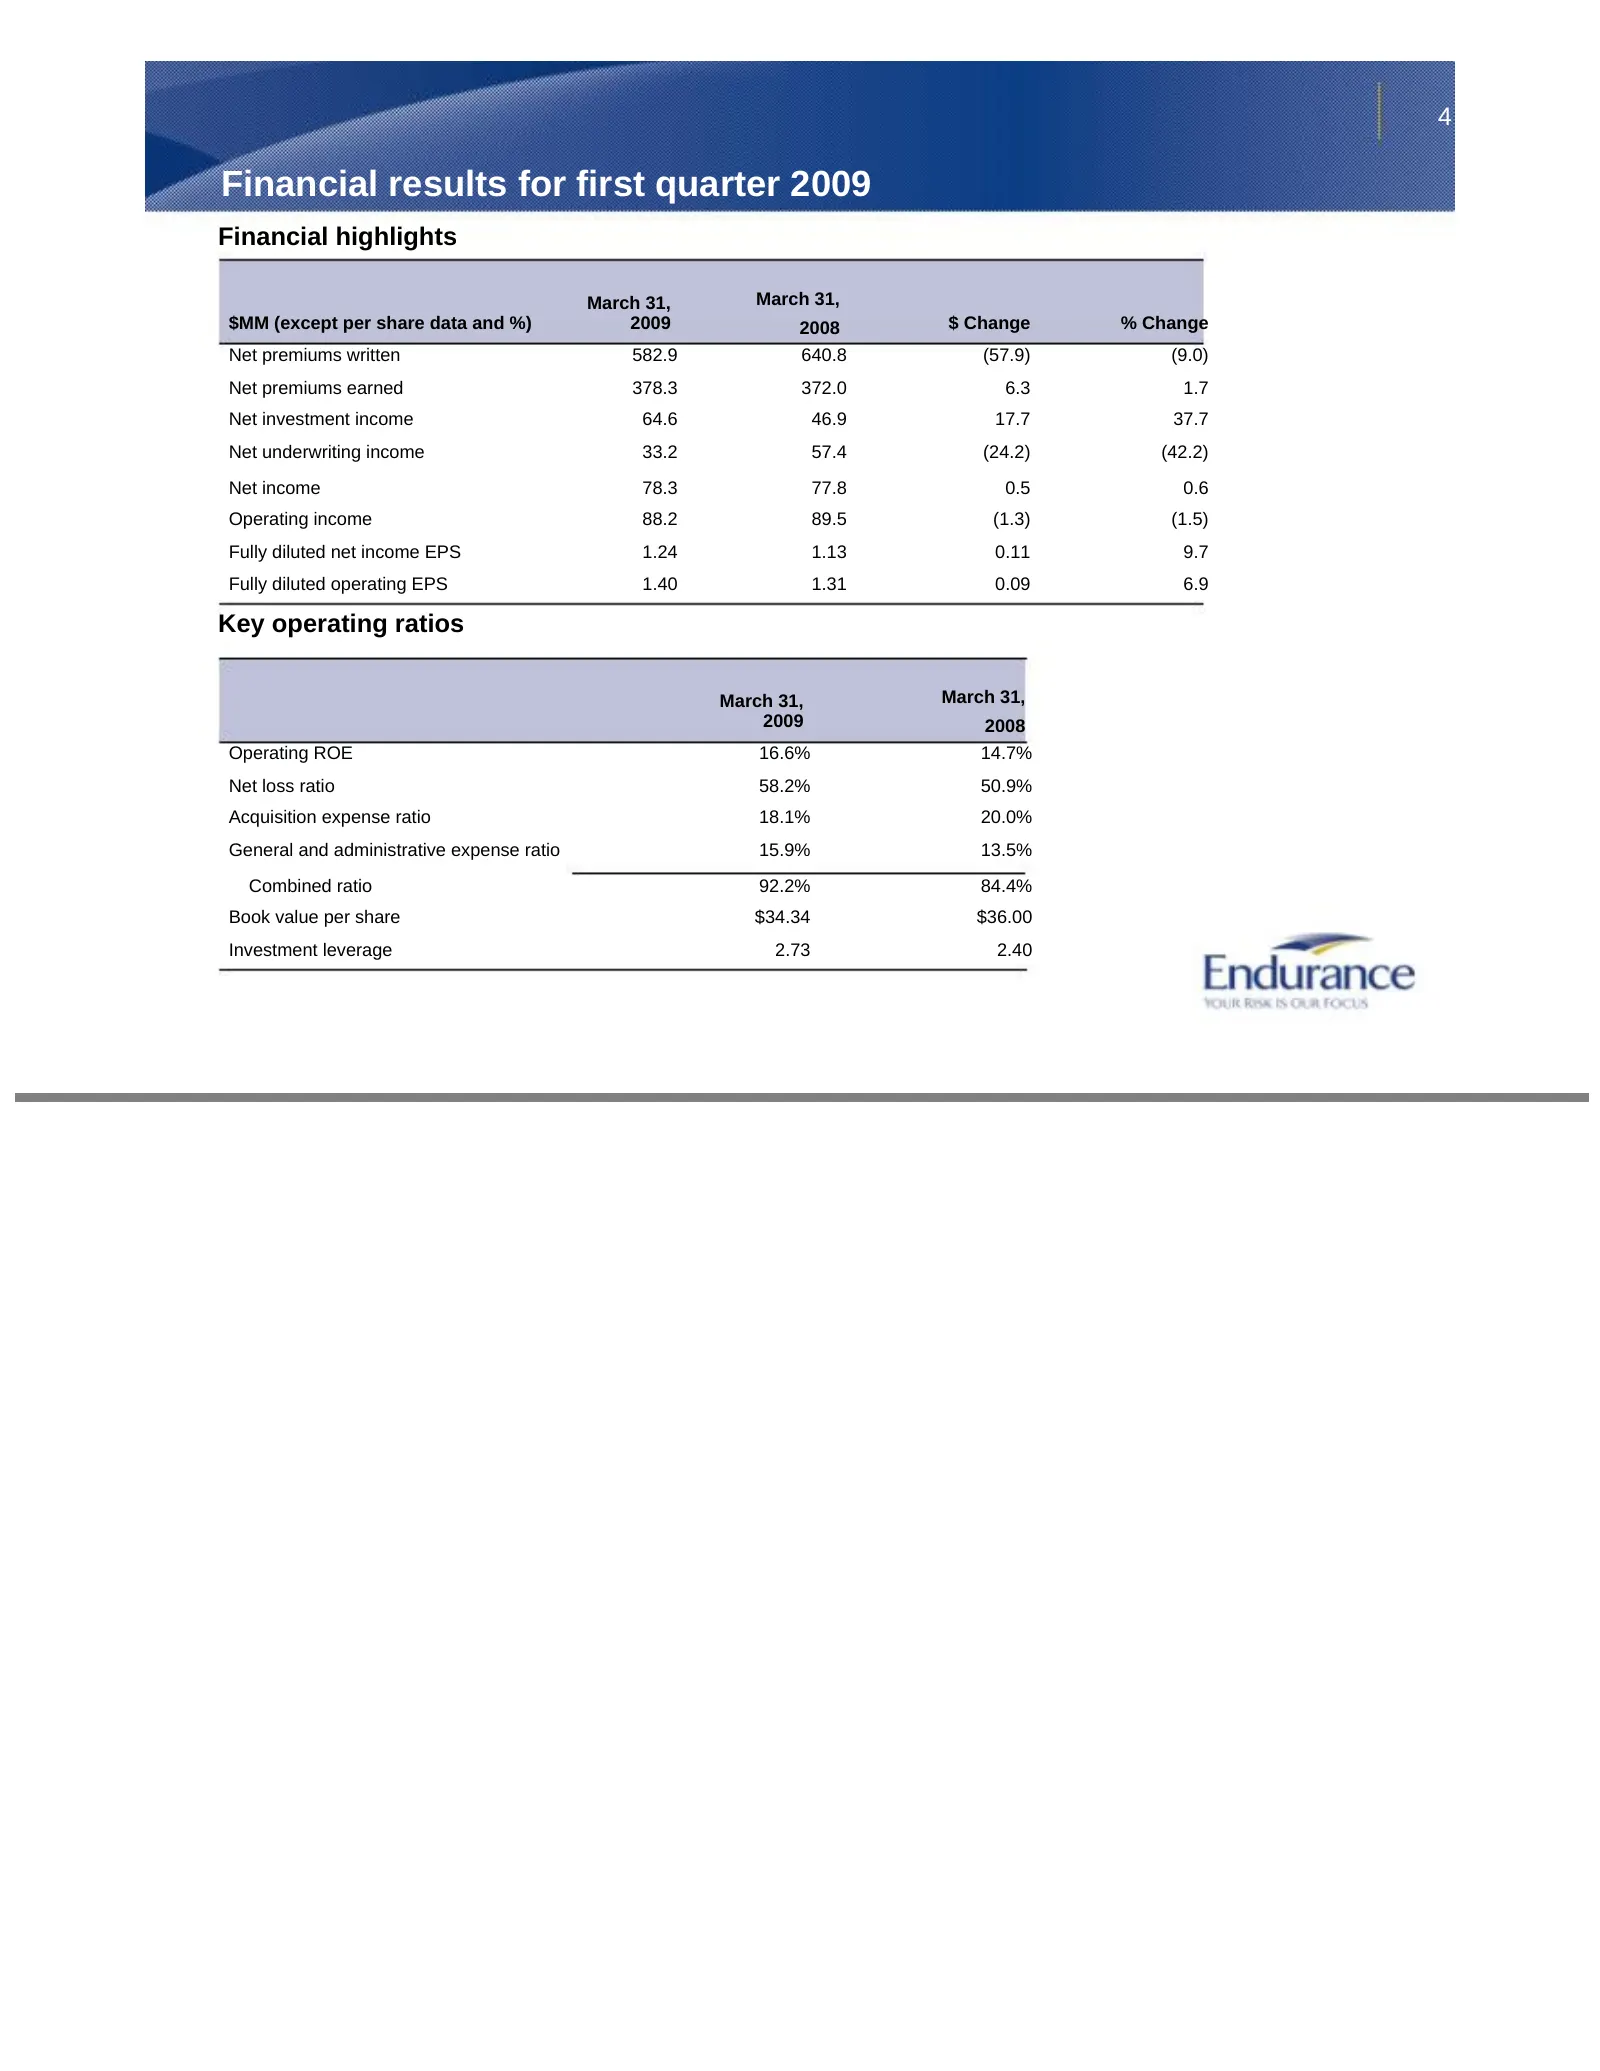
4 Financial results for first quarter 2009 Financial highlights March 31, March 31, $MM (except per share data and %) 2009 2008 $ Change % Change Net premiums written 582.9 640.8 (57.9) (9.0) Net premiums earned 378.3 372.0 6.3 1.7 Net investment income 64.6 46.9 17.7 37.7 Net underwriting income 33
Slide 5: Net written premiums
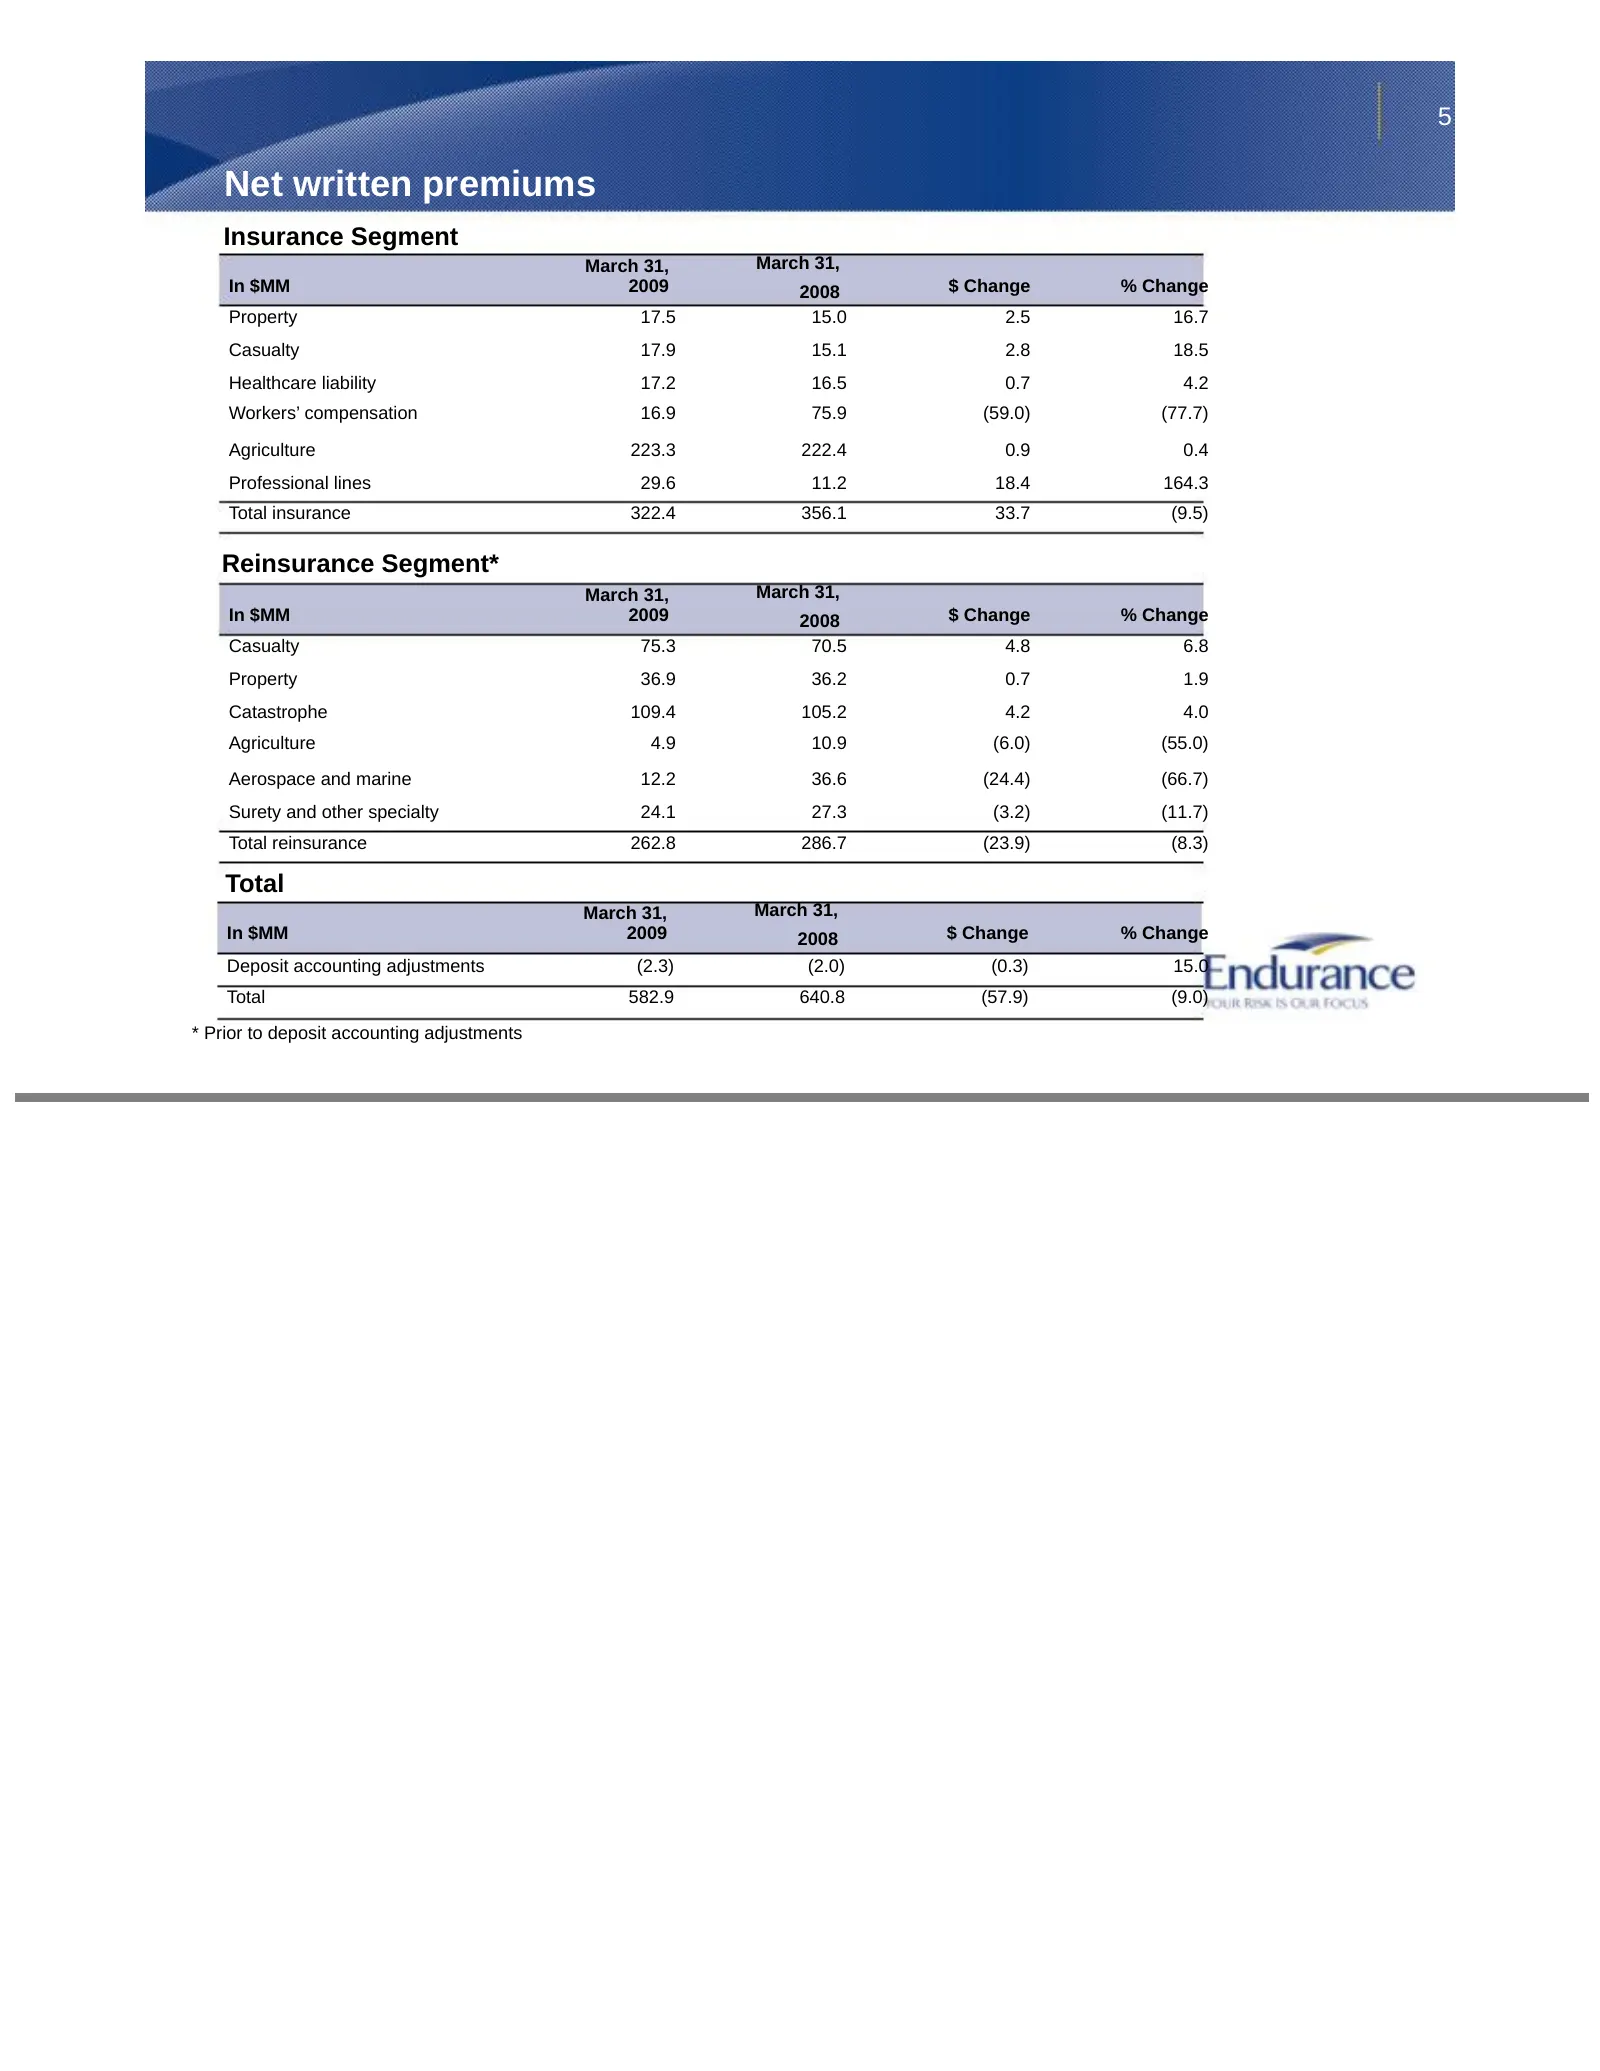
5 Net written premiums Insurance Segment March 31, March 31, In $MM 2009 2008 $ Change % Change Property 17.5 15.0 2.5 16.7 Casualty 17.9 15.1 2.8 18.5 Healthcare liability 17.2 16.5 0.7 4.2 Workers’ compensation 16.9 75.9 (59.0) (77.7) Agriculture 223.3 222.4 0.9 0.4 Professional lines 29.6 11.2 18
Slide 6: Balance sheet strength at March 31, 2009
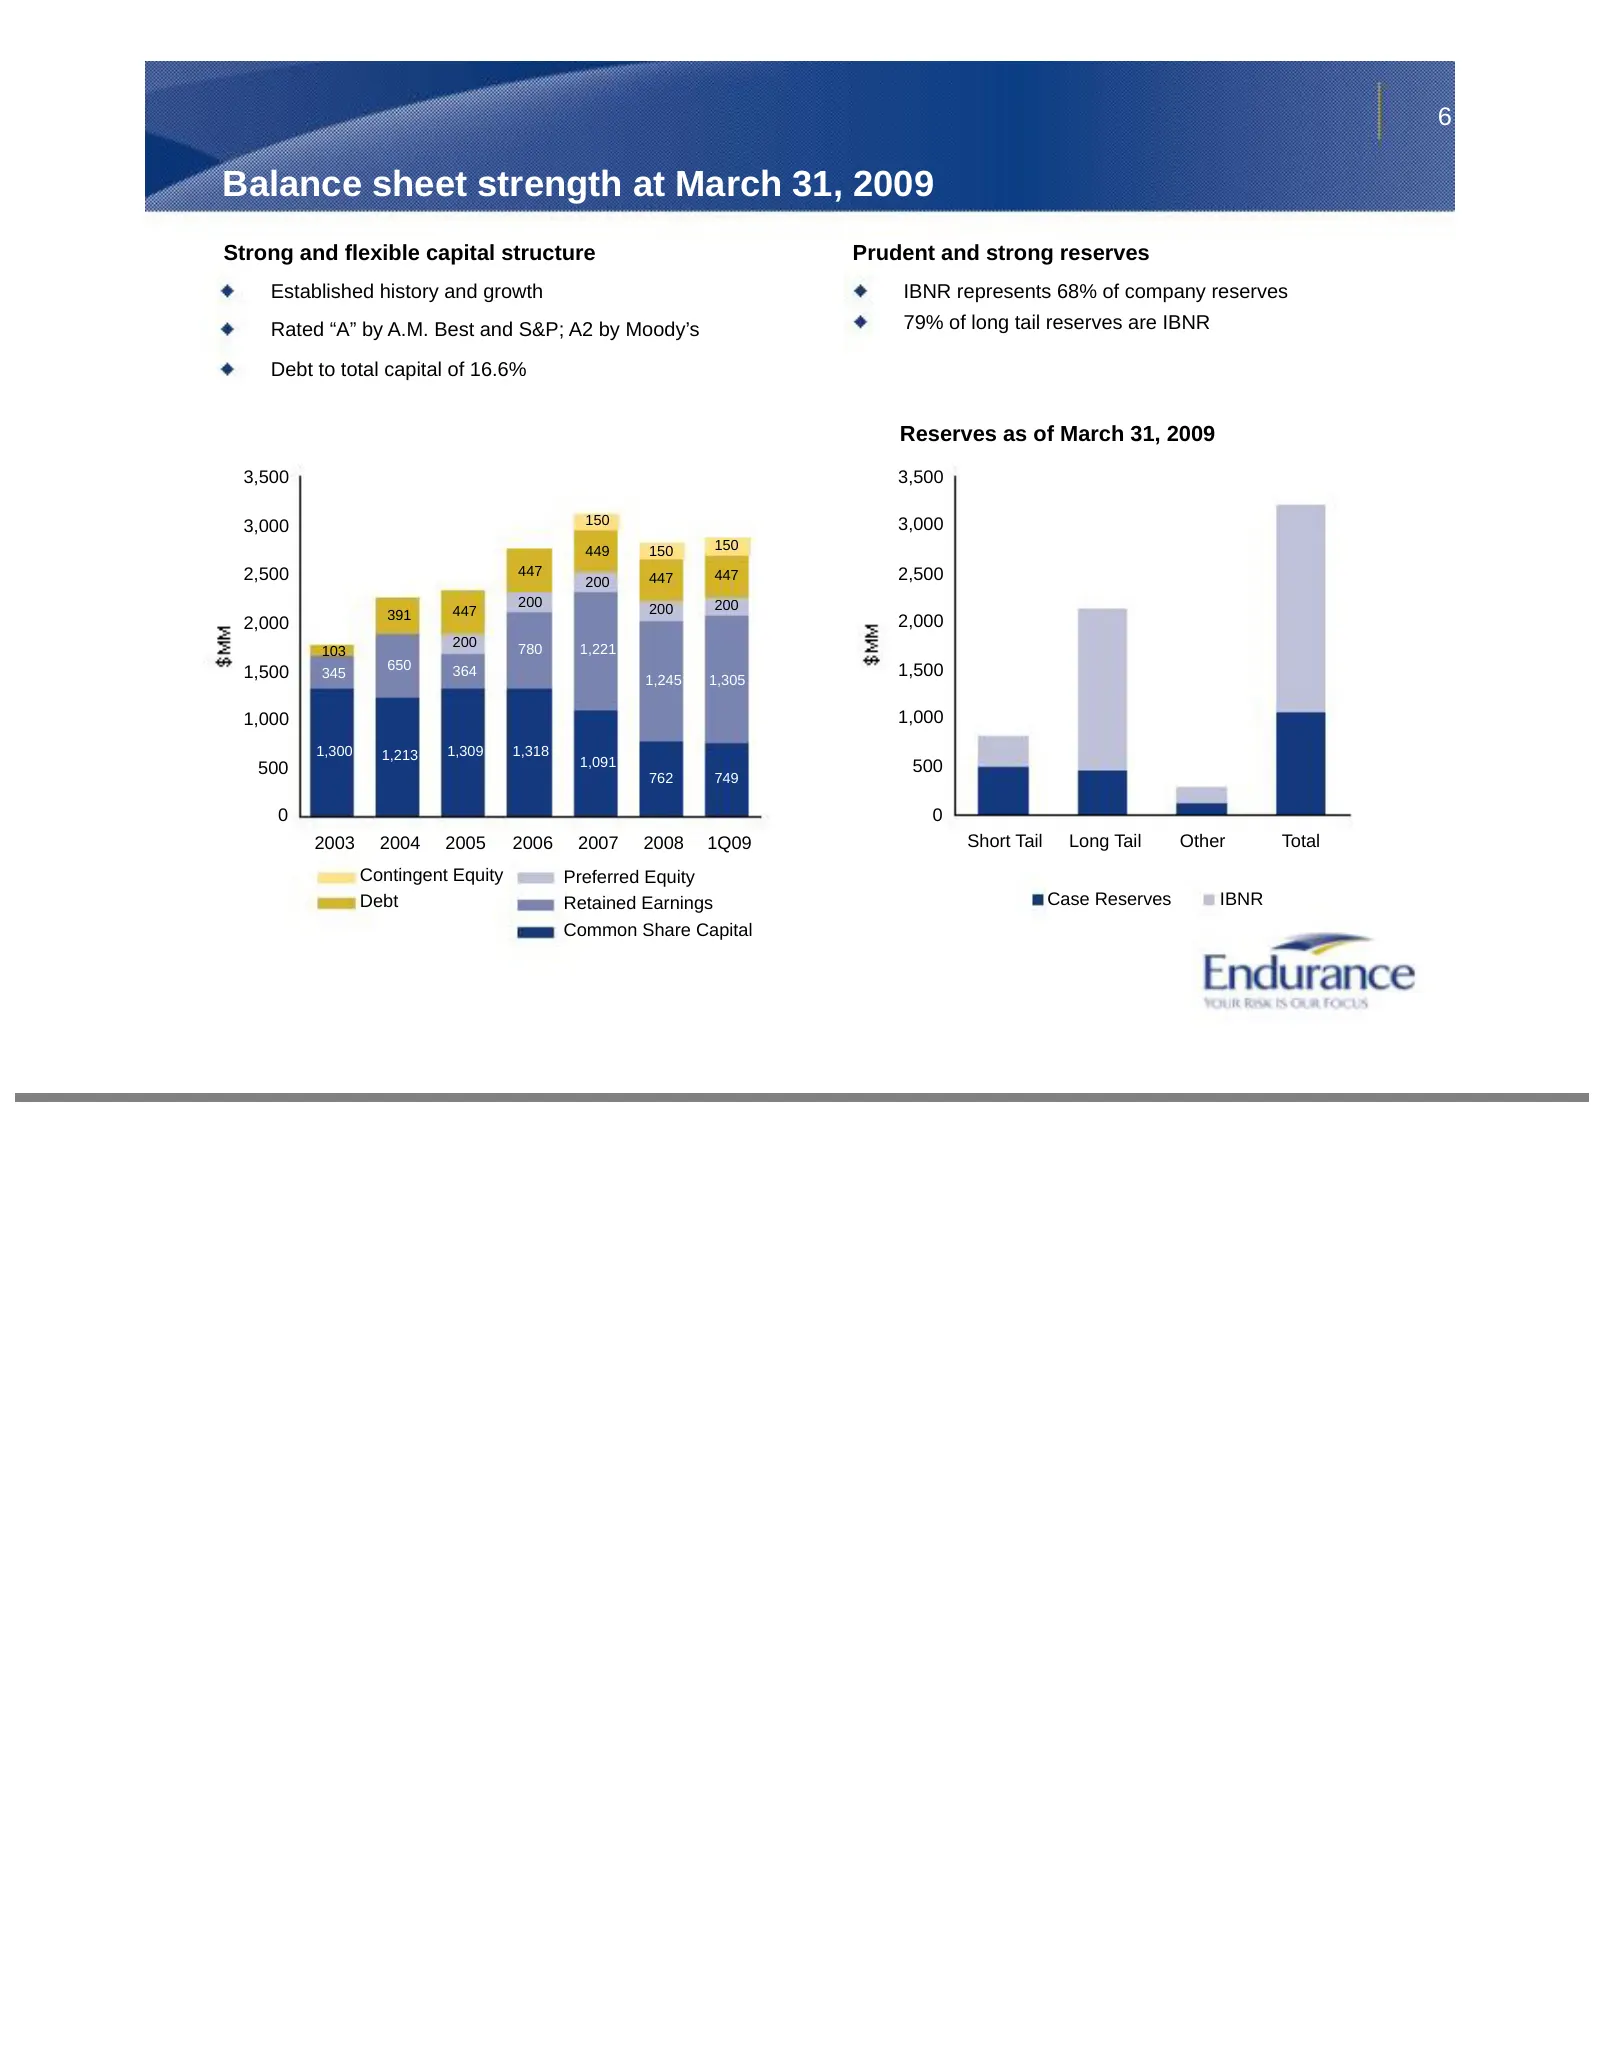
6 Balance sheet strength at March 31, 2009 Strong and flexible capital structure Prudent and strong reserves Established history and growth IBNR represents 68% of company reserves Rated “A” by A.M. Best and S&P; A2 by Moody’s 79% of long tail reserves are IBNR Debt to total capital of 16.6% Reserves
Slide 7: Investment portfolio composition at March 31, 2009
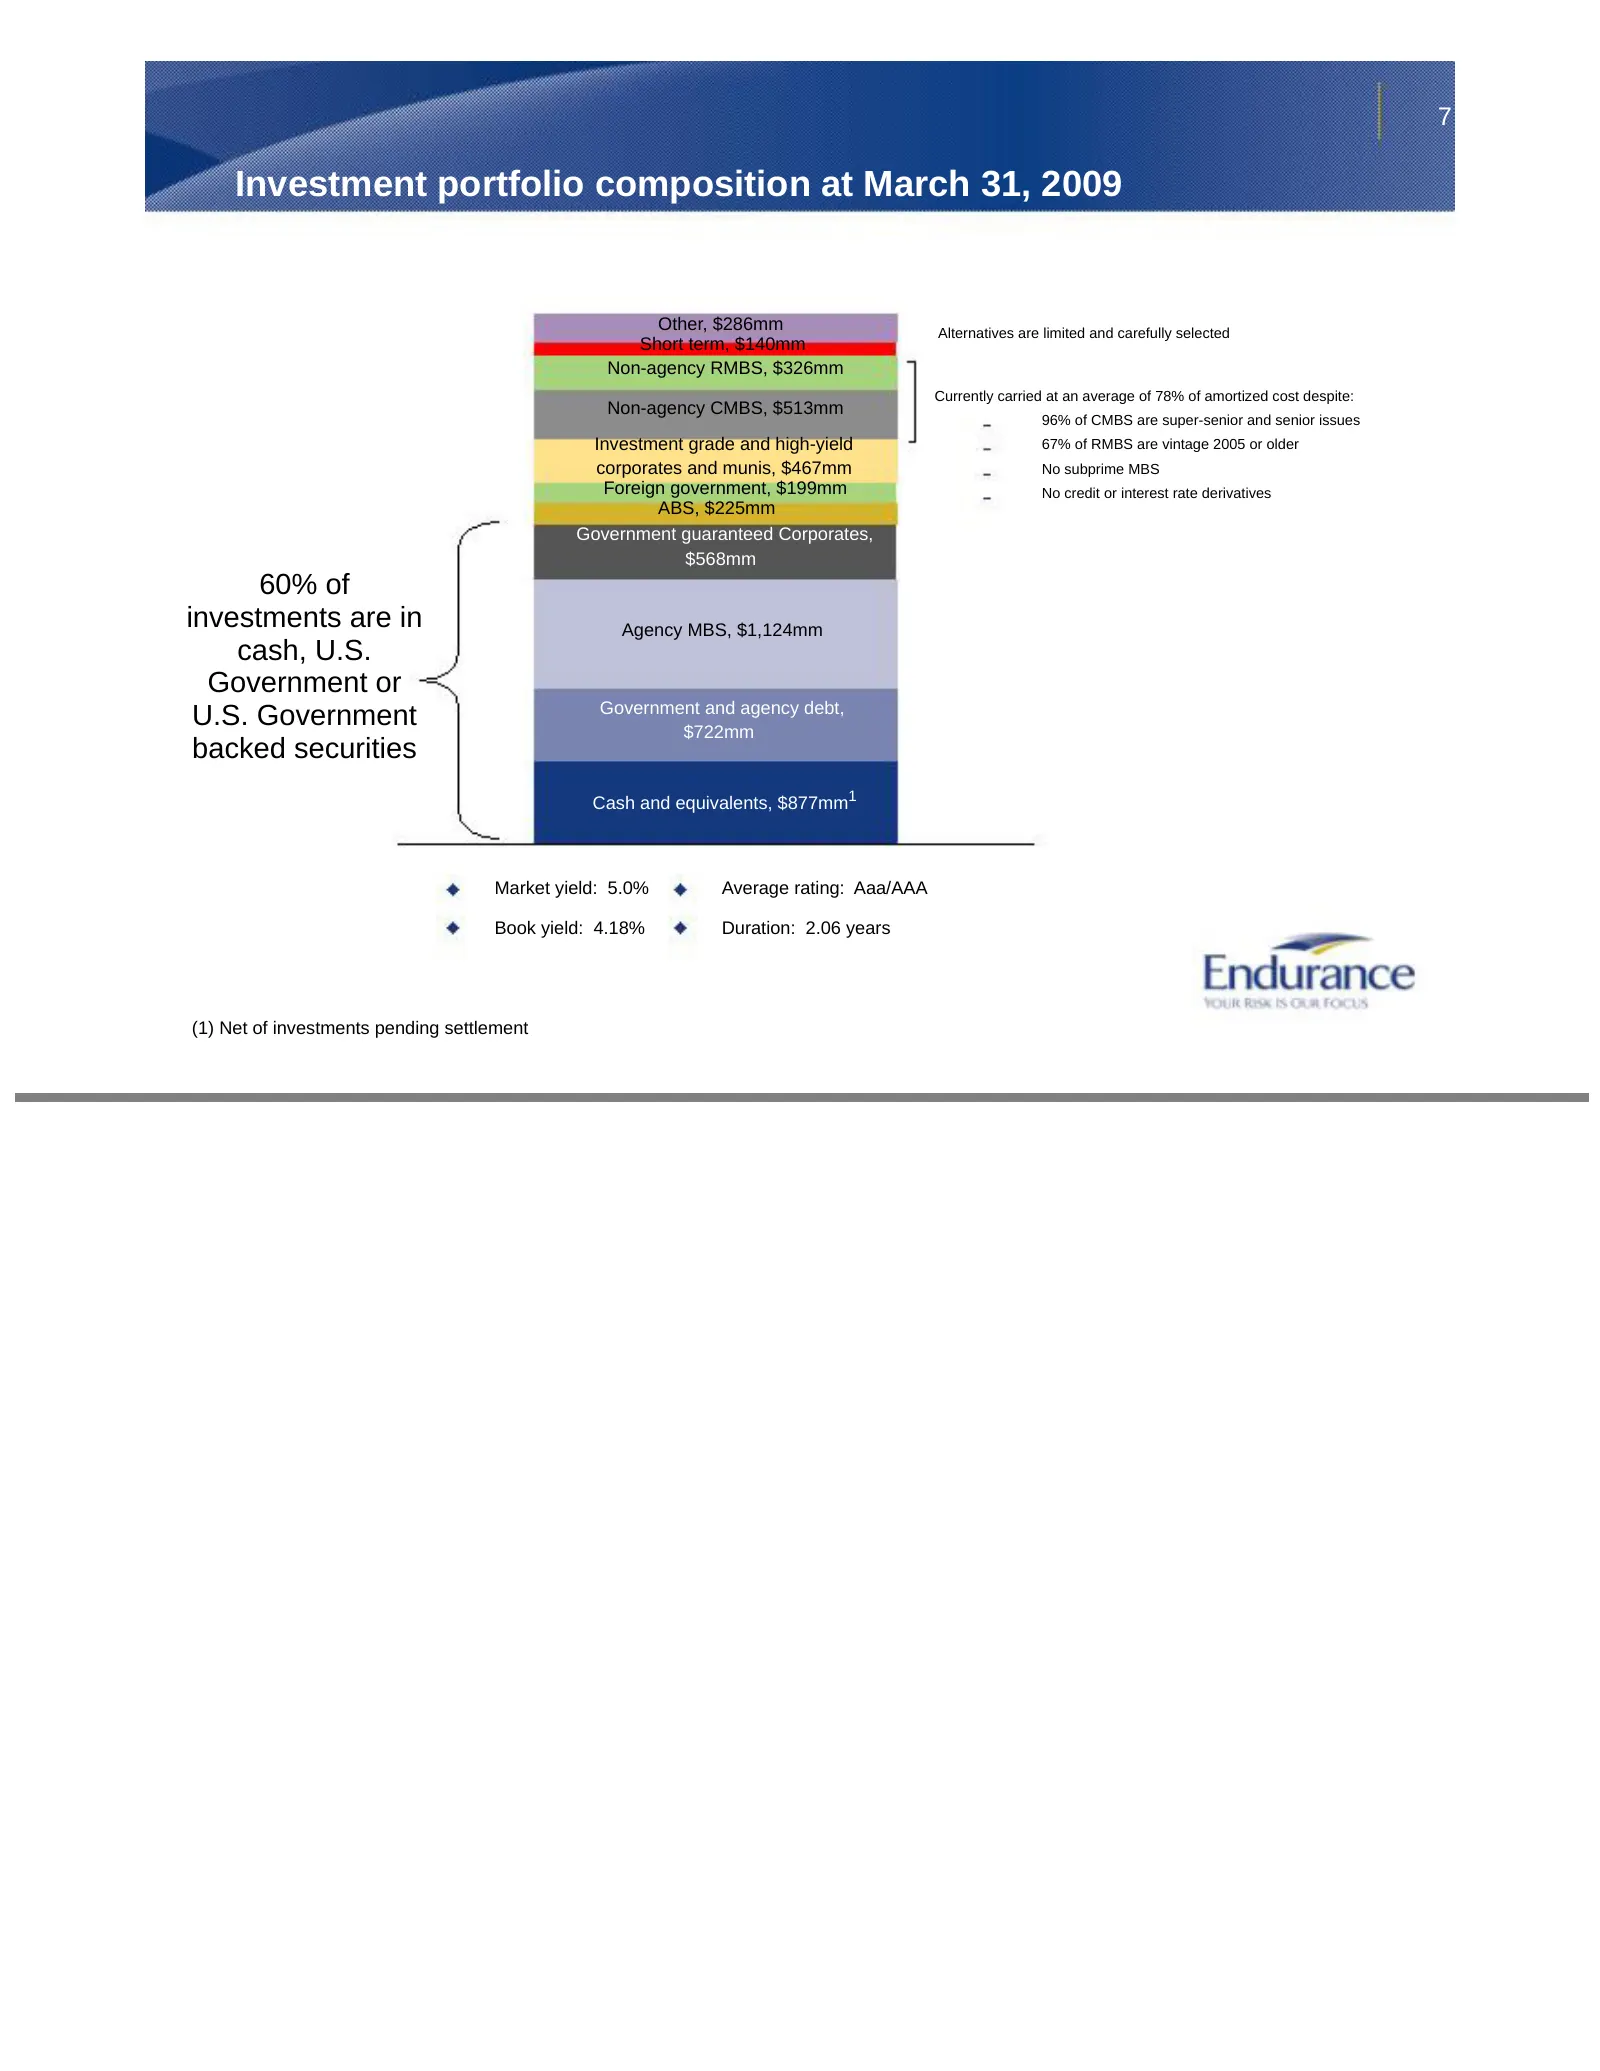
7 Investment portfolio composition at March 31, 2009 Other, $286mm Alternatives are limited and carefully selected Short term, $140mm Non-agency RMBS, $326mm Currently carried at an average of 78% of amortized cost despite: Non-agency CMBS, $513mm 96% of CMBS are super-senior and senior issues Inves
Slide 8: Senior Non-Agency RMBS Portfolio as of 3/31/09
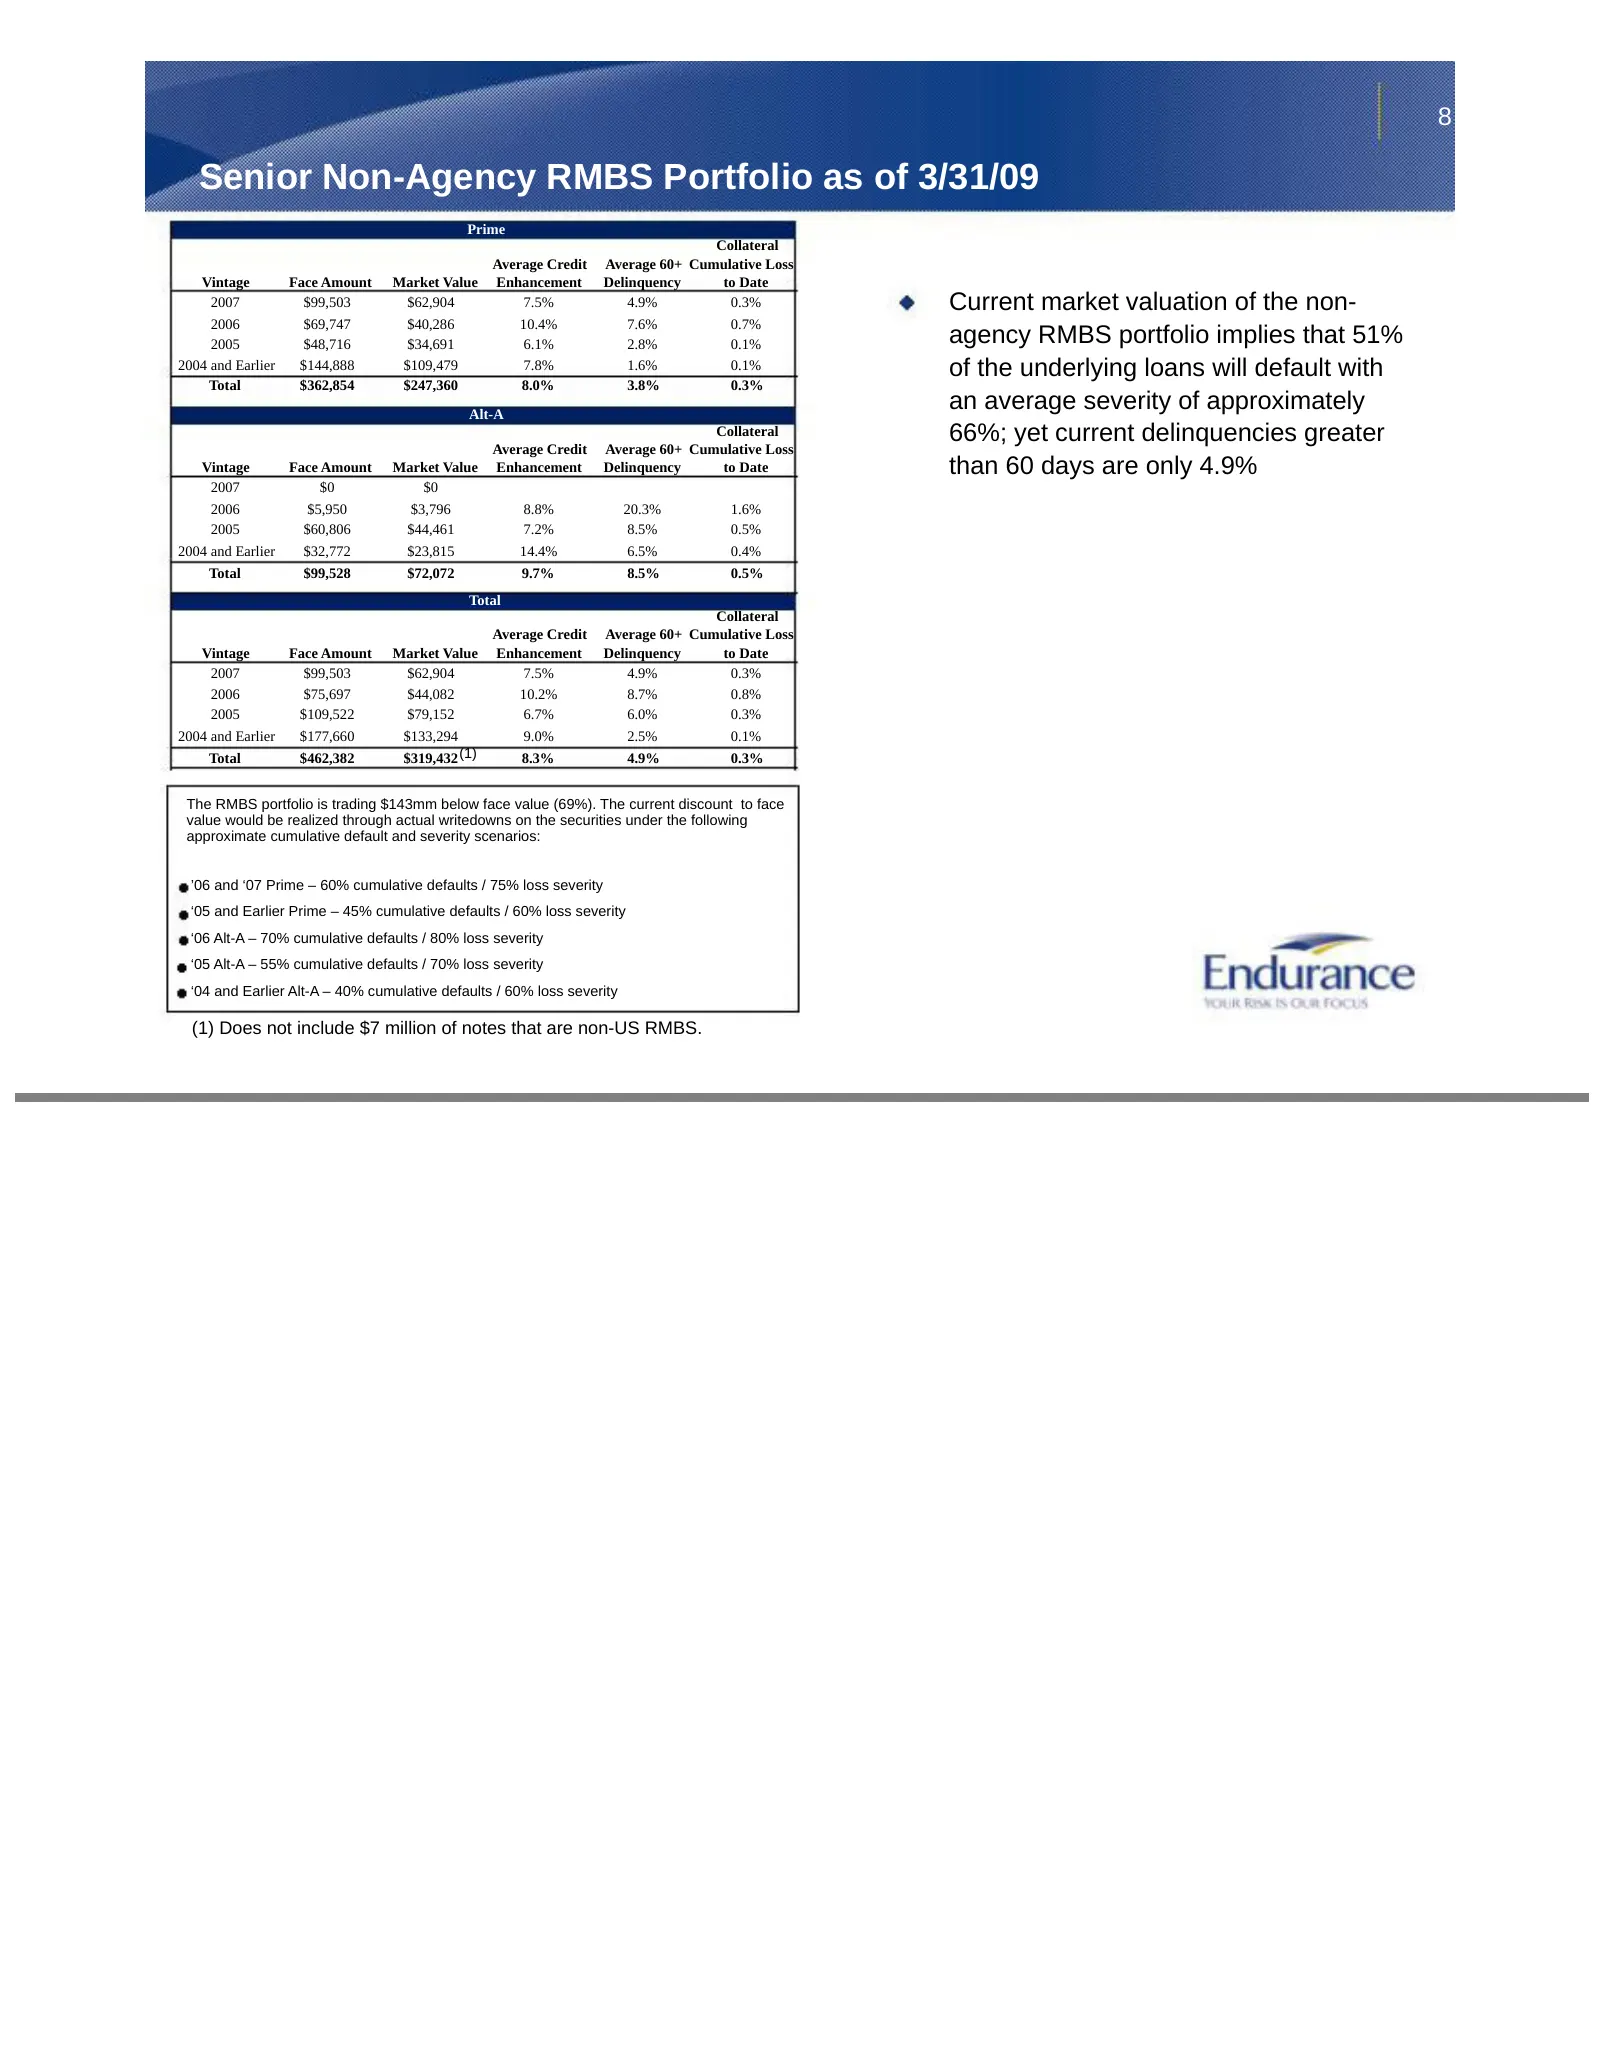
8 Senior Non-Agency RMBS Portfolio as of 3/31/09 Prime Collateral Average Credit Average 60+ Cumulative Loss Vintage Face Amount Market Value Enhancement Delinquency to Date 2007 $99,503 $62,904 7.5% 4.9% 0.3% Current market valuation of the non- 2006 $69,747 $40,286 10.4% 7.6% 0.7% 2005 $48,716 $34
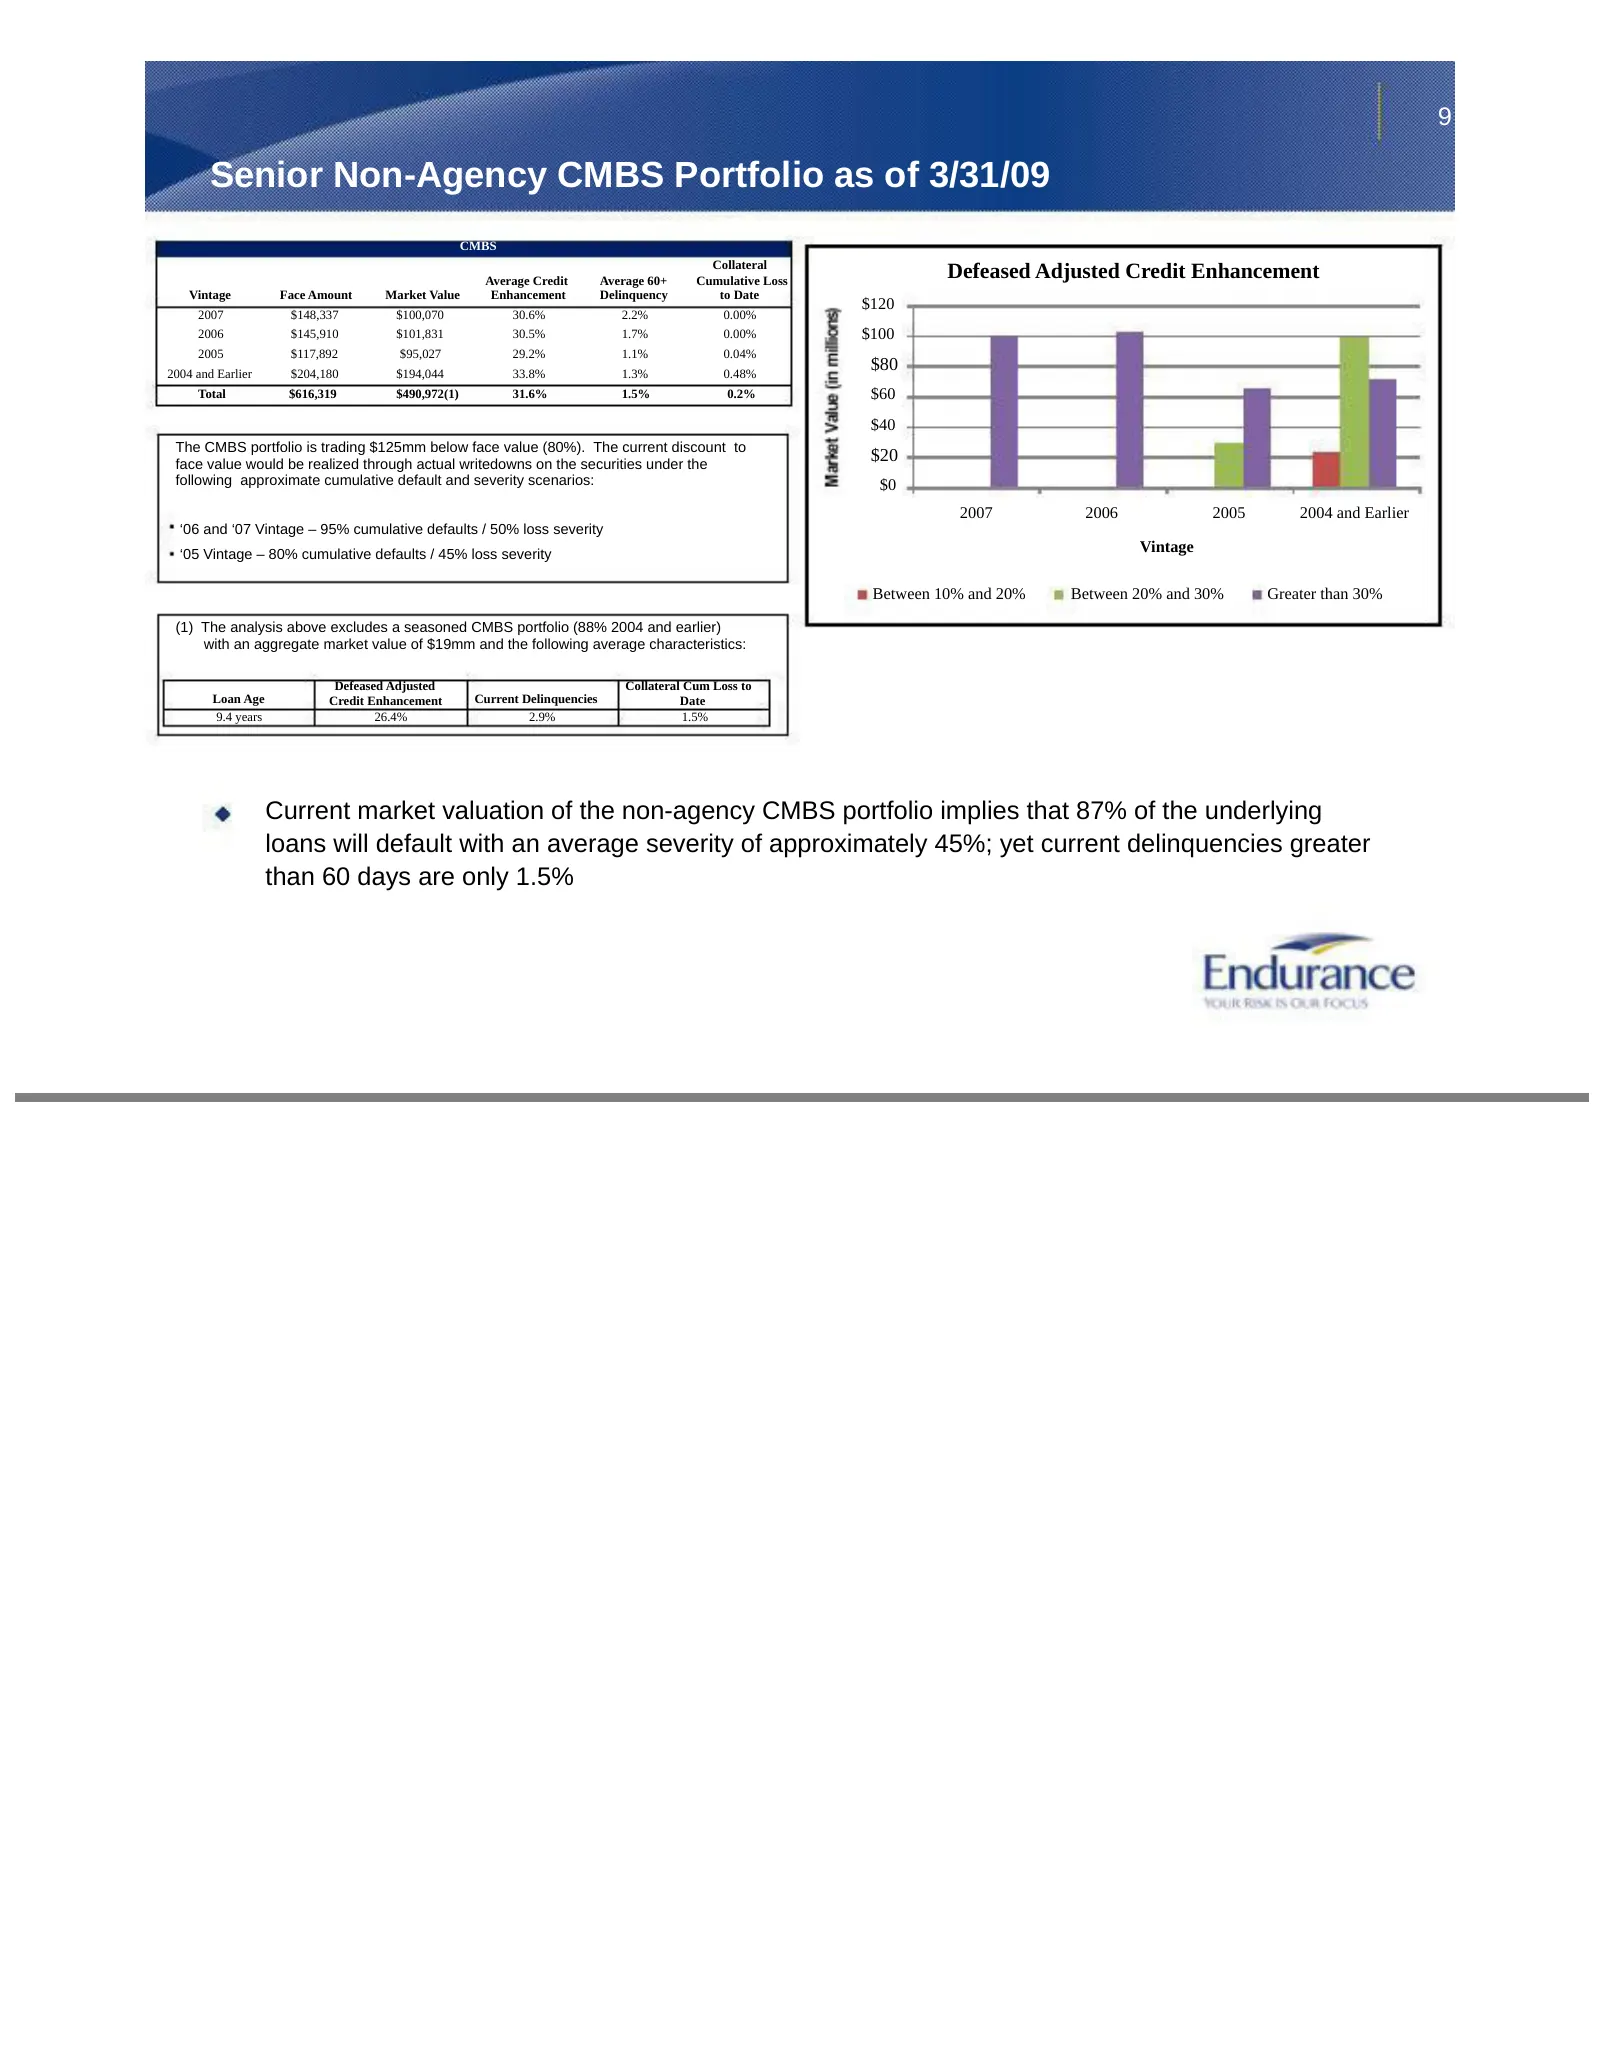
Slide 9: Senior Non-Agency CMBS Portfolio as of 3/31/09
9 Senior Non-Agency CMBS Portfolio as of 3/31/09 CMBS Collateral Average Credit Average 60+ Cumulative Loss Defeased Adjusted Credit Enhancement Vintage Face Amount Market Value Enhancement Delinquency to Date $120 2007 $148,337 $100,070 30.6% 2.2% 0.00% 2006 $145,910 $101,831 30.5% 1.7% 0.00% $100
Source: SEC EDGAR · 8-K filed May 7, 2009
More decks from Endurance Specialty Holdings Ltd
 Merger or Acquisition (October 2016)17 slides · Oct 12, 2016
 Investor Presentation (August 2016)29 slides · Aug 9, 2016
 Investor Presentation (May 2016)28 slides · May 10, 2016
 Investor Presentation (February 2016)29 slides · Feb 9, 2016
 Investor Presentation (February 2015)28 slides · Feb 11, 2015
 Merger or Acquisition (April 2014)22 slides · Apr 14, 2014