Essity AB Class A · OMXSTO:ESSITY_A
Essity AB Class A — Investor Presentation (June 2024)
27 slides from Essity AB Class A's investor presentation, Jun 17, 2024

Slide 1: Essity – Fit for Profitable Growth
Essity – Fit for Profitable Growth June 17, 2024

Slide 2: Magnus Groth, President and CEO
Magnus Groth President and CEO
Slide 3: Announcements
Announcements June 17, 2024 Text ▪ New financial targets ─ Annual organic sales growth >3% ─ EBITA margin >15% ▪ Share buyback program of SEK 3bn
Slide 4: Essity – A Leading Hygiene and Health Company
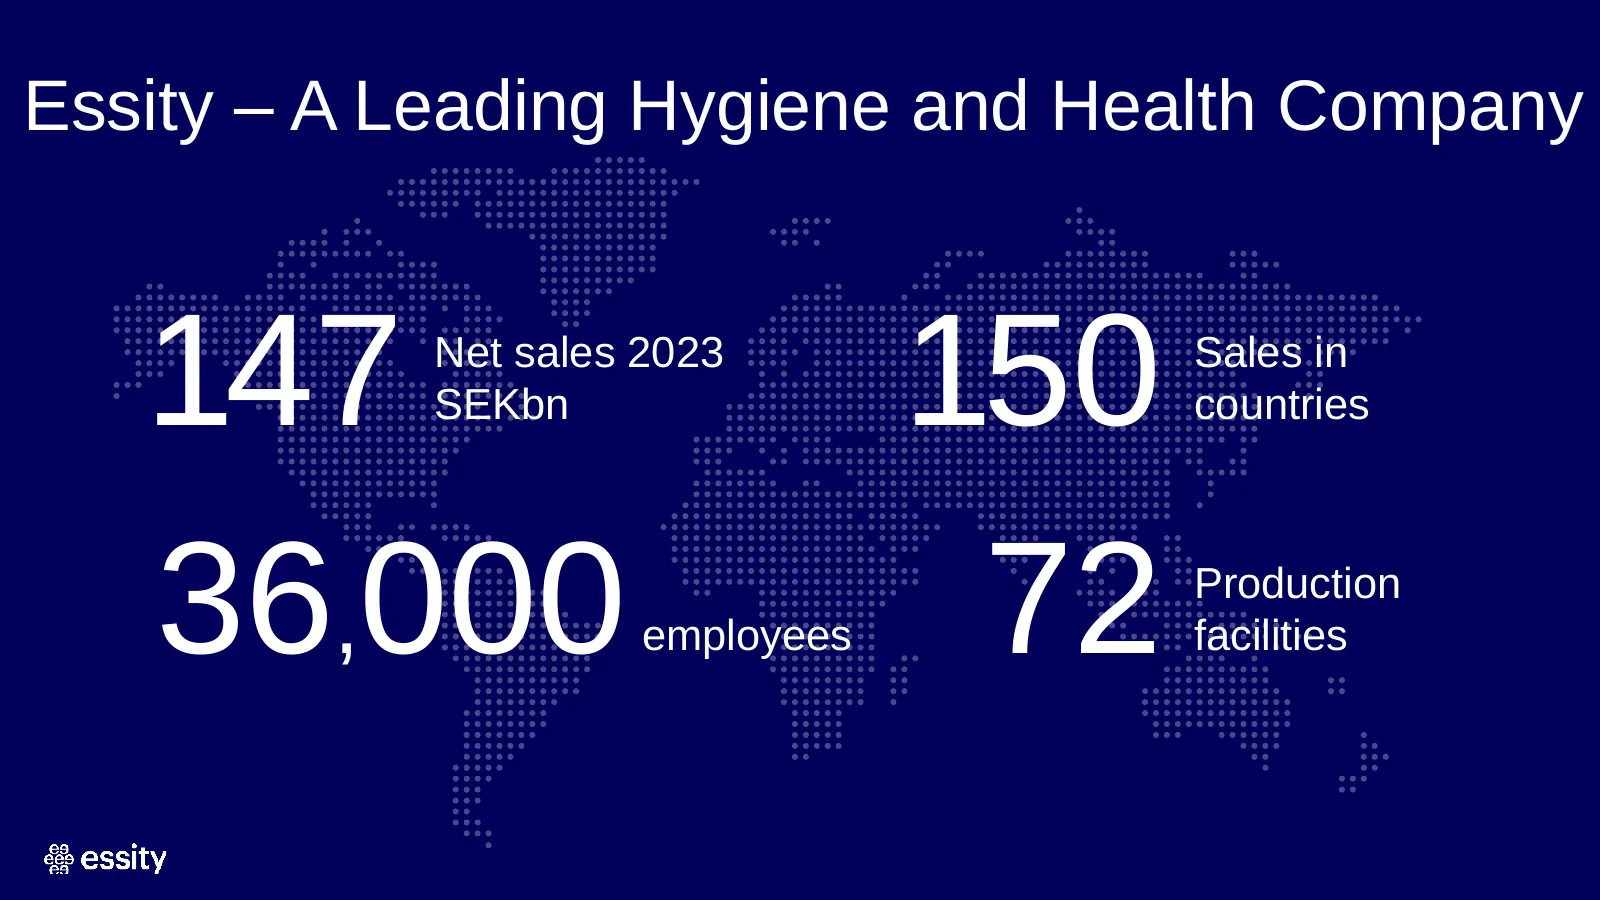
Essity – A Leading Hygiene and Health Company 147 Net sales 2023 SEKbn 150 Sales in countries 36,000 employees 72 Production facilities
Slide 5: Attractive Business Areas Focusing on Profitable Growth
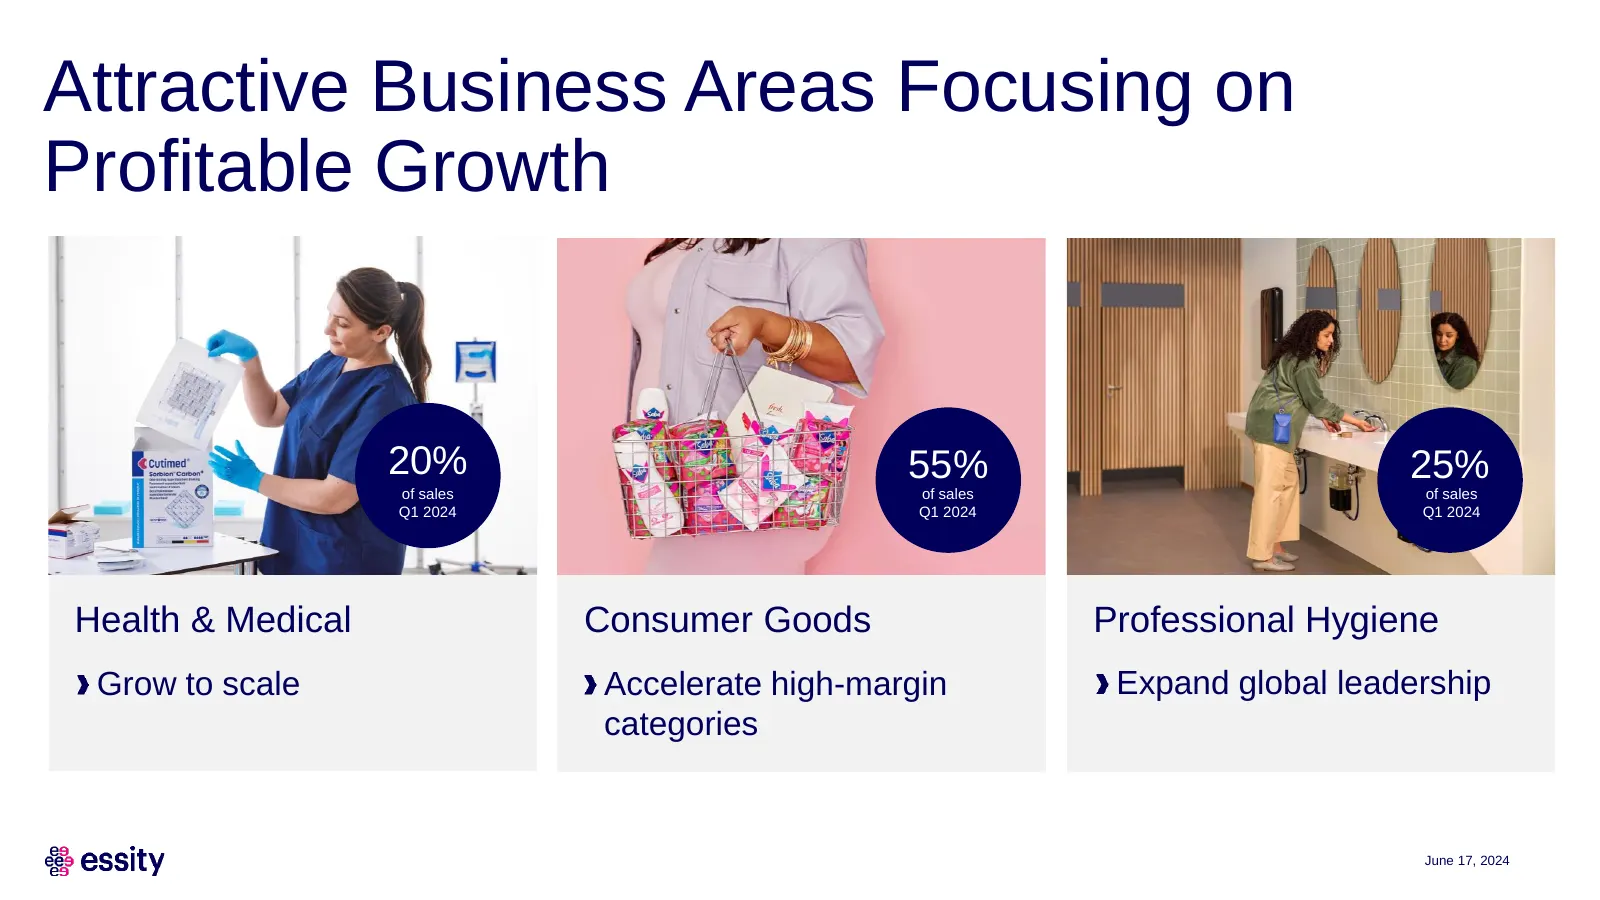
Attractive Business Areas Focusing on Profitable Growth 20% 55% 25% of sales of sales of sales Q1 2024 Q1 2024 Q1 2024 Health & Medical Consumer Goods Professional Hygiene Grow to scale Accelerate high-margin Expand global leadership categories June 17, 2024
Slide 6: A Decade of Continuous Change
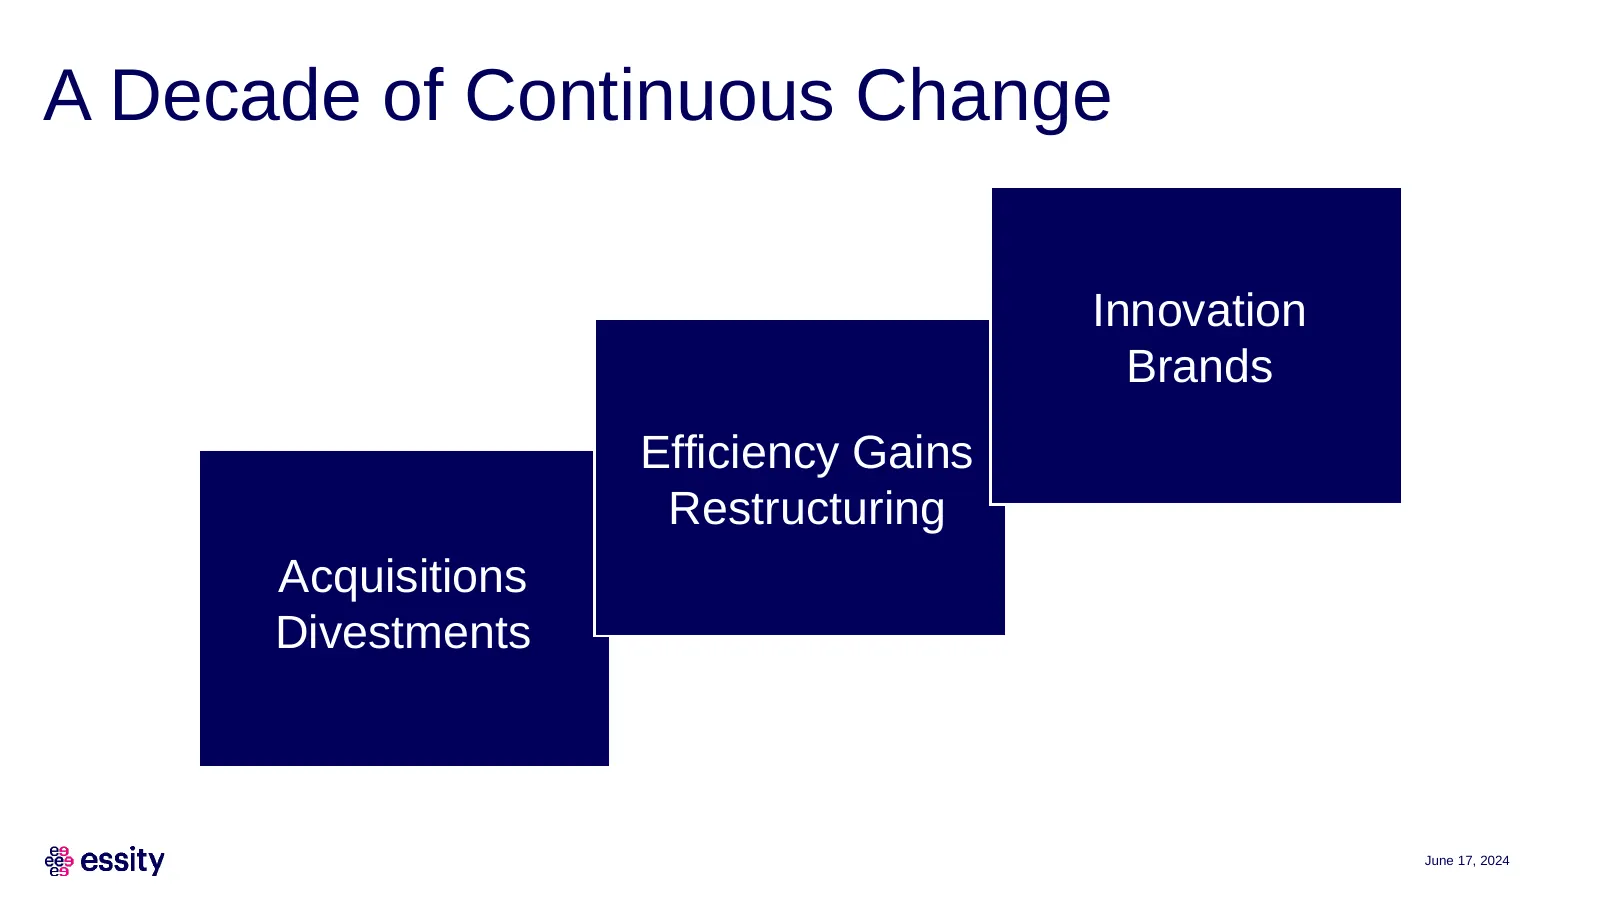
A Decade of Continuous Change Innovation Brands Efficiency Gains Restructuring Acquisitions Divestments June 17, 2024
Slide 7: A Decade of Strong Financial Development
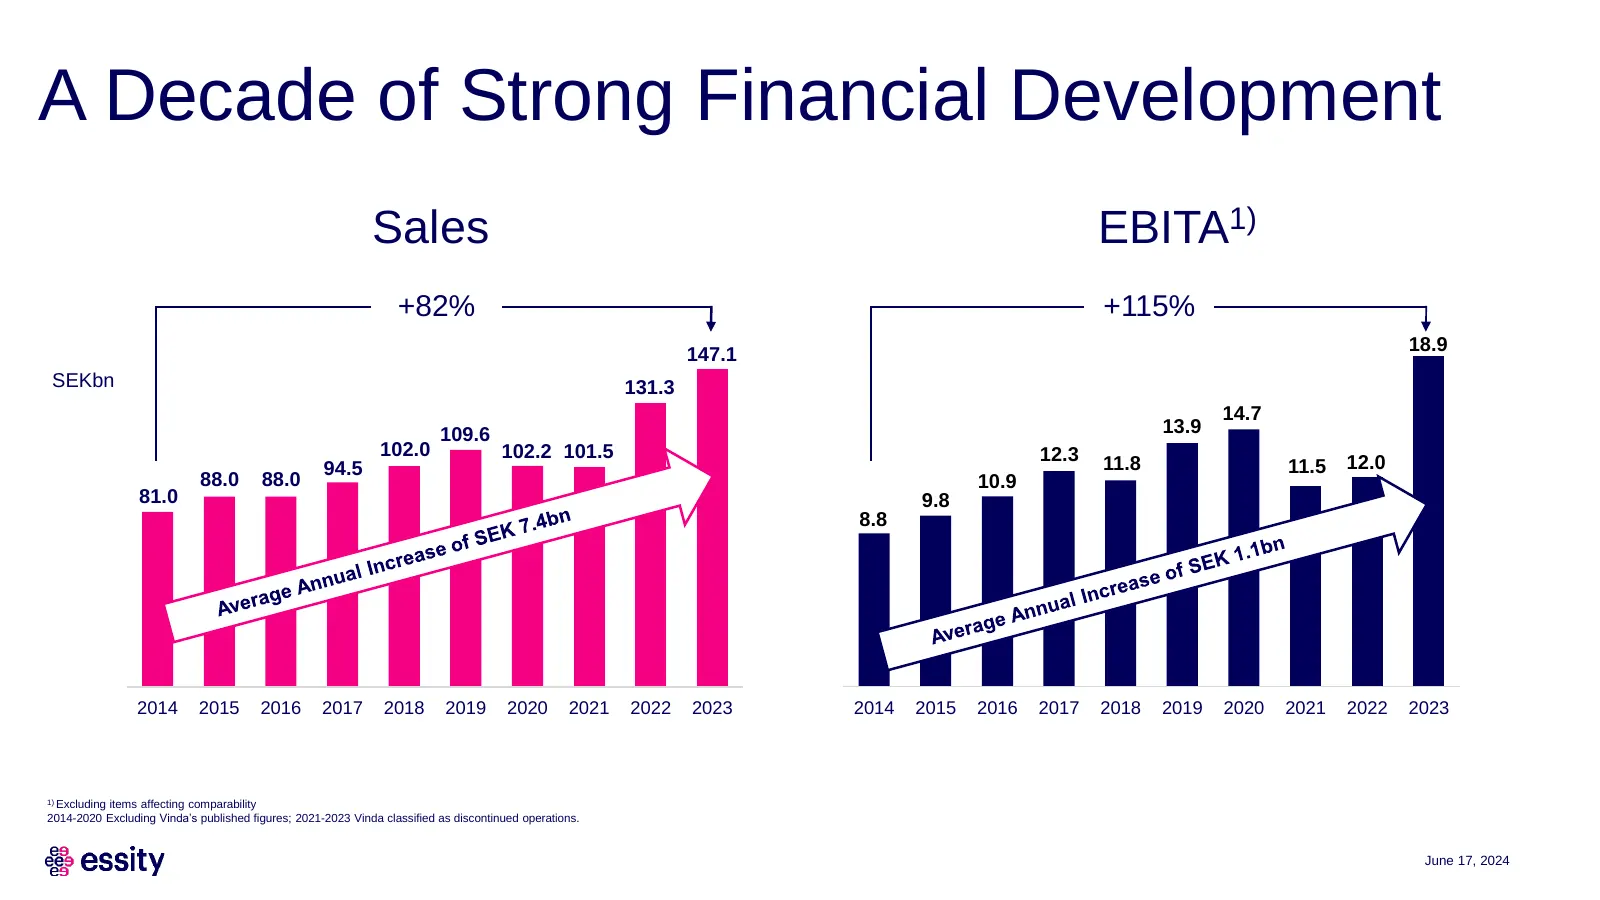
A Decade of Strong Financial Development Sales EBITA1) +82% +115% 18.9 147.1 SEKbn 131.3 14.7 109.6 13.9 102.0 102.2 101.5 12.3 94.5 11.8 11.5 12.0 88.0 88.0 10.9 81.0 9.8 8.8 2014 2015 2016 2017 2018 2019 2020 2021 2022 2023 2014 2015 2016 2017 2018 2019 2020 2021 2022 2023 1) Excluding items affec
Slide 8: Generating High EPS Growth
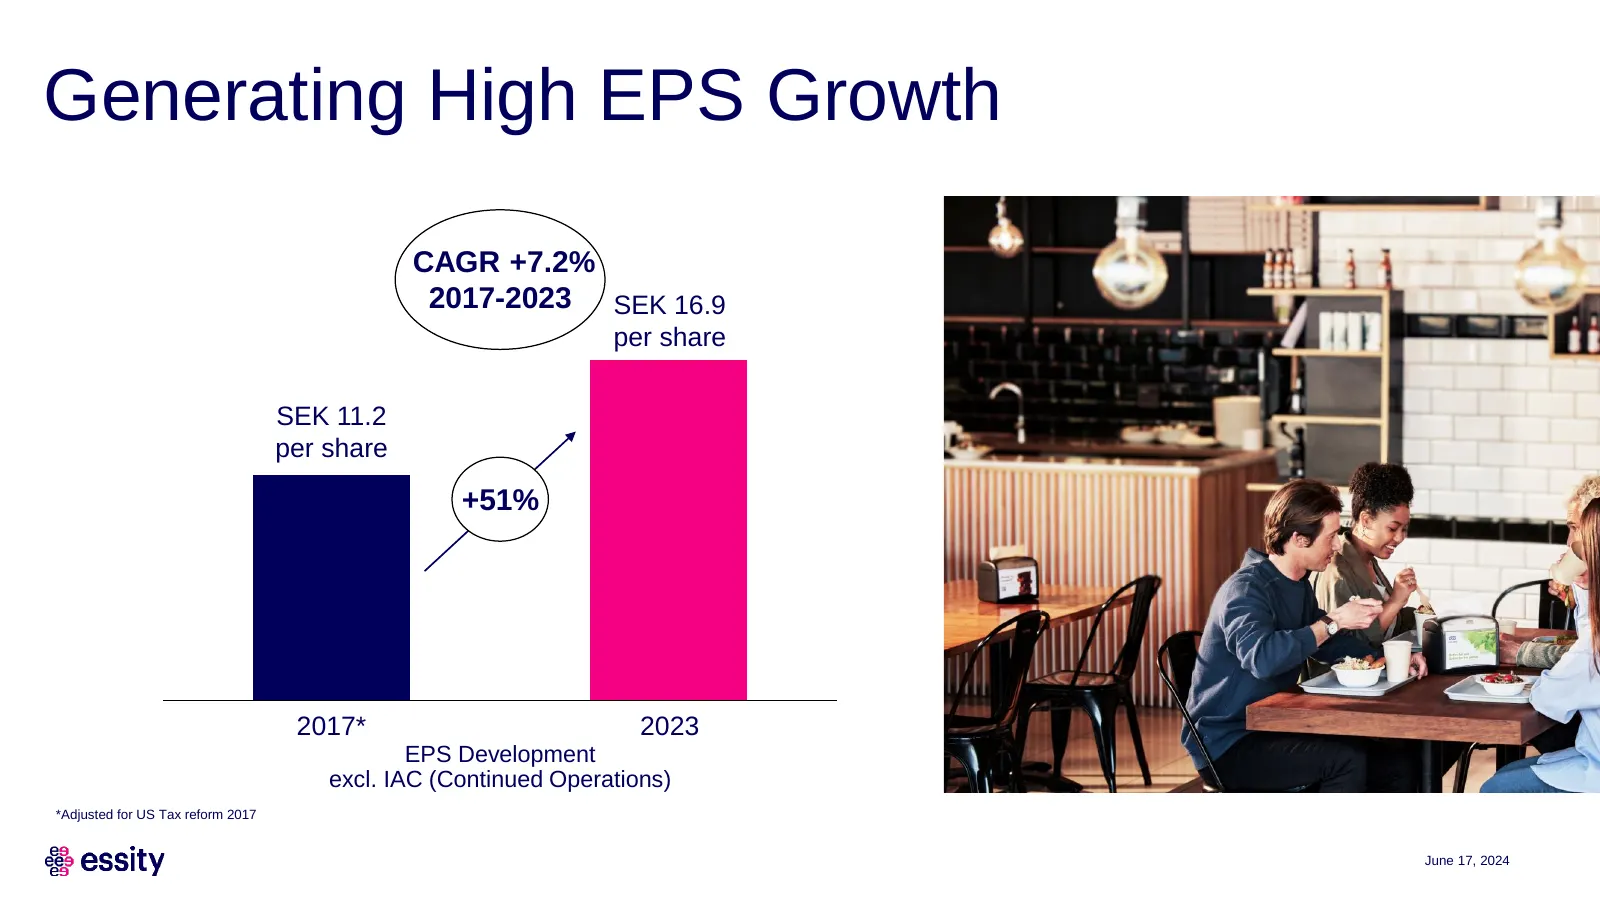
Generating High EPS Growth CAGR +7.2% 2017-2023 SEK 16.9 per share SEK 11.2 per share +51% 2017* 2023 EPS Development excl. IAC (Continued Operations) *Adjusted for US Tax reform 2017 June 17, 2024
Slide 9: Strengthened Balance Sheet
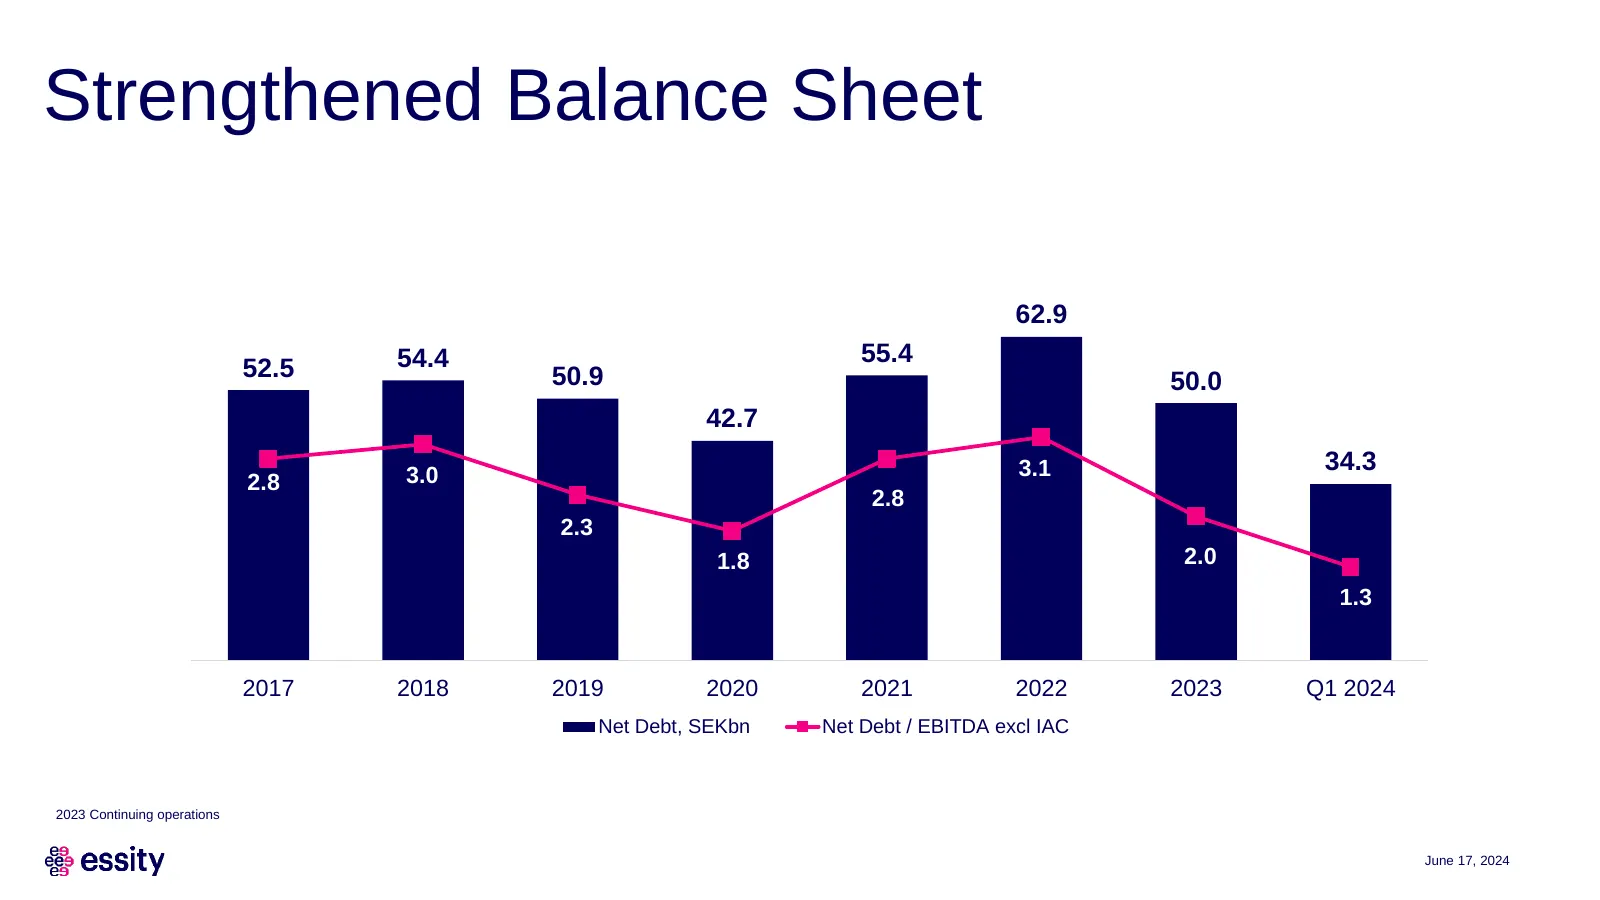
Strengthened Balance Sheet 70 5 62.9 4,5 60 54.4 55.4 52.5 50.9 50.0 4 50 3,5 42.7 3 40 34.3 3.0 3.1 2,5 2.8 30 50.4 50.9 2.8 2 2.342.7 34.3 20 2.0 1,5 1.8 1 10 1.3 0,5 0 0 2017 2018 2019 2020 2021 2022 2023 Q1 2024 Net Debt, SEKbn Net Debt / EBITDA excl IAC 2023 Continuing operations June 17, 2024

Slide 10: Essity in Better Shape than Ever
Essity in Better Shape than Ever Strong financial position More profitable and attractive portfolio Pricing power More efficient production Lower volatility Text
Slide 11: New Financial Targets – Higher Ambitions
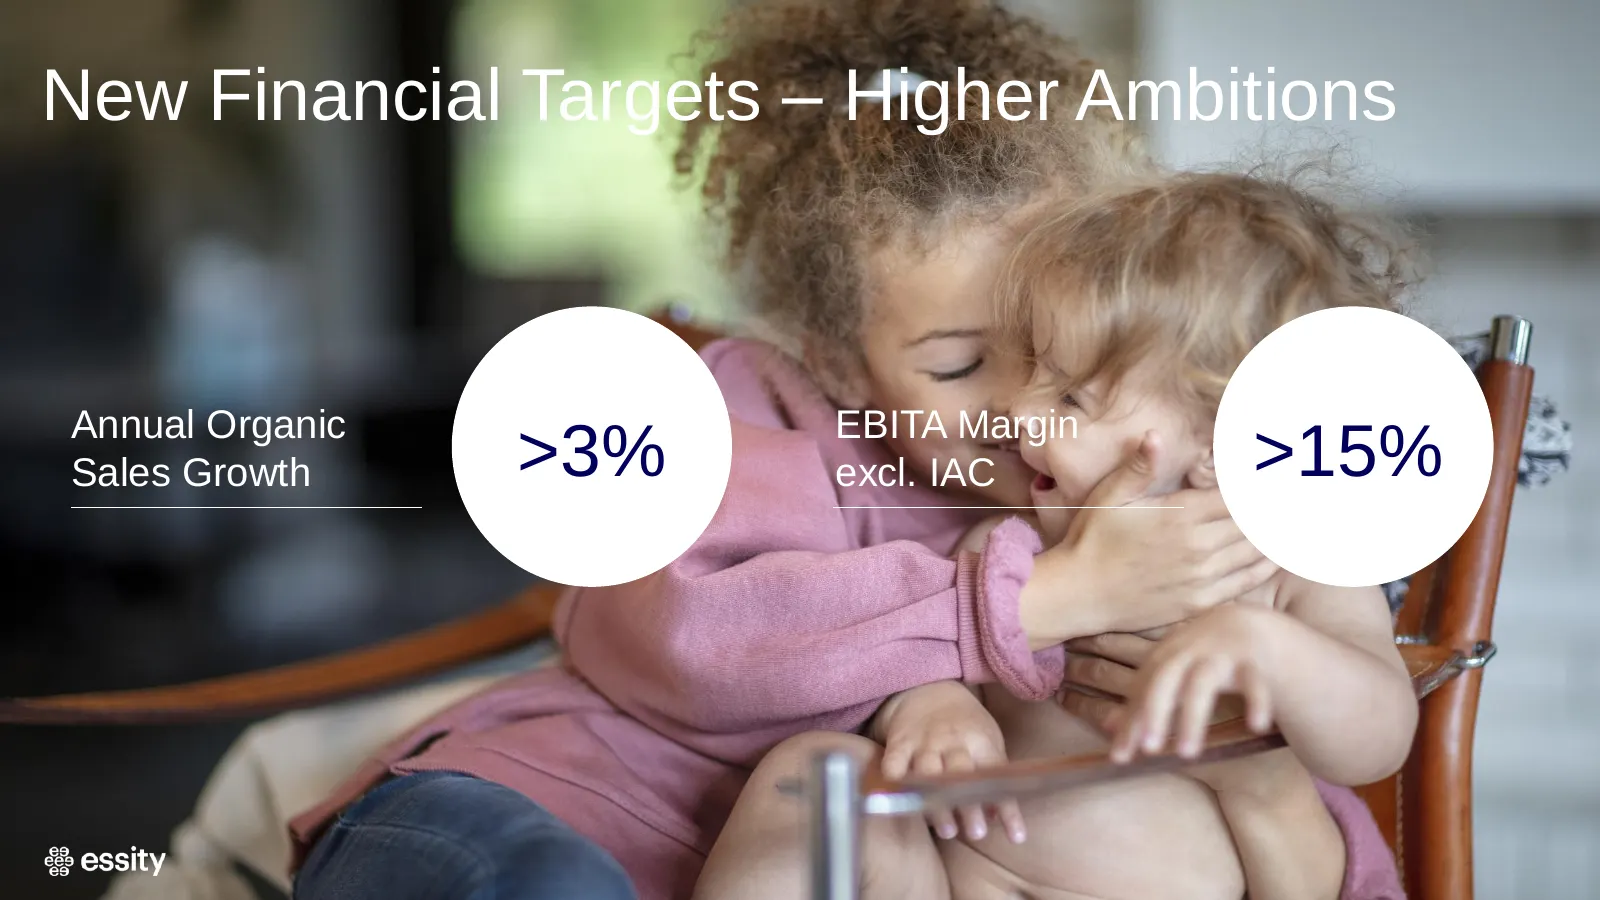
New Financial Targets – Higher Ambitions Annual Organic EBITA Margin Sales Growth >3% excl. IAC >15% Text
Slide 12: Financial Restrictions and Policies Unchanged
Financial Restrictions and Policies Unchanged Maintain Long-term a solid stable and Capital Structure investment Dividend rising grade rating dividends
Slide 13: Share Buyback Program
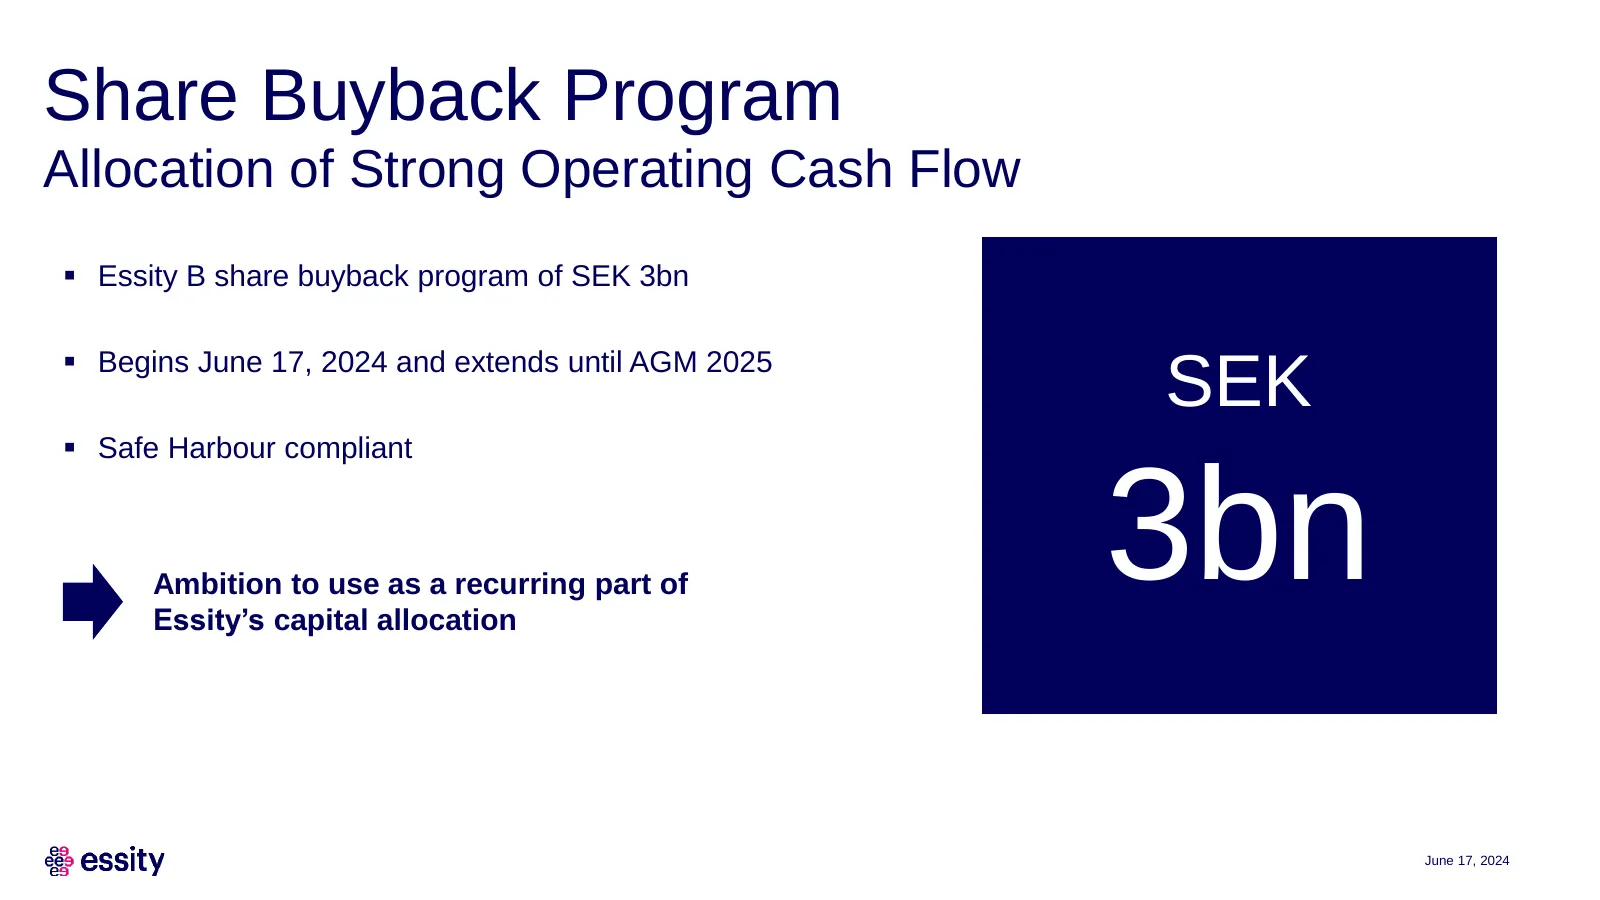
Share Buyback Program Allocation of Strong Operating Cash Flow ▪ Essity B share buyback program of SEK 3bn ▪ Begins June 17, 2024 and extends until AGM 2025 SEK ▪ Safe Harbour compliant Ambition to use as a recurring part of Essity’s capital allocation 3bn June 17, 2024
Slide 14: Fredrik Rystedt, CFO & Executive Vice President
Fredrik Rystedt CFO & Executive Vice President
Slide 15: Vinda Impact on Growth and ROCE
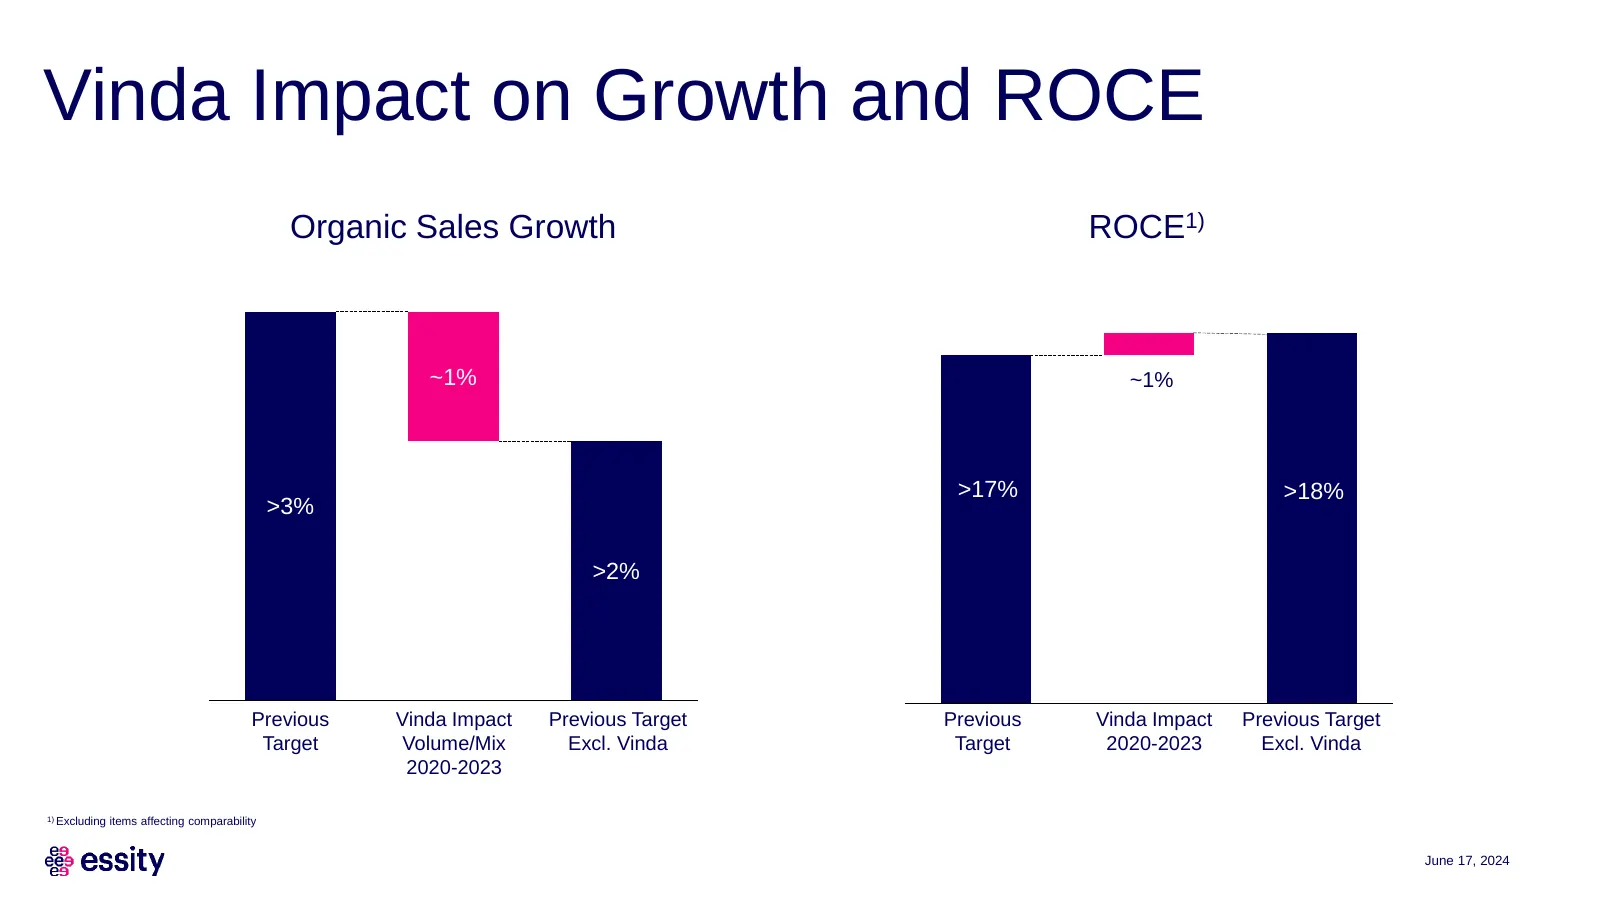
Vinda Impact on Growth and ROCE Organic Sales Growth ROCE1) ~ ~1% ~1% >17% >18% >3% >2% Previous Vinda Impact Previous Target Previous Vinda Impact Previous Target Target Volume/Mix Excl. Vinda Target 2020-2023 Excl. Vinda 2020-2023 1) Excluding items affecting comparability June 17, 2024
Slide 16: The ROCE Components
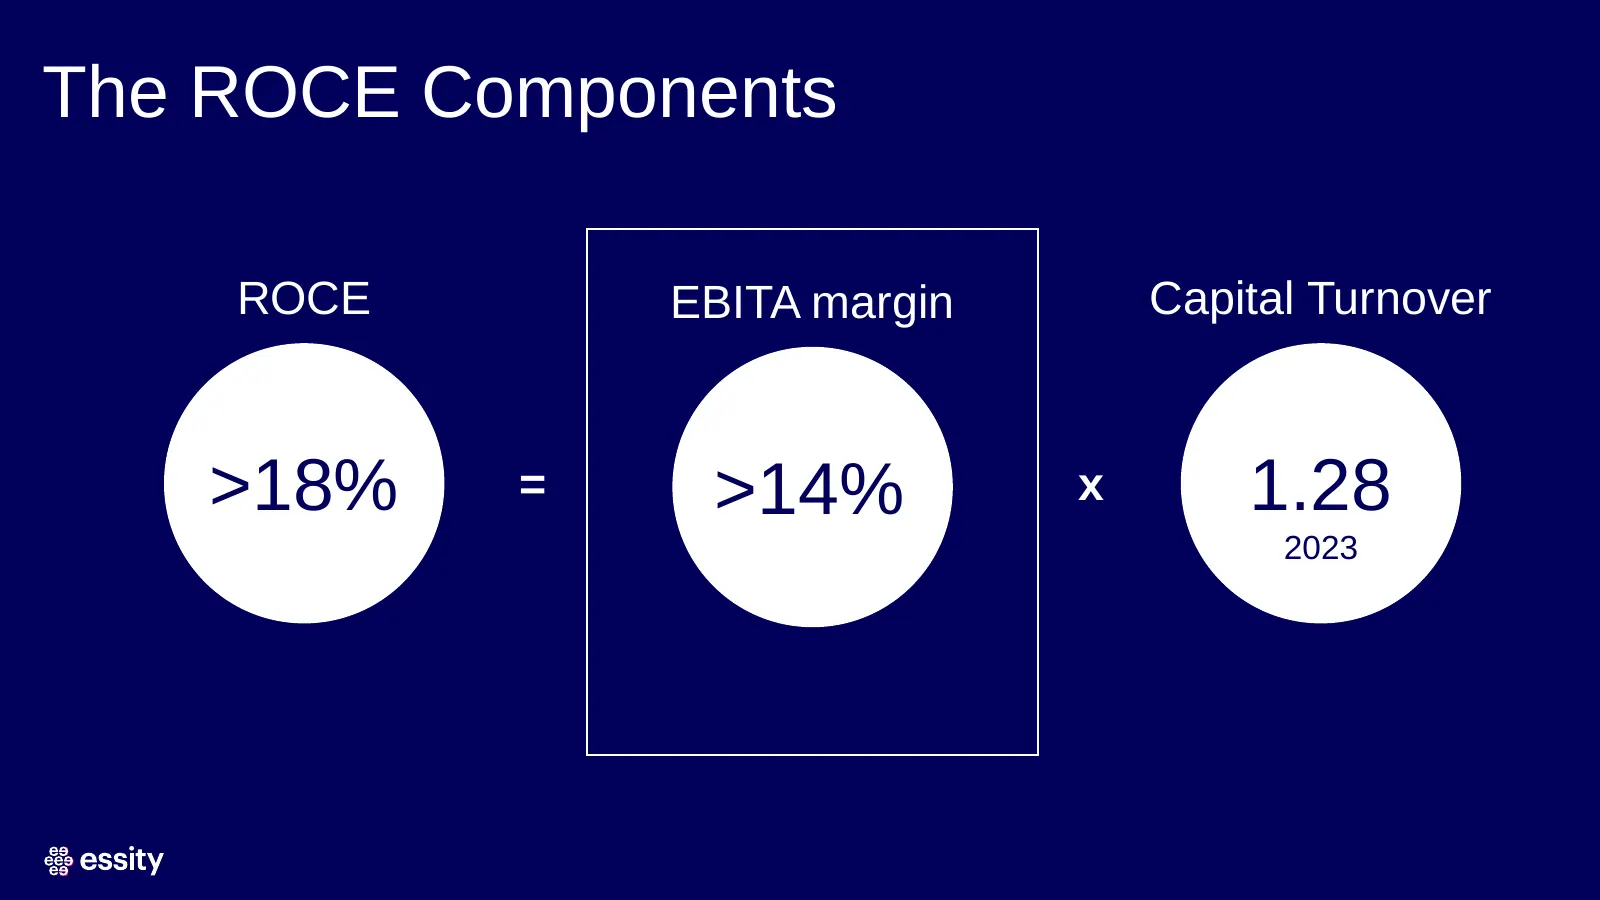
The ROCE Components ROCE EBITA margin Capital Turnover >18% = >14% x 1.28 2023 June 17, 2024
Slide 17: New Financial Targets – Higher Ambitions
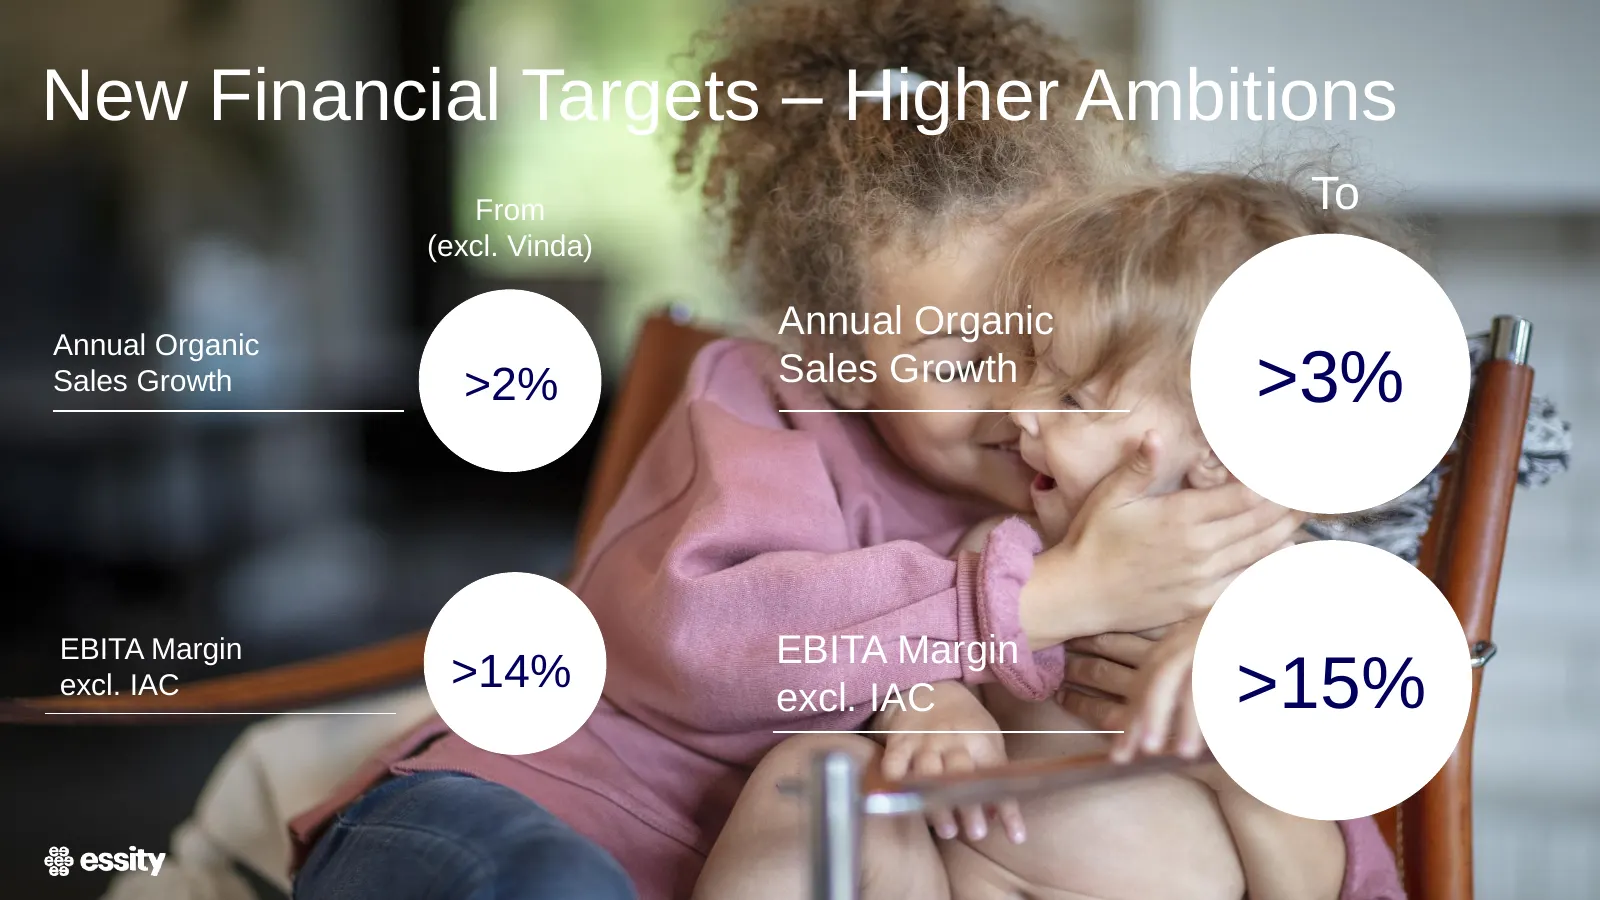
New Financial Targets – Higher Ambitions From To (excl. Vinda) Annual Organic Annual Organic Sales Growth >2% Sales Growth >3% EBITA Margin excl. IAC >14% Text EBITA Margin excl. IAC >15%
Slide 18: Favorable Market Trends
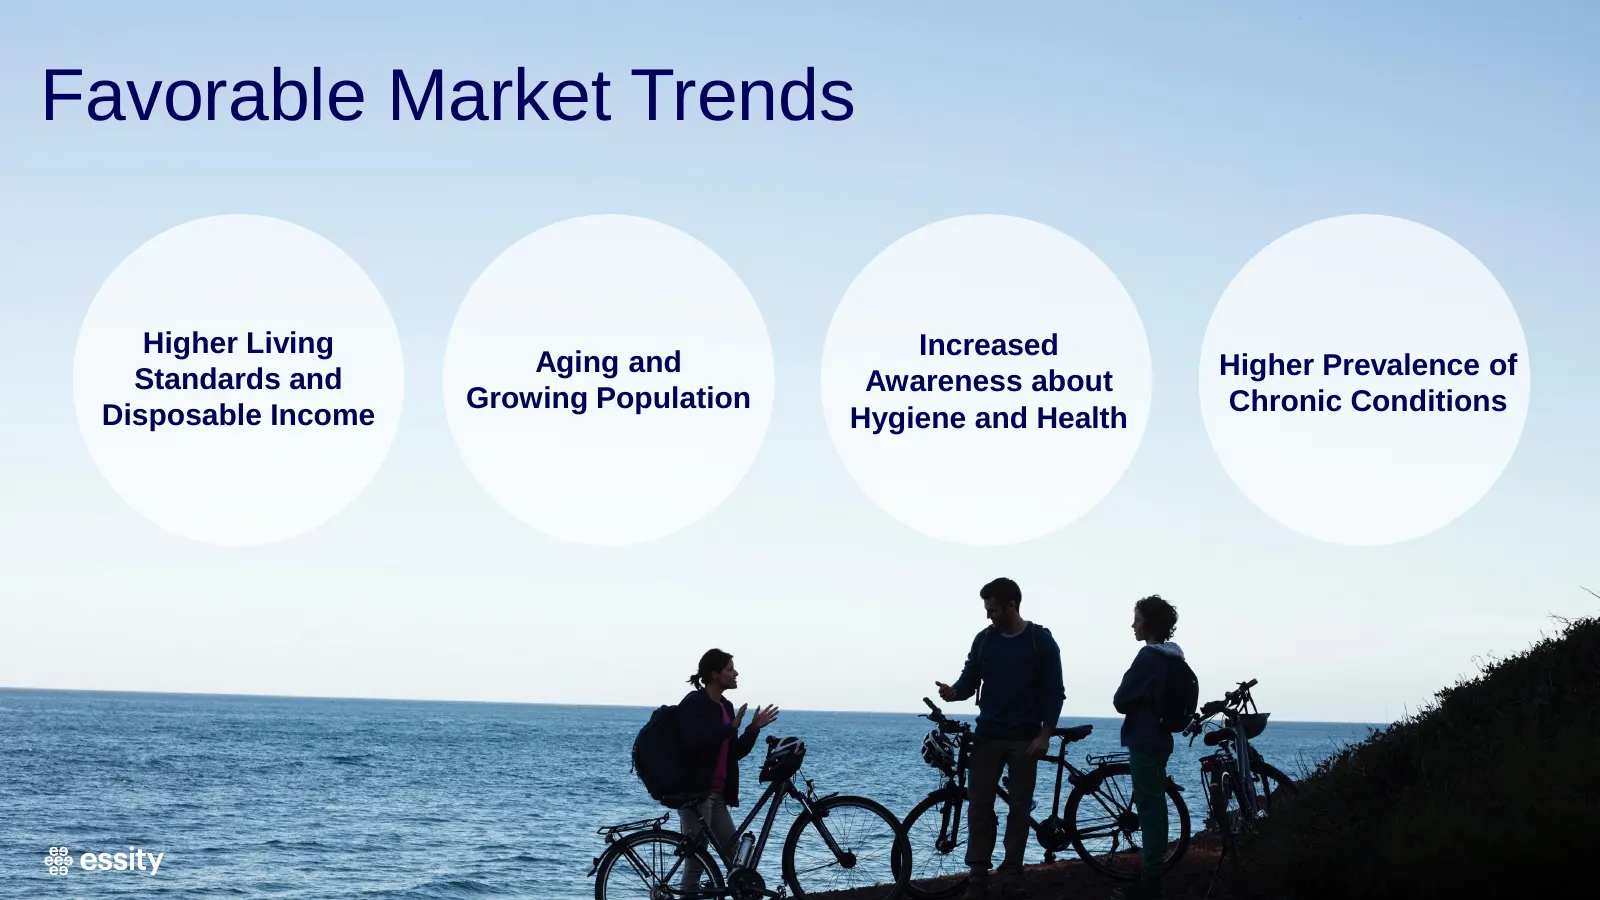
Favorable Market Trends Higher Living Increased Aging and Higher Prevalence of Standards and Awareness about Growing Population Chronic Conditions Disposable Income Hygiene and Health
Slide 19: Essity's Global Market Growth Exposure
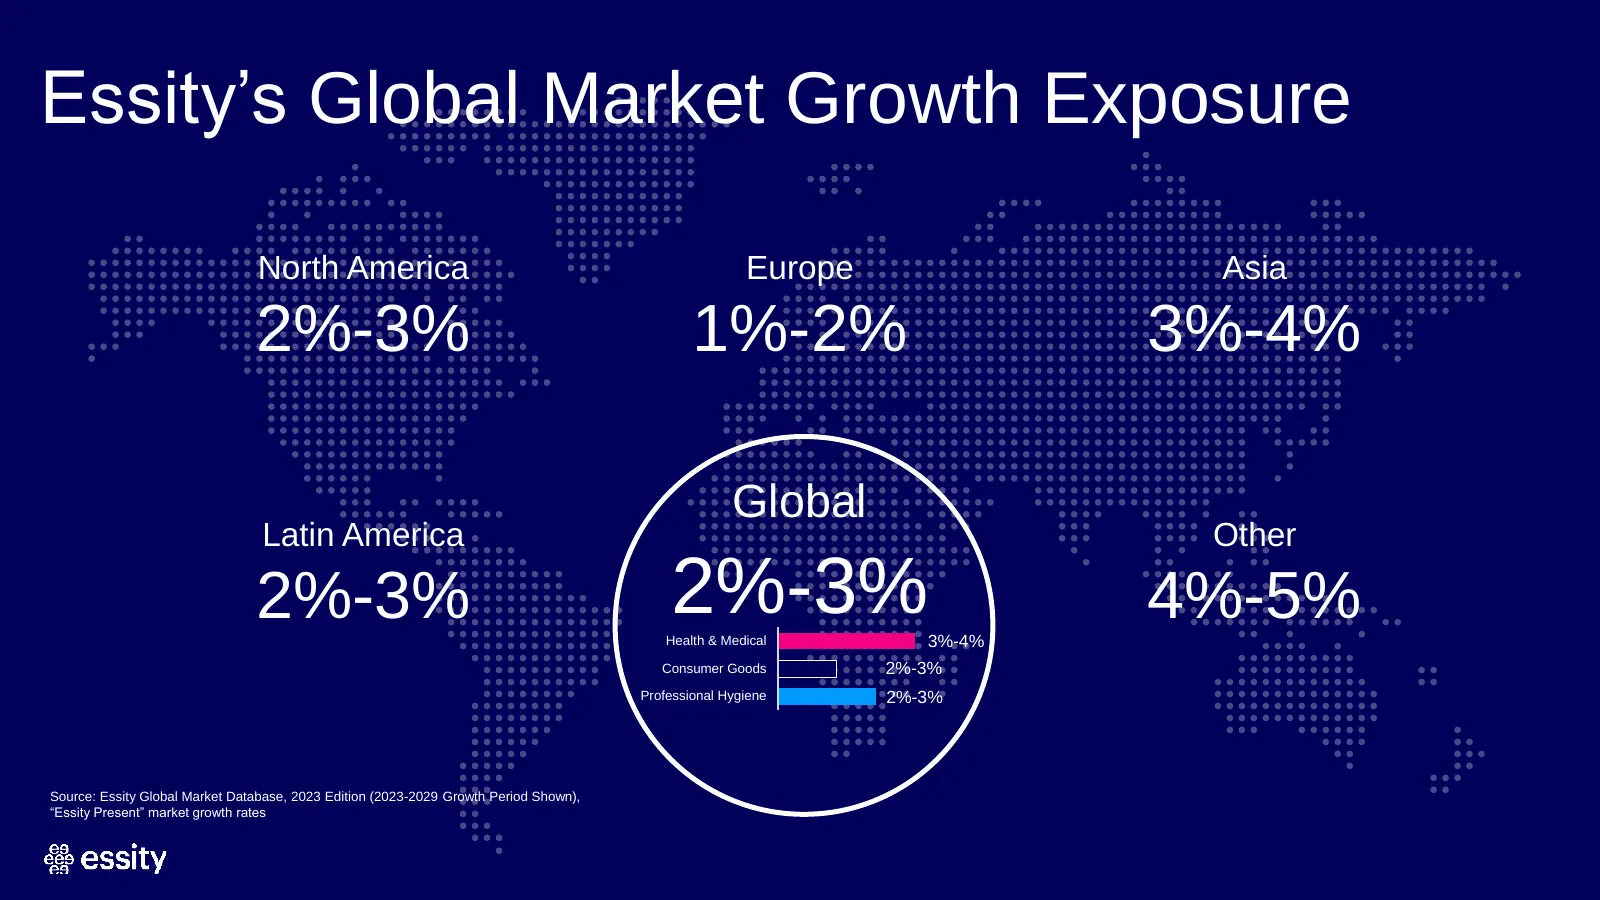
Essity’s Global Market Growth Exposure North America Europe Asia 2%-3% 1%-2% 3%-4% Global Latin America Other 2%-3% 2%-3% Health & Medical 3%-4% 4%-5% Consumer Goods 2%-3% Professional Hygiene 2%-3% Source: Essity Global Market Database, 2023 Edition (2023-2029 Growth Period Shown), “Essity Present”
Slide 20: Shifting Gears to Growth
Shifting Gears to Growth ▪ Focused organization ─ Externally oriented after period of internal change and restructuring ─ Remuneration incentives geared to growth ▪ Focused portfolio ─ Good underlying market growth ─ Superior product assortment ─ Robust gross margin and value creating operating marg
Slide 21: Roadmap to EBITA Margin Target
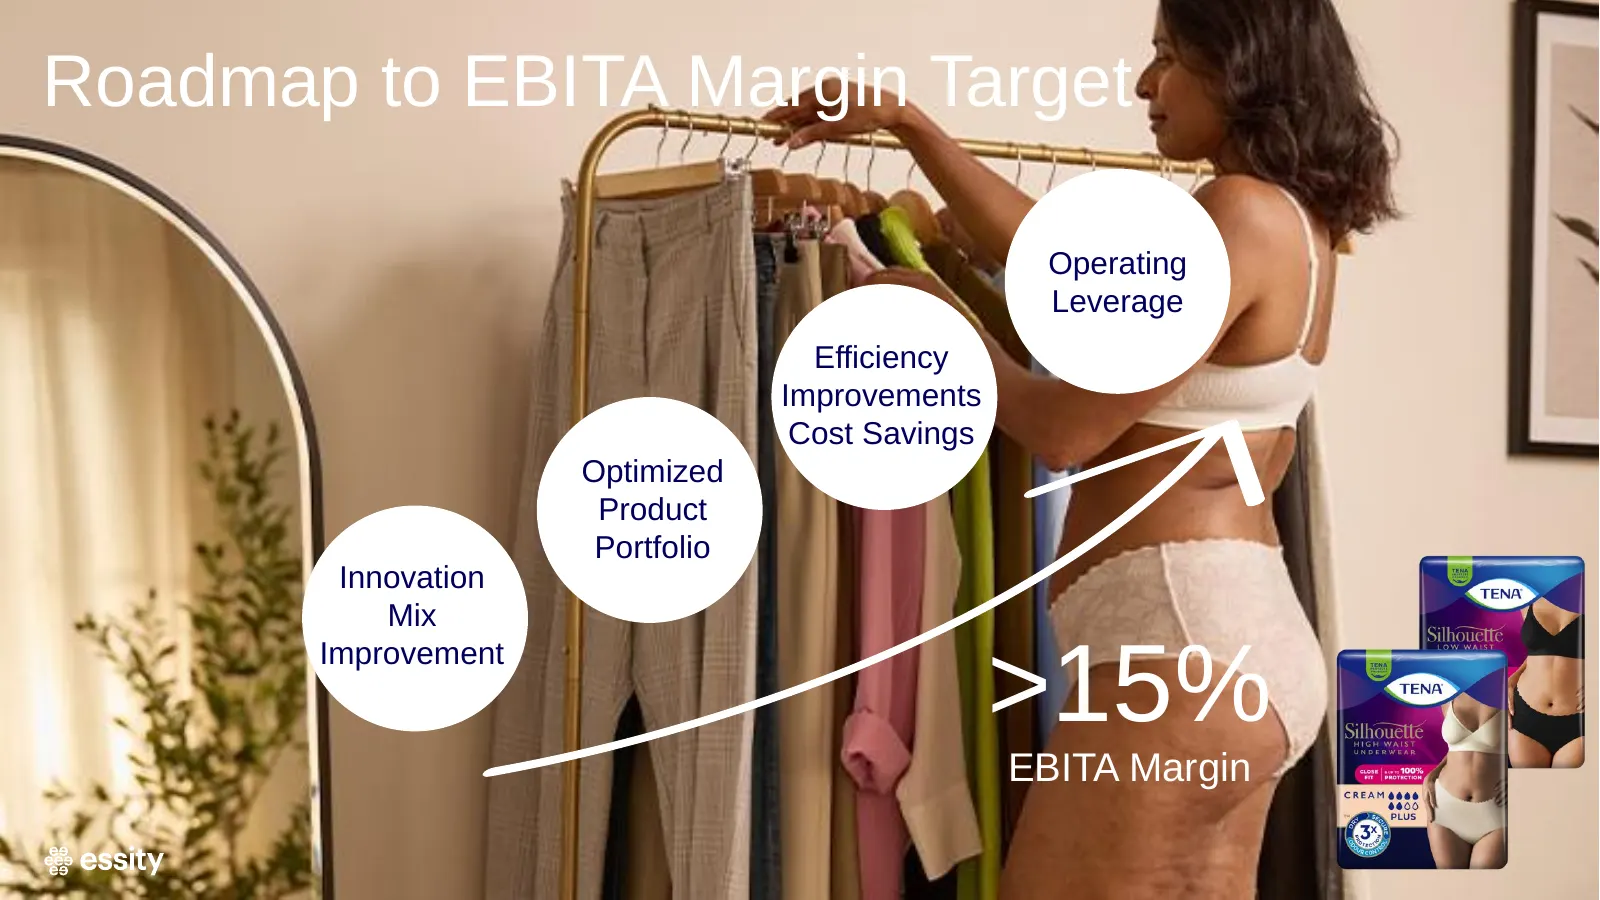
Roadmap to EBITA Margin Target Operating Leverage Efficiency Improvements Cost Savings Optimized Product Portfolio Innovation Mix Improvement >15% EBITA Margin

Slide 22: Magnus Groth, President and CEO
Magnus Groth President and CEO
Slide 23: Summary
Summary ▪ New financial targets ─ Annual organic sales growth >3% ─ EBITA margin >15% ▪ Financial restrictions and policies unchanged ─ Maintain solid investment grade rating ─ Stable and rising dividends ▪ Share buyback program SEK 3bn ─ Ambition to use as a recurring part of Essity’s capital alloc
Slide 24: Essity – Fit for Profitable Growth to Drive Increased Shareholder Value
Essity – Fit for Profitable Growth to Drive Increased Shareholder Value Globally leading in attractive and growing hygiene and health markets Leading market positions based on strong brands and successful innovations Focus to increase sales in fastest growing and most profitable segments and channel
Slide 25: Forward-looking statements
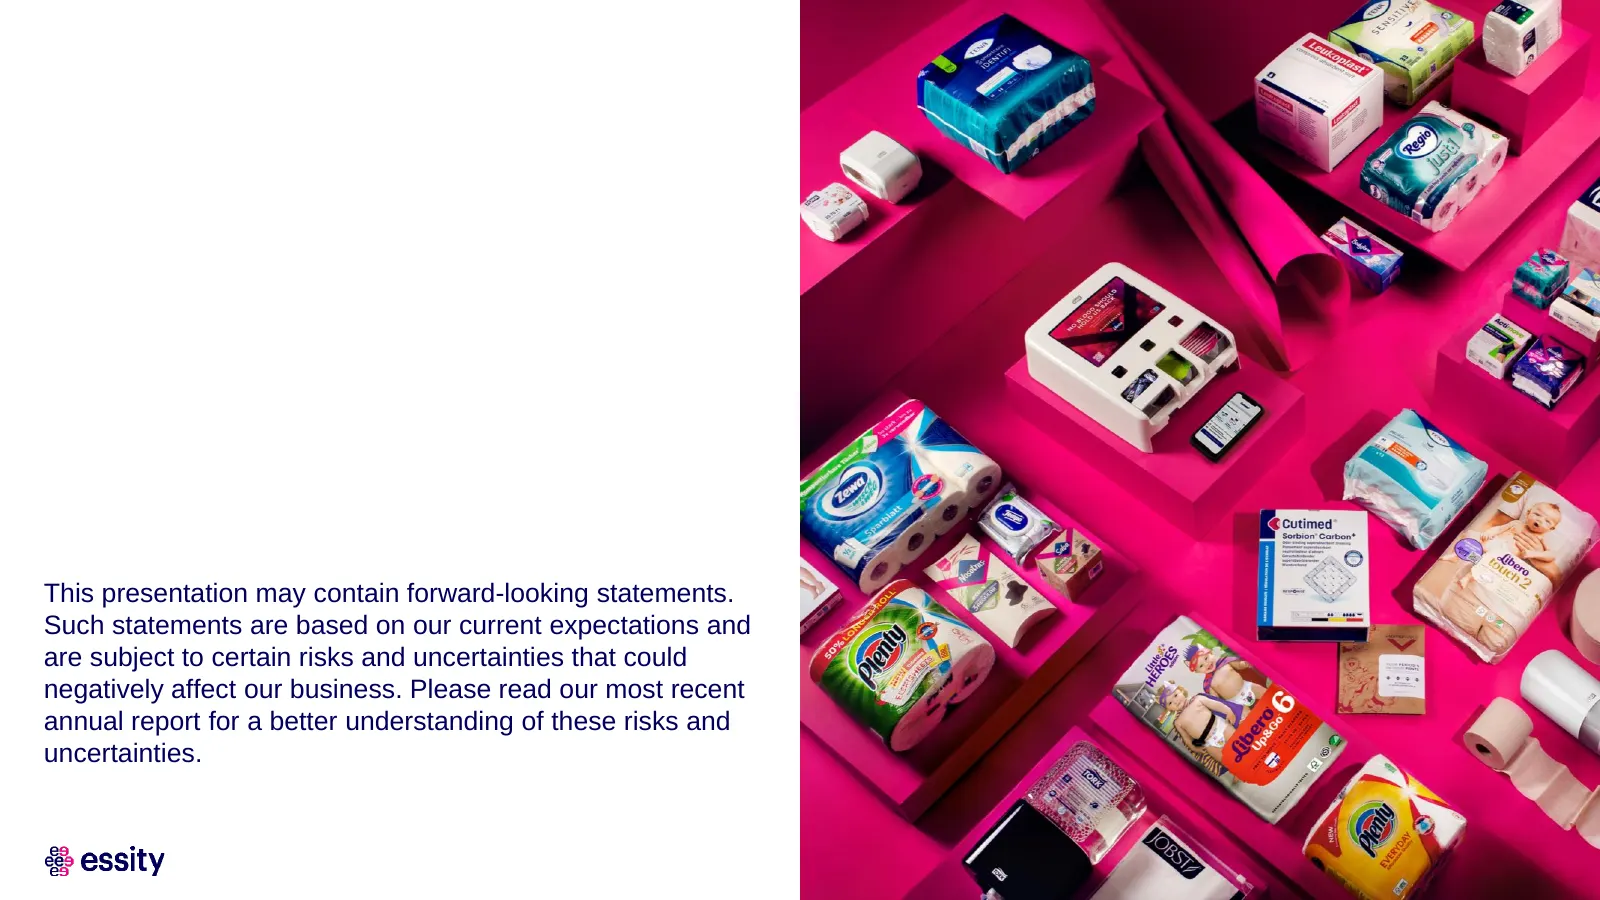
This presentation may contain forward-looking statements. Such statements are based on our current expectations and are subject to certain risks and uncertainties that could negatively affect our business. Please read our most recent annual report for a better understanding of these risks and uncert

Slide 26: Q&A
Text Q&A

Slide 27: Thank you.
Thank you.
Source: Internet Archive copy of essity.com
More decks from Essity AB Class A
 Q3 2026 Earnings Presentation28 slides · Oct 22, 2026
 Q2 2026 Earnings Presentation20 slides · Jul 16, 2026
 Investor Day (May 2026)122 slides · May 7, 2026
 Q1 2026 Earnings Presentation20 slides · Apr 23, 2026
 Q4 2025 Earnings Presentation22 slides · Jan 22, 2026
 Q3 2025 Earnings Presentation17 slides · Oct 23, 2025