Pioneer Natural Resources — Investor Presentation (February 2008)
38 slides from Pioneer Natural Resources's investor presentation, Feb 26, 2008
Slide 1: Investor Presentation February 2008
Investor Presentation February 2008
Slide 2: Forward-Looking Statements
Forward-Looking Statements Except for historical information contained herein, the statements, charts and graphs in this presentation are forward-looking statements that are made pursuant to the Safe Harbor Provisions of the Private Securities Litigation Reform Act of 1995. Forward- looking statemen
Slide 3: Investment Highlights
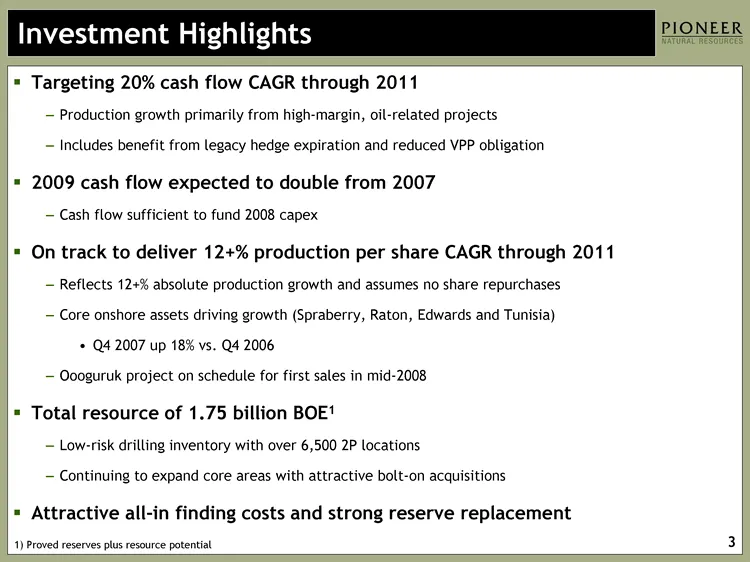
Investment Highlights Targeting 20% cash flow CAGR through 2011 Production growth primarily from high-margin, oil-related projects Includes benefit from legacy hedge expiration and reduced VPP obligation 2009 cash flow expected to double from 2007 Cash flow sufficient to fund 2008 capex On track to
Slide 4: Targeting 20% Cash Flow CAGR
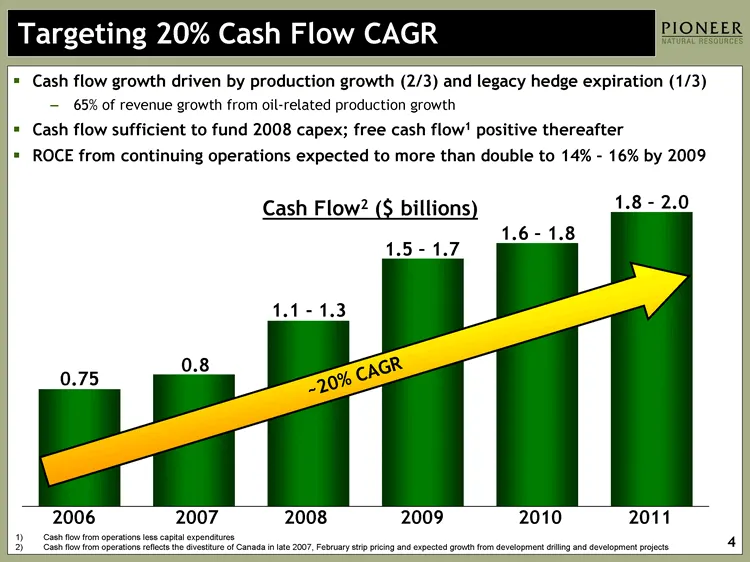
2006 2007 2008 2009 2010 2011 East 0.756 0.85 1.2 1.6 1.7 1.9 Targeting 20% Cash Flow CAGR Cash flow from operations less capital expenditures Cash flow from operations reflects the divestiture of Canada in late 2007, February strip pricing and expected growth from development drilling and developme
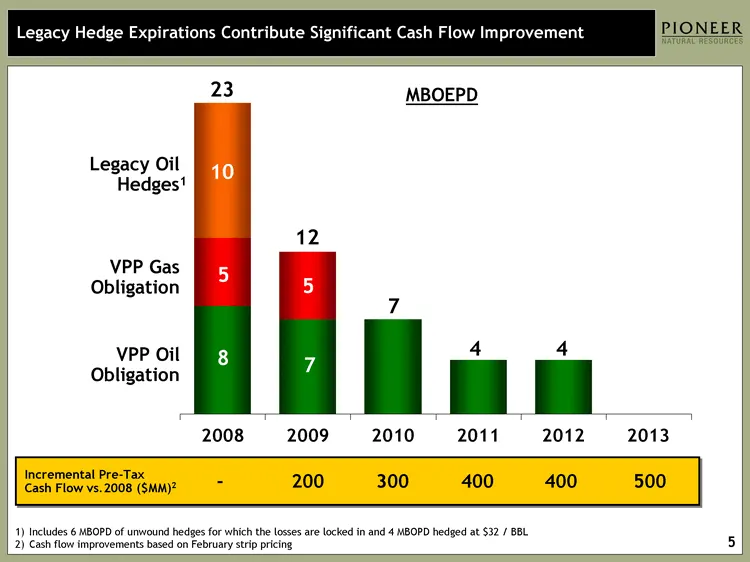
Slide 5: Legacy Hedge Expirations Contribute Significant Cash Flow Improvement
2008 2009 2010 2011 2012 2013 Historical Production VPP Oil 8 7 7 4 4 0 VPP Gas 5 5 Legacy Hedges 10 Legacy Hedge Expirations Contribute Significant Cash Flow Improvement VPP Oil Obligation 12 Includes 6 MBOPD of unwound hedges for which the losses are locked in and 4 MBOPD hedged at $32 / BBL Cash
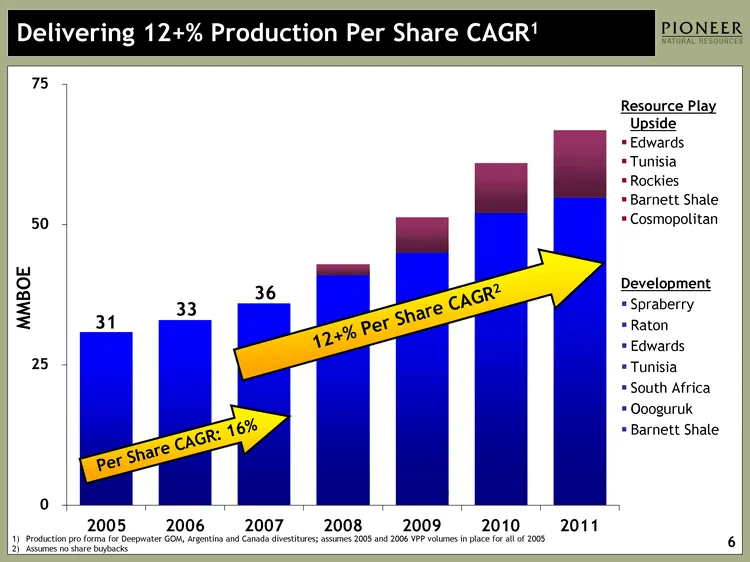
Slide 6: Delivering 12+% Production Per Share CAGR
2005 2006 2007 2008 2009 2010 2011 Historical Production Production Outlook 30.9 33 36 41 45 52 54.8 1.9 6.3 9 12 Delivering 12+% Production Per Share CAGR1 Development Spraberry Raton Edwards Tunisia South Africa Oooguruk Barnett Shale Resource Play Upside Edwards Tunisia Rockies Barnett Shale Cosm
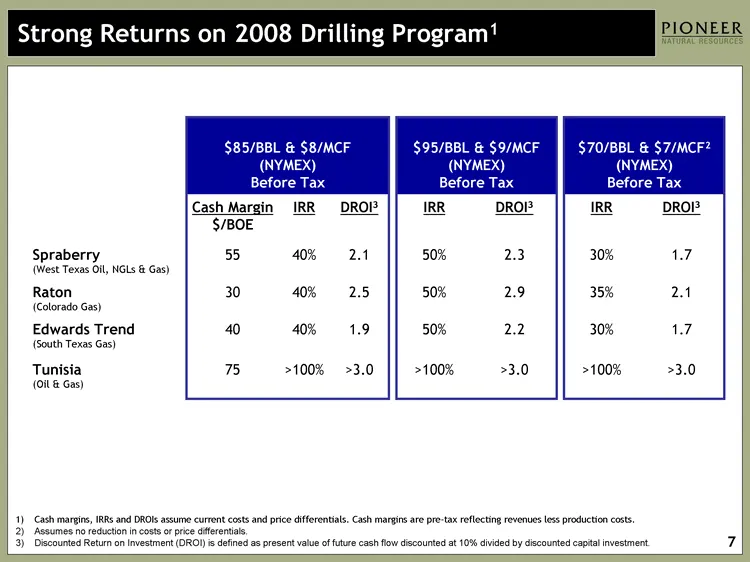
Slide 7: Strong Returns on 2008 Drilling Program
Strong Returns on 2008 Drilling Program1 $85/BBL & $8/MCF (NYMEX) Before Tax $85/BBL & $8/MCF (NYMEX) Before Tax $85/BBL & $8/MCF (NYMEX) Before Tax $95/BBL & $9/MCF (NYMEX) Before Tax $95/BBL & $9/MCF (NYMEX) Before Tax $70/BBL & $7/MCF2 (NYMEX) Before Tax $70/BBL & $7/MCF2 (NYMEX) Before Tax Cash
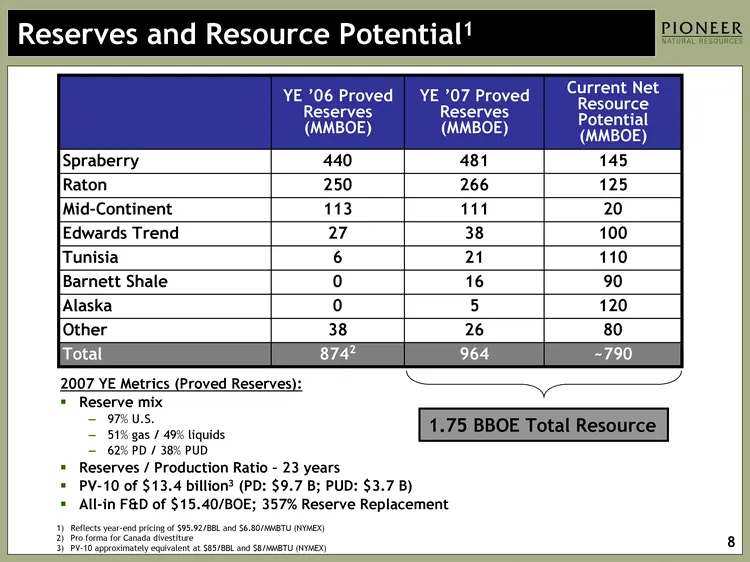
Slide 8: Reserves and Resource Potential
Reserves and Resource Potential1 YE '06 Proved Reserves (MMBOE) YE '07 Proved Reserves (MMBOE) Current Net Resource Potential (MMBOE) Spraberry 440 481 145 Raton 250 266 125 Mid-Continent 113 111 20 Edwards Trend 27 38 100 Tunisia 6 21 110 Barnett Shale 0 16 90 Alaska 0 5 120 Other 38 26 80 Total 87
Slide 9: Spraberry - A Premier Resource Play
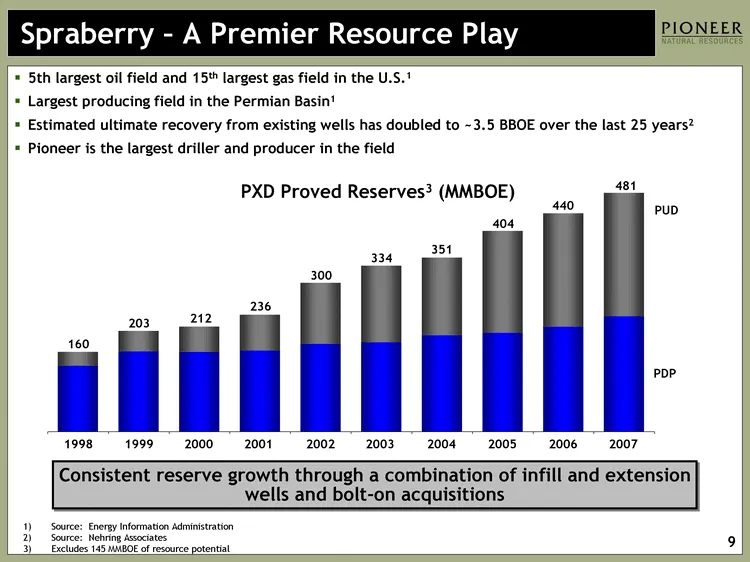
5th largest oil field and 15th largest gas field in the U.S.1 Largest producing field in the Permian Basin1 Estimated ultimate recovery from existing wells has doubled to ~3.5 BBOE over the last 25 years2 Pioneer is the largest driller and producer in the field PDP PUD 1998 133 28 1999 162 41 2000 1
Slide 10: Spraberry Resource Play - Cornerstone of Growth
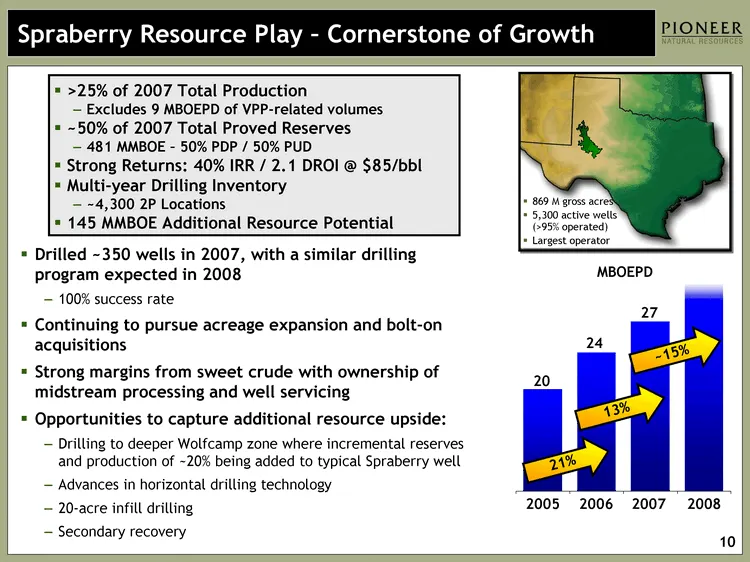
Spraberry Resource Play - Cornerstone of Growth Drilled ~350 wells in 2007, with a similar drilling program expected in 2008 100% success rate Continuing to pursue acreage expansion and bolt-on acquisitions Strong margins from sweet crude with ownership of midstream processing and well servicing Opp
Slide 11: Raton Growth Continues
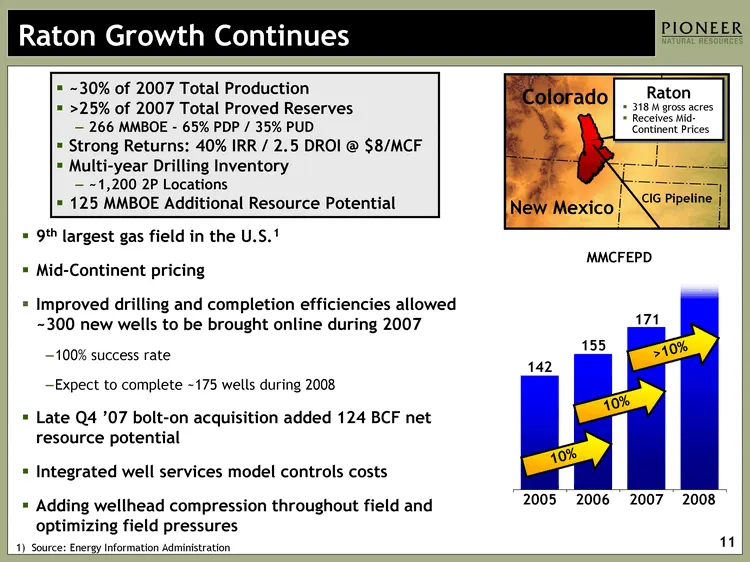
Raton Growth Continues New Mexico Colorado Raton 318 M gross acres Receives Mid- Continent Prices MMCFEPD 9th largest gas field in the U.S.1 Mid-Continent pricing Improved drilling and completion efficiencies allowed ~300 new wells to be brought online during 2007 100% success rate Expect to complet
Slide 12: Edwards Trend Success Continues
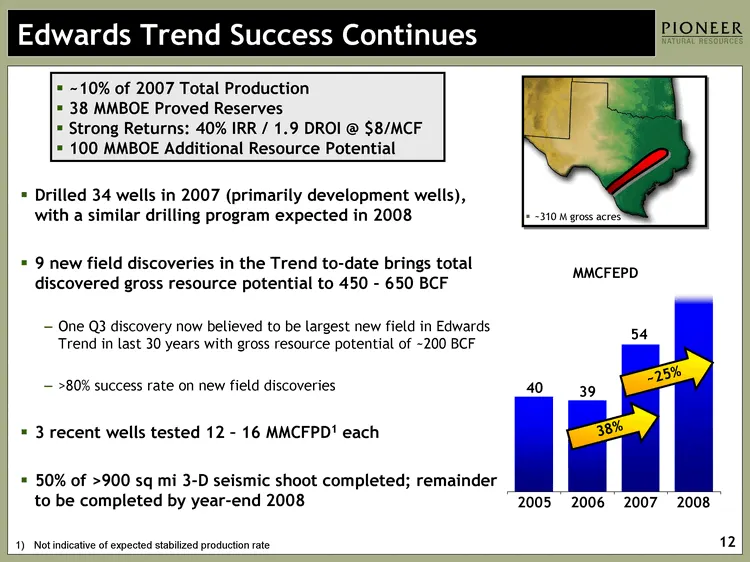
Edwards Trend Success Continues Drilled 34 wells in 2007 (primarily development wells), with a similar drilling program expected in 2008 9 new field discoveries in the Trend to-date brings total discovered gross resource potential to 450 - 650 BCF One Q3 discovery now believed to be largest new fiel
Slide 13: Barnett Shale - PXD To Commence Drilling
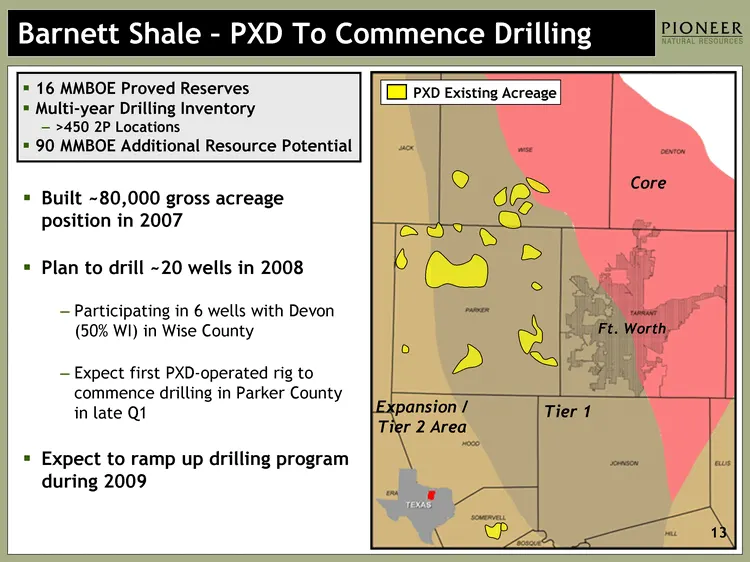
Barnett Shale - PXD To Commence Drilling Expansion / Tier 2 Area Tier 1 Core Ft. Worth 13 Built ~80,000 gross acreage position in 2007 Plan to drill ~20 wells in 2008 Participating in 6 wells with Devon (50% WI) in Wise County Expect first PXD-operated rig to commence drilling in Parker County in la
Slide 14: Tunisia Success Continues
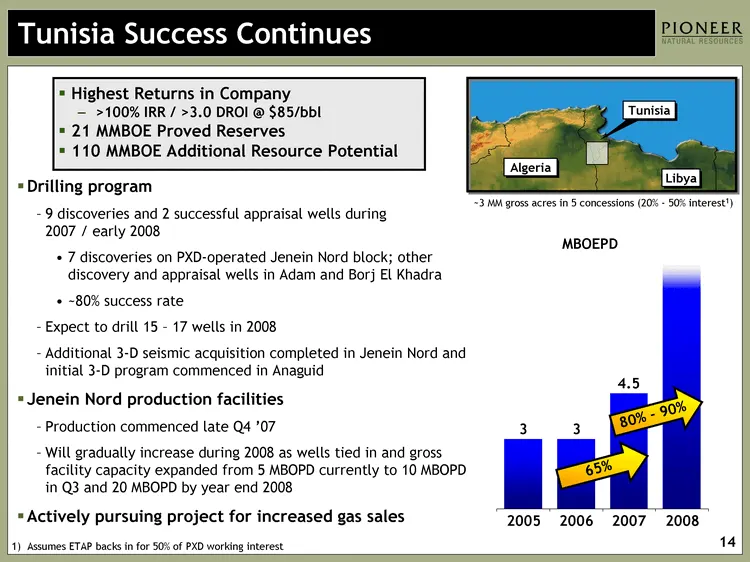
Tunisia Success Continues Drilling program 9 discoveries and 2 successful appraisal wells during 2007 / early 2008 7 discoveries on PXD-operated Jenein Nord block; other discovery and appraisal wells in Adam and Borj El Khadra ~80% success rate Expect to drill 15 - 17 wells in 2008 Additional 3-D se
Slide 15: South Africa Now Producing Oil & Gas
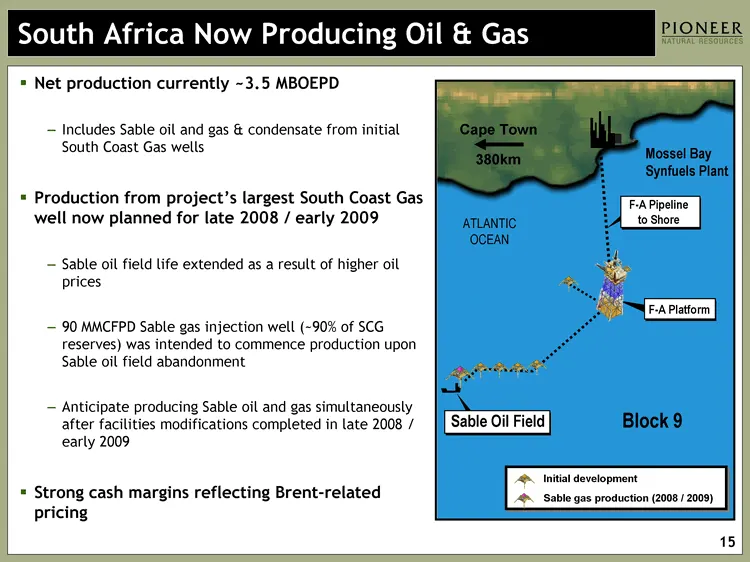
South Africa Now Producing Oil & Gas Net production currently ~3.5 MBOEPD Includes Sable oil and gas & condensate from initial South Coast Gas wells Production from project's largest South Coast Gas well now planned for late 2008 / early 2009 Sable oil field life extended as a result of higher oil p
Slide 16: Oooguruk Project On Schedule
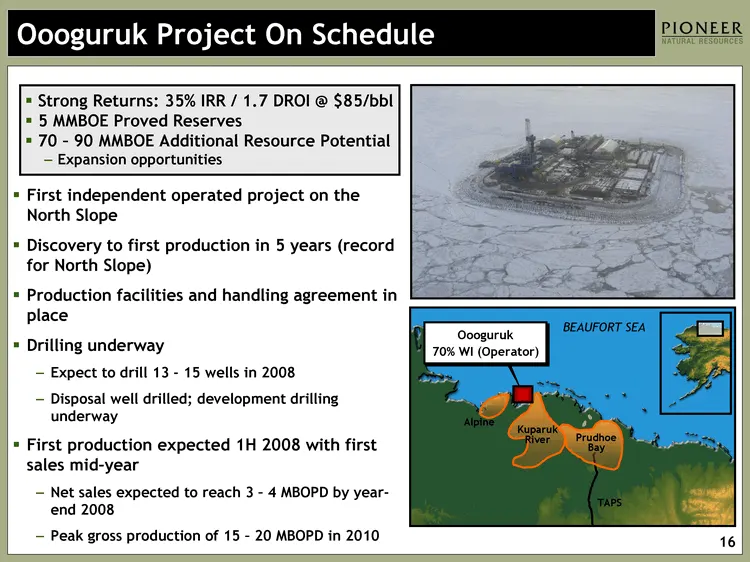
Oooguruk Project On Schedule First independent operated project on the North Slope Discovery to first production in 5 years (record for North Slope) Production facilities and handling agreement in place Drilling underway Expect to drill 13 - 15 wells in 2008 Disposal well drilled; development drilli
Slide 17: Cosmopolitan Test Results Encouraging
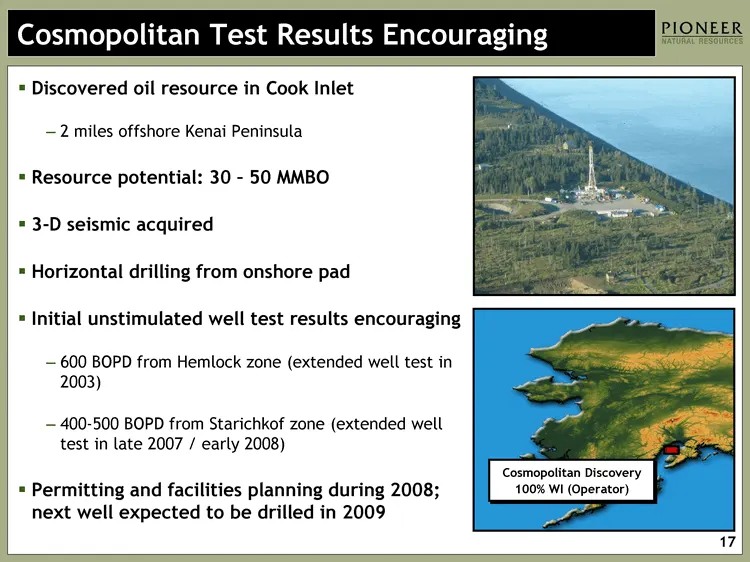
Cosmopolitan Test Results Encouraging Cosmopolitan Test Results Encouraging Cosmopolitan Discovery 100% WI (Operator) Discovered oil resource in Cook Inlet 2 miles offshore Kenai Peninsula Resource potential: 30 - 50 MMBO 3-D seismic acquired Horizontal drilling from onshore pad Initial unstimulated
Slide 18: Investment Highlights
Investment Highlights Targeting 20% cash flow CAGR through 2011 2009 cash flow expected to double from 2007 On track to deliver 12+% production per share CAGR through 2011 Total resource of 1.75 billion BOE1 1) Proved reserves plus resource potential
Slide 19: Appendix
Appendix
Slide 20: Hedge Position and Hedging Strategy
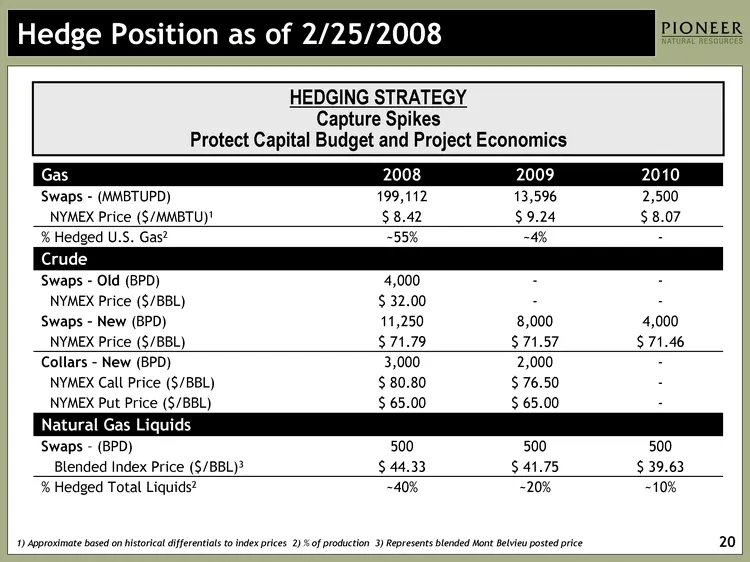
1) Approximate based on historical differentials to index prices 2) % of production 3) Represents blended Mont Belvieu posted price Gas 2008 2009 2010 Swaps - (MMBTUPD) 199,112 13,596 2,500 NYMEX Price ($/MMBTU)1 $ 8.42 $ 9.24 $ 8.07 % Hedged U.S. Gas2 ~55% ~4% - Crude Swaps - Old (BPD) 4,000 - - NY
Slide 21: Delivering Consistent Production Growth
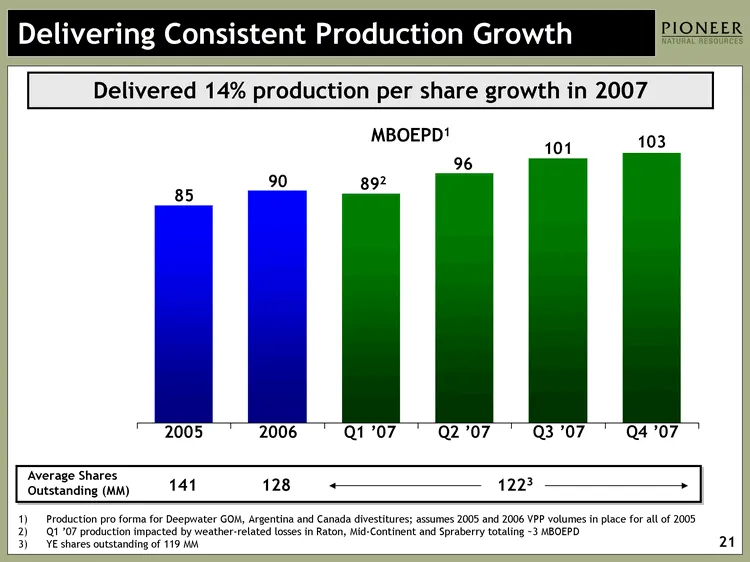
Delivering Consistent Production Growth 2005 2006 Q1 2007 Q2 2007 Q3 2007 Q4 2007 2008 East 85 90 89 96 101 103 109 90 103 892 1) Production pro forma for Deepwater GOM, Argentina and Canada divestitures; assumes 2005 and 2006 VPP volumes in place for all of 2005 Q1 '07 production impacted by weathe
Slide 22: Production (MBOEPD)
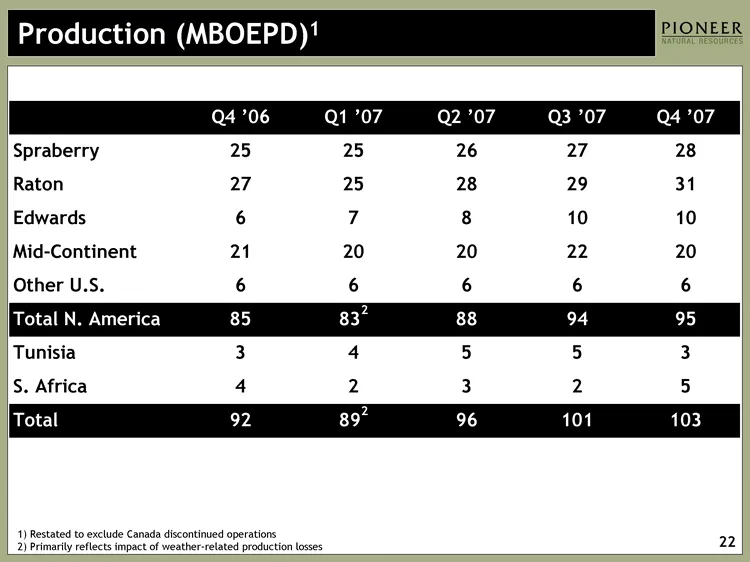
Production (MBOEPD)1 Q4 '06 Q1 '07 Q2 '07 Q3 '07 Q4 '07 Spraberry 25 25 26 27 28 Raton 27 25 28 29 31 Edwards 6 7 8 10 10 Mid-Continent 21 20 20 22 20 Other U.S. 6 6 6 6 6 Total N. America 85 832 88 94 95 Tunisia 3 4 5 5 3 S. Africa 4 2 3 2 5 Total 92 892 96 101 103 1) Restated to exclude Canada dis
Slide 23: Q4 '07 Acquisition Metrics
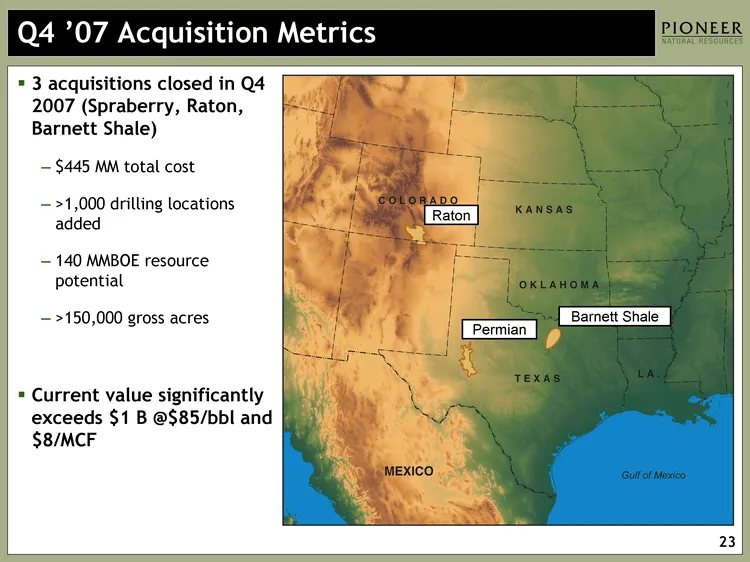
Q4 '07 Acquisition Metrics 3 acquisitions closed in Q4 2007 (Spraberry, Raton, Barnett Shale) $445 MM total cost >1,000 drilling locations added 140 MMBOE resource potential >150,000 gross acres Current value significantly exceeds $1 B @$85/bbl and $8/MCF Raton Permian Barnett Shale
Slide 24: 2008 Cash Flow Sensitivity
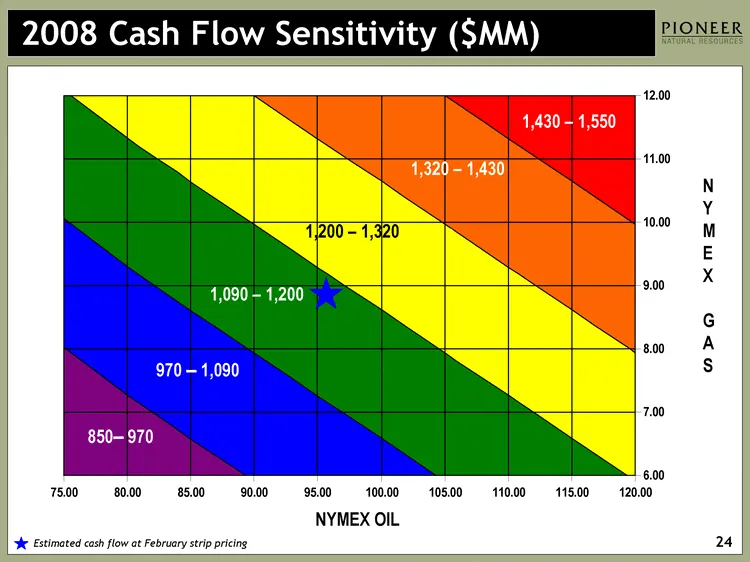
2008 Cash Flow Sensitivity ($MM) 850- 970 970 - 1,090 1,090 - 1,200 1,200 - 1,320 1,320 - 1,430 1,430 - 1,550 N Y M E X G A S NYMEX OIL Estimated cash flow at February strip pricing 24
Slide 25: 2009 Cash Flow Sensitivity
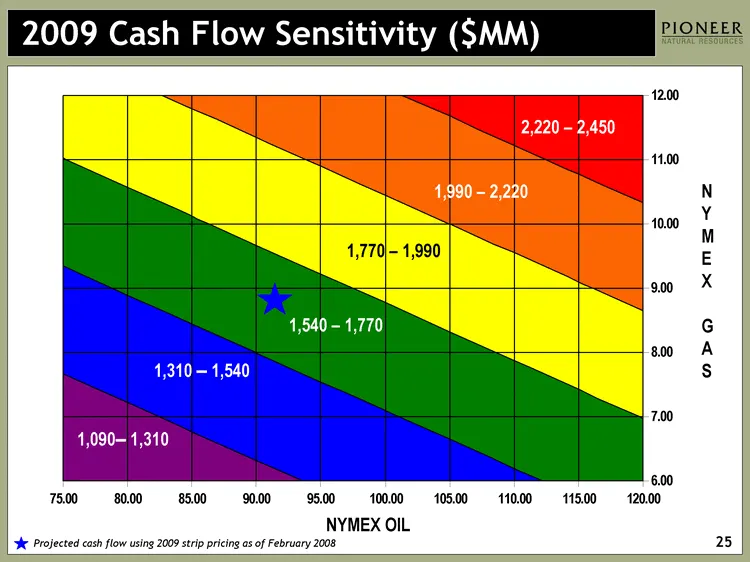
2009 Cash Flow Sensitivity ($MM) 1,090- 1,310 1,310 - 1,540 1,540 - 1,770 1,770 - 1,990 1,990 - 2,220 2,220 - 2,450 N Y M E X G A S NYMEX OIL Projected cash flow using 2009 strip pricing as of February 2008 25
Slide 26: Spraberry Type Well Payout ($85/BBL)
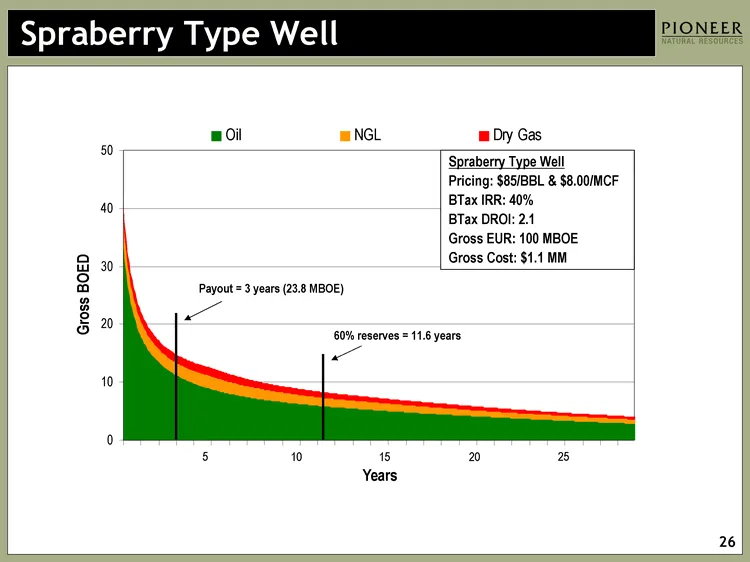
Spraberry Type Well Payout = 3 years (23.8 MBOE) 5 10 15 20 25 Spraberry Type Well Pricing: $85/BBL & $8.00/MCF BTax IRR: 40% BTax DROI: 2.1 Gross EUR: 100 MBOE Gross Cost: $1.1 MM 60% reserves = 11.6 years
Slide 27: Spraberry Type Well Payout ($95/BBL)
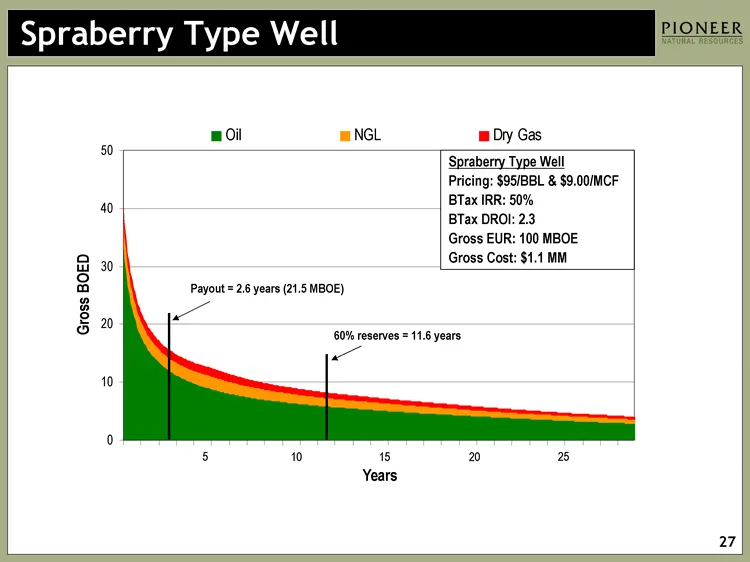
Spraberry Type Well Payout = 2.6 years (21.5 MBOE) 5 10 15 20 25 Spraberry Type Well Pricing: $95/BBL & $9.00/MCF BTax IRR: 50% BTax DROI: 2.3 Gross EUR: 100 MBOE Gross Cost: $1.1 MM 60% reserves = 11.6 years
Slide 28: Production Cost Trends
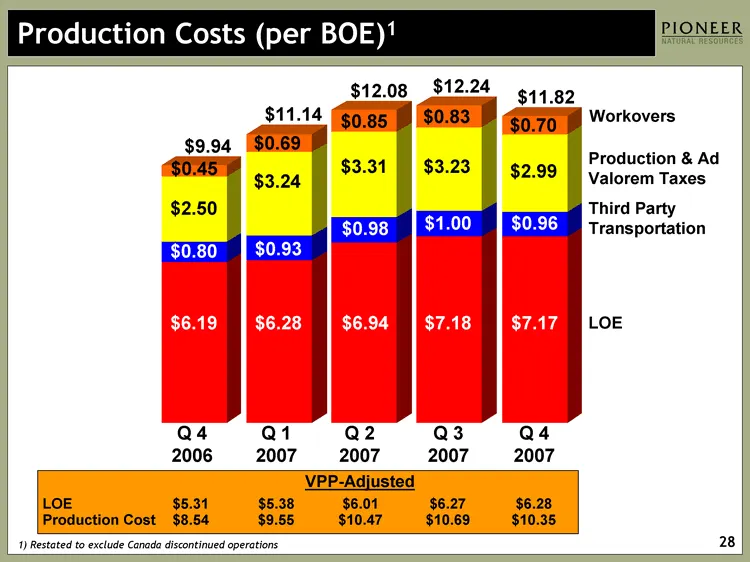
Q1 Q2 Q3 Q1 2000 Q2 2000 Q3 2000 Q4 2000 Q1 01 Q2 2001 Q3 01 Q4 01 Q1 02 Q2 02 Q3 02 Q4 02 Q1 03 Q2 03 Q3 03 Q4 03 Q1 04 Q2 04 Q3 04 Q4 04 Q1 05 Q2 05 Q3 05 Q4 05 Q1 06 Q2 06 Q3 06 Q4 06 Q1 2007 Q2 2007 Q3 2007 Q4 2007 LOE 2.99 2.42 2.47 2.18 2.05 2.2 2.33 2.36 2.58 2.89 3.19 3.29 2.88 2.63 2.68 3.0
Slide 29: VPP - Adjusted Production Costs
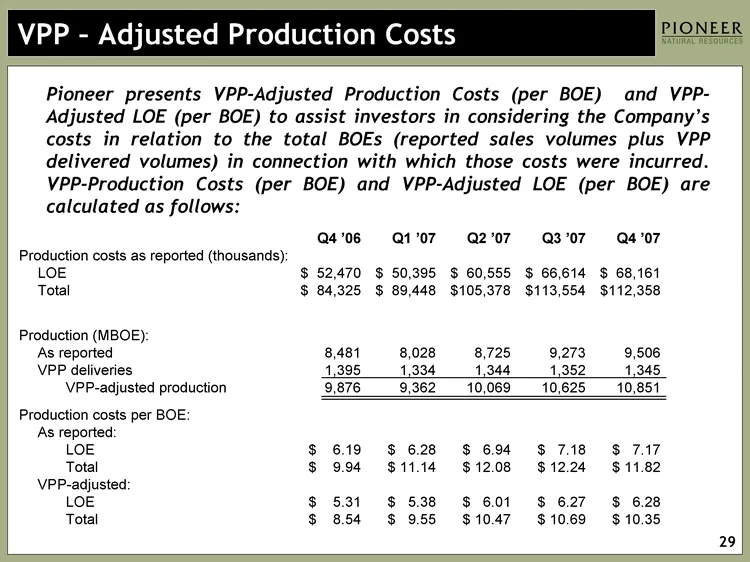
VPP - Adjusted Production Costs Pioneer presents VPP-Adjusted Production Costs (per BOE) and VPP- Adjusted LOE (per BOE) to assist investors in considering the Company's costs in relation to the total BOEs (reported sales volumes plus VPP delivered volumes) in connection with which those costs were
Slide 30: 9 Months 2007 All-in Costs vs. Peers
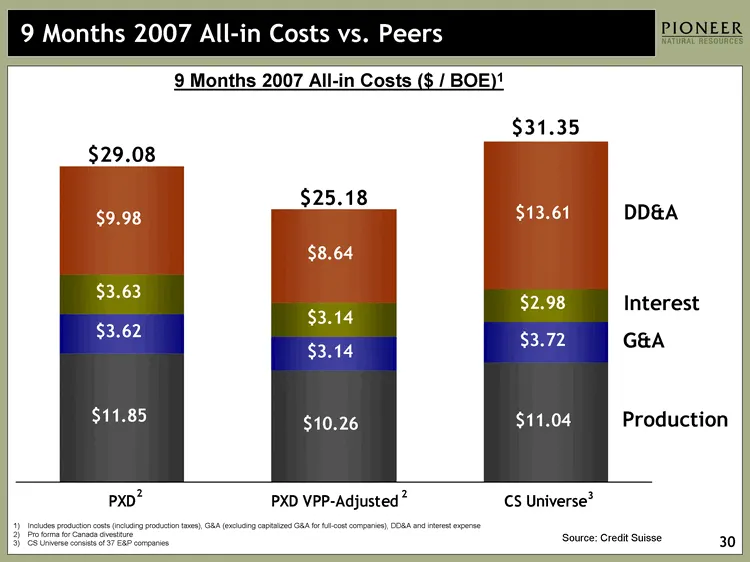
Op Cost G&A Interest DD&A PXD 11.85 3.62 3.63 9.98 PXD VPP-Adjusted 10.26 3.14 3.14 8.64 PEER AVG 10.18 2.65 2.25 12.32 CS Universe 11.04 3.72 2.98 13.61 9 Months 2007 All-in Costs vs. Peers Source: Credit Suisse 9 Months 2007 All-in Costs ($ / BOE)1 Includes production costs (including production t
Slide 31: Impact of Volumetric Production Payments: Volumes
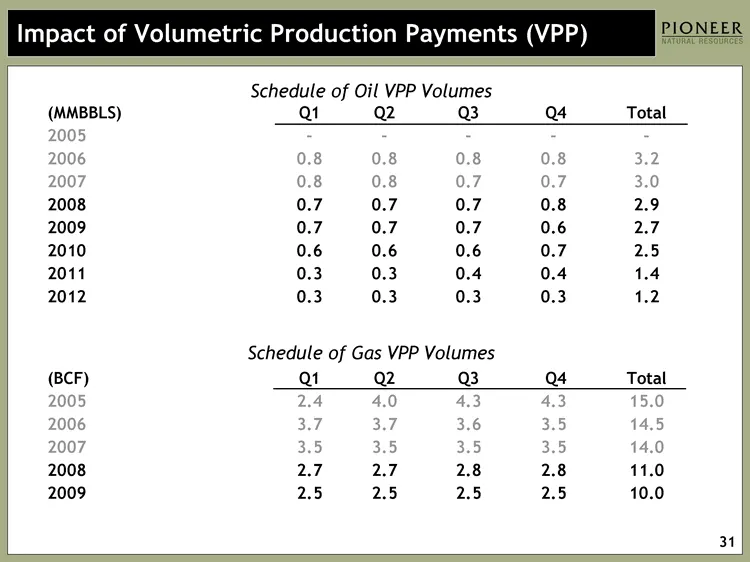
(MMBBLS) Q1 Q2 Q3 Q4 Total 2005 - - - - - 2006 0.8 0.8 0.8 0.8 3.2 2007 0.8 0.8 0.7 0.7 3.0 2008 0.7 0.7 0.7 0.8 2.9 2009 0.7 0.7 0.7 0.6 2.7 2010 0.6 0.6 0.6 0.7 2.5 2011 0.3 0.3 0.4 0.4 1.4 2012 0.3 0.3 0.3 0.3 1.2 (BCF) Q1 Q2 Q3 Q4 Total 2005 2.4 4.0 4.3 4.3 15.0 2006 3.7 3.7 3.6 3.5 14.5 2007 3.
Slide 32: Impact of Volumetric Production Payments: Amortization
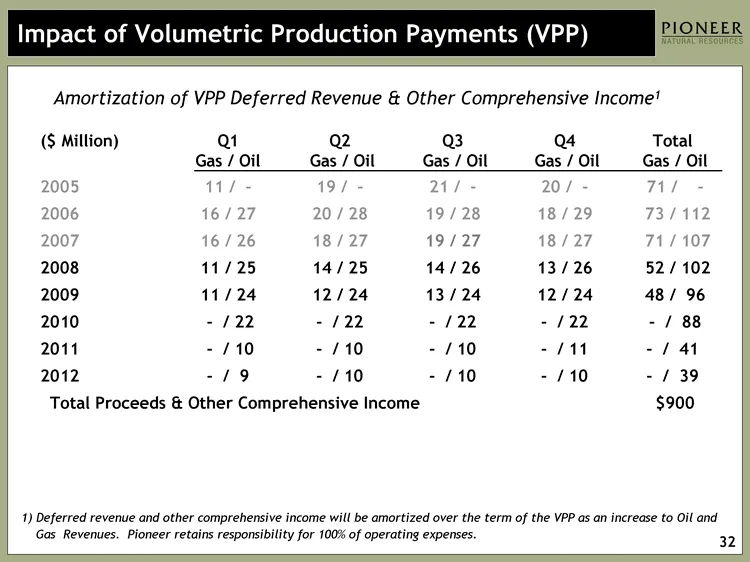
($ Million) Q1 Q2 Q3 Q4 Total Gas / Oil Gas / Oil Gas / Oil Gas / Oil Gas / Oil 2005 11 / - 19 / - 21 / - 20 / - 71 / - 2006 16 / 27 20 / 28 19 / 28 18 / 29 73 / 112 2007 16 / 26 18 / 27 19 / 27 18 / 27 71 / 107 2008 11 / 25 14 / 25 14 / 26 13 / 26 52 / 102 2009 11 / 24 12 / 24 13 / 24 12 / 24 48 /
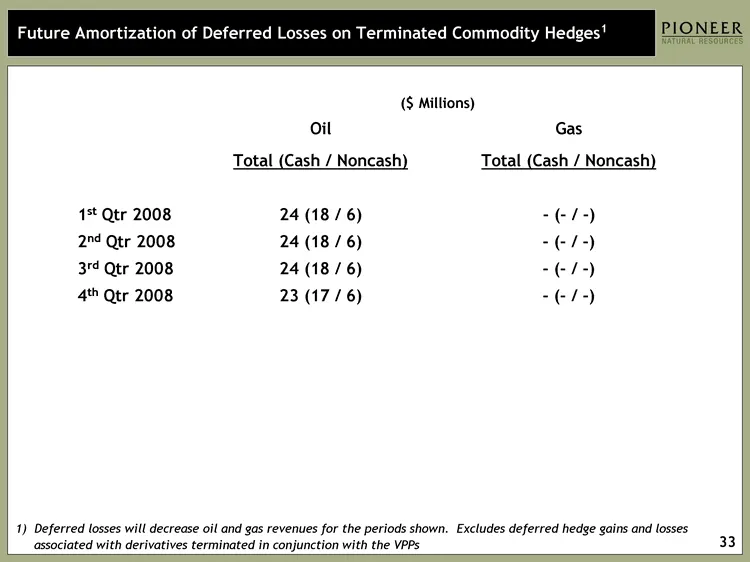
Slide 33: Future Amortization of Deferred Losses on Terminated Commodity Hedges
Future Amortization of Deferred Losses on Terminated Commodity Hedges1 1) Deferred losses will decrease oil and gas revenues for the periods shown. Excludes deferred hedge gains and losses associated with derivatives terminated in conjunction with the VPPs Oil Gas Total (Cash / Noncash) Total (Cash
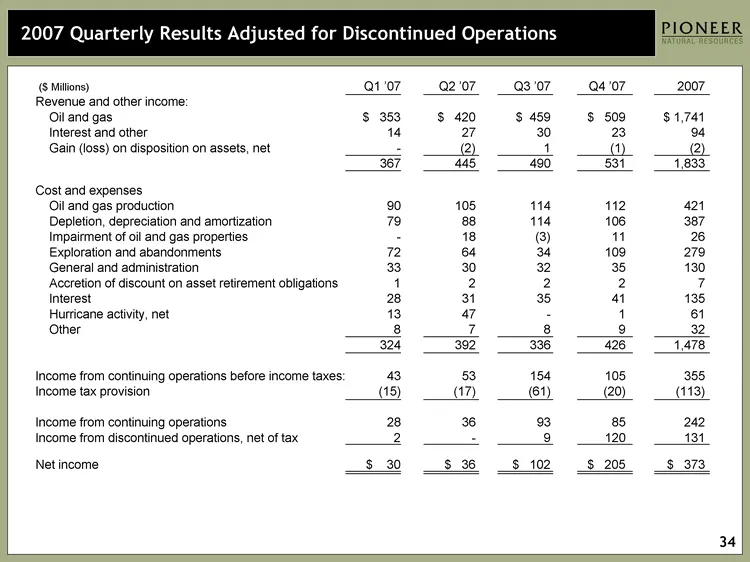
Slide 34: 2007 Quarterly Results Adjusted for Discontinued Operations
2007 Quarterly Results Adjusted for Discontinued Operations ($ Millions) Q1 '07 Q2 '07 Q3 '07 Q4 '07 2007 Revenue and other income: Oil and gas $ 353 $ 420 $ 459 $ 509 $ 1,741 Interest and other 14 27 30 23 94 Gain (loss) on disposition on assets, net - (2) 1 (1) (2) 367 445 490 531 1,833 Cost and e
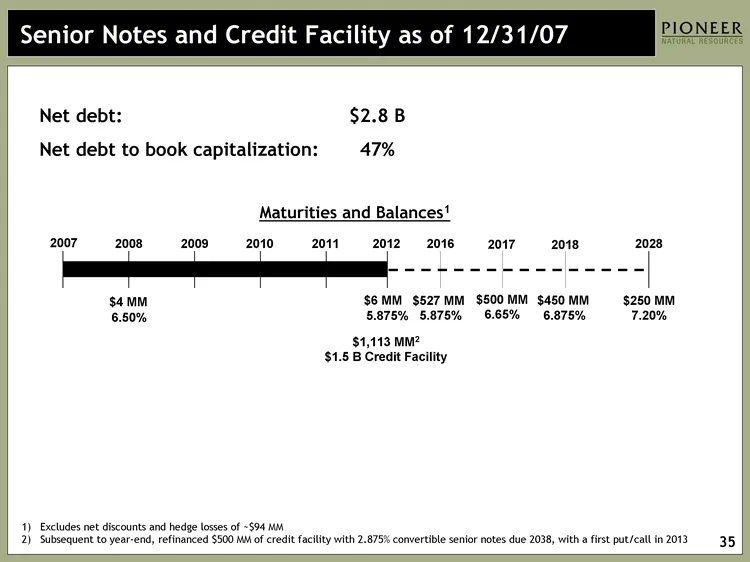
Slide 35: Senior Notes and Credit Facility
Senior Notes and Credit Facility as of 12/31/07 2007 2008 2009 2010 2011 2012 2028 $6 MM 5.875% $250 MM 7.20% 2016 $527 MM 5.875% 2018 $450 MM 6.875% $1,113 MM2 $1.5 B Credit Facility $4 MM 6.50% Maturities and Balances1 2017 $500 MM 6.65% Net debt: $2.8 B Net debt to book capitalization: 47% Exclud
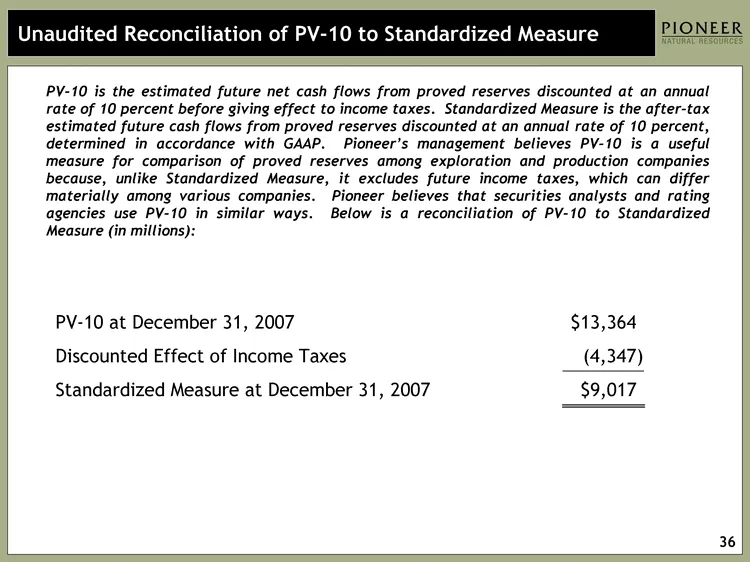
Slide 36: Reconciliation of PV-10 to Standardized Measure
Unaudited Reconciliation of PV-10 to Standardized Measure PV-10 is the estimated future net cash flows from proved reserves discounted at an annual rate of 10 percent before giving effect to income taxes. Standardized Measure is the after-tax estimated future cash flows from proved reserves discount
Slide 37: F&D Costs, Reserve Replacement and Current Value
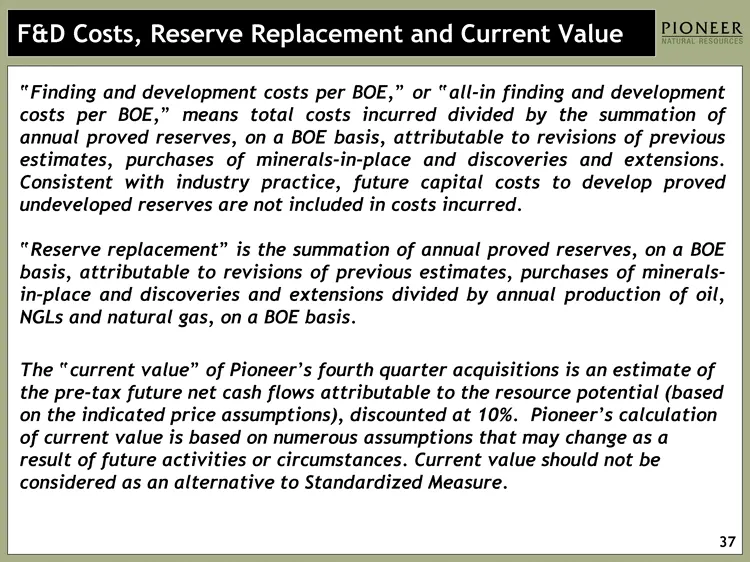
F&D Costs, Reserve Replacement and Current Value "Finding and development costs per BOE," or "all-in finding and development costs per BOE," means total costs incurred divided by the summation of annual proved reserves, on a BOE basis, attributable to revisions of previous estimates, purchases of mi
Slide 38: Certain Reserve Information
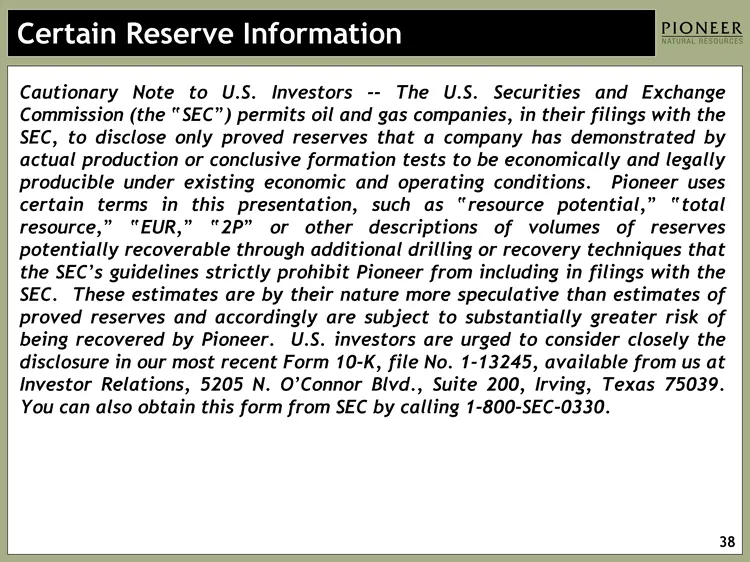
Certain Reserve Information Cautionary Note to U.S. Investors -- The U.S. Securities and Exchange Commission (the "SEC") permits oil and gas companies, in their filings with the SEC, to disclose only proved reserves that a company has demonstrated by actual production or conclusive formation tests t
Source: SEC EDGAR · 8-K filed Feb 26, 2008
More decks from Pioneer Natural Resources Co
 Merger or Acquisition (October 2023)15 slides · Oct 11, 2023
 Q3 2020 Earnings Presentation30 slides · Nov 4, 2020
 Merger or Acquisition (October 2020)18 slides · Oct 20, 2020
 IPAA Oil & Gas Investment Symposium 201846 slides · Apr 9, 2018
 Investor Presentation (January 2014)80 slides · Jan 6, 2014
 Q4 2012 Earnings Presentation48 slides · Feb 13, 2013