EP Energy — Barclays CEO Energy-Power Conference 2015
23 slides from EP Energy's conference presentation, Sep 8, 2015
Slide 1: Barclays CEO Energy-Power Conference
Barclays CEO Energy-Power Conference Brent Smolik Chairman, President and Chief Executive Officer EP Energy Corporation September 9, 2015
Slide 2: Cautionary Statement Regarding Forward-Looking Statements
Cautionary Statement Regarding Forward-Looking Statements This presentation includes certain forward-looking statements and projections of EP Energy. EP Energy has made every reasonable effort to ensure that the information and assumptions on which these statements and projections are based are curr
Slide 3: EP Energy (NYSE: EPE): Improving execution in all four asset areas
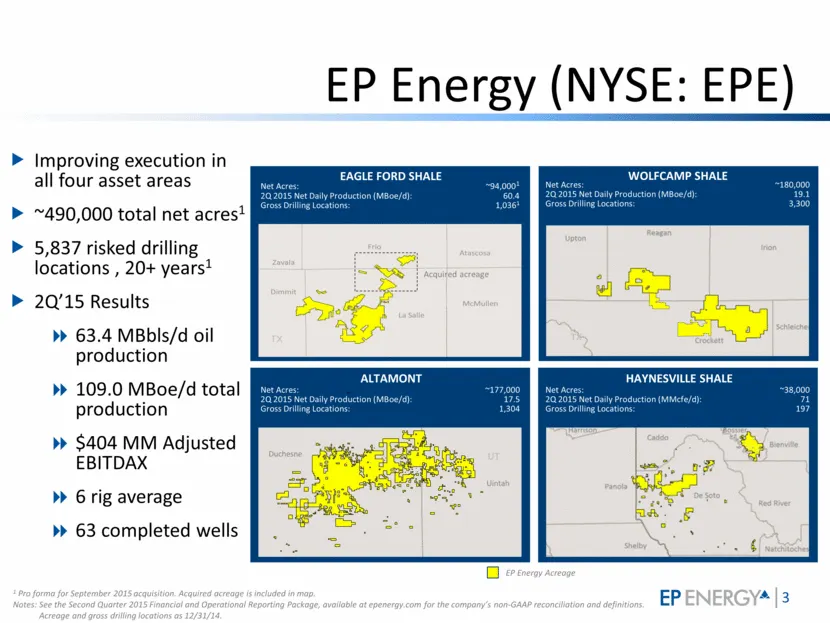
EP Energy (NYSE: EPE) Improving execution in all four asset areas ~490,000 total net acres1 5,837 risked drilling locations , 20+ years1 2Q’15 Results 63.4 MBbls/d oil production 109.0 MBoe/d total production $404 MM Adjusted EBITDAX 6 rig average 63 completed wells 1 Pro forma for September 2015 ac
Slide 4: EPE: Compelling Value
EPE: Compelling Value Improving performance of high-quality assets Reducing capital and operating costs Increasing well-level returns and asset value Improving financial position Proven track record of improving performance through market cycles
Slide 5: High-quality Asset Portfolio
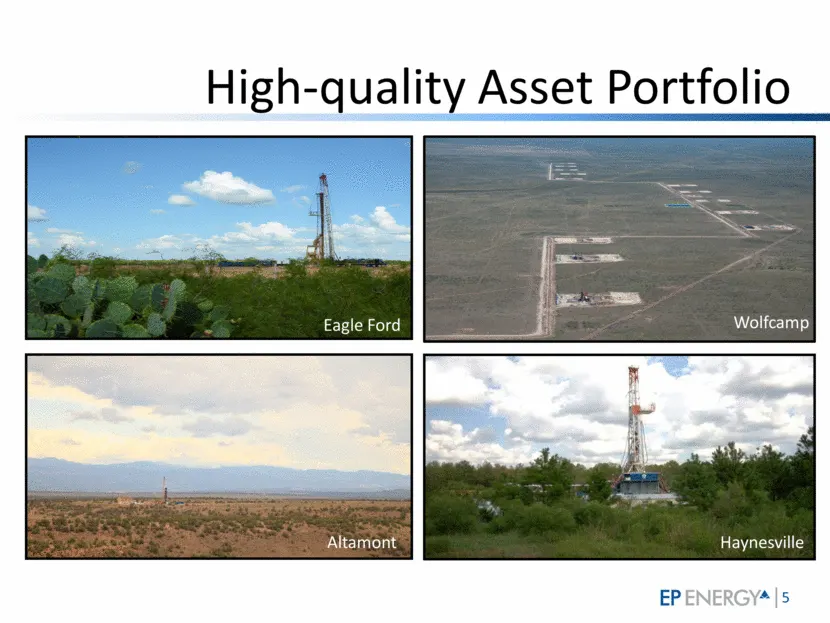
Wolfcamp High-quality Asset Portfolio Altamont Eagle Ford Haynesville
Slide 6: Eagle Ford: Improving Franchise
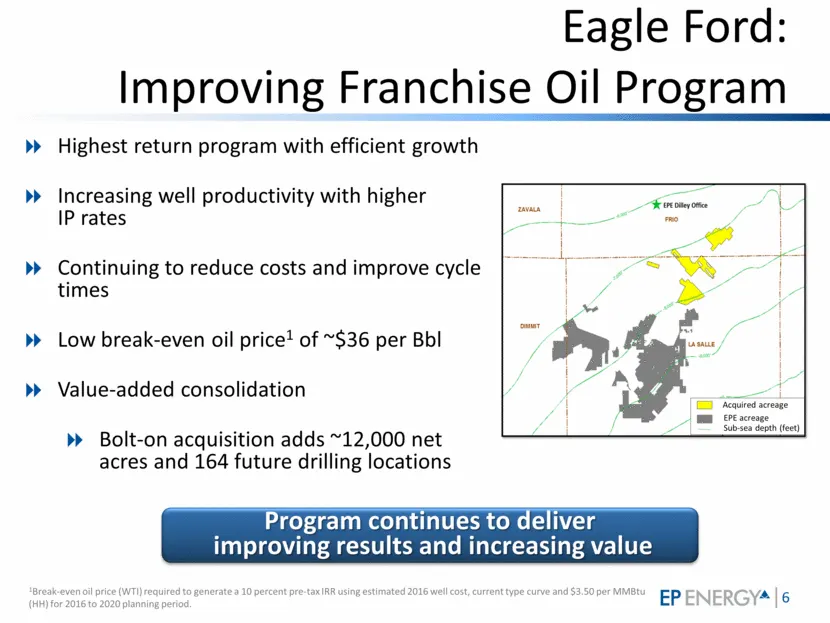
Eagle Ford: Improving Franchise Oil Program Highest return program with efficient growth Increasing well productivity with higher IP rates Continuing to reduce costs and improve cycle times Low break-even oil price1 of ~$36 per Bbl Value-added consolidation Bolt-on acquisition adds ~12,000 net acres
Slide 7: Wolfcamp: Tremendous Resource in S. Midland Basin
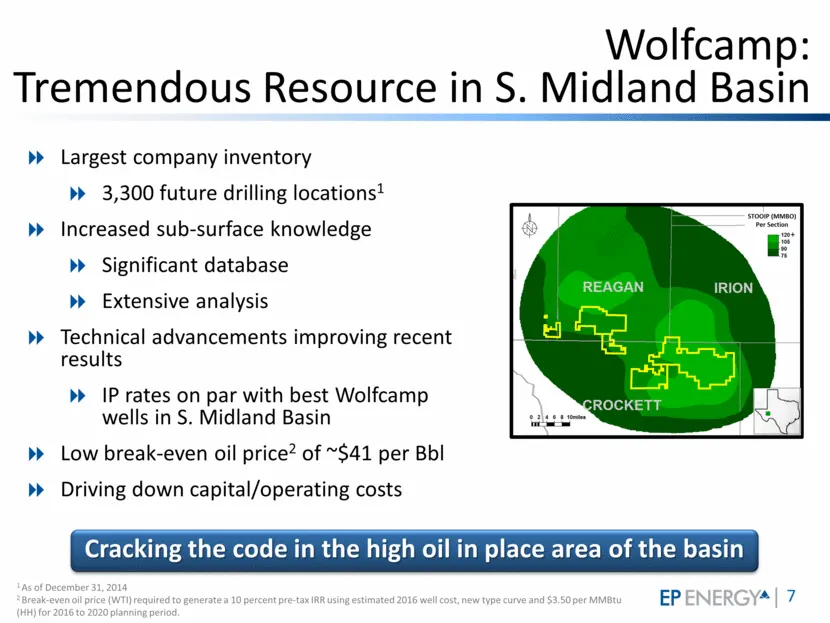
Wolfcamp: Tremendous Resource in S. Midland Basin Largest company inventory 3,300 future drilling locations1 Increased sub-surface knowledge Significant database Extensive analysis Technical advancements improving recent results IP rates on par with best Wolfcamp wells in S. Midland Basin Low break-
Slide 8: Wolfcamp: Keys to Superior Performance
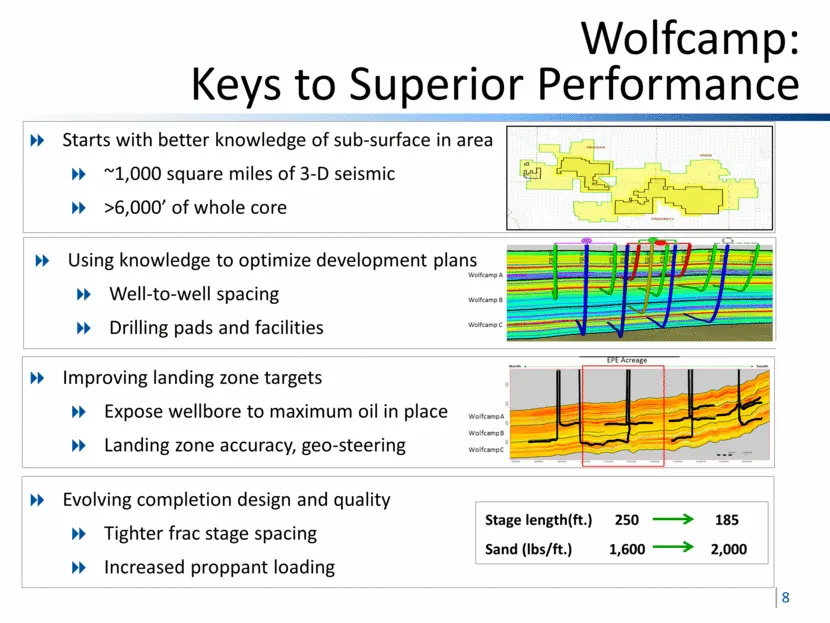
Wolfcamp: Keys to Superior Performance Starts with better knowledge of sub-surface in area ~1,000 square miles of 3-D seismic >6,000’ of whole core Using knowledge to optimize development plans Well-to-well spacing Drilling pads and facilities Improving landing zone targets Expose wellbore to maximu
Slide 9: Wolfcamp: Leader In The S. Midland Basin
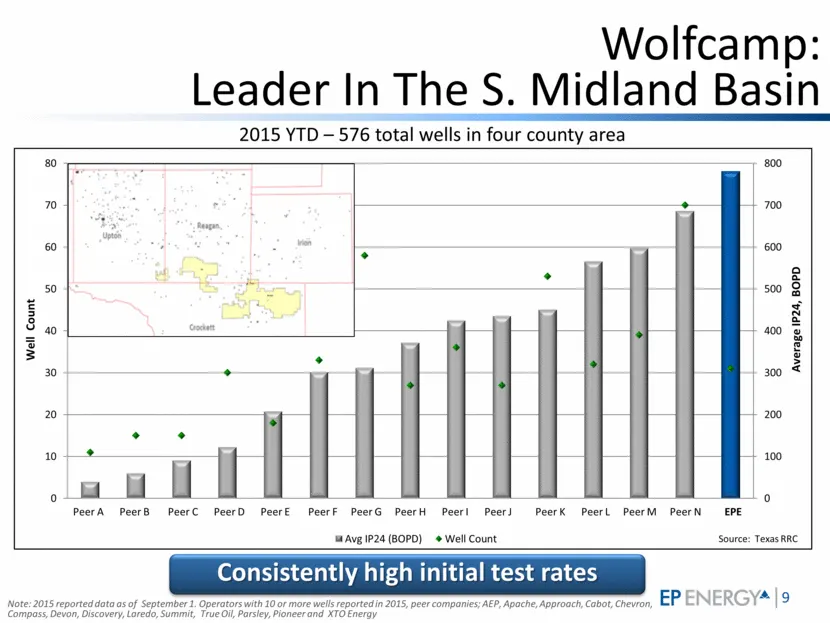
Wolfcamp: Leader In The S. Midland Basin Consistently high initial test rates 2015 YTD – 576 total wells in four county area Note: 2015 reported data as of September 1. Operators with 10 or more wells reported in 2015, peer companies; AEP, Apache, Approach, Cabot, Chevron, Compass, Devon, Discovery,
Slide 10: Wolfcamp: New Type Curve
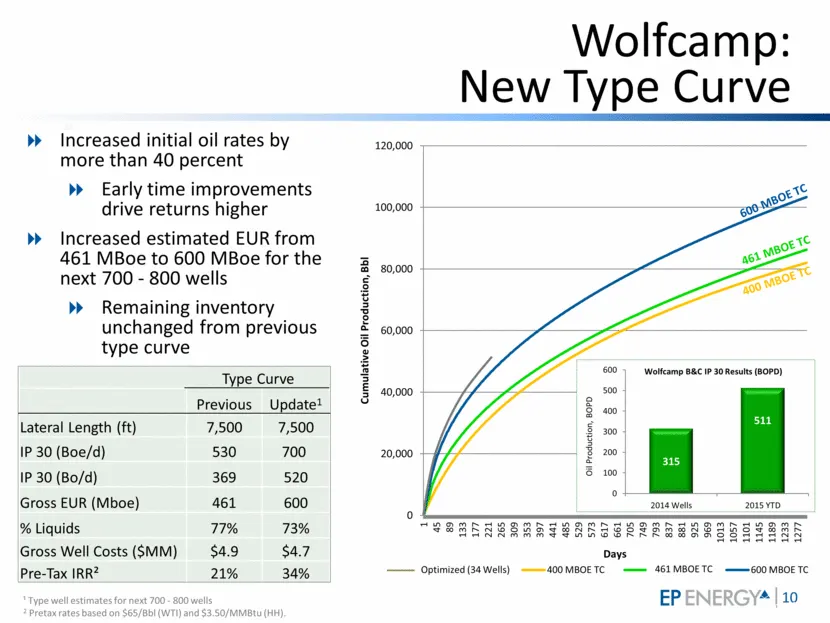
Wolfcamp: New Type Curve 23 Increased initial oil rates by more than 40 percent Early time improvements drive returns higher Increased estimated EUR from 461 MBoe to 600 MBoe for the next 700 - 800 wells Remaining inventory unchanged from previous type curve Type Curve Previous Update1 Lateral Lengt
Slide 11: Altamont: Best Acreage In The Basin
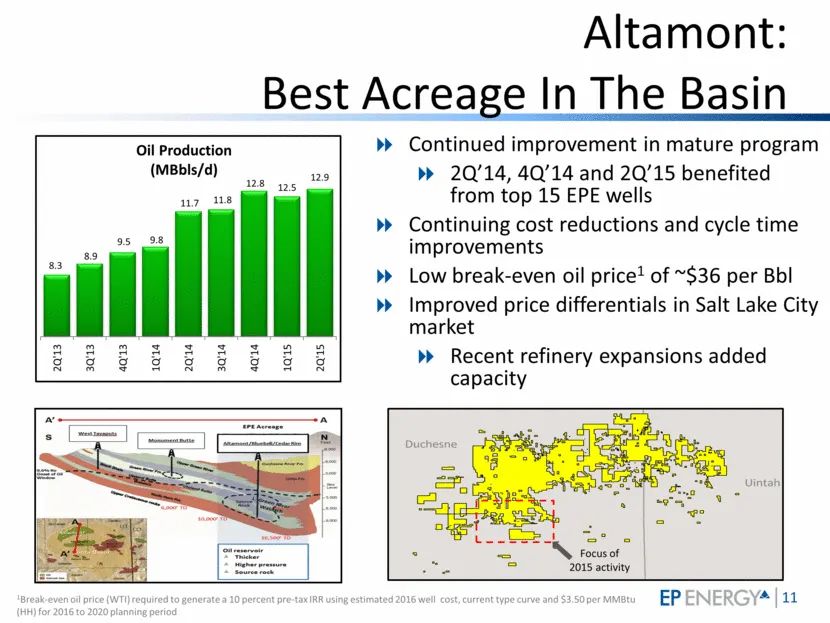
Altamont: Best Acreage In The Basin Continued improvement in mature program 2Q’14, 4Q’14 and 2Q’15 benefited from top 15 EPE wells Continuing cost reductions and cycle time improvements Low break-even oil price1 of ~$36 per Bbl Improved price differentials in Salt Lake City market Recent refinery ex
Slide 12: Haynesville: New Techniques Enhancing Returns
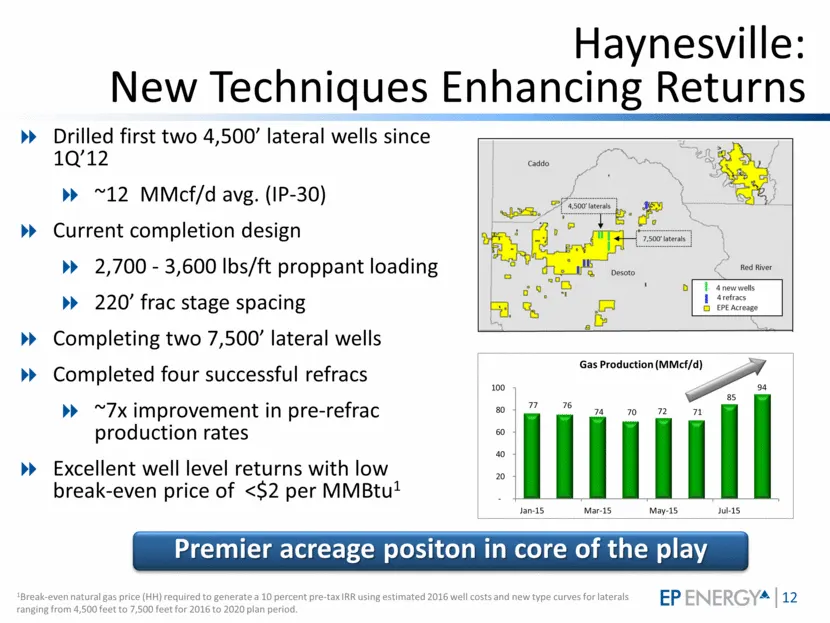
Haynesville: New Techniques Enhancing Returns Drilled first two 4,500’ lateral wells since 1Q’12 ~12 MMcf/d avg. (IP-30) Current completion design 2,700 - 3,600 lbs/ft proppant loading 220’ frac stage spacing Completing two 7,500’ lateral wells Completed four successful refracs ~7x improvement in pr
Slide 13: Improving Cost and Efficiency
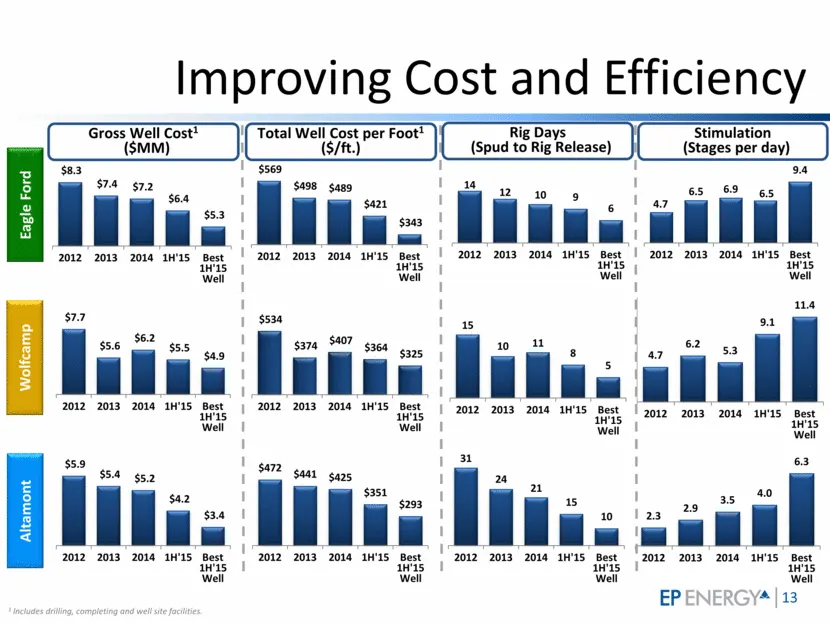
Improving Cost and Efficiency 1 Includes drilling, completing and well site facilities. Eagle Ford Altamont Wolfcamp Gross Well Cost1 ($MM) Rig Days (Spud to Rig Release) Stimulation (Stages per day) Total Well Cost per Foot1 ($/ft.) $8.3 $7.4 $7.2 $6.4 $5.3 2012 2013 2014 1H'15 Best 1H'15 Well $5.9
Slide 14: Continuing To Improve Low Cost Operations
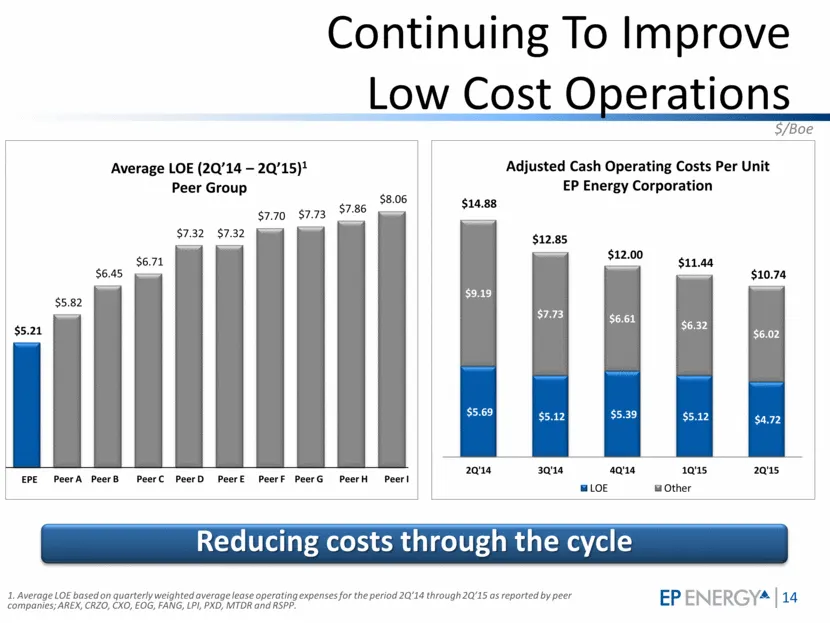
Continuing To Improve Low Cost Operations Average LOE (2Q’14 – 2Q’15)1 Peer Group 1. Average LOE based on quarterly weighted average lease operating expenses for the period 2Q’14 through 2Q’15 as reported by peer companies; AREX, CRZO, CXO, EOG, FANG, LPI, PXD, MTDR and RSPP. Peer A EPE Peer I Peer
Slide 15: Strong Well Economics
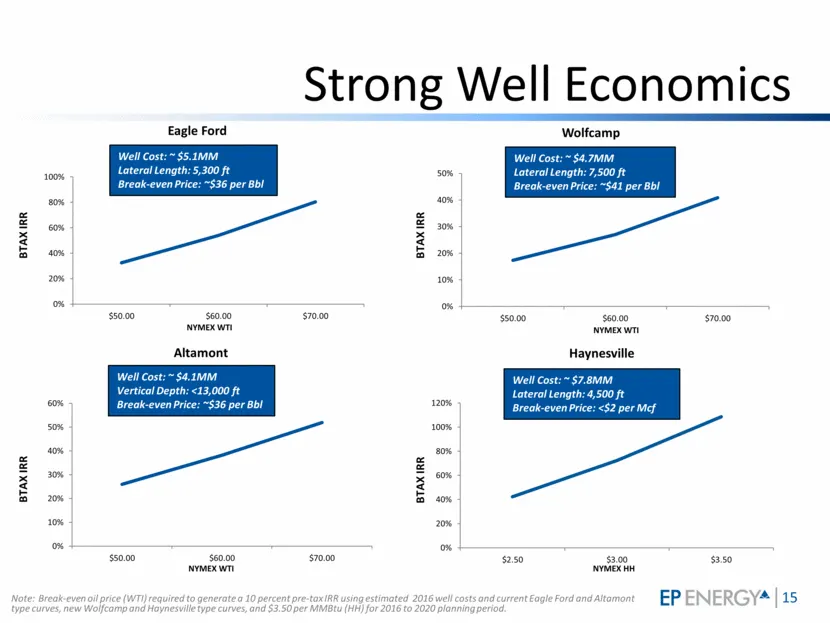
Strong Well Economics Eagle Ford Wolfcamp Altamont Well Cost: ~ $5.1MM Lateral Length: 5,300 ft Break-even Price: ~$36 per Bbl Well Cost: ~ $4.7MM Lateral Length: 7,500 ft Break-even Price: ~$41 per Bbl Well Cost: ~ $4.1MM Vertical Depth: <13,000 ft Break-even Price: ~$36 per Bbl NYMEX WTI NYMEX WTI
Slide 16: Solid Multi-year Hedge Program
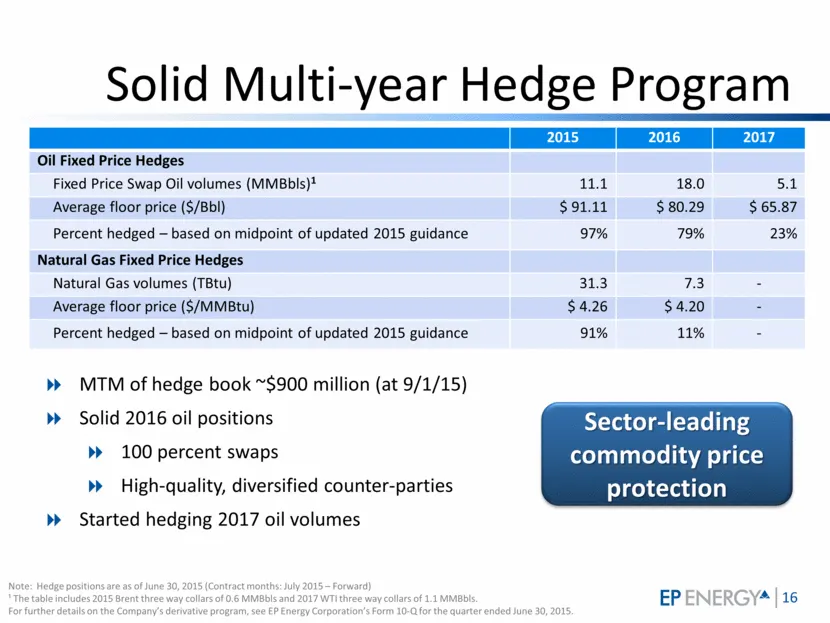
Solid Multi-year Hedge Program 2015 2016 2017 Oil Fixed Price Hedges Fixed Price Swap Oil volumes (MMBbls)1 11.1 18.0 5.1 Average floor price ($/Bbl) $ 91.11 $ 80.29 $ 65.87 Percent hedged – based on midpoint of updated 2015 guidance 97% 79% 23% Natural Gas Fixed Price Hedges Natural Gas volumes (TB
Slide 17: Improving Financial Position
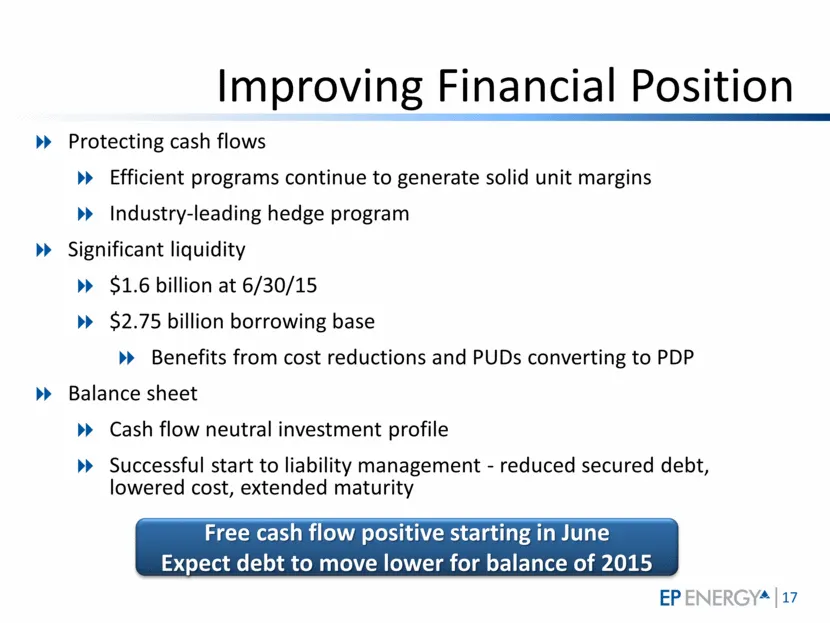
Improving Financial Position Protecting cash flows Efficient programs continue to generate solid unit margins Industry-leading hedge program Significant liquidity $1.6 billion at 6/30/15 $2.75 billion borrowing base Benefits from cost reductions and PUDs converting to PDP Balance sheet Cash flow neu
Slide 18: Superior Performance
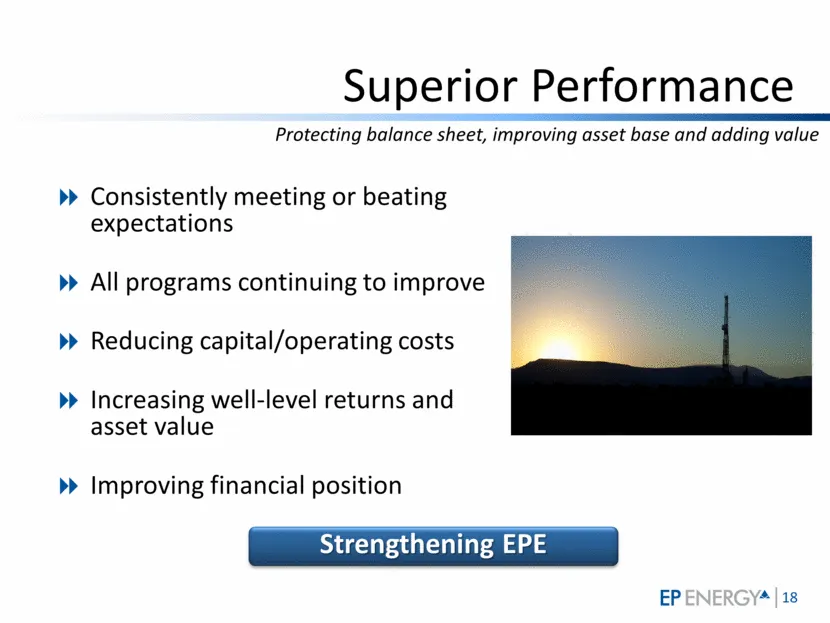
Superior Performance Consistently meeting or beating expectations All programs continuing to improve Reducing capital/operating costs Increasing well-level returns and asset value Improving financial position Strengthening EPE Protecting balance sheet, improving asset base and adding value
Slide 19: Barclays CEO Energy-Power Conference
Barclays CEO Energy-Power Conference Brent Smolik Chairman, President and Chief Executive Officer EP Energy Corporation September 9, 2015
Slide 20: Appendix
EP ENERGY* Appendix
Slide 21: EPE Type Well Economics
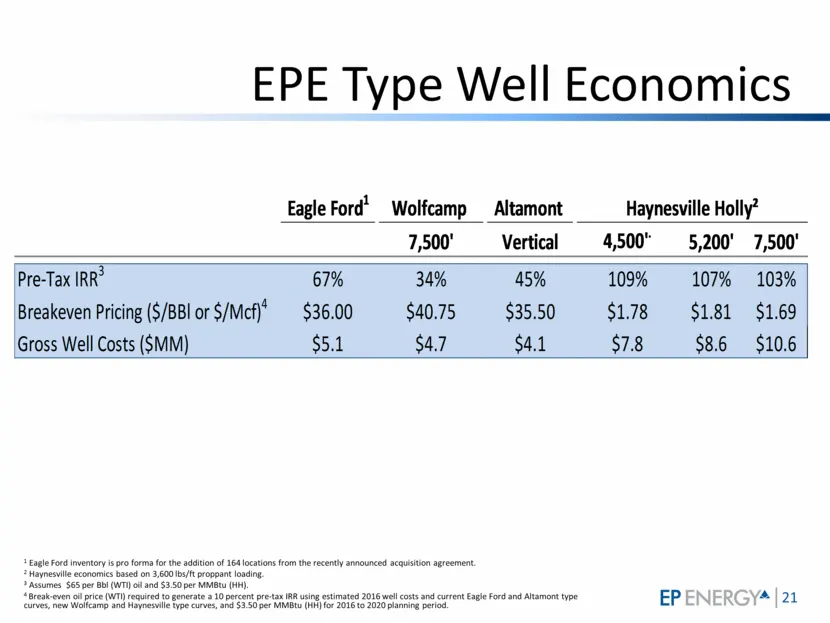
EPE Type Well Economics 1 Eagle Ford inventory is pro forma for the addition of 164 locations from the recently announced acquisition agreement. 2 Haynesville economics based on 3,600 lbs/ft proppant loading. 3 Assumes $65 per Bbl (WTI) oil and $3.50 per MMBtu (HH). 4 Break-even oil price (WTI) requ
Slide 22: Improved 2015 Outlook
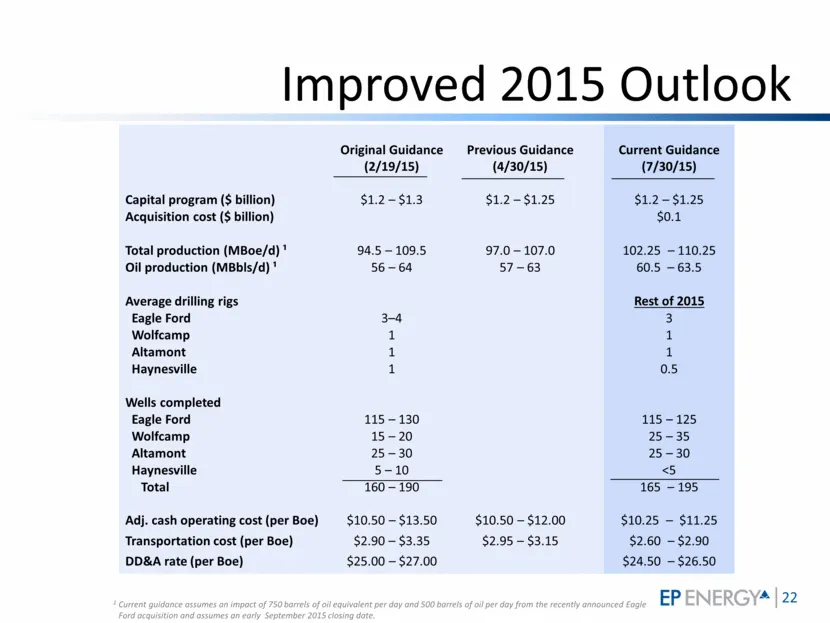
Original Guidance (2/19/15) Previous Guidance (4/30/15) Current Guidance (7/30/15) Capital program ($ billion) $1.2 – $1.3 $1.2 – $1.25 $1.2 – $1.25 Acquisition cost ($ billion) $0.1 Total production (MBoe/d) ¹ 94.5 – 109.5 97.0 – 107.0 102.25 – 110.25 Oil production (MBbls/d) ¹ 56 – 64 57 – 63 60.5
Slide 23: Eagle Ford: Adding Production and Inventory
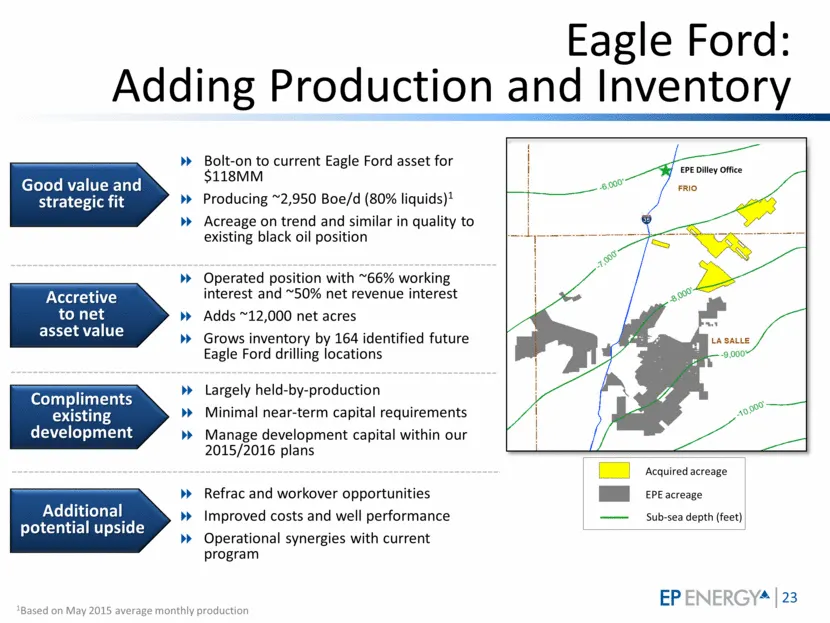
Bolt-on to current Eagle Ford asset for $118MM Producing ~2,950 Boe/d (80% liquids)1 Acreage on trend and similar in quality to existing black oil position Good value and strategic fit Eagle Ford: Adding Production and Inventory Accretive to net asset value Compliments existing development Additiona
Source: SEC EDGAR · 8-K filed Sep 8, 2015
More decks from EP Energy Corp
 Presentation (January 2020)6 slides · Jan 9, 2020
 Investor Presentation (October 2019)83 slides · Oct 4, 2019
 IPO Roadshow (October 2019)5 slides · Oct 4, 2019
 Investor Presentation (September 2018)11 slides · Sep 5, 2018
 Debt Investor Presentation (May 2018)25 slides · May 17, 2018
 Credit Suisse Energy Summit 201724 slides · Feb 14, 2017