Sealed Air — JP Morgan Global High Yield and Leveraged Finance Conference 2013
26 slides from Sealed Air's conference presentation, Feb 25, 2013
Slide 1: Sealed Air Corporation – JP Morgan Global High Yield and Leveraged Finance Conference
Exhibit 99.1 SEALED AIR CORPORATION JP Morgan Global High Yield and Leveraged Finance Conference February 25, 2013 Carol P. Lowe – Senior Vice President & Chief Financial Officer Tod S. Christie - Treasurer
Slide 2: Safe Harbor and Regulation G Statement
Safe Harbor and Regulation G Statement • This presentation contains “forward-looking statements” within the meaning of the Private Securities Litigation Reform Act of 1995. Forward-looking statements can be identified by such words as “anticipates,” “believes,” “plan,” “assumes,” “could,” “estimates
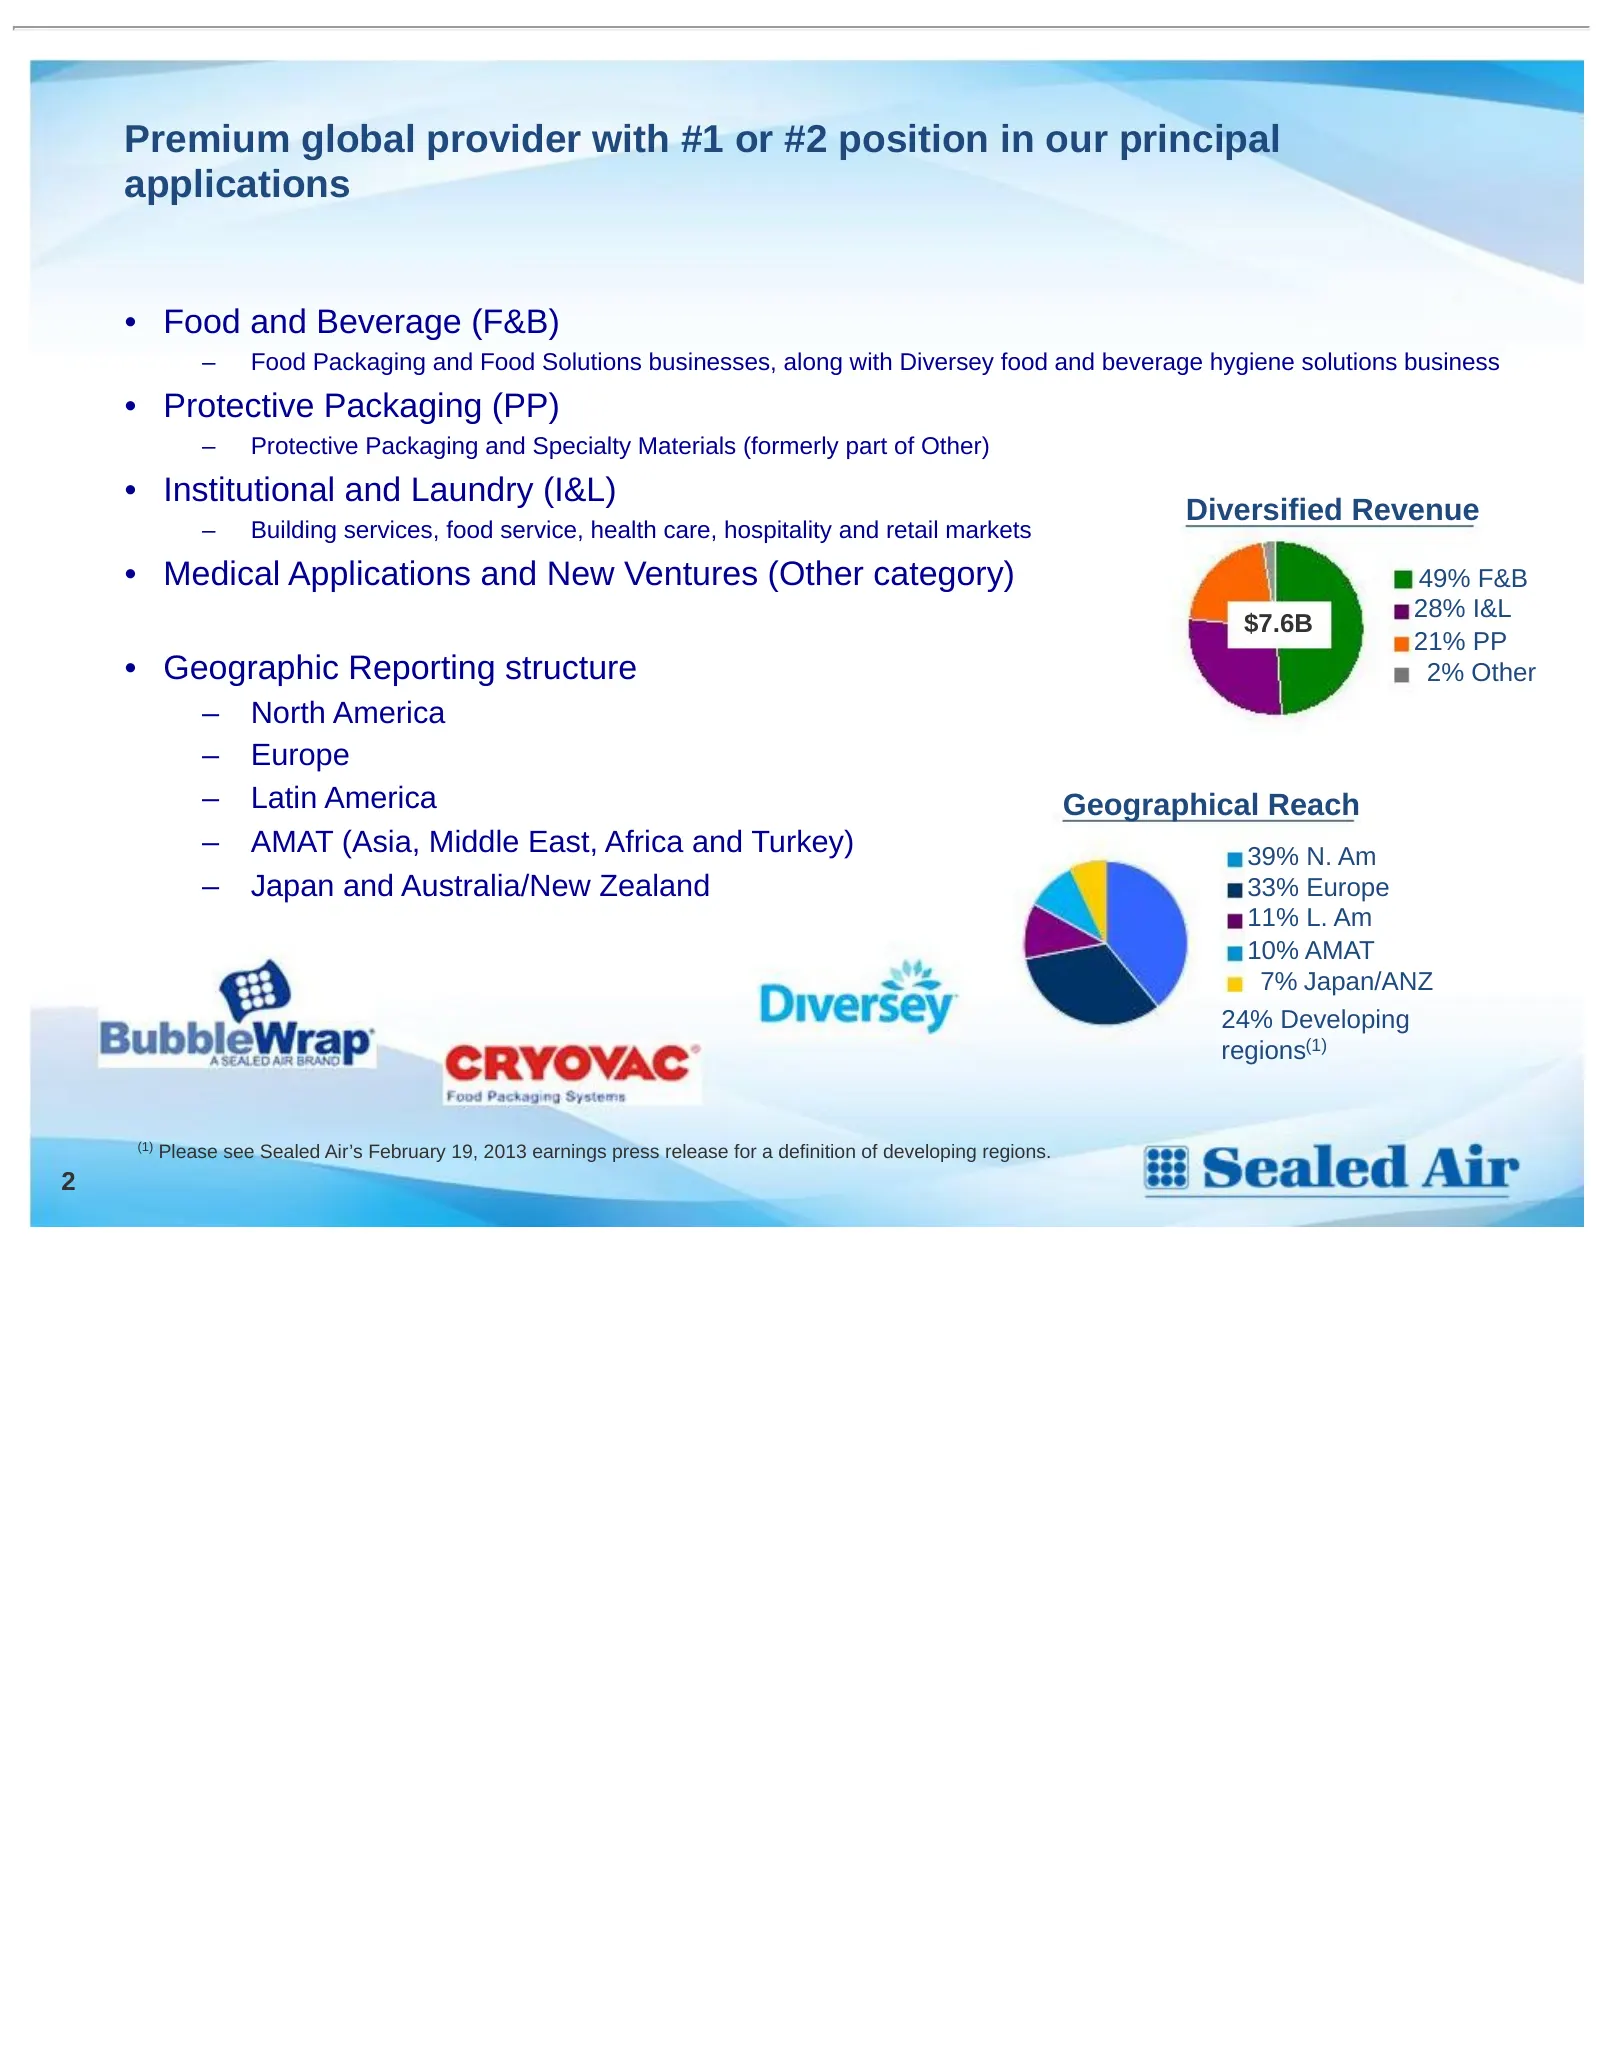
Slide 3: Premium global provider with #1 or #2 position in our principal applications
Premium global provider with #1 or #2 position in our principal applications • Food and Beverage (F&B) – Food Packaging and Food Solutions businesses, along with Diversey food and beverage hygiene solutions business • Protective Packaging (PP) – Protective Packaging and Specialty Materials (formerly
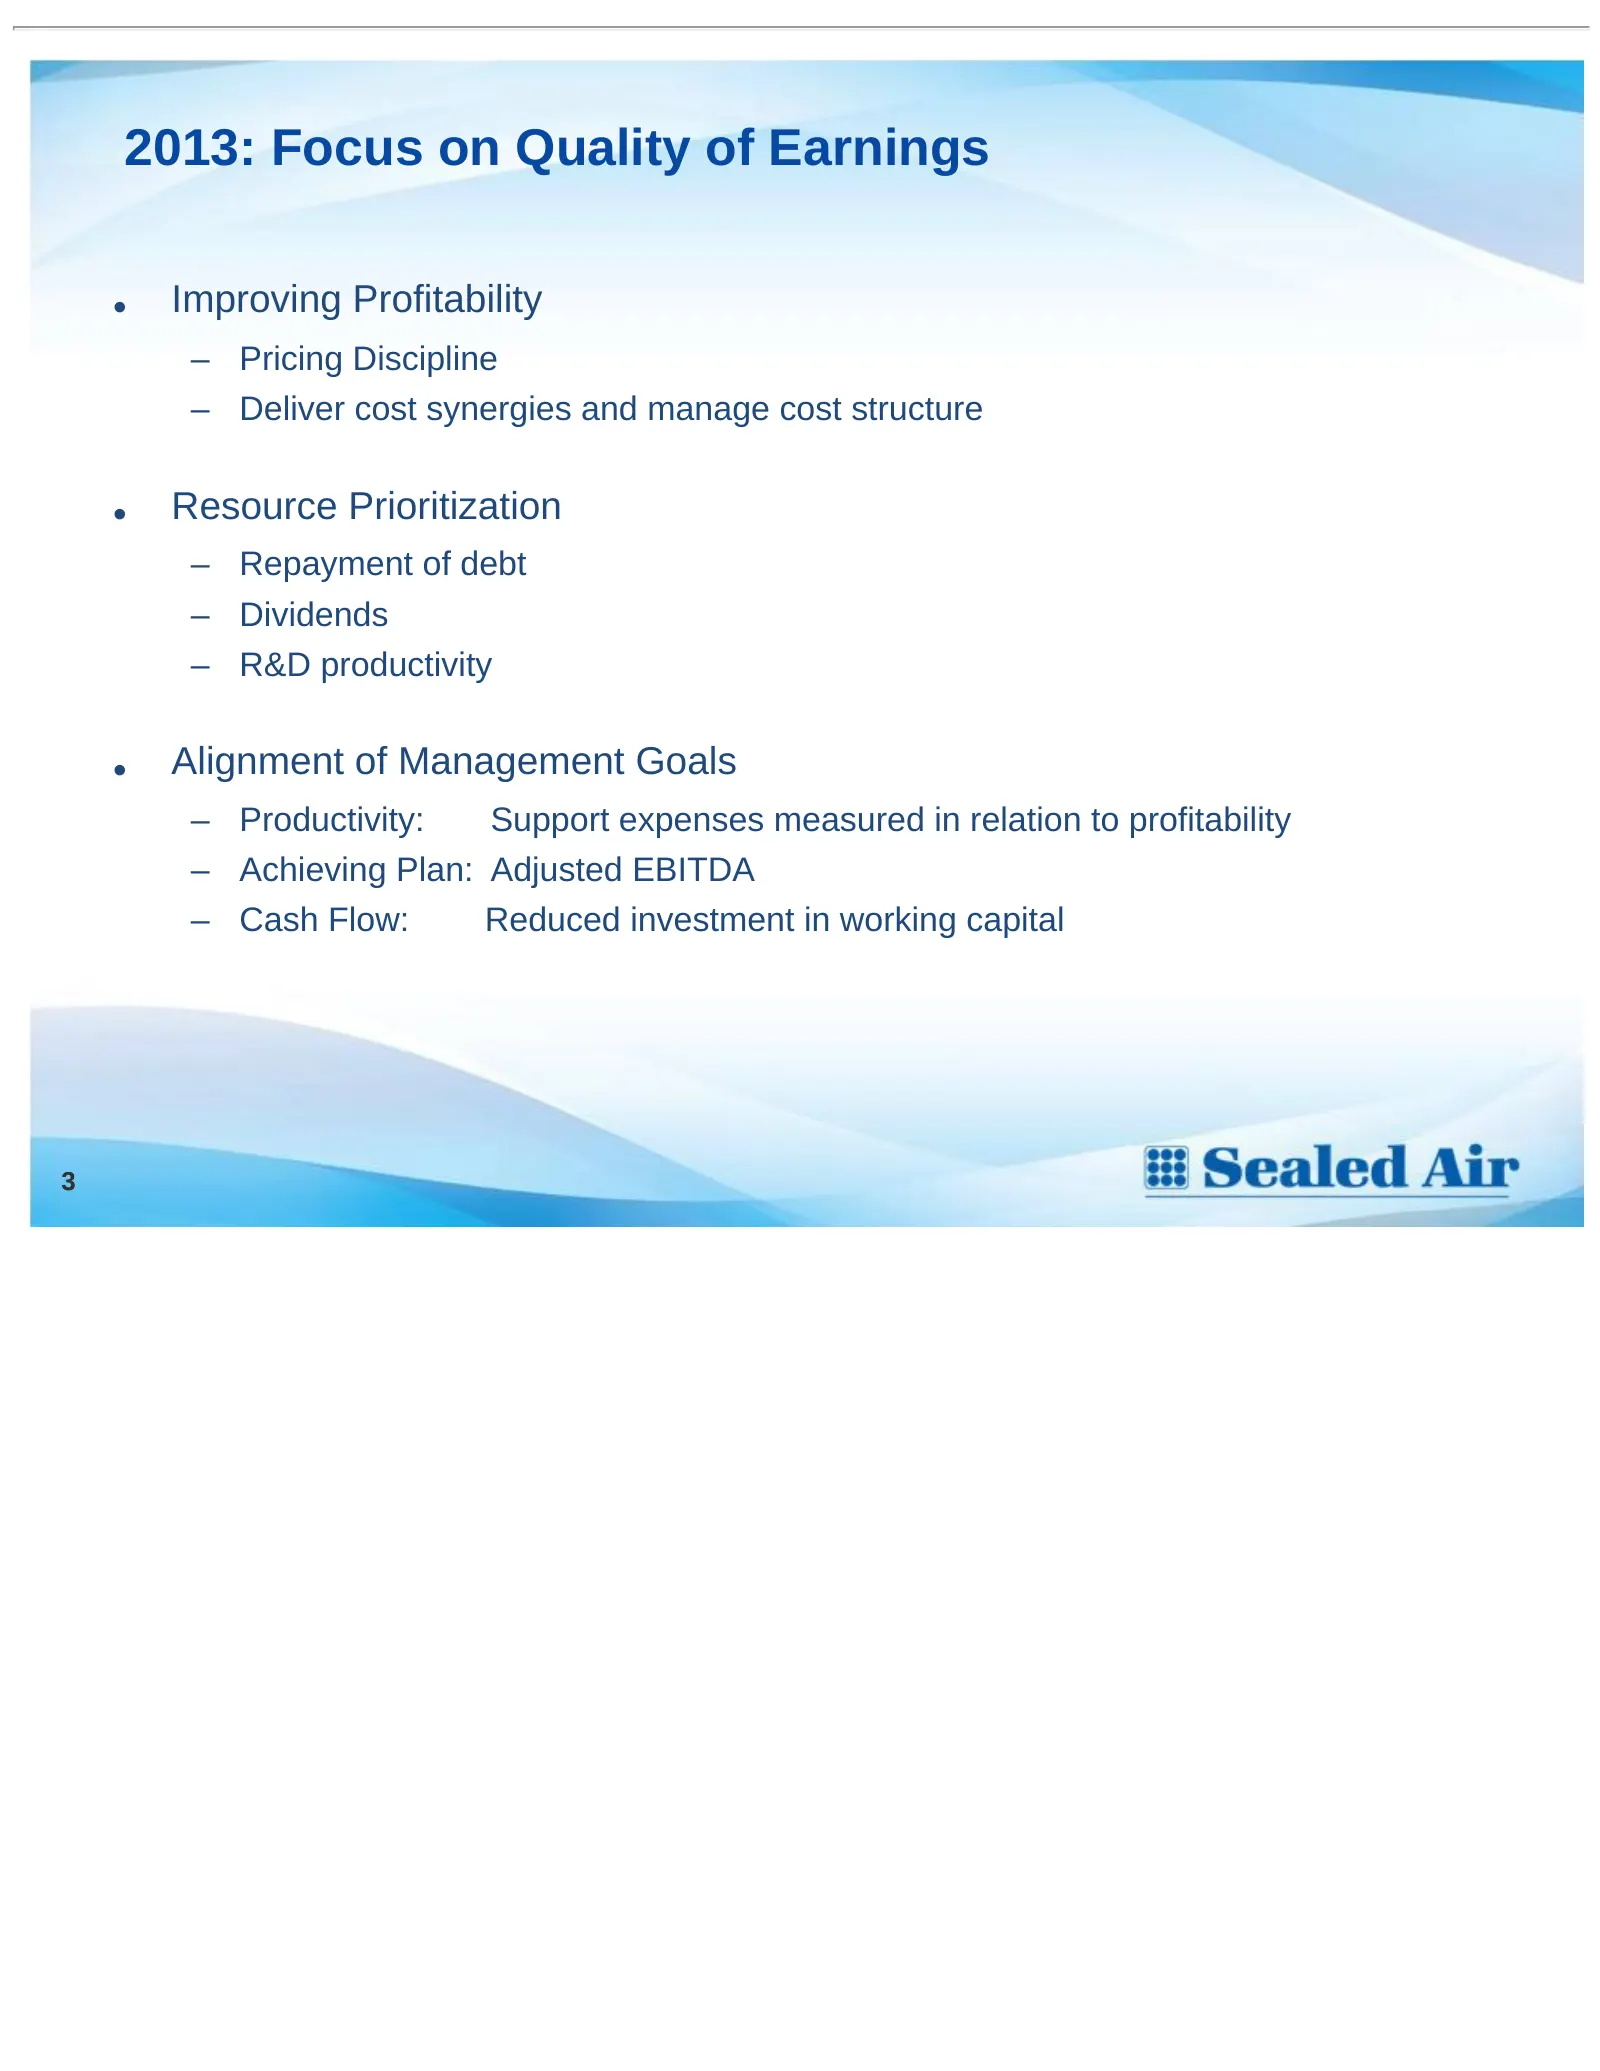
Slide 4: 2013: Focus on Quality of Earnings
2013: Focus on Quality of Earnings • Improving Profitability – Pricing Discipline – Deliver cost synergies and manage cost structure • Resource Prioritization – Repayment of debt – Dividends – R&D productivity • Alignment of Management Goals – Productivity: Support expenses measured in relation to p
Slide 5: Food & Beverage: Value Creation In Operations and Downstream
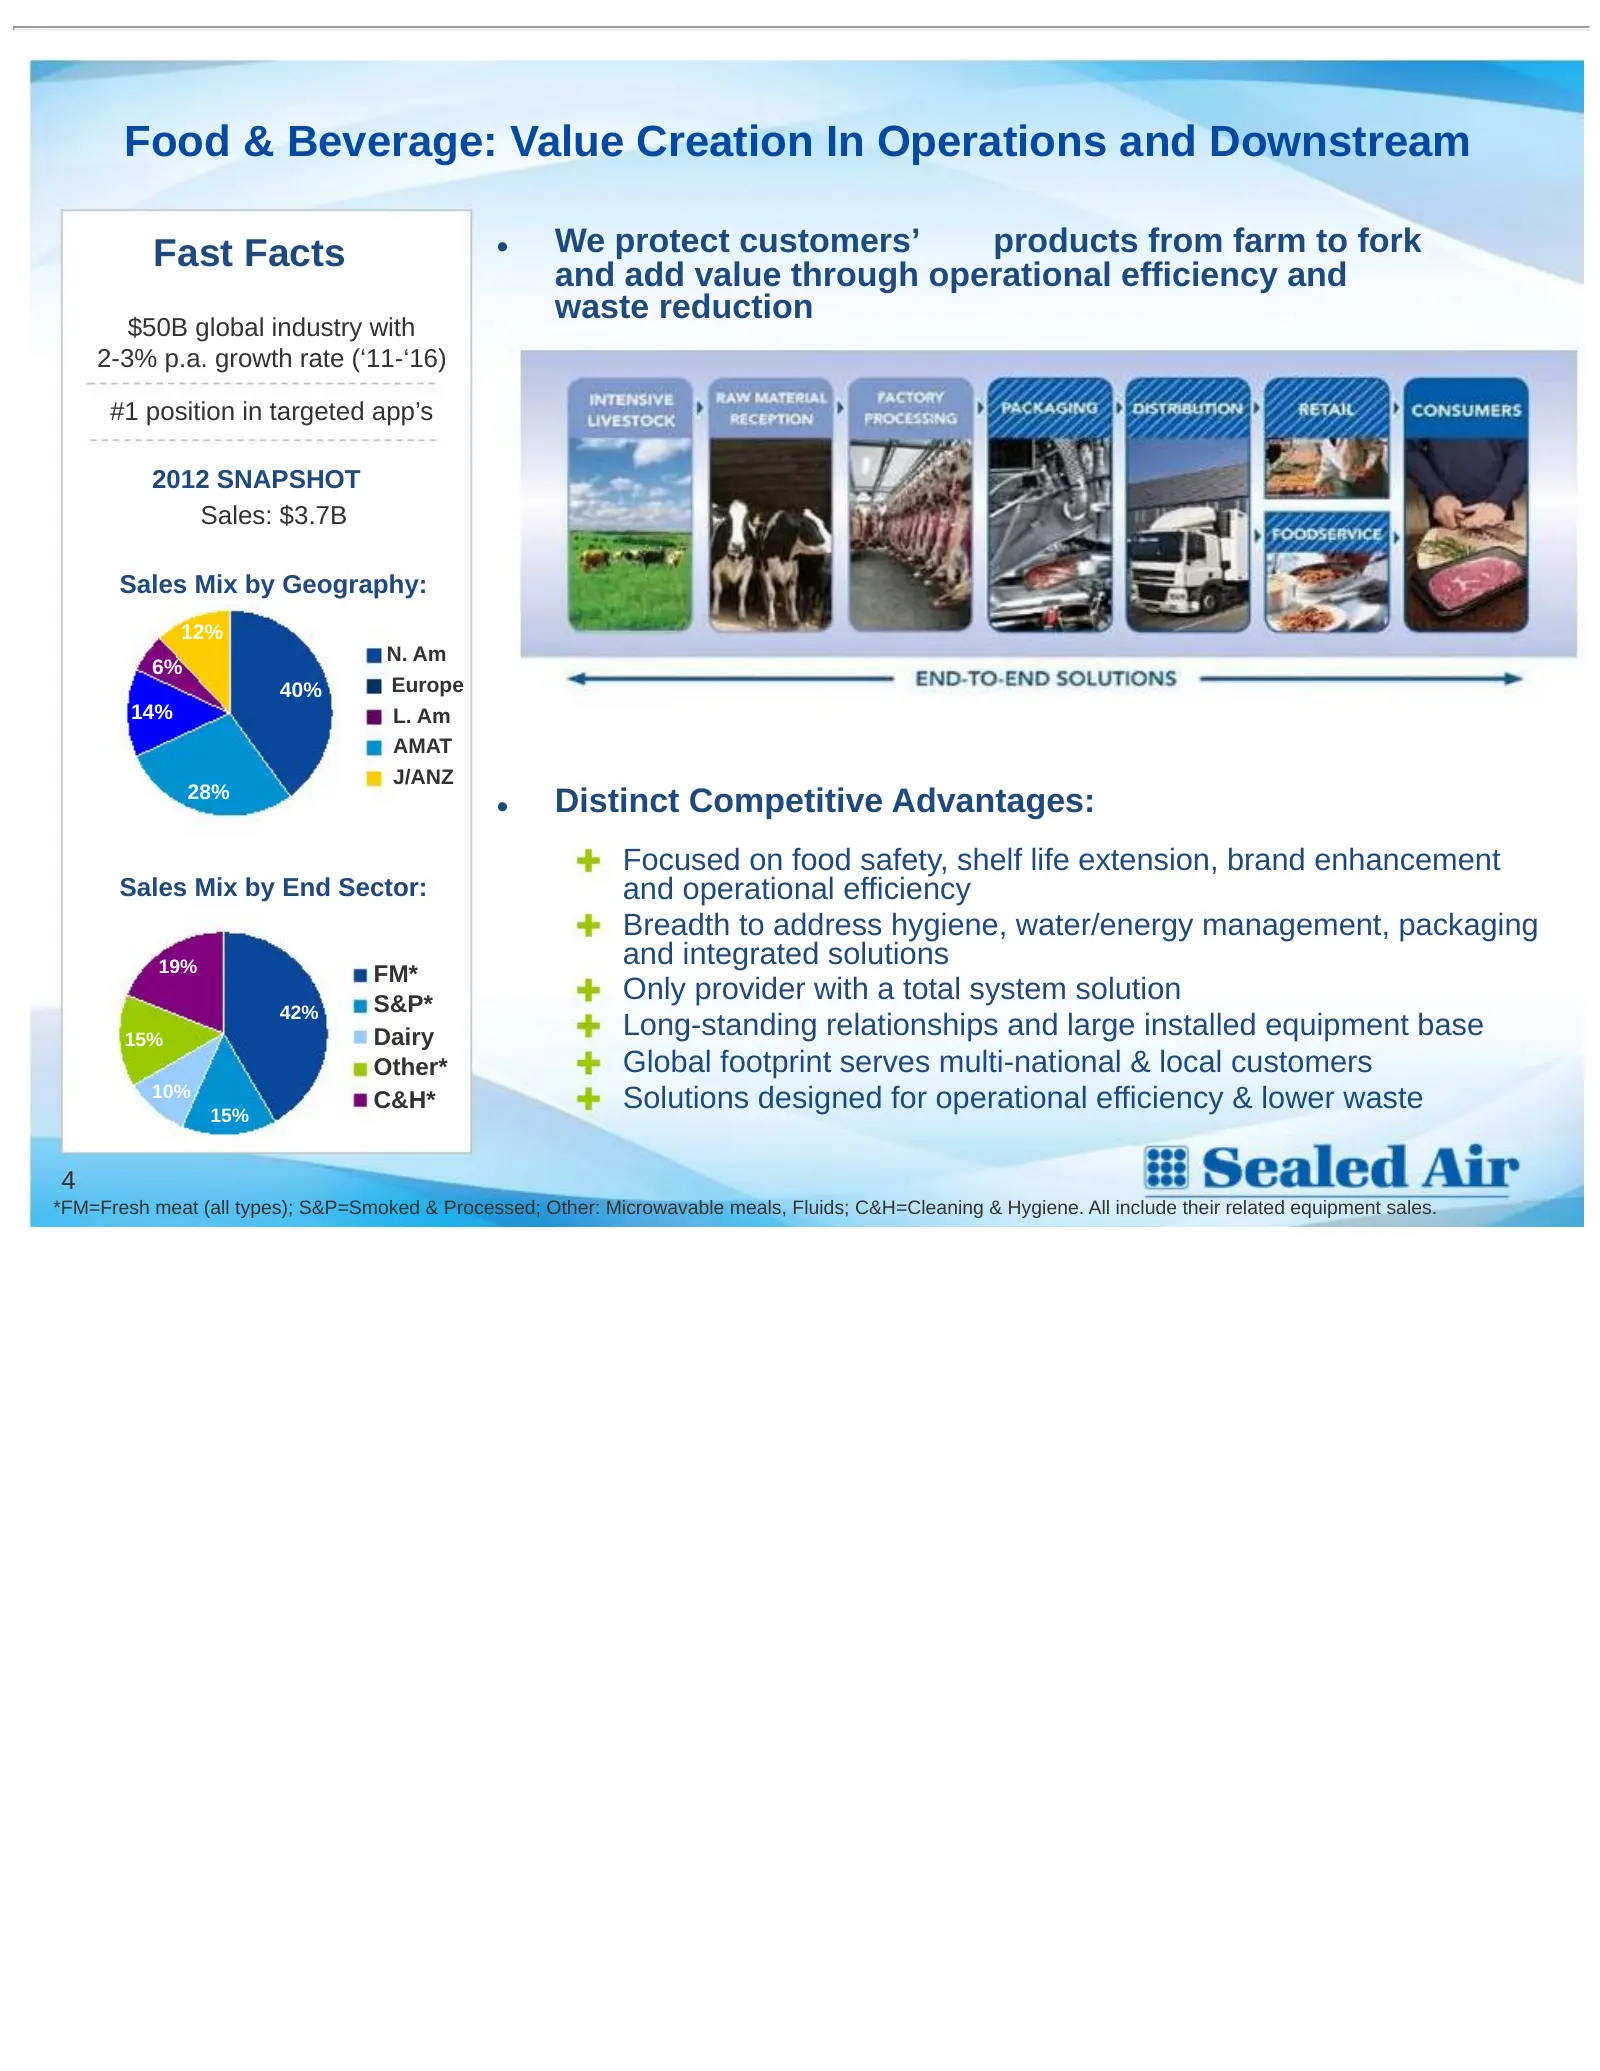
Food & Beverage: Value Creation In Operations and Downstream Fast Facts • We protect customers’ products from farm to fork and add value through operational efficiency and waste reduction $50B global industry with 2-3% p.a. growth rate (‘11-‘16) #1 position in targeted app’s 2012 SNAPSHOT Sales: $3.
Slide 6: Food & Beverage: Achieved Volume and Margin Improvement
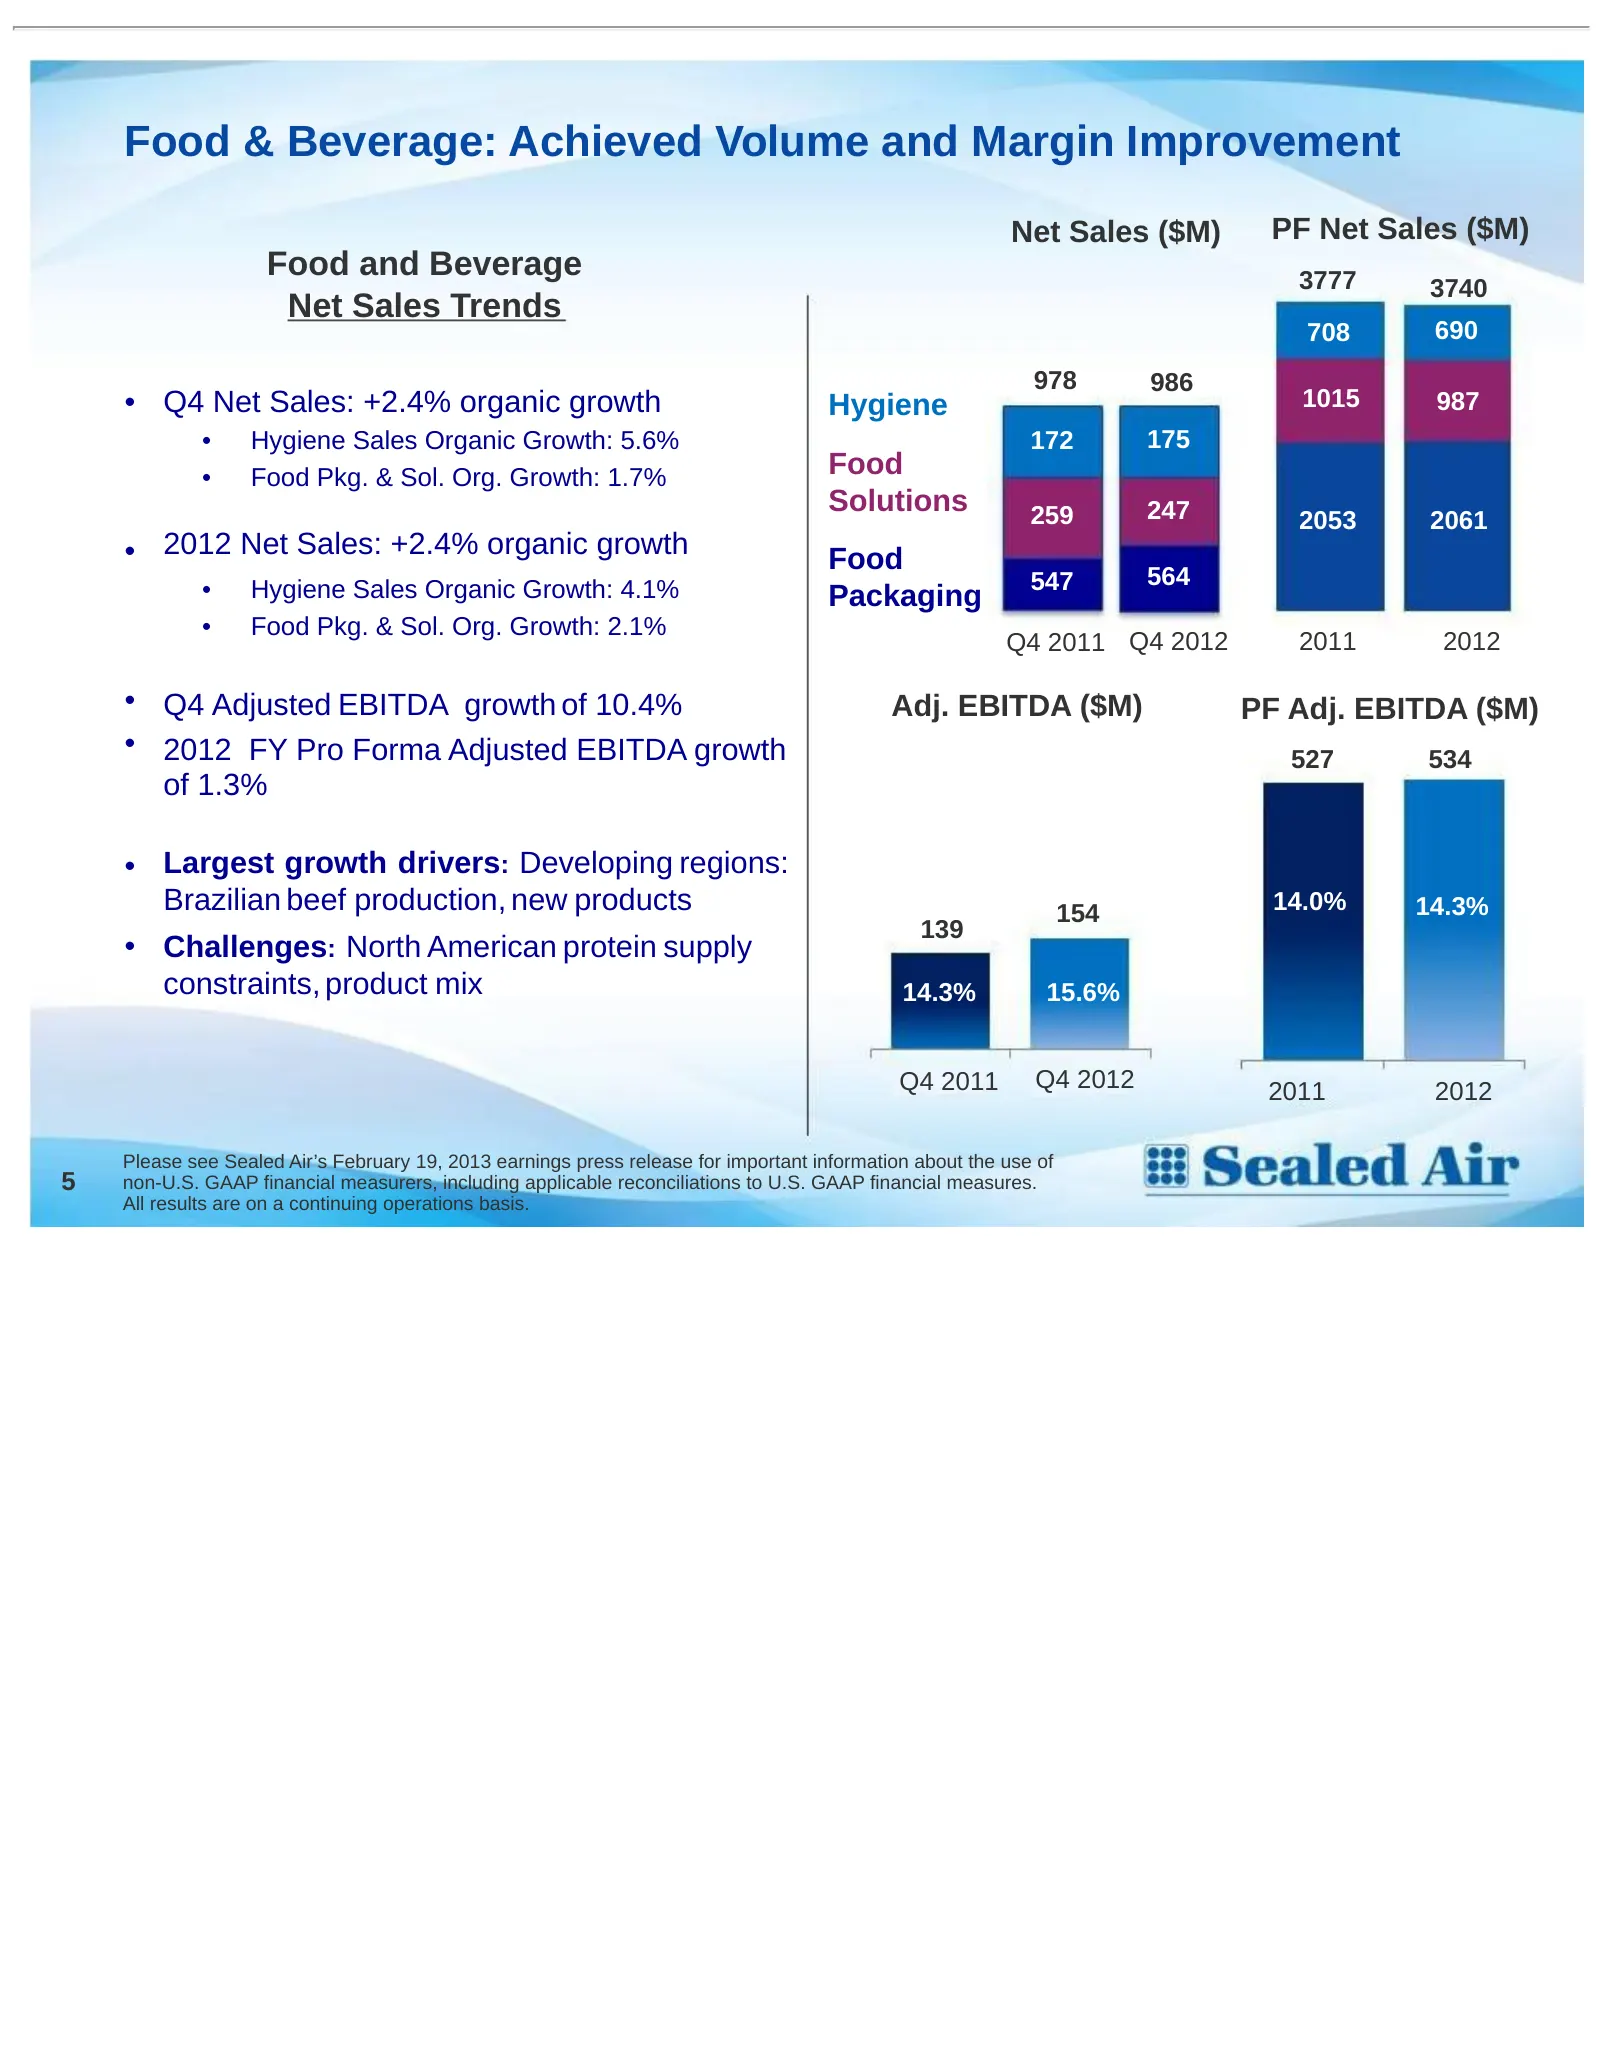
Food & Beverage: Achieved Volume and Margin Improvement Net Sales ($M) PF Net Sales ($M) Food and Beverage 3777 3740 Net Sales Trends 708 690 978 986 • Q4 Net Sales: +2.4% organic growth Hygiene 1015 987 • Hygiene Sales Organic Growth: 5.6% 172 175 • Food Pkg. & Sol. Org. Growth: 1.7% Food Solutions
Slide 7: Institutional & Laundry: Reducing the “Total Cost to Clean”
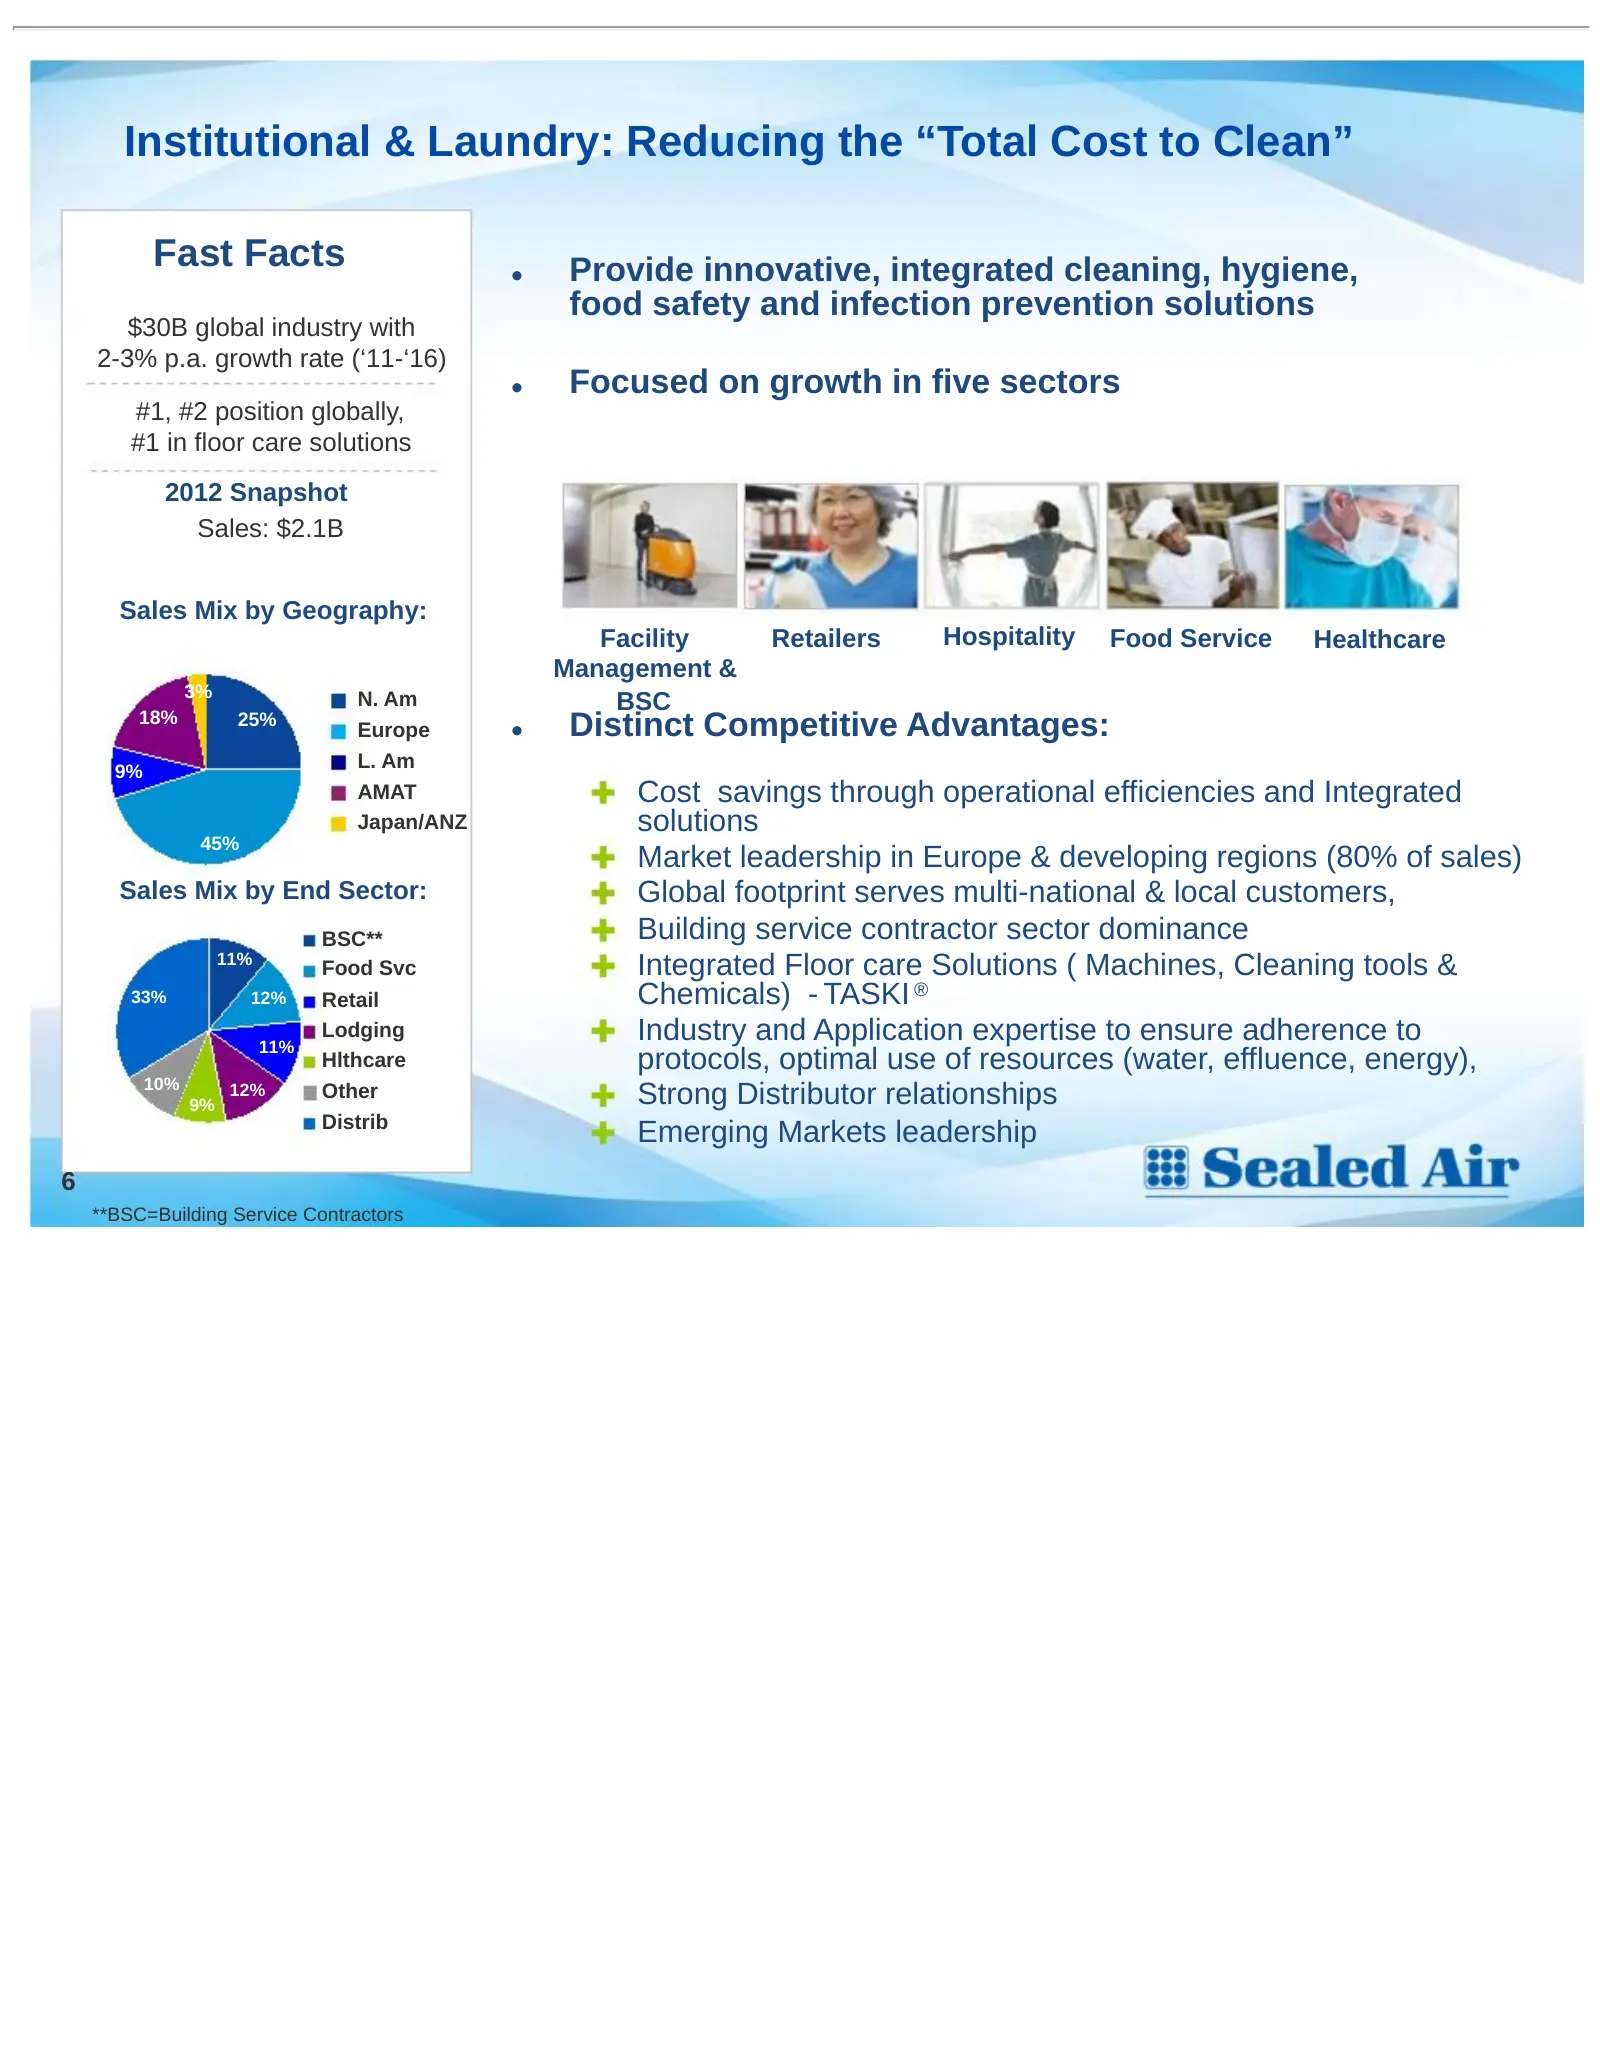
Institutional & Laundry: Reducing the “Total Cost to Clean” Fast Facts Provide innovative, integrated cleaning, hygiene, • food safety and infection prevention solutions $30B global industry with 2-3% p.a. growth rate (‘11-‘16) • Focused on growth in five sectors #1, #2 position globally, #1 in floo
Slide 8: Institutional and Laundry: Adjusted EBITDA and Margin Improvement
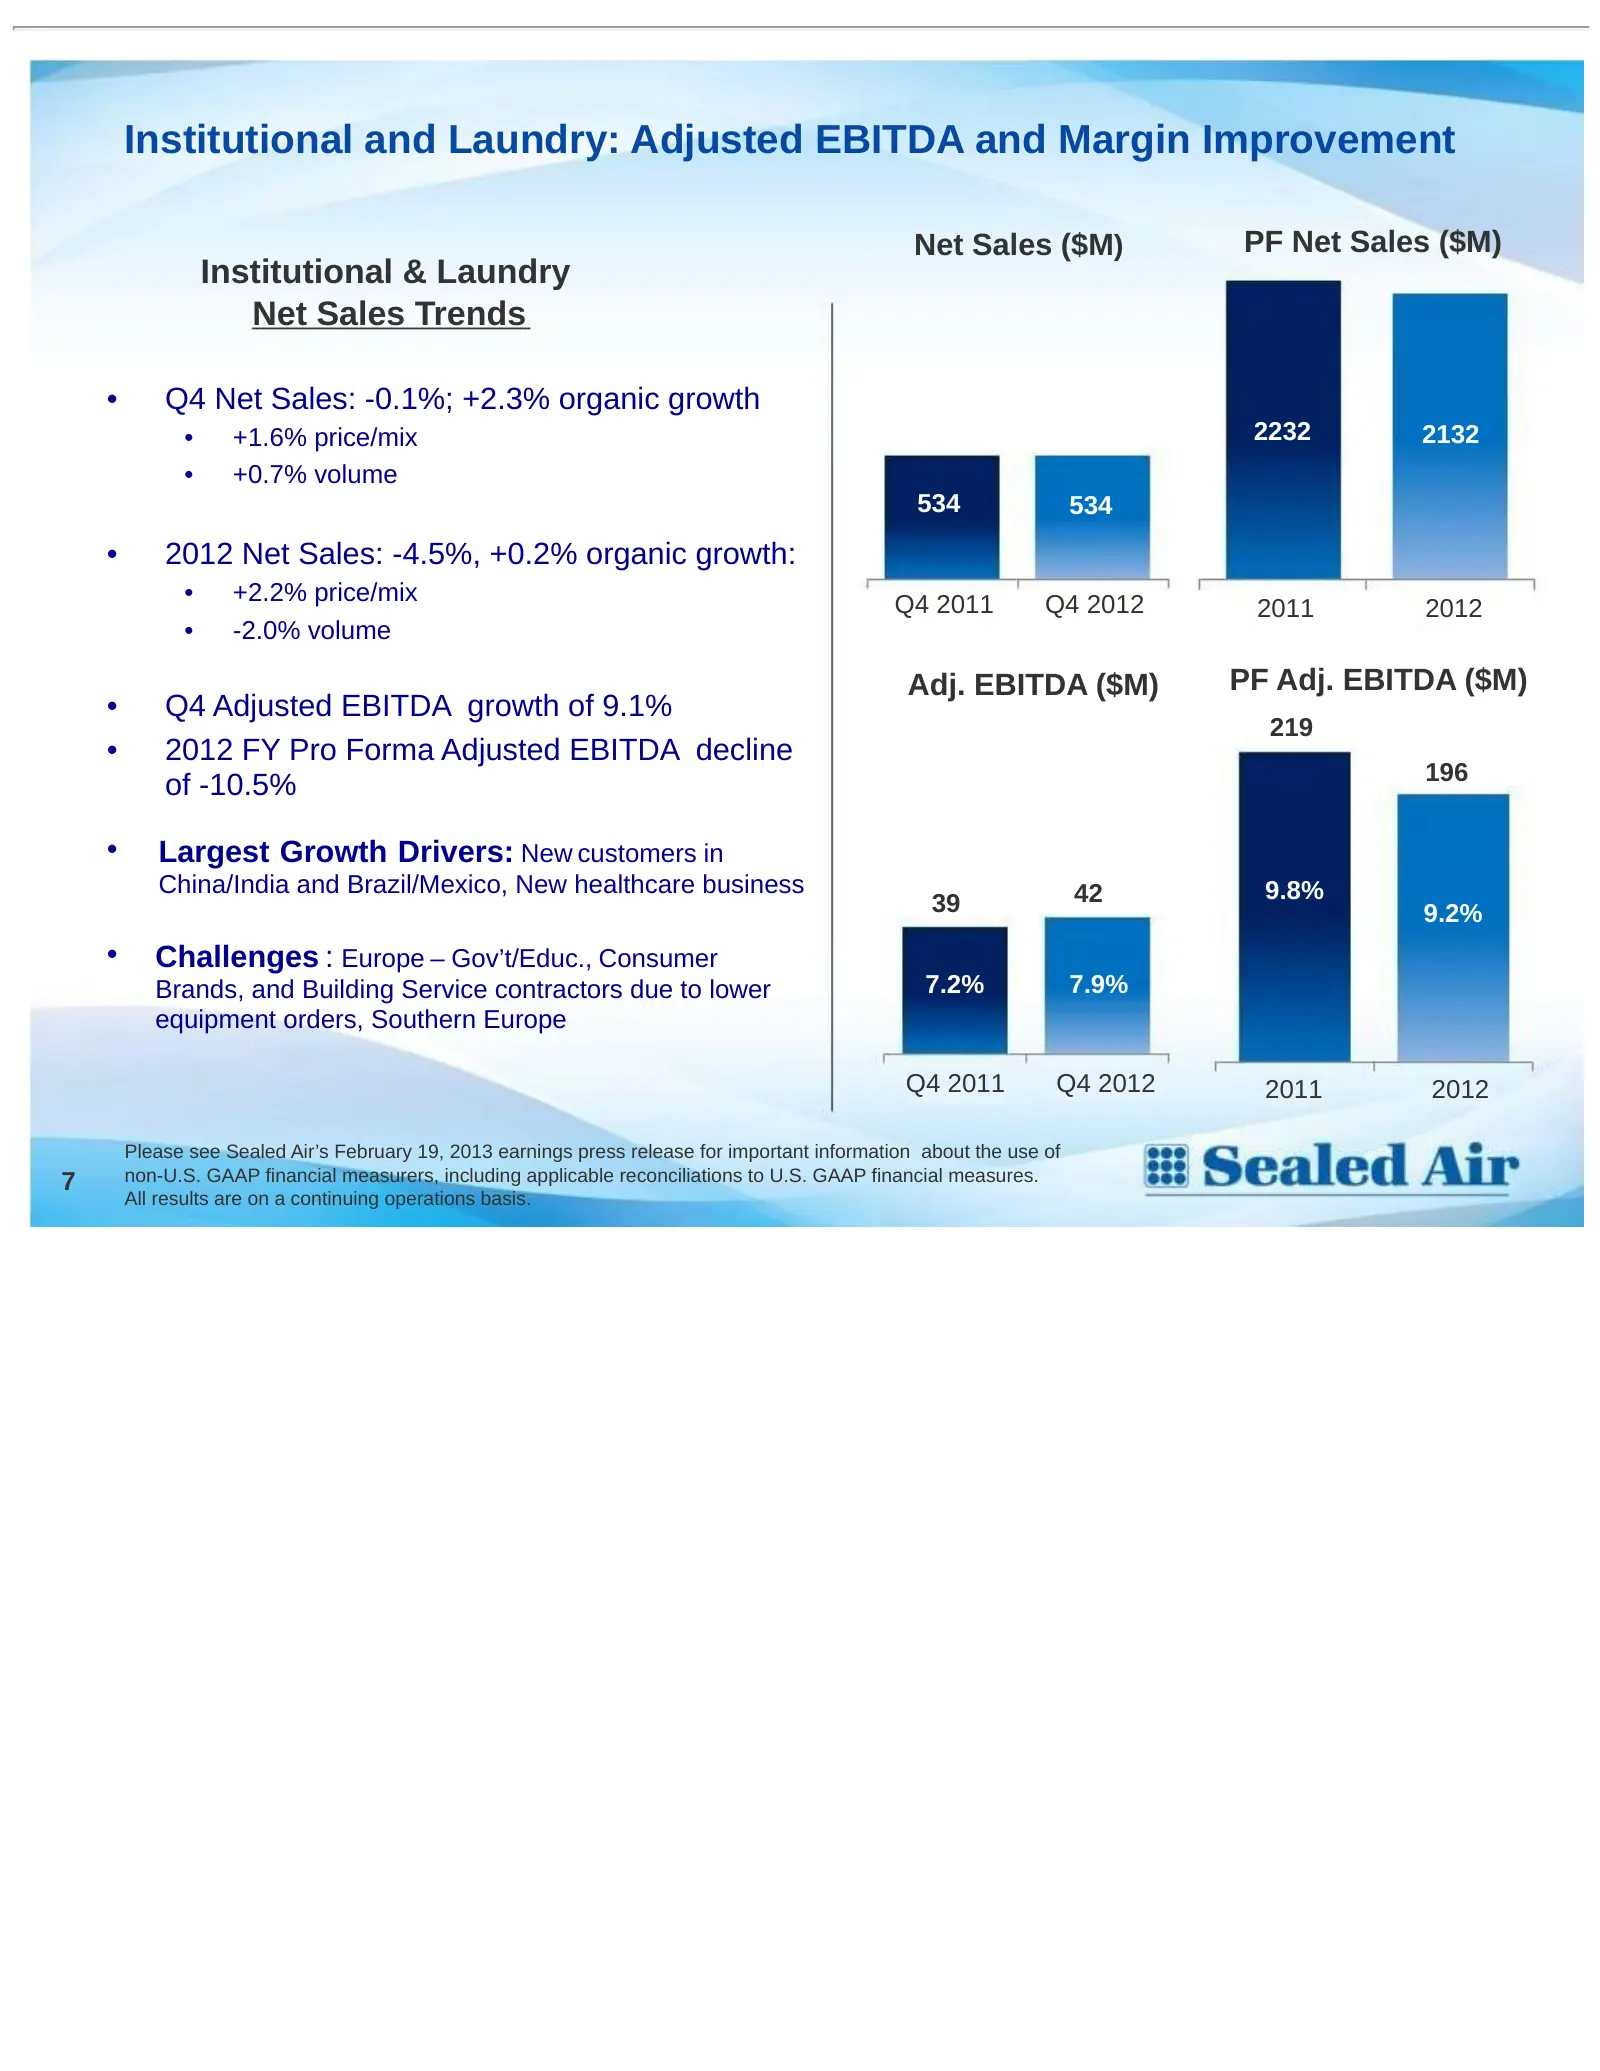
Institutional and Laundry: Adjusted EBITDA and Margin Improvement Net Sales ($M) PF Net Sales ($M) Institutional & Laundry Net Sales Trends • Q4 Net Sales: -0.1%; +2.3% organic growth • +1.6% price/mix 2232 2132 • +0.7% volume 534 534 • 2012 Net Sales: -4.5%, +0.2% organic growth: • +2.2% price/mix
Slide 9: Protective Packaging: Focused on Sustainable & Efficient Delivery
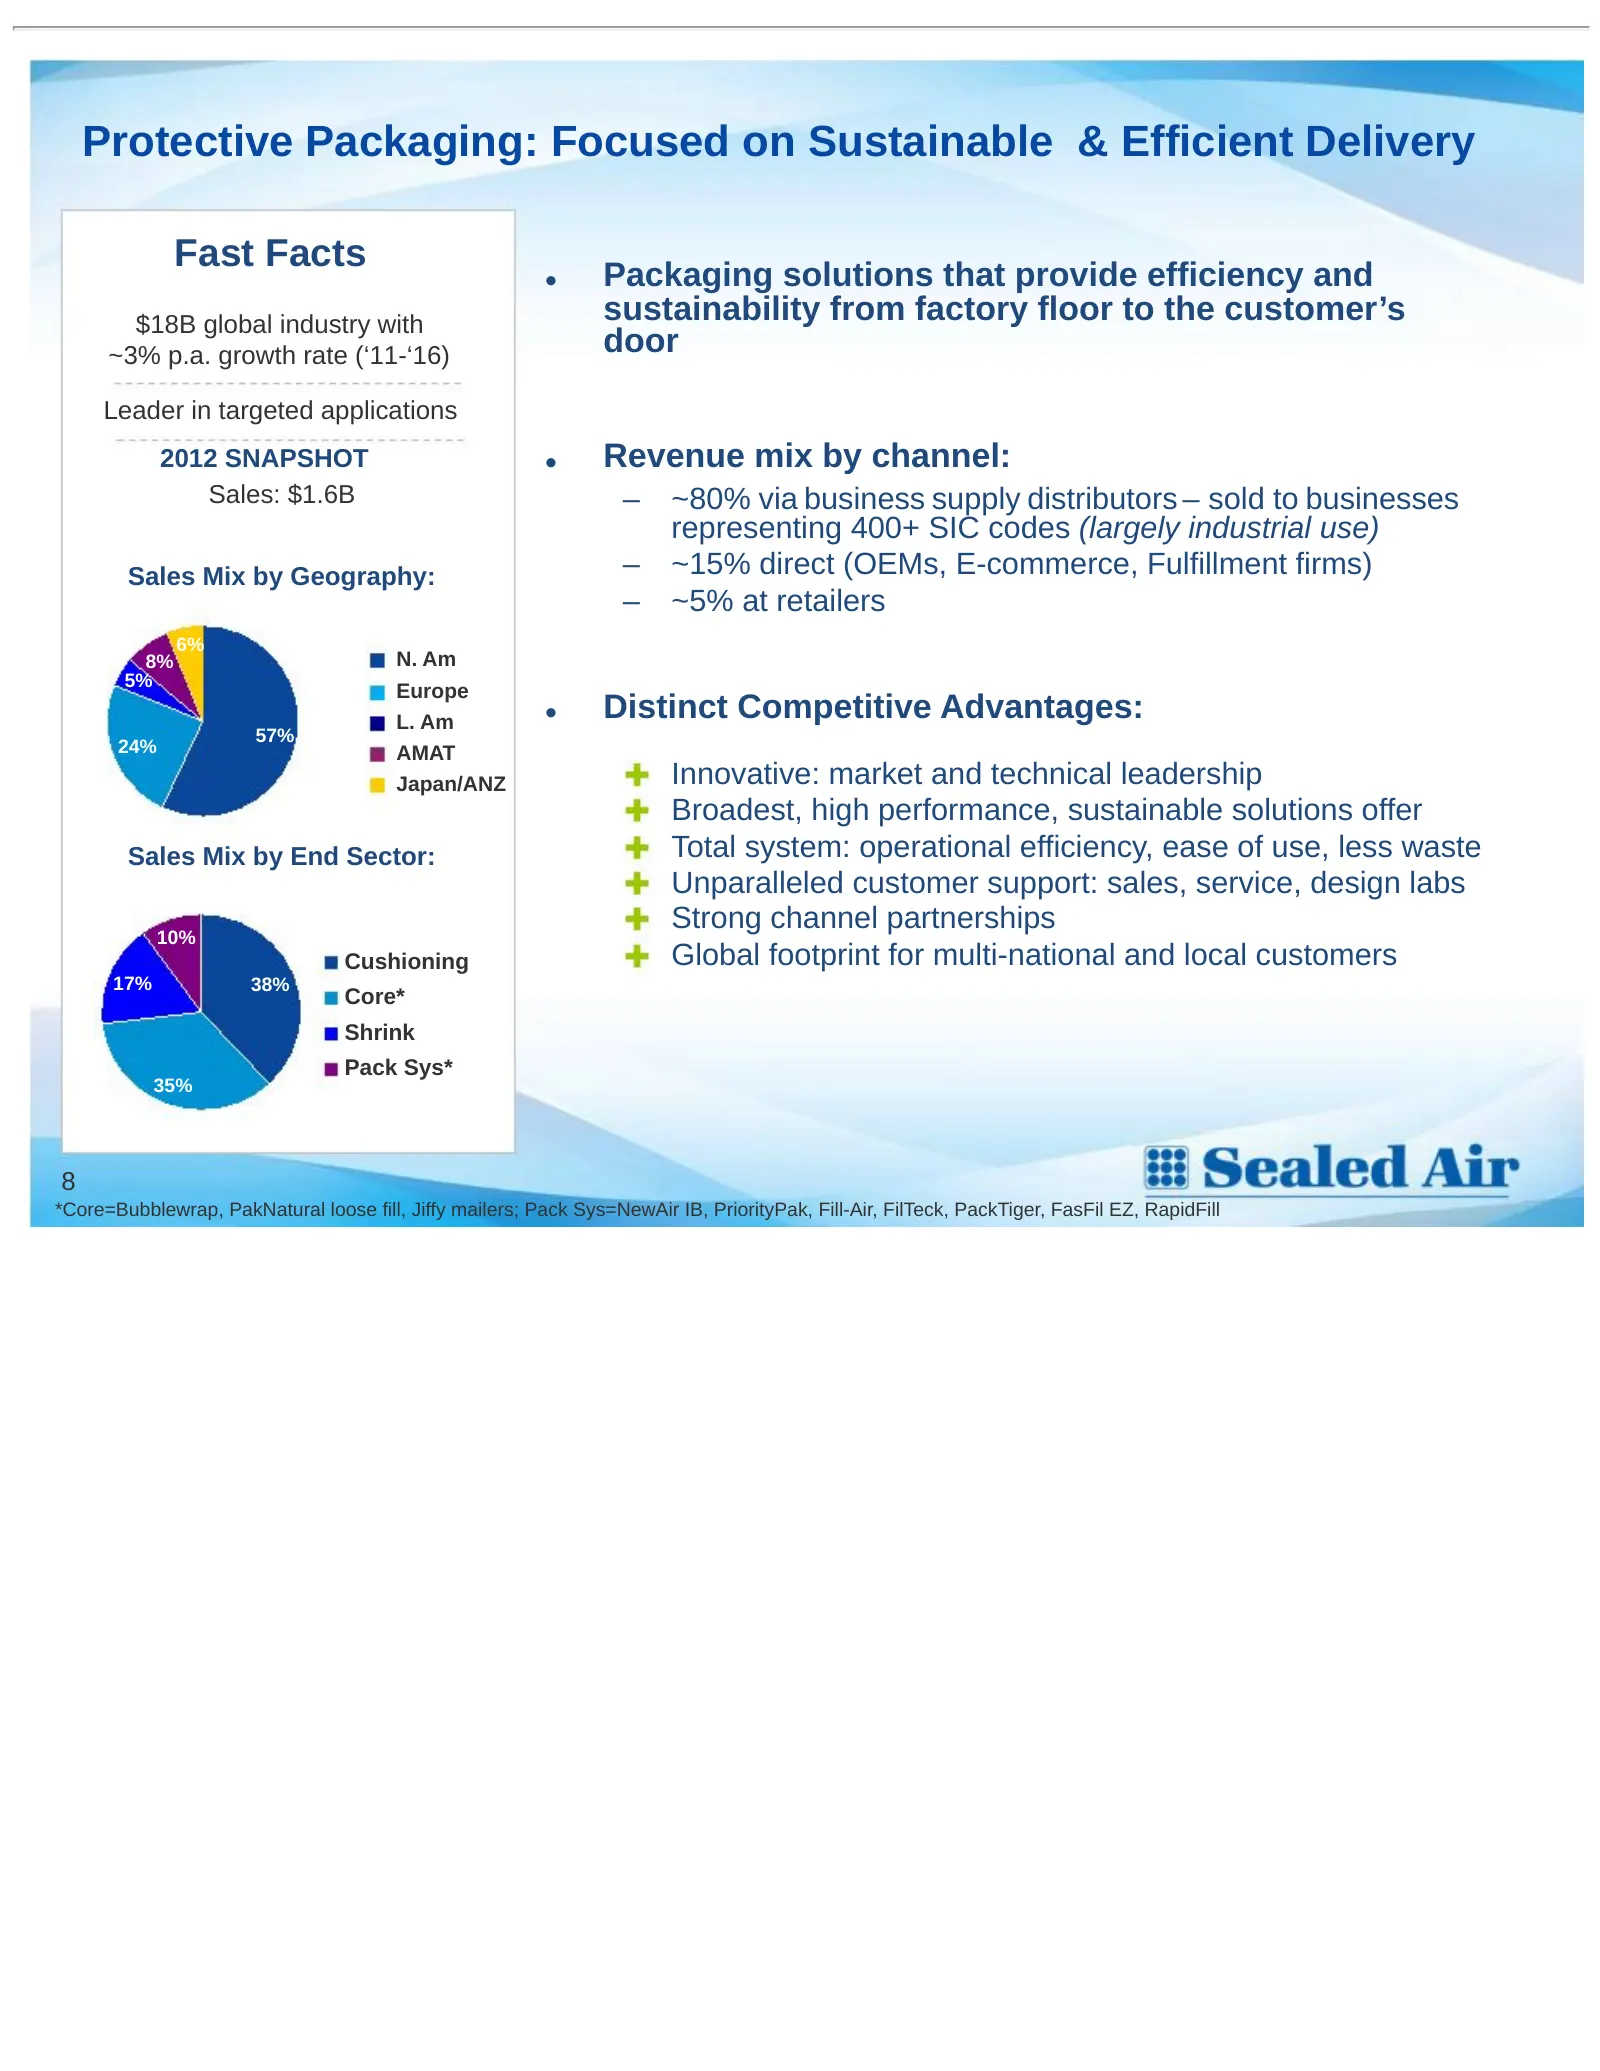
Protective Packaging: Focused on Sustainable & Efficient Delivery Fast Facts Packaging solutions that provide efficiency and • $18B global industry with sustainability from factory floor to the customer’s ~3% p.a. growth rate (‘11-‘16) door Leader in targeted applications 2012 SNAPSHOT • Revenue mix
Slide 10: Protective Packaging: Gains in Adjusted EBITDA and Margin
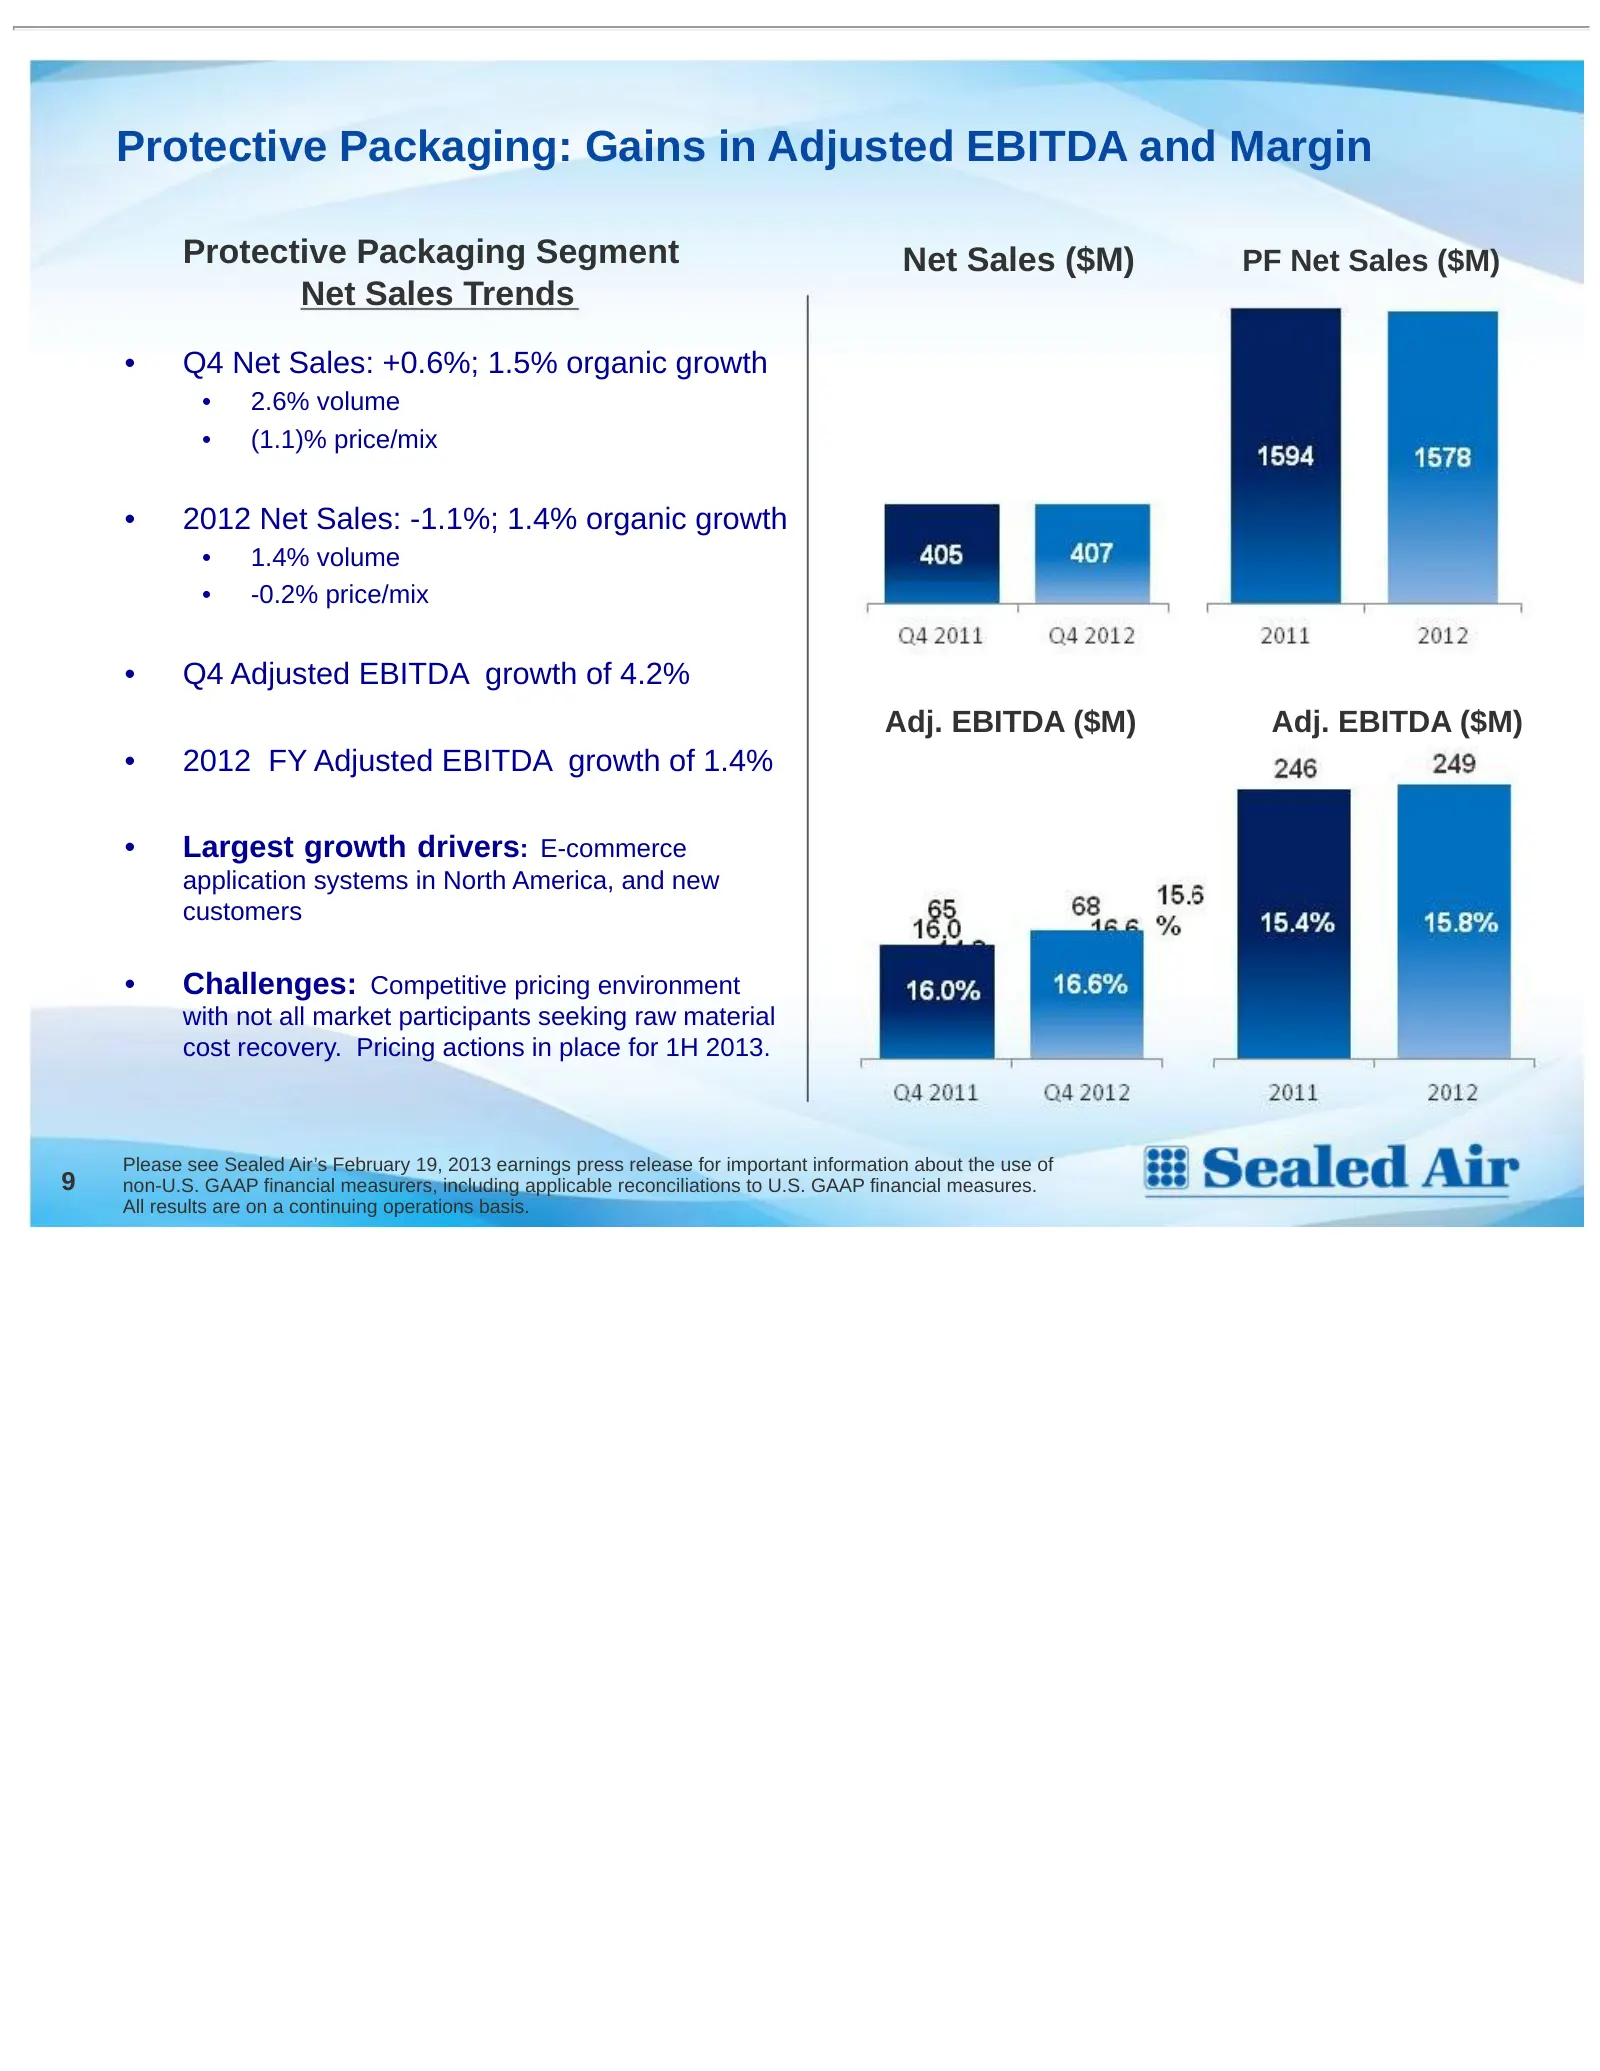
Protective Packaging: Gains in Adjusted EBITDA and Margin Protective Packaging Segment Net Sales ($M) PF Net Sales ($M) Net Sales Trends • Q4 Net Sales: +0.6%; 1.5% organic growth • 2.6% volume • (1.1)% price/mix • 2012 Net Sales: -1.1%; 1.4% organic growth • 1.4% volume • -0.2% price/mix • Q4 Adjus
Slide 11: Consolidated Adjusted EBITDA Performance
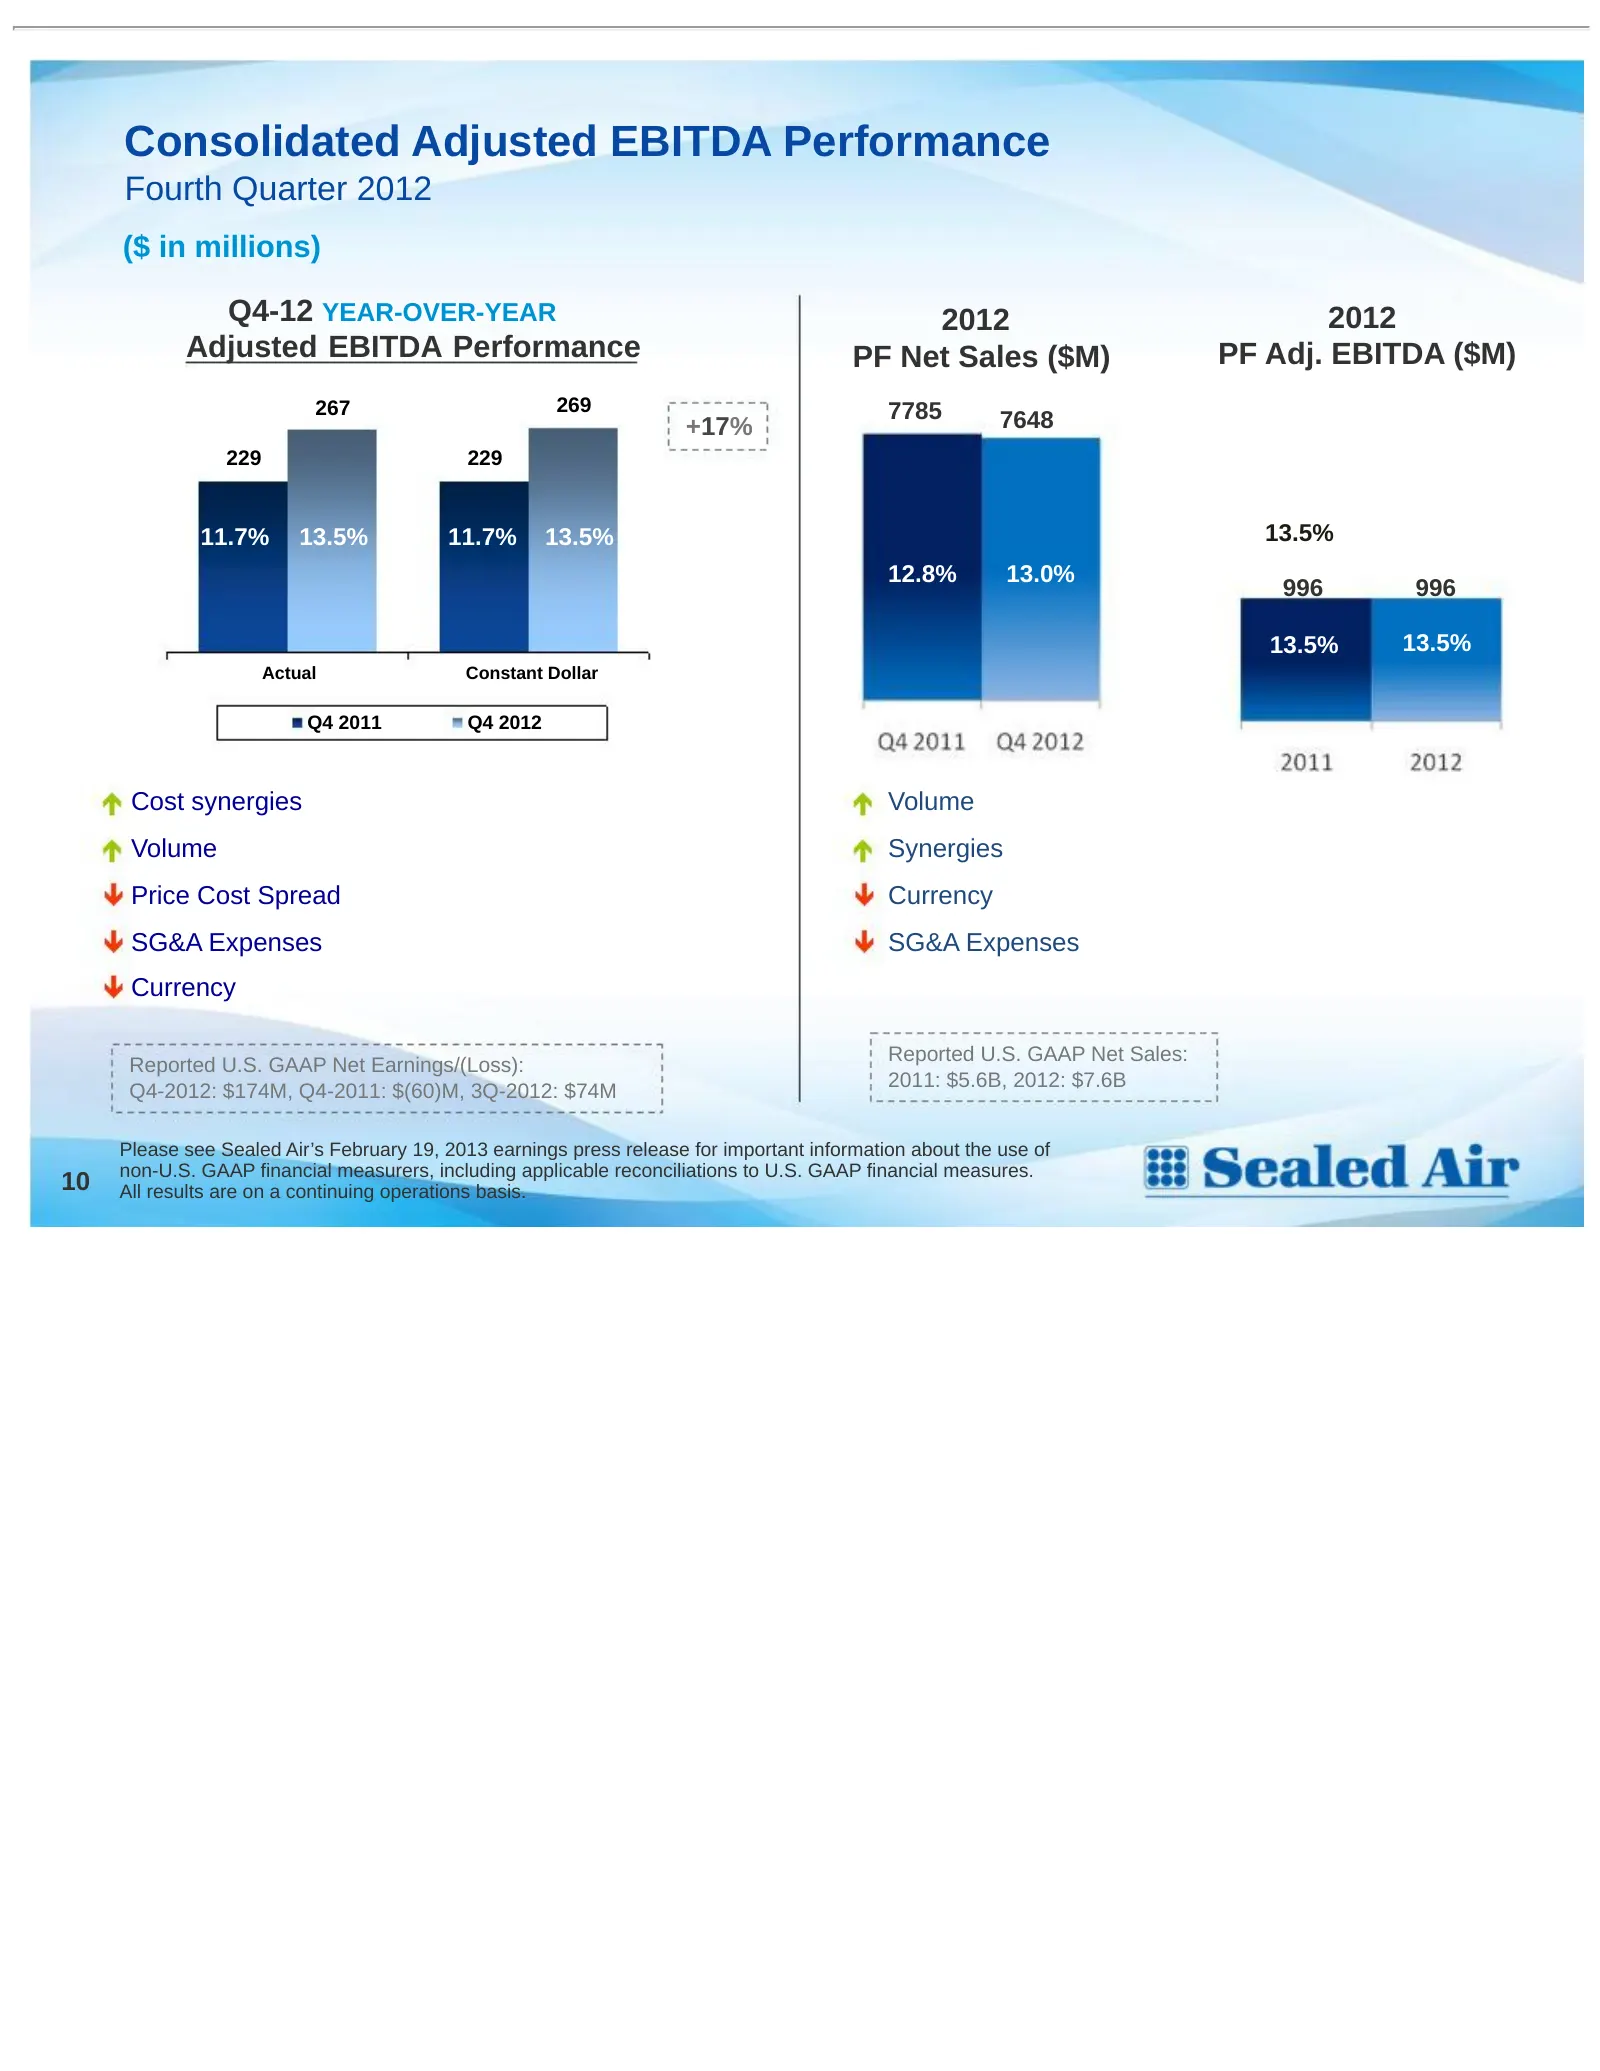
Consolidated Adjusted EBITDA Performance Fourth Quarter 2012 ($ in millions) Q4-12 YEAR-OVER-YEAR 2012 2012 Adjusted EBITDA Performance PF Net Sales ($M) PF Adj. EBITDA ($M) 267 269 7785 +17% 7648 229 229 11.7% 13.5% 11.7% 13.5% 13.5% 12.8% 13.0% 996 996 13.5% 13.5% Actual Constant Dollar Q4 2011 Q4
Slide 12: Adjusted Free Cash Flow and Working Capital
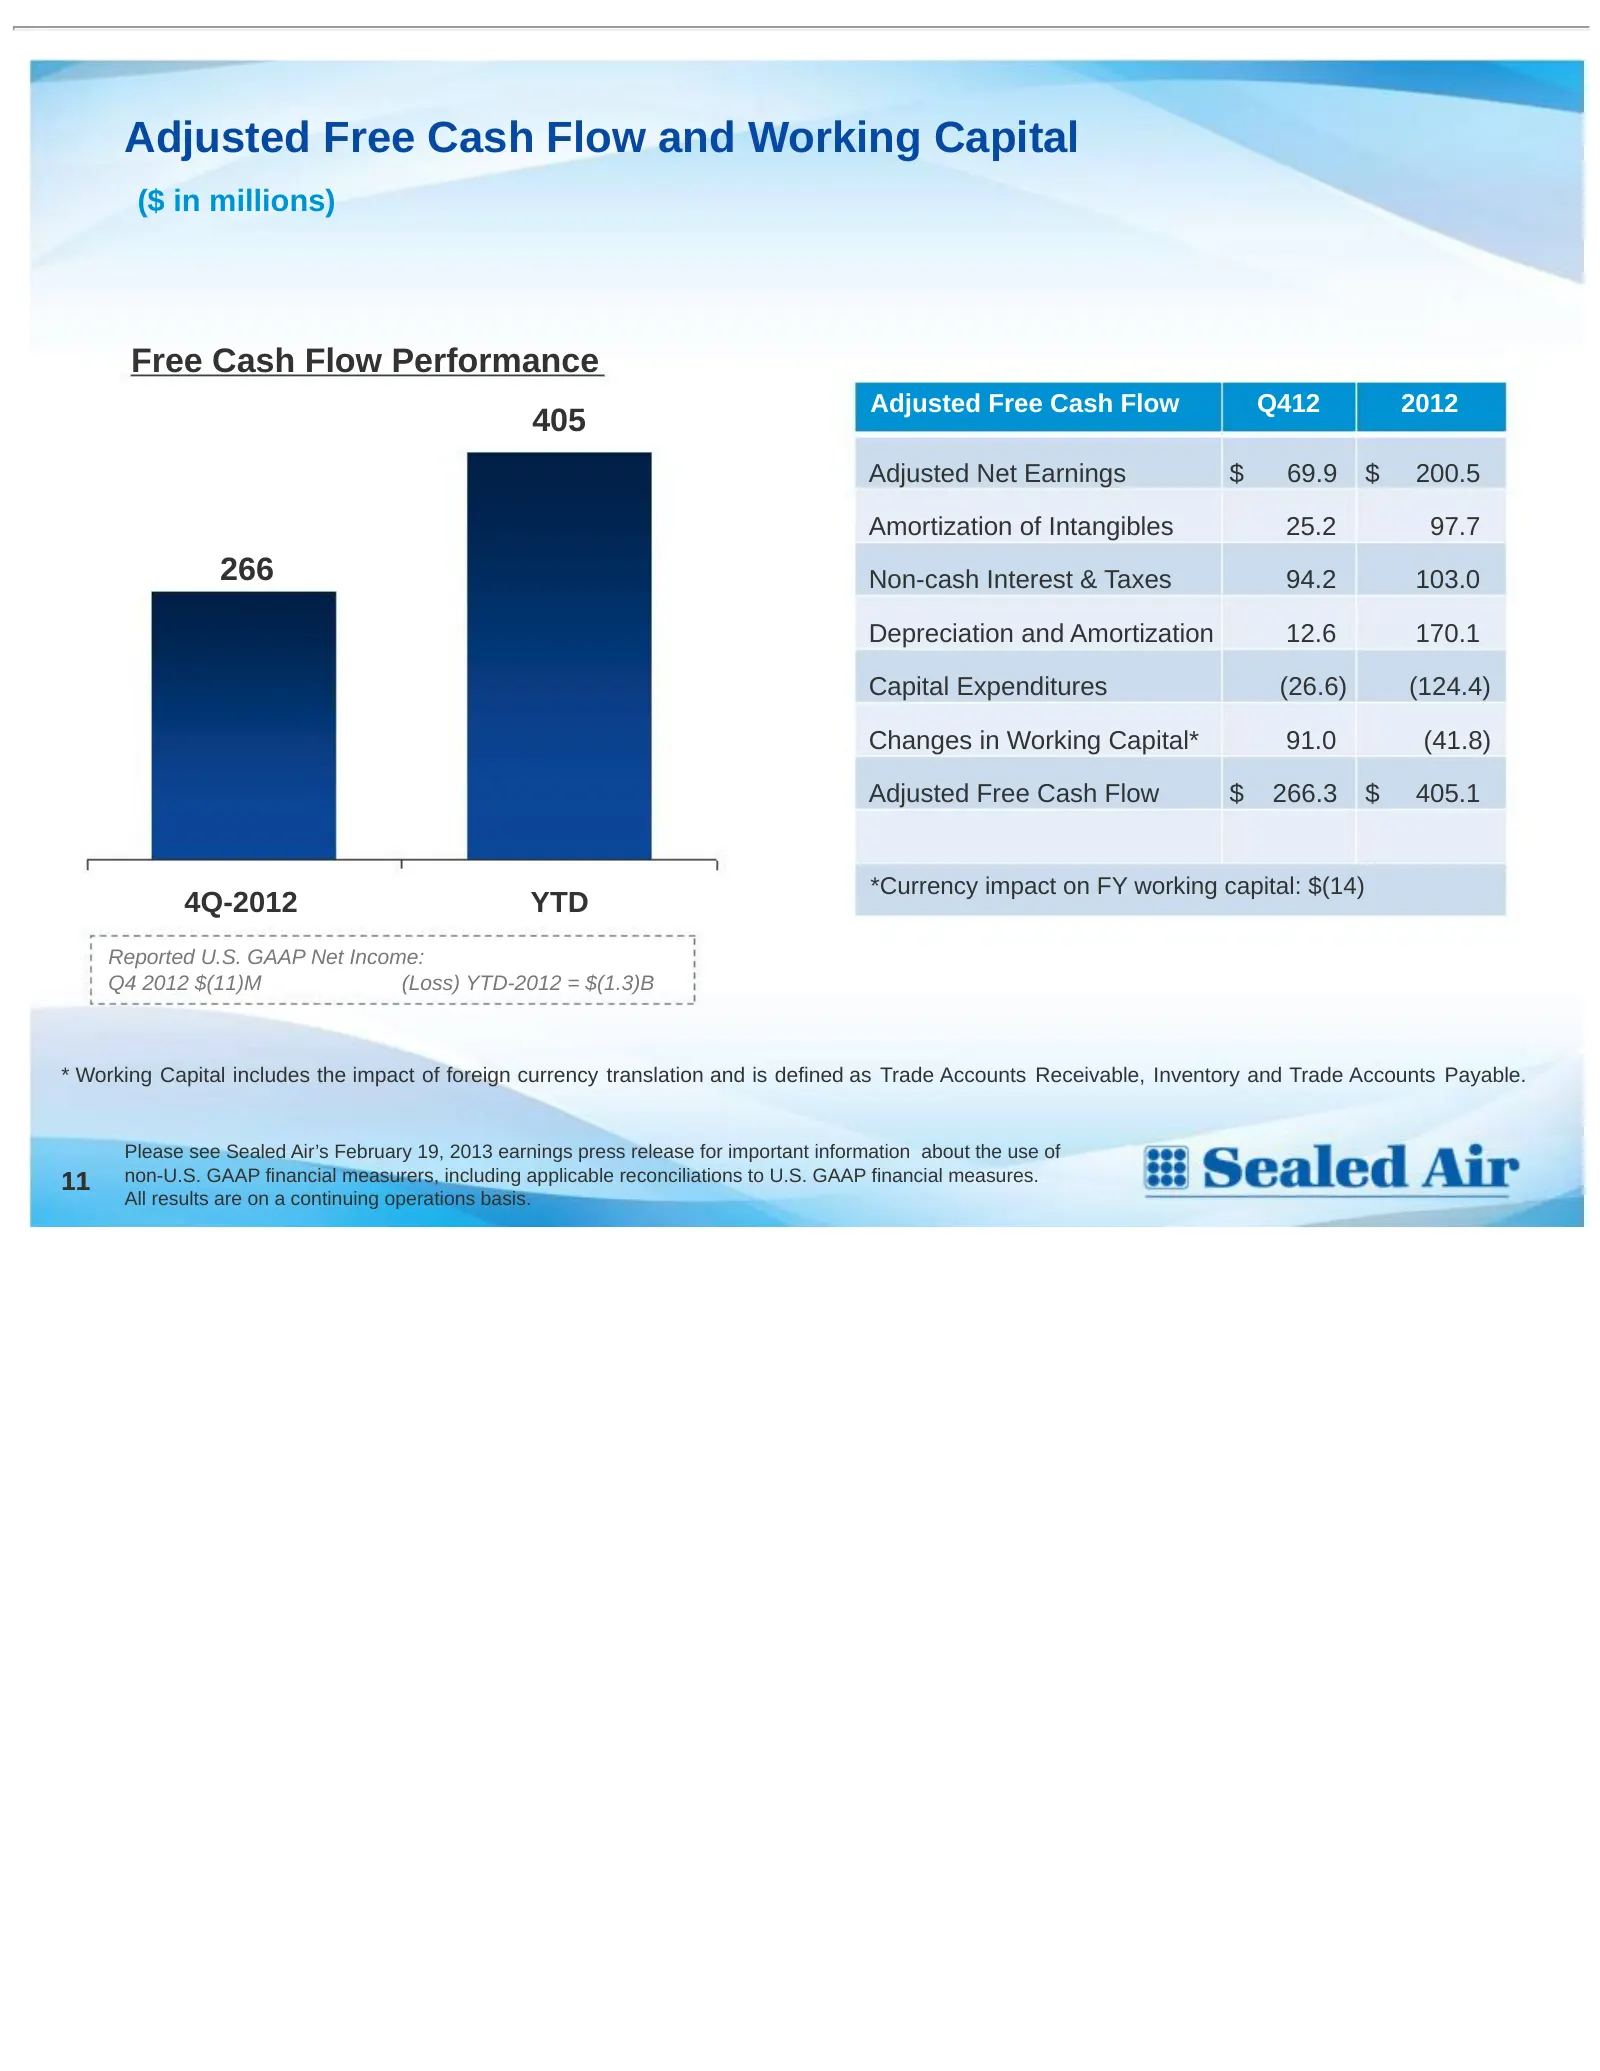
Adjusted Free Cash Flow and Working Capital ($ in millions) Free Cash Flow Performance Adjusted Free Cash Flow Q412 2012 405 Adjusted Net Earnings $ 69.9 $ 200.5 Amortization of Intangibles 25.2 97.7 266 Non-cash Interest & Taxes 94.2 103.0 Depreciation and Amortization 12.6 170.1 Capital Expenditur
Slide 13: Liquidity & Net Debt
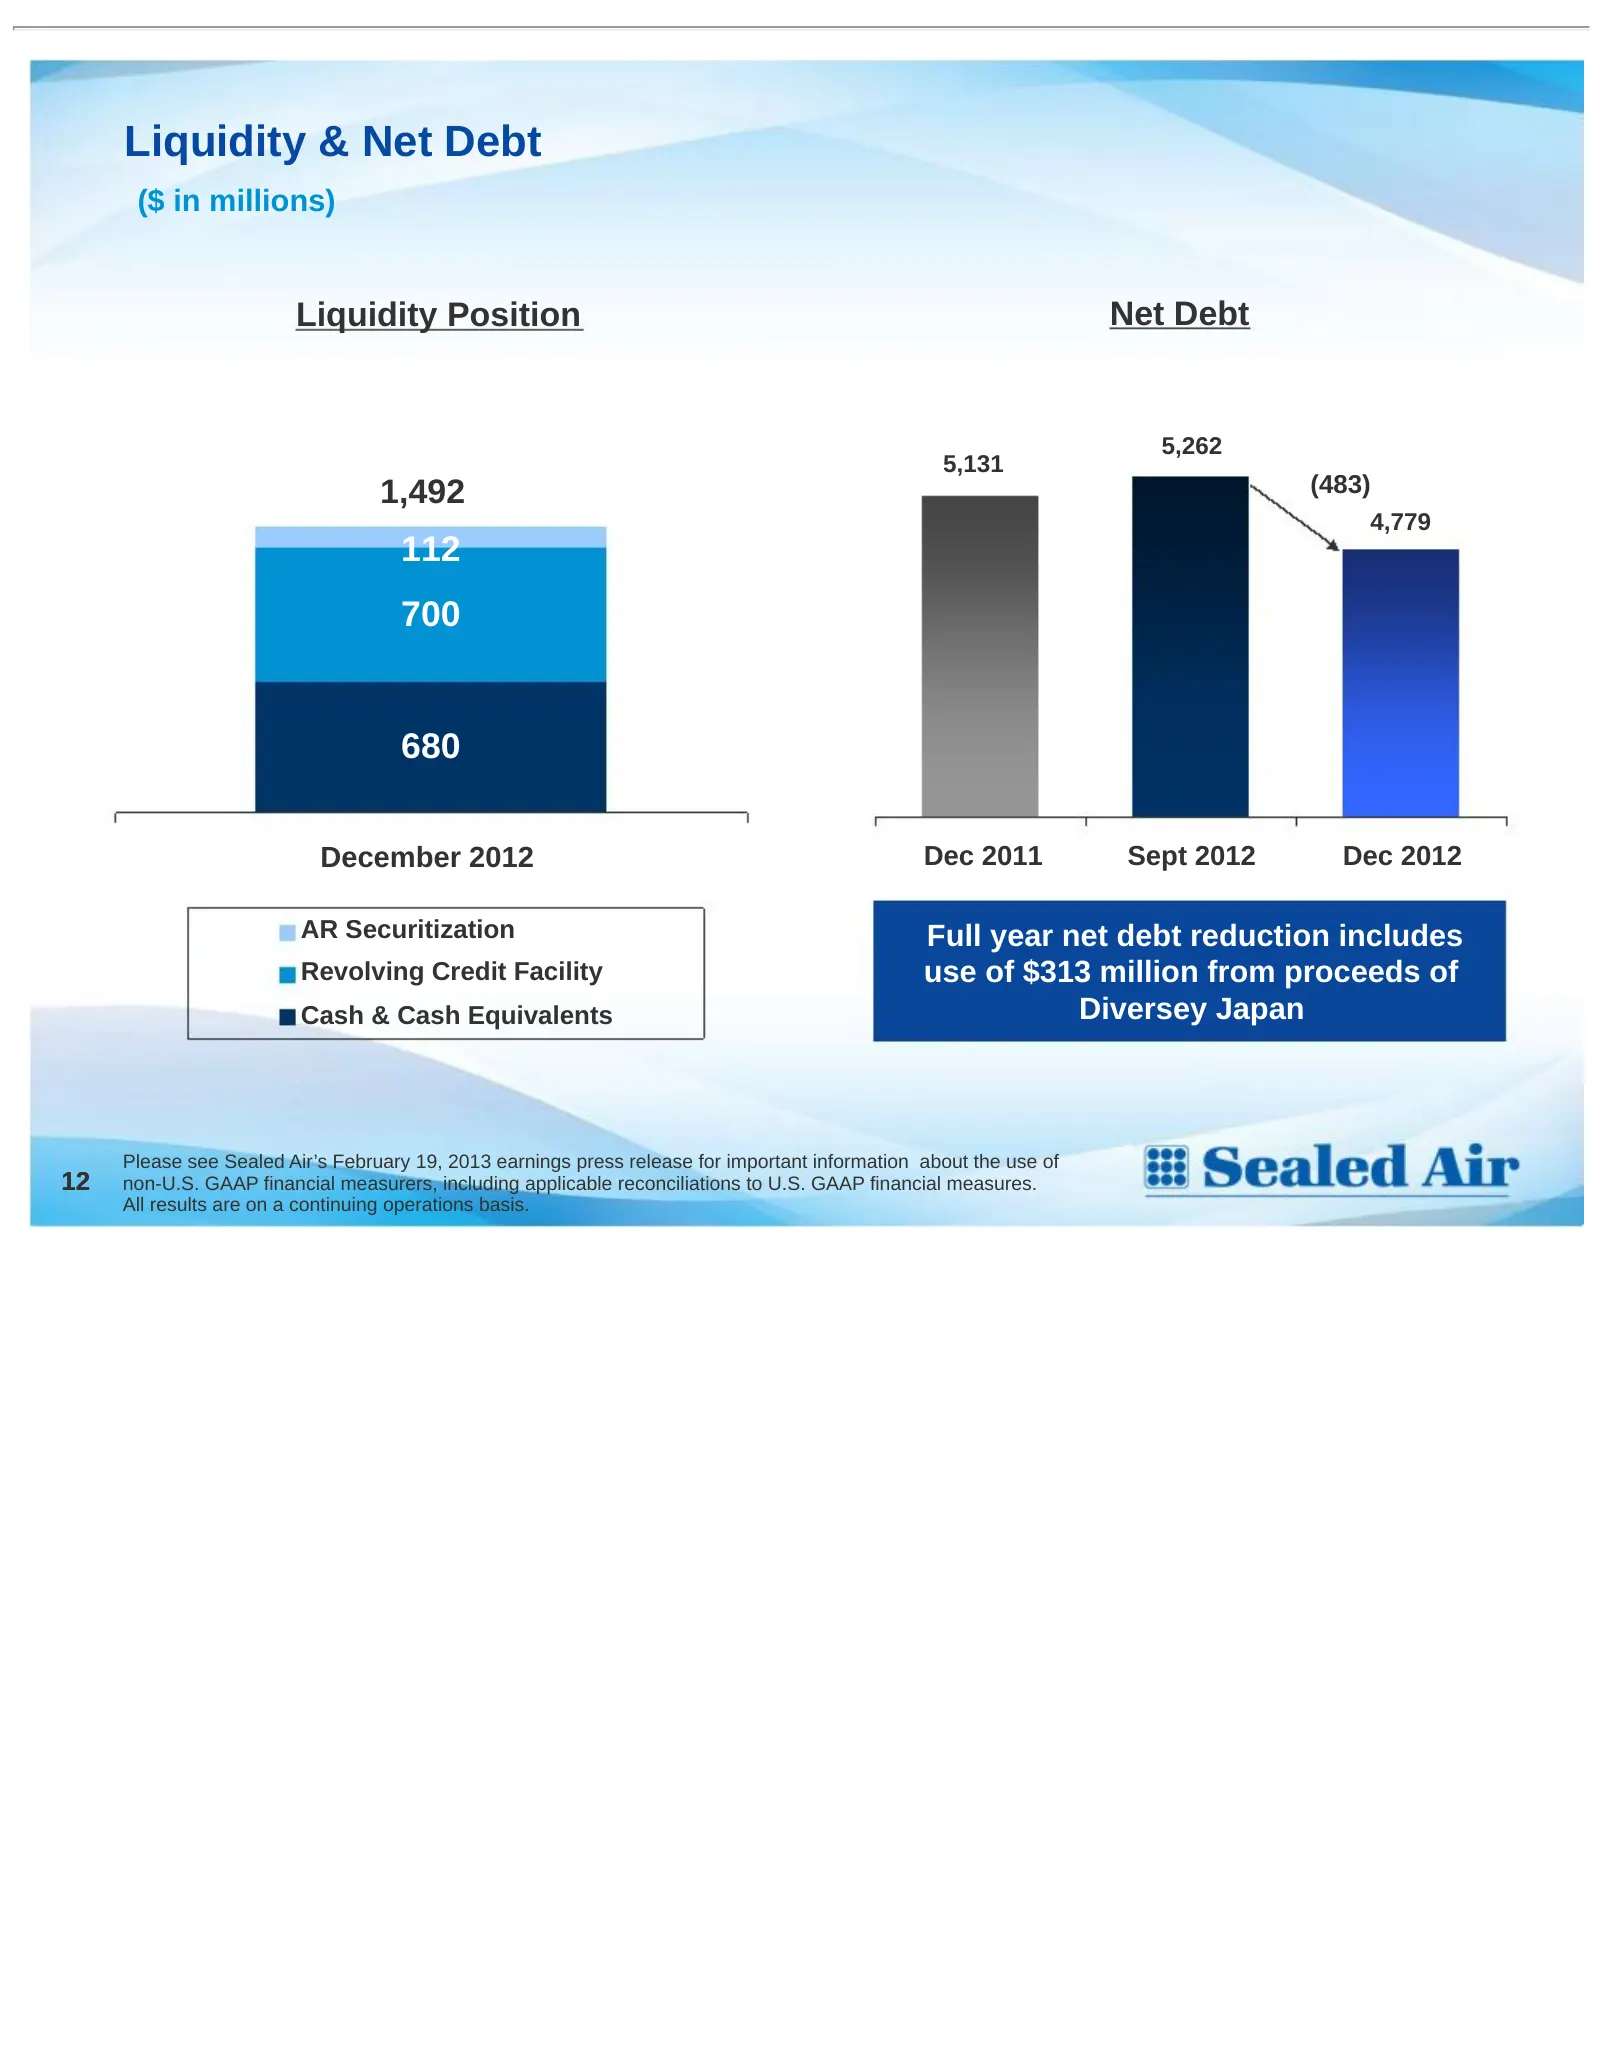
Liquidity & Net Debt ($ in millions) Liquidity Position Net Debt 5,262 5,131 1,492 (483) 4,779 112 700 680 December 2012 Dec 2011 Sept 2012 Dec 2012 AR Securitization Full year net debt reduction includes Revolving Credit Facility use of $313 million from proceeds of Cash & Cash Equivalents Diversey
Slide 14: Updated Covenants and Debt Maturity Schedule
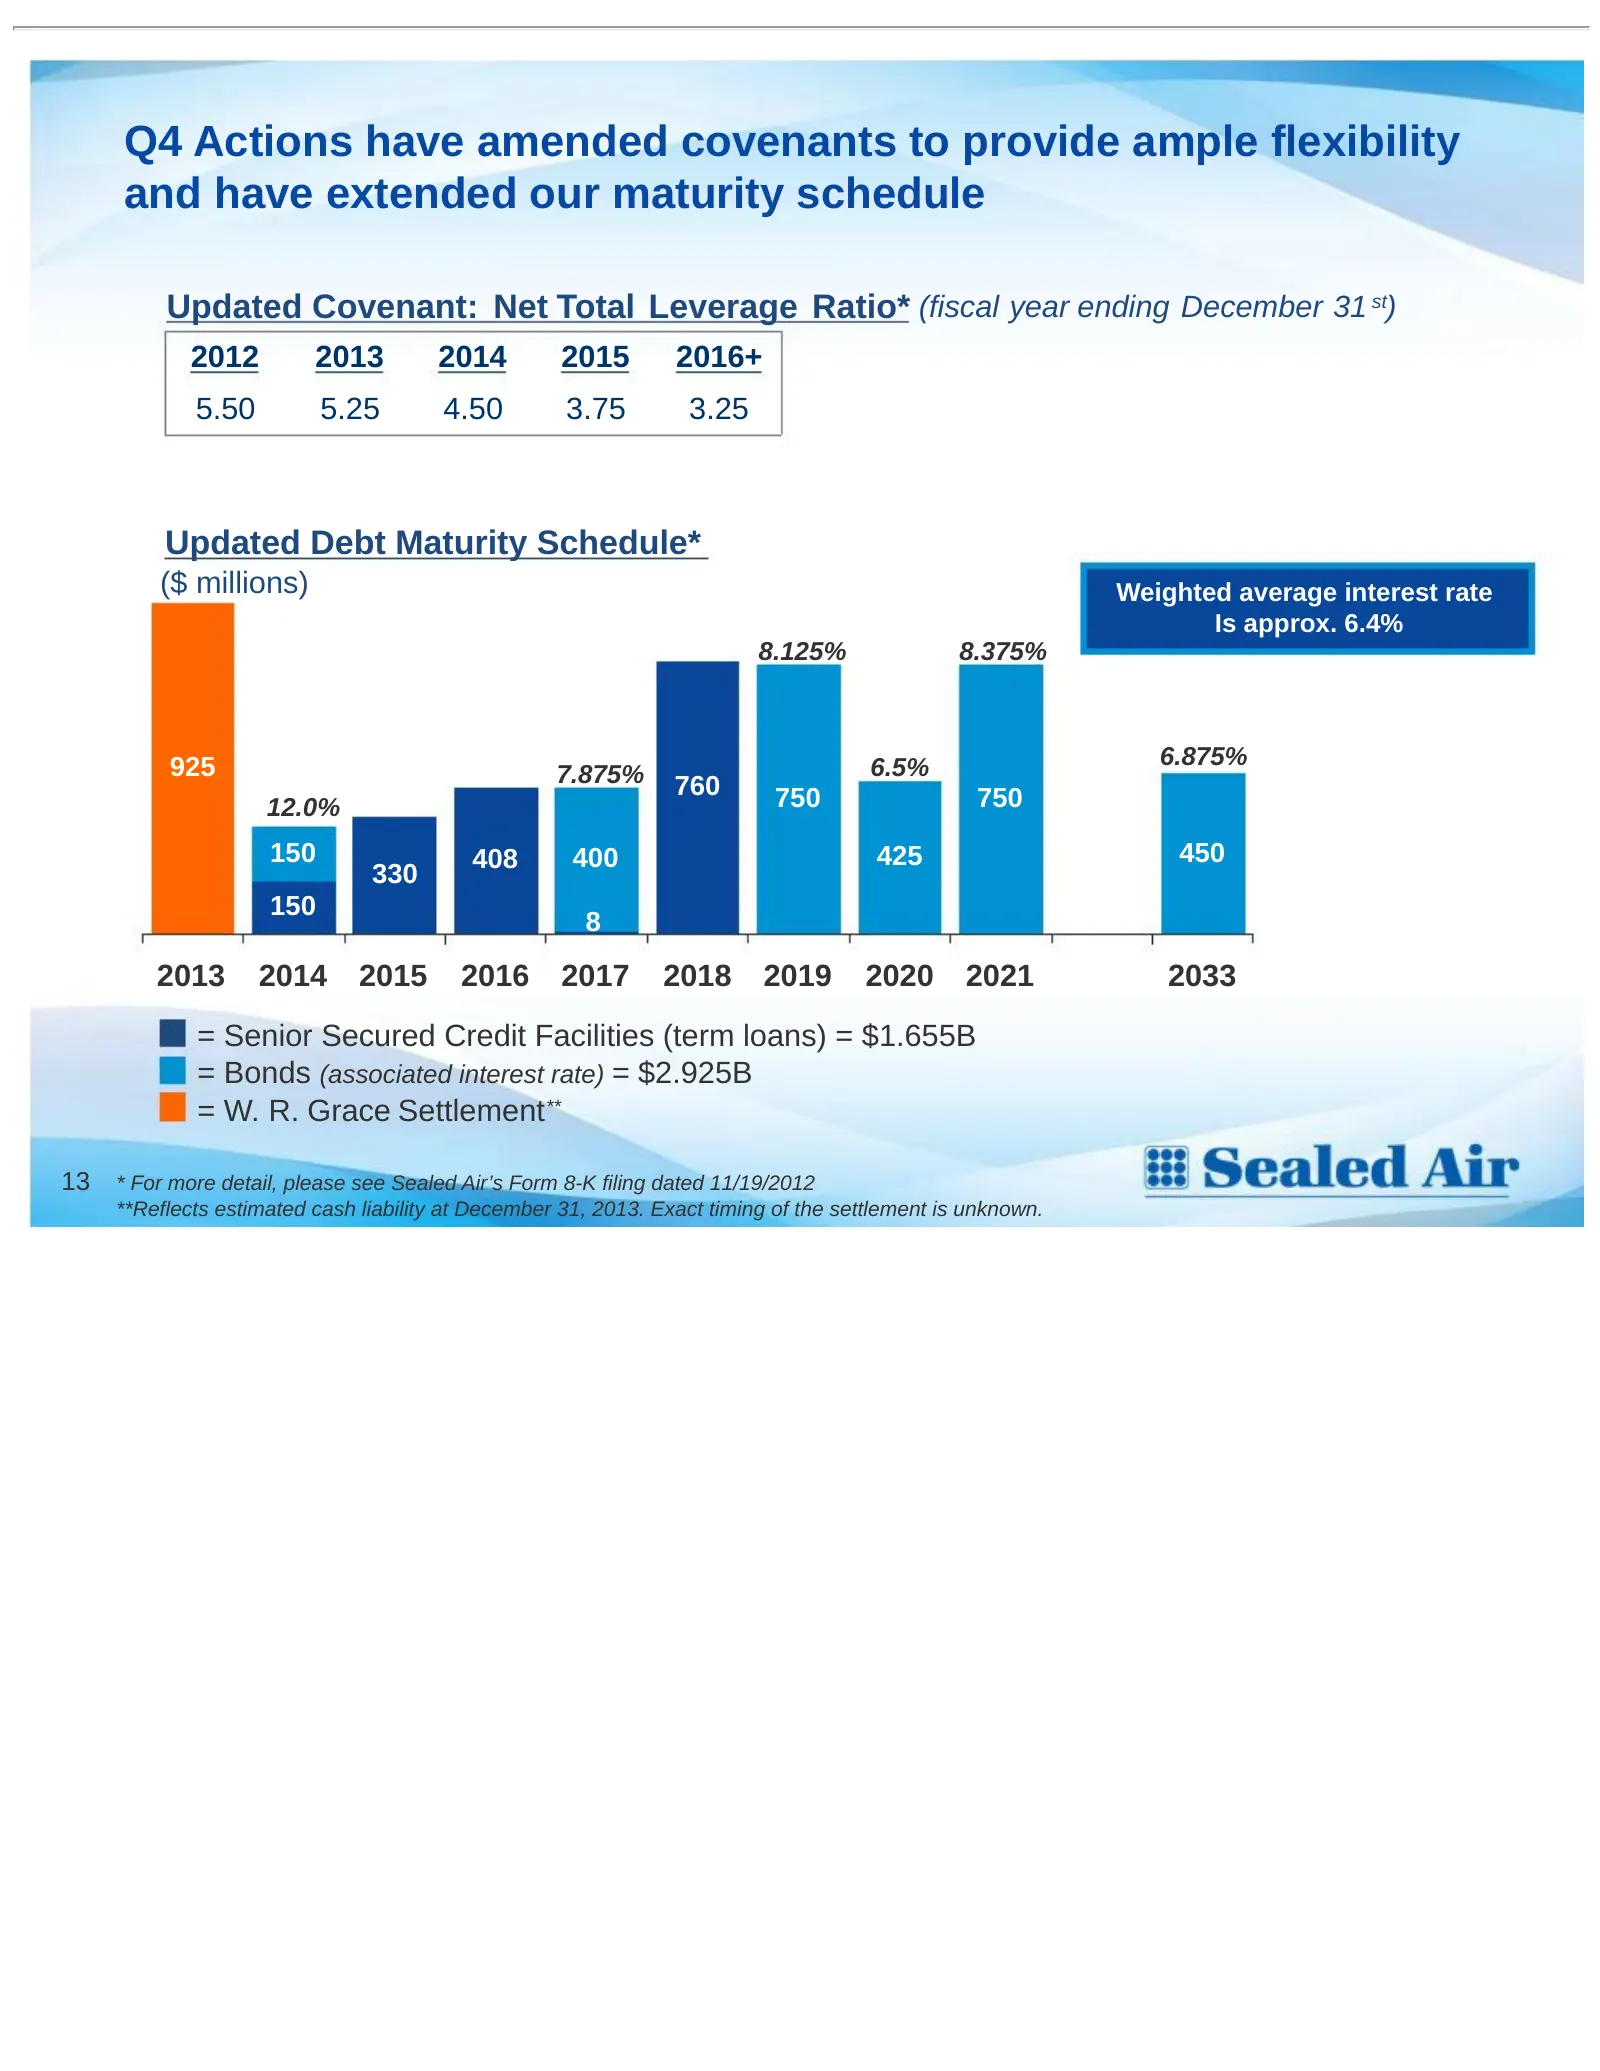
Q4 Actions have amended covenants to provide ample flexibility and have extended our maturity schedule Updated Covenant: Net Total Leverage Ratio* (fiscal year ending December 31 st) 2012 2013 2014 2015 2016+ 5.50 5.25 4.50 3.75 3.25 Updated Debt Maturity Schedule* ($ millions) Weighted average inte
Slide 15: FY2013 Outlook
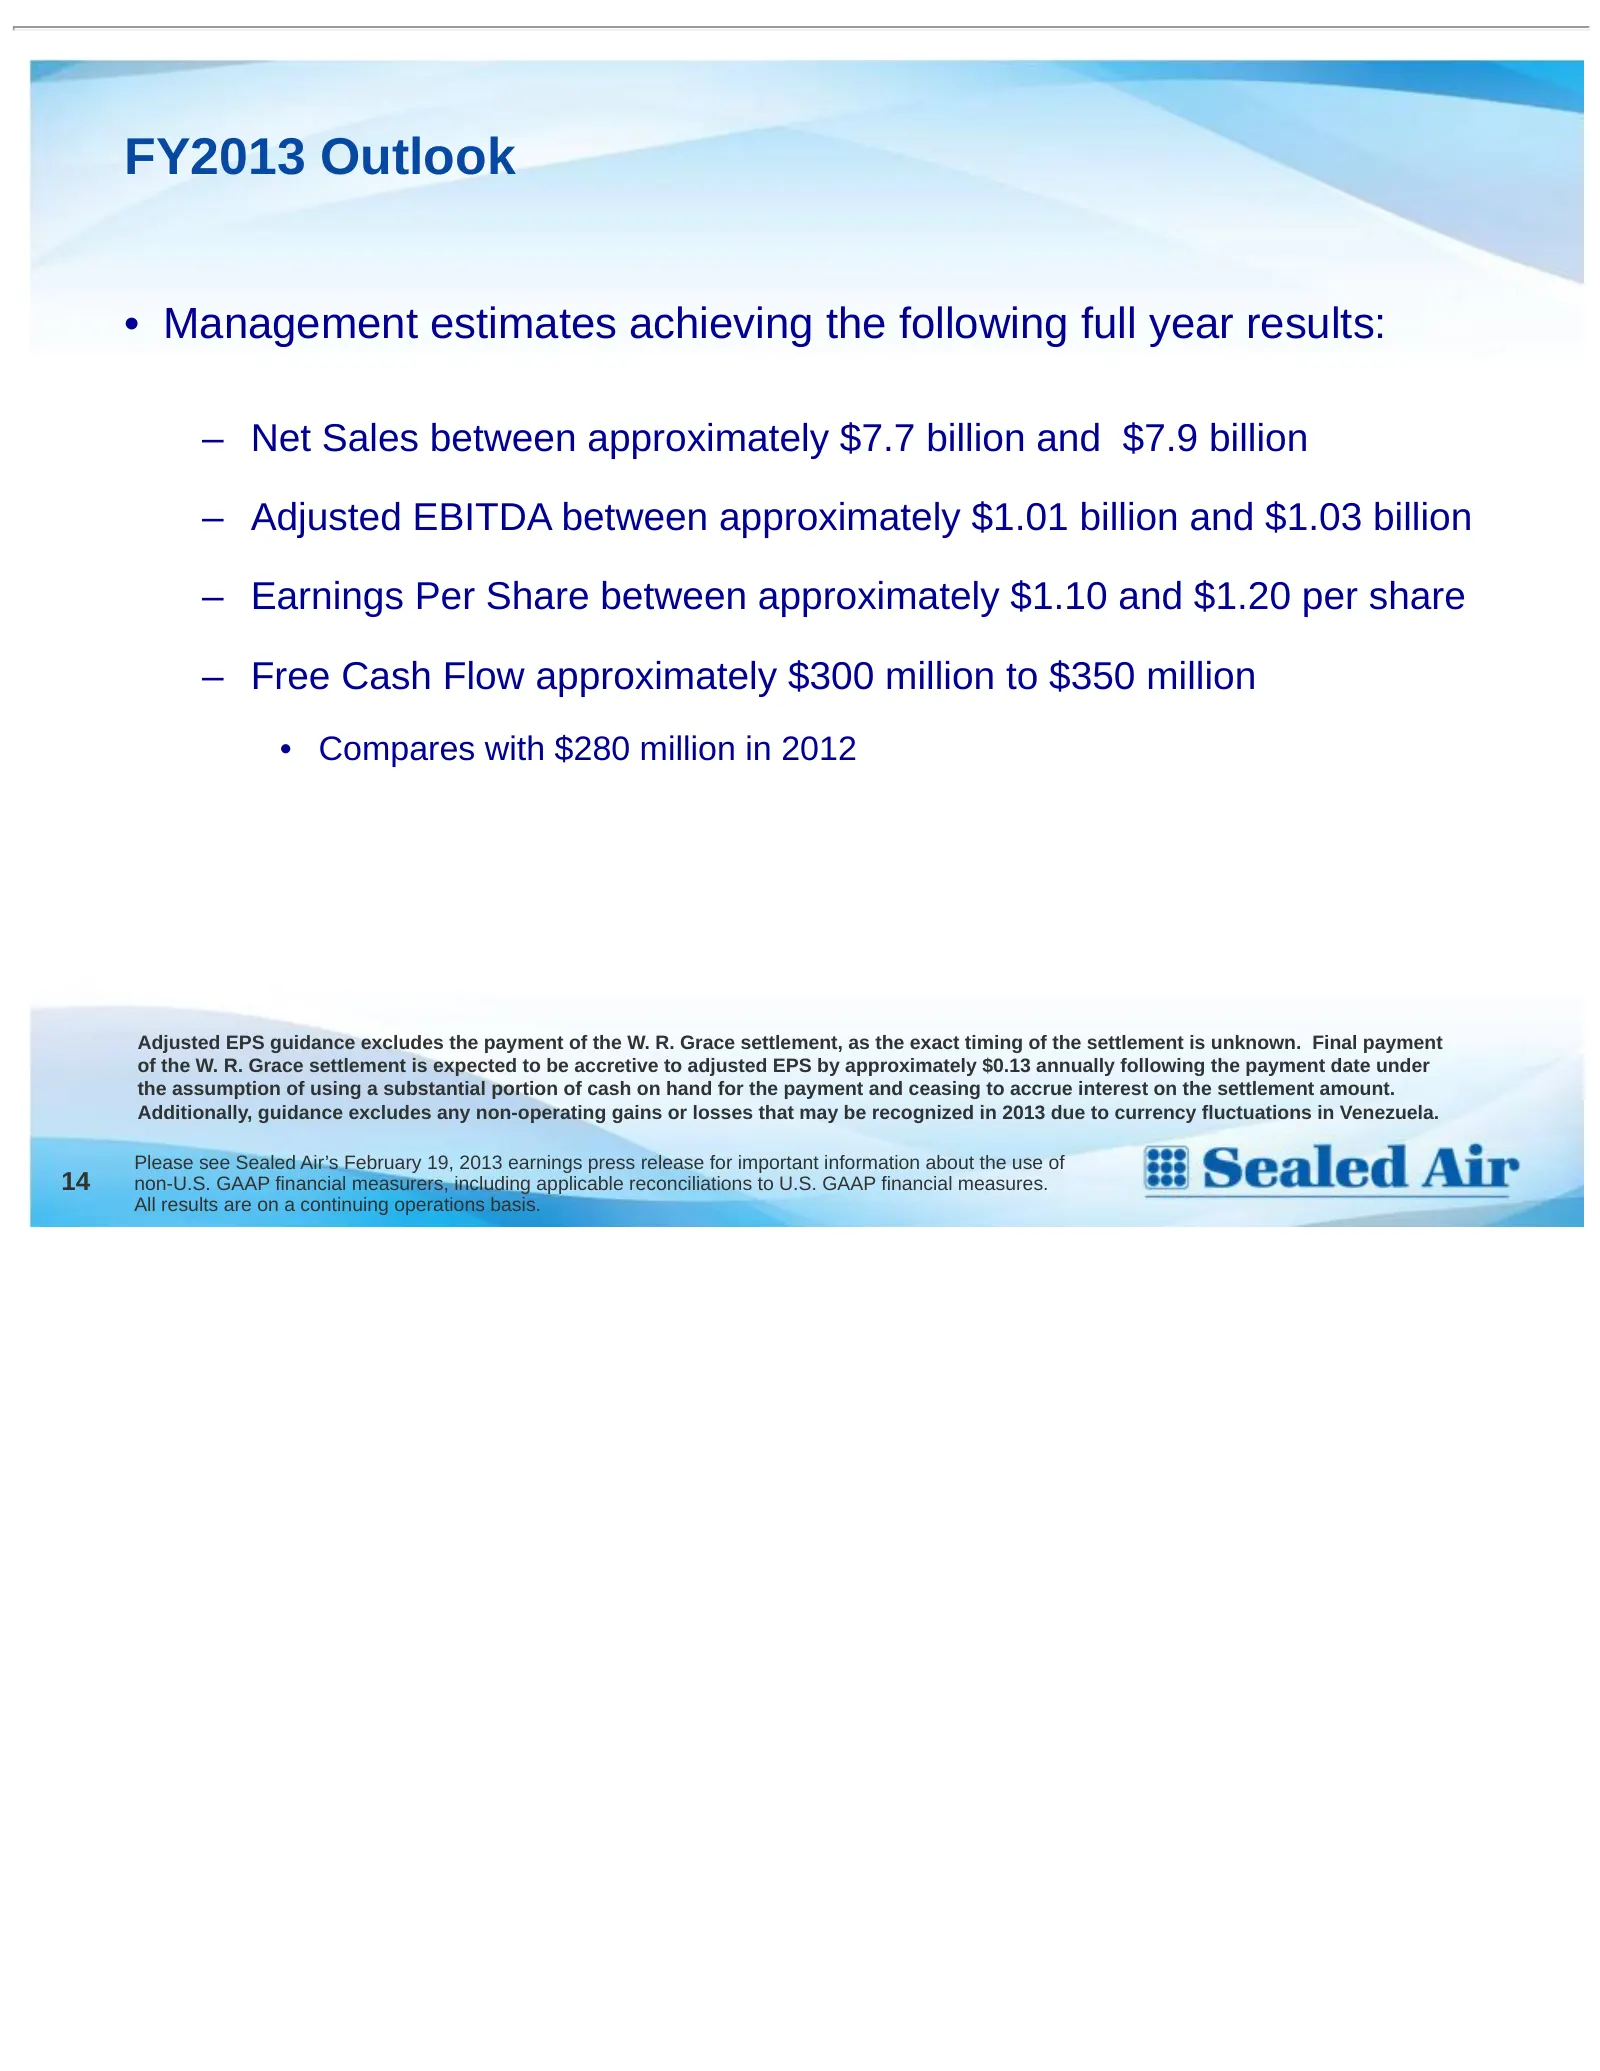
FY2013 Outlook • Management estimates achieving the following full year results: – Net Sales between approximately $7.7 billion and $7.9 billion – Adjusted EBITDA between approximately $1.01 billion and $1.03 billion – Earnings Per Share between approximately $1.10 and $1.20 per share – Free Cash Fl
Slide 16: Earnings Conference Call Fourth Quarter 2012 – Q&A
SEALED AIR CORPORATION Earnings Conference Call Fourth Quarter 2012 Q&A Please see Sealed Air’s February 19, 2013 earnings press release for important information about the use of non-U.S. GAAP financial measurers, including applicable reconciliations to U.S. GAAP financial measures. All results are
Slide 17: Appendix
SEALED AIR CORPORATION Earnings Conference Call Fourth Quarter 2012 Appendix Please see Sealed Air’s February 19, 2013 earnings press release for important information about the use of non-U.S. GAAP financial measurers, including applicable reconciliations to U.S. GAAP financial measures. All result
Slide 18: 2012 Adjusted EPS Calculation
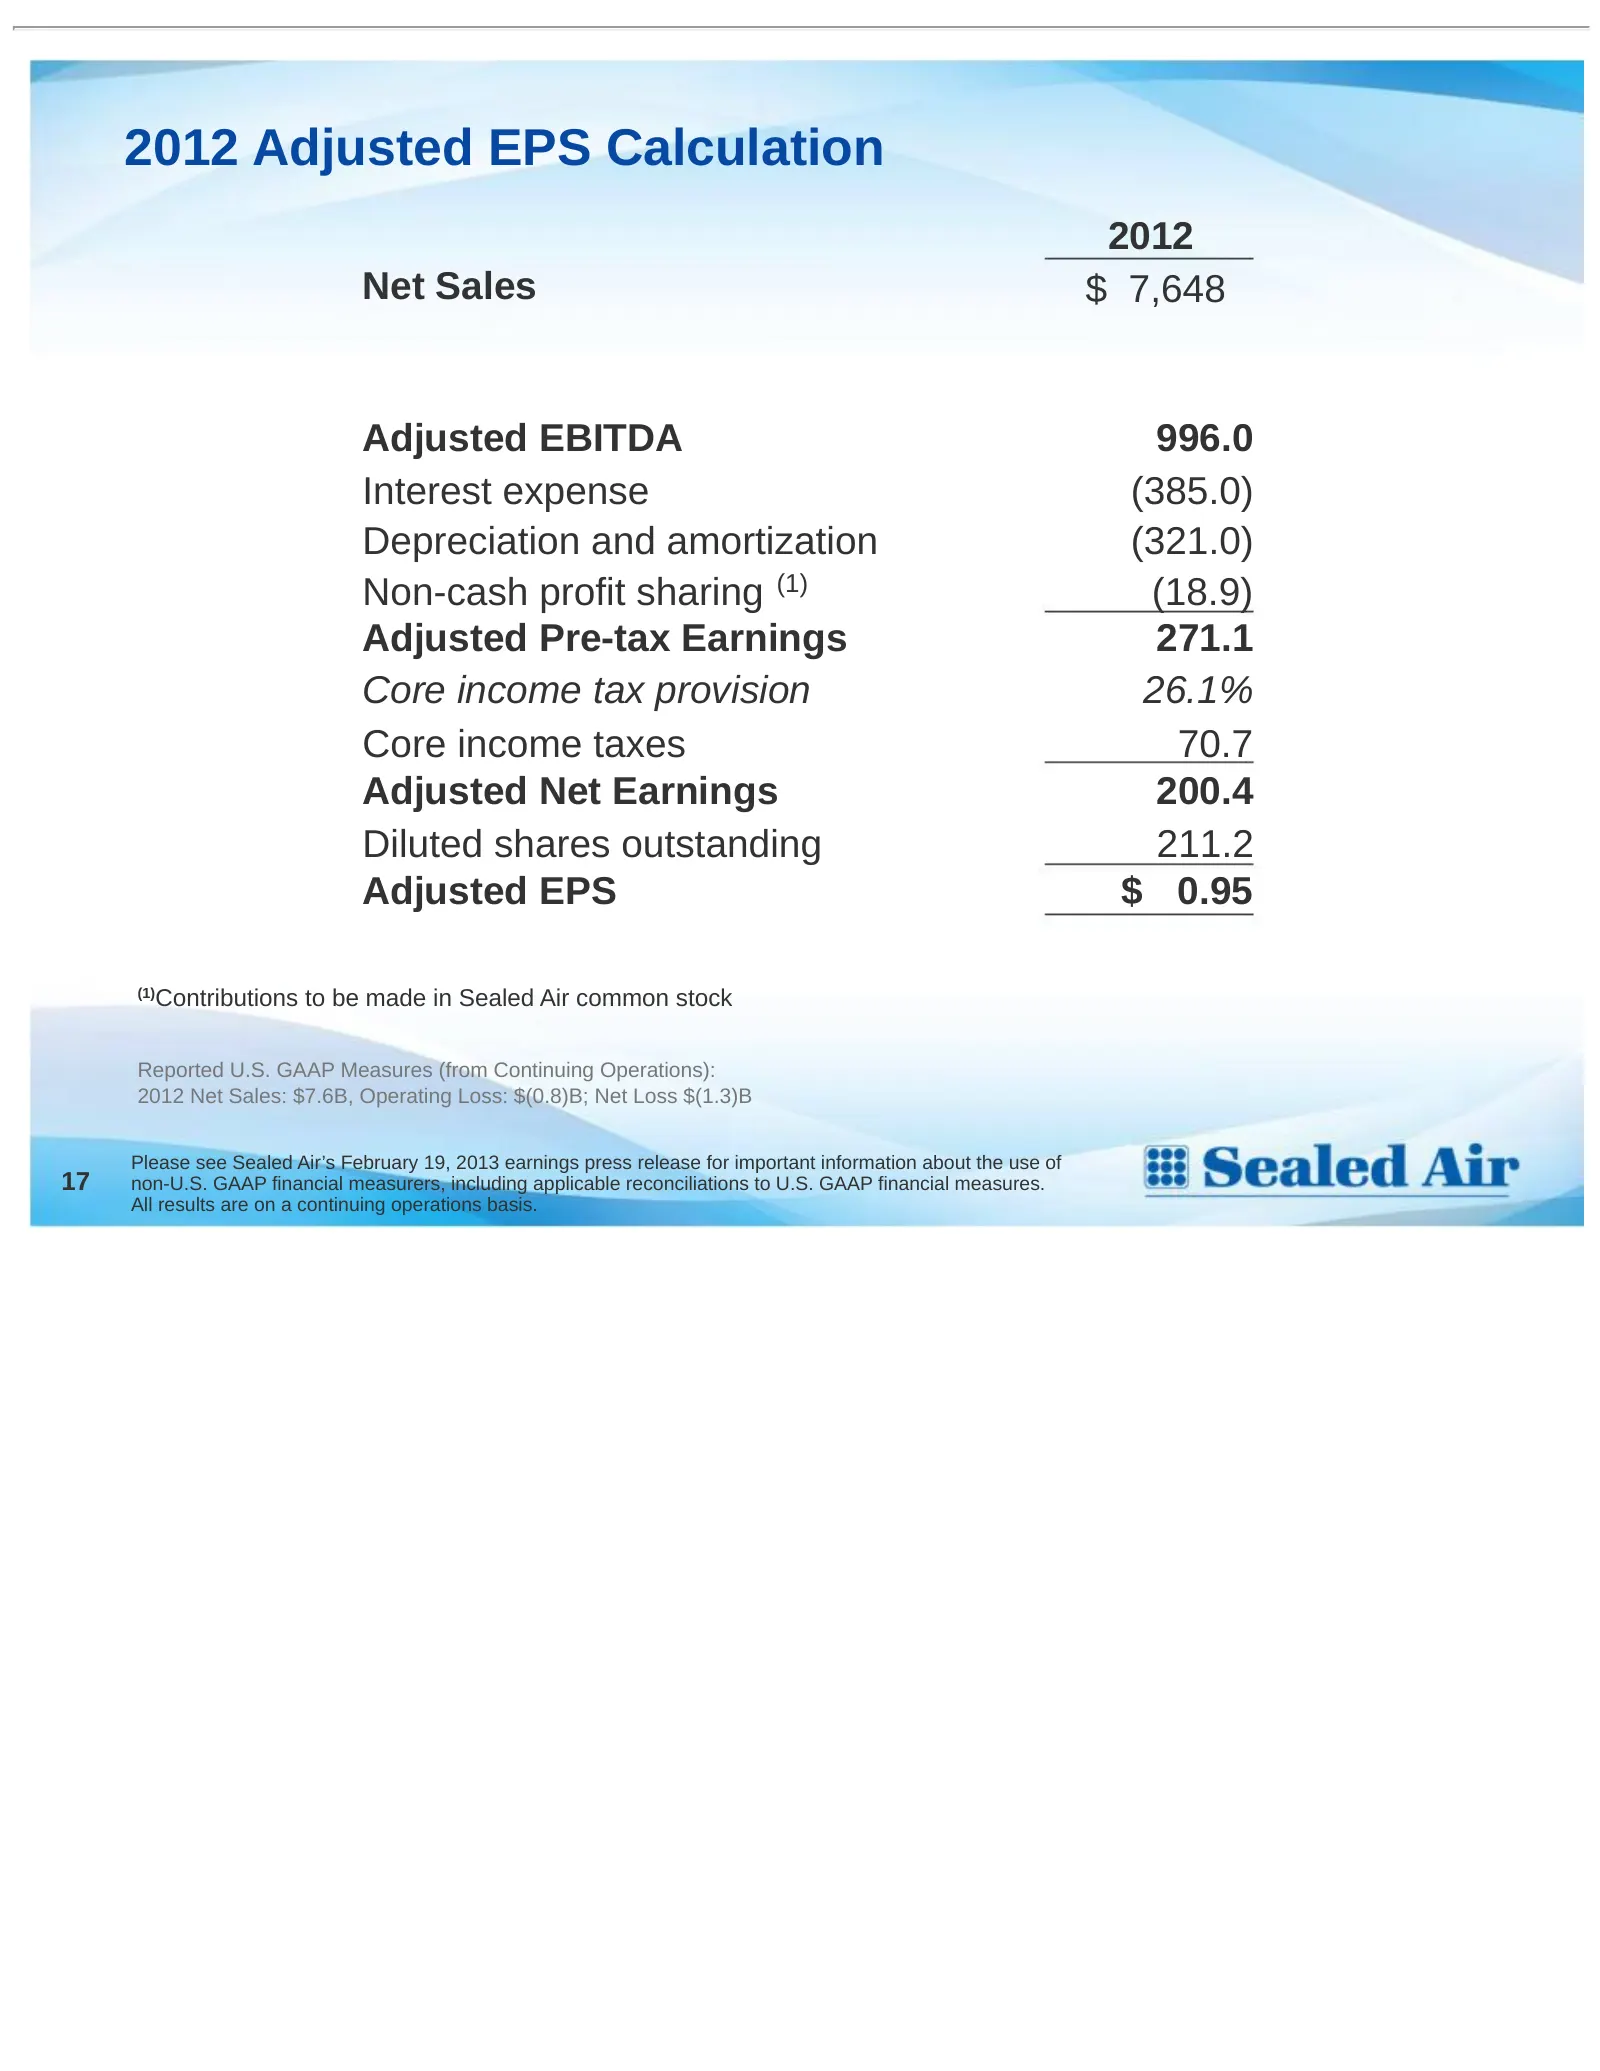
2012 Adjusted EPS Calculation 2012 Net Sales $ 7,648 Adjusted EBITDA 996.0 Interest expense (385.0) Depreciation and amortization (321.0) Non-cash profit sharing (1) (18.9) Adjusted Pre-tax Earnings 271.1 Core income tax provision 26.1% Core income taxes 70.7 Adjusted Net Earnings 200.4 Diluted shar
Slide 19: Q4 2012 Adjusted EBITDA Bridge
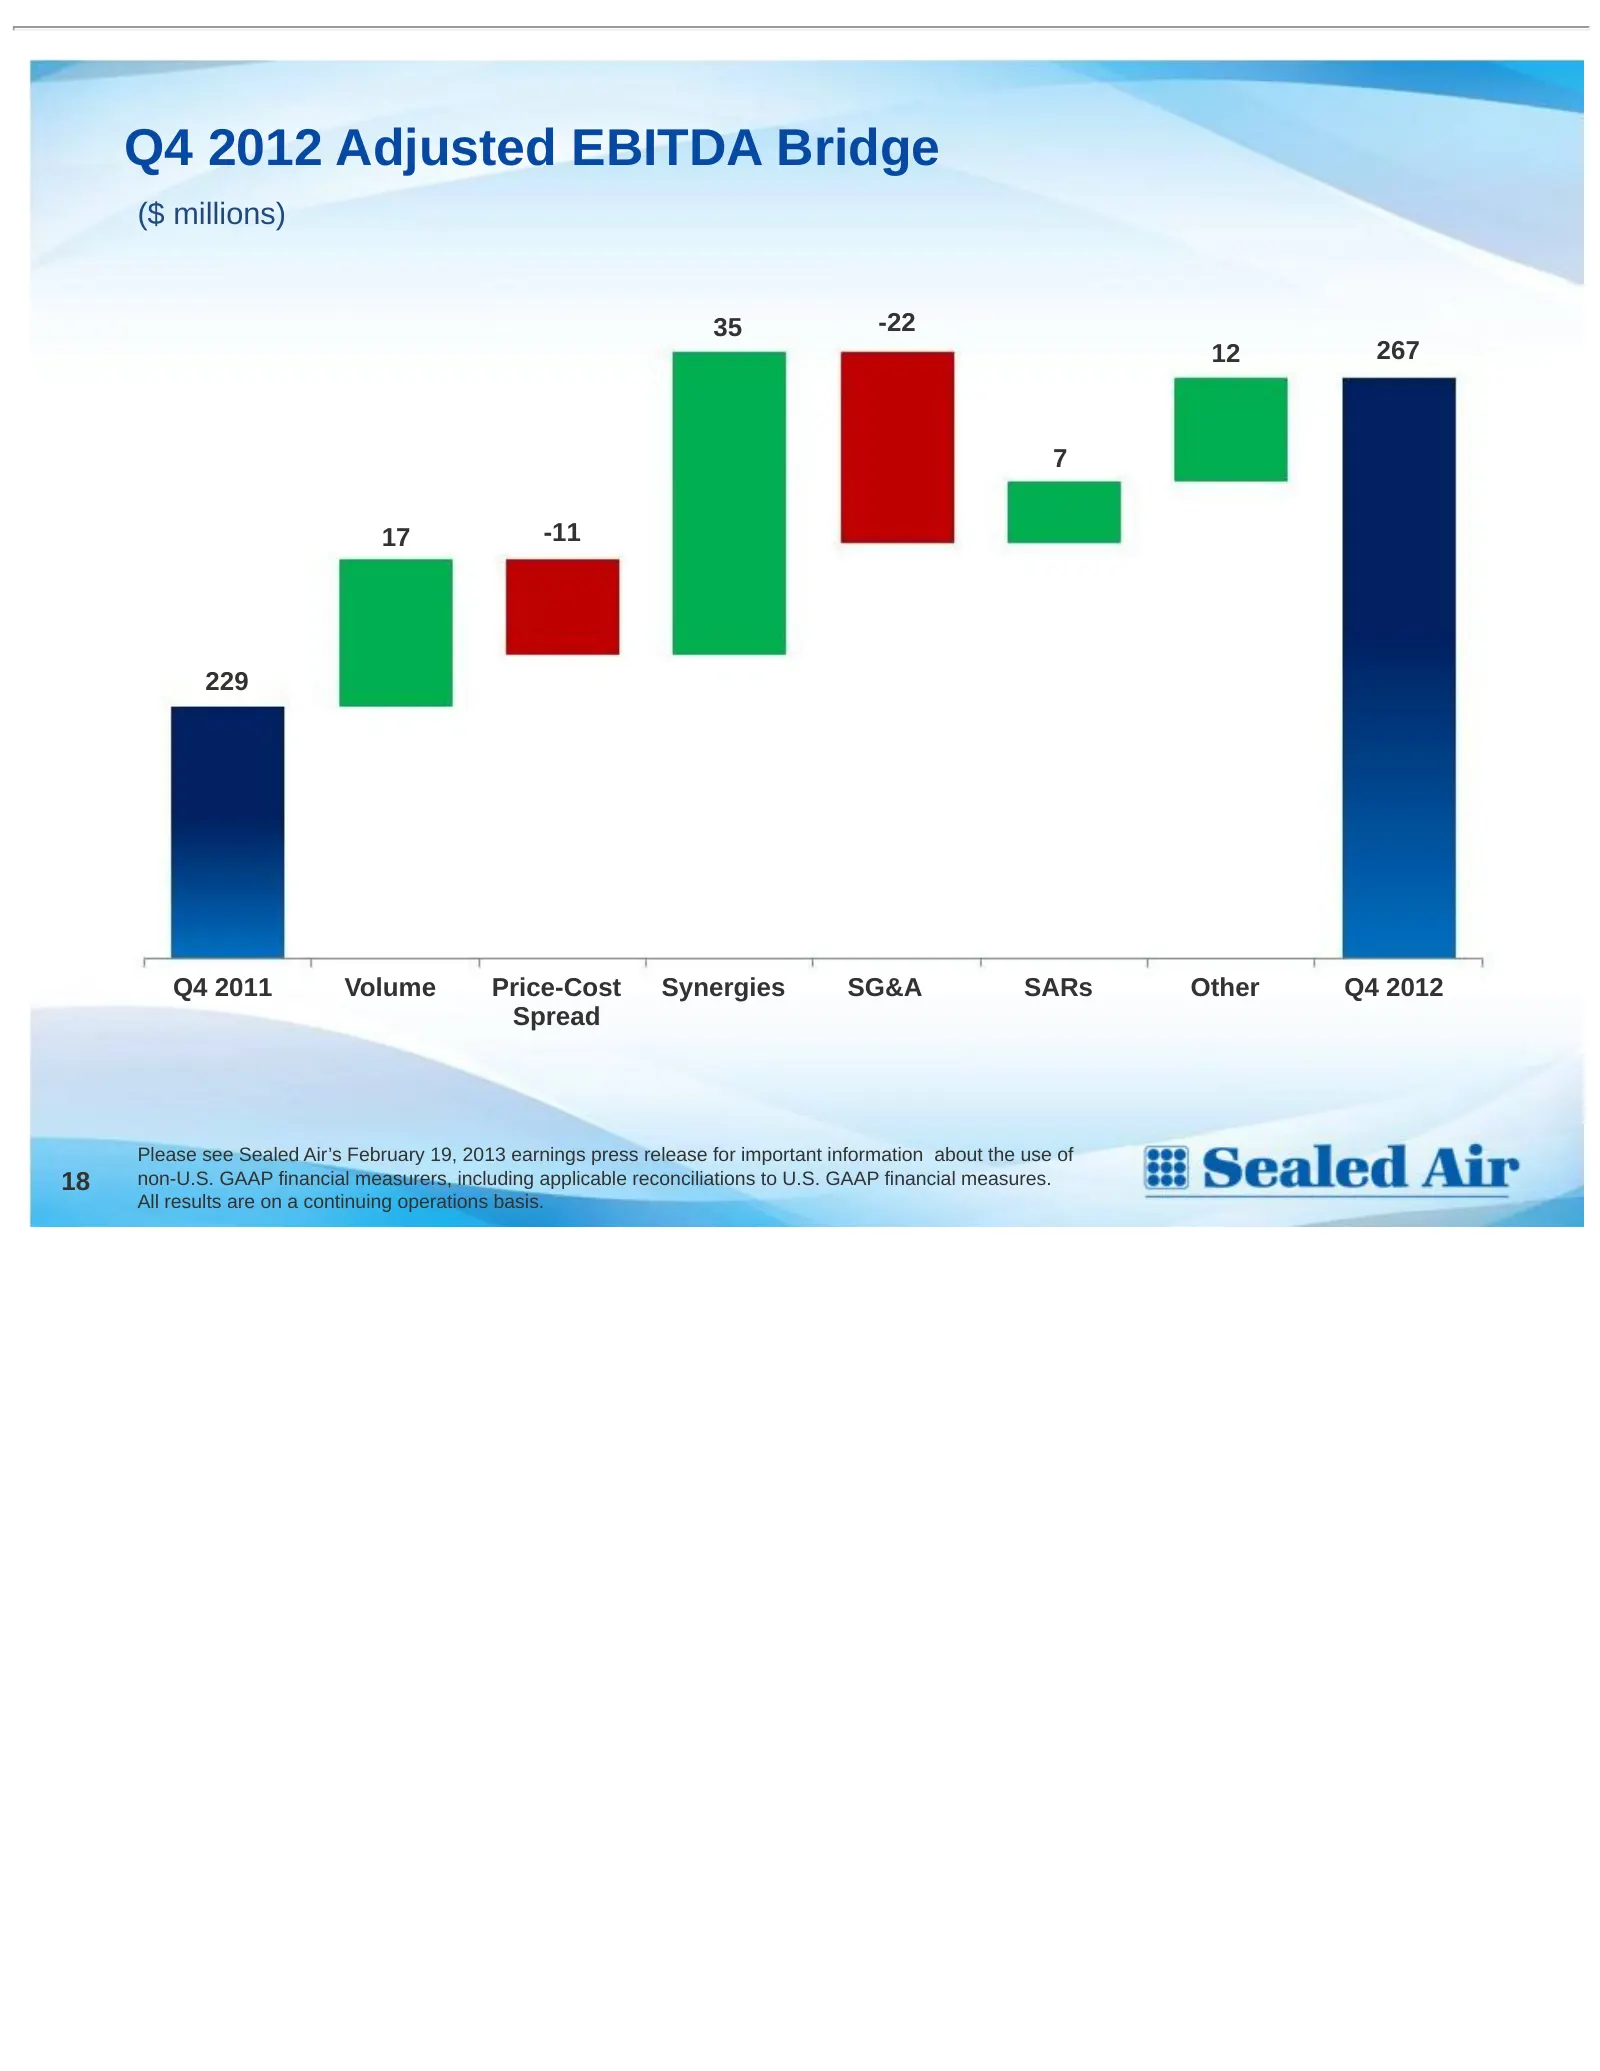
Q4 2012 Adjusted EBITDA Bridge ($ millions) 35 -22 12 267 7 17 -11 229 Q4 2011 Volume Price-Cost Synergies SG&A SARs Other Q4 2012 Spread Please see Sealed Air’s February 19, 2013 earnings press release for important information about the use of 18 non-U.S. GAAP financial measurers, including applic
Slide 20: Reconciliation of US GAAP Gross Profit and Operating Profit to Non-U.S. GAAP
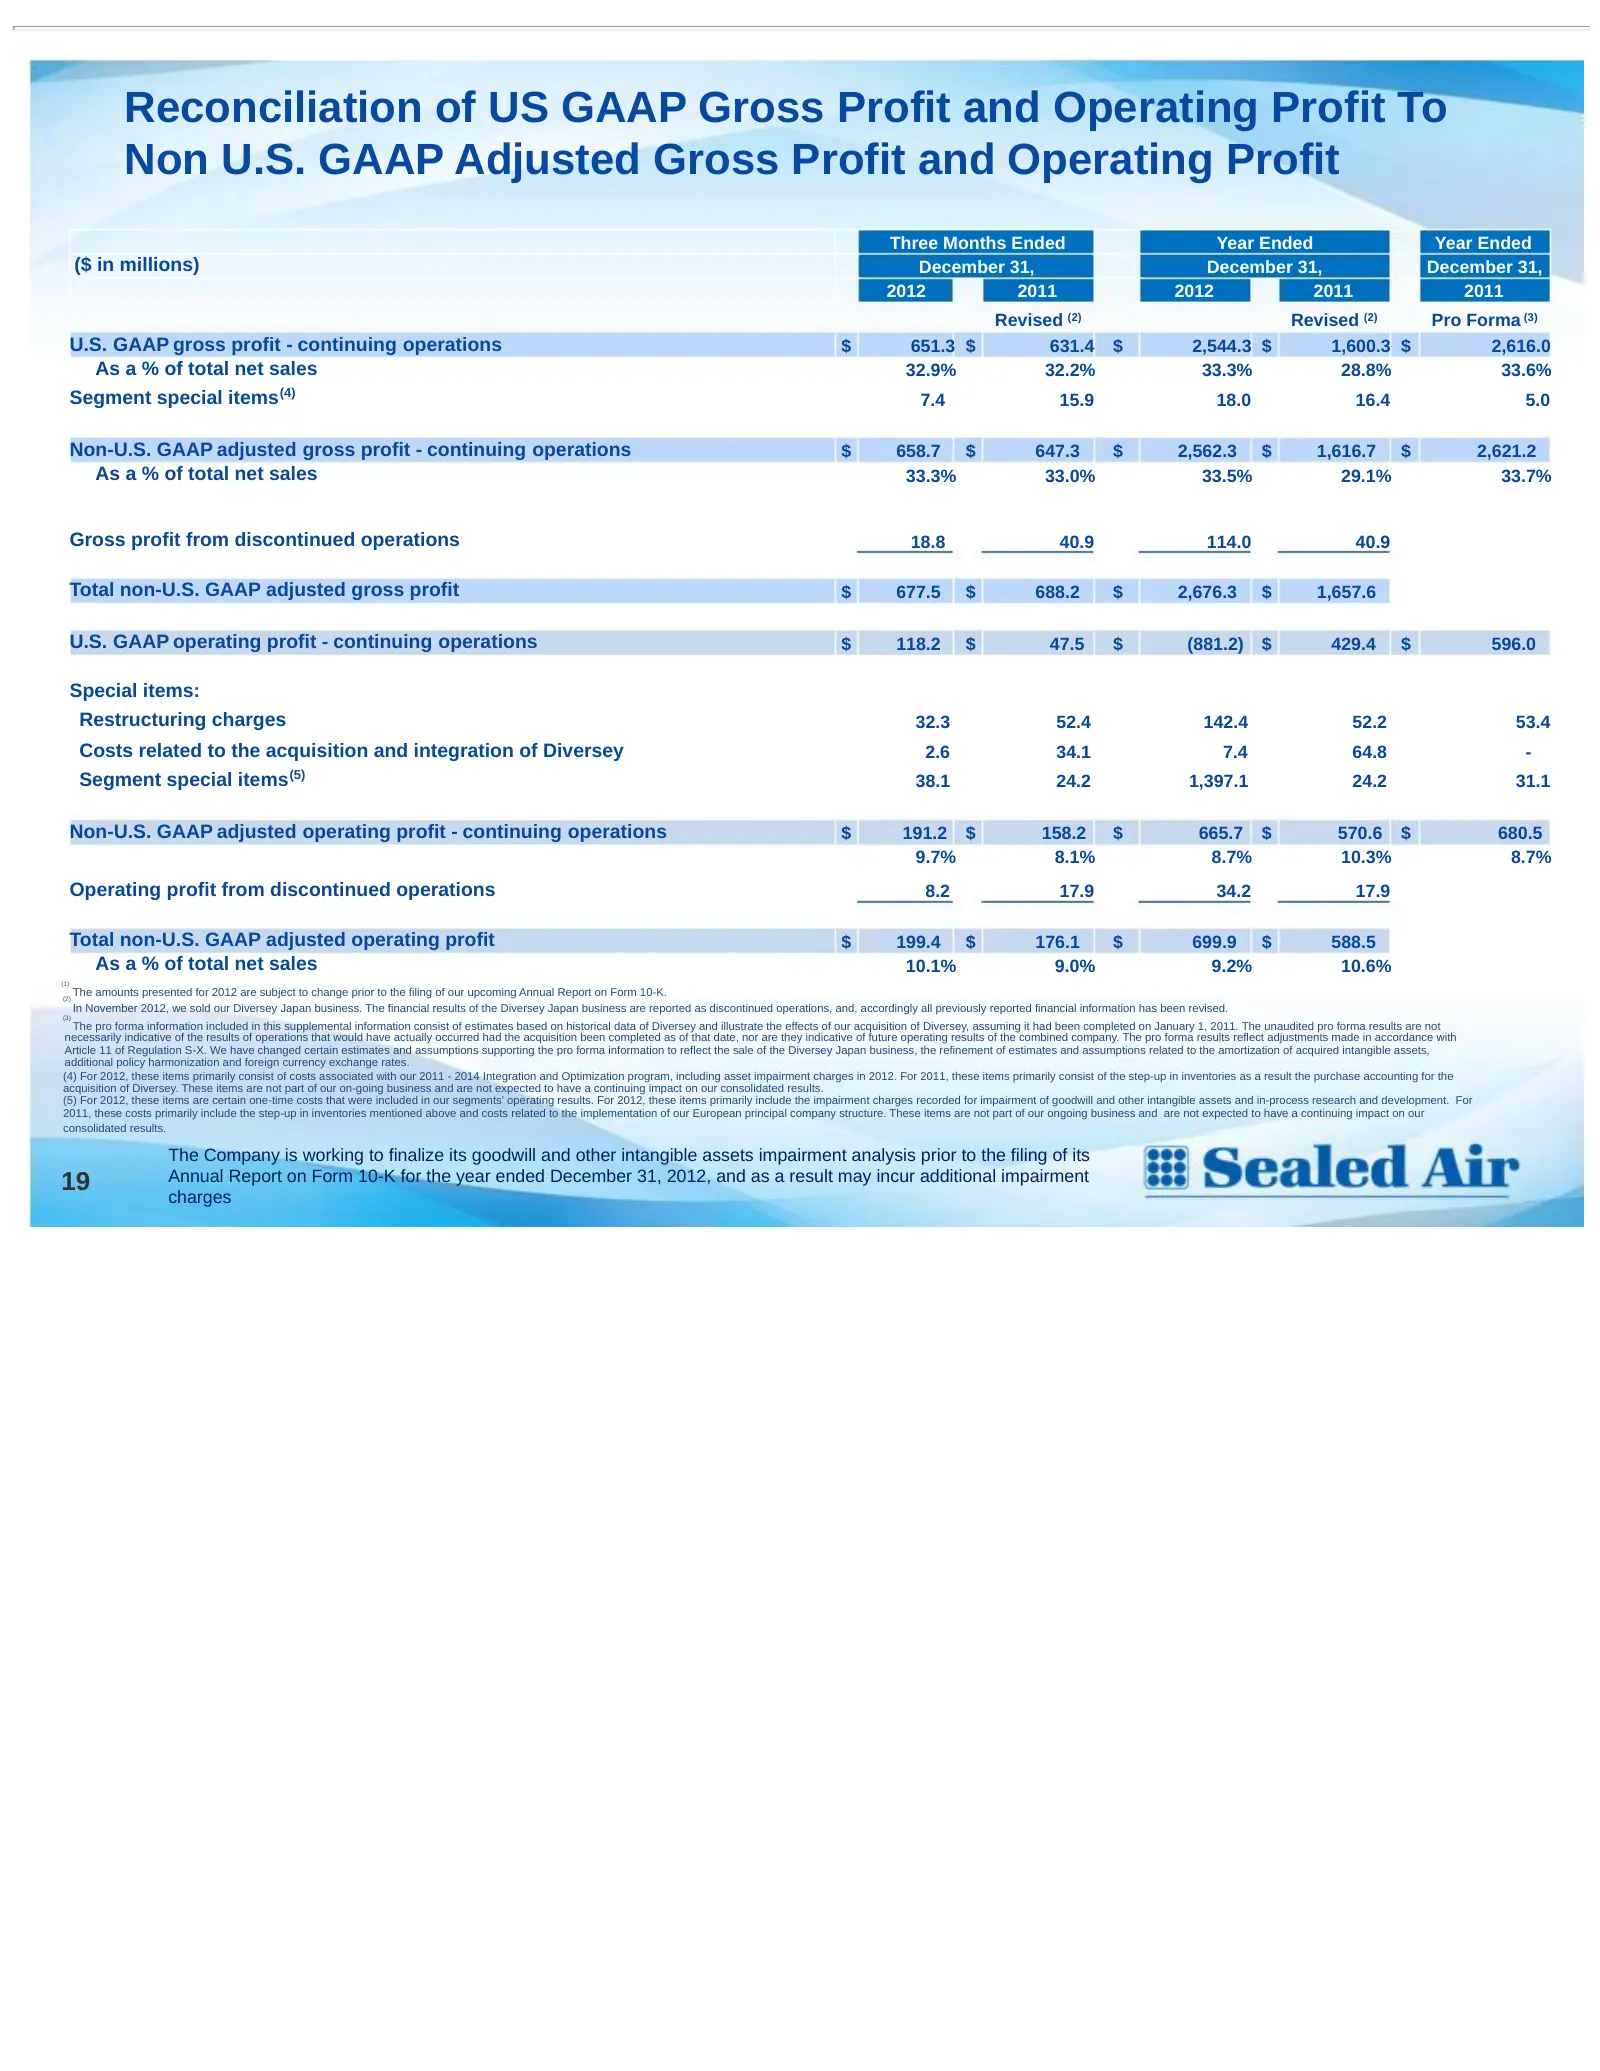
Reconciliation of US GAAP Gross Profit and Operating Profit To Non U.S. GAAP Adjusted Gross Profit and Operating Profit Three Months Ended Year Ended Year Ended ($ in millions) December 31, December 31, December 31, 2012 2011 2012 2011 2011 Revised (2) Revised (2) Pro Forma (3) U.S. GAAP gross profi
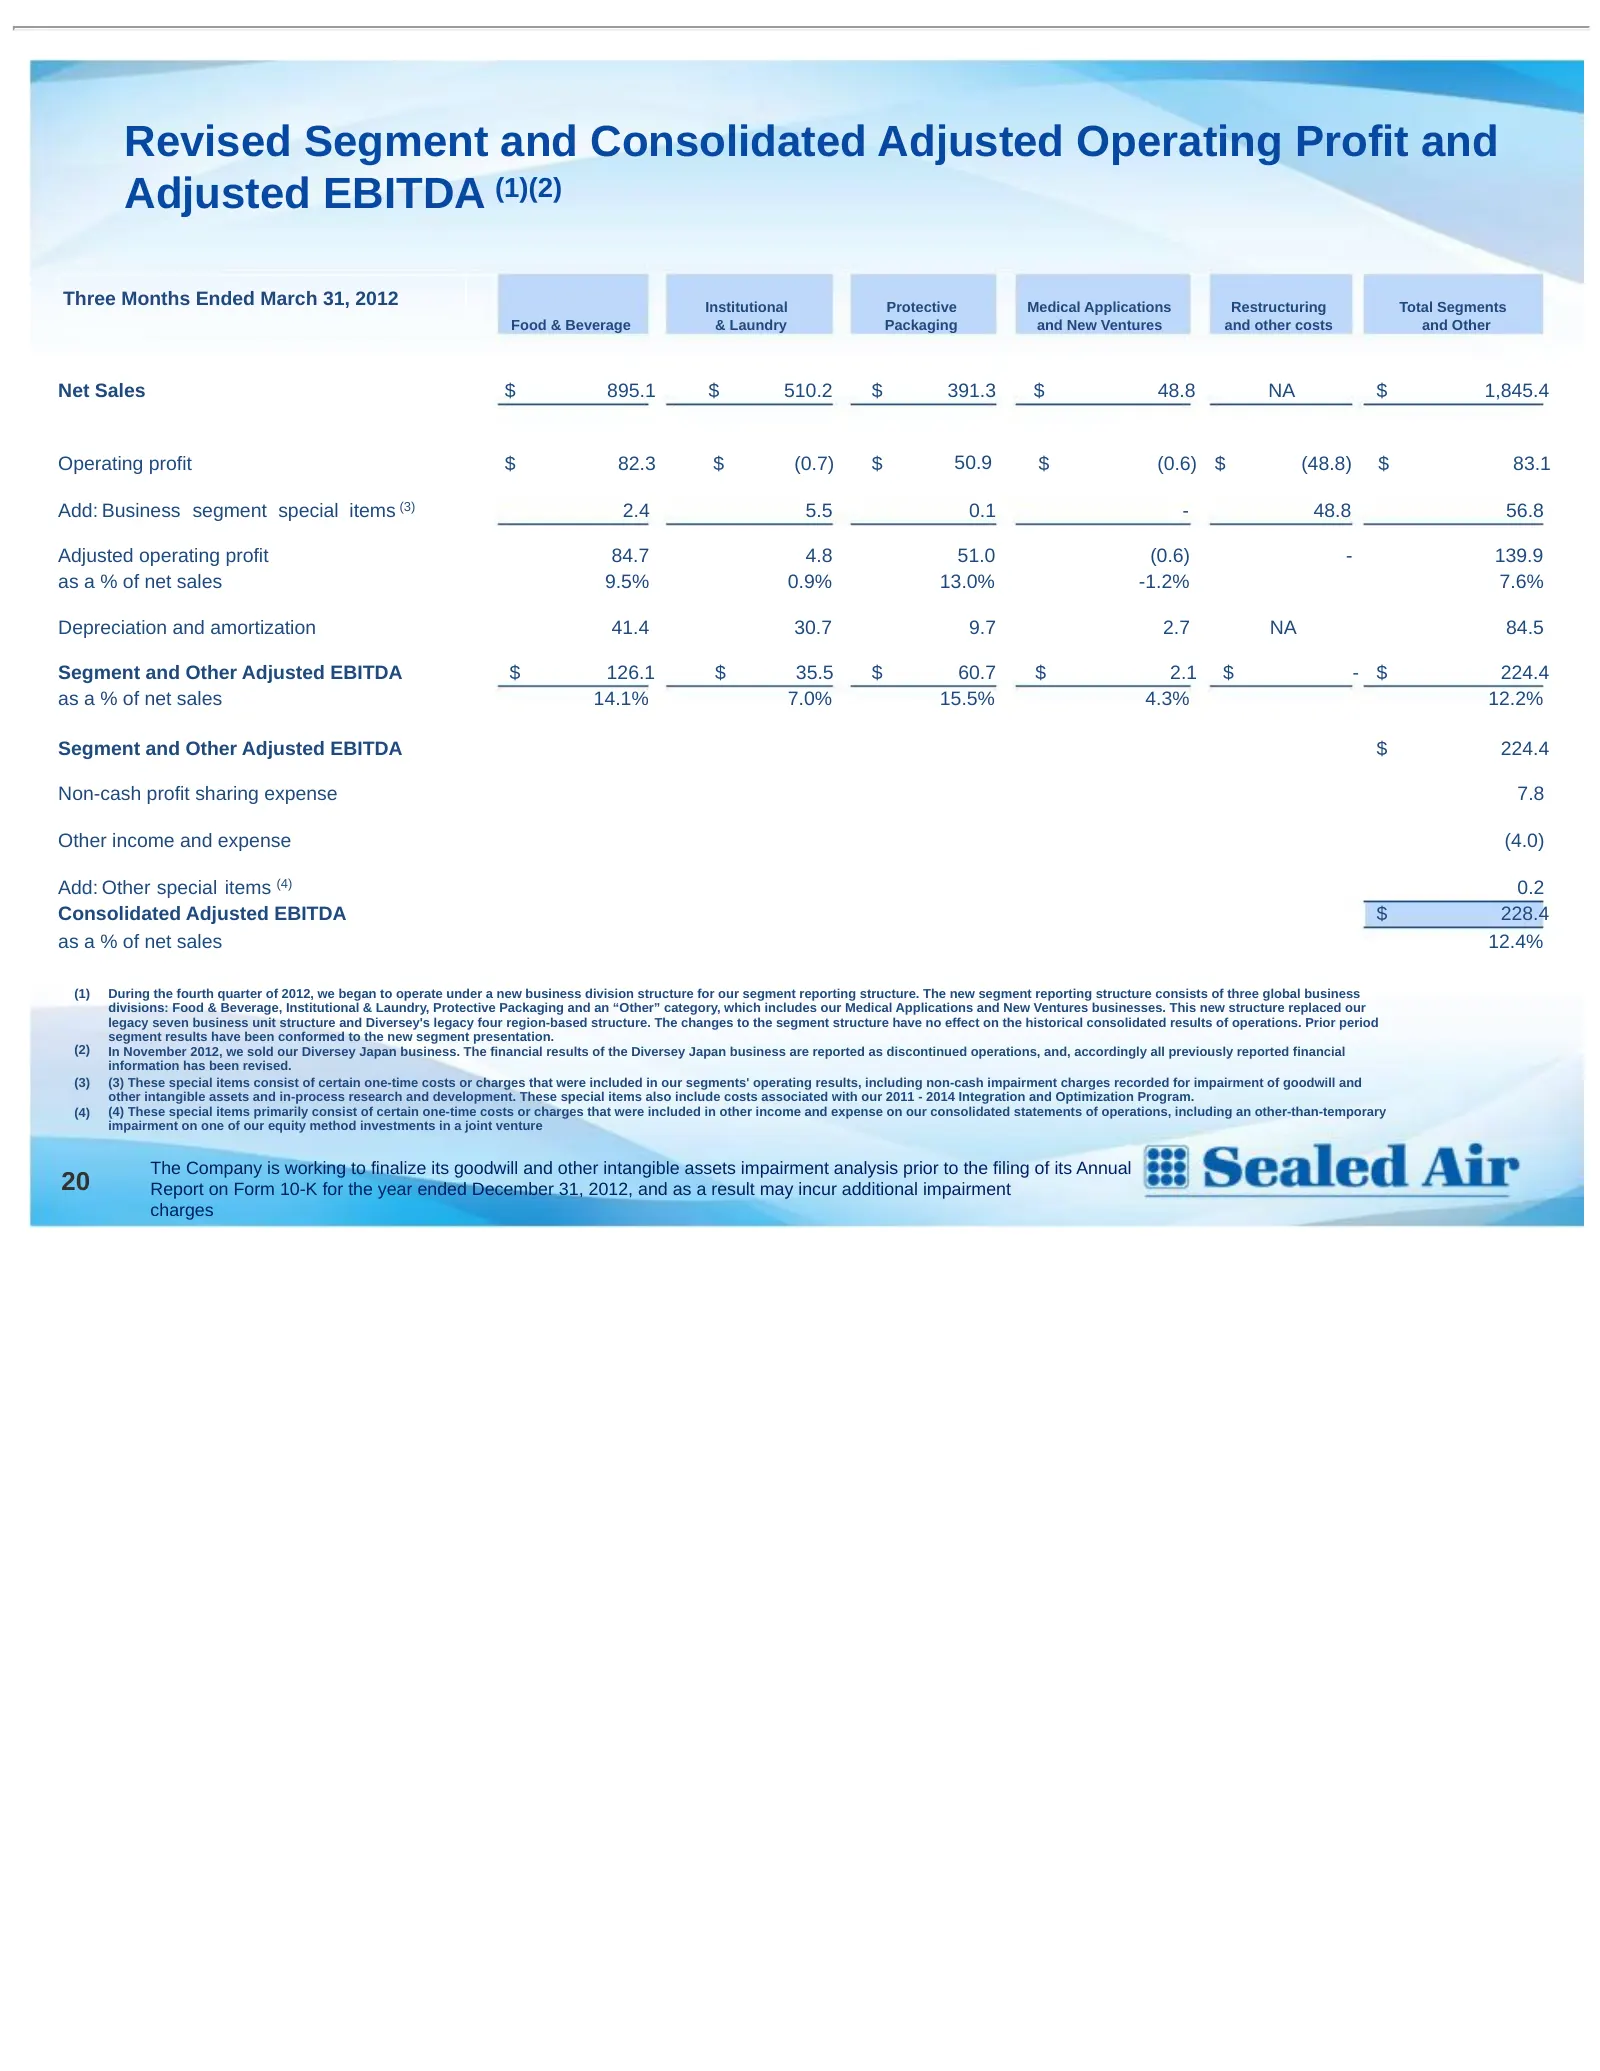
Slide 21: Revised Segment and Consolidated Adjusted Operating Profit and Adjusted EBITDA – Q1 2012
Revised Segment and Consolidated Adjusted Operating Profit and Adjusted EBITDA (1)(2) Three Months Ended March 31, 2012 Institutional Protective Medical Applications Restructuring Total Segments Food & Beverage & Laundry Packaging and New Ventures and other costs and Other Net Sales $ 895.1 $ 510.2
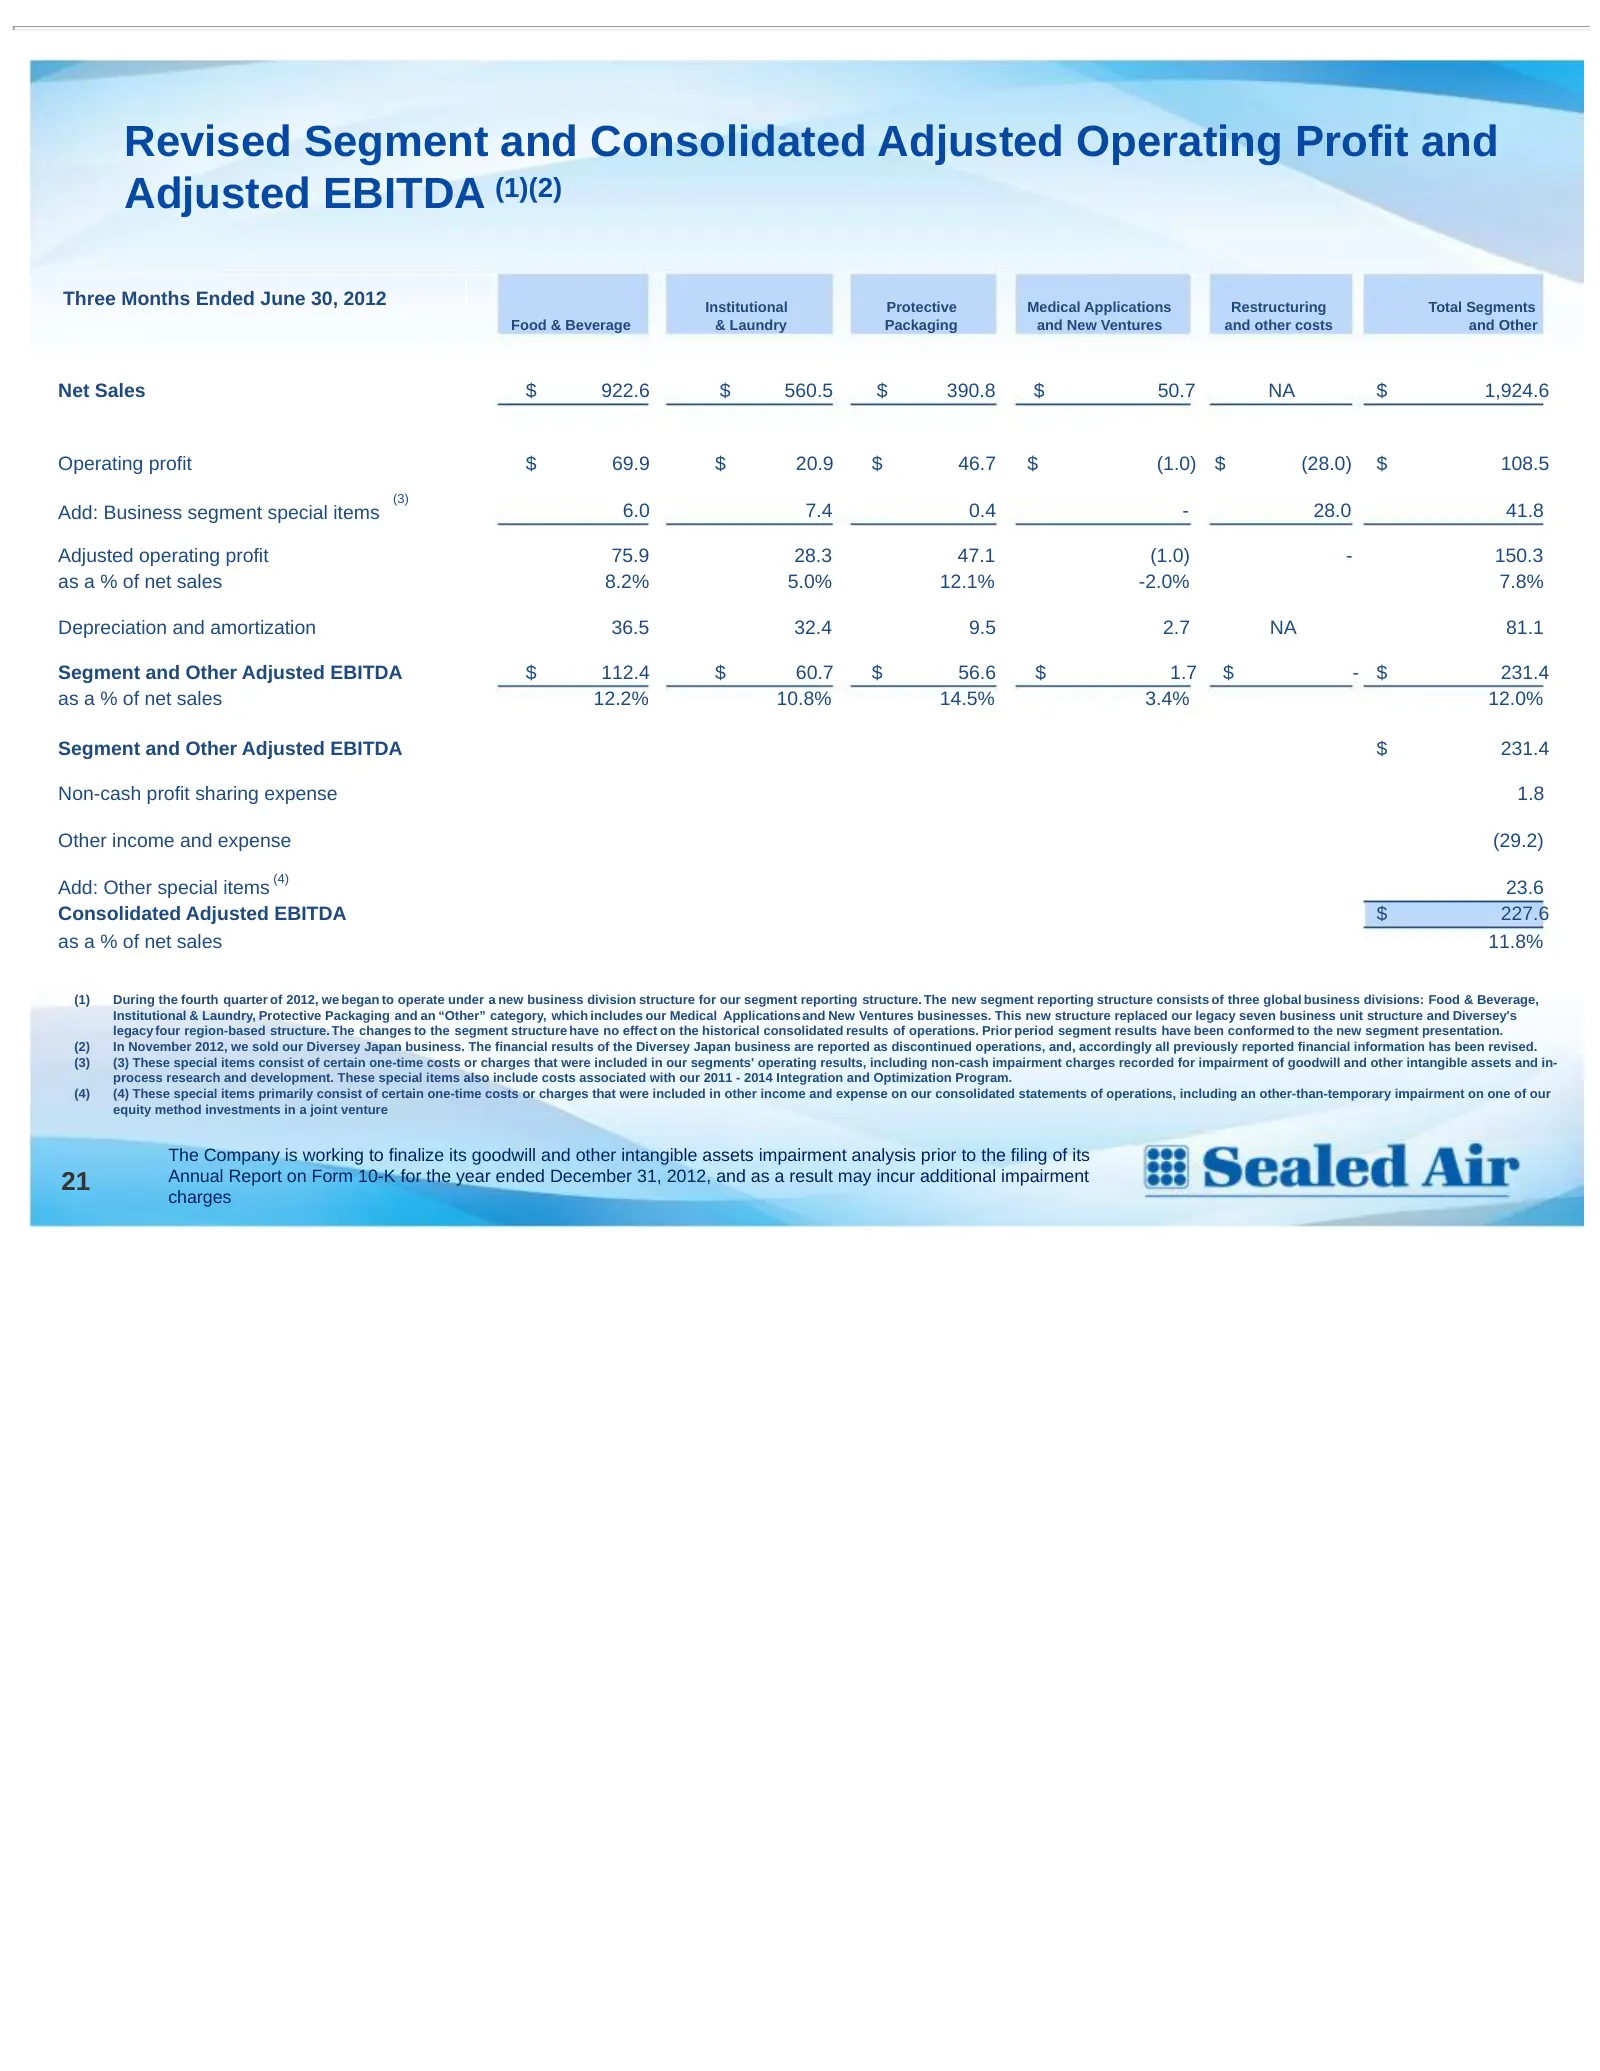
Slide 22: Revised Segment and Consolidated Adjusted Operating Profit and Adjusted EBITDA – Q2 2012
Revised Segment and Consolidated Adjusted Operating Profit and Adjusted EBITDA (1)(2) Three Months Ended June 30, 2012 Institutional Protective Medical Applications Restructuring Total Segments Food & Beverage & Laundry Packaging and New Ventures and other costs and Other Net Sales $ 922.6 $ 560.5 $
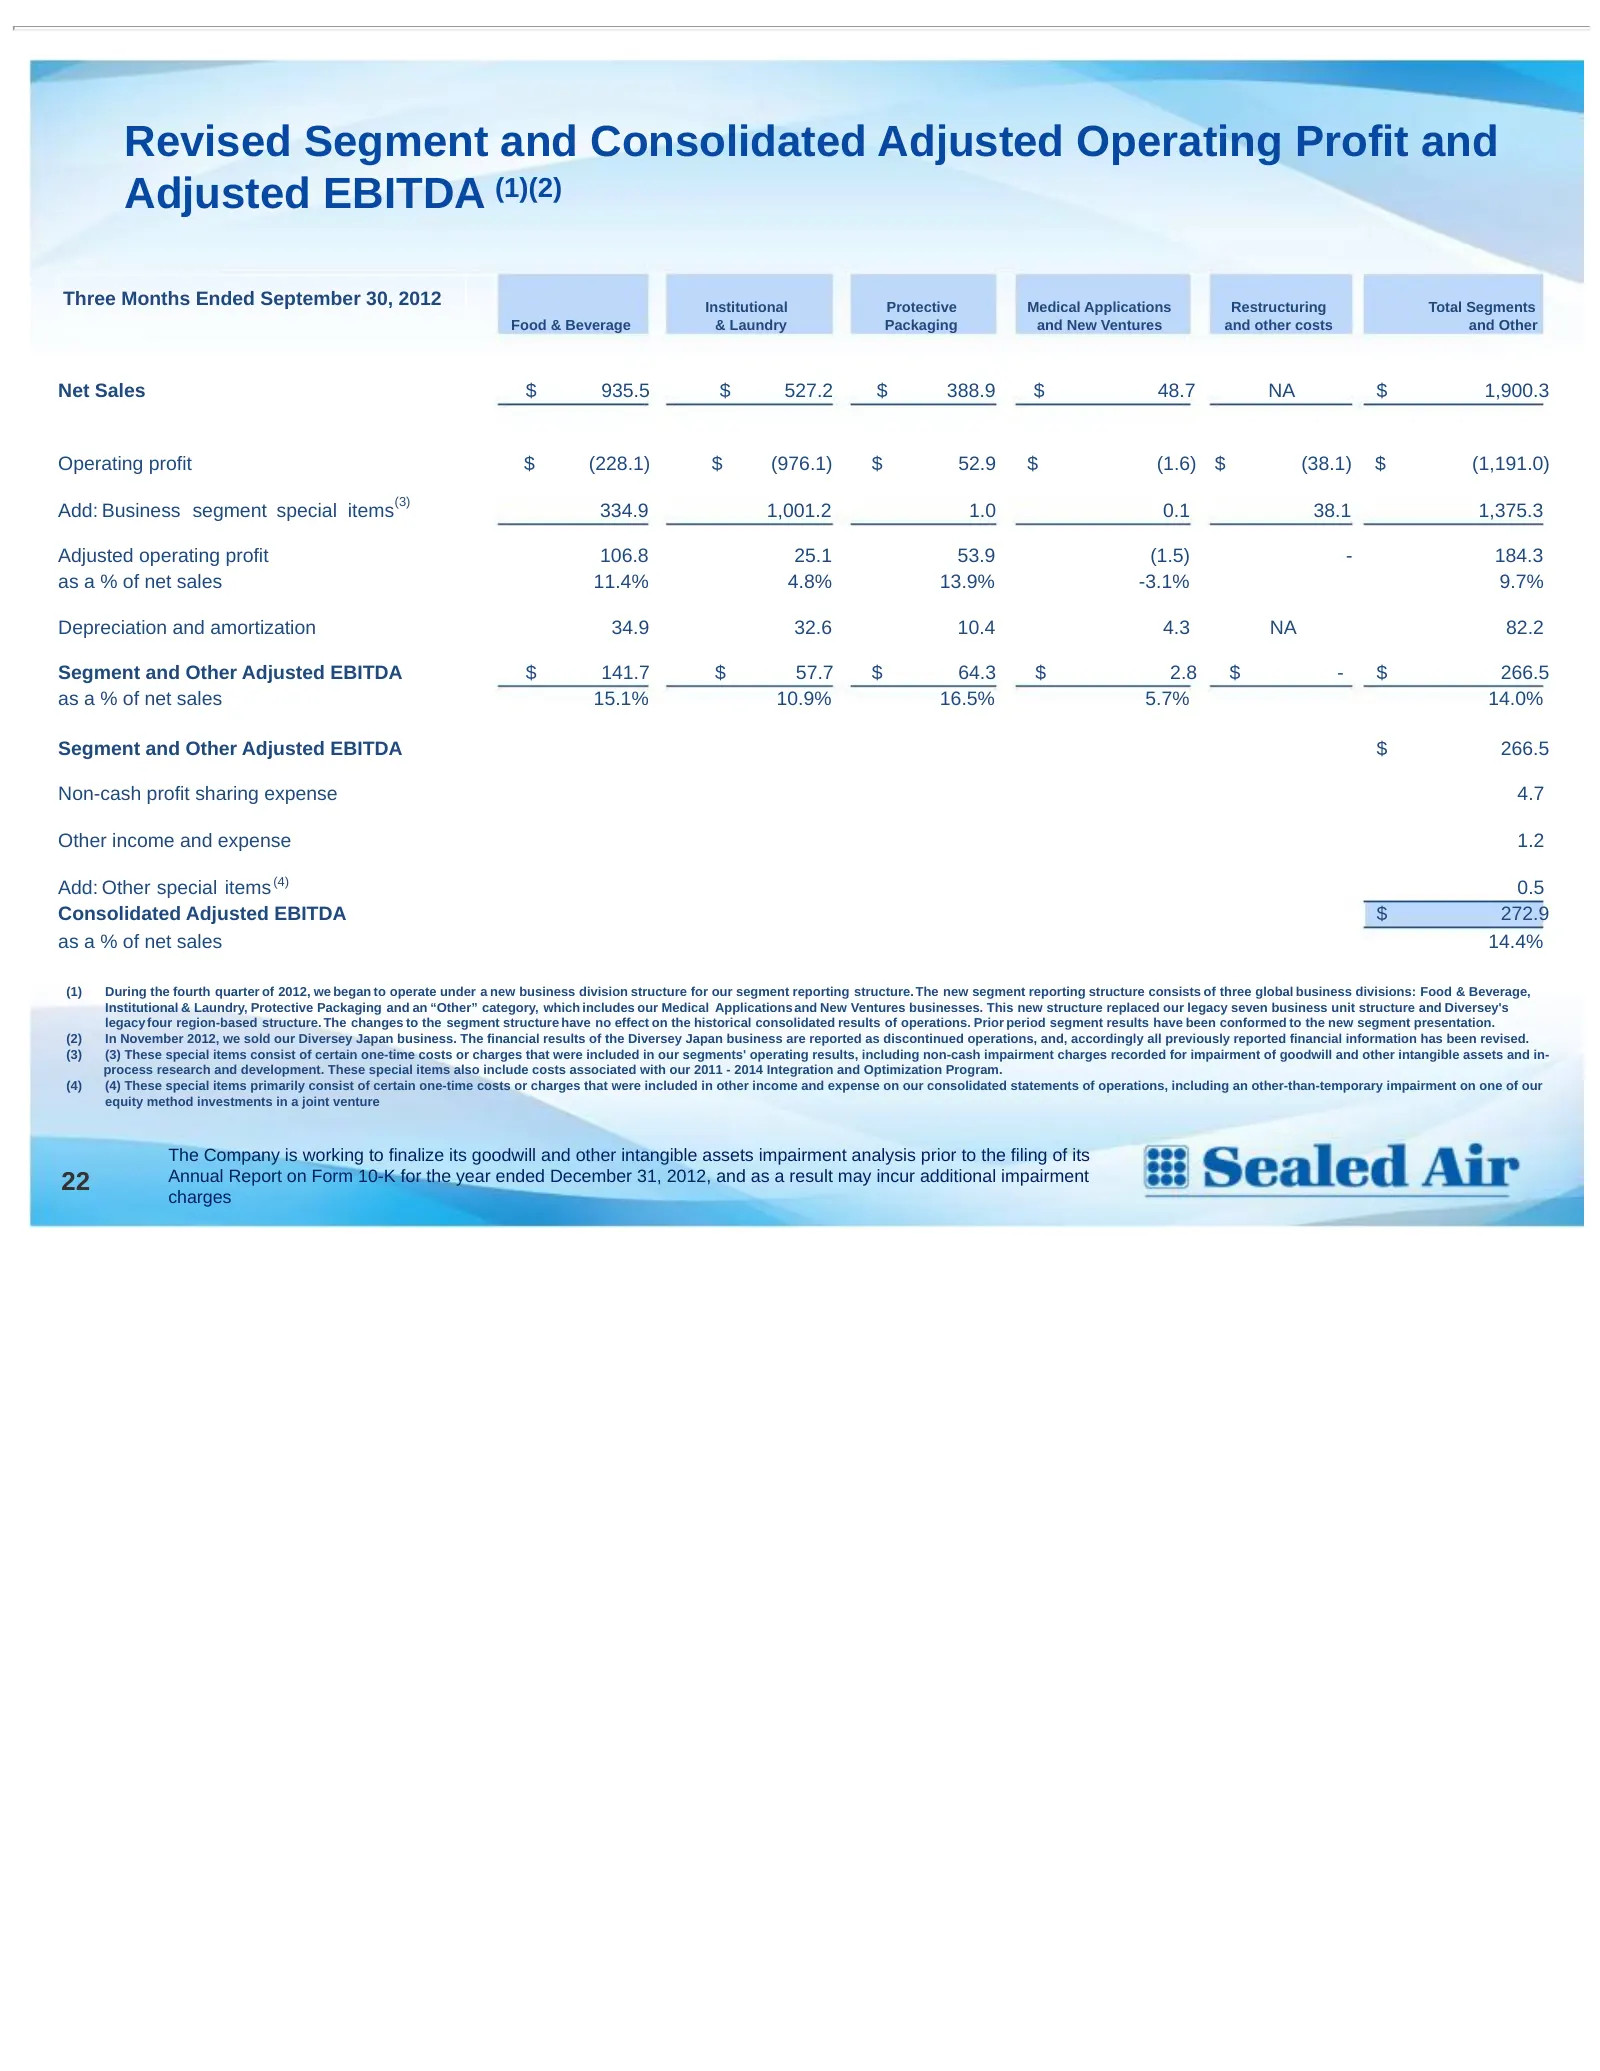
Slide 23: Revised Segment and Consolidated Adjusted Operating Profit and Adjusted EBITDA – Q3 2012
Revised Segment and Consolidated Adjusted Operating Profit and Adjusted EBITDA (1)(2) Three Months Ended September 30, 2012 Institutional Protective Medical Applications Restructuring Total Segments Food & Beverage & Laundry Packaging and New Ventures and other costs and Other Net Sales $ 935.5 $ 52
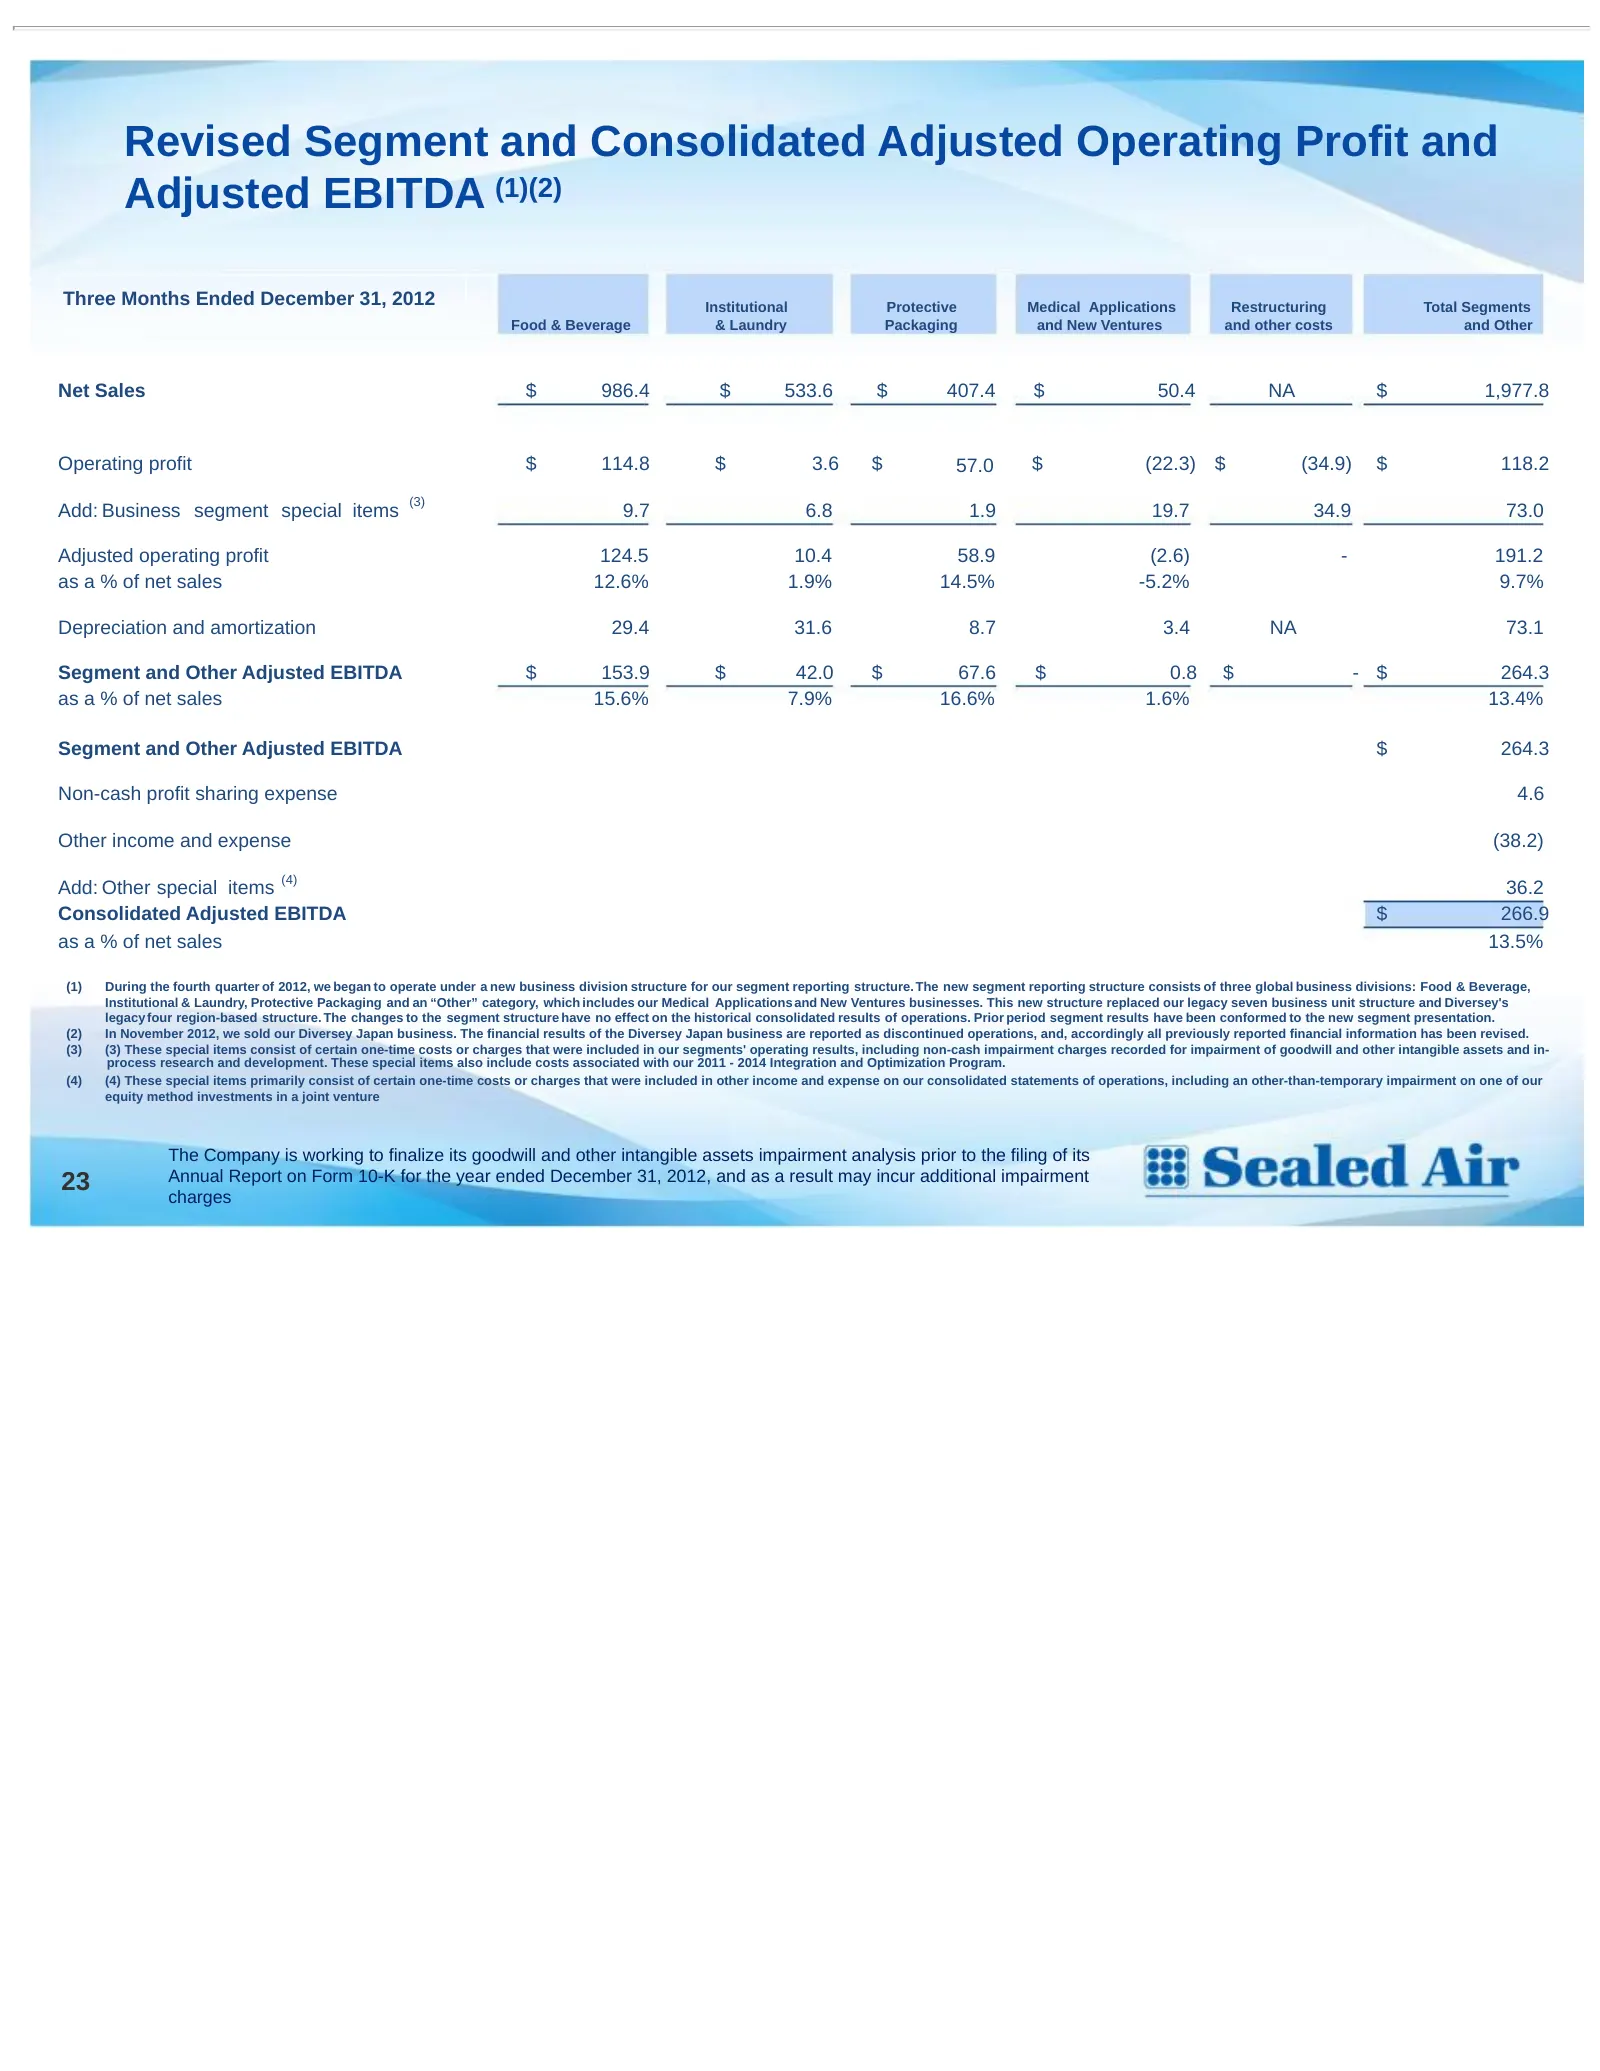
Slide 24: Revised Segment and Consolidated Adjusted Operating Profit and Adjusted EBITDA – Q4 2012
Revised Segment and Consolidated Adjusted Operating Profit and Adjusted EBITDA (1)(2) Three Months Ended December 31, 2012 Institutional Protective Medical Applications Restructuring Total Segments Food & Beverage & Laundry Packaging and New Ventures and other costs and Other Net Sales $ 986.4 $ 533
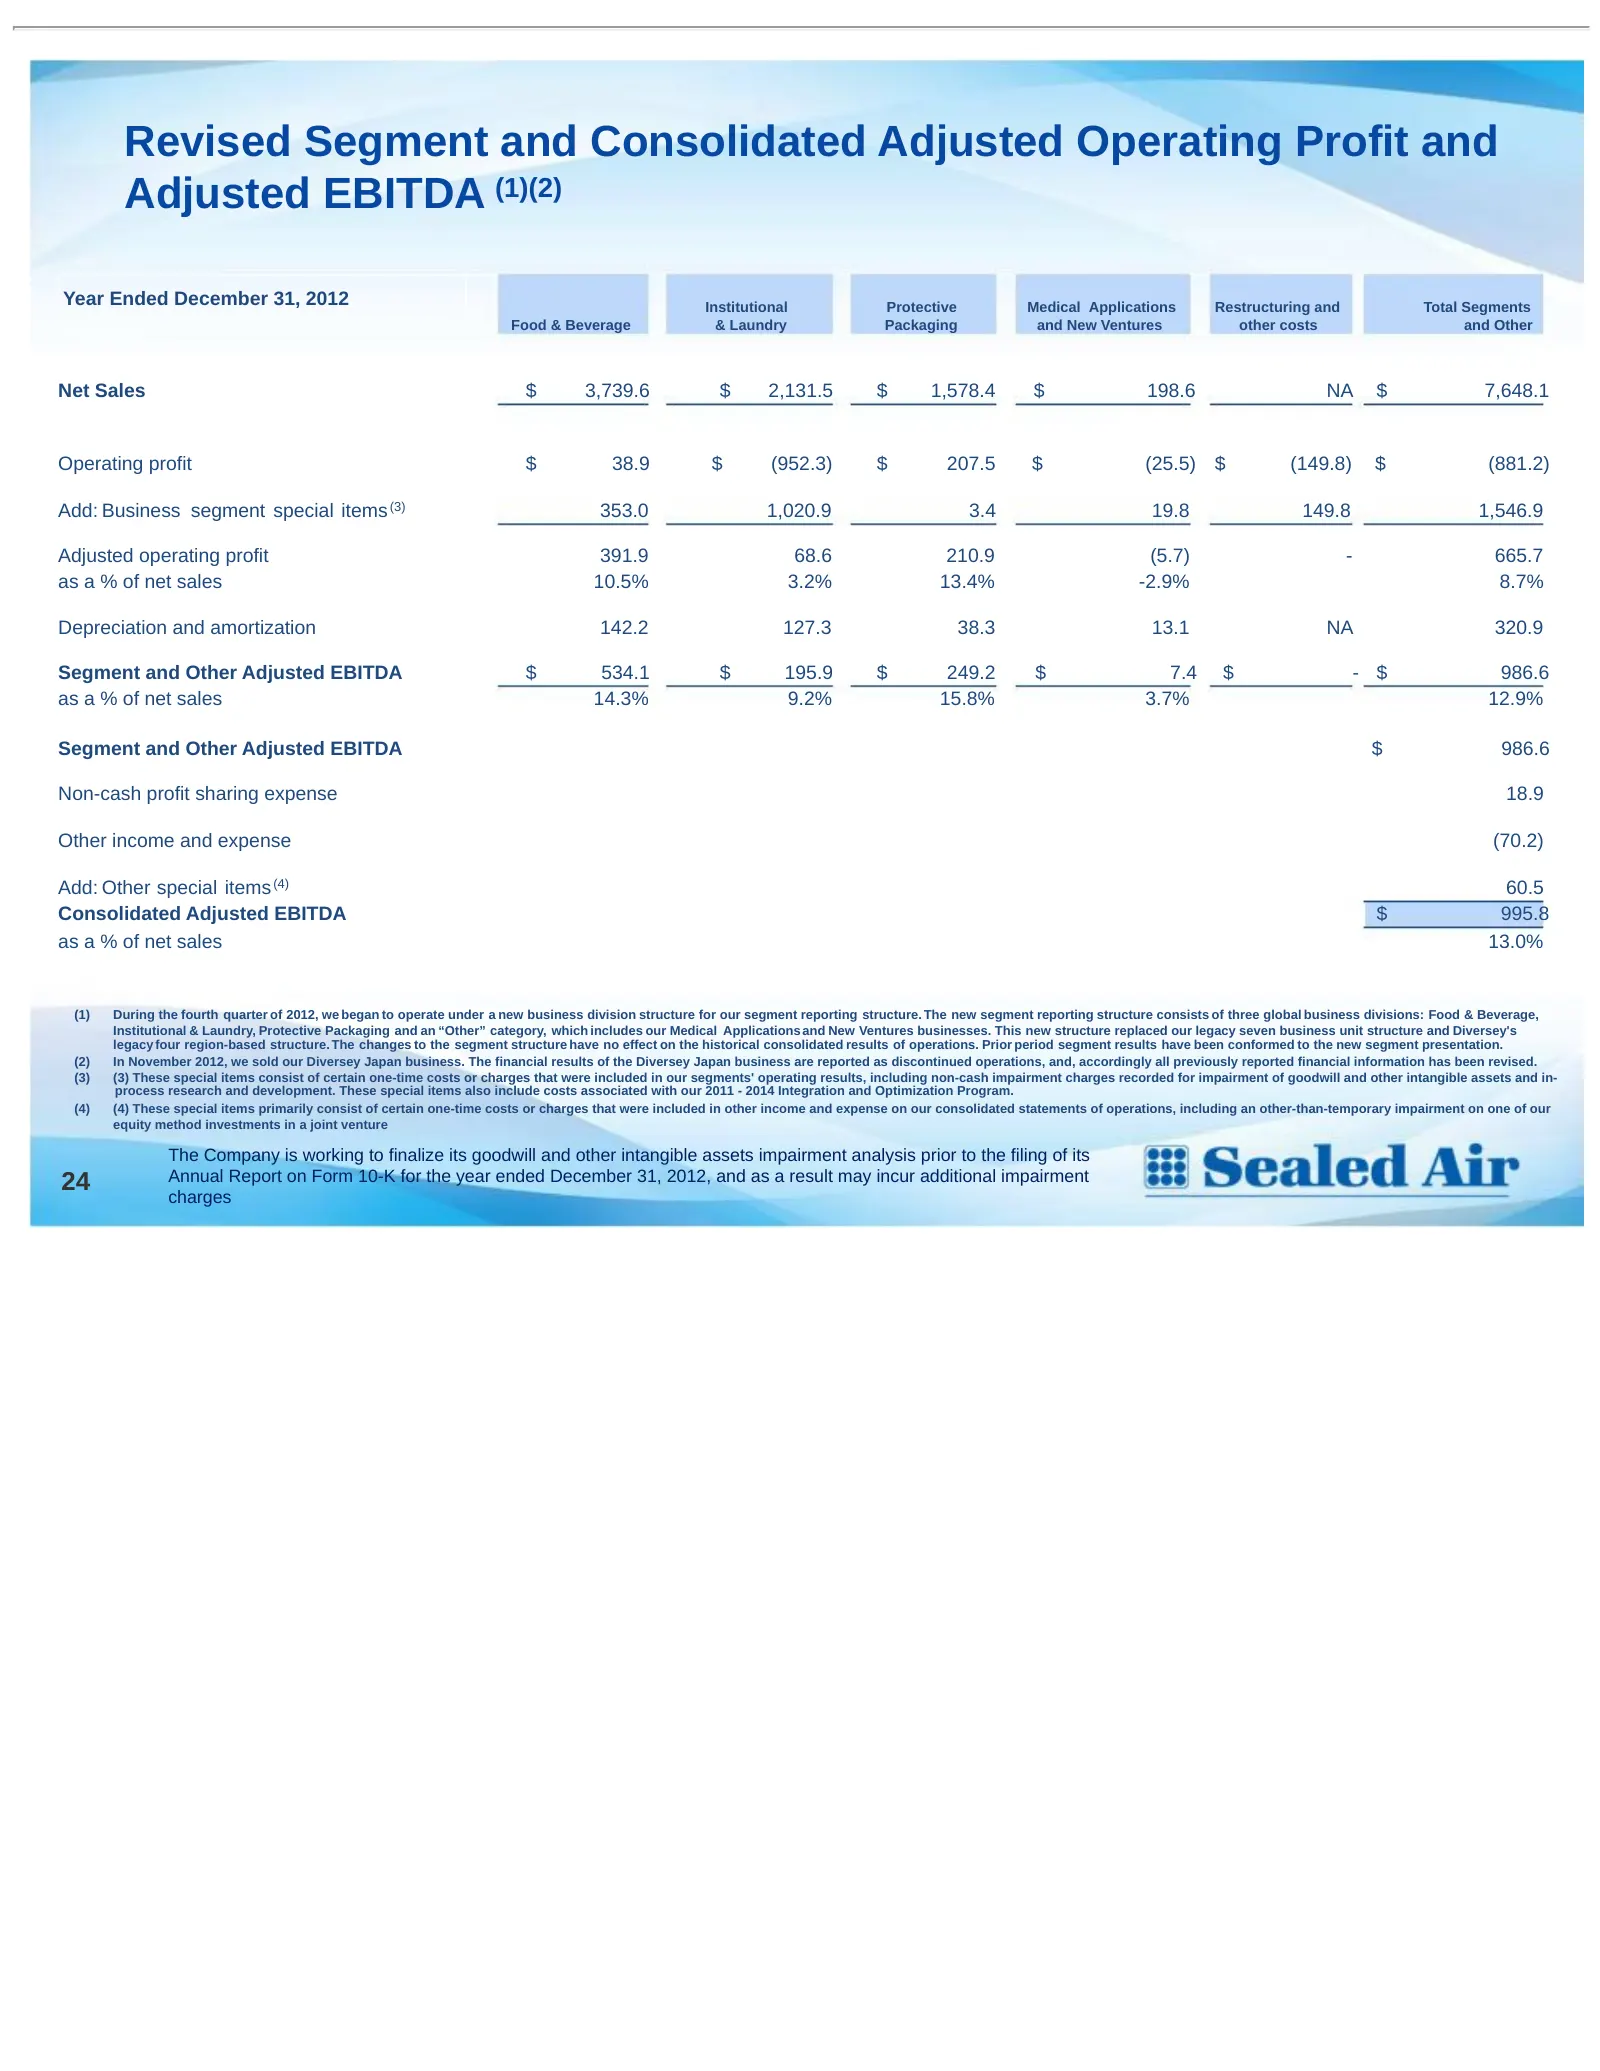
Slide 25: Revised Segment and Consolidated Adjusted Operating Profit and Adjusted EBITDA – Year 2012
Revised Segment and Consolidated Adjusted Operating Profit and Adjusted EBITDA (1)(2) Year Ended December 31, 2012 Institutional Protective Medical Applications Restructuring and Total Segments Food & Beverage & Laundry Packaging and New Ventures other costs and Other Net Sales $ 3,739.6 $ 2,131.5 $
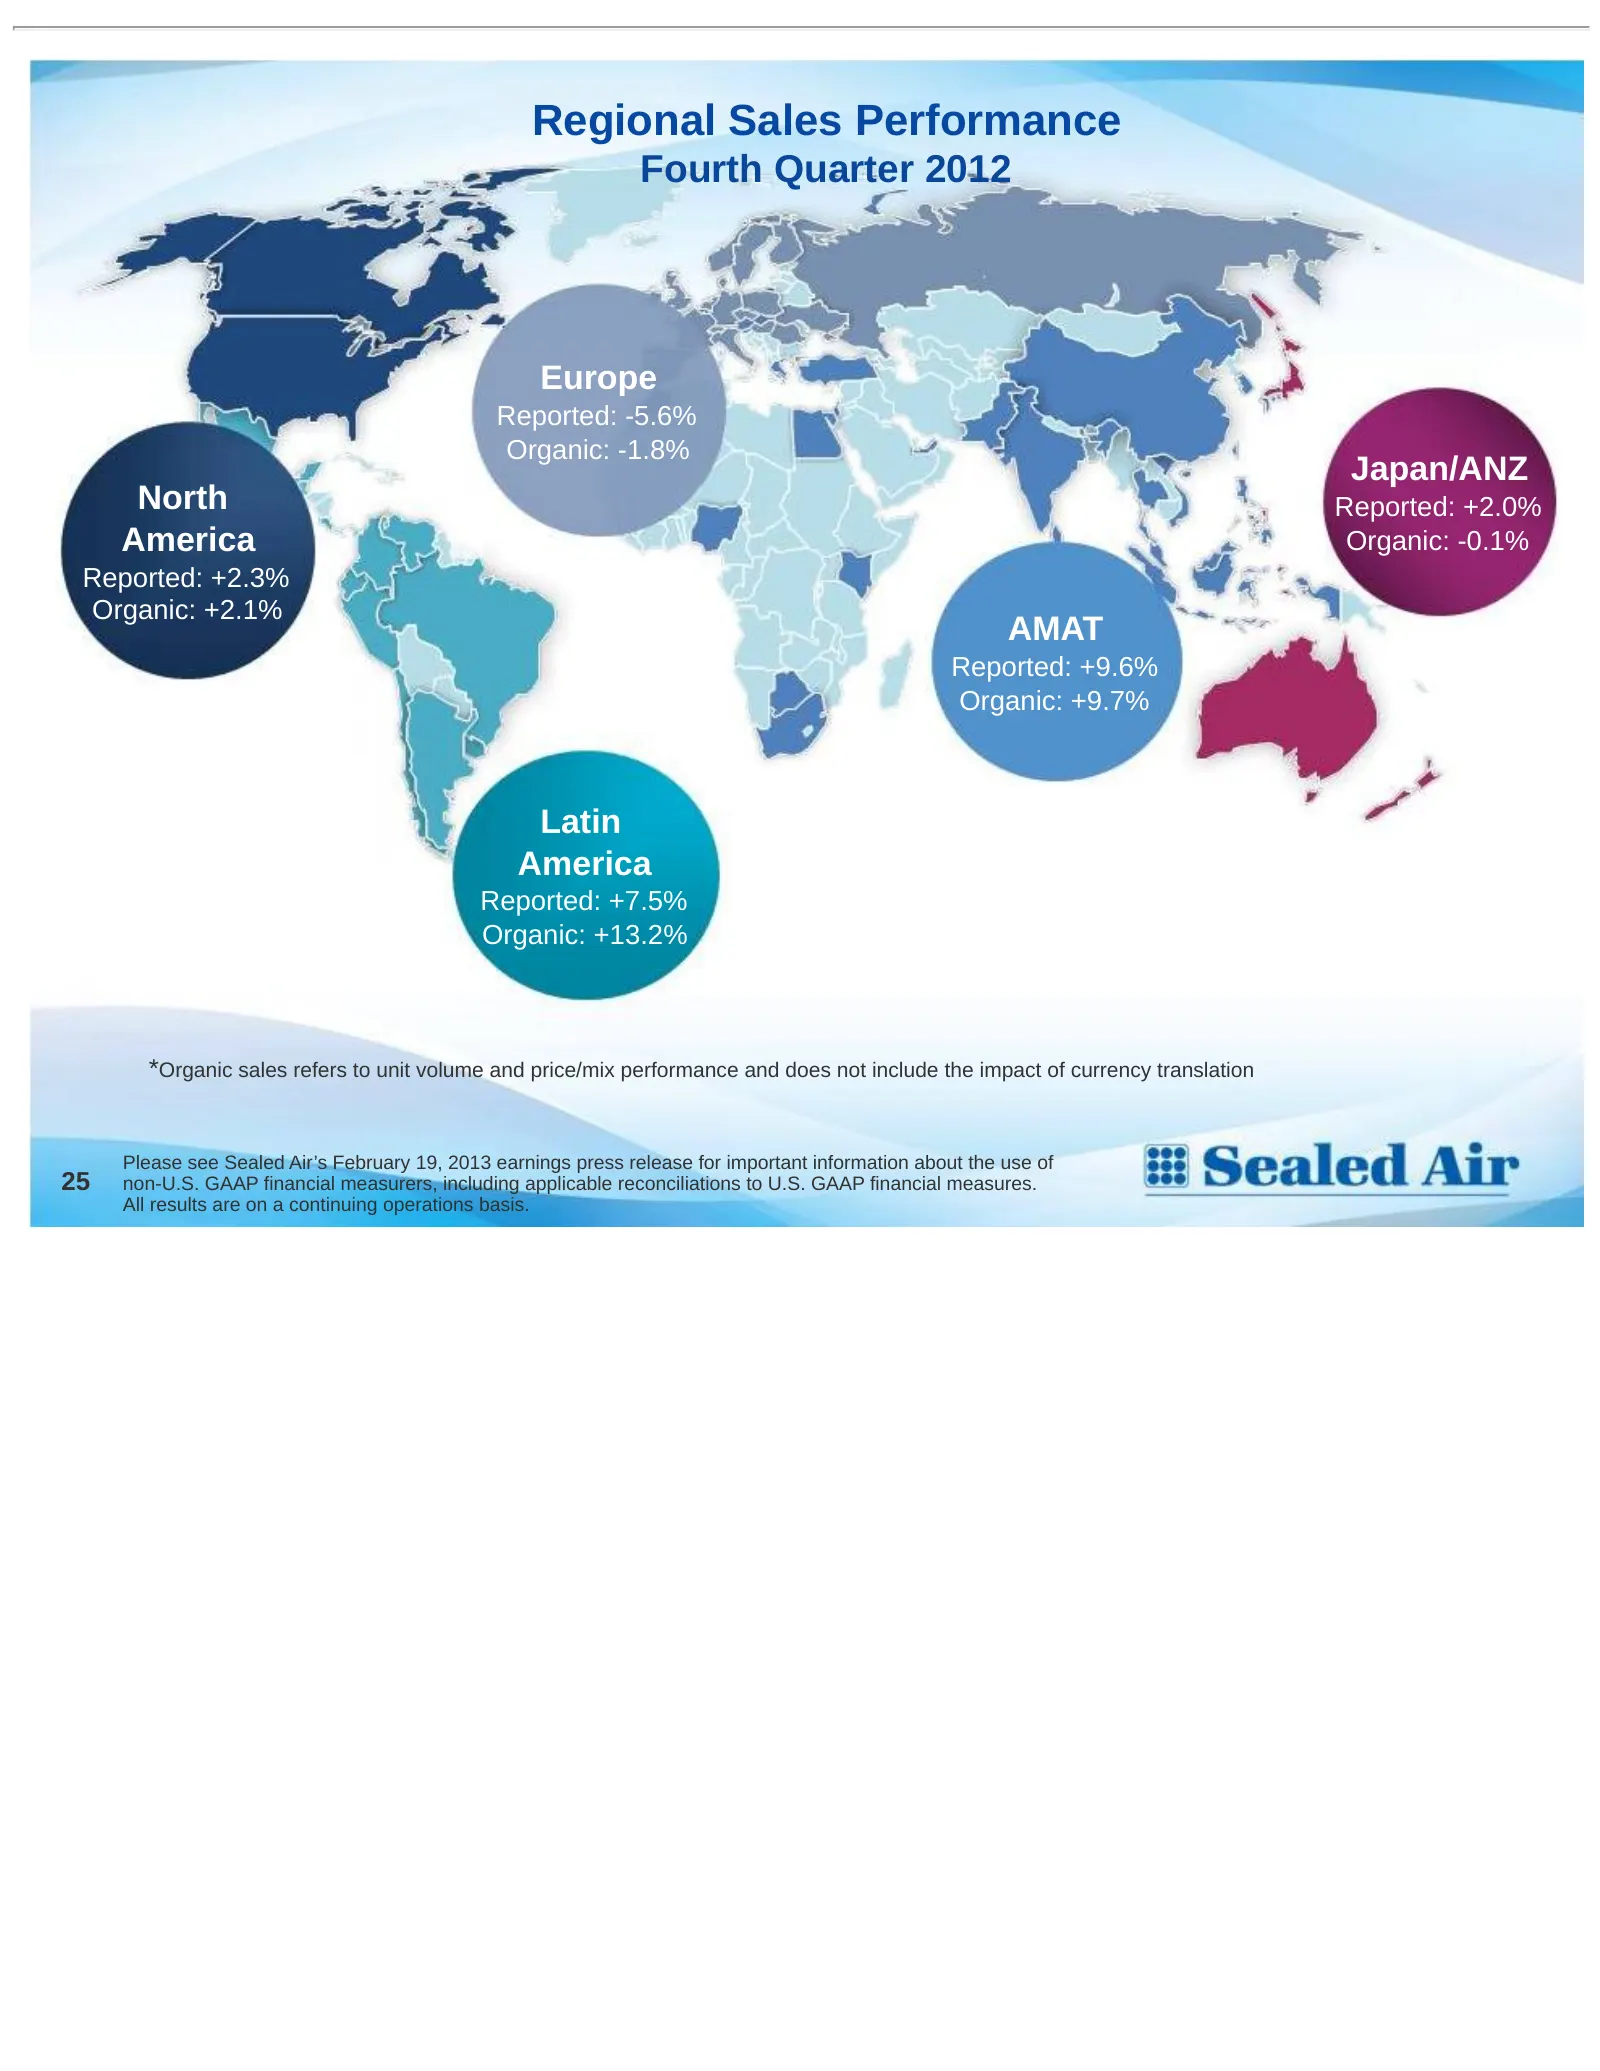
Slide 26: Regional Sales Performance
Regional Sales Performance Fourth Quarter 2012 Europe Reported: -5.6% Organic: -1.8% Japan/ANZ North Reported: +2.0% America Organic: -0.1% Reported: +2.3% Organic: +2.1% AMAT Reported: +9.6% Organic: +9.7% Latin America Reported: +7.5% Organic: +13.2% *Organic sales refers to unit volume and price/
Source: SEC EDGAR · 8-K filed Feb 25, 2013
More decks from Sealed Air Corporation
 Q3 2025 Earnings Presentation17 slides · Nov 4, 2025
 Q2 2025 Earnings Presentation17 slides · Aug 5, 2025
 Q1 2025 Earnings Presentation15 slides · May 6, 2025
 Q4 2024 Earnings Presentation21 slides · Feb 25, 2025
 Q3 2024 Earnings Presentation20 slides · Nov 7, 2024
 Q2 2024 Earnings Presentation20 slides · Aug 8, 2024