CALGON CARBON — Wedbush Sustainability & Infrastructure Conference 2016
25 slides from CALGON CARBON's conference presentation, Mar 8, 2016
Slide 1: Wedbush Sustainability & Infrastructure Conference March 9, 2016
Wedbush Sustainability & Infrastructure Conference March 9, 2016
Slide 2: Safe Harbor Statement
Safe Harbor Statement Today’s presentation contains historical information and forward-looking statements. Forward-looking statements typically contain words such as “expect,” “believe,” “estimate,” “anticipate,” or similar words indicating that future outcomes are uncertain. Statements looking forw
Slide 3: Agenda
Agenda Calgon Carbon’s Products and ServicesFinancial OverviewDrivers of Sales GrowthMercury RemovalNorth American Drinking WaterReactivationBallast Water TreatmentDrivers of Value CreationCost Improvement ProgramInvesting in Existing PlantsRevenue Growth Focus M&ACapital Allocation Program
Slide 4: Company Profile
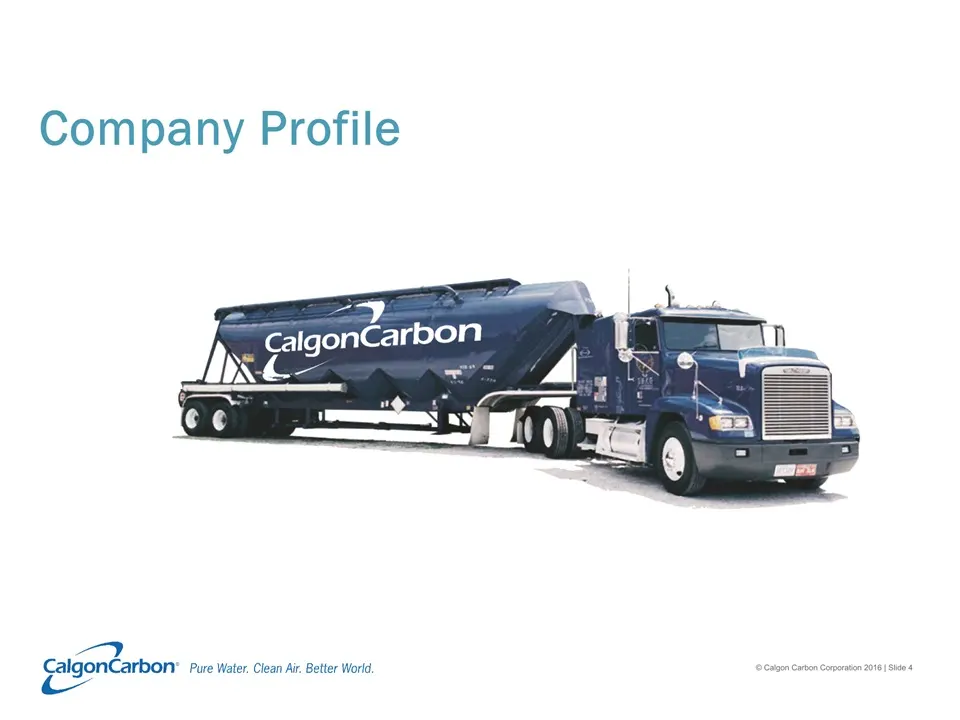
Company Profile = aim } “CalgonCarbon Hh — yy CalgonCarbon® Pure Water. Clean Air. Better World,
Slide 5: Who We Are
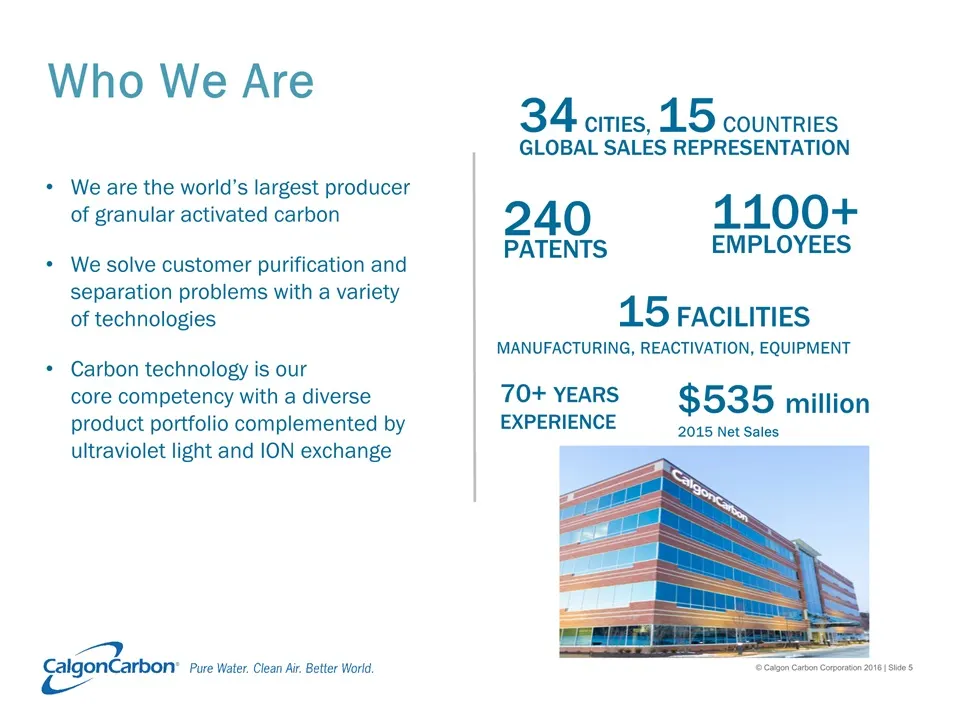
Who We Are We are the world’s largest producer of granular activated carbon We solve customer purification and separation problems with a variety of technologiesCarbon technology is our core competency with a diverse product portfolio complemented by ultraviolet light and ION exchange 15 FACILITIESM
Slide 6: What We Do
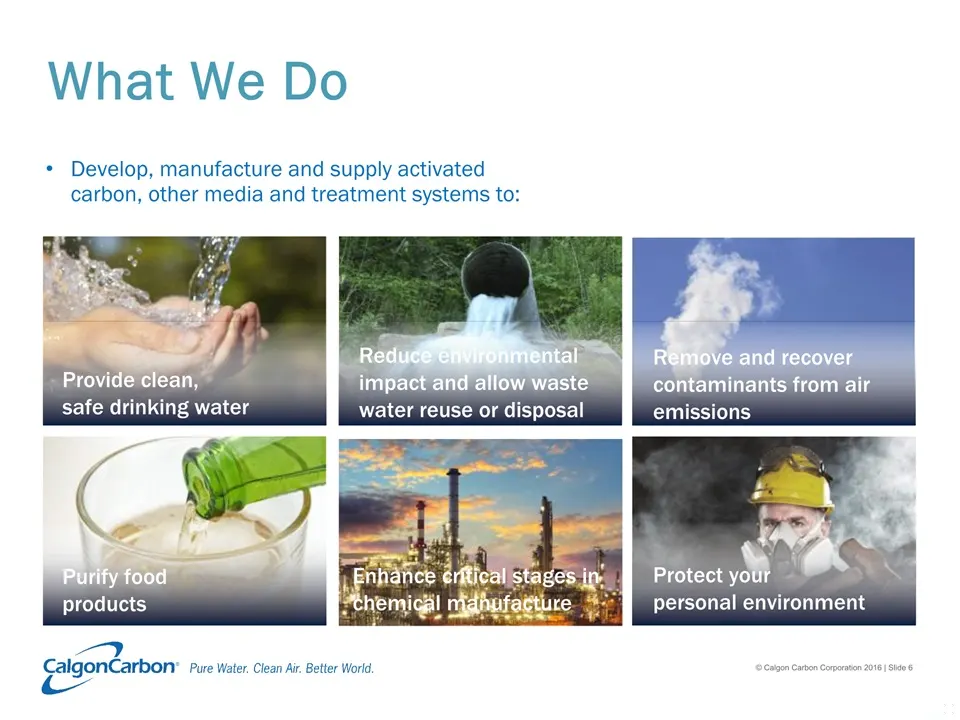
What We Do Develop, manufacture and supply activated carbon, other media and treatment systems to: Reduce environmental impact and allow waste water reuse or disposal Remove and recover contaminants from air emissions Purify food products Protect your personal environment Provide clean, safe drinkin
Slide 7: Activated Carbon: Granular, Extruded, Powder, Cloth
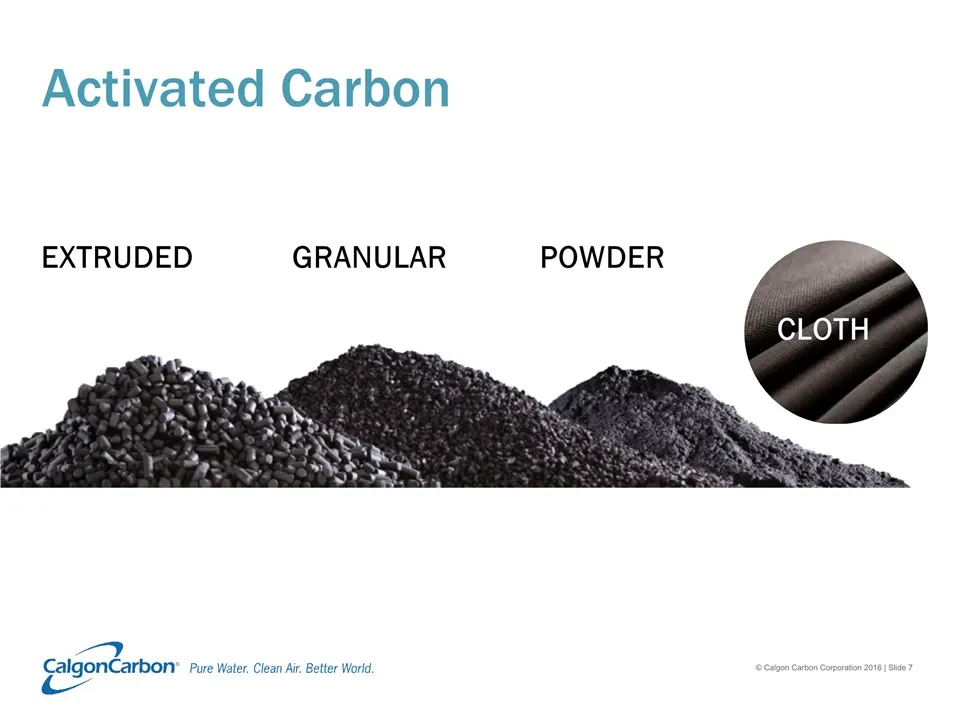
GRANULAR EXTRUDED POWDER Activated Carbon CLOTH
Slide 8: Equipment: Carbon Adsorption, Ultraviolet, Ion Exchange, Ballast Water
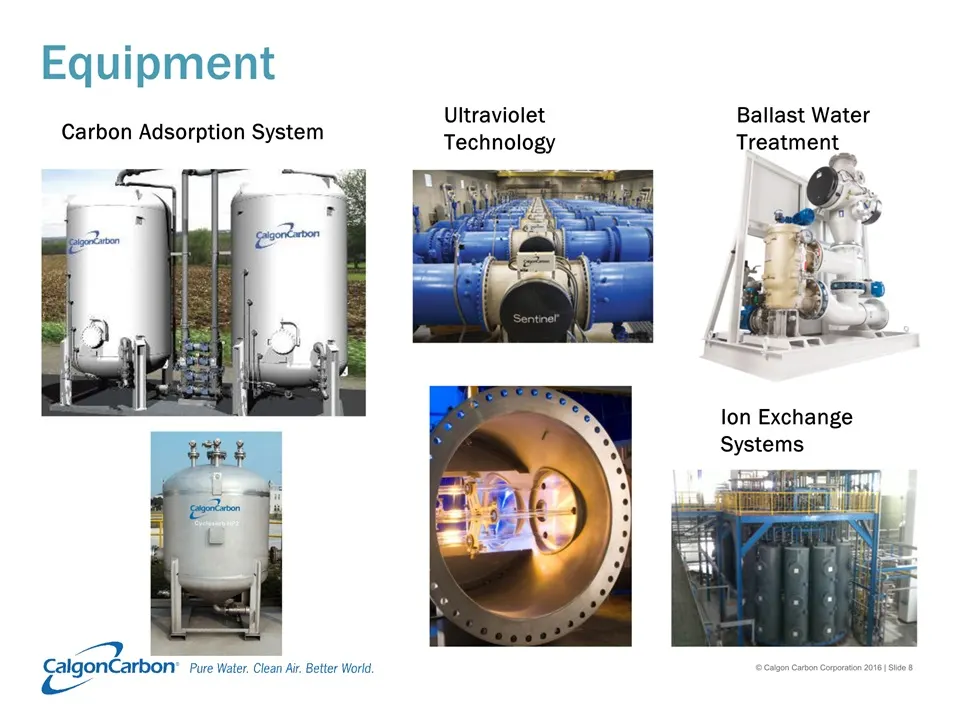
Equipment Carbon Adsorption System Ultraviolet Technology Ion Exchange Systems Ballast Water Treatment
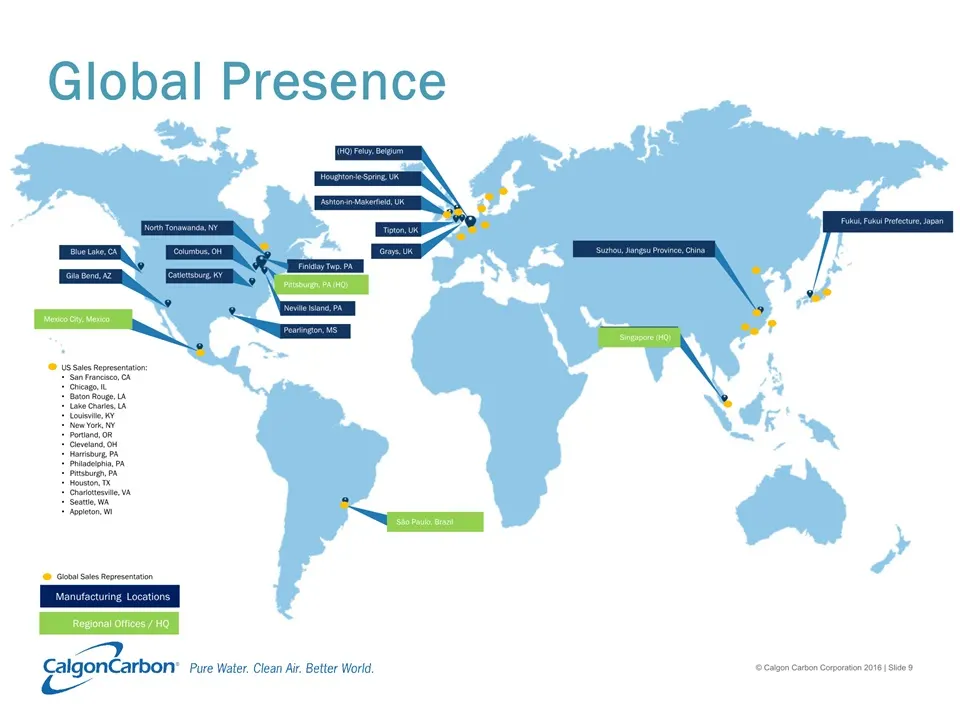
Slide 9: Global Presence
Columbus, OH North Tonawanda, NY Pittsburgh, PA (HQ) Catlettsburg, KY Pearlington, MS Neville Island, PA Gila Bend, AZ Columbus, OH Blue Lake, CA Mexico City, Mexico São Paulo, Brazil Houghton-le-Spring, UK Ashton-in-Makerfield, UK Tipton, UK Grays, UK (HQ) Feluy, Belgium Suzhou, Jiangsu Province, C
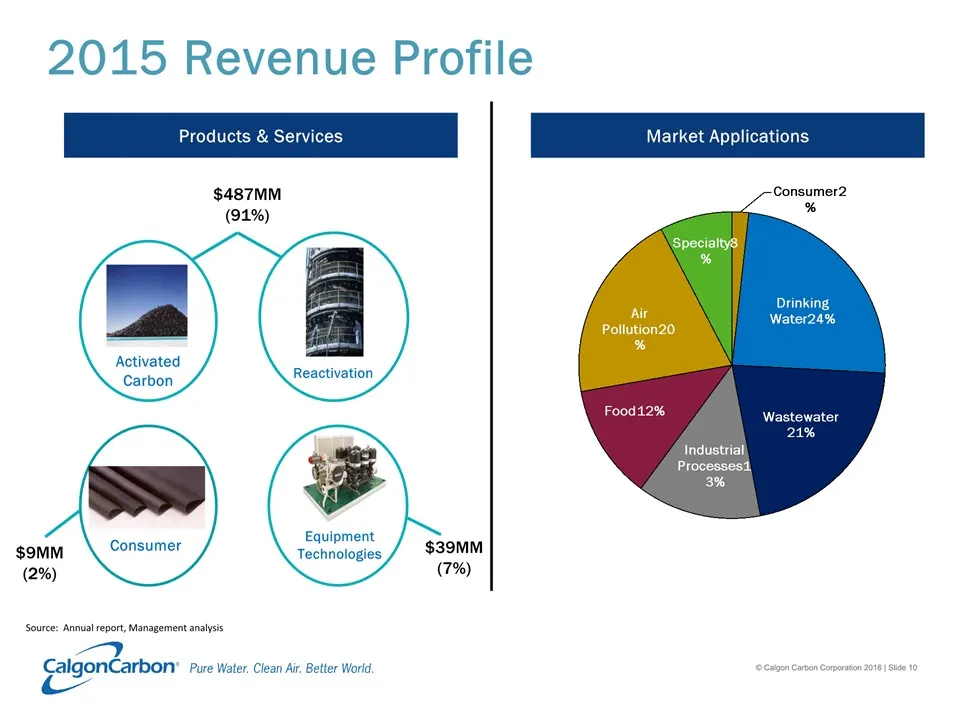
Slide 10: 2015 Revenue Profile
Activated Carbon Reactivation Equipment Technologies Consumer $487MM(91%) $39MM(7%) $9MM(2%) Market Applications Products & Services 2015 Revenue Profile Source: Annual report, Management analysis
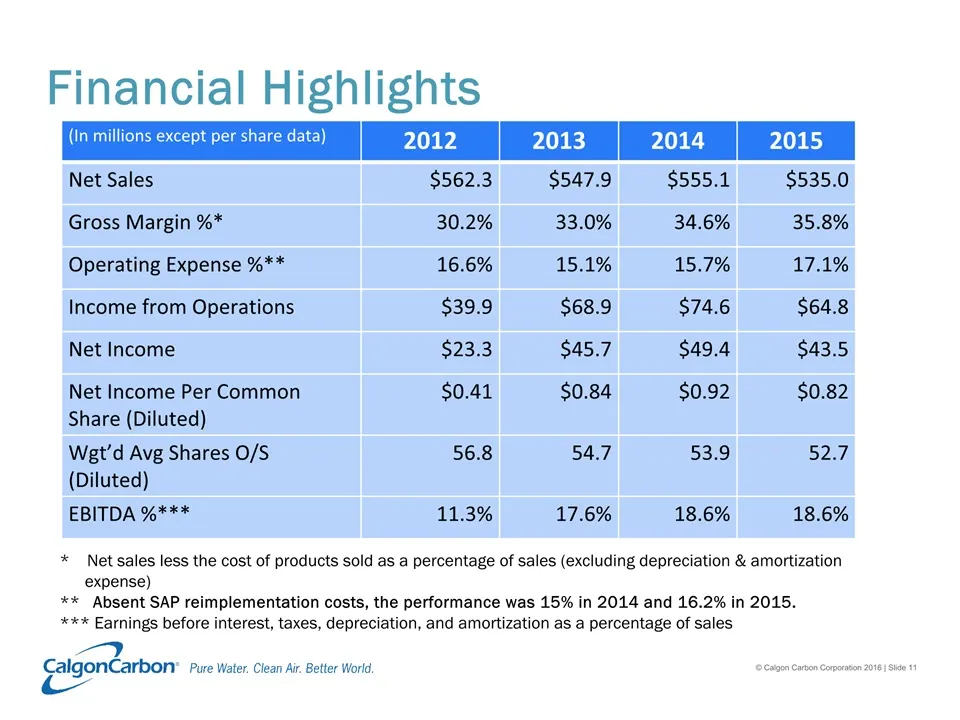
Slide 11: Financial Highlights
Financial Highlights (In millions except per share data) 2012 2013 2014 2015 Net Sales $562.3 $547.9 $555.1 $535.0 Gross Margin %* 30.2% 33.0% 34.6% 35.8% Operating Expense %** 16.6% 15.1% 15.7% 17.1% Income from Operations $39.9 $68.9 $74.6 $64.8 Net Income $23.3 $45.7 $49.4 $43.5 Net Income Per Co
Slide 12: Drivers of Sales Growth
Drivers of Sales GrowthMercury RemovalNorth American Drinking WaterReactivationBallast Water Treatment
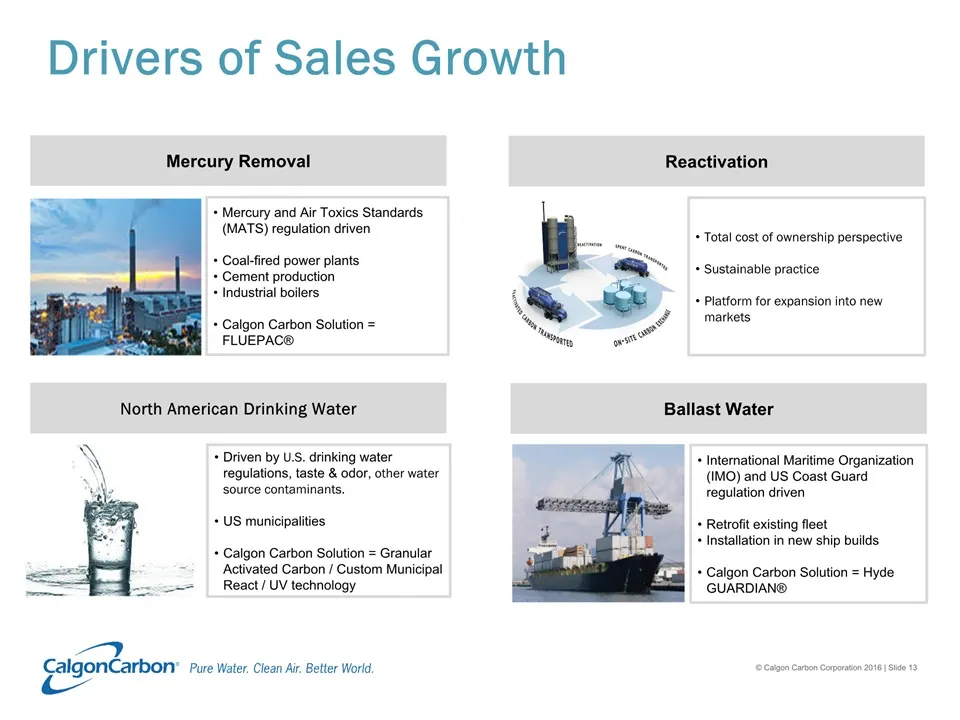
Slide 13: Drivers of Sales Growth
Drivers of Sales Growth Mercury Removal North American Drinking Water Ballast Water Mercury and Air Toxics Standards (MATS) regulation driven Coal-fired power plantsCement productionIndustrial boilersCalgon Carbon Solution = FLUEPAC® Driven by U.S. drinking water regulations, taste & odor, other wat
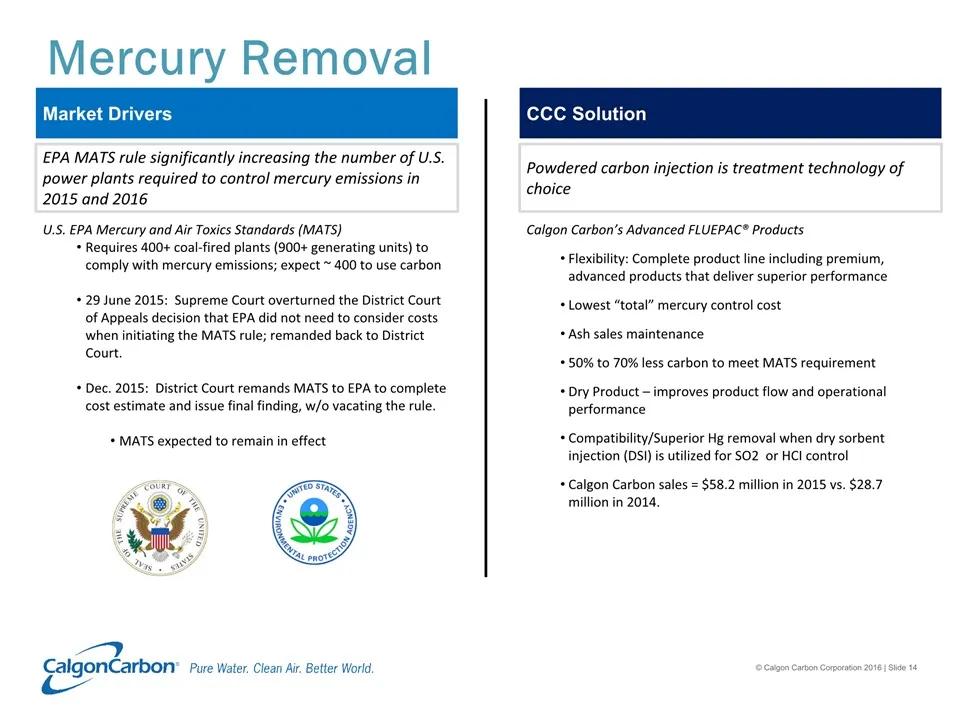
Slide 14: Mercury Removal
Mercury Removal EPA MATS rule significantly increasing the number of U.S. power plants required to control mercury emissions in 2015 and 2016 U.S. EPA Mercury and Air Toxics Standards (MATS) Requires 400+ coal-fired plants (900+ generating units) to comply with mercury emissions; expect ~ 400 to use
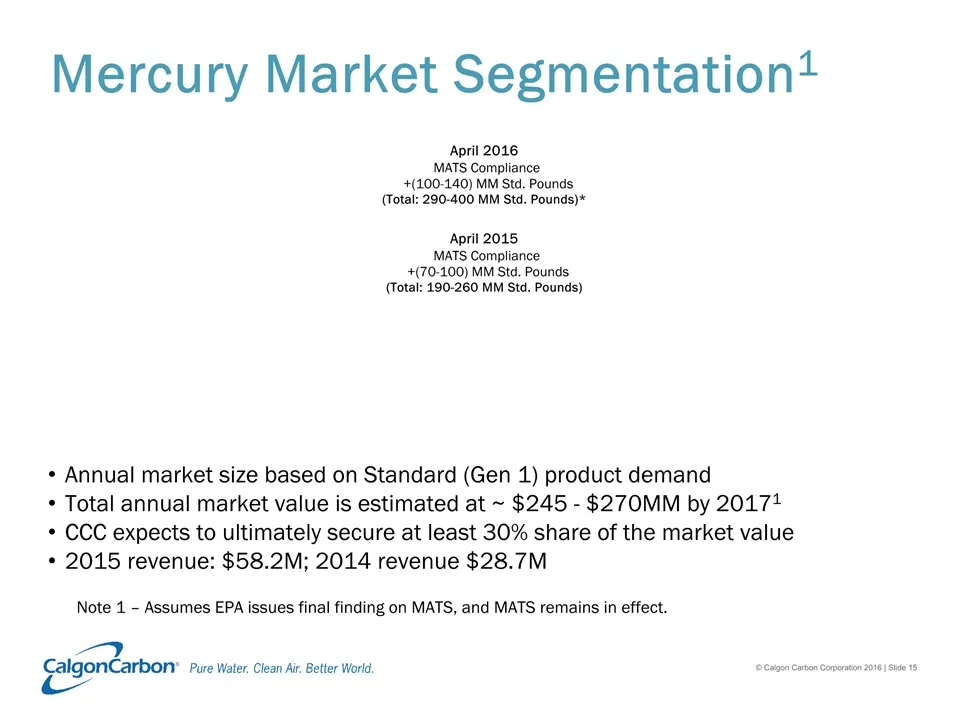
Slide 15: Mercury Market Segmentation
Mercury Market Segmentation1 Annual market size based on Standard (Gen 1) product demandTotal annual market value is estimated at ~ $245 - $270MM by 20171CCC expects to ultimately secure at least 30% share of the market value2015 revenue: $58.2M; 2014 revenue $28.7M Note 1 – Assumes EPA issues final
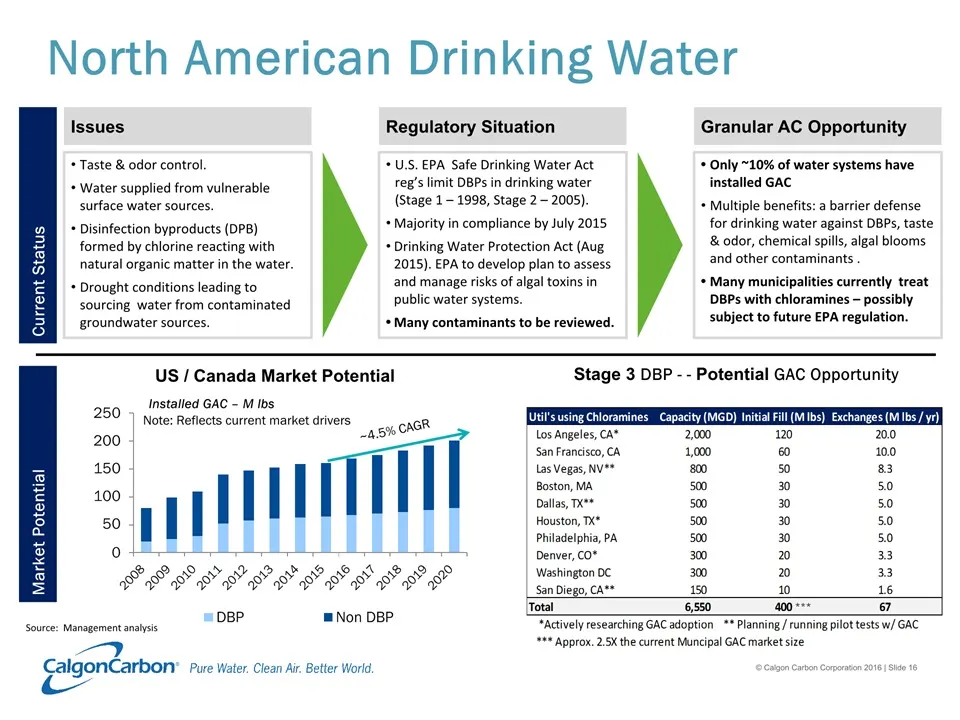
Slide 16: North American Drinking Water Issues
North American Drinking Water Issues Regulatory Situation Granular AC Opportunity Taste & odor control.Water supplied from vulnerable surface water sources.Disinfection byproducts (DPB) formed by chlorine reacting with natural organic matter in the water.Drought conditions leading to sourcing water
Slide 17: Reactivation
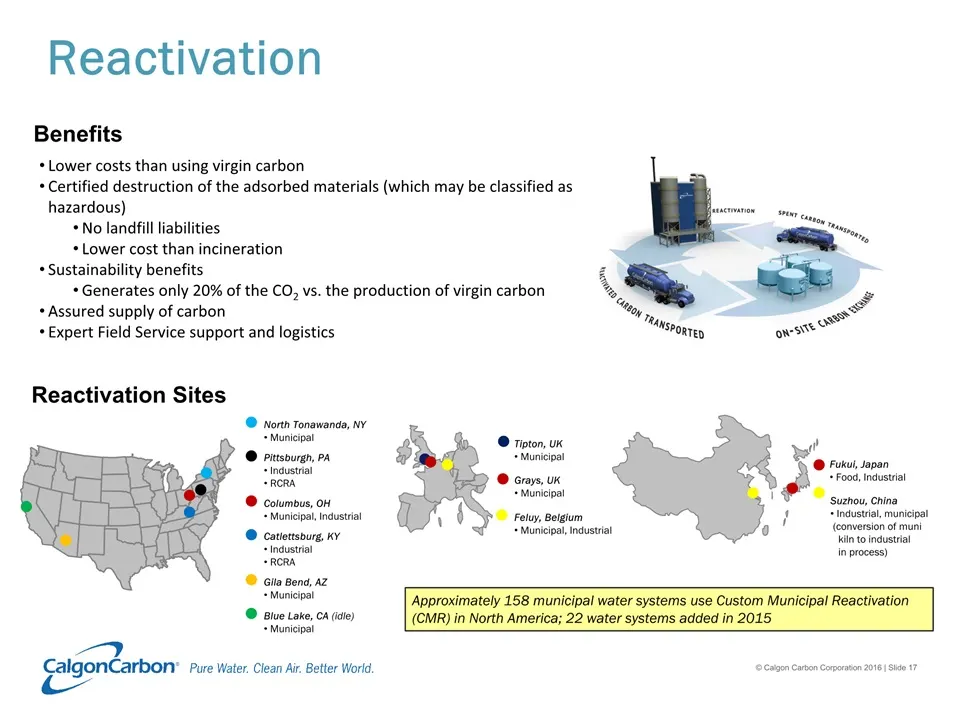
Reactivation Lower costs than using virgin carbonCertified destruction of the adsorbed materials (which may be classified as hazardous)No landfill liabilitiesLower cost than incinerationSustainability benefitsGenerates only 20% of the CO2 vs. the production of virgin carbonAssured supply of carbonEx
Slide 18: North American Drinking Water Market
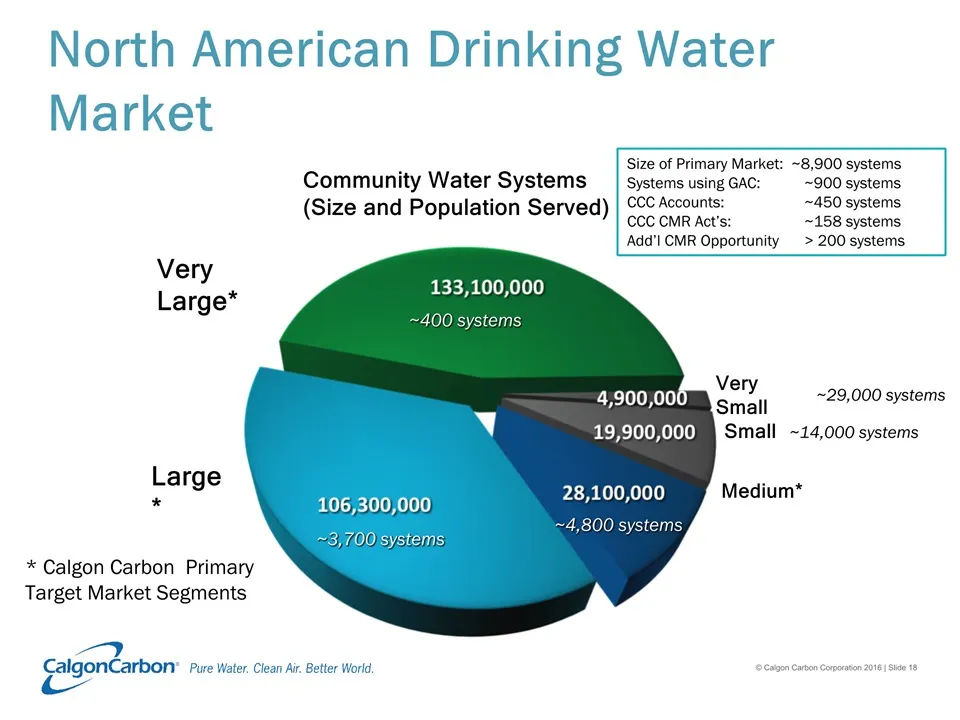
North American Drinking Water Market Community Water Systems (Size and Population Served) Large* Very Large* Small Medium* Very Small ~400 systems ~3,700 systems ~4,800 systems ~29,000 systems ~14,000 systems * Calgon Carbon Primary Target Market Segments Size of Primary Market: ~8,900 systemsSystem
Slide 19: Ballast Water Treatment
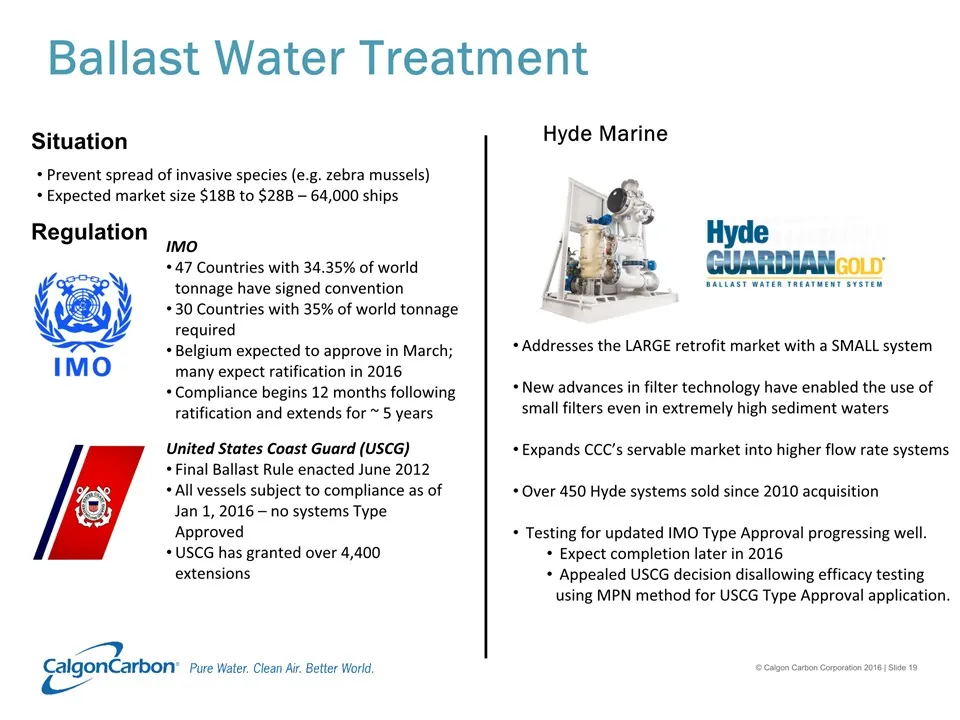
Ballast Water Treatment Prevent spread of invasive species (e.g. zebra mussels) Expected market size $18B to $28B – 64,000 ships Regulation IMO47 Countries with 34.35% of world tonnage have signed convention30 Countries with 35% of world tonnage requiredBelgium expected to approve in March; many exp
Slide 20: Value Creation Drivers
~ Pn i Jee oe - 6, poh gi ewe = 4 5 be ee™.. ODO A Pa ae Ale) Value Creation Drivers
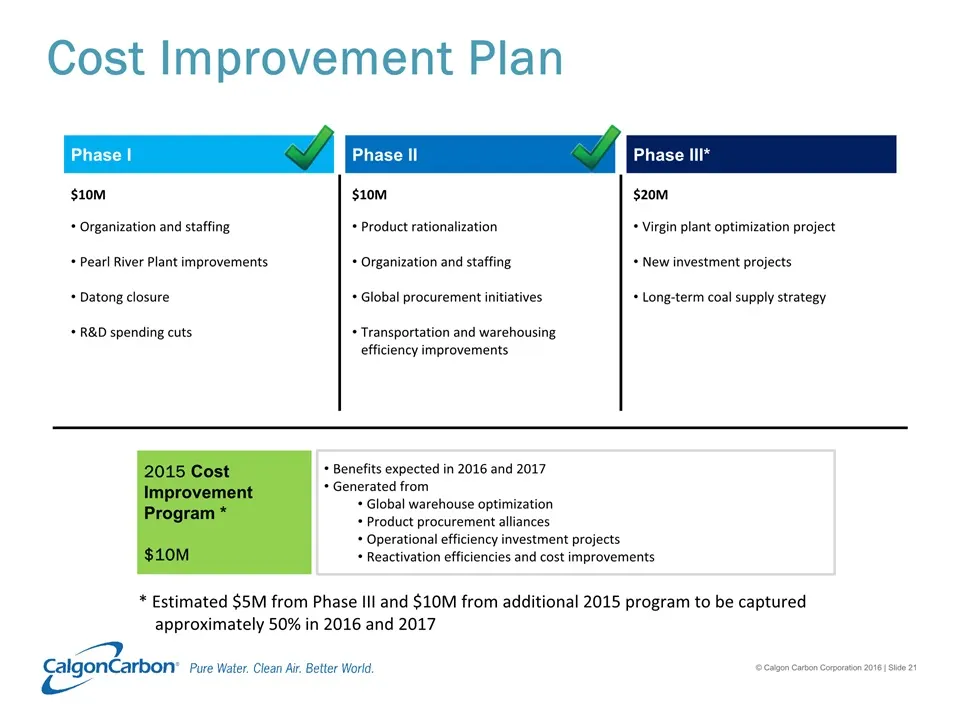
Slide 21: Cost Improvement Plan
Cost Improvement Plan Phase I Phase II Phase III* Organization and staffingPearl River Plant improvementsDatong closureR&D spending cuts Product rationalizationOrganization and staffingGlobal procurement initiativesTransportation and warehousing efficiency improvements Virgin plant optimization proj
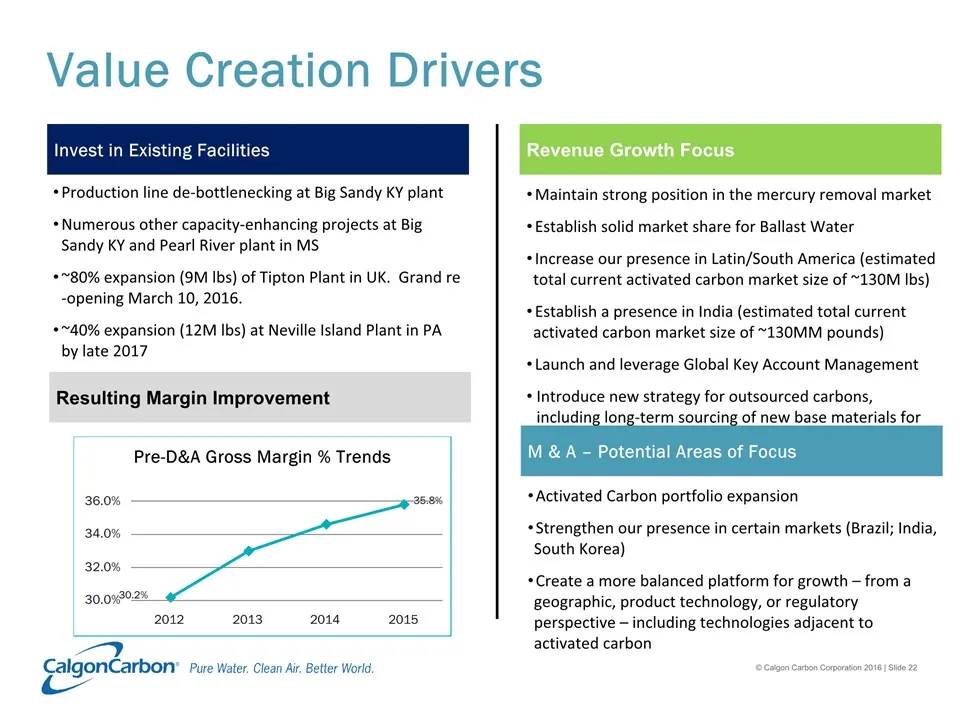
Slide 22: Value Creation Drivers
Value Creation Drivers Revenue Growth Focus Invest in Existing Facilities Production line de-bottlenecking at Big Sandy KY plantNumerous other capacity-enhancing projects at Big Sandy KY and Pearl River plant in MS~80% expansion (9M lbs) of Tipton Plant in UK. Grand re-opening March 10, 2016.~40% ex
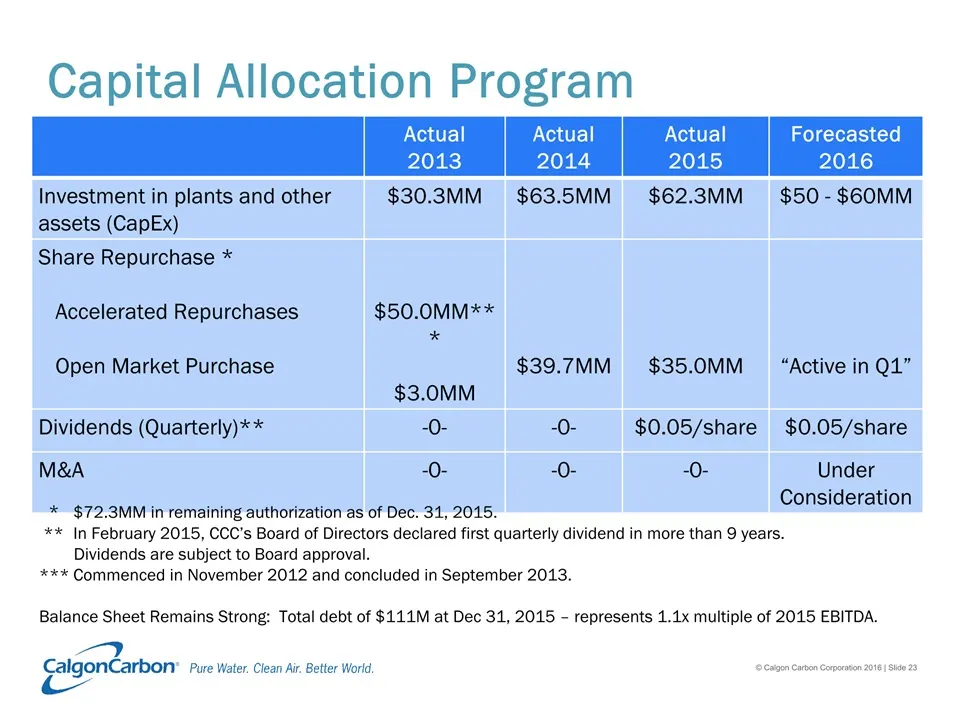
Slide 23: Capital Allocation Program
Capital Allocation Program Actual2013 Actual2014 Actual2015 Forecasted2016 Investment in plants and other assets (CapEx) $30.3MM $63.5MM $62.3MM $50 - $60MM Share Repurchase * Accelerated Repurchases Open Market Purchase $50.0MM***$3.0MM $39.7MM $35.0MM “Active in Q1” Dividends (Quarterly)** -0- -0-
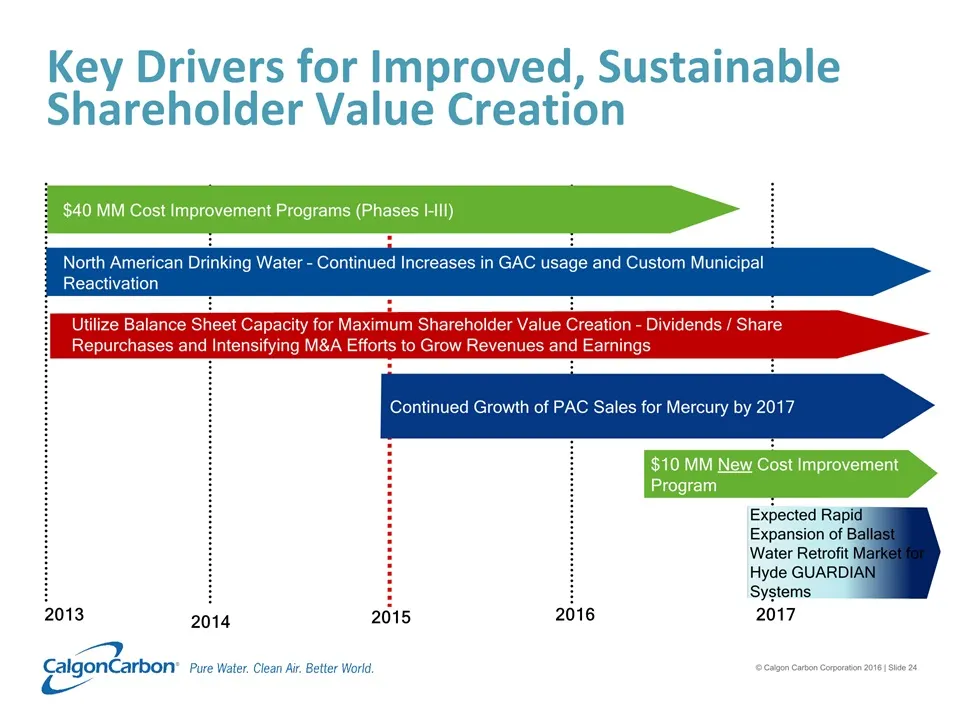
Slide 24: Key Drivers for Improved, Sustainable Shareholder Value Creation
Key Drivers for Improved, Sustainable Shareholder Value Creation 2013 2014 2015 2016 2017 Expected Rapid Expansion of Ballast Water Retrofit Market for Hyde GUARDIAN Systems Utilize Balance Sheet Capacity for Maximum Shareholder Value Creation – Dividends / Share Repurchases and Intensifying M&A Eff
Slide 25: Thank You
Thank You CalgonCarbon’ Pure water. Clean Air. Better World, ‘© calgon Carton Capuraton 2016 Sie 25
Source: SEC EDGAR · 8-K filed Mar 8, 2016
More decks from CALGON CARBON Corp
 Merger or Acquisition (September 2017)15 slides · Sep 21, 2017
 Q2 2017 Earnings Presentation10 slides · Aug 4, 2017
 Q1 2017 Earnings Presentation11 slides · May 9, 2017
 Investor Presentation (March 2017)25 slides · Mar 13, 2017
 Q4 2016 Earnings Presentation11 slides · Feb 24, 2017
 Q3 2016 Earnings Presentation11 slides · Nov 3, 2016