Valeant Pharmaceuticals International Inc
Valeant Pharmaceuticals International — Investor Presentation (February 2005)
52 slides from Valeant Pharmaceuticals International's investor presentation, Feb 8, 2005
Slide 1: Forward-Looking Statement
VALEANT Pharmaceutical International Forward – Looking Statement This presentation contains forward-looking statements that involve risk and uncertainties, including, but not limited to, the company’s ability to successfully close the transaction and integrate Xcel’s operations into those of Valeant
Slide 2: Valeant Pharmaceuticals International company description
VALEANT Pharmaceutical International A unique, GLOBAL, research-based specialty pharmaceutical company that discovers, develops, manufactures and markets pharmaceutical products in the areas of neurology, dermatology and infectious disease
Slide 3: Company Profile
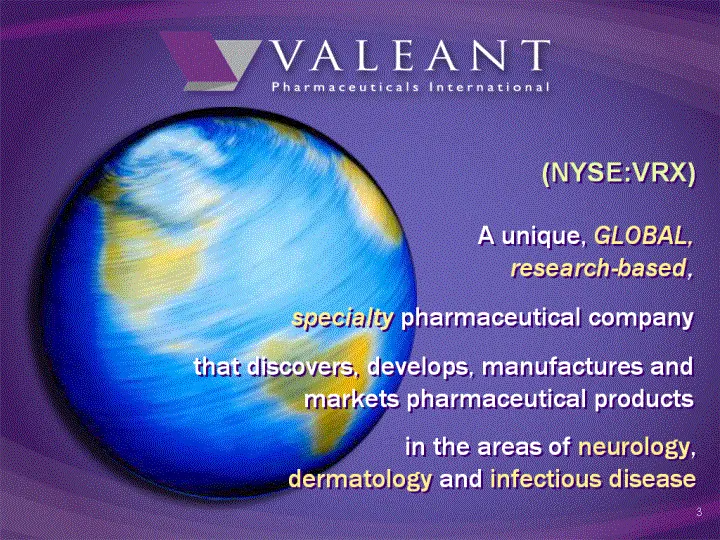
Company Profile $686 Million in Revenues in 2003 575 Products 2,400 SKUs 1,000 Sales Representatives Research & Development Global Manufacturing 4,437 Employees
Slide 4: Xcel — Transaction Summary
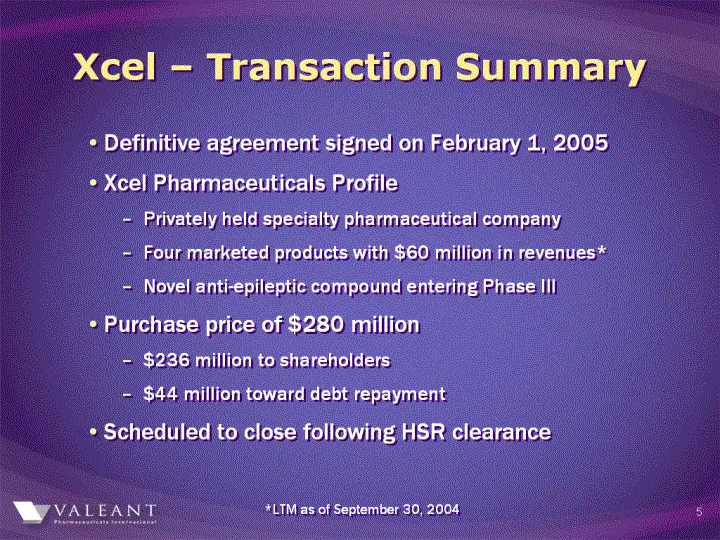
Xcel — Transaction Summary · Definitive agreement signed on February 1, 2005 · Xcel Pharmaceuticals Profile - Privately held specialty pharmaceutical company - Four marketed products with $60 million in revenues* - Novel anti-epileptic compound entering Phase III · Purchase price of $280 million - $
Slide 5: Best of Both Worlds
Best of Both Worlds VALEANT Pharmaceuticals International
Slide 6: What makes us unique? Global Footprint
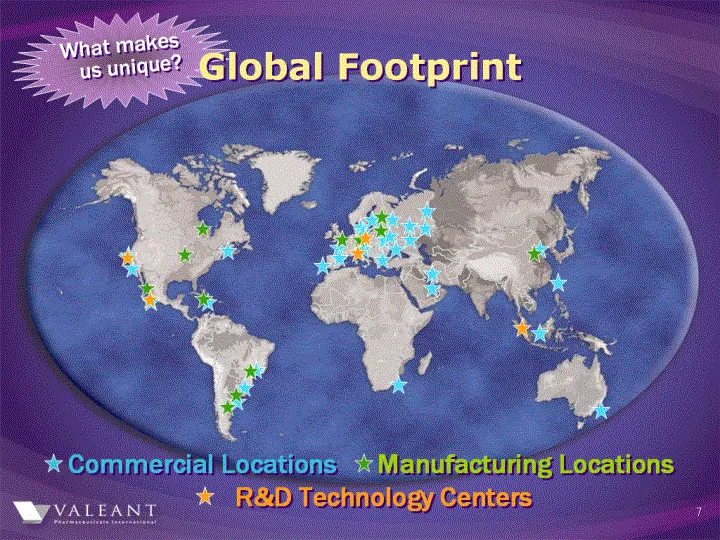
What makes us unique? Global Footprint * Commercial Locations * Manufacturing Locations * R&D Technology Centers
Slide 7: What makes us unique? R&D Capabilities
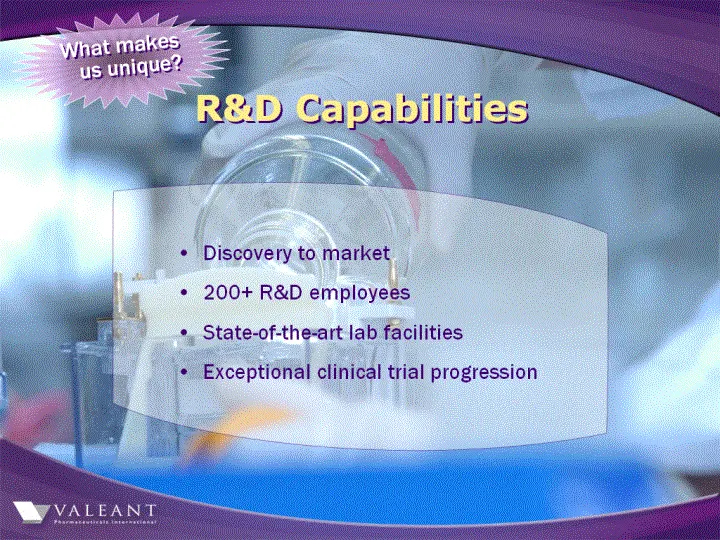
What makes us unique? R&D Capabilities · Discovery to market · 200 + R&D employees · State-of-the-art lab facilities · Exceptional clinical trial progression
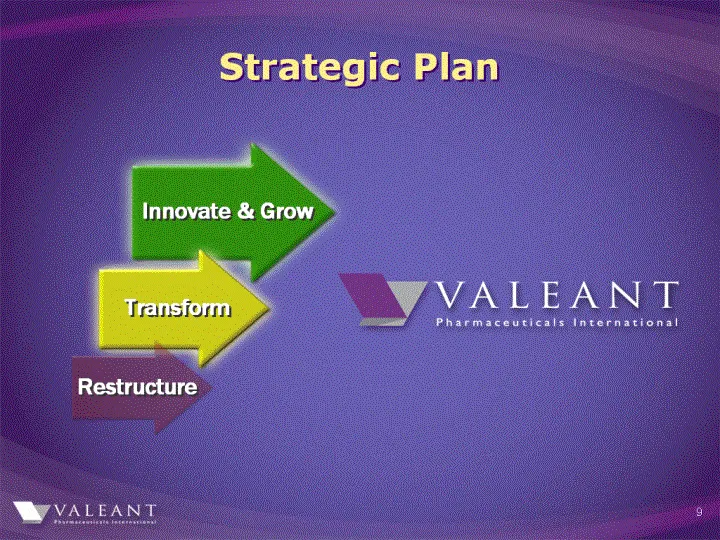
Slide 8: Strategic Plan
Strategic Plan Innovate & Grow Transform Restructure VALEANT Pharmaceuticals International
Slide 9: Strategic Plan
Strategic Plan ; Innovate & Grow > Sfanistorni) Restructure WY VALEANT
Slide 10: Growth Strategy
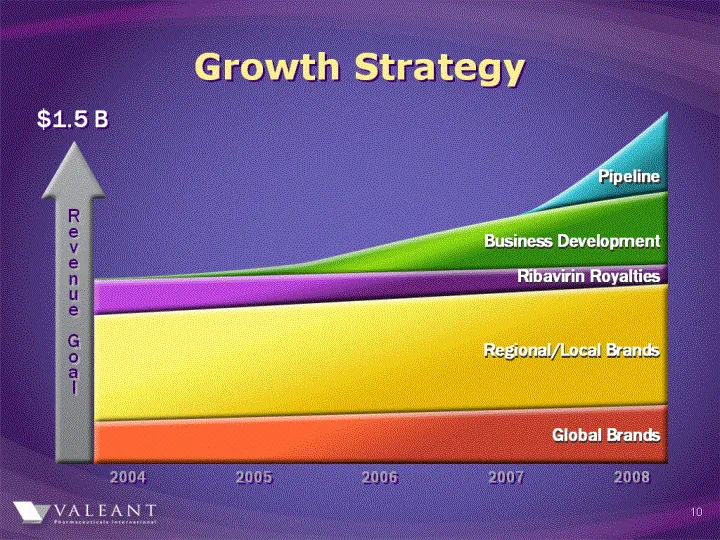
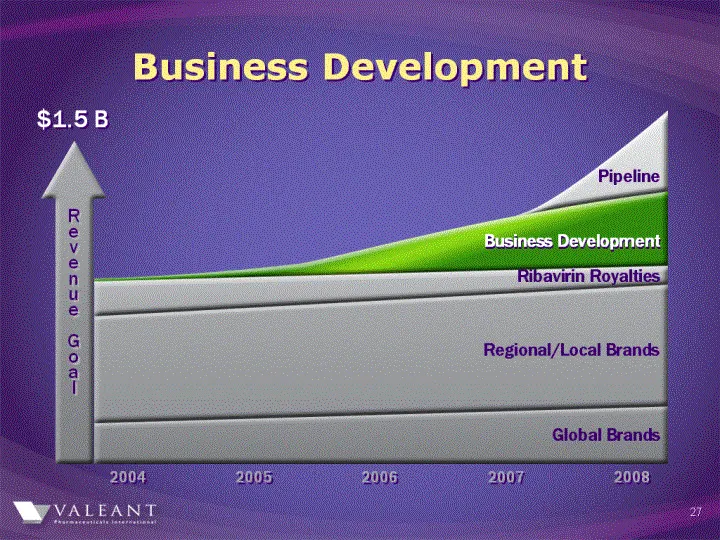
WVALEANT Growth Strategy P LL = Business Development "Ribavirin Royal
Slide 11: Growth Strategy: Pipeline and Business Development
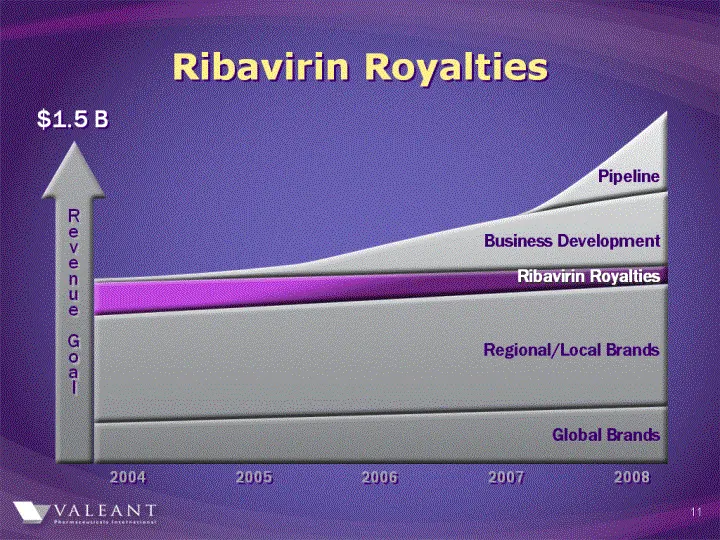
bavirin Royaltie Pipeline # ess Development © Regional/Local Brands R e v e n u € G ° a 2005: 2006,
Slide 12: Specialty Pharmaceuticals Global
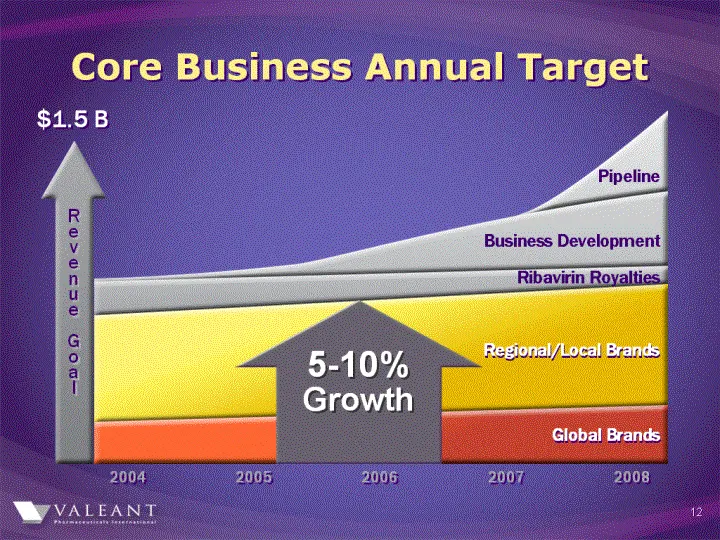
Specialty Pharmaceuticals Global *LTM product sales as of September 30, 2004
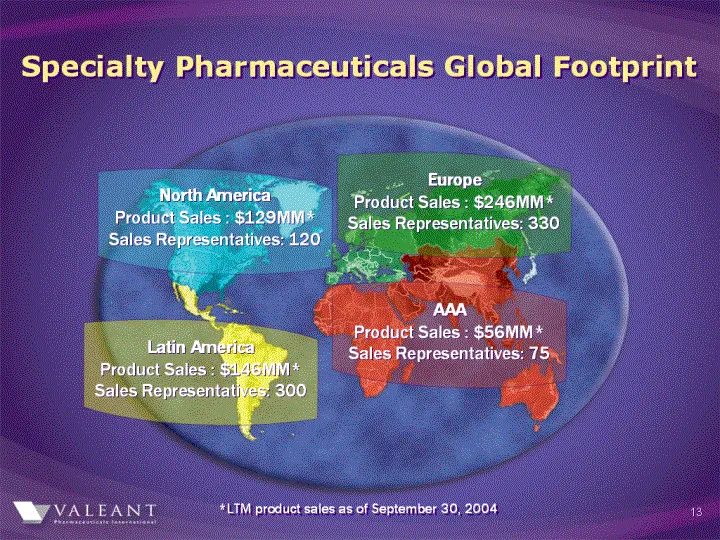
Slide 13: Specialty Pharmaceuticals Global Footprint
Specialty Pharmaceuticals Global Footprint +LTM product sales as of September 30, 2004 3
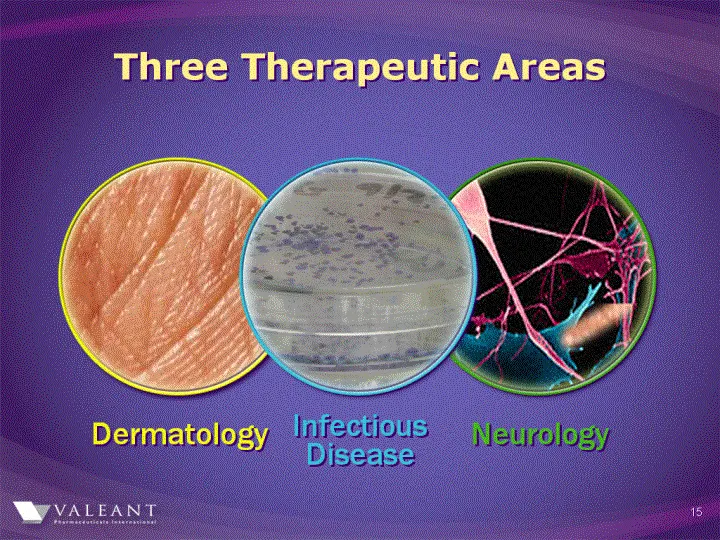
Slide 14: Three Therapeutic Areas
Three Therapeutic Areas Dermatology Infectious Disease Neurology
Slide 15: Nine Global Brands
Nine Global Brands · Formerly called Remofovir
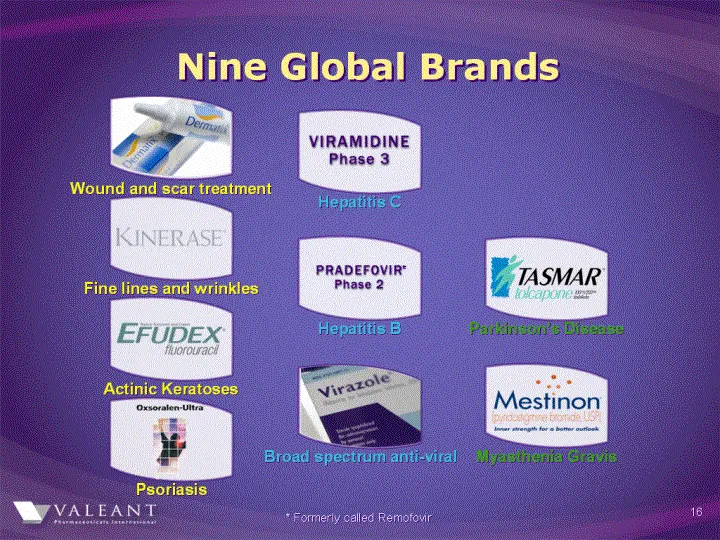
Slide 16: Ten Global Brands
Ten Global Brands * Formerly called Remofovir
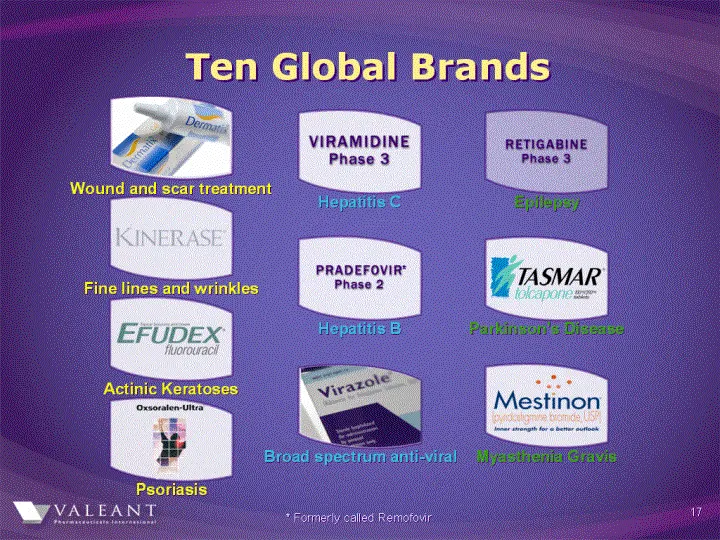
Slide 17: Ten Global Brands
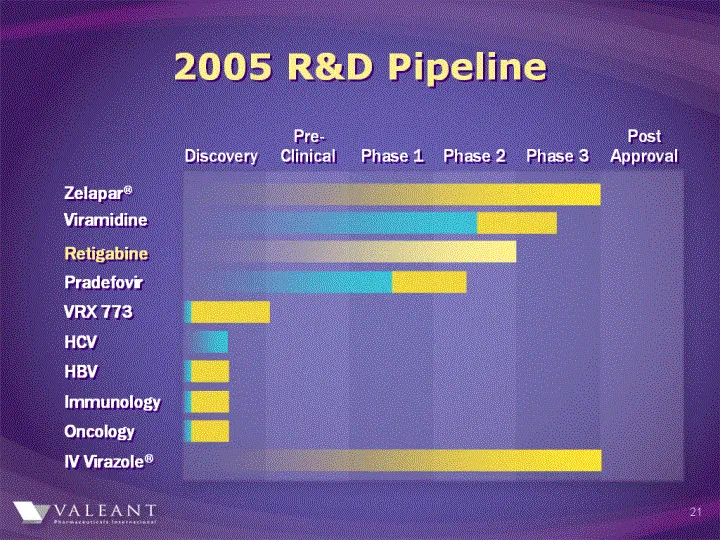
Ten Global Brands VIRAMIDINE RETIGABINE Phase 3 Phase 3 Wound and scar treatment Hepantie@ Ena PRADEFOVIR" TASMAR Fine lines and wrinkl Hepatitis 2: Partinsons Disease Actinic Keratoses Mestinon Broad spectiuniani-viral 9 me Psoriasis T * Formerly called Remofour
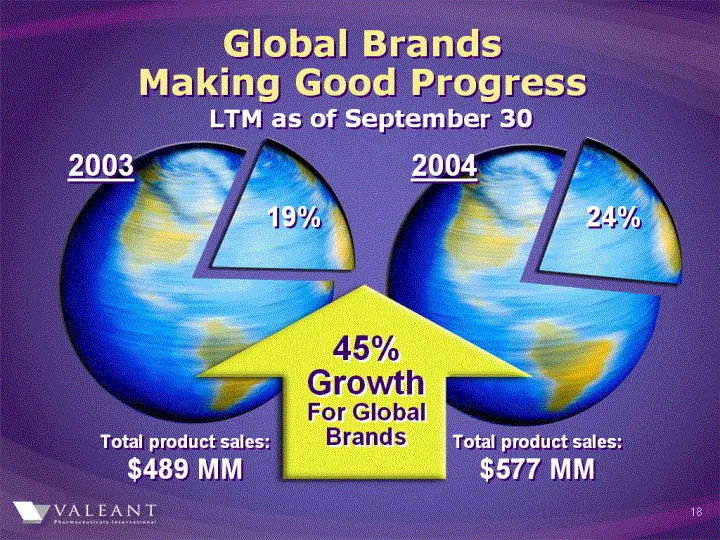
Slide 18: Core Business
Core Business *LTM ended September 30, 2004
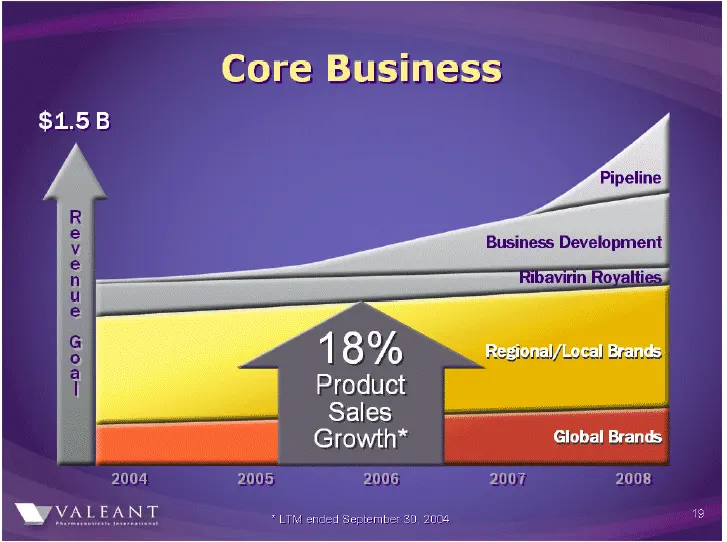
Slide 19: Core Business
Core Business 18% Product Sales: Growth* Global Brands 2004 2005: S006 2007) 2008 WW YVALEANT > Ti ended Sepleribe 39, 2004
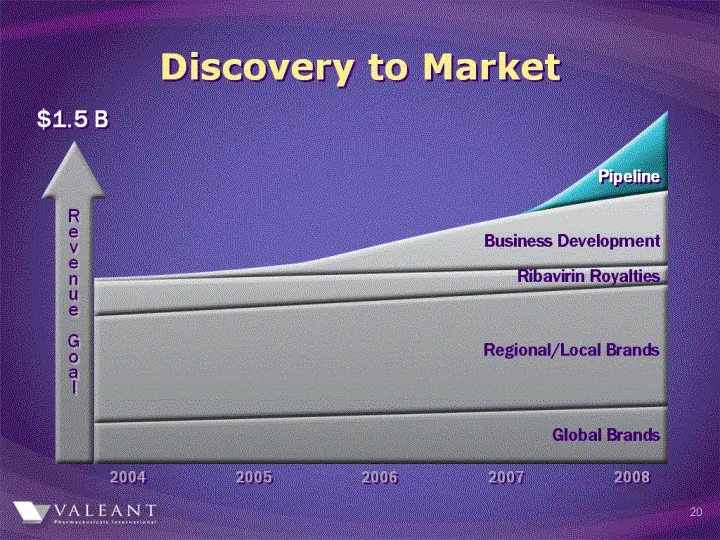
Slide 20: Growth Drivers: Discovery to Market, Business Development
R e v e n u € G 0 a overy to Market Business Development | ibavirin Royal Regional/Local Brands 2006;
Slide 21: Viramidine Update
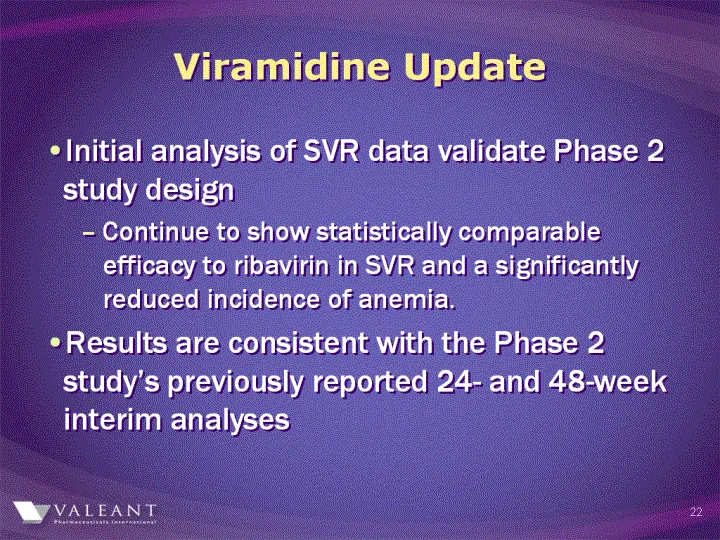
Viramidine Update · Initial analysis of SVR data validate Phase 2 study design - Continue to show statistically comparable efficacy to ribavirin in SVR and significantly reduced incidence of anemia. · Results are consistent with the Phase 2 study’s previously reported 24- and 48-week interim analyse
Slide 22: Viramidine Phase 3
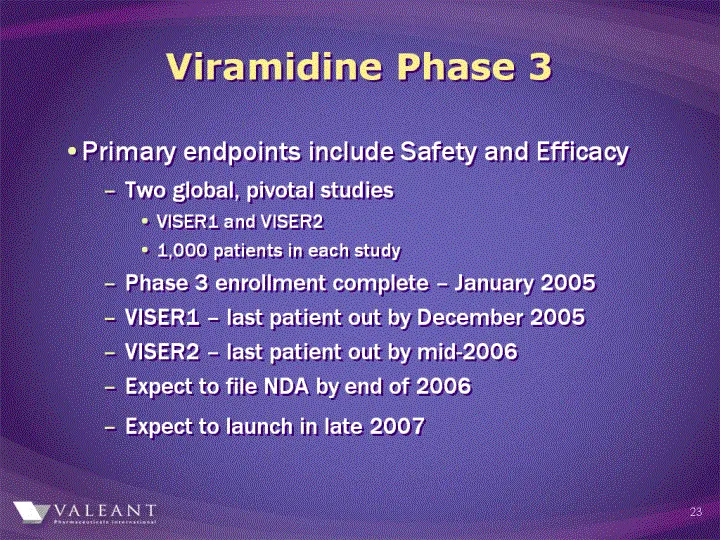
Viramidine Phase 3 · Primary endpoints include Safety and Efficacy - Two global,, pivotal studies · VISER1 and VISER2 · 1,000 patients in each study - Phase 3 enrollment complete – January 2005 - VISER1 – last patient out by December 2005 - VISER2 – last patient out by mid –2006 - Expect to file NDA
Slide 23: Pradefovir Update
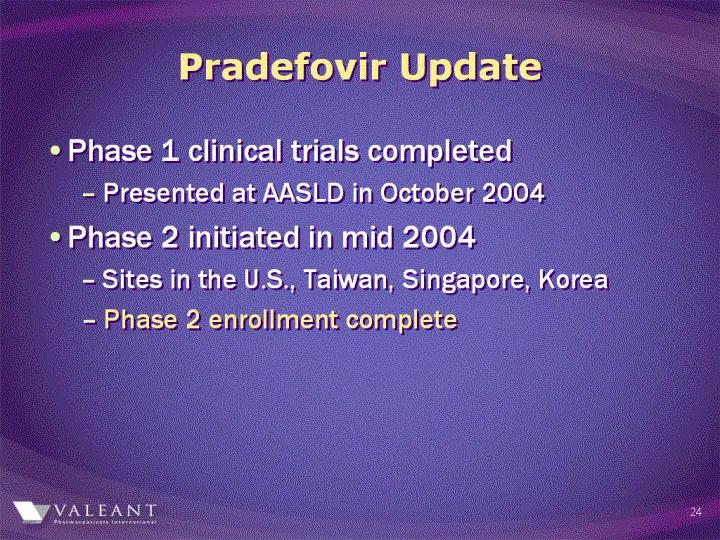
Pradefovir Update · Phase 1 clinical trails completed - Presented at AASLD in October 2004 · Phase 2 initiated in mid 2004 - Site in the U.S, Taiwan, Singapore, Korea - Phase 2 enrollment complete
Slide 24: Pradefovir Update
Pradefovir Update ¢ Phase 1 clin’
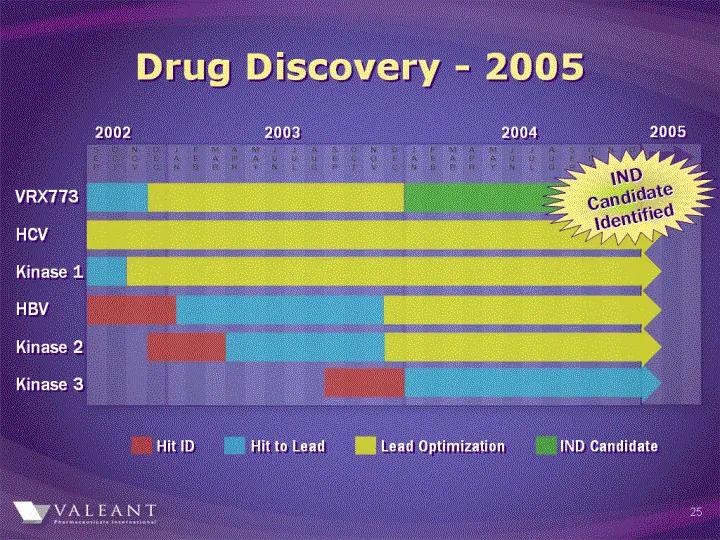
Slide 25: IND Candidate Identified VRX773
IND Candidate Identified VRX773 · IND candidate identified for treatment of HIV · Non- nucleoside reverse transcriptase inhibitor · Profile superior to existing therapies · Molecule could potentially yield an Investigational · New Drug Application in 12-15 months
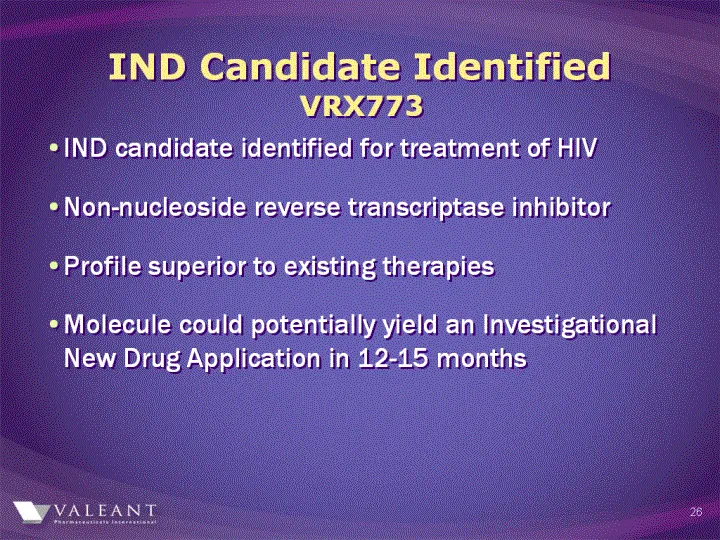
Slide 26: IND Candidate Identified
IND Candidate Identified WVALEANT 26
Slide 27: Acquisition Rationale: Grow core therapeutic areas
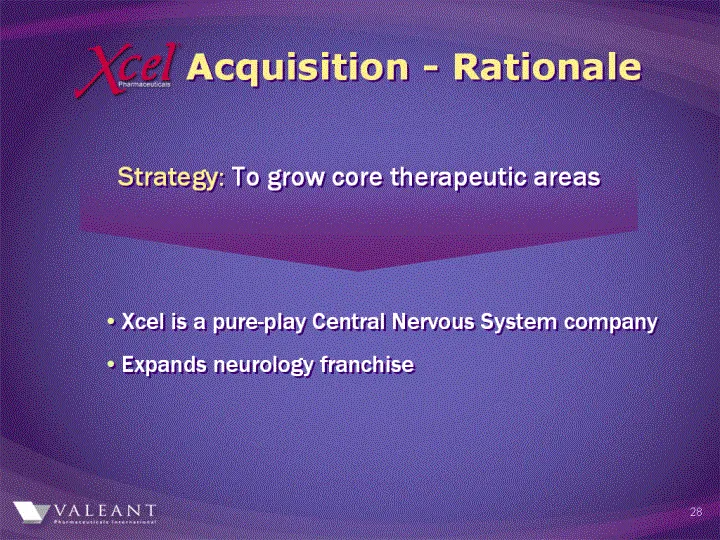
Acquisition – Rationale Strategy : To grow core therapeutic areas · Xcel is a pure-play Central Nervous System company · Expands neurology franchise
Slide 28: Acquisition Rationale: Expand late-stage pipeline
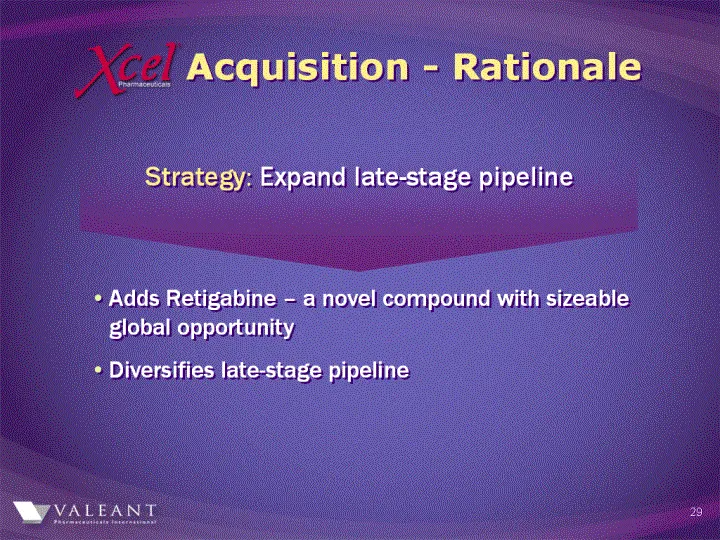
Acquisition – Rationale Strategy: Expand late-stage pipeline · Adds Retigabine – anovel compound with sizeable global opportunity · Diversifies late-stage pipeline
Slide 29: Acquisition Rationale: Expand North American franchise
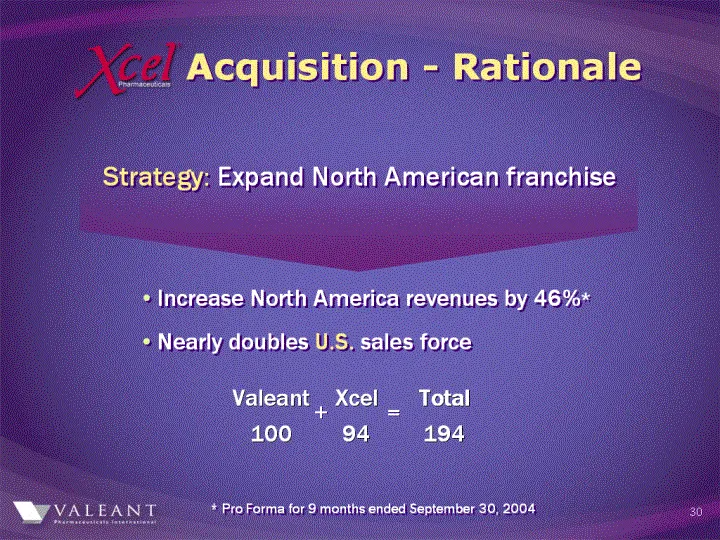
Acquisition – Rationale Strategy: Expand North American franchise · Increase North America revenues by 46%* · Nearly doubles U.S sales force Valeant Xcel Total + 100 94=194 *Pro Forma for 9 months ended September 30,2004
Slide 30: Acquisition Rationale: Sales & Resource Synergy
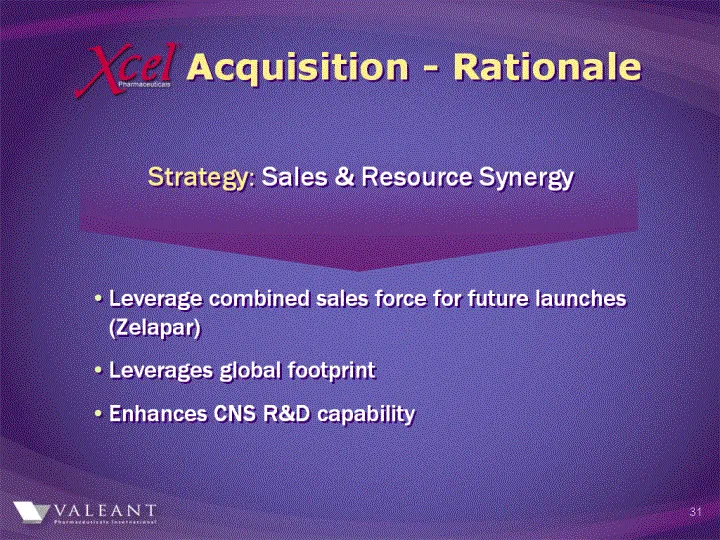
Acquisition – Rationale Strategy: Sales & Resource Synergy · Leverage combined sales force for future launches (Zelapar) · Leverages global footprint · Enhances CNS R&D capability
Slide 31: Acquisition Rationale: Positive cash flow
Acquisition – Rationale Strategy: Positive cash flow · Largely self-funding investment
Slide 32: Largely self-funding investment
* Largely self-funding investment
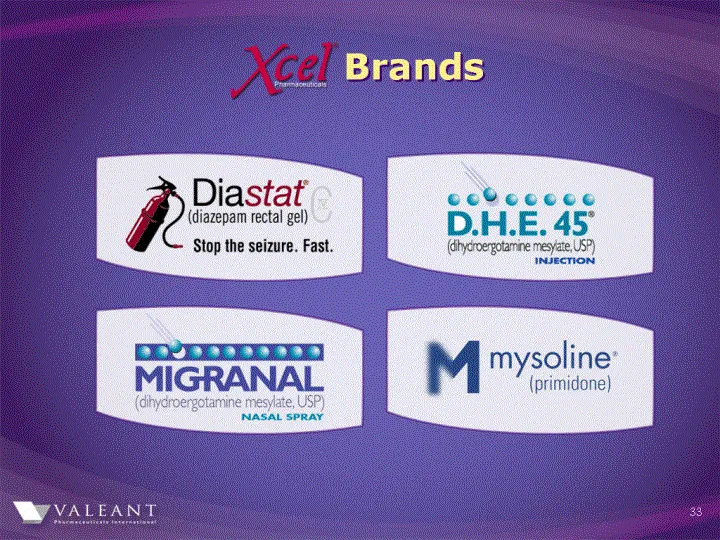
Slide 33: Business Development Revenue
Business Development Revenue
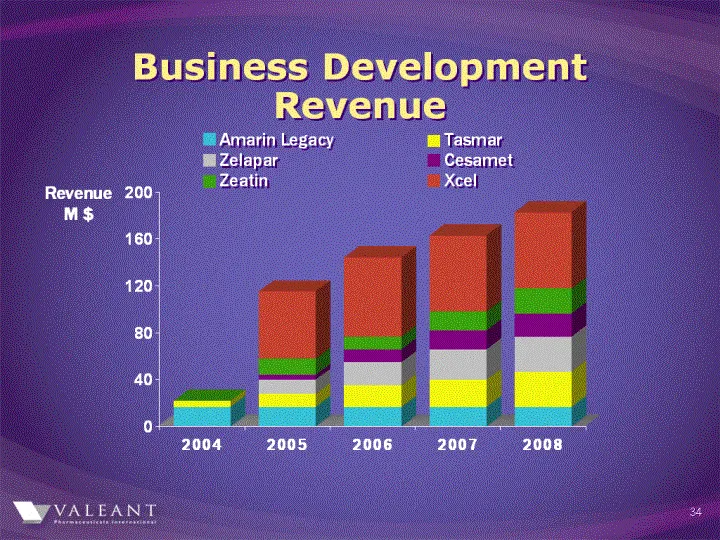
Slide 34: Business Development Revenue
Business Development Revenue Amarin Legacy @ lasmar @ Zelapar __ Cesamet _ Zeatin _ Xcel 2004 2005 2006 2007 2008 Way VALEANT
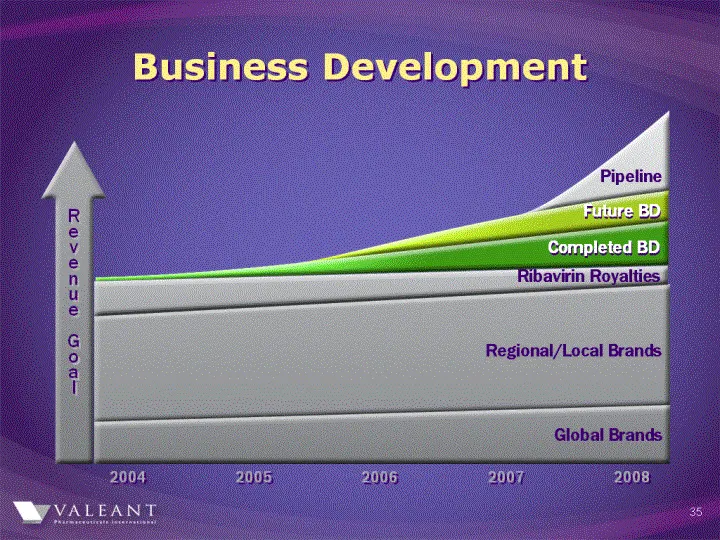
Slide 35: Global Supply Network
Global Supply Network By 2006: 5 Sites in 5 Countries
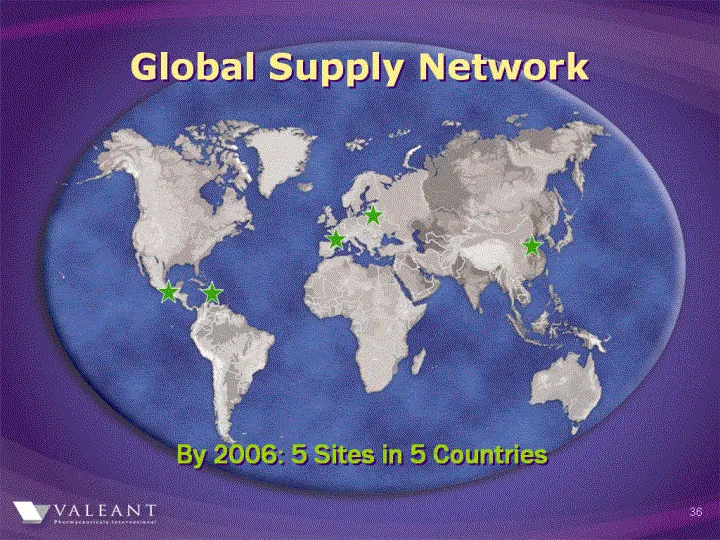
Slide 36: Performance Goals
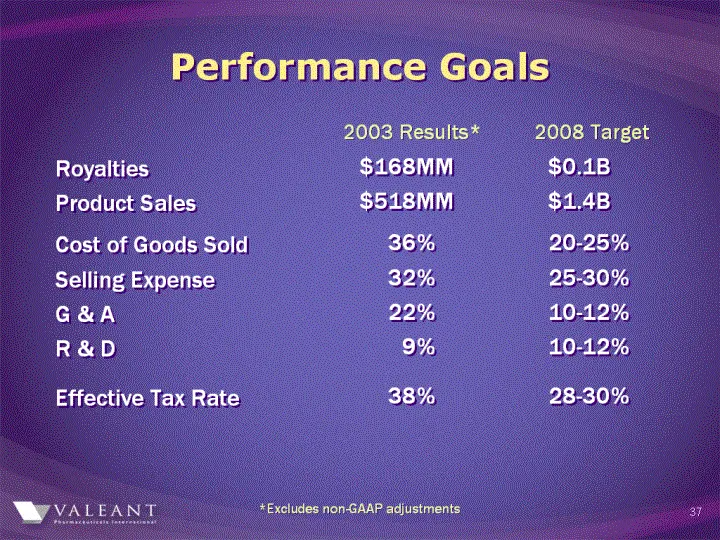
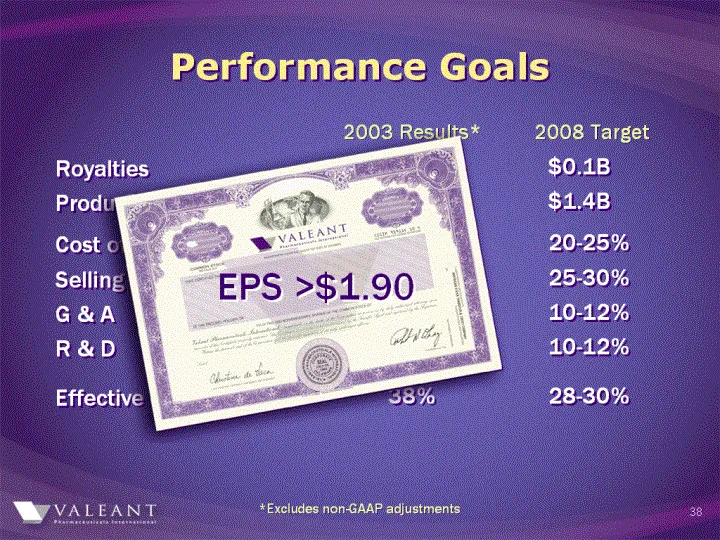
Performance Goals 2003 Results *2008 Target Royalties$168MM $0.1B Product Sales$518MM $1.4B Cost of Goods Sold 36% 20-25% Selling Expense 32% 25-30% G & A 22% 10-12% R & D 9% 10-12% Effective Tax Rate 38% 28-30% *Excludes non-GAAP adjustments
Slide 37: Performance Goals
Performance Goals *Excludes non-GAAP adjustments
Slide 38: Valeant is a Unique Specialty Pharmaceutical Company
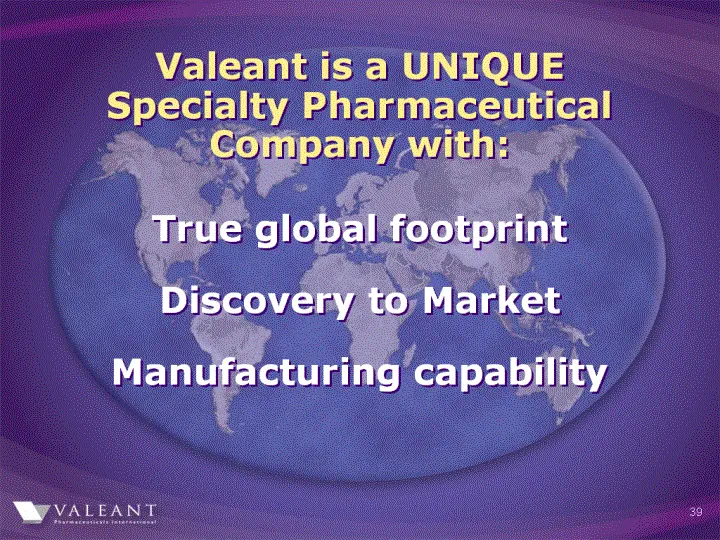
Valeant is a UNIQUE Specialty Pharmaceutical Company with: True global footprint Discovery to Market Manufacturing capability
Slide 39: Financial Review
Financial Review
Slide 40: Product Sales
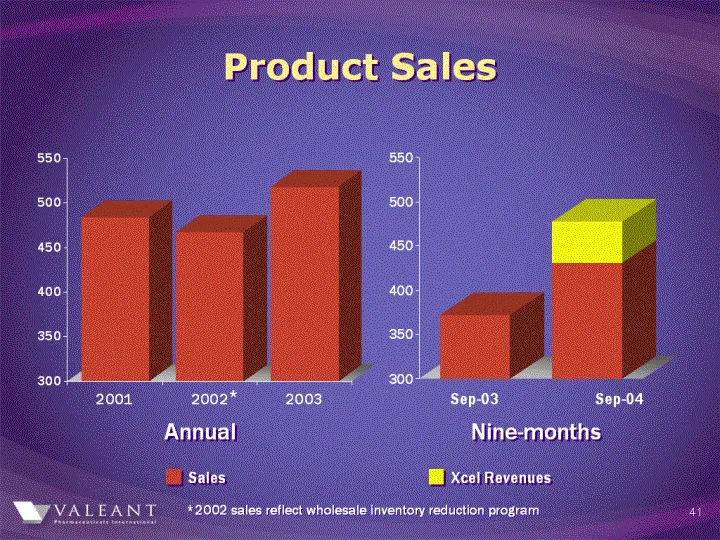
Product Sales *2002 sales reflect wholesale inventory reduction program
Slide 41: Product Sales by Region
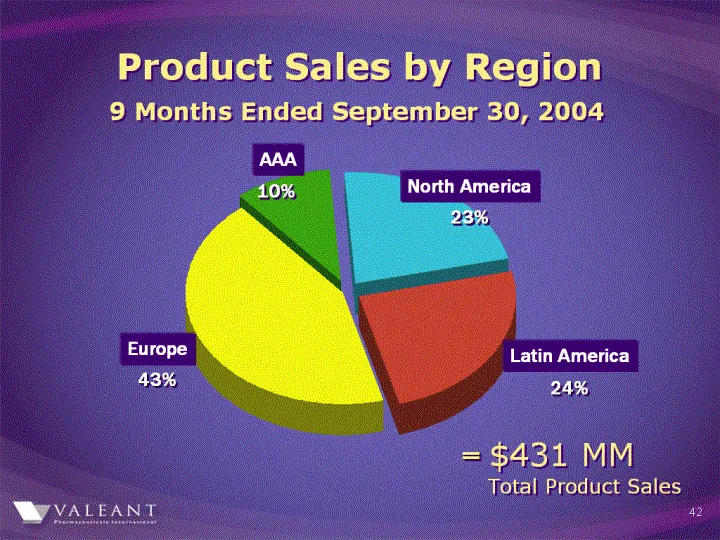
Product Sales by Region 9 Months Ended September 30,2004 =$431 MM Total Product Sales
Slide 42: Pro Forma Product Sales by Region
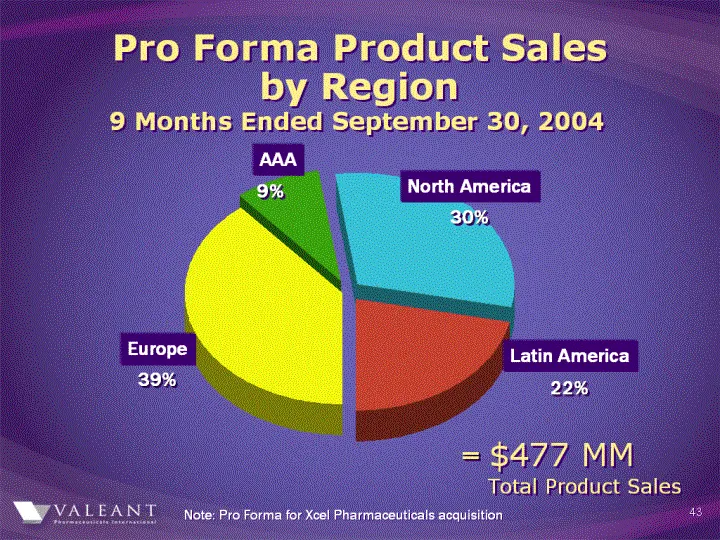
Pro Forma Product Sales by Region 9 Months Ended September 30, 2004 =$477 MM Total Product Sales Note : Pro Forma for Xcel Pharmaceuticals acquisition
Slide 43: Product Lines
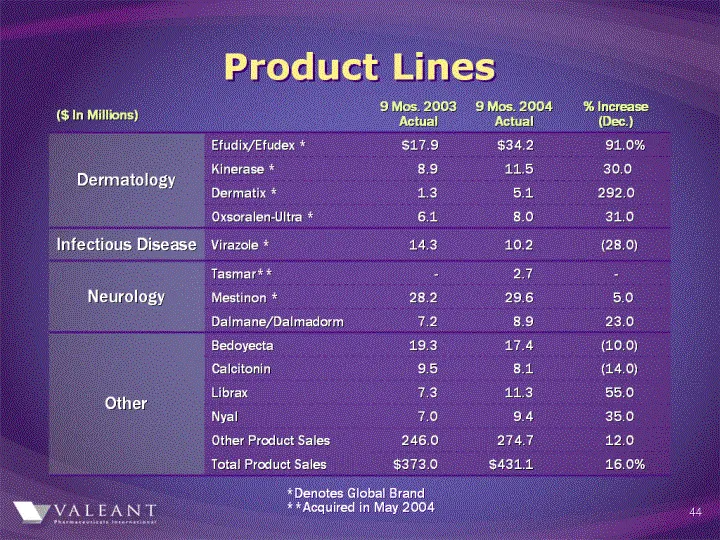
Product Lines ($ In Millions) 9Mos.2003 Actual 9Mos.2004 Actual %Increase(Dec.) Efudix/Efudex * &17.9 $34.2 91.0% Kinerase * 8.9 11.5 30.0 DermatologyDermatix * 1.3 5.1 292.0 Oxsorealen-Ultra * 6.1 8.0 31.0 Infectious Disease Virazole * 14.3 10.2 (28.0) Tasmar **- 2.7 - Neurology Mestinon * 28.2 29.
Slide 44: Adjusted Operating Income
Adjusted Operating Income ($In Million) Nine months Ended Sept.30 2003 2004 Product Sales $373 $431 Royalties 137 63 510494 Cost of Goods Sold 130 142 Selling Expenses 120 143 General & Administrative 85 69 R&D 30 64 Amortization 26 41 Operating Income $119 $35 Note: Excludes in-process R&D expenses
Slide 45: Adjusted Operating Income
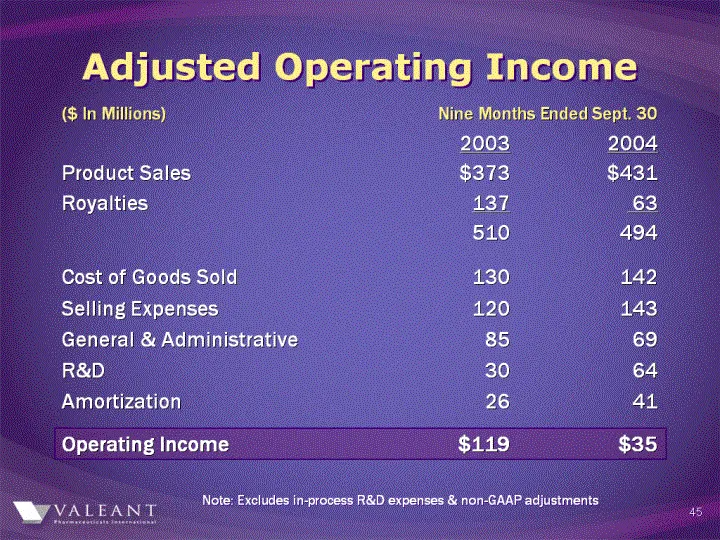
Adjusted Operating Income ($In Millions) Nine Months Ended Sept.30 Specialty Pharmaceuticals 2003 2004 Product Sales $373 $431 Cost of Goods Sold130 142 Selling Expenses 120 143 General & Administrative 67 63 Amortization 24 27 Specialty Pharmaceuticals 32 56 R&D (50) (84) Ribavirin Royalties 137 63
Slide 46: Adjusted Operating Income Pro Forma
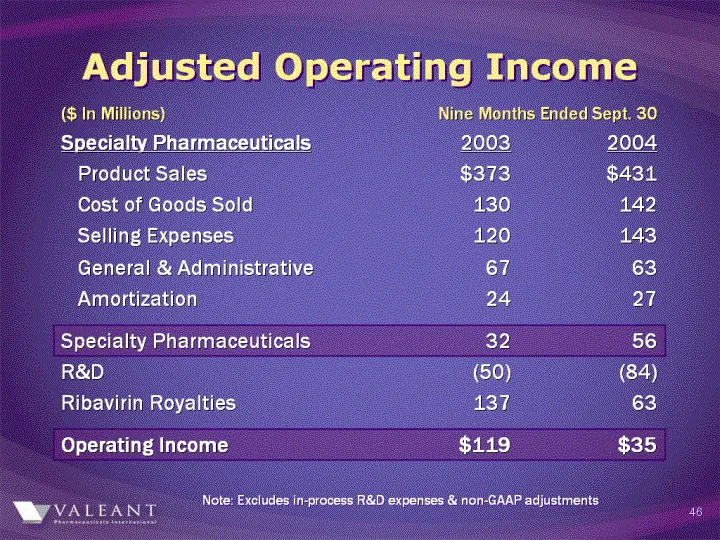
Adjusted Operating Income ($In Millions) Nine Months Ended Sept.30 Specialty Pharmaceuticals Valeant Pro Forma * Product Sales $431 $477 Cost of Goods Sold142 150 Selling Expenses 143 160 General & Administrative 63 68 Amortization 27 37 Specialty Pharmaceuticals 56 62 R&D (84) (96) Ribavirin Royalt
Slide 47: Cash Available for Strategic Initiatives
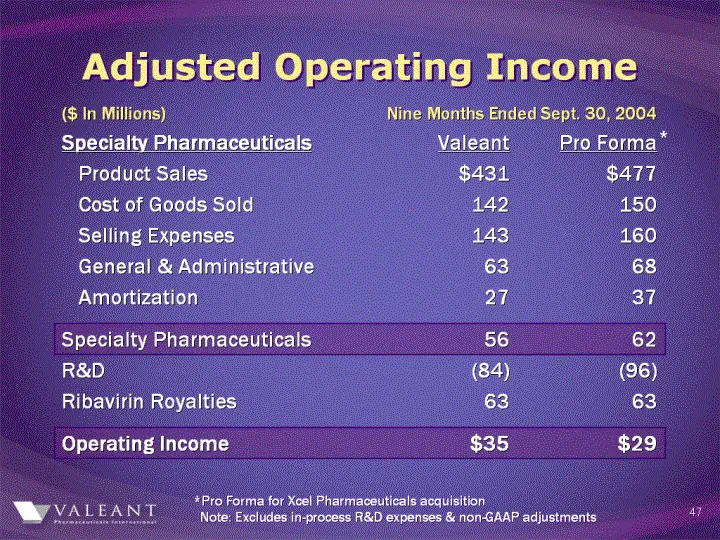
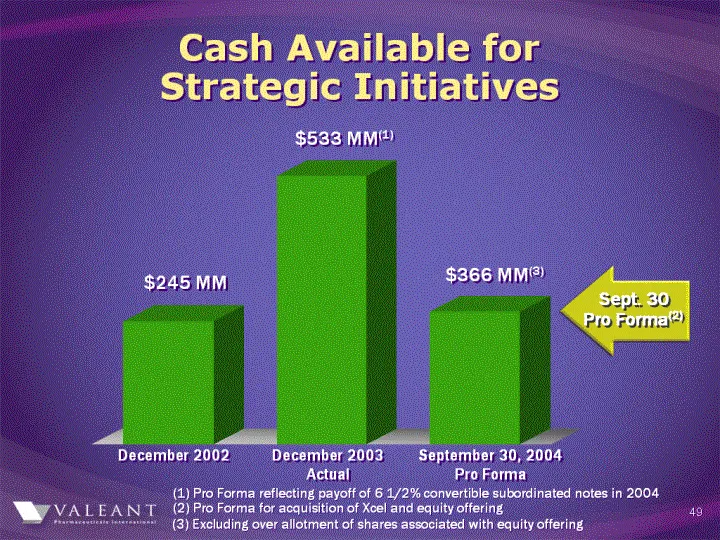
Cash Available for Strategic Initiatives (1) Pro Forma reflecting payoff of 61/2% convertible subordinated notes in 2004
Slide 48: Cash Available for Strategic Initiatives
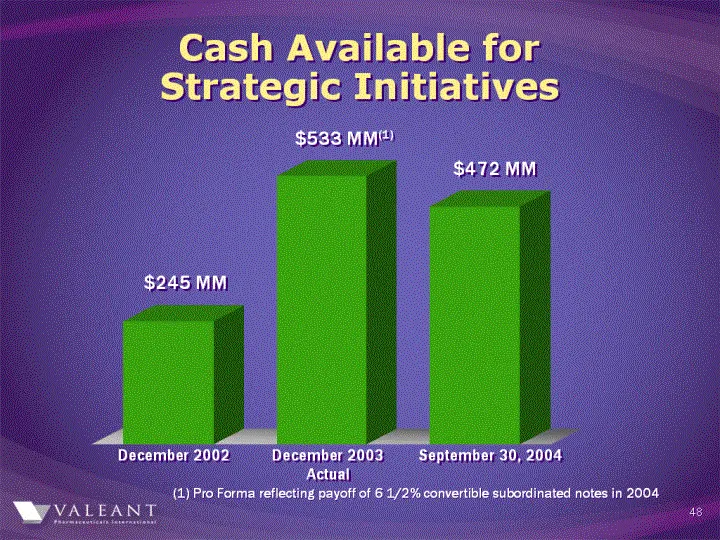
Cash Available for Strategic Initiatives (1)Pro Forma reflecting payoff of 61/2% convertible subordinated notes in 2004 (2) Pro Forma for acquisition of Xcel and equity offering (3) Excluding over allotment of shares associated with equity offering
Slide 49: Balance Sheet
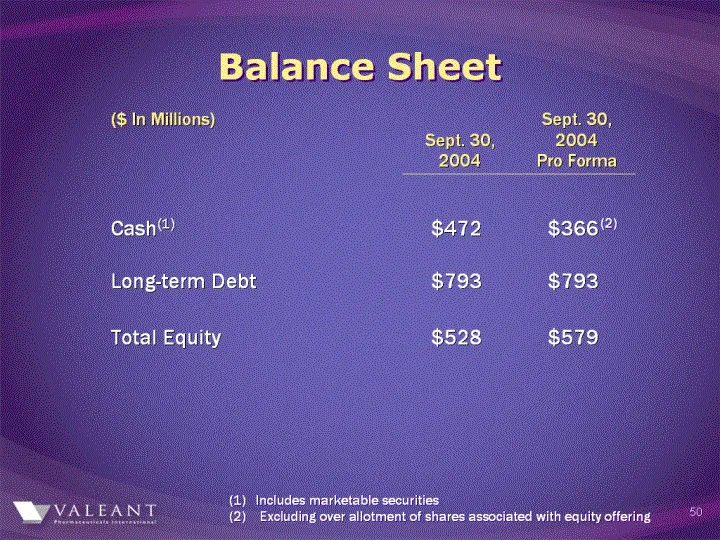
Balance Sheet ($ In Millions) Sept. 30, 2004 Sept. 30, 2004 Pro Forma Cash(1) $472 $366(2) Long-term Debt $793 $793 Total Equity $528 $579 (1) Includes ,marketable securities (2) Excluding over allotment so shares associated with equity offering
Slide 50: Financial Metrics
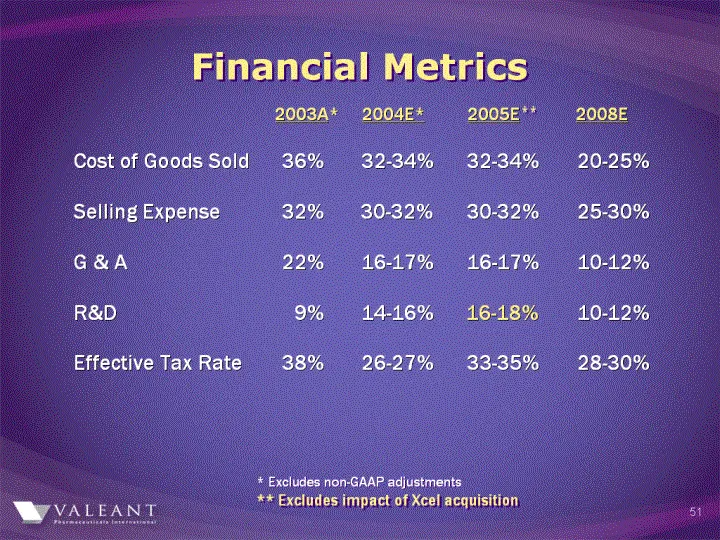
Financial Metrics 2003 A * 2004 E * 2005 E ** 2008E Cost of Goods Sold 36% 32-34% 32-34% 20-25% Selling Expense 32% 30-32% 30-32% 25-30% G & A 22% 16-17% 16-17% 10-12% R & D 9% 14-16% 16-18% 10-12% Effective Tax Rate 38% 26-27% 33-35% 28-30% *Excludes non – GAAP adjustments **Excludes impact of Xcel
Slide 51: Delivering Results, Keeping Our Promises, Positioning VRX for the Future
VALEANT Pharmaceutical International Delivering Results Keeping Our Promises Positioning VRX for the Future
Slide 52: Delivering Results, Keeping Our Promises, Positioning VRX for the Future
Source: SEC EDGAR · 8-K filed Feb 8, 2005
More decks from Valeant Pharmaceuticals International Inc
 Q2 2010 Earnings Presentation25 slides · Aug 3, 2010
 Q2 2010 Earnings Presentation25 slides · Aug 2, 2010
 Merger or Acquisition (June 2010)22 slides · Jun 21, 2010
 Merger or Acquisition (December 2008)14 slides · Dec 10, 2008
 Technical Presentation (May 2008)20 slides · May 13, 2008
 Investor Presentation (March 2008)42 slides · Mar 27, 2008