Tristel PLC · LSE:TSTL
Tristel — H1 2015-16 Earnings Presentation
16 slides from Tristel's earnings presentation, Feb 24, 2016
Slide 1: Interim results presentation 31 December 2015
Paul Swinney: CEO Paul Swinney: CEO Liz Dixon: FD Liz Dixon: FD Interim results presentation 31 December 2015
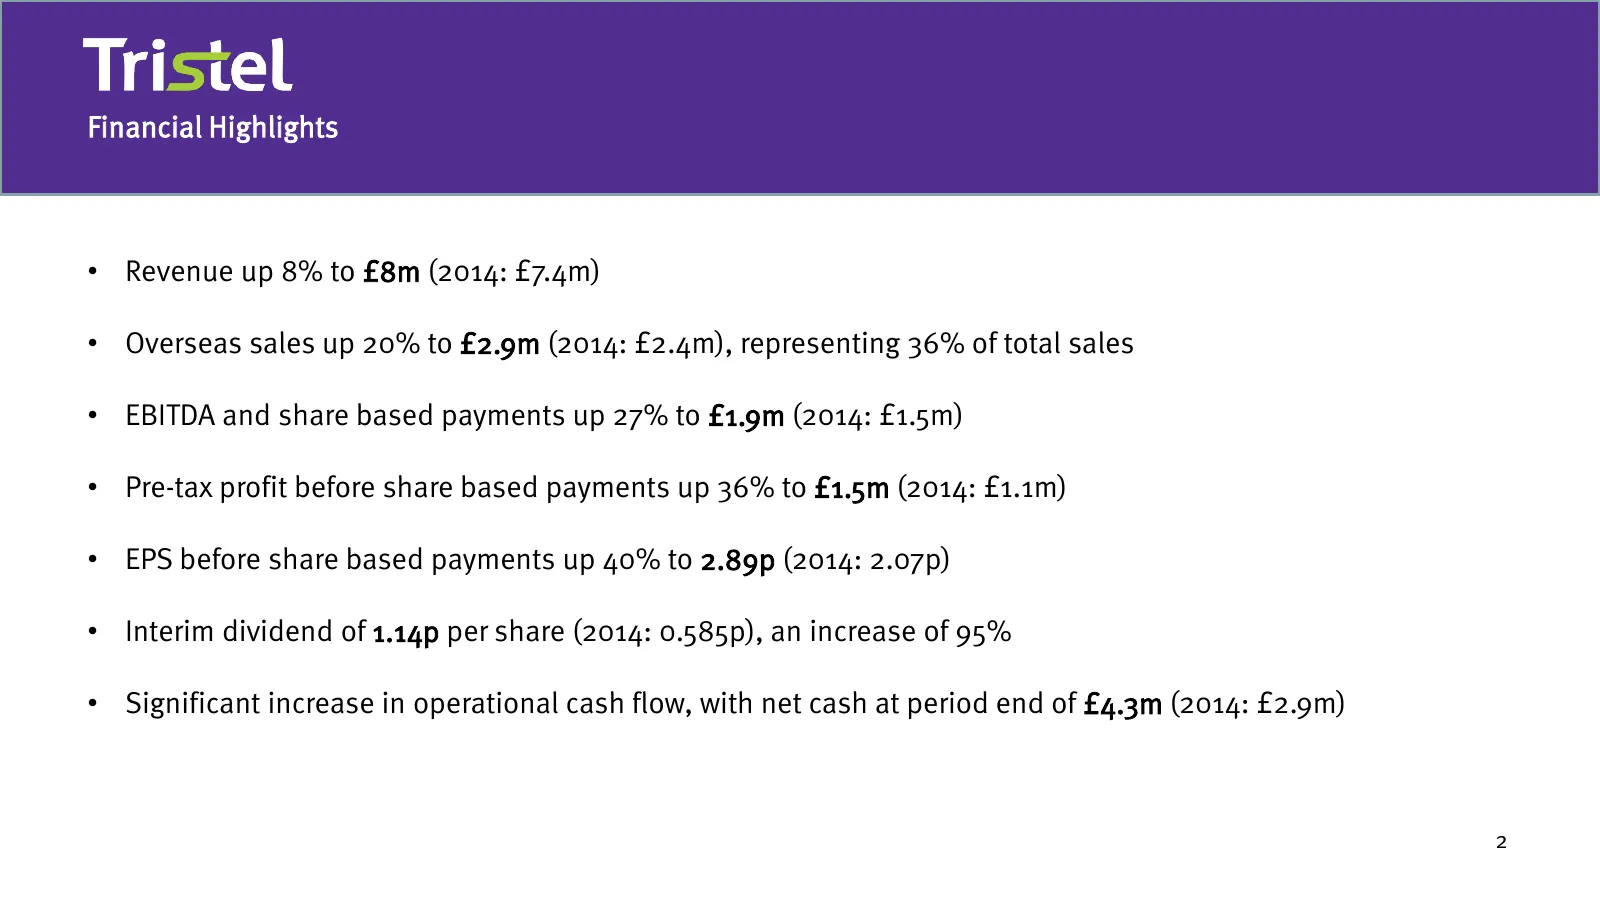
Slide 2: Financial Highlights
Financial Highlights • Revenue up 8% to £8m (2014: £7.4m) • Overseas sales up 20% to £2.9m (2014: £2.4m), representing 36% of total sales • EBITDA and share based payments up 27% to £1.9m (2014: £1.5m) • Pre-tax profit before share based payments up 36% to £1.5m (2014: £1.1m) • EPS before share base
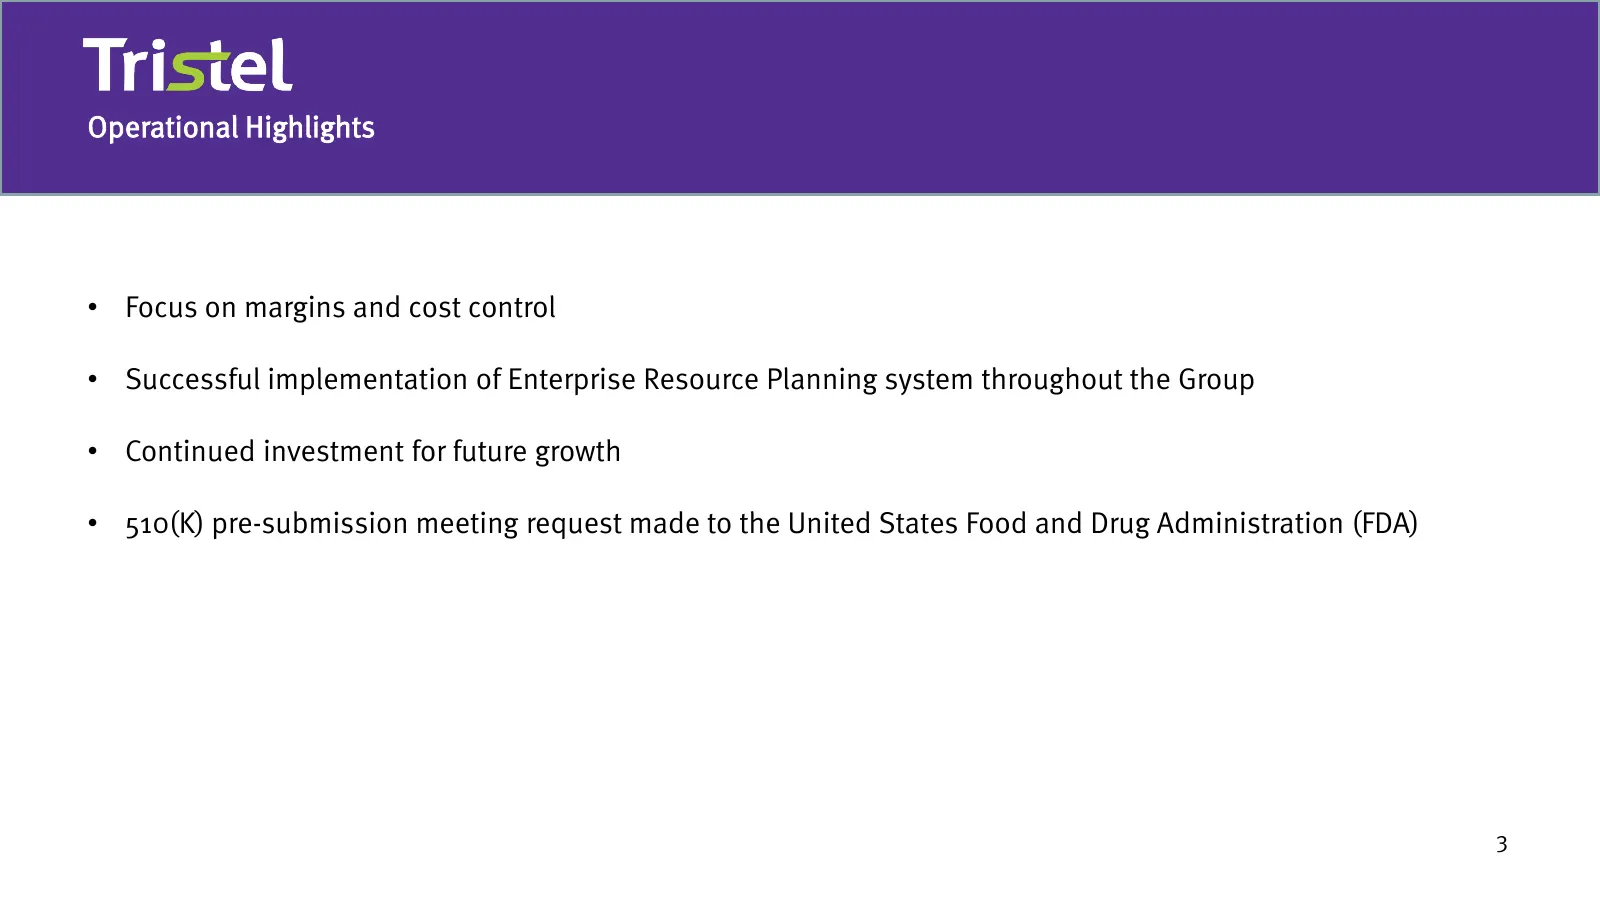
Slide 3: Operational Highlights
Operational Highlights • Focus on margins and cost control • Successful implementation of Enterprise Resource Planning system throughout the Group • Continued investment for future growth • 510(K) pre-submission meeting request made to the United States Food and Drug Administration (FDA) 3
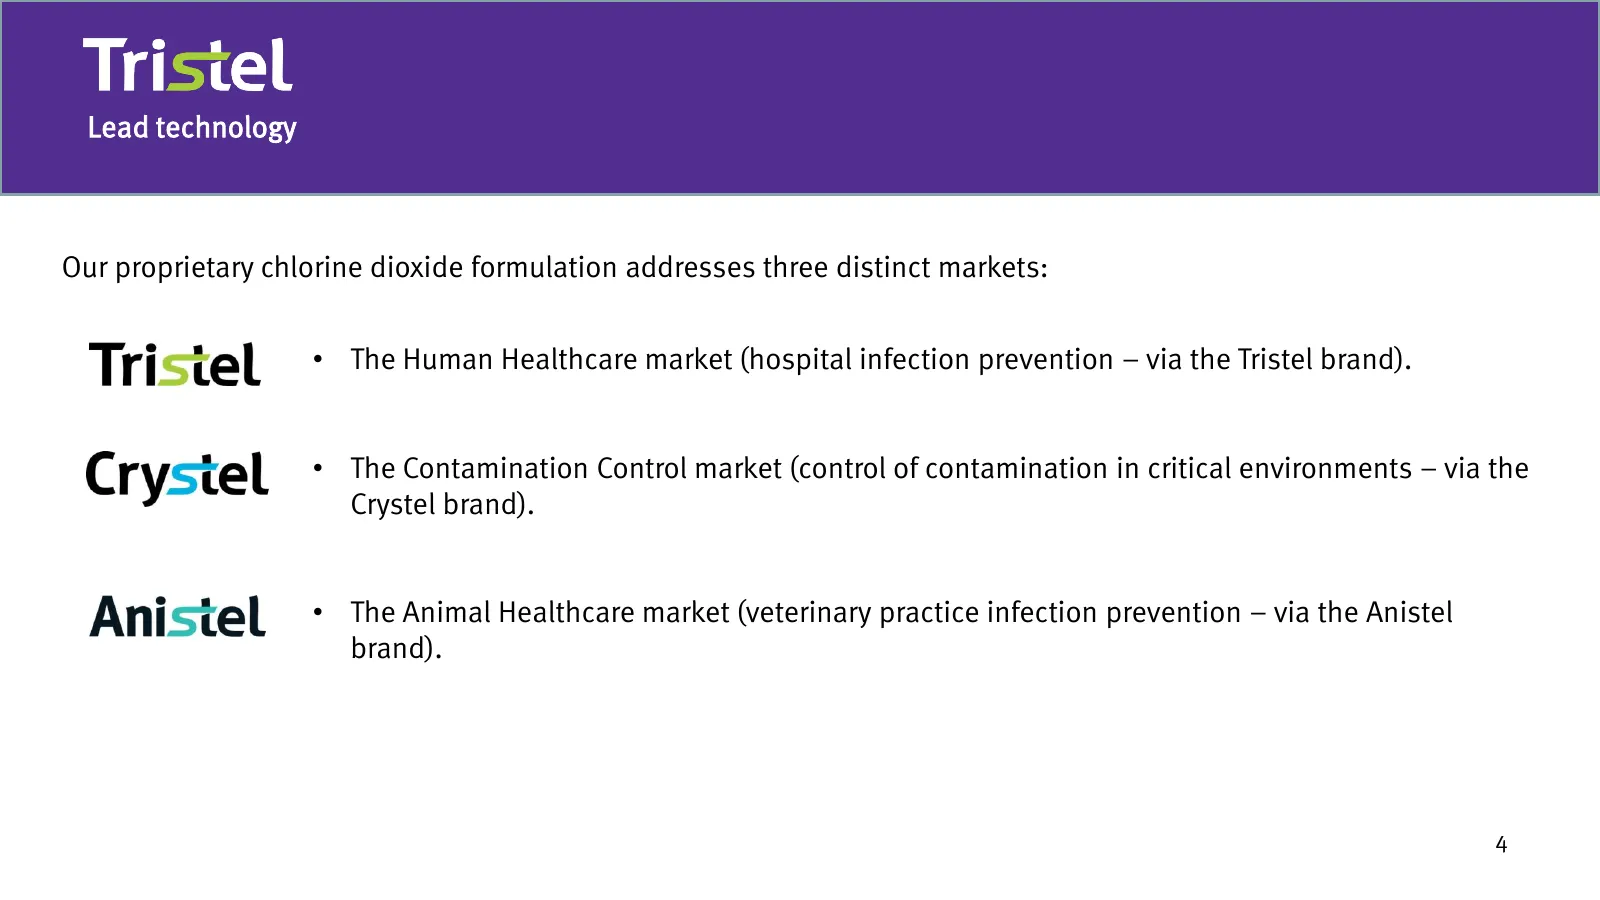
Slide 4: Lead technology
Lead technology Our proprietary chlorine dioxide formulation addresses three distinct markets: • The Human Healthcare market (hospital infection prevention – via the Tristel brand). • The Contamination Control market (control of contamination in critical environments – via the Crystel brand). • The
Slide 5: Strategic financial goals
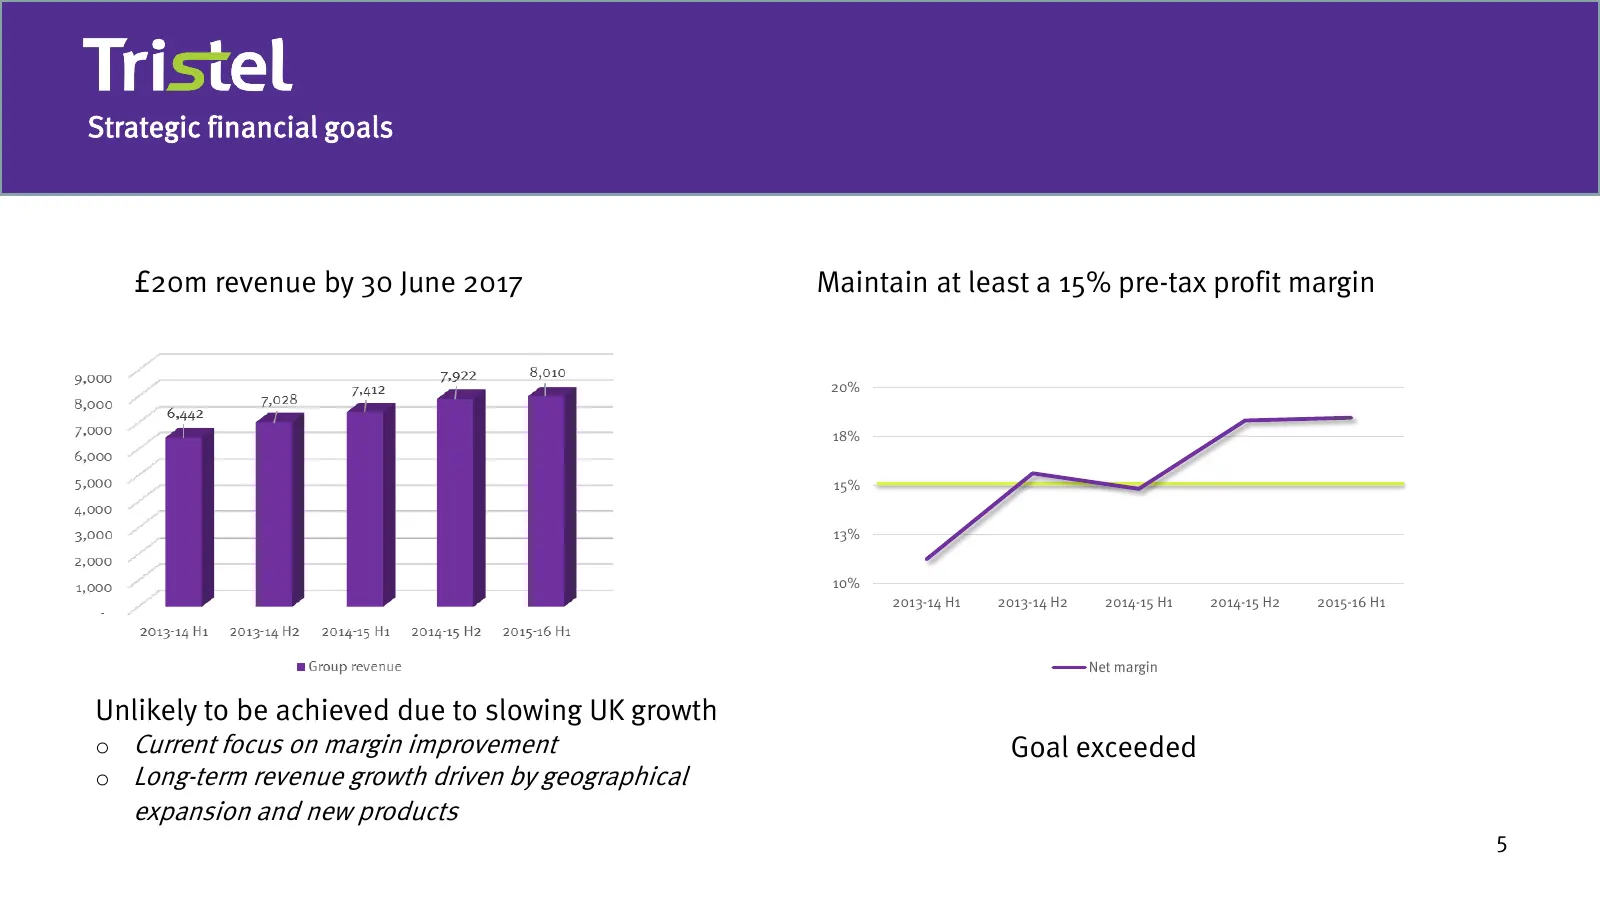
Strategic financial goals £20m revenue by 30 June 2017 Maintain at least a 15% pre-tax profit margin 20% 18% 15% 13% +29% 10% 2013-14 H1 2013-14 H2 2014-15 H1 2014-15 H2 2015-16 H1 Gross profit 72% Gross profit 50% Net margin Unlikely to be achieved due to slowing UK growth o Current focus on margin
Slide 6: Revenue dynamics
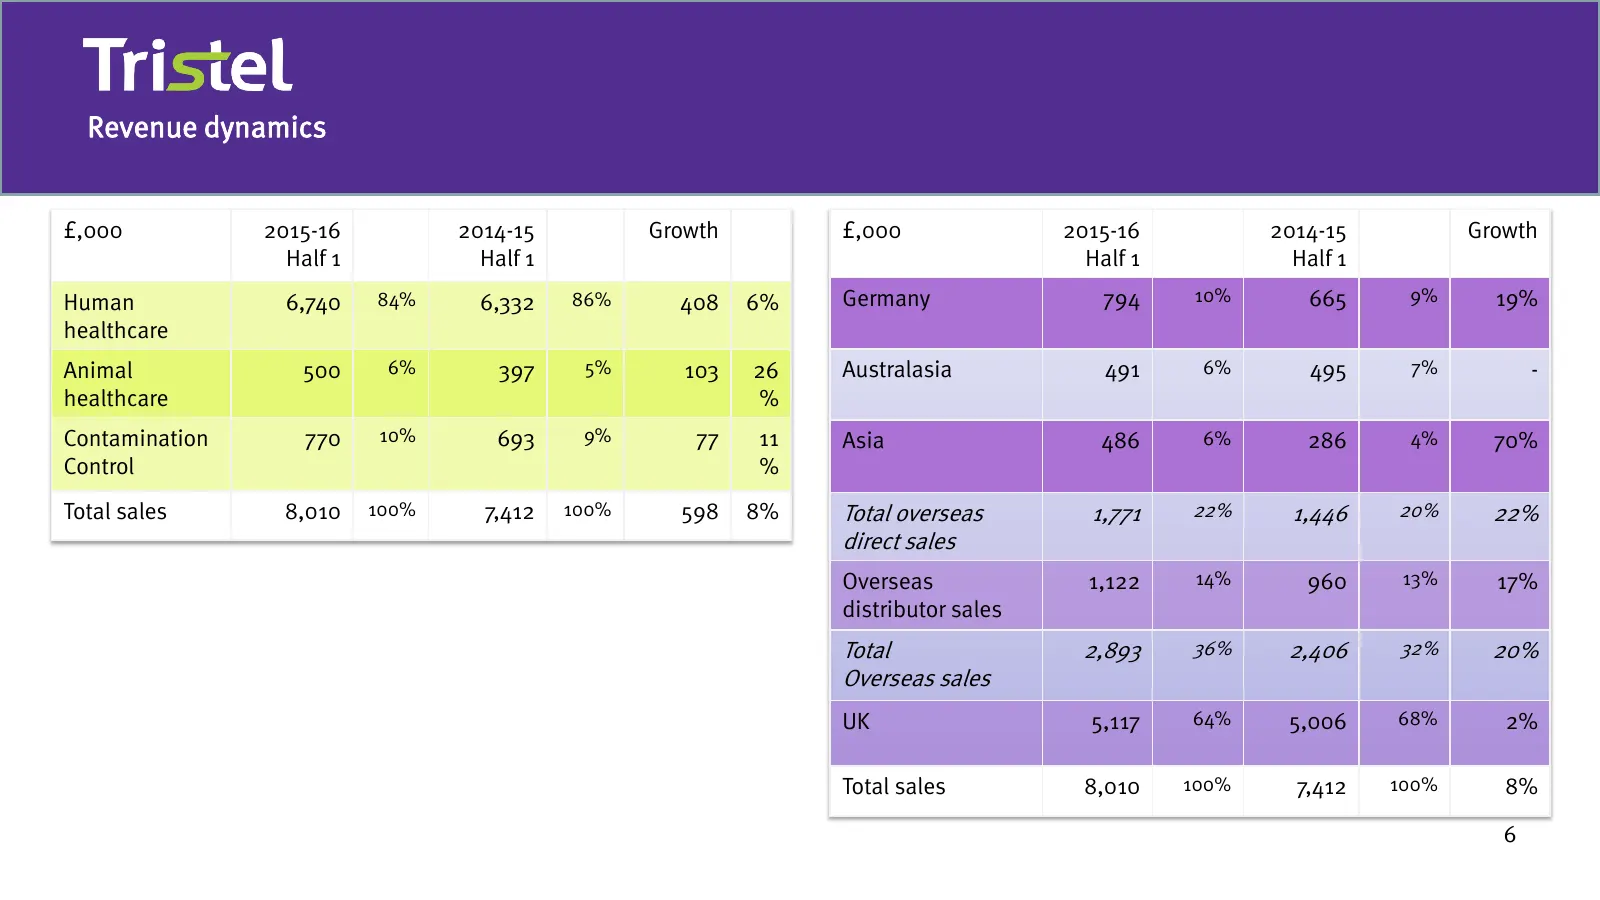
Revenue dynamics £,000 2015-16 2014-15 Growth £,000 2015-16 2014-15 Growth Half 1 Half 1 Half 1 Half 1 Human 6,740 84% 6,332 86% 408 6% Germany 794 10% 665 9% 19% healthcare Animal 500 6% 397 5% 103 26 Australasia 491 6% 495 7% - healthcare % Contamination 770 10% 693 9% 77 11 Asia 486 6% 286 4% 70%
Slide 7: Revenue detail
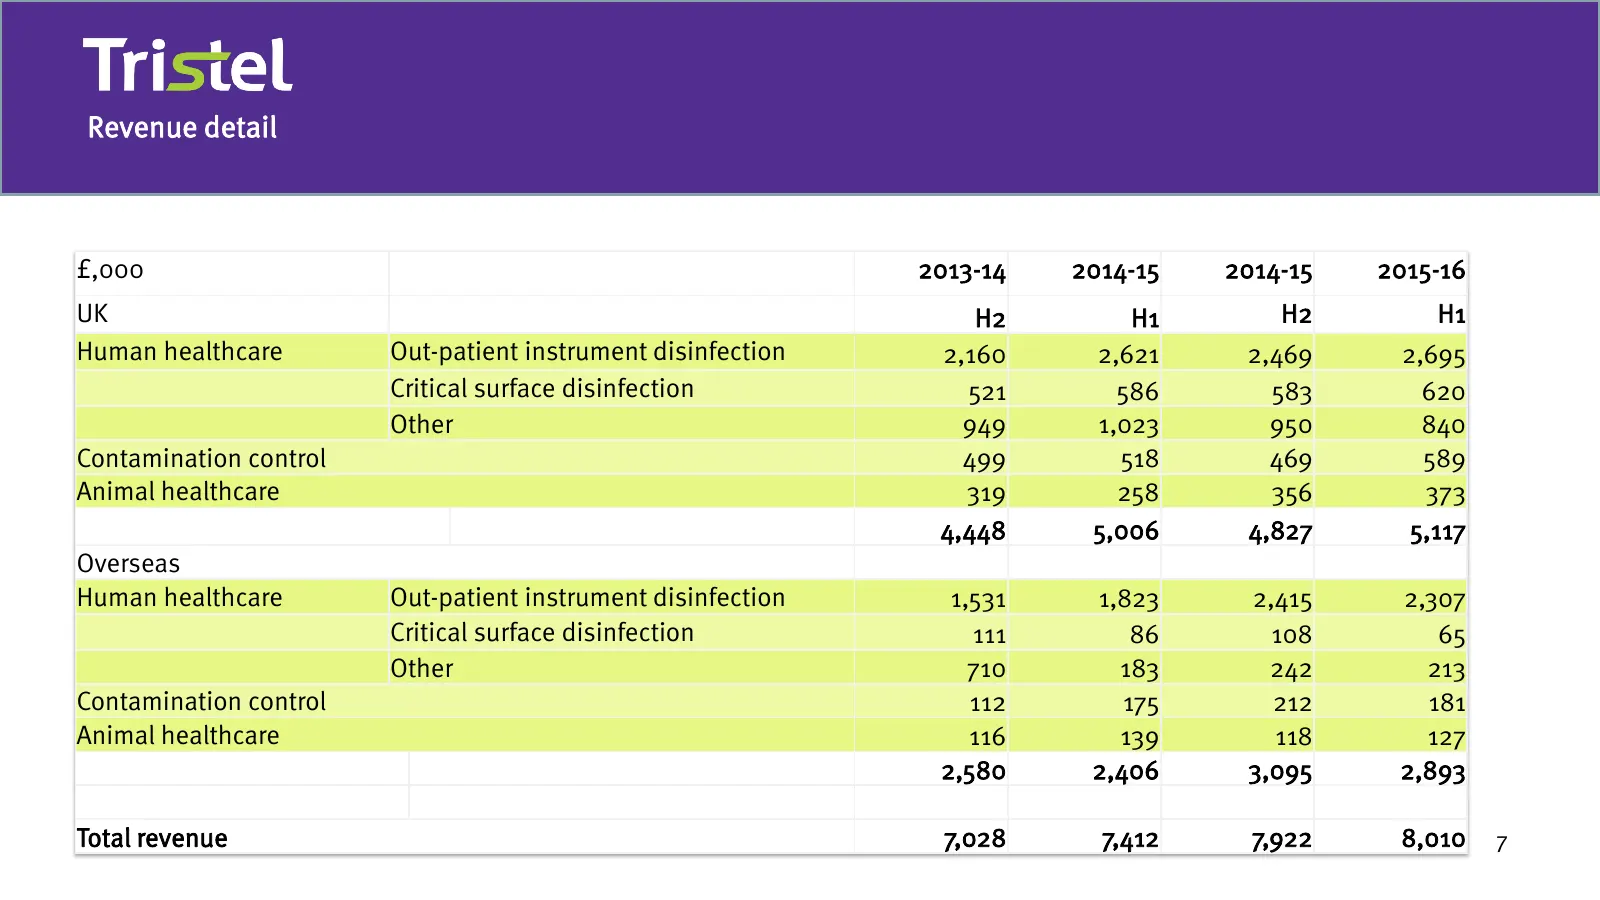
Revenue detail £,000 2013-14 2014-15 2014-15 2015-16 UK H2 H1 H2 H1 Human healthcare Out-patient instrument disinfection 2,160 2,621 2,469 2,695 Critical surface disinfection 521 586 583 620 Other 949 1,023 950 840 Contamination control 499 518 469 589 Animal healthcare 319 258 356 373 4,448 5,006 4
Slide 8: Productivity investments & gross margin improvements
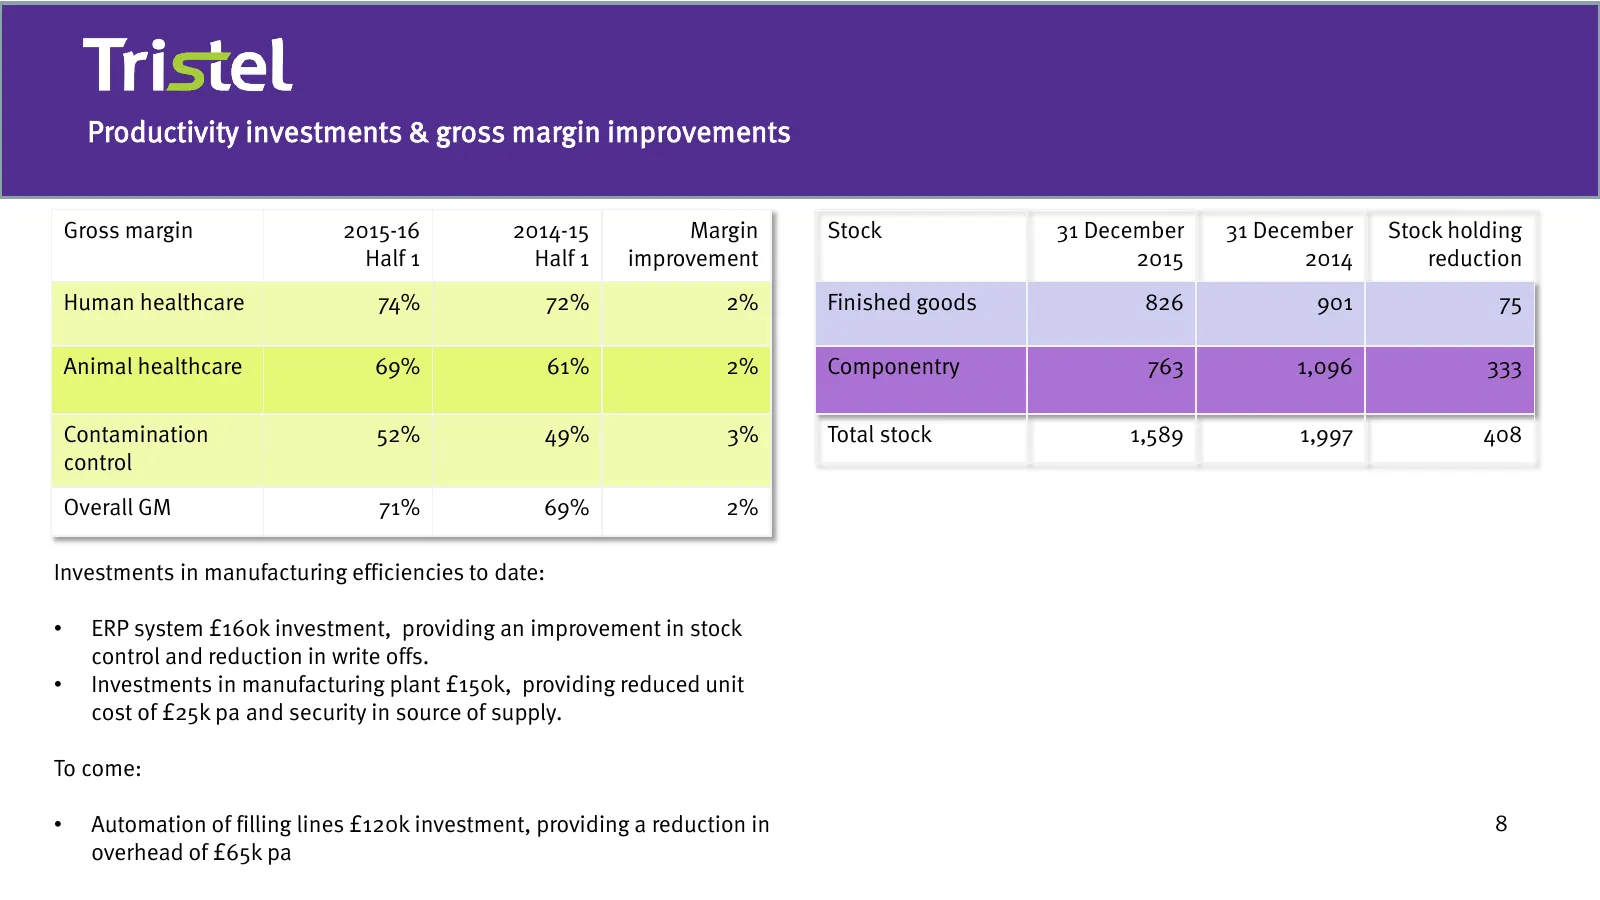
Productivity investments & gross margin improvements Gross margin 2015-16 2014-15 Margin Stock 31 December 31 December Stock holding Half 1 Half 1 improvement 2015 2014 reduction Human healthcare 74% 72% 2% Finished goods 826 901 75 Animal healthcare 69% 61% 2% Componentry 763 1,096 333 Contaminatio
Slide 9: Selection of regulatory approval initiatives
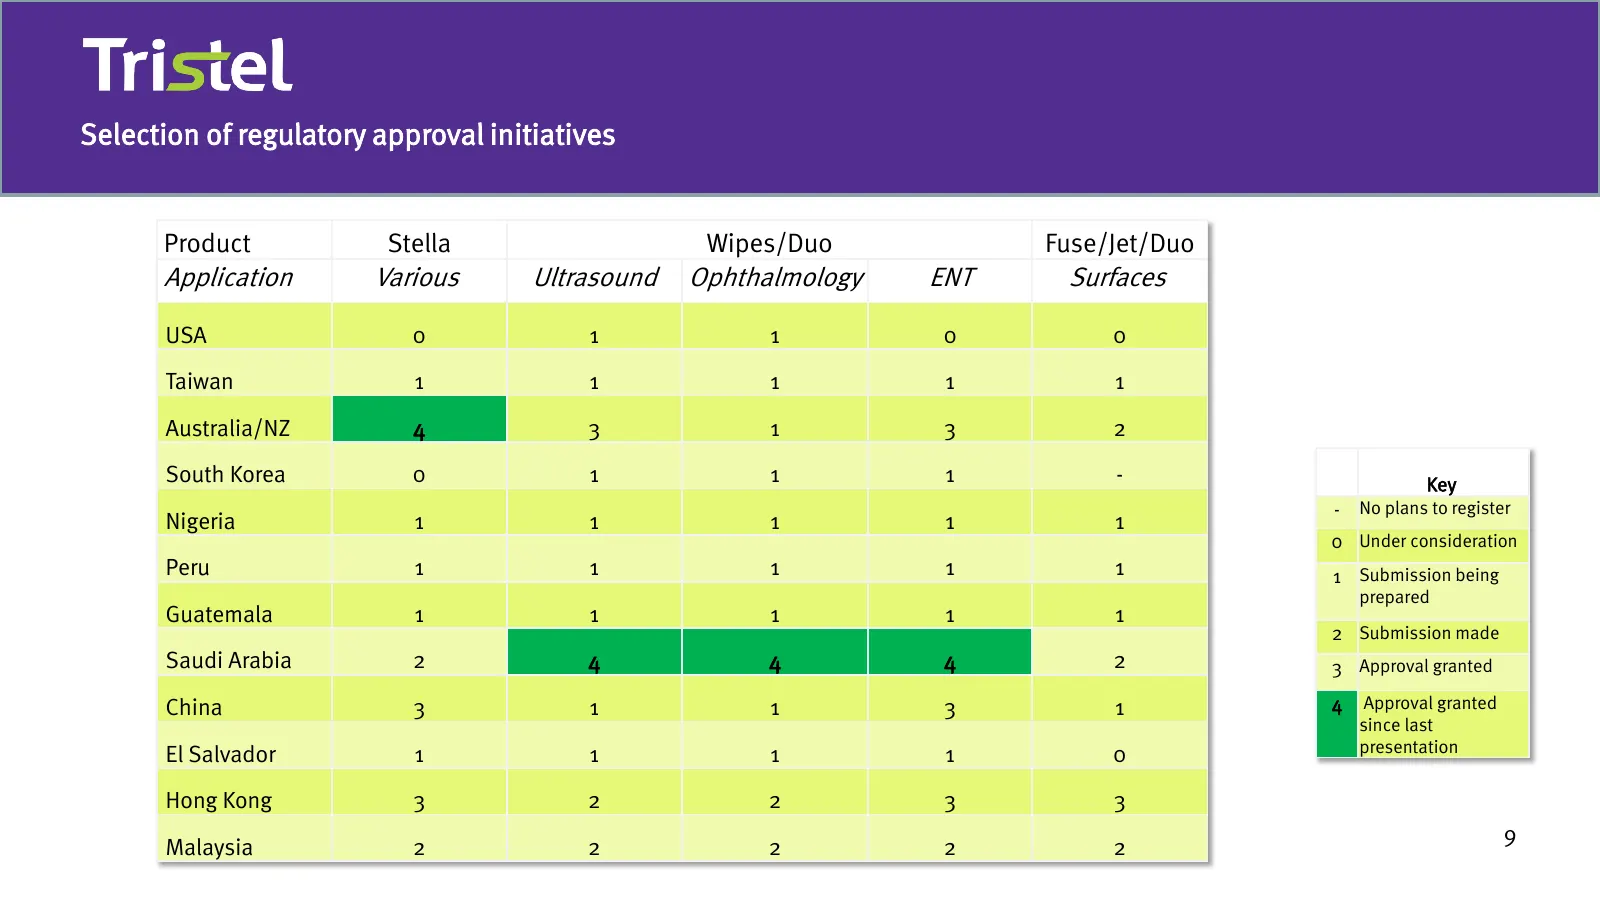
Selection of regulatory approval initiatives Product Stella Wipes/Duo Fuse/Jet/Duo Application Various Ultrasound Ophthalmology ENT Surfaces USA 0 1 1 0 0 Taiwan 1 1 1 1 1 Australia/NZ 4 3 1 3 2 South Korea 0 1 1 1 - Key - No plans to register Nigeria 1 1 1 1 1 0 Under consideration Peru 1 1 1 1 1 1
Slide 10: USA regulatory approval initiative
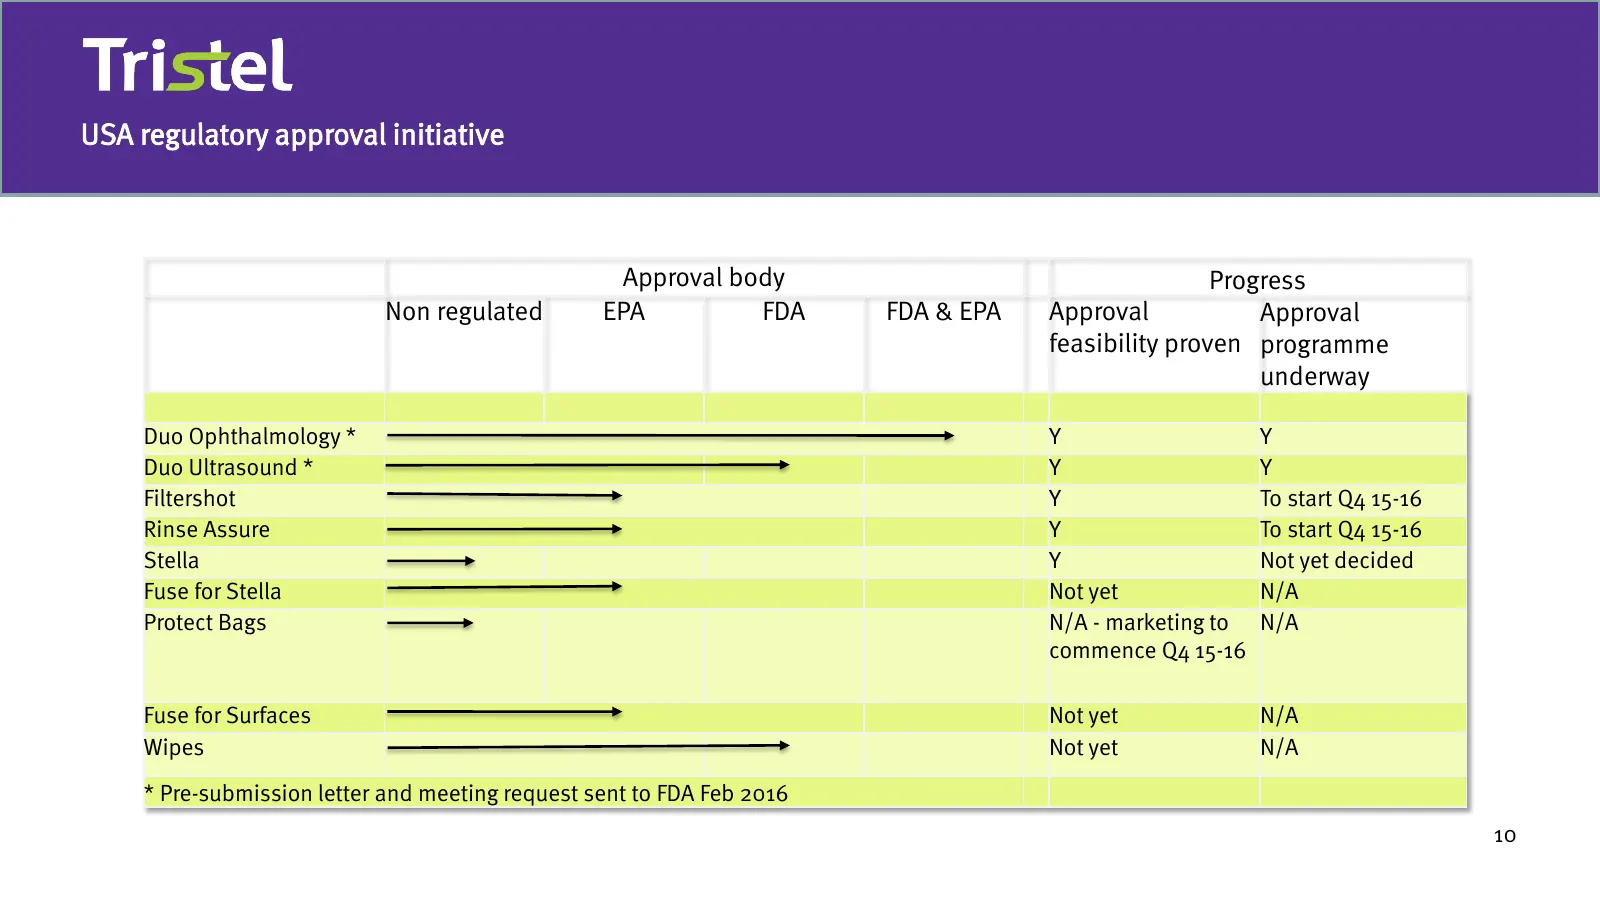
USA regulatory approval initiative Approval body Progress Non regulated EPA FDA FDA & EPA Approval Approval feasibility proven programme underway Duo Ophthalmology * Y Y Duo Ultrasound * Y Y Filtershot Y To start Q4 15-16 Rinse Assure Y To start Q4 15-16 Stella Y Not yet decided Fuse for Stella Not
Slide 11: Outlook and Summary
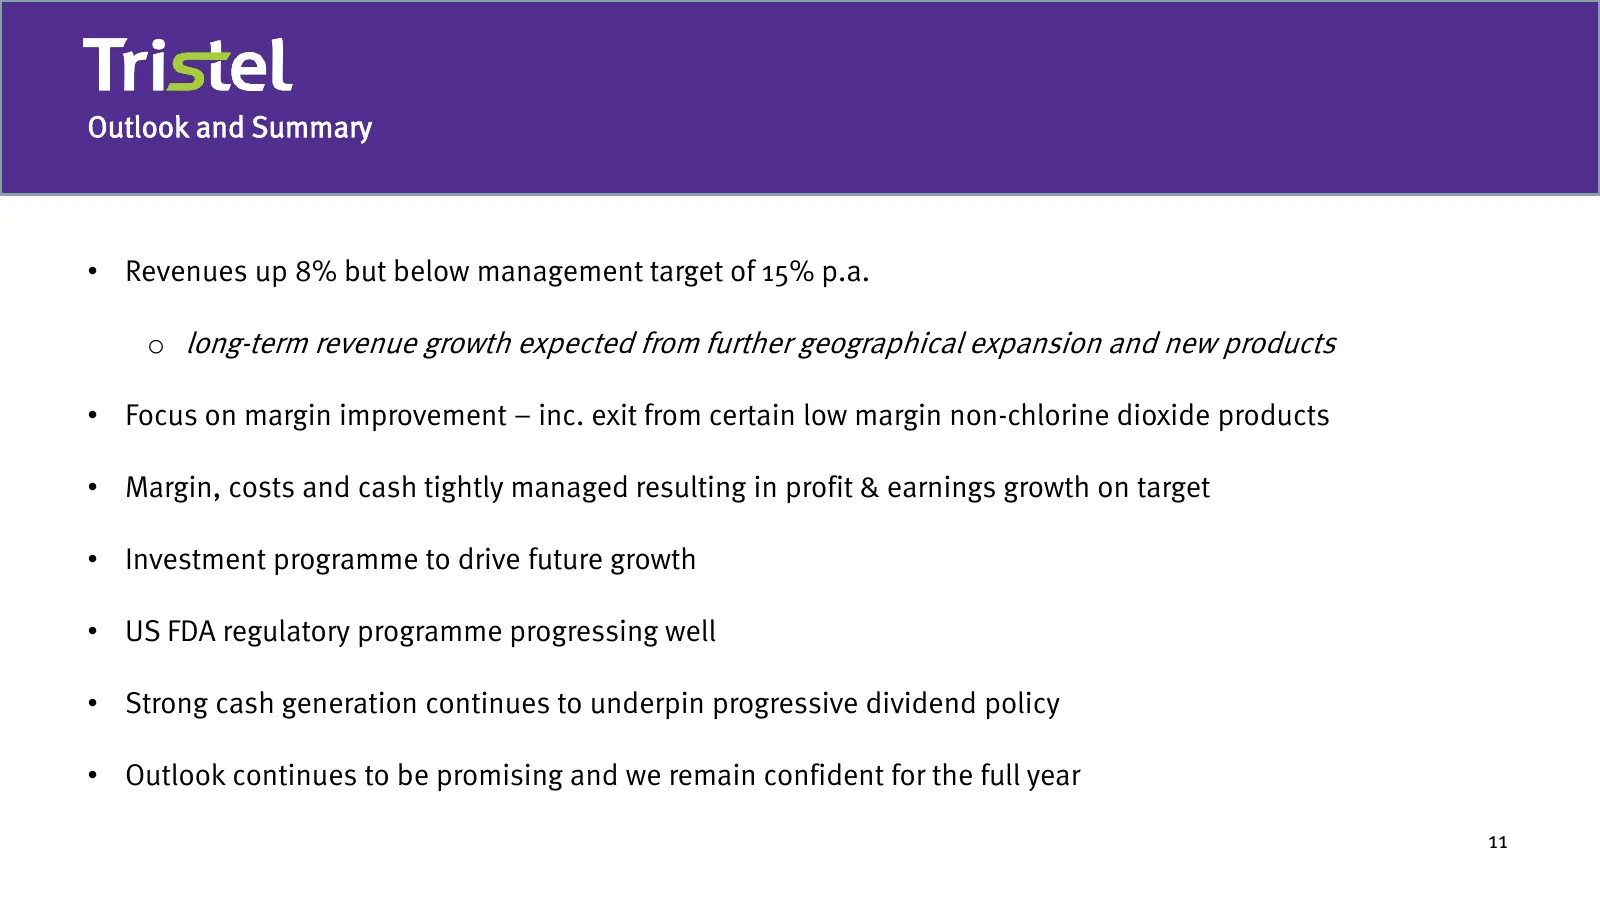
Outlook and Summary • Revenues up 8% but below management target of 15% p.a. o long-term revenue growth expected from further geographical expansion and new products • Focus on margin improvement – inc. exit from certain low margin non-chlorine dioxide products • Margin, costs and cash tightly manag
Slide 12: Income Statement
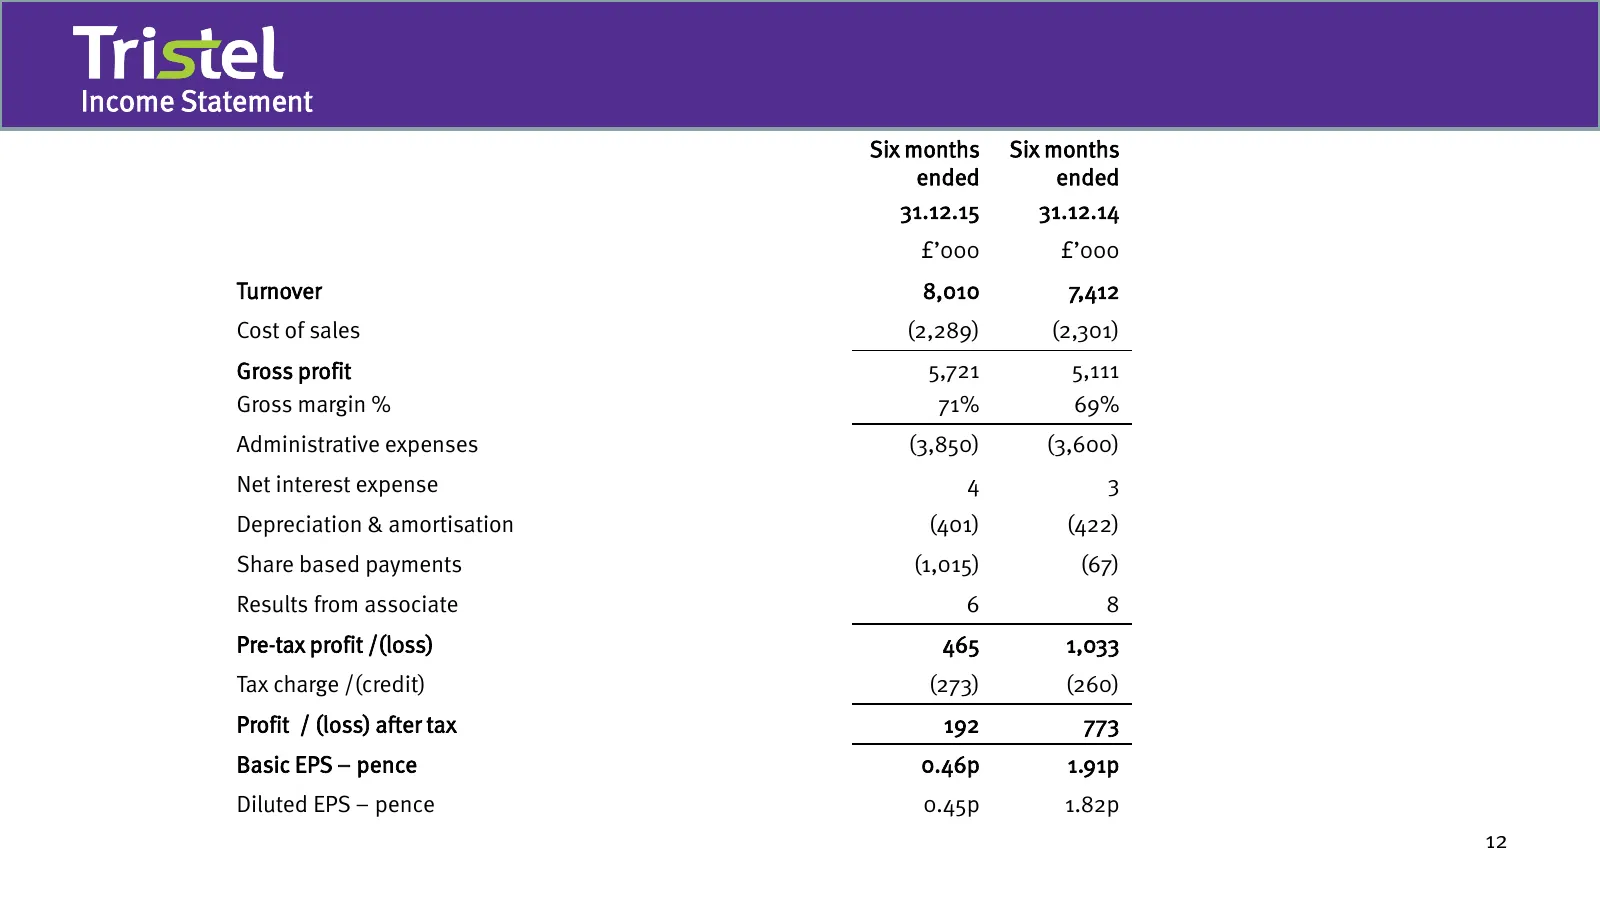
Income Statement Six months Six months ended ended 31.12.15 31.12.14 £’000 £’000 Turnover 8,010 7,412 Cost of sales (2,289) (2,301) Gross profit 5,721 5,111 Gross margin % 71% 69% Administrative expenses (3,850) (3,600) Net interest expense 4 3 Depreciation & amortisation (401) (422) Share based pay
Slide 13: Balance Sheet
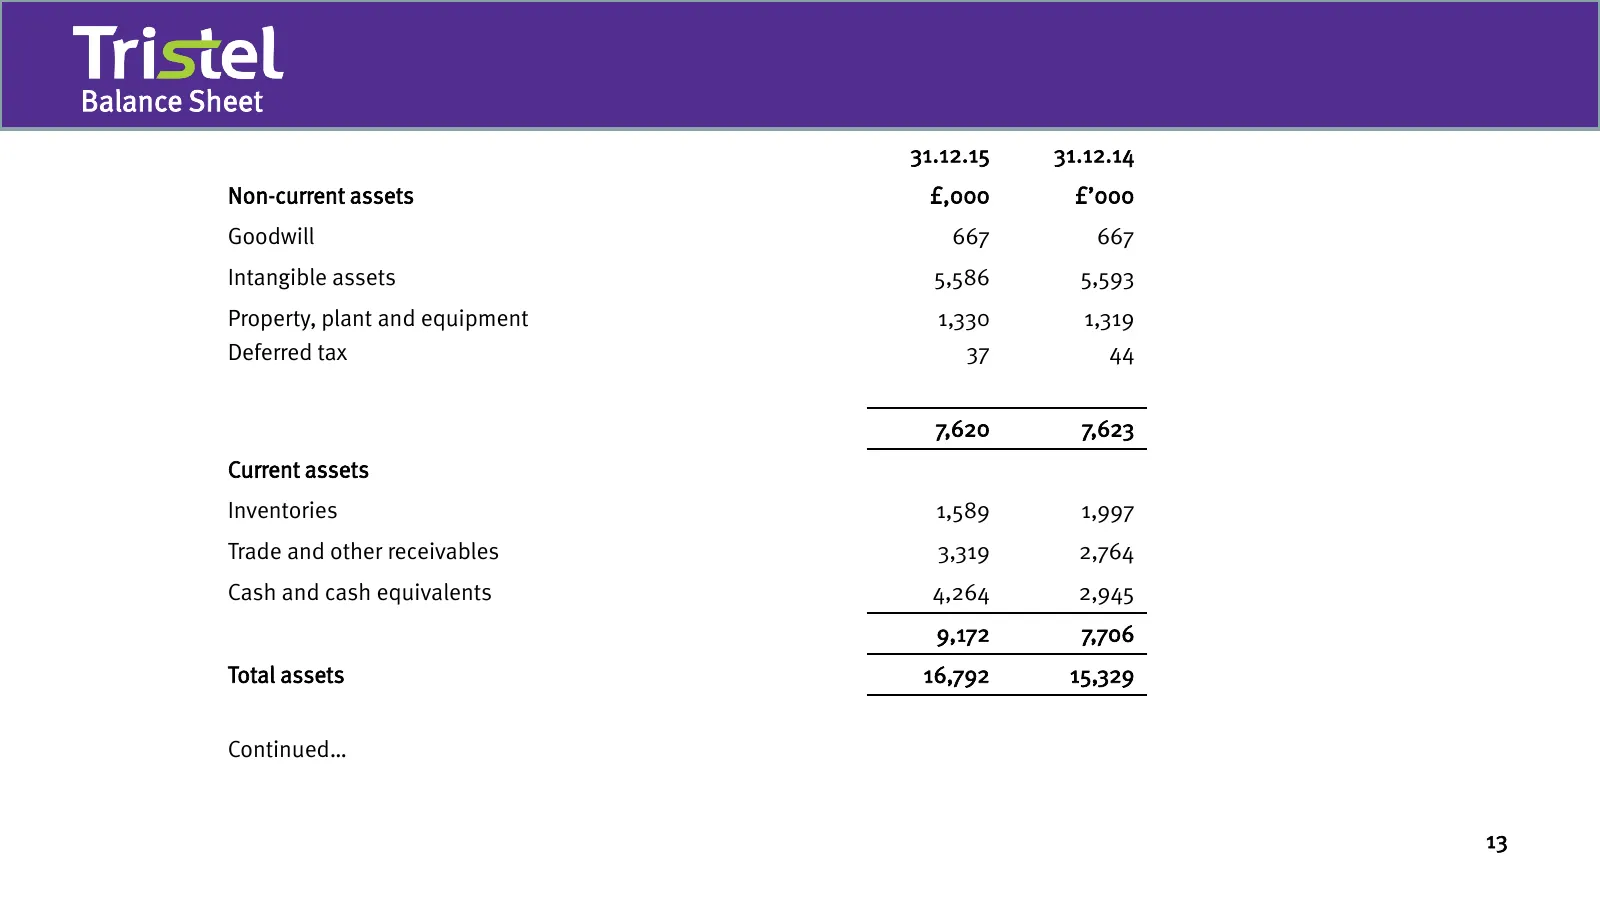
Balance Sheet 31.12.15 31.12.14 Non-current assets £,000 £’000 Goodwill 667 667 Intangible assets 5,586 5,593 Property, plant and equipment 1,330 1,319 Deferred tax 37 44 7,620 7,623 Current assets Inventories 1,589 1,997 Trade and other receivables 3,319 2,764 Cash and cash equivalents 4,264 2,945
Slide 14: Balance Sheet continued
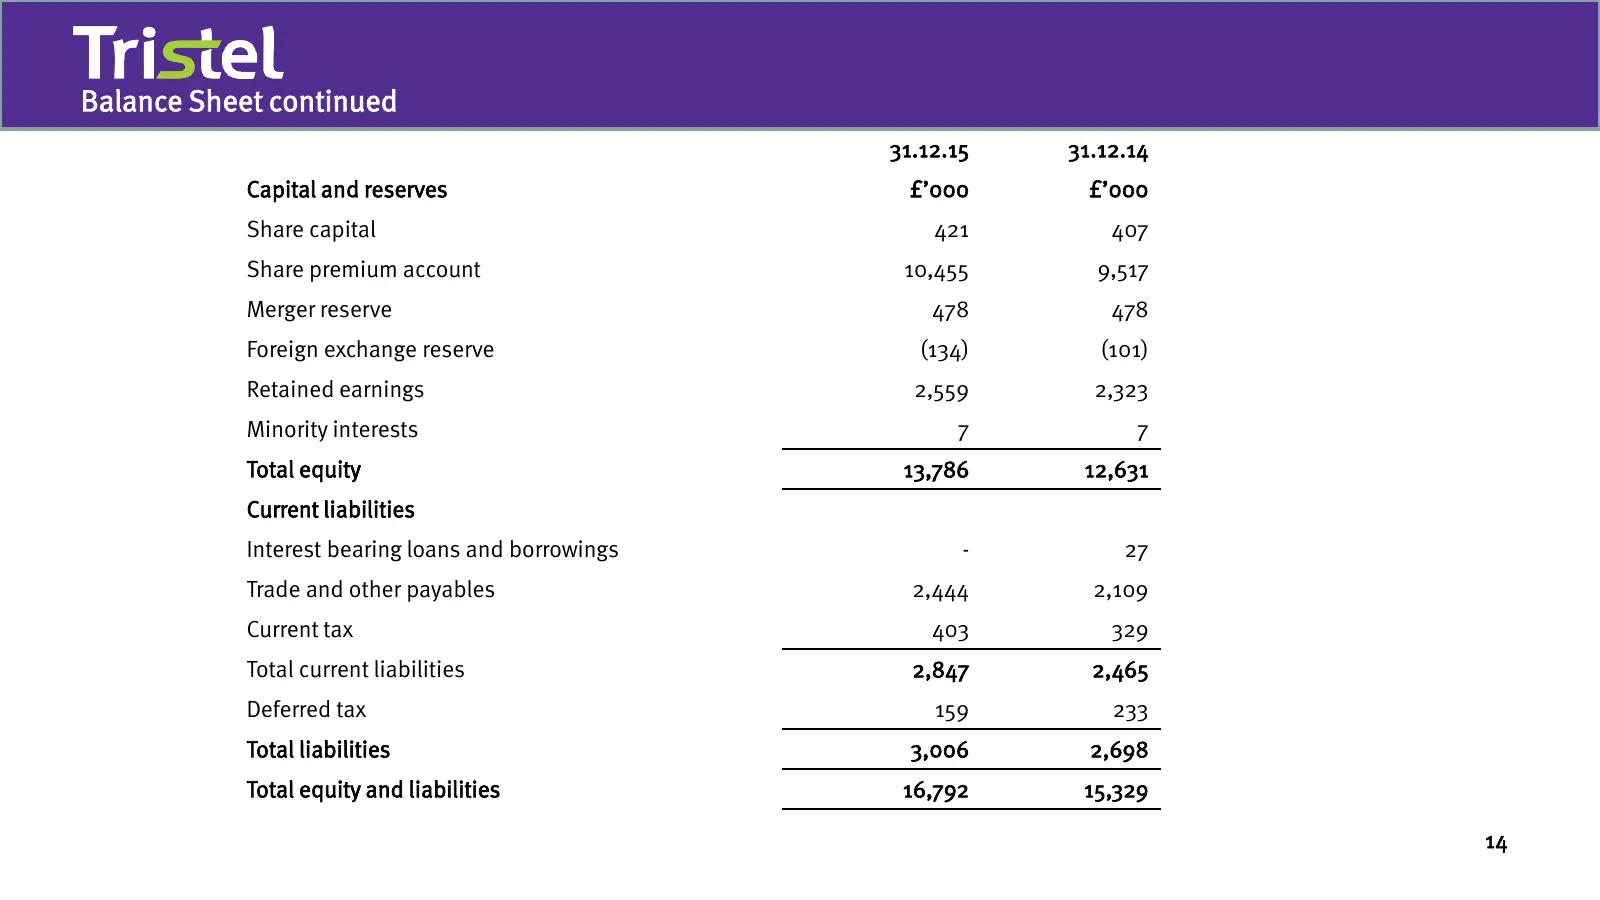
Balance Sheet continued 31.12.15 31.12.14 Capital and reserves £’000 £’000 Share capital 421 407 Share premium account 10,455 9,517 Merger reserve 478 478 Foreign exchange reserve (134) (101) Retained earnings 2,559 2,323 Minority interests 7 7 Total equity 13,786 12,631 Current liabilities Interest
Slide 15: Cash flow reconciliation
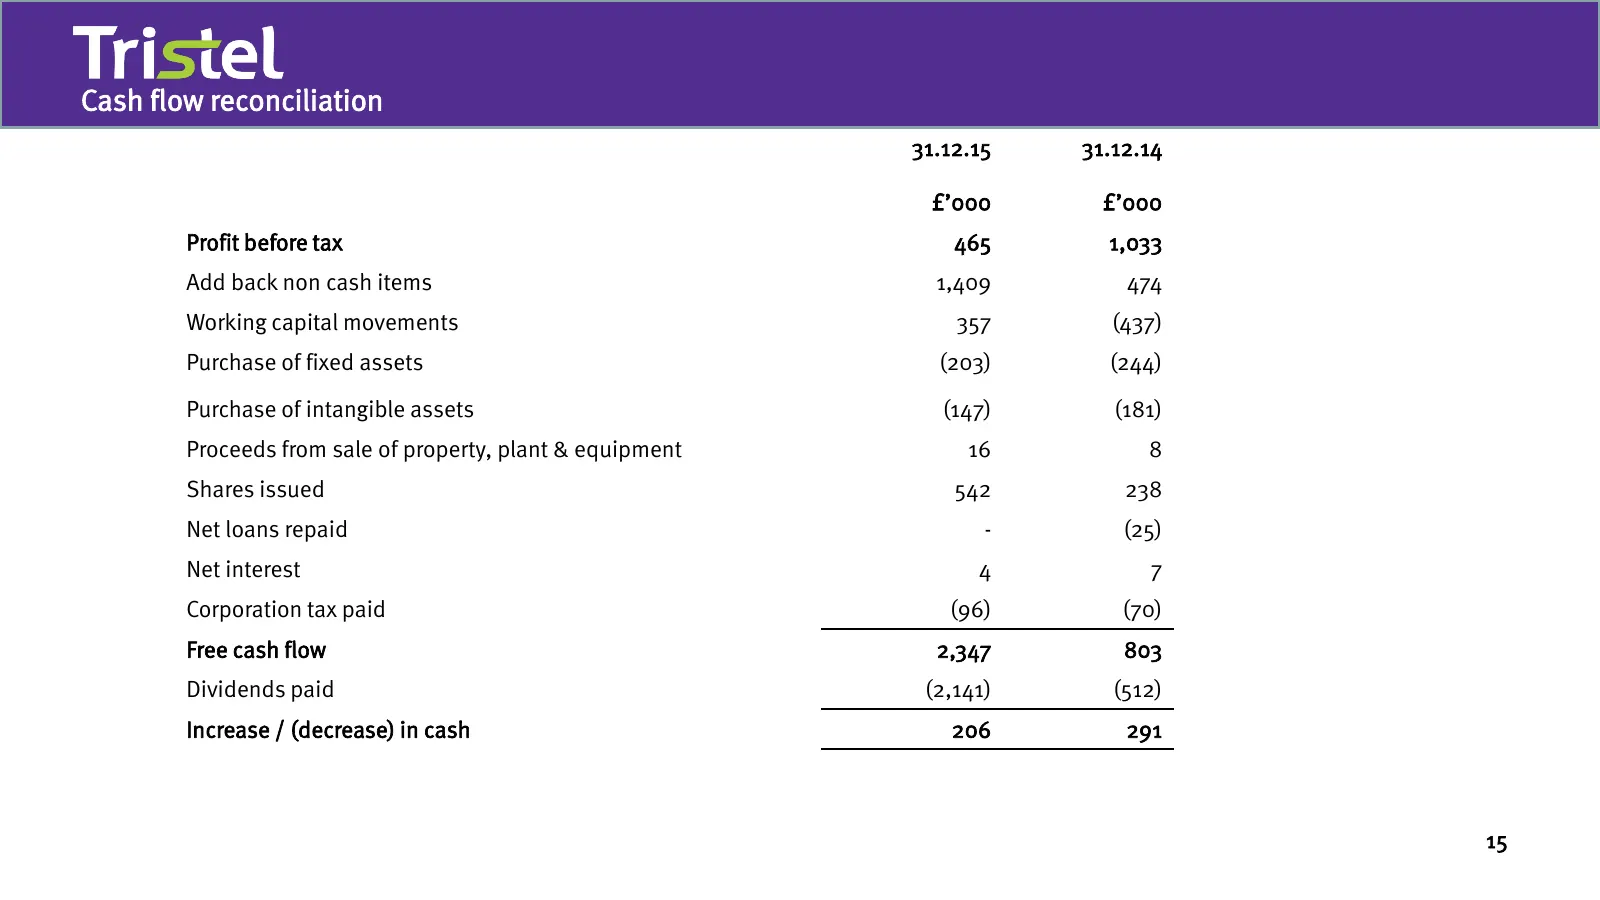
Cash flow reconciliation 31.12.15 31.12.14 £’000 £’000 Profit before tax 465 1,033 Add back non cash items 1,409 474 Working capital movements 357 (437) Purchase of fixed assets (203) (244) Purchase of intangible assets (147) (181) Proceeds from sale of property, plant & equipment 16 8 Shares issued
Slide 16: Paulswinney@tristel.com lizdixon@tristel.com tristel@walbrook.com
16 Paulswinney@tristel.com lizdixon@tristel.com tristel@walbrook.com
Source: Internet Archive copy of tristel.com
More decks from Tristel PLC
 ShareSoc Leeds (April 2026)26 slides · April 2026
 FY2025 Earnings Presentation49 slides · October 2025
 Investor Presentation (June 2025)15 slides · June 2025
 Q2 2025 Earnings Presentation31 slides · Feb 24, 2025
 Investor Presentation (October 2024)28 slides · October 2024
 H1 2024 Earnings Presentation21 slides · February 2024