American Railcar Industries Inc
American Railcar Industries — Q1 2015 Earnings Presentation
12 slides from American Railcar Industries's earnings presentation, Apr 29, 2015
Slide 1: Q1 2015 Supplemental Information
Vetta itn om « | iM inf ge” Pa L__} Ql 2015 SomeaaeRE INFORMATION INVESTOR CONTACT: (636) 940-6000 WEBSITE: WW\W.AMERICANRAILCAR.COM 3 = i. ‘is
Slide 2: Forward Looking Disclaimer
Forward Looking Disclaimer sa a ' = future presentation,
Slide 3: ARI Key Railcar Markets
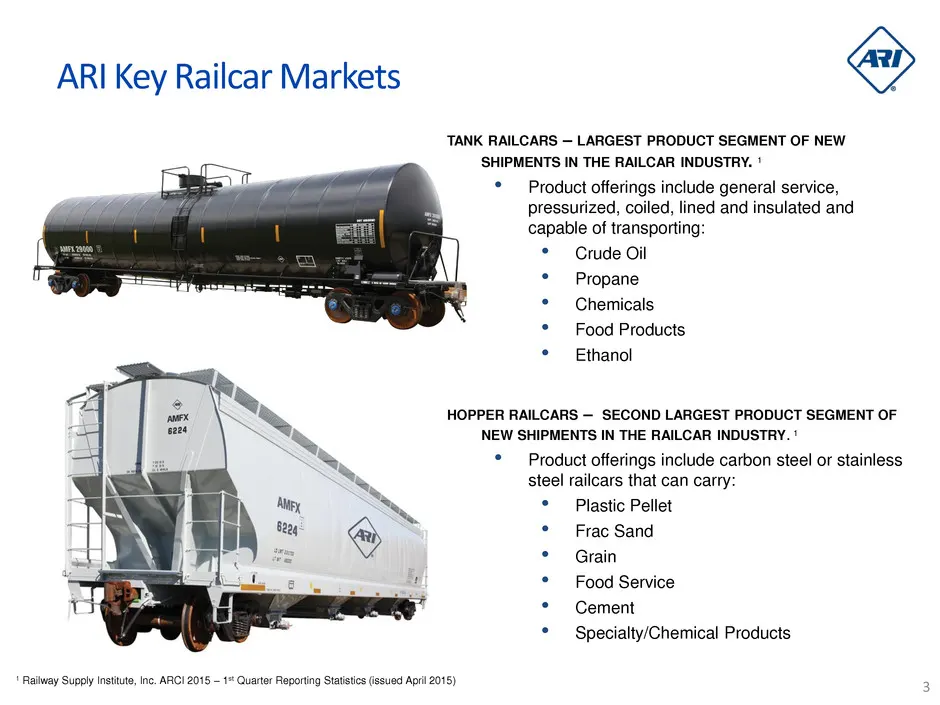
ARI Key Railcar Markets TANK RAILCARS — LARGEST PRODUCT SEGMENT OF NEW IPMENTS IN THE RAILCAR INDUSTRY. ' * Product offerings include general service, pressurized, coiled, lined and insulated and capable of transporting: * Crude Oil * Propane * Chemicals * — Food Products * Ethanol HOPRER E sper — S
Slide 4: Broad manufacturing base allows ARI to provide quality railcars and components
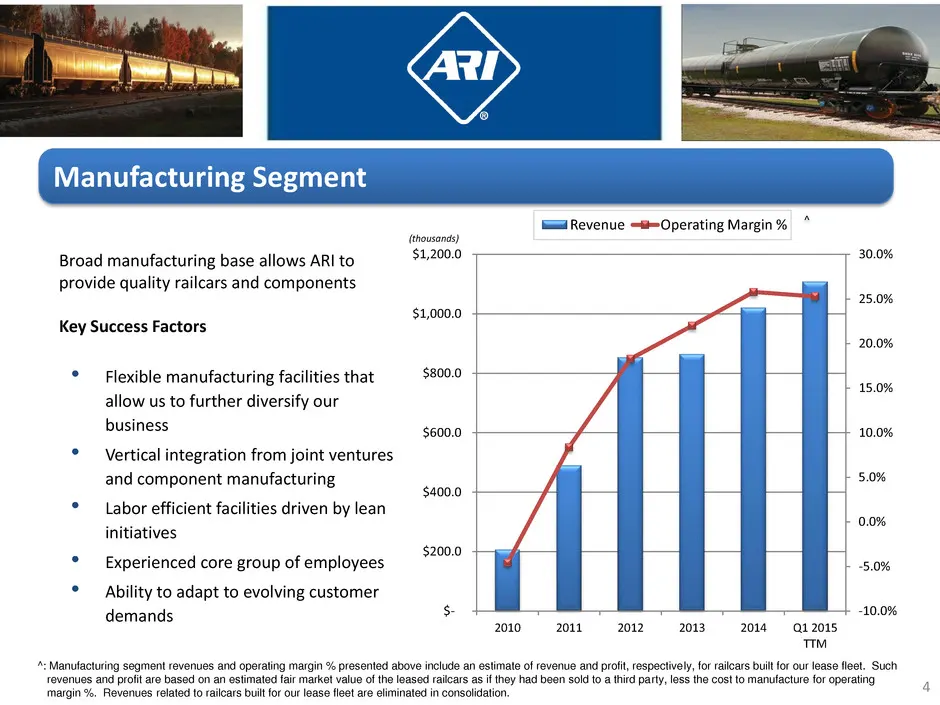
Broad manufacturing base allows ARI to provide quality railcars and components Key Success Factors (thousands) $1,200.0 $1,000.0 iz Revenue “Operating Margin % Flexible business initiatives facilities that $800.0 allow us to further diversify our $600.0 Vertical integration from joint ventures and c
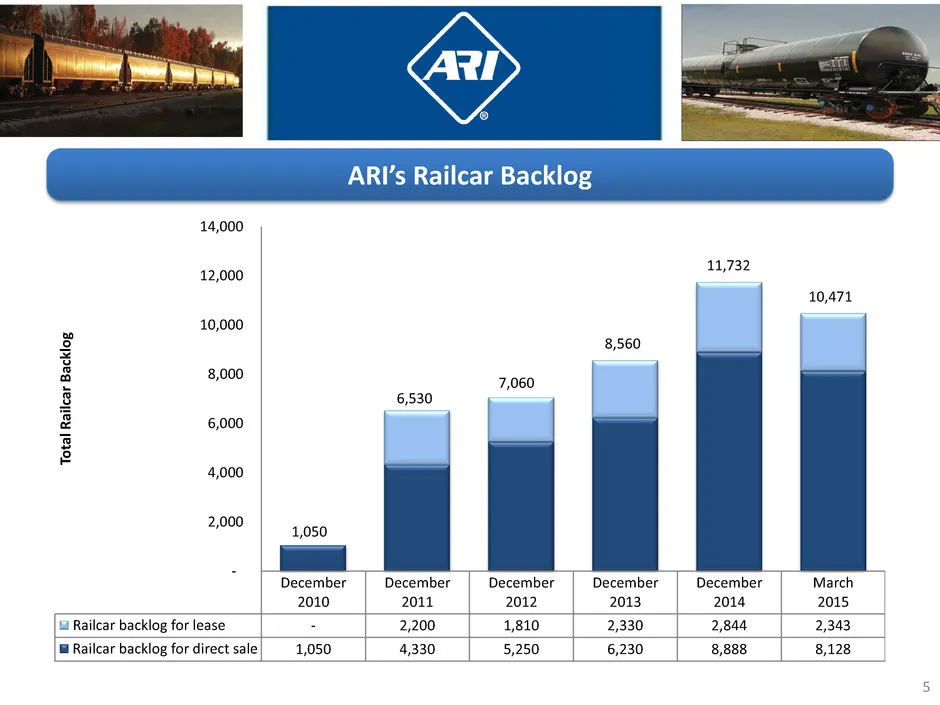
Slide 5: ARI's Railcar Backlog
14,000 12,000 10,000 8,000 6,000 ARI’s Railcar Backlog 10,471 December March 2014 2015 lt Railcar backlog for lease | 2844 =| 2,343 Railcar backlog for direct sale | 3ga8 | 8,128
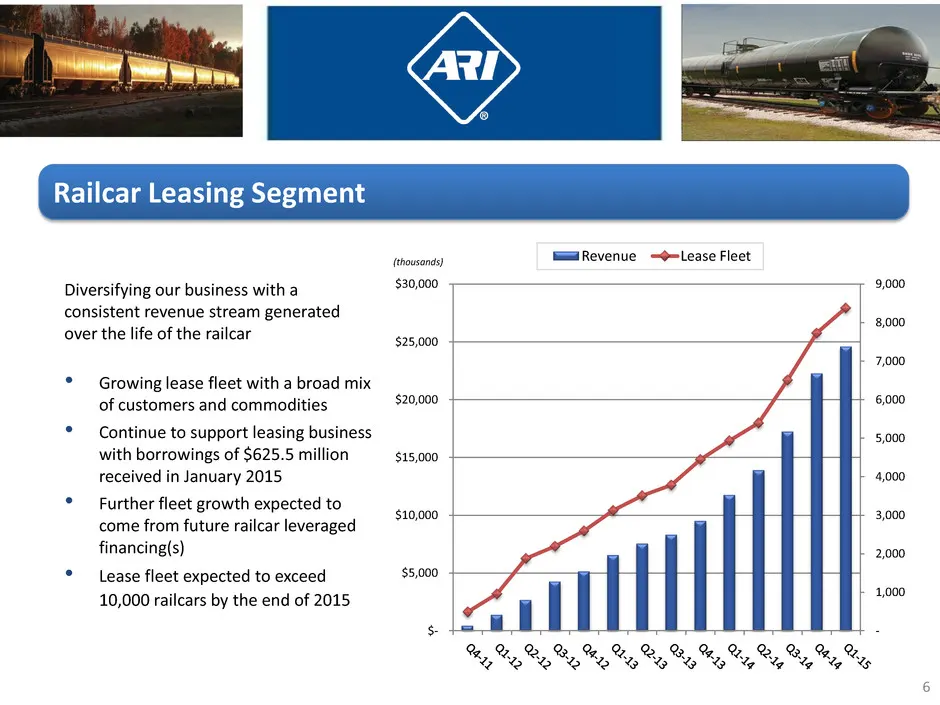
Slide 6: Railcar Leasing Segment
Railcar Leasing Segment lmRevenue Lease Fleet Diversifying our business with a consistent revenue stream generated over the life of the railcar Growing lease fleet with a broad mix of customers and commodities Continue to support leasing business with borrowings of $625.5 million received in January
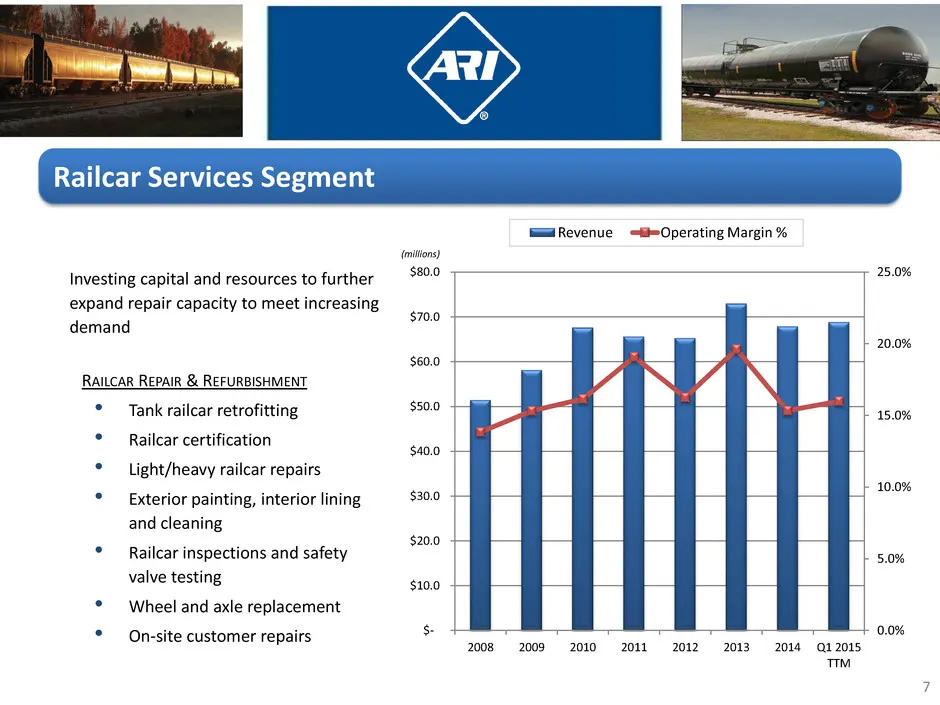
Slide 7: Railcar Services Segment
Railcar Services Segment lama Revenue =tiOperating Margin % (tors Investing capital and resources to further 8° 25.08 expand repair capacity to meet increasing $700 demand 20.0% $60.0 RAILCAR REPAIR & REFURBISHMENT *° Tank railcar retrofitting $50.0 15.0% * — Railcar certification $400 © Light/heavy
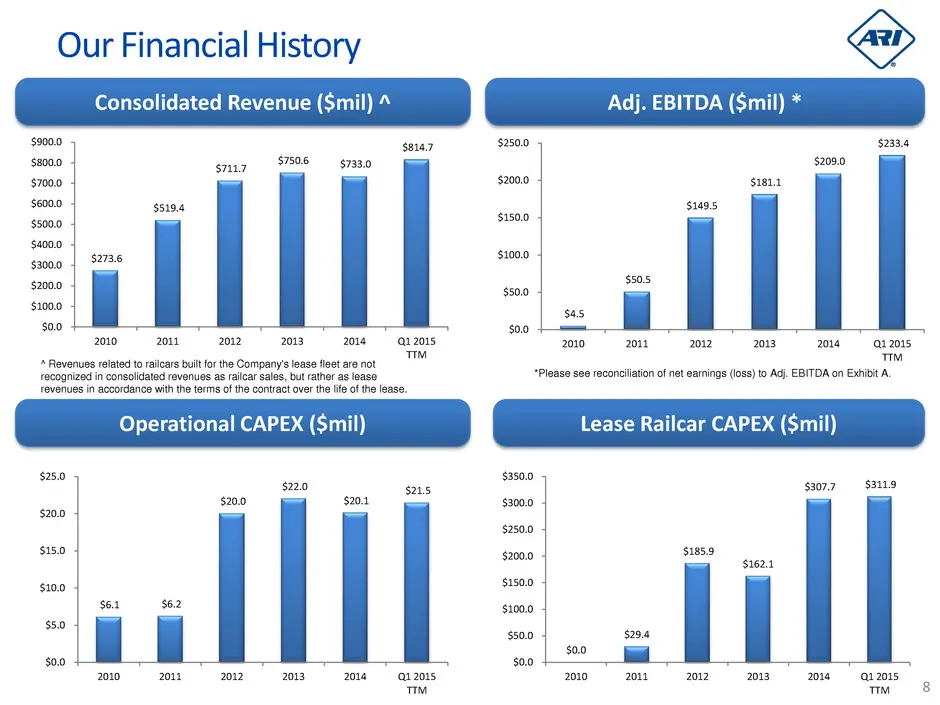
Slide 8: Our Financial History
Our Financial History Consolidated Revenue ($mil) “ Adj. EBITDA ($mil) * $200.0 sea $2500 gas $2000 gy 57508 g7a80 $7000 se000 $519.4 $5000 $2000 geooo | $2736 $2000 $1000 300 : = = = wo | 220182018201 aio oS OSIM TM ti atathor a Operational CAPEX (Smil) Lease Railcar CAPEX (Smil) $250 $22.0 21s zoo
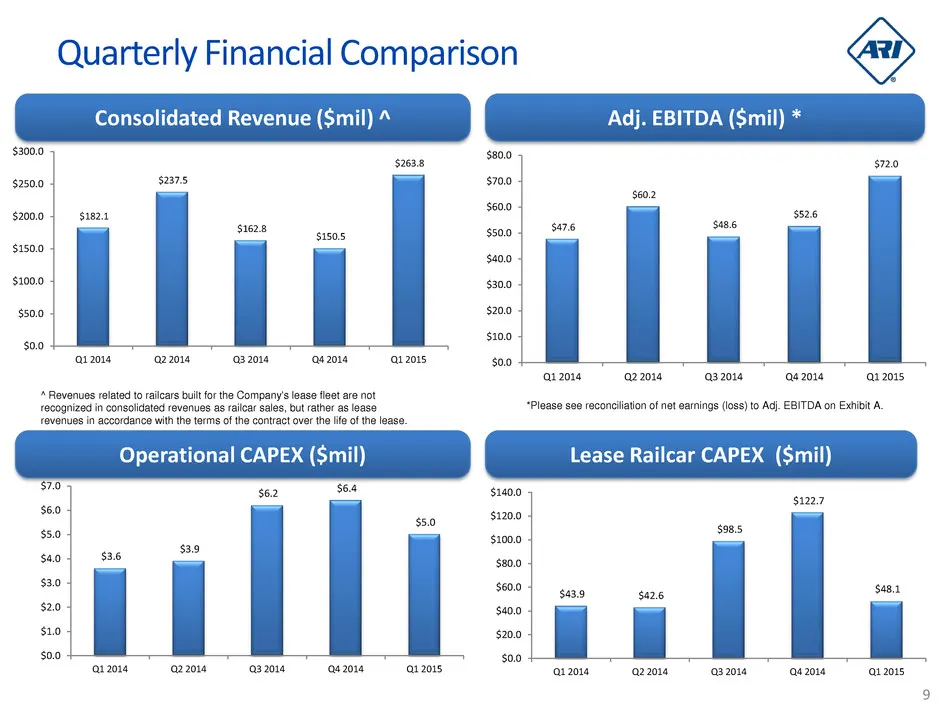
Slide 9: Quarterly Financial Comparison
Consolidated Revenue ($mil) * Adj. EBITDA ($mil) * Quarterly Financial Comparison Po sus sxoo | sors sme | so soo | sama | see susos - sus sao sono as aa sme | is $0.0 +— L_.. +I + — is Operational CAPEX oa Lease Railcar CAPEX (Smil) an 2016 $72.0 2 2016 032014 8 2014 1 2015 ai 2016 2 2018 a3 2018 8
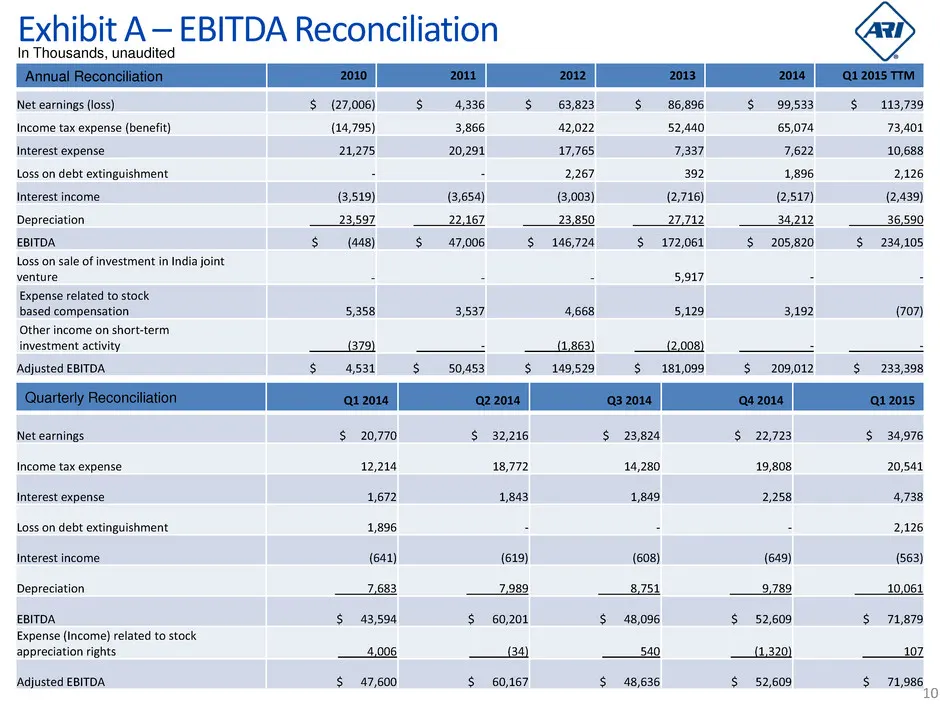
Slide 10: Exhibit A EBITDA Reconciliation
Exhibit A 7 EBITDA Reconciliation In Thousands, unaudite Net earnings (loss) $ (27,006) Income tax expense (benefit) (14,795) Interest expense 21,275 Loss on debt extinguishment Interest income. (3,519) Depreciation 23597 EBITDA $ (aaa) psseosibat ian oc at aoe related to stock based compensation 5,
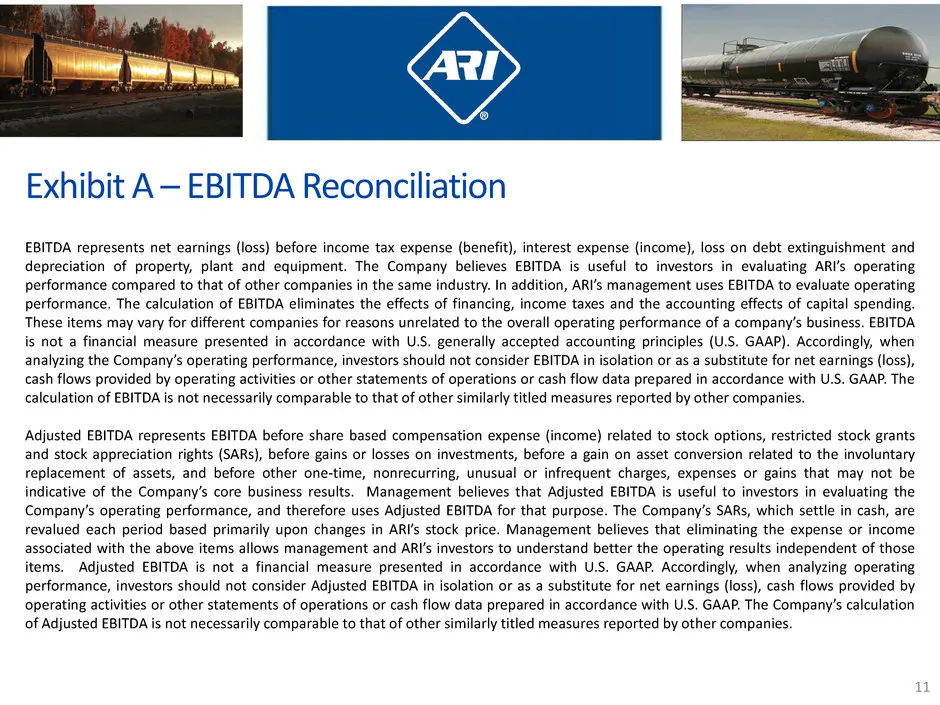
Slide 11: Exhibit A — EBITDA Reconciliation
a Exhibit A — EBITDA Reconciliation EBITDA represents net comings (loss) ee Rone estes (benef) ine erpense (income), loss on debt extinguishment and depreciation of property, plant and equipment. The 1 believes seful to investors in evaluating ARI's operating ary for differer anies for perfor ncial
Slide 12: Agile, Responsive, Innovative
AGILE RESPONSIVE INNOVATIVE | > = en Ea ee, <I fi Ae A _ R _-asl és (apa SS a
Source: SEC EDGAR · 8-K filed Apr 29, 2015
More decks from American Railcar Industries Inc
 Q3 2018 Earnings Presentation19 slides · Oct 30, 2018
 Investor Presentation (August 2018)26 slides · Aug 24, 2018
 Q2 2018 Earnings Presentation19 slides · Aug 1, 2018
 Q1 2018 Earnings Presentation18 slides · May 1, 2018
 Q4 2017 Earnings Presentation19 slides · Feb 23, 2018
 Cowen conference 201824 slides · Feb 6, 2018