IRIS RegTech Solutions Limited · NSE:IRIS
IRIS RegTech Solutions — IRIS Business Services — H1 FY19 Earnings Presentation
14 slides from IRIS RegTech Solutions's earnings presentation, Nov 5, 2018
Slide 1: Letter to BSE Limited: Investor Presentation
IRIS Business Services Limited 5th November, 2018 To, BSE Limited Corporate Relationship Department, Phiroze Jeejeebhoy Towers, Dalal Street, Mumbai 400 001 Scrip Code: 540735 Sub: Investor Presentation Dear Sir/ Madam, Pursuant to Regulation 30 of SEBI (Listing Obligations and Disclosure Requiremen

Slide 2: IRIS Compliance, Data & Analytics Investor Presentation
IRIS Compliance, Data & Analytics Investor Presentation November 5, 2018 1
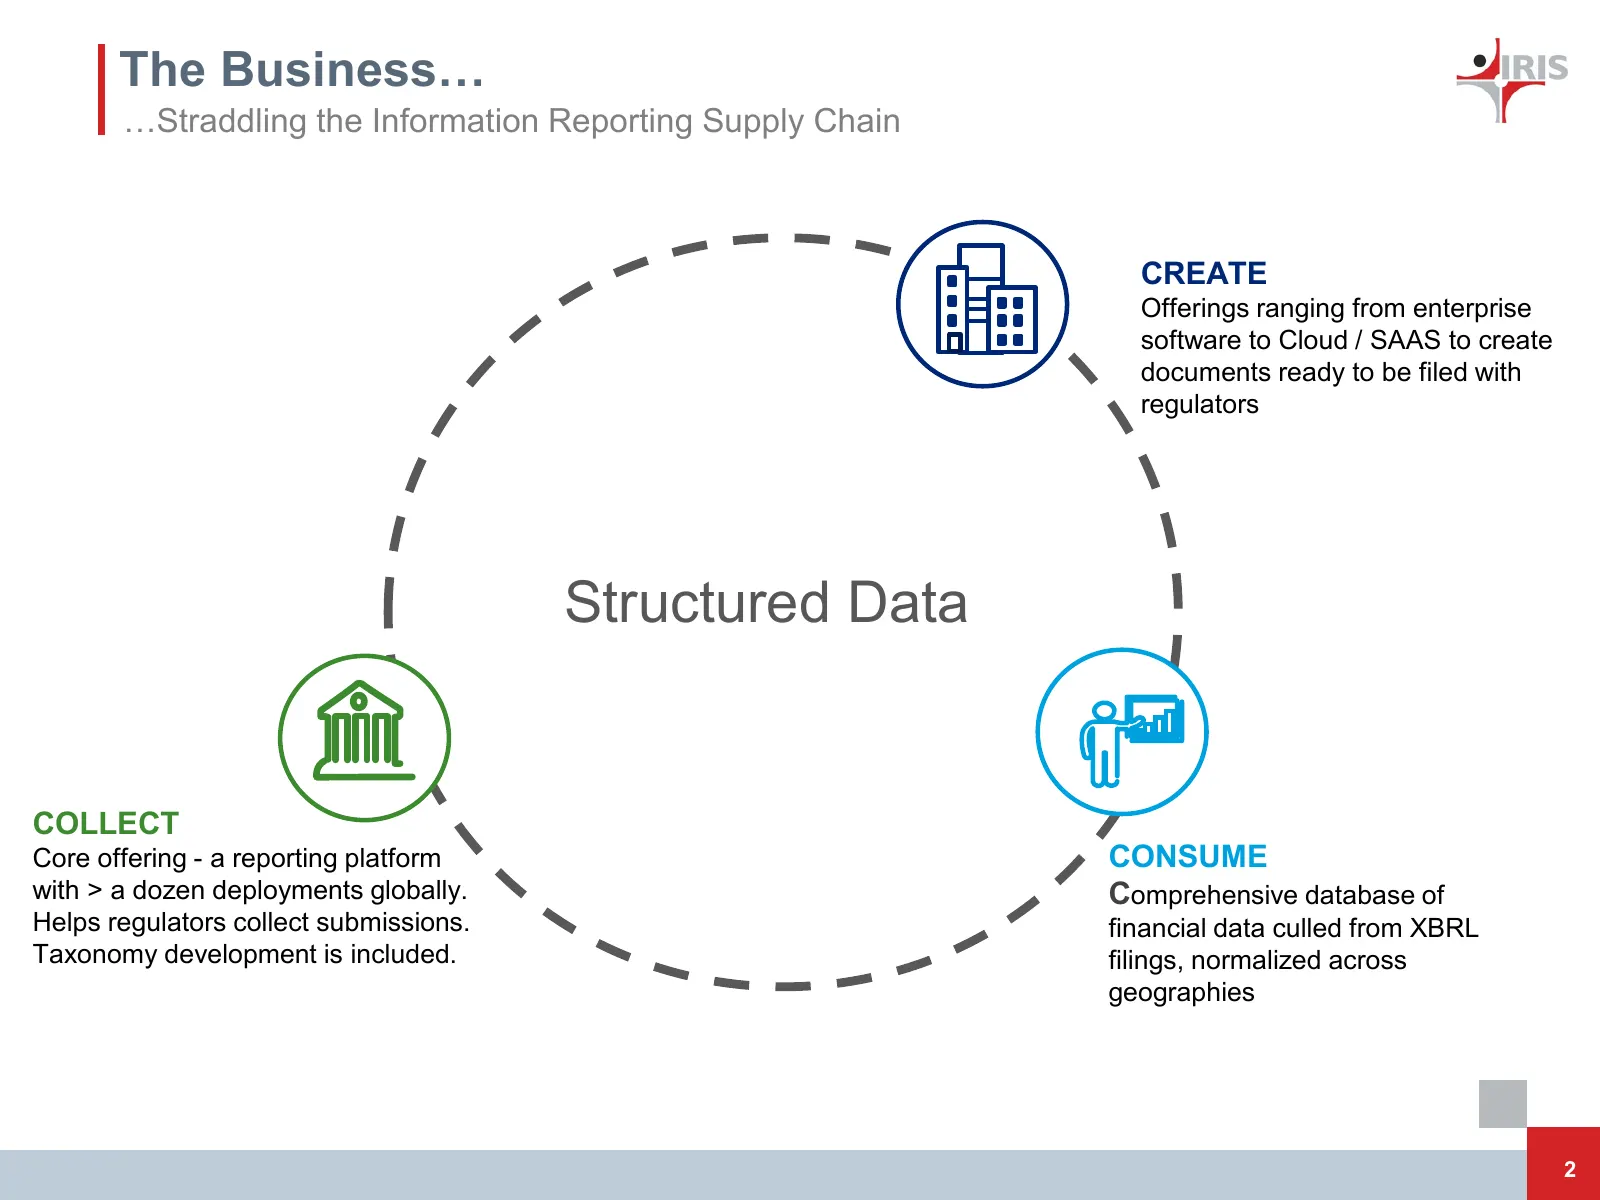
Slide 3: The Business: Straddling the Information Reporting Supply Chain
The Business… …Straddling the Information Reporting Supply Chain CREATE Offerings ranging from enterprise software to Cloud / SAAS to create documents ready to be filed with regulators Structured Data COLLECT Core offering - a reporting platform CONSUME with > a dozen deployments globally. Comprehen
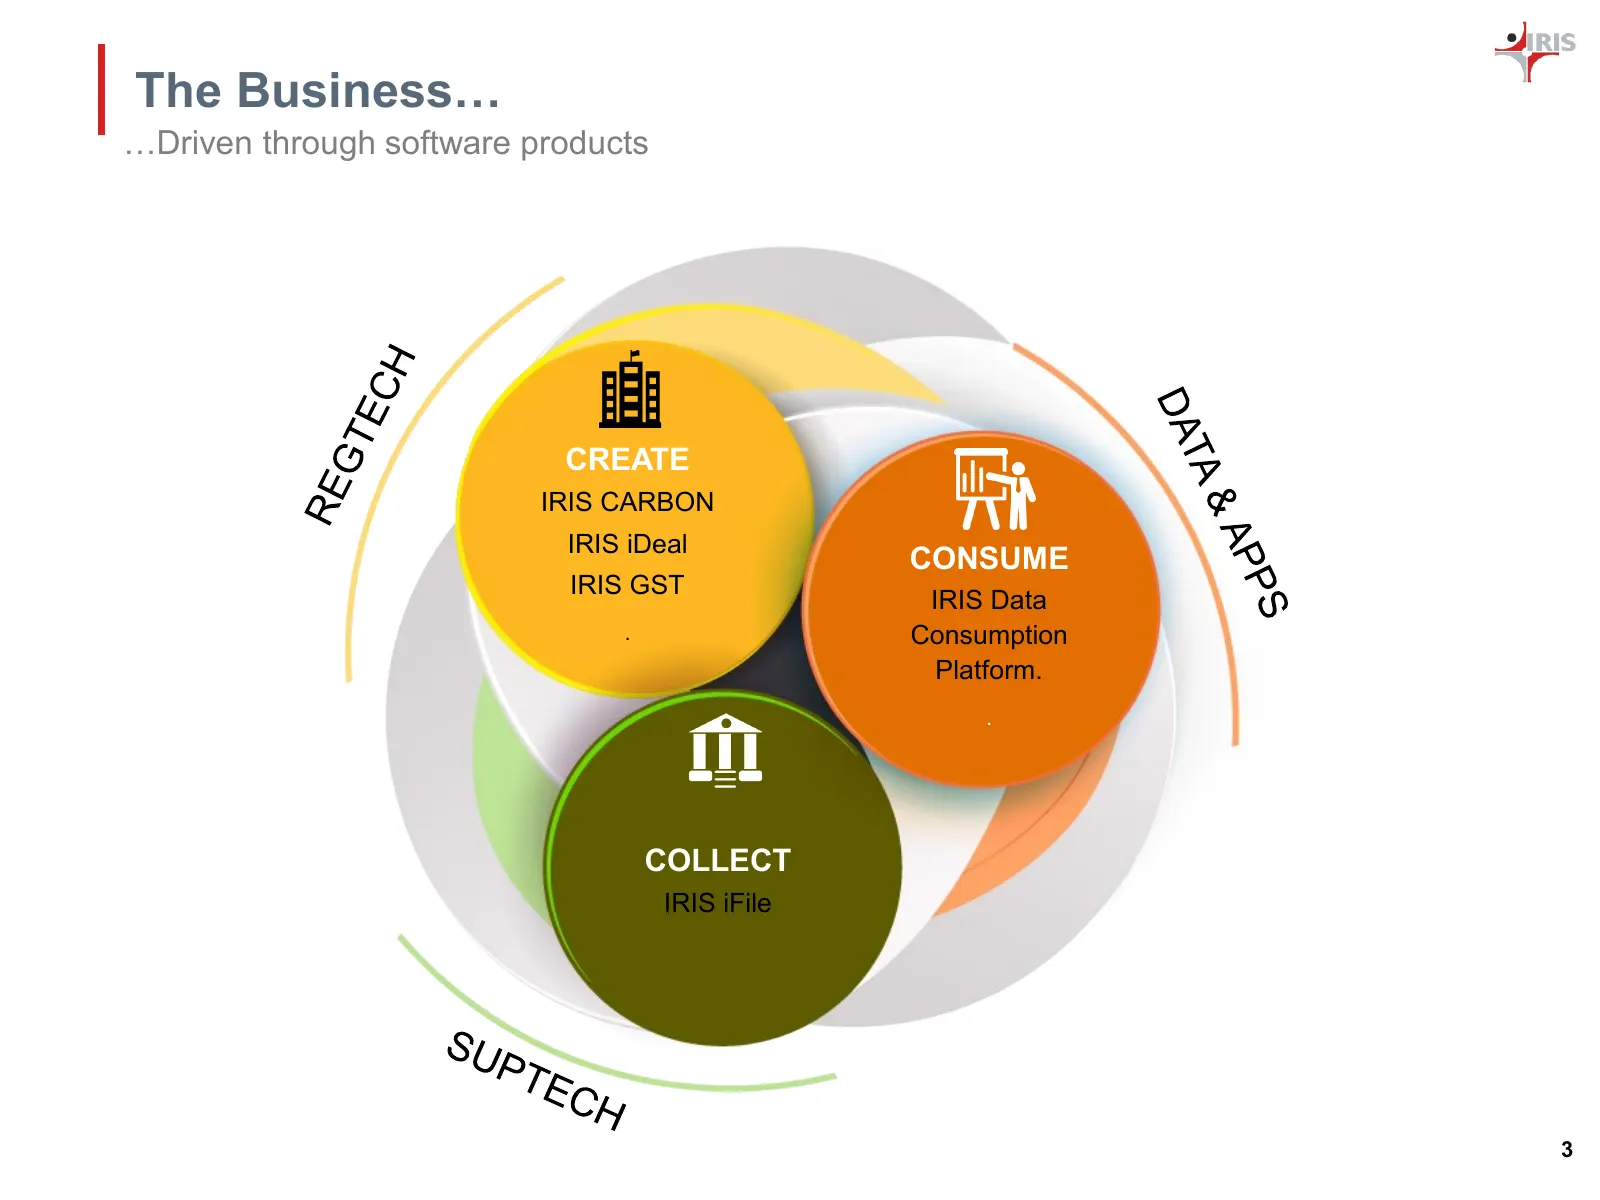
Slide 4: The Business: Driven through software products
The Business… …Driven through software products CREATE IRIS CARBON IRIS iDeal CONSUME IRIS GST IRIS Data . Consumption Platform. . COLLECT IRIS iFile 3
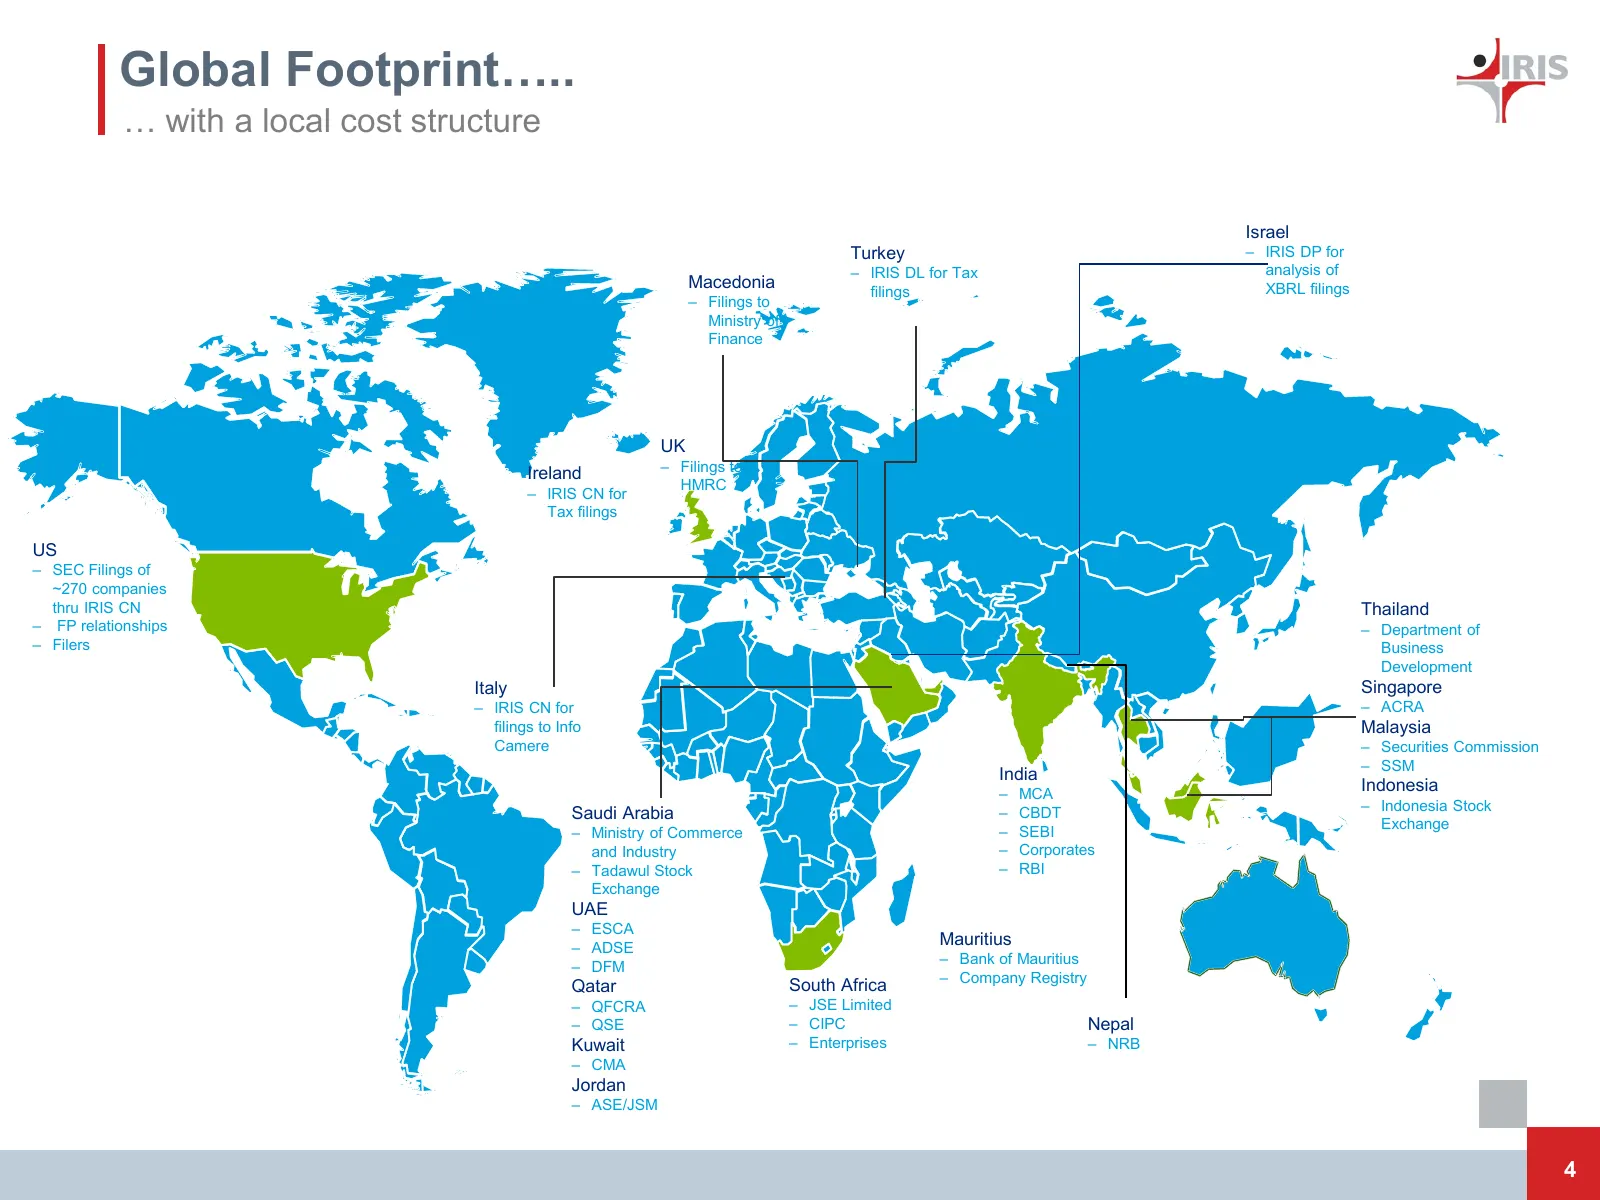
Slide 5: Global Footprint with a local cost structure
Global Footprint….. … with a local cost structure Israel Turkey – IRIS DP for – IRIS DL for Tax analysis of Macedonia filings XBRL filings – Filings to Ministry of Finance UK – Filings to Ireland HMRC – IRIS CN for Tax filings US – SEC Filings of ~270 companies thru IRIS CN Thailand – FP relationshi
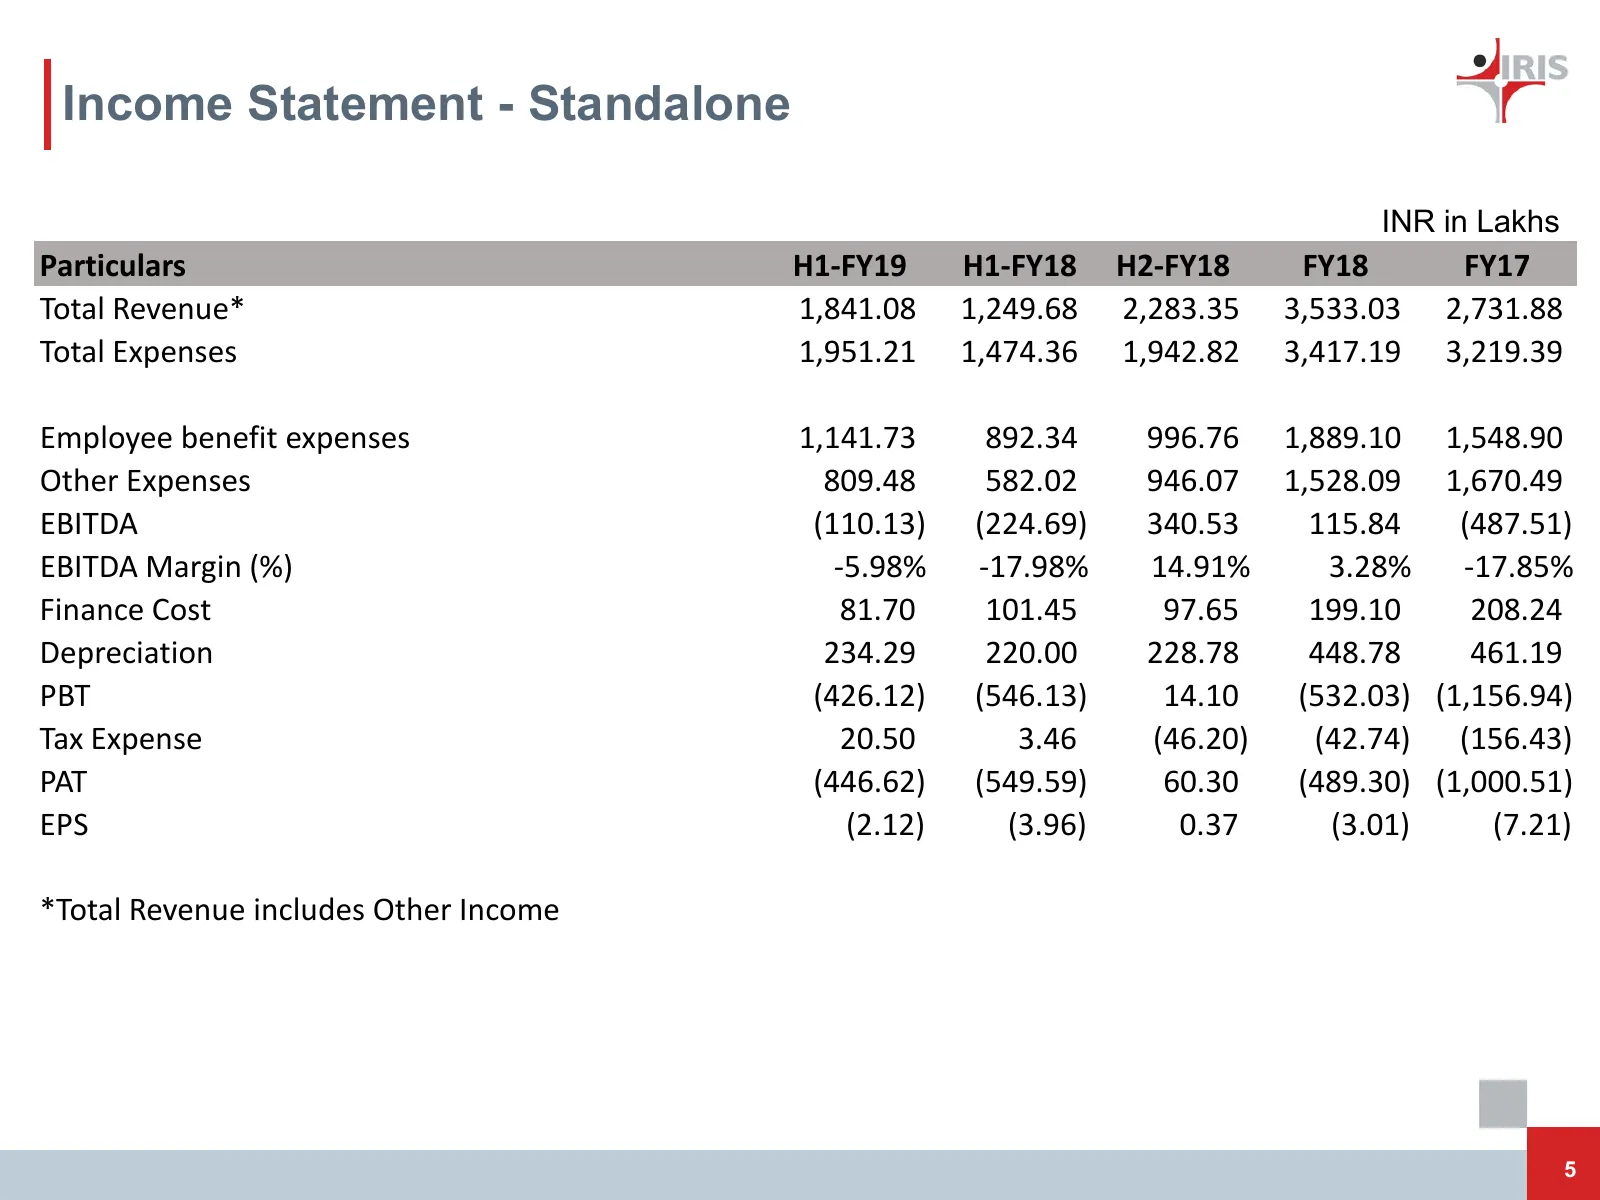
Slide 6: Income Statement - Standalone
Income Statement - Standalone INR in Lakhs Particulars H1-FY19 H1-FY18 H2-FY18 FY18 FY17 Total Revenue* 1,841.08 1,249.68 2,283.35 3,533.03 2,731.88 Total Expenses 1,951.21 1,474.36 1,942.82 3,417.19 3,219.39 Employee benefit expenses 1,141.73 892.34 996.76 1,889.10 1,548.90 Other Expenses 809.48 58
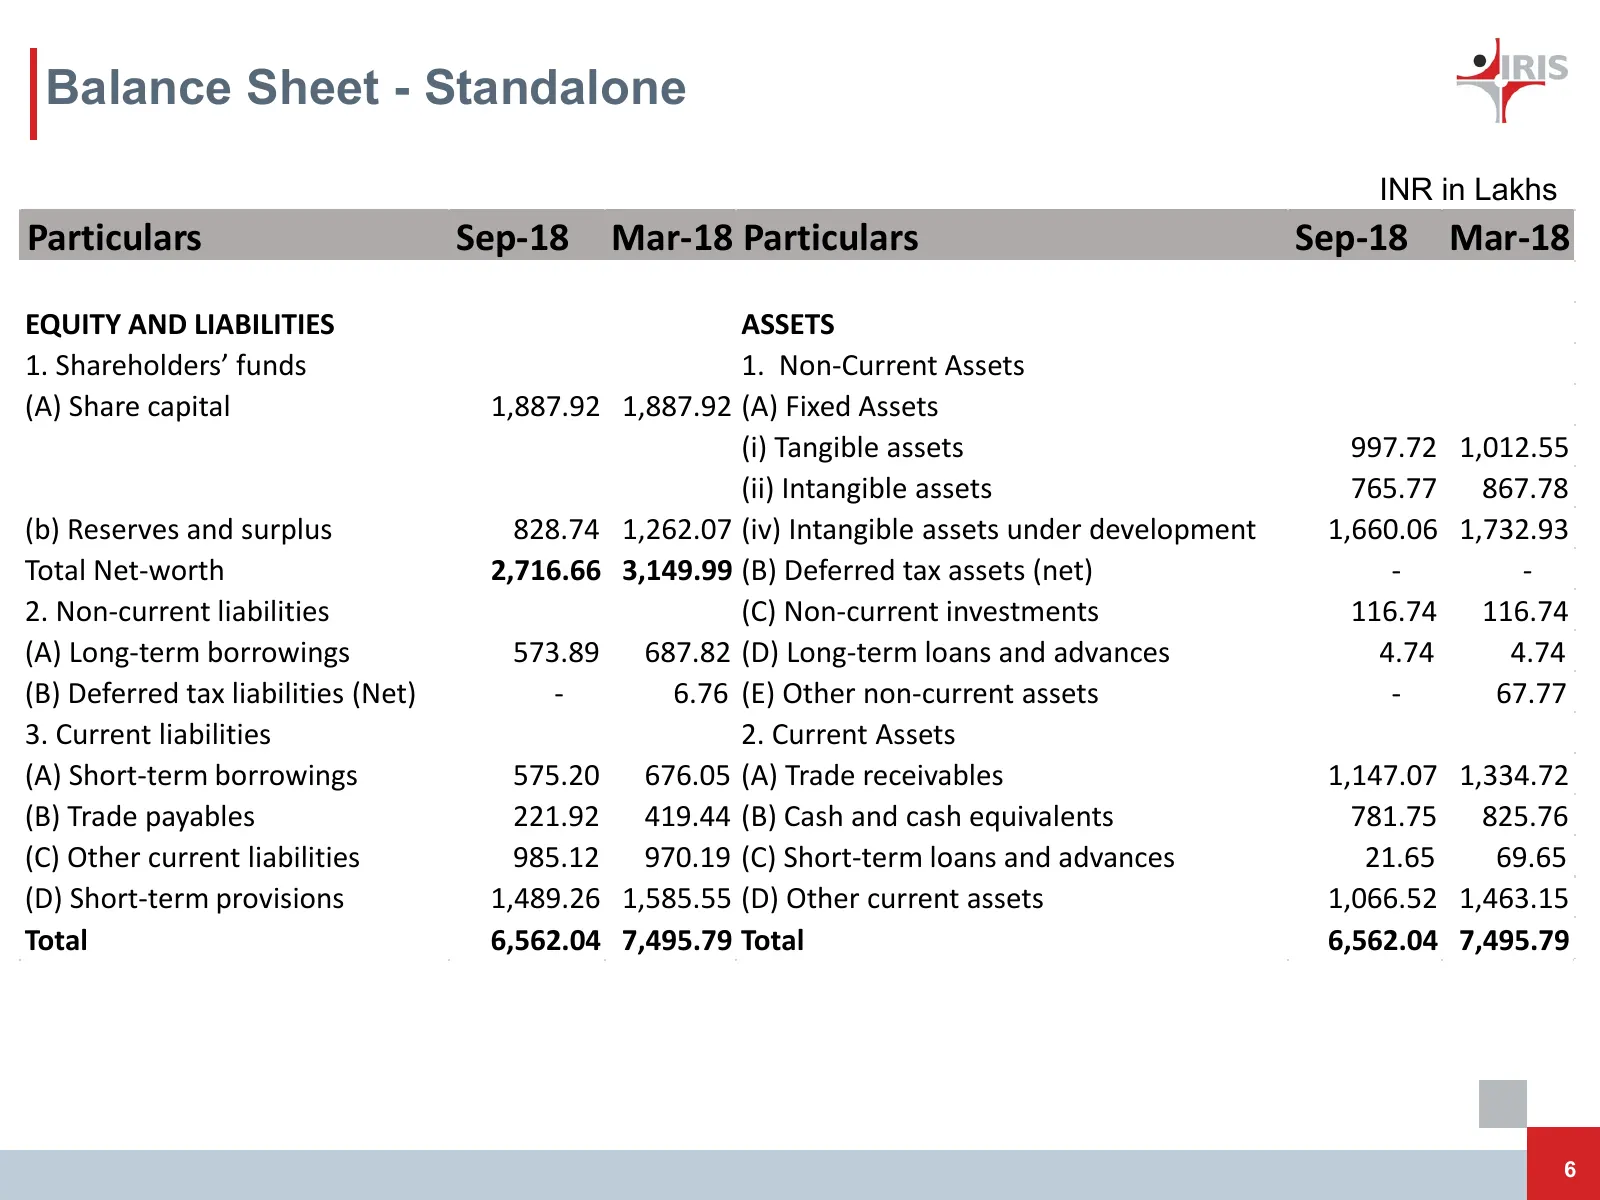
Slide 7: Balance Sheet - Standalone
Balance Sheet - Standalone INR in Lakhs Particulars Sep-18 Mar-18 Particulars Sep-18 Mar-18 EQUITY AND LIABILITIES ASSETS 1. Shareholders’ funds 1. Non-Current Assets (A) Share capital 1,887.92 1,887.92 (A) Fixed Assets (i) Tangible assets 997.72 1,012.55 (ii) Intangible assets 765.77 867.78 (b) Res
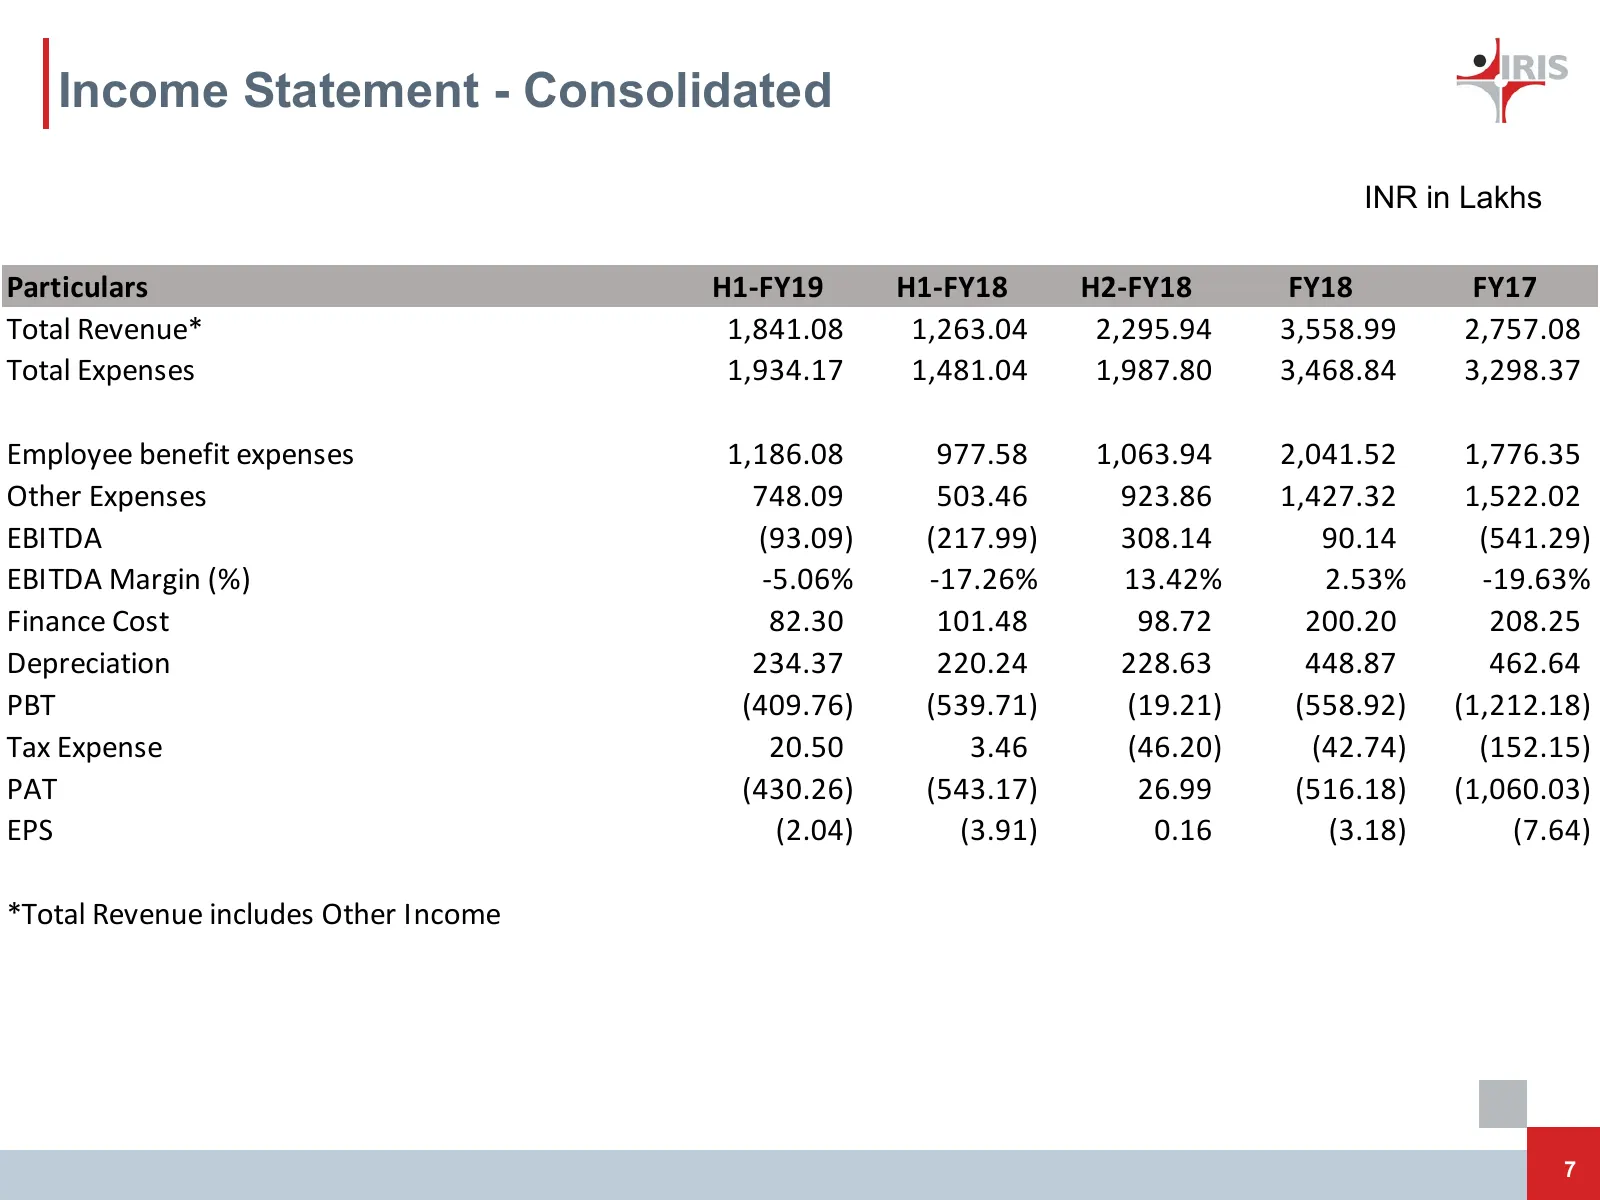
Slide 8: Income Statement - Consolidated
Income Statement - Consolidated INR in Lakhs Particulars H1-FY19 H1-FY18 H2-FY18 FY18 FY17 Total Revenue* 1,841.08 1,263.04 2,295.94 3,558.99 2,757.08 Total Expenses 1,934.17 1,481.04 1,987.80 3,468.84 3,298.37 Employee benefit expenses 1,186.08 977.58 1,063.94 2,041.52 1,776.35 Other Expenses 748.0
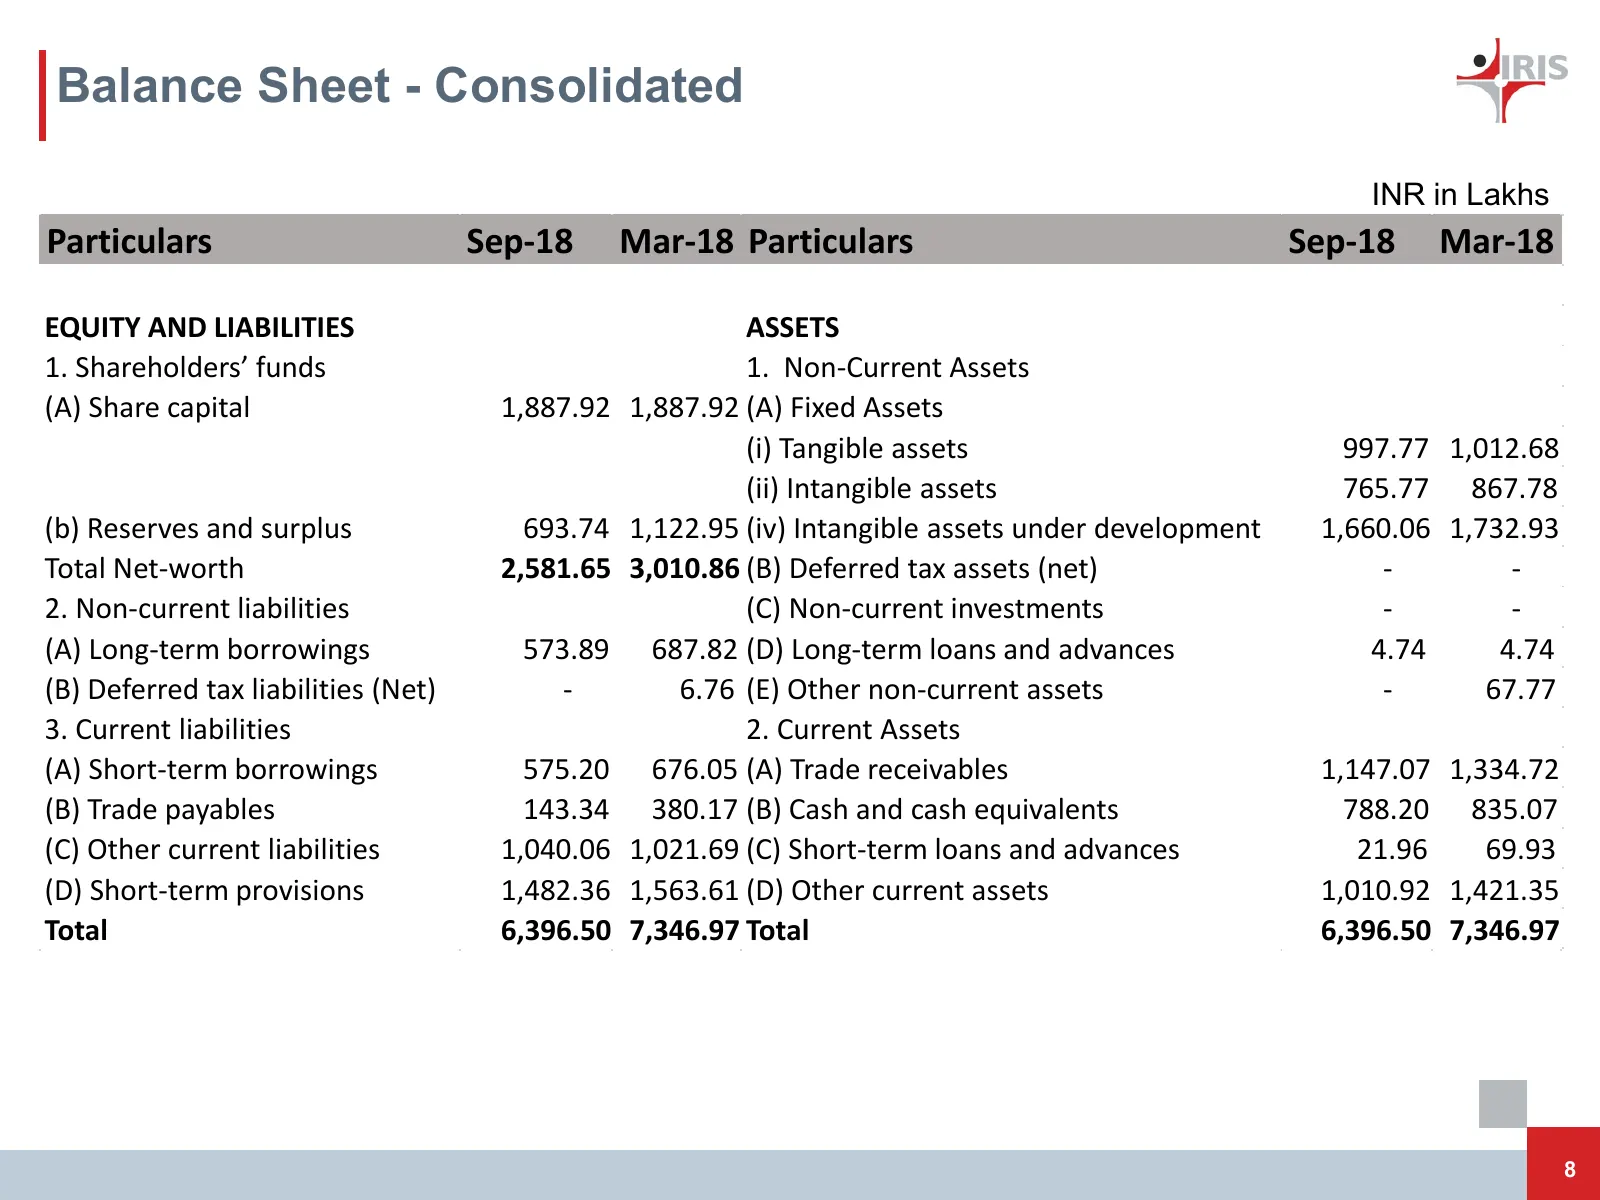
Slide 9: Balance Sheet - Consolidated
Balance Sheet - Consolidated INR in Lakhs Particulars Sep-18 Mar-18 Particulars Sep-18 Mar-18 EQUITY AND LIABILITIES ASSETS 1. Shareholders’ funds 1. Non-Current Assets (A) Share capital 1,887.92 1,887.92 (A) Fixed Assets (i) Tangible assets 997.77 1,012.68 (ii) Intangible assets 765.77 867.78 (b) R
Slide 10: Financial performance – Highlights
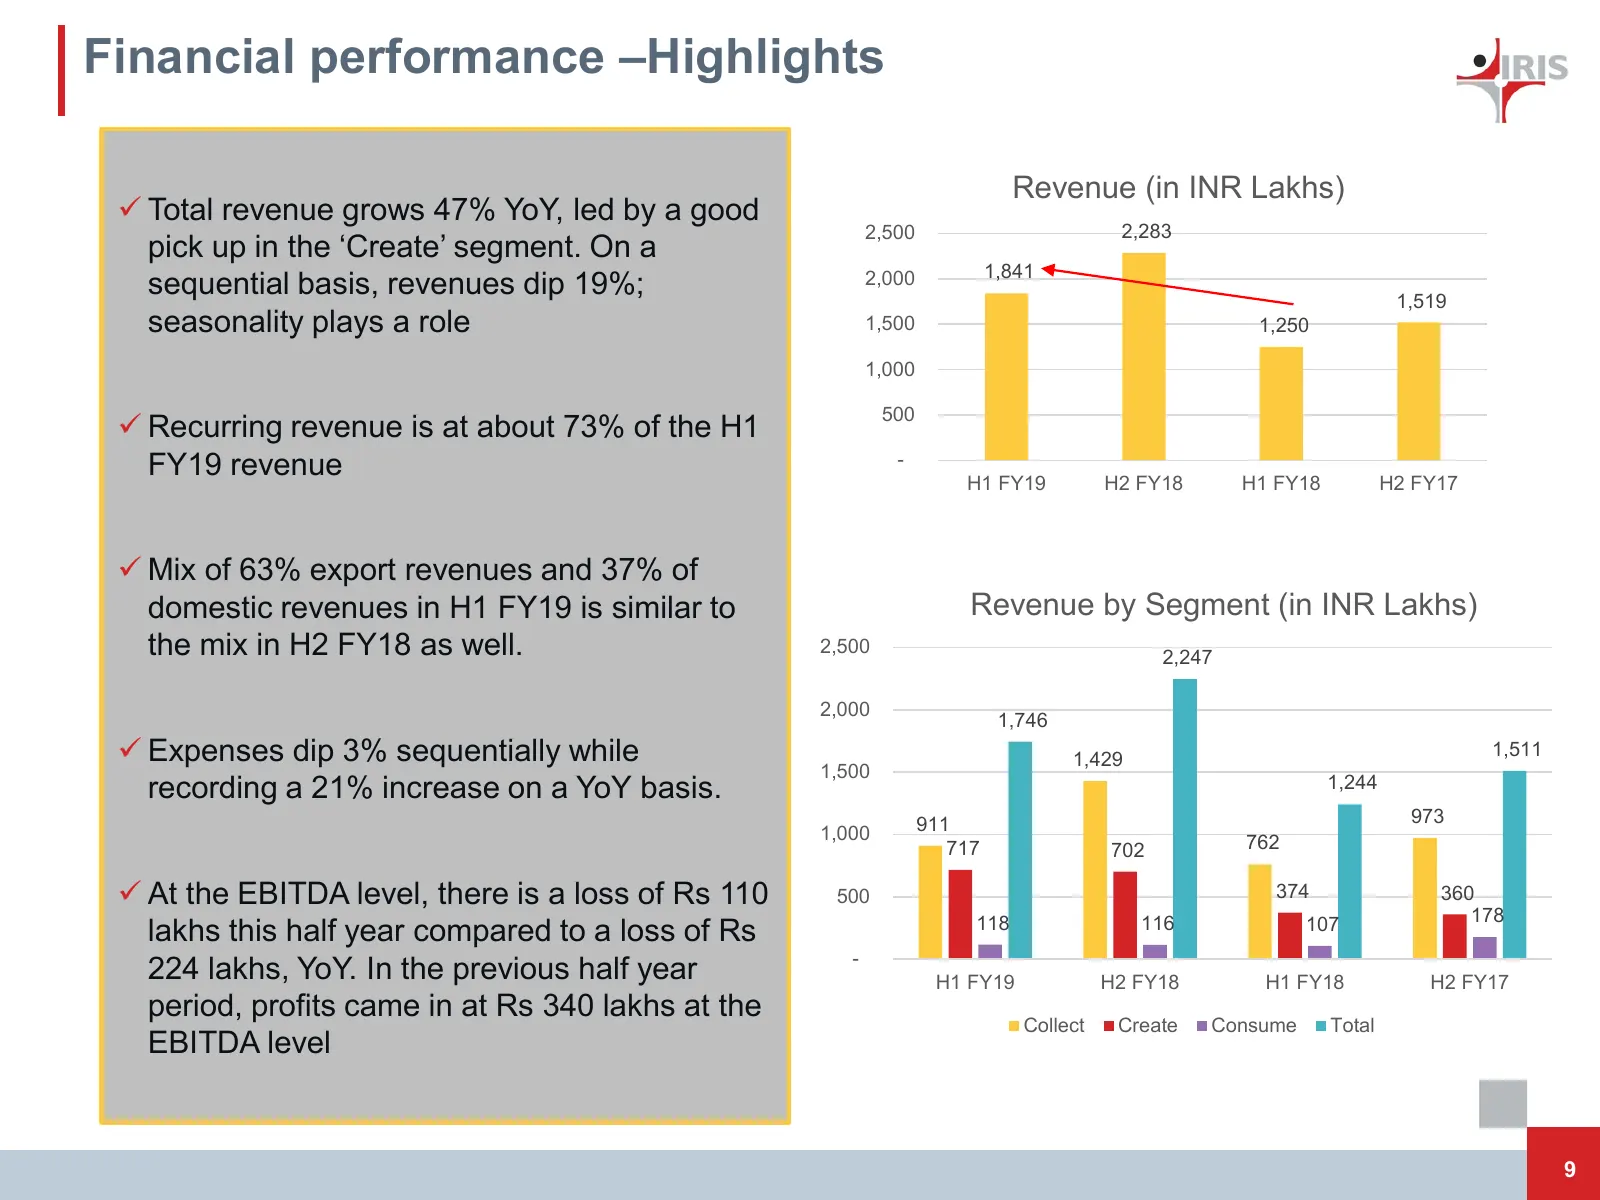
Financial performance –Highlights Revenue (in INR Lakhs) Total revenue grows 47% YoY, led by a good 2,500 2,283 pick up in the ‘Create’ segment. On a 1,841 sequential basis, revenues dip 19%; 2,000 1,519 seasonality plays a role 1,500 1,250 1,000 500 Recurring revenue is at about 73% of the H1 F
Slide 11: Expense trends (before capitalisation)
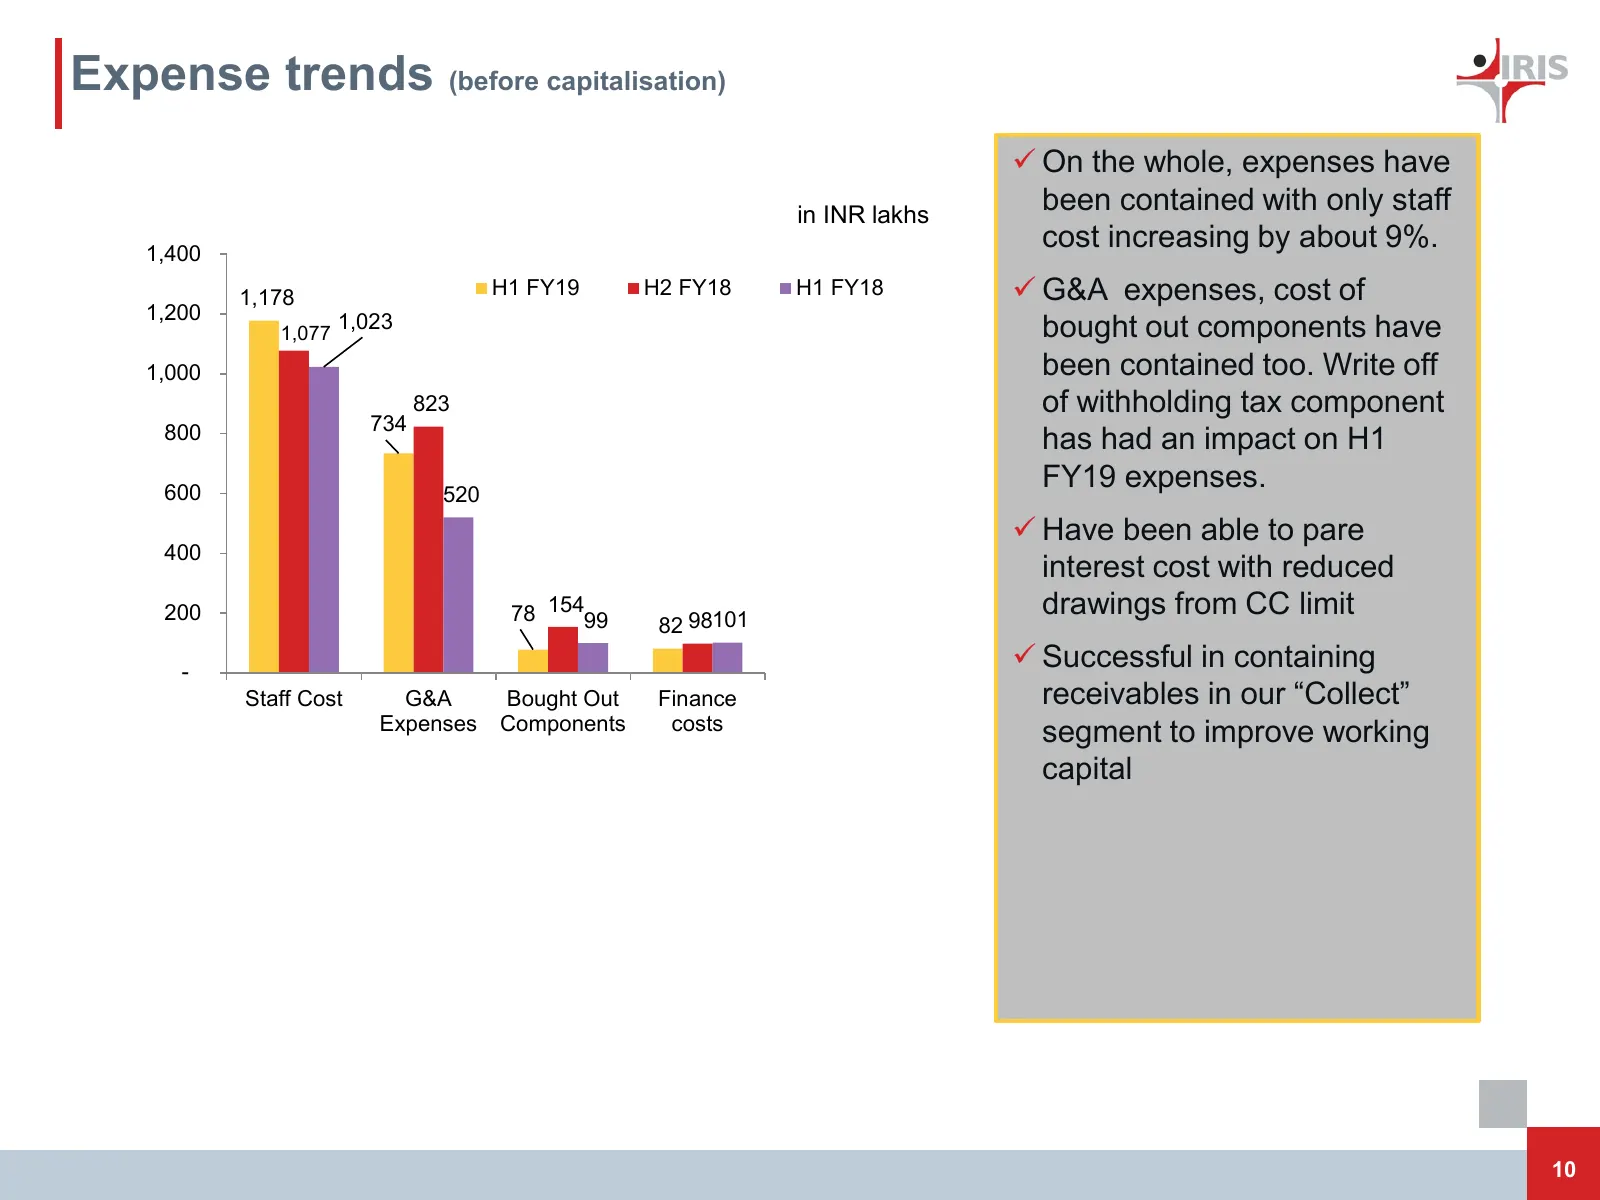
Expense trends (before capitalisation) On the whole, expenses have in INR lakhs been contained with only staff 1,400 cost increasing by about 9%. 1,178 H1 FY19 H2 FY18 H1 FY18 G&A expenses, cost of 1,200 1,077 1,023 bought out components have 1,000 been contained too. Write off 823 of withholdin
Slide 12: Revenue Mix by Segment
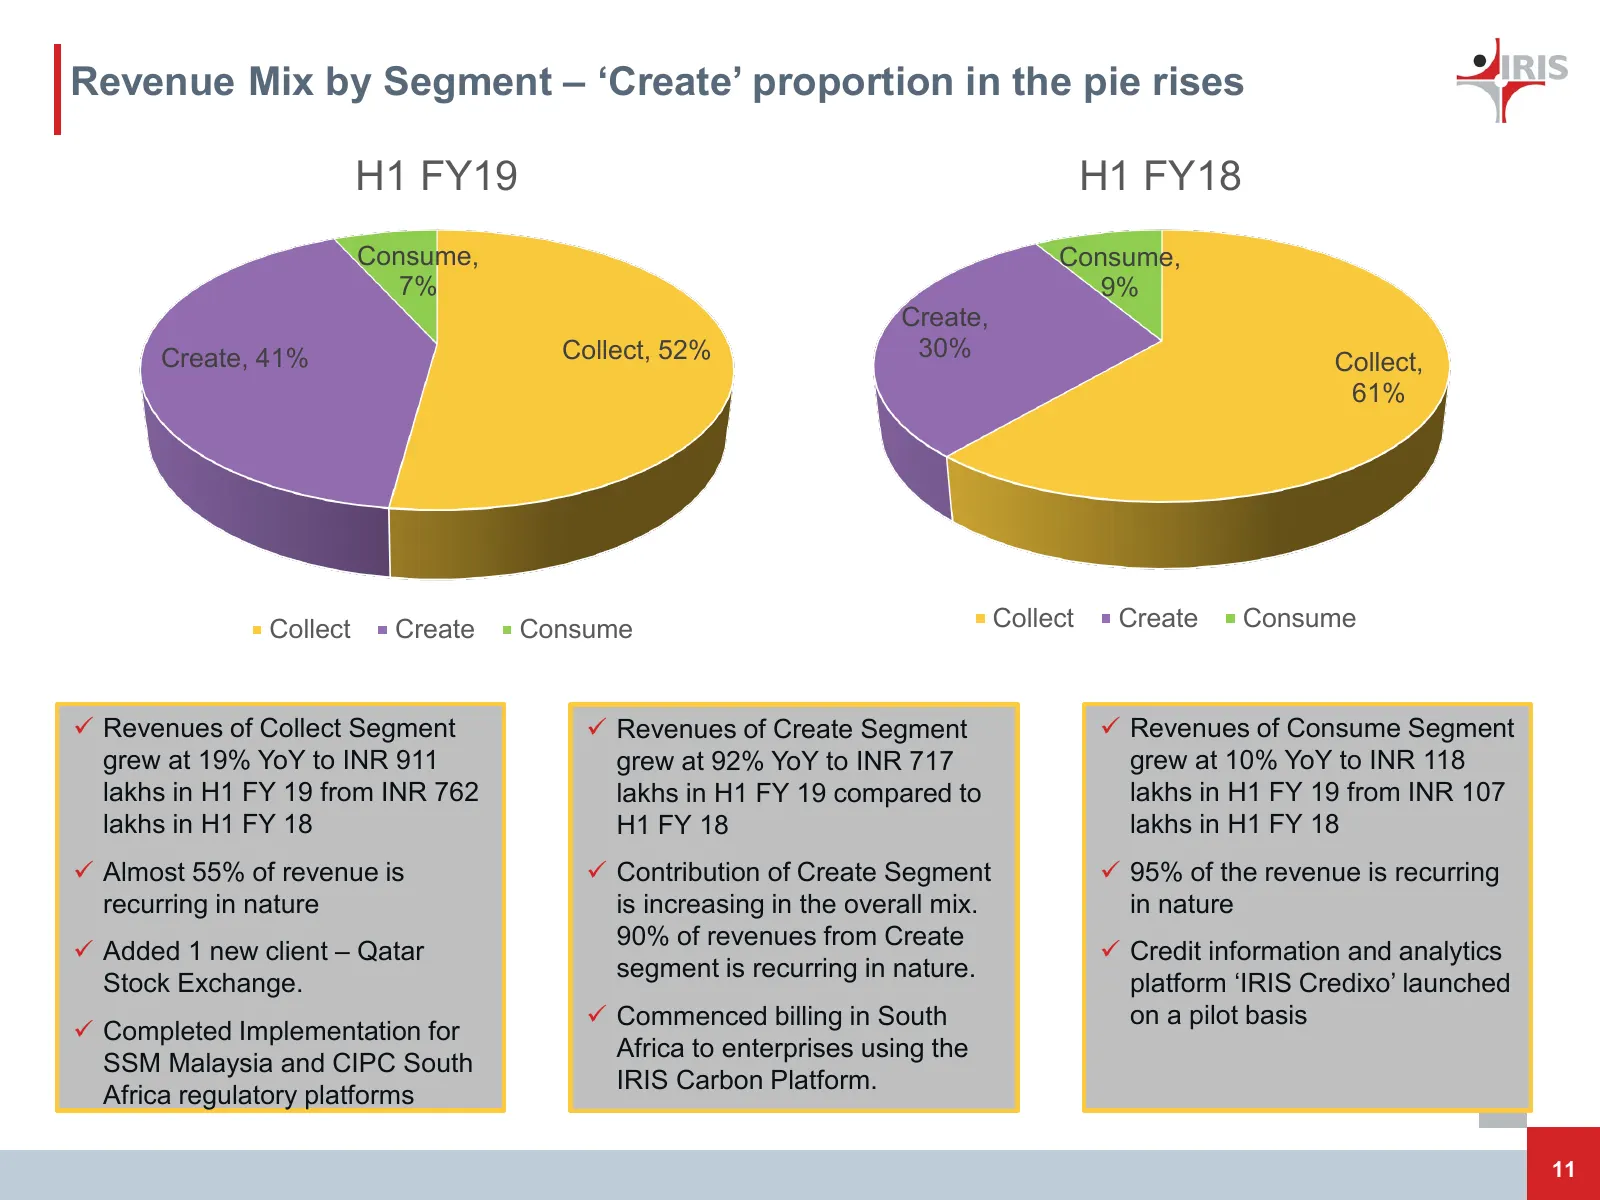
Revenue Mix by Segment – ‘Create’ proportion in the pie rises H1 FY19 H1 FY18 Consume, Consume, 7% 9% Create, Create, 41% Collect, 52% 30% Collect, 61% Collect Create Consume Collect Create Consume Revenues of Collect Segment Revenues of Create Segment Revenues of Consume Segment grew at 19% Y
Slide 13: Revenue Mix by Currency
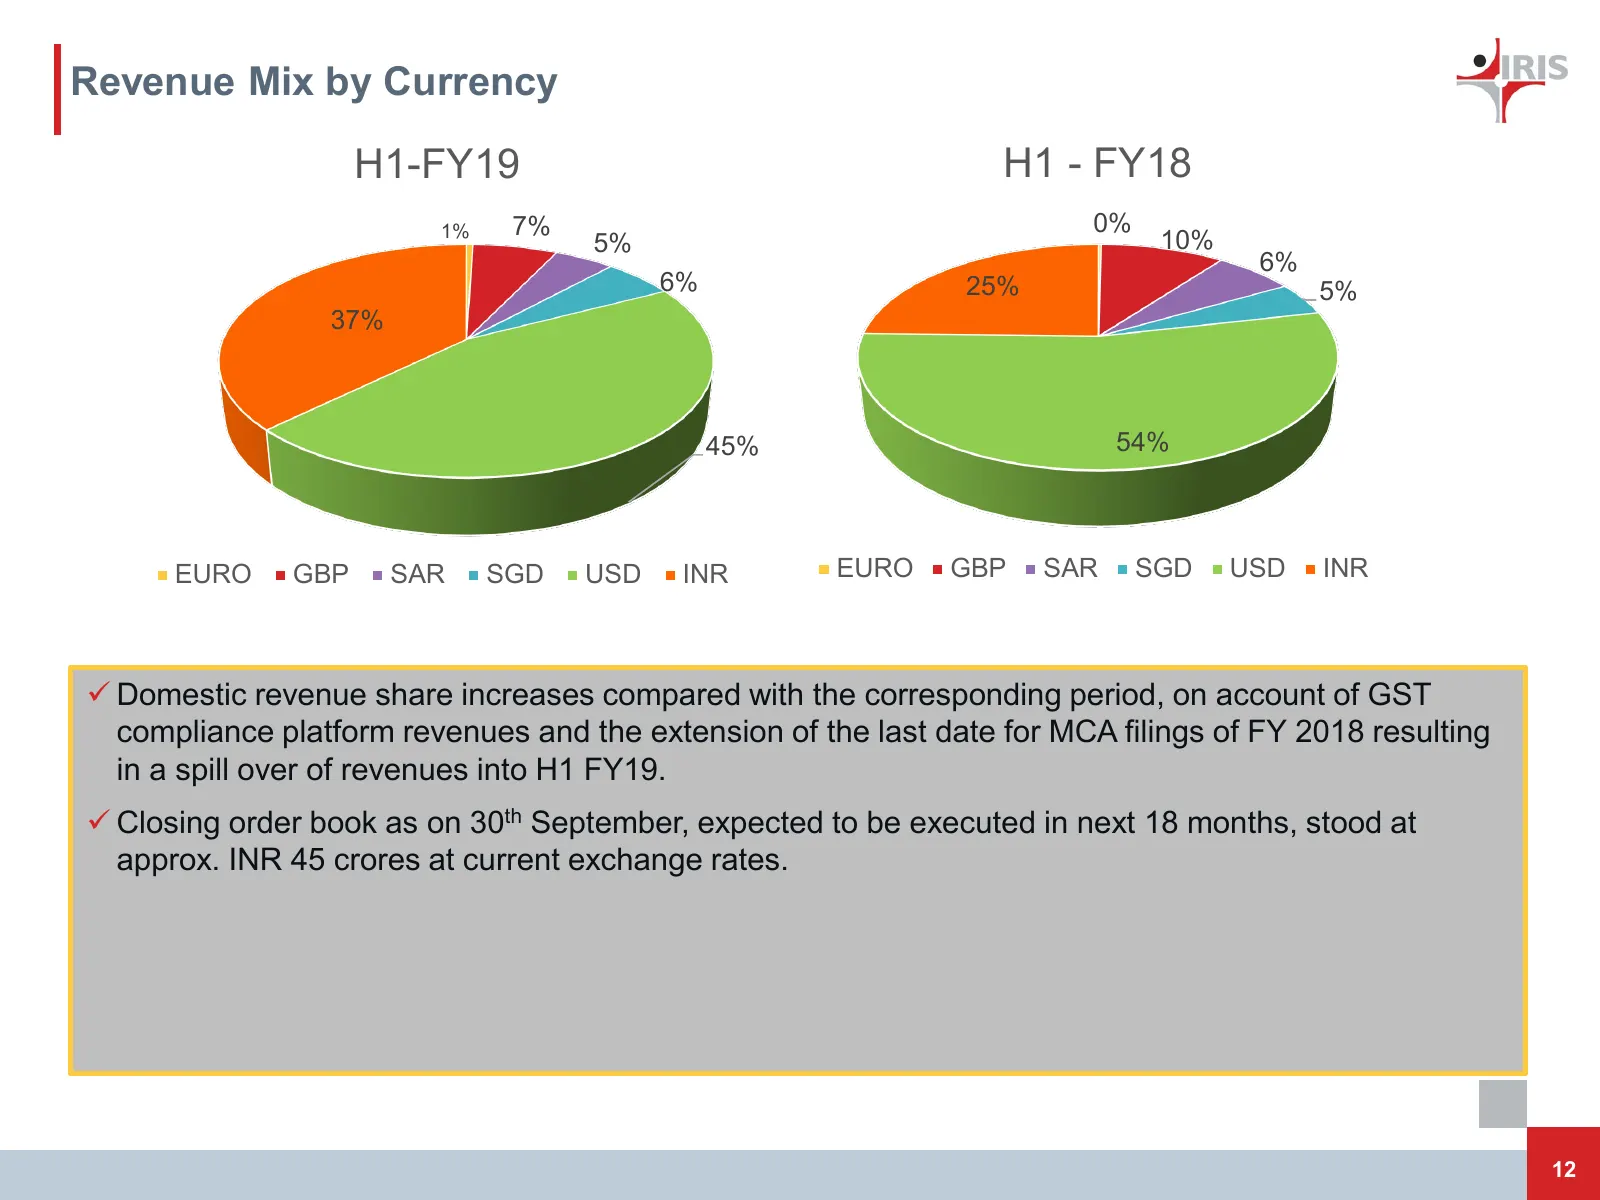
Revenue Mix by Currency H1-FY19 H1 - FY18 1% 7% 0% 5% 10% 6% 6% 25% 5% 37% 45% 54% EURO GBP SAR SGD USD INR EURO GBP SAR SGD USD INR Domestic revenue share increases compared with the corresponding period, on account of GST compliance platform revenues and the extension of the last date for MCA fi

Slide 14: Thank you!
Thank you!
Source: Internet Archive copy of irisbusiness.com
More decks from IRIS RegTech Solutions Limited
 Q2 & H1 FY27 Earnings Presentation29 slides · Nov 5, 2026
 Q4 FY26 Earnings Presentation40 slides · May 18, 2026
 Q2 FY26 Earnings Presentation38 slides · Nov 14, 2025
 FY2025 Earnings Presentation36 slides · May 15, 2025
 Investor Day (November 2024)72 slides · Nov 26, 2024
 H1 FY25 Earnings Presentation30 slides · Oct 30, 2024