Ascom Holding AG · SIX:ASCN
Ascom — H1 2022 Earnings Presentation
42 slides from Ascom's earnings presentation, Aug 11, 2022
Slide 1: Half-Year Media Conference 2022
I made some adjustments on the slides and put some text boxes with comments Footer to be updated on each page (date August) Could we make the subtitle somewhat bigger and bold (on the master slide so that is adjusts each page), as the subtitle does not come out suffifiently – would suggest to put -
Slide 2: Welcome
Welcome Daniel Lack, Company Secretary HALF YEAR MEDIA CONFERENCE 2022 | 11 AUGUST | ©2022 ASCOM 2

Slide 3: Agenda
Agenda Ascom at a Glance Nicolas Vanden Abeele, CEO Financial Review H1 2022 Dominik Maurer, CFO Update on Ascom Strategy Nicolas Vanden Abeele, CEO Equity Story / Guidance Nicolas Vanden Abeele, CEO Q&A HALF YEAR MEDIA CONFERENCE 2022 | 11 AUGUST | ©2022 ASCOM 3
Slide 4: Ascom at a Glance
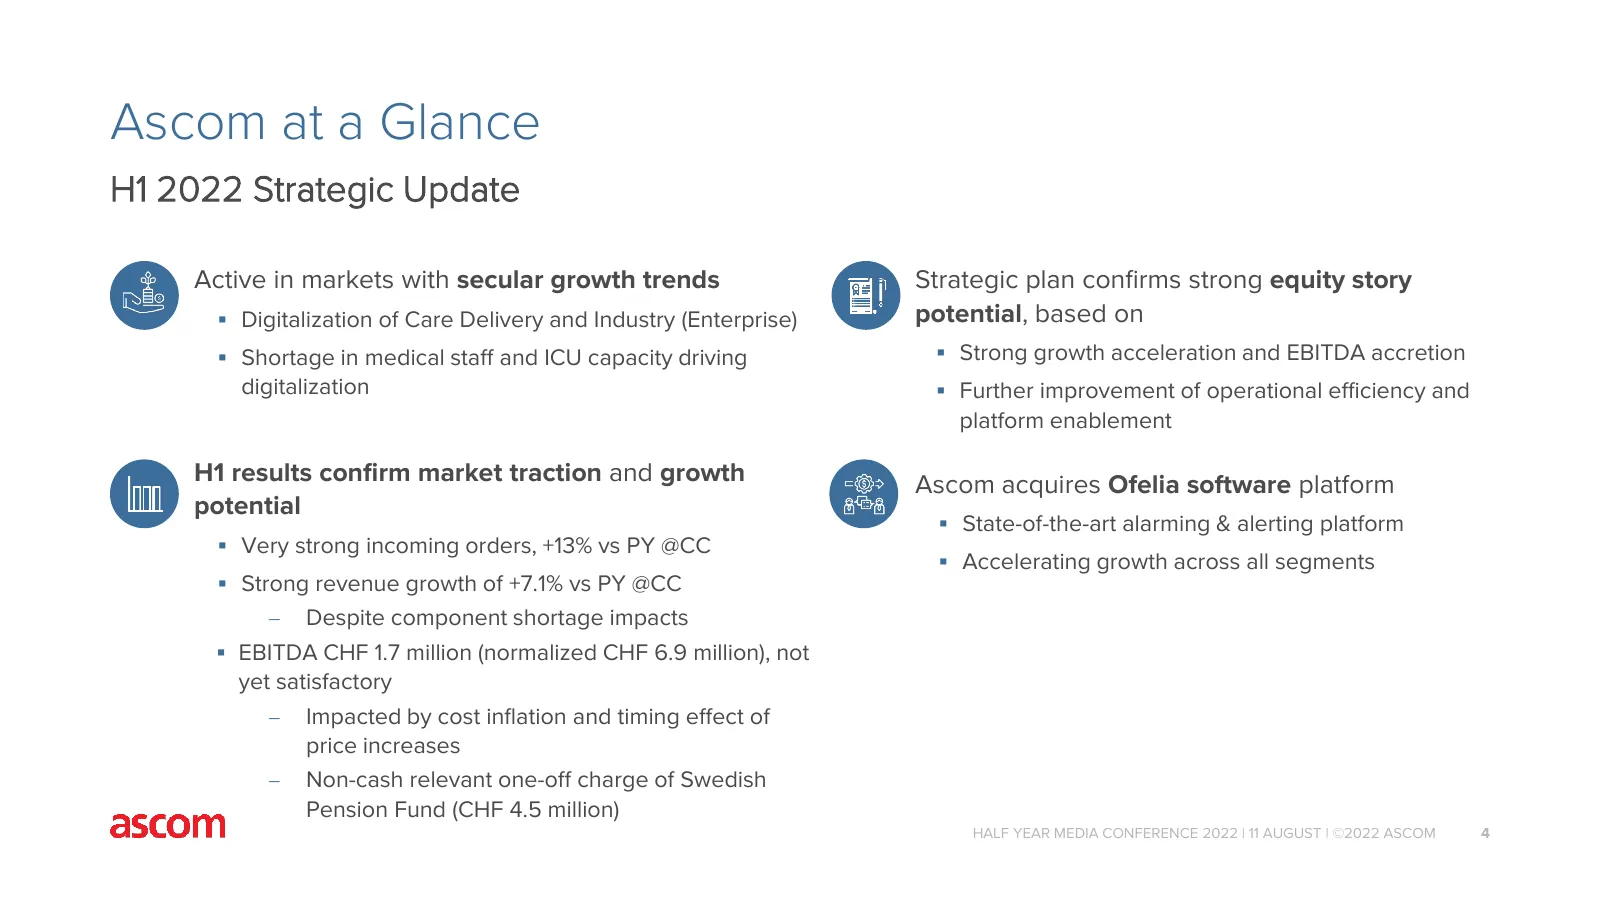
Ascom at a Glance H1 2022 Strategic Update Active in markets with secular growth trends Strategic plan confirms strong equity story Digitalization of Care Delivery and Industry (Enterprise) potential, based on Shortage in medical staff and ICU capacity driving Strong growth acceleration and EB

Slide 5: H1 2022 Financials
To be updated by Finance H1 2022 Financials Dominik Maurer, CFO HALF YEAR MEDIA CONFERENCE 2022 | 11 AUGUST | ©2022 ASCOM 5
Slide 6: Key Figures H1 2022 (growth at actual rates)
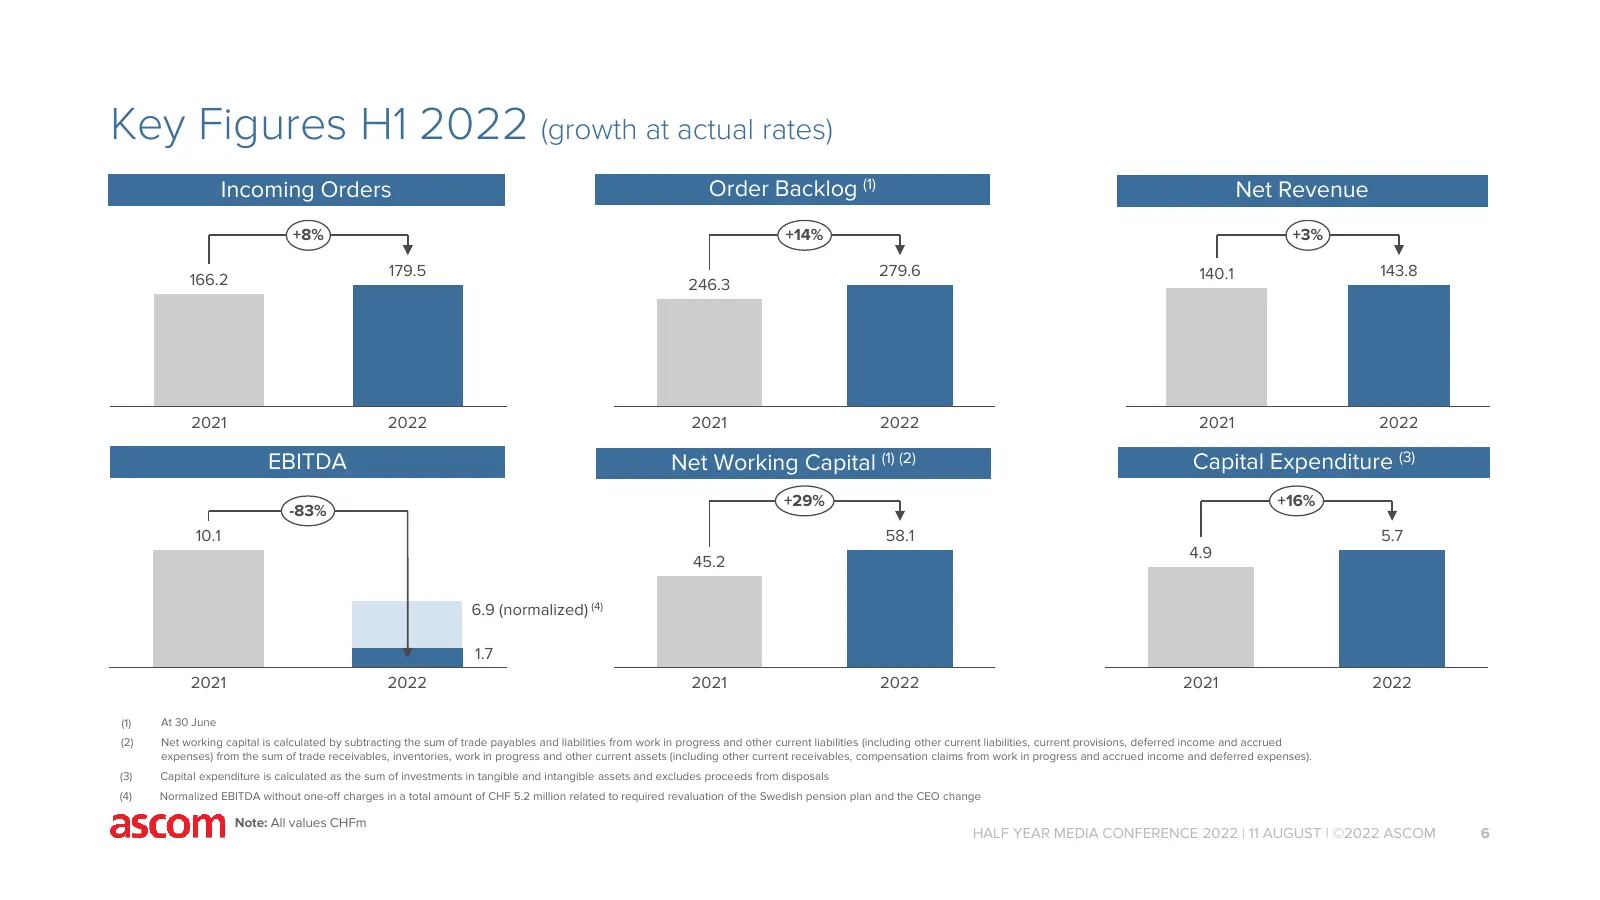
Key Figures H1 2022 (growth at actual rates) Incoming Orders Order Backlog (1) Net Revenue +8% +14% +3% 179.5 279.6 140.1 143.8 166.2 246.3 2021 2022 2021 2022 2021 2022 EBITDA Net Working Capital (1) (2) Capital Expenditure (3) +29% +16% -83% 10.1 58.1 5.7 4.9 45.2 6.9 (normalized) (4) 1.7 2021 202
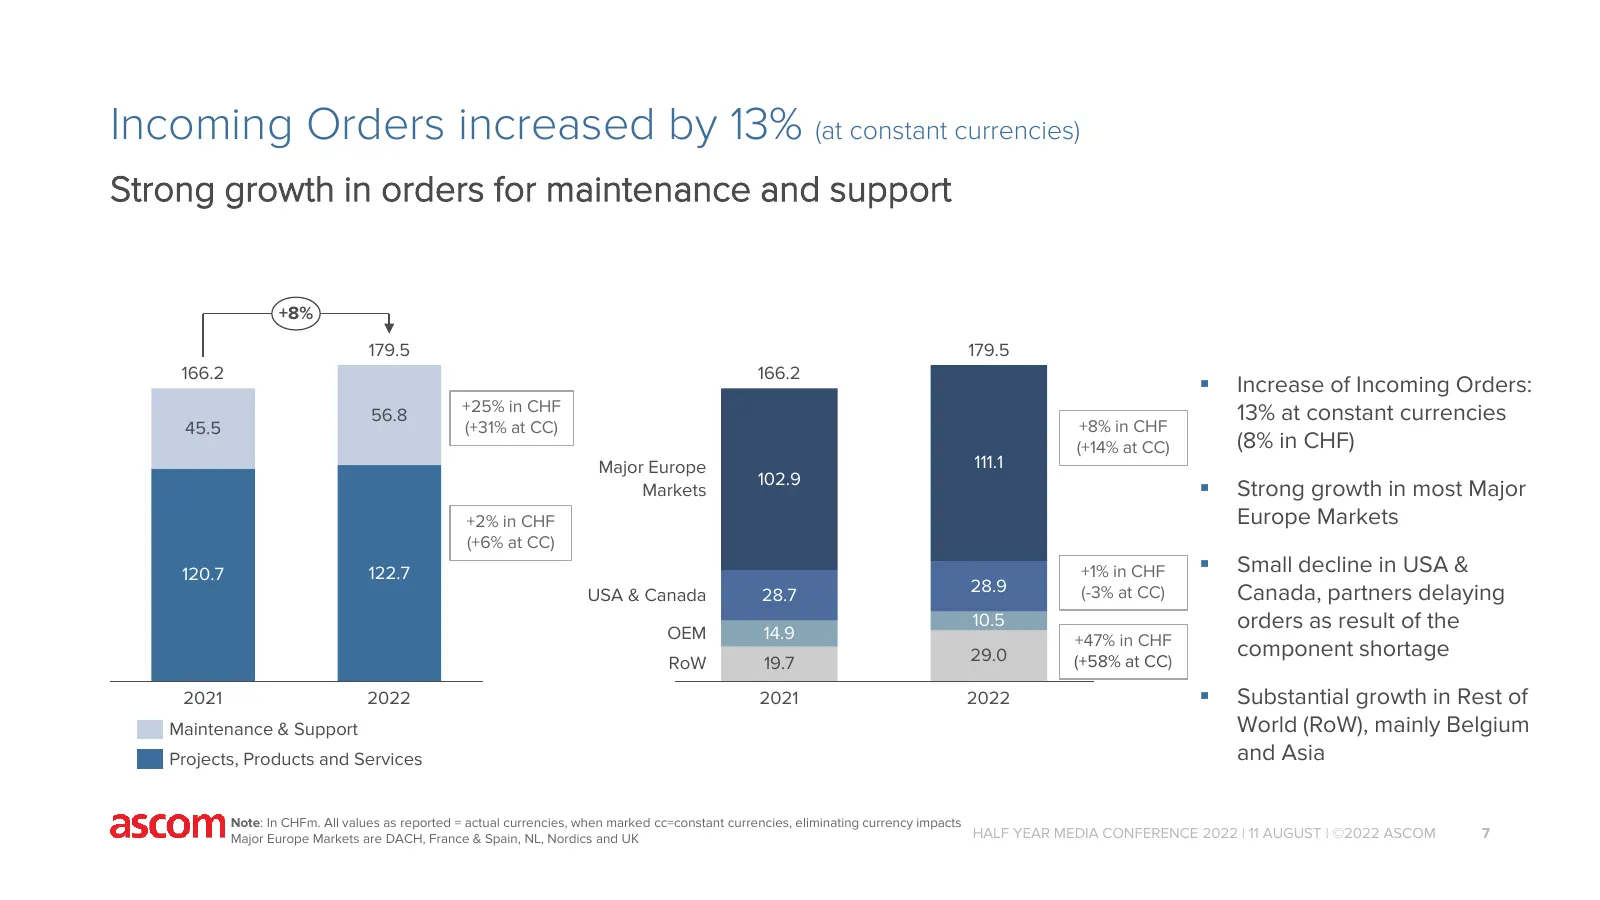
Slide 7: Incoming Orders increased by 13% (at constant currencies)
Incoming Orders increased by 13% (at constant currencies) Strong growth in orders for maintenance and support +8% 179.5 179.5 166.2 166.2 Increase of Incoming Orders: 56.8 +25% in CHF 13% at constant currencies 45.5 (+31% at CC) +8% in CHF (+14% at CC) (8% in CHF) Major Europe 111.1 102.9 Markets
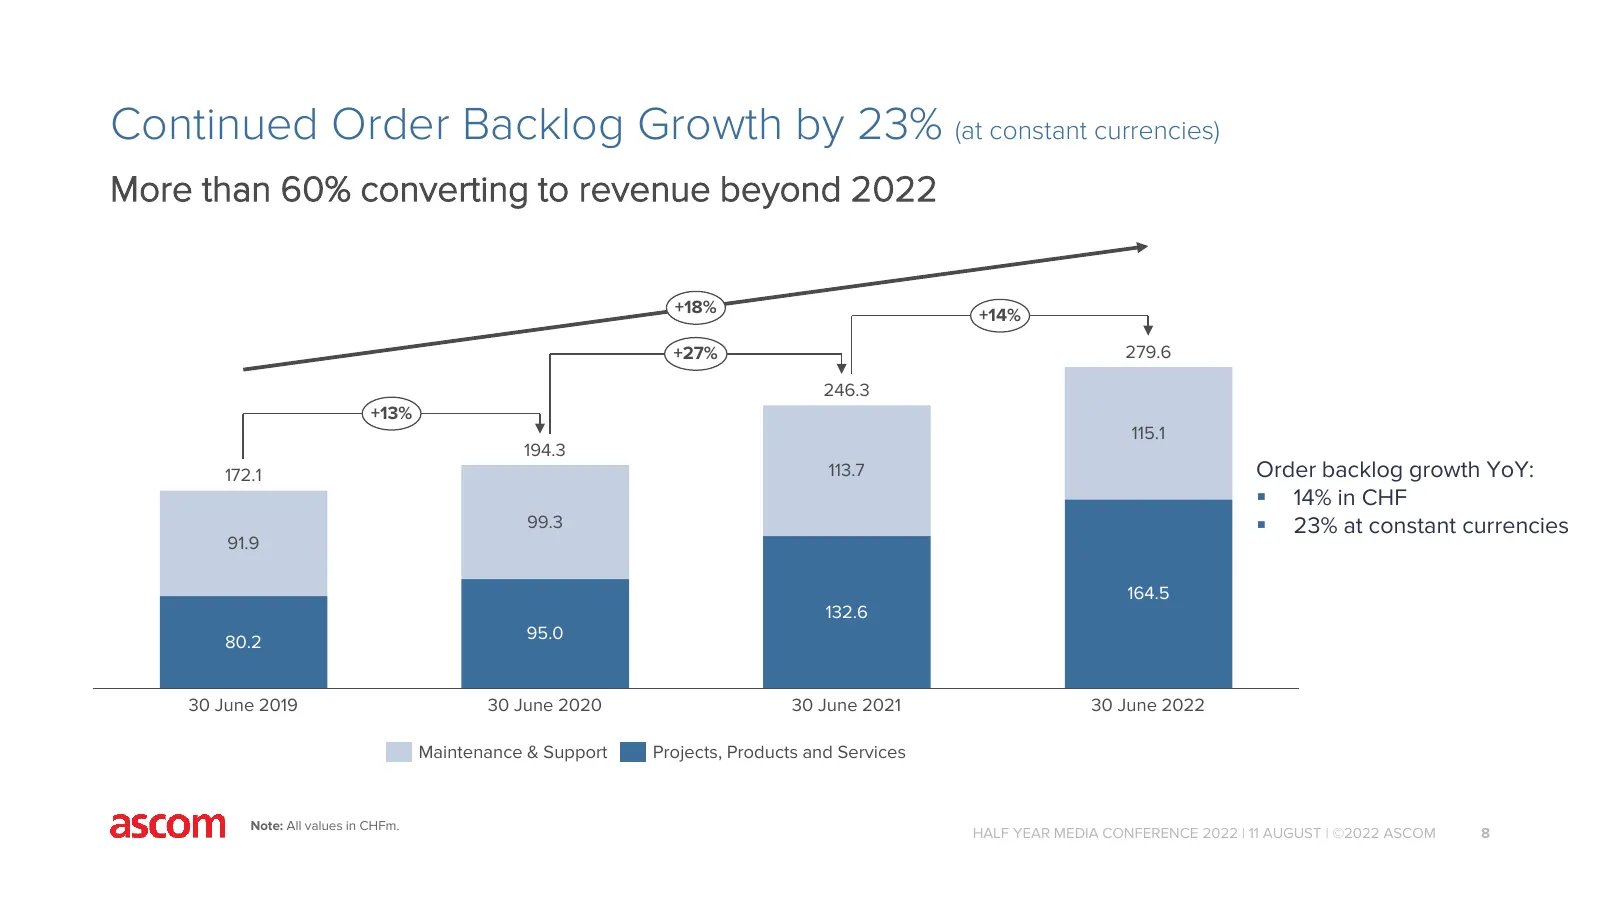
Slide 8: Continued Order Backlog Growth by 23% (at constant currencies)
Continued Order Backlog Growth by 23% (at constant currencies) More than 60% converting to revenue beyond 2022 +18% +14% +27% 279.6 246.3 +13% 115.1 194.3 172.1 113.7 Order backlog growth YoY: 14% in CHF 99.3 23% at constant currencies 91.9 164.5 132.6 80.2 95.0 30 June 2019 30 June 2020 30 June
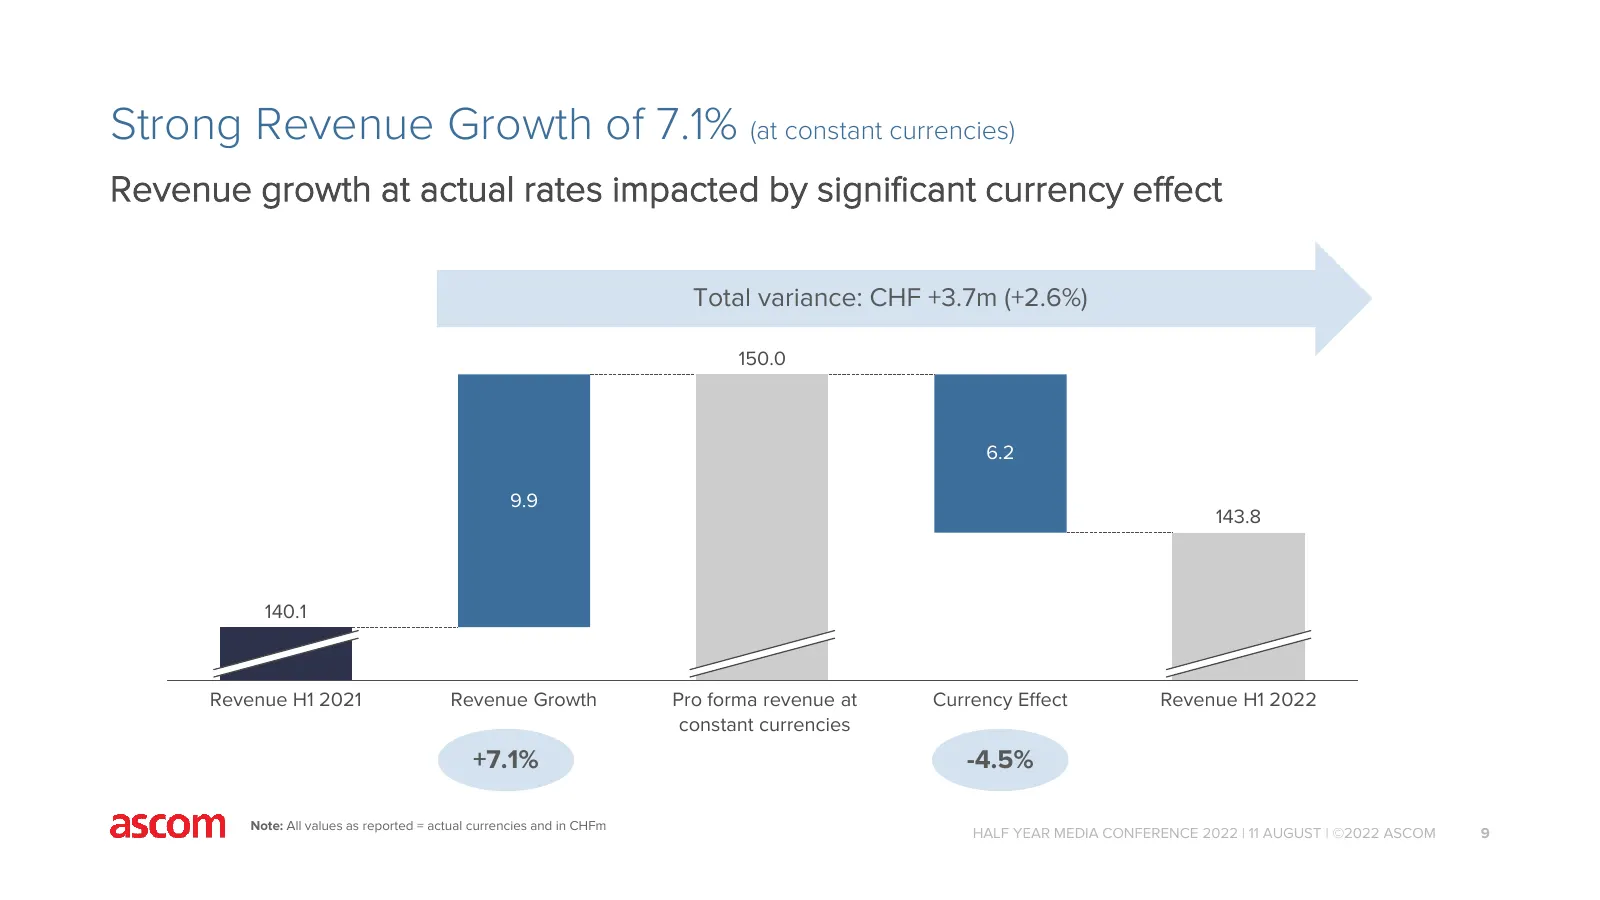
Slide 9: Strong Revenue Growth of 7.1% (at constant currencies)
Strong Revenue Growth of 7.1% (at constant currencies) Revenue growth at actual rates impacted by significant currency effect Total variance: CHF +3.7m (+2.6%) 150.0 6.2 9.9 143.8 140.1 Revenue H1 2021 Revenue Growth Pro forma revenue at Currency Effect Revenue H1 2022 constant currencies +7.1% -4.5
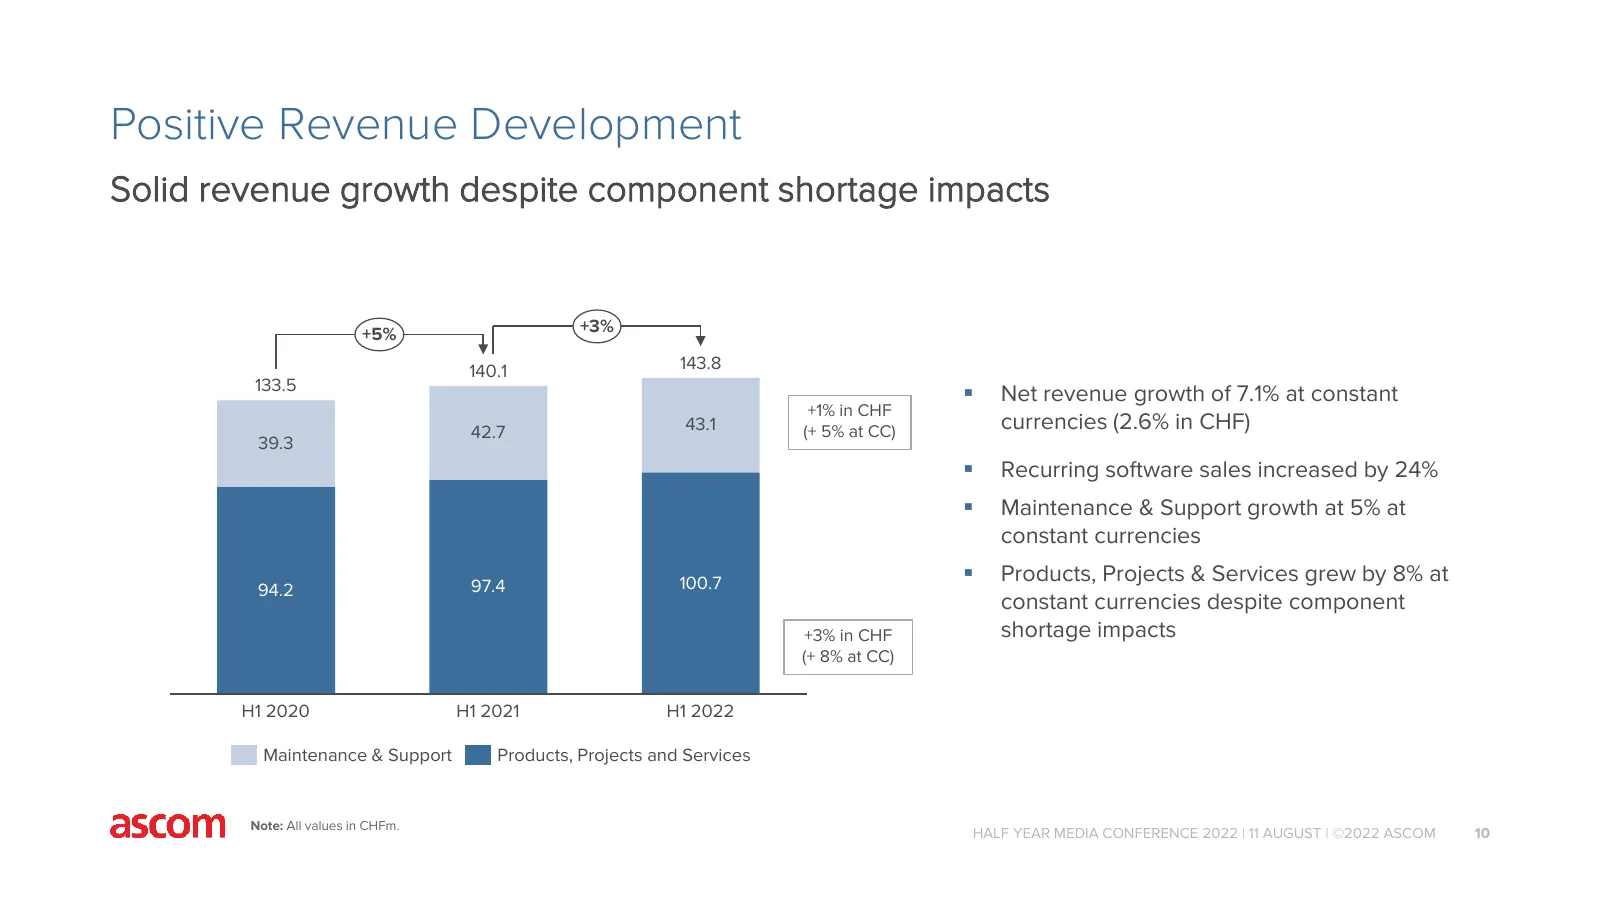
Slide 10: Positive Revenue Development
Positive Revenue Development Solid revenue growth despite component shortage impacts +5% +3% 140.1 143.8 133.5 Net revenue growth of 7.1% at constant +1% in CHF 42.7 43.1 (+ 5% at CC) currencies (2.6% in CHF) 39.3 Recurring software sales increased by 24% Maintenance & Support growth at 5% at
Slide 11: Revenue H1 2022 – Regional Development (I)
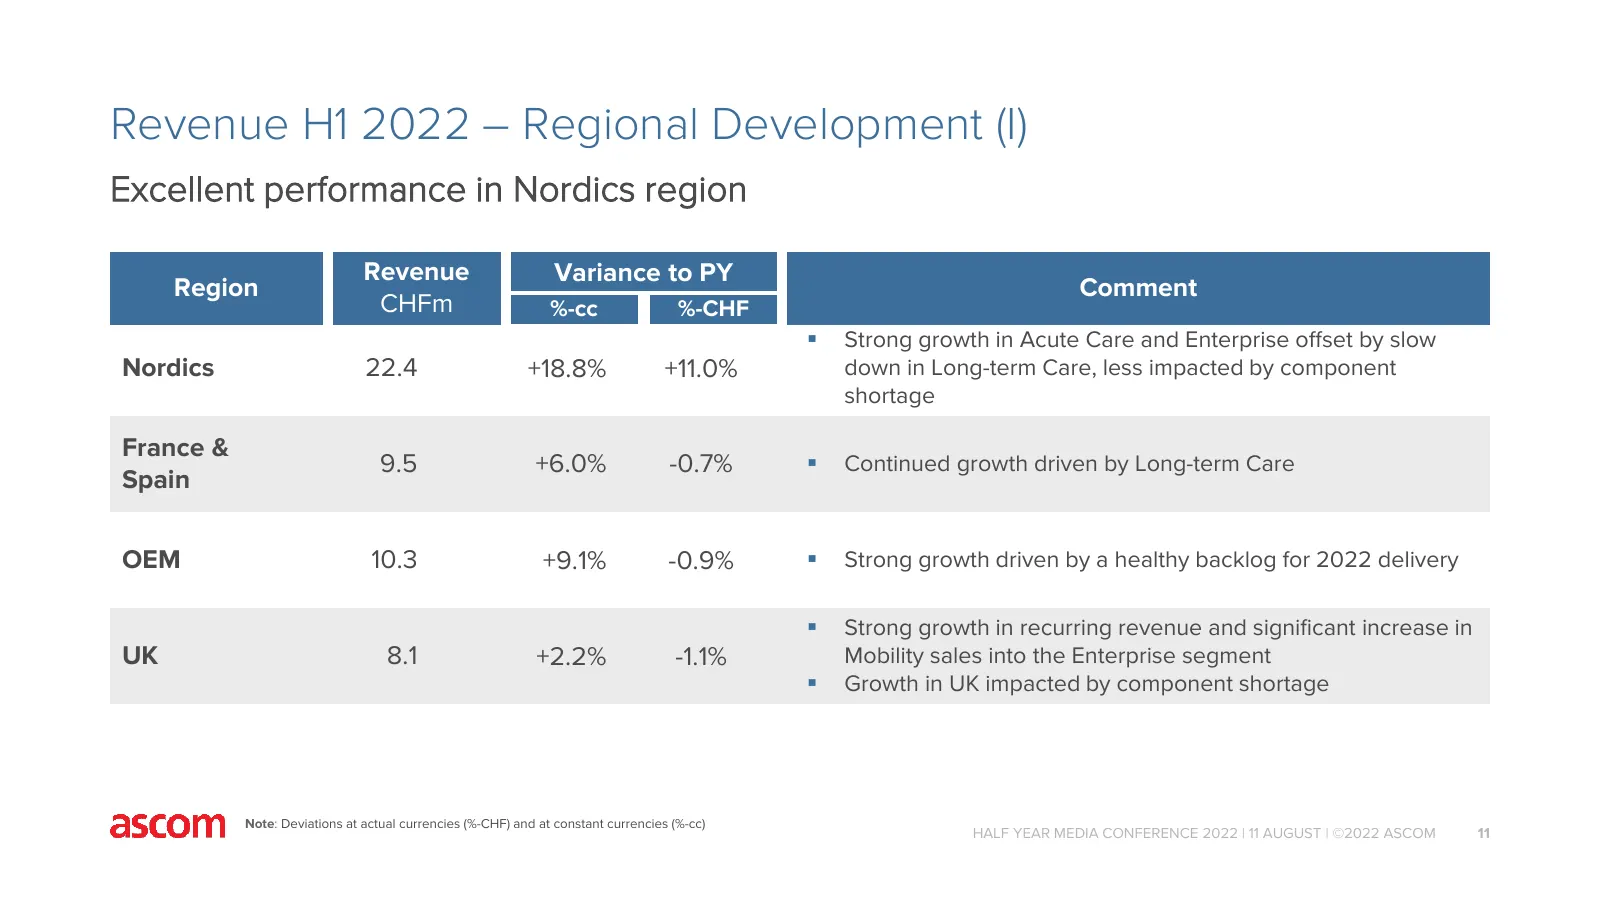
Revenue H1 2022 – Regional Development (I) Excellent performance in Nordics region Revenue Variance to PY Region Comment CHFm %-cc %-CHF Strong growth in Acute Care and Enterprise offset by slow Nordics 22.4 +18.8% +11.0% down in Long-term Care, less impacted by component shortage France & 9.5 +6.
Slide 12: Revenue H1 2022 – Regional Development (II)
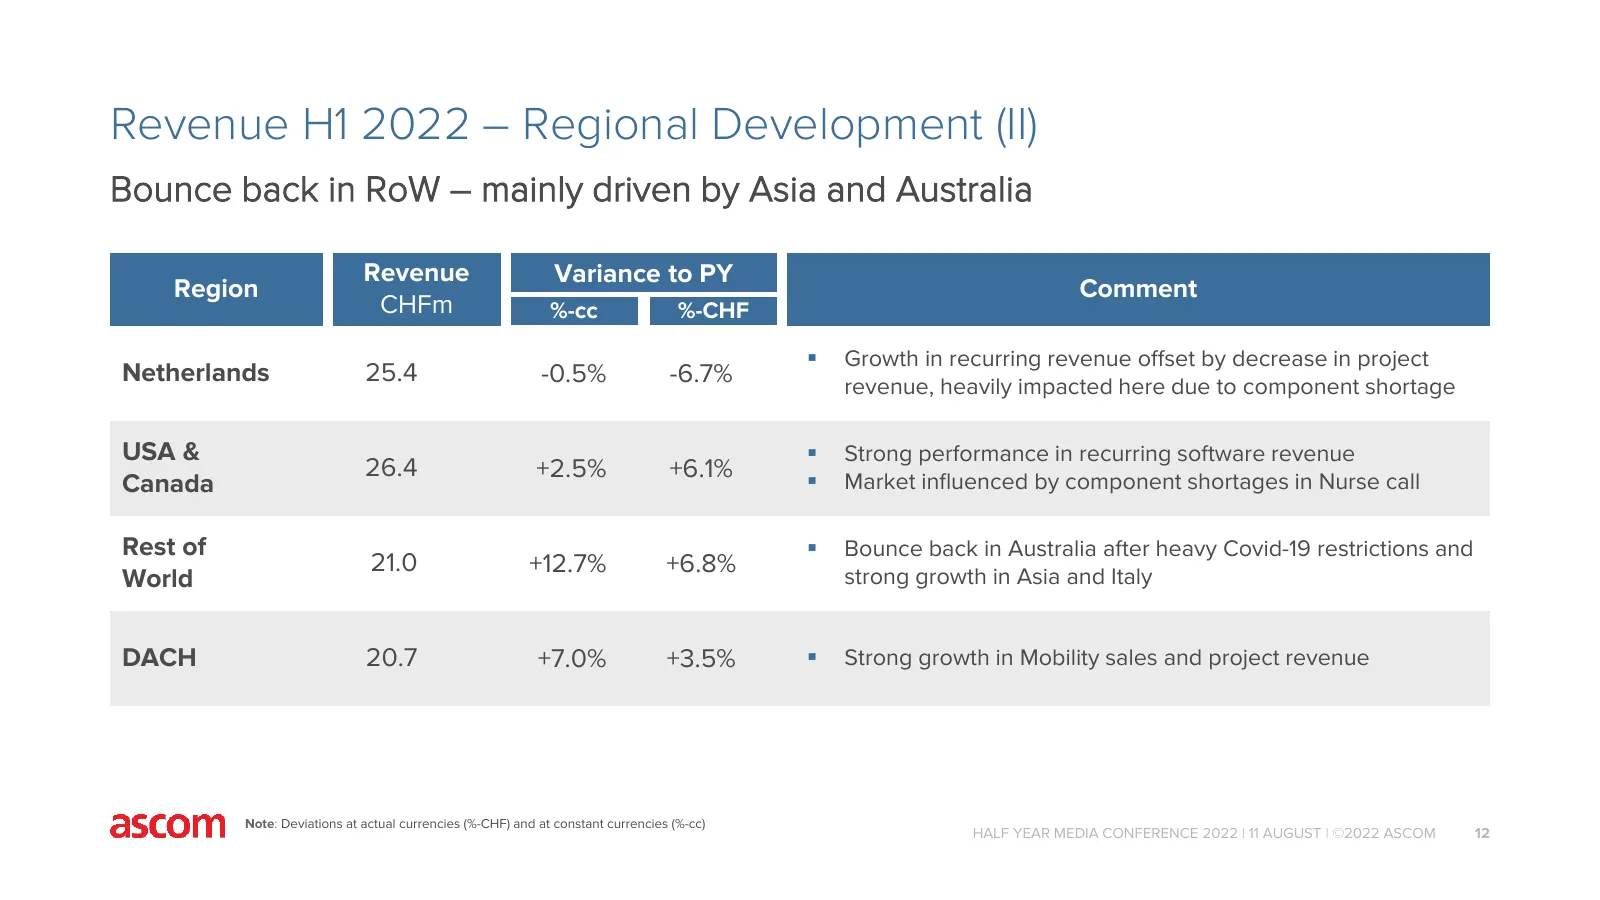
Revenue H1 2022 – Regional Development (II) Bounce back in RoW – mainly driven by Asia and Australia Revenue Variance to PY Region Comment CHFm %-cc %-CHF Growth in recurring revenue offset by decrease in project Netherlands 25.4 -0.5% -6.7% revenue, heavily impacted here due to component shortage
Slide 13: Revenue Type Market Segment
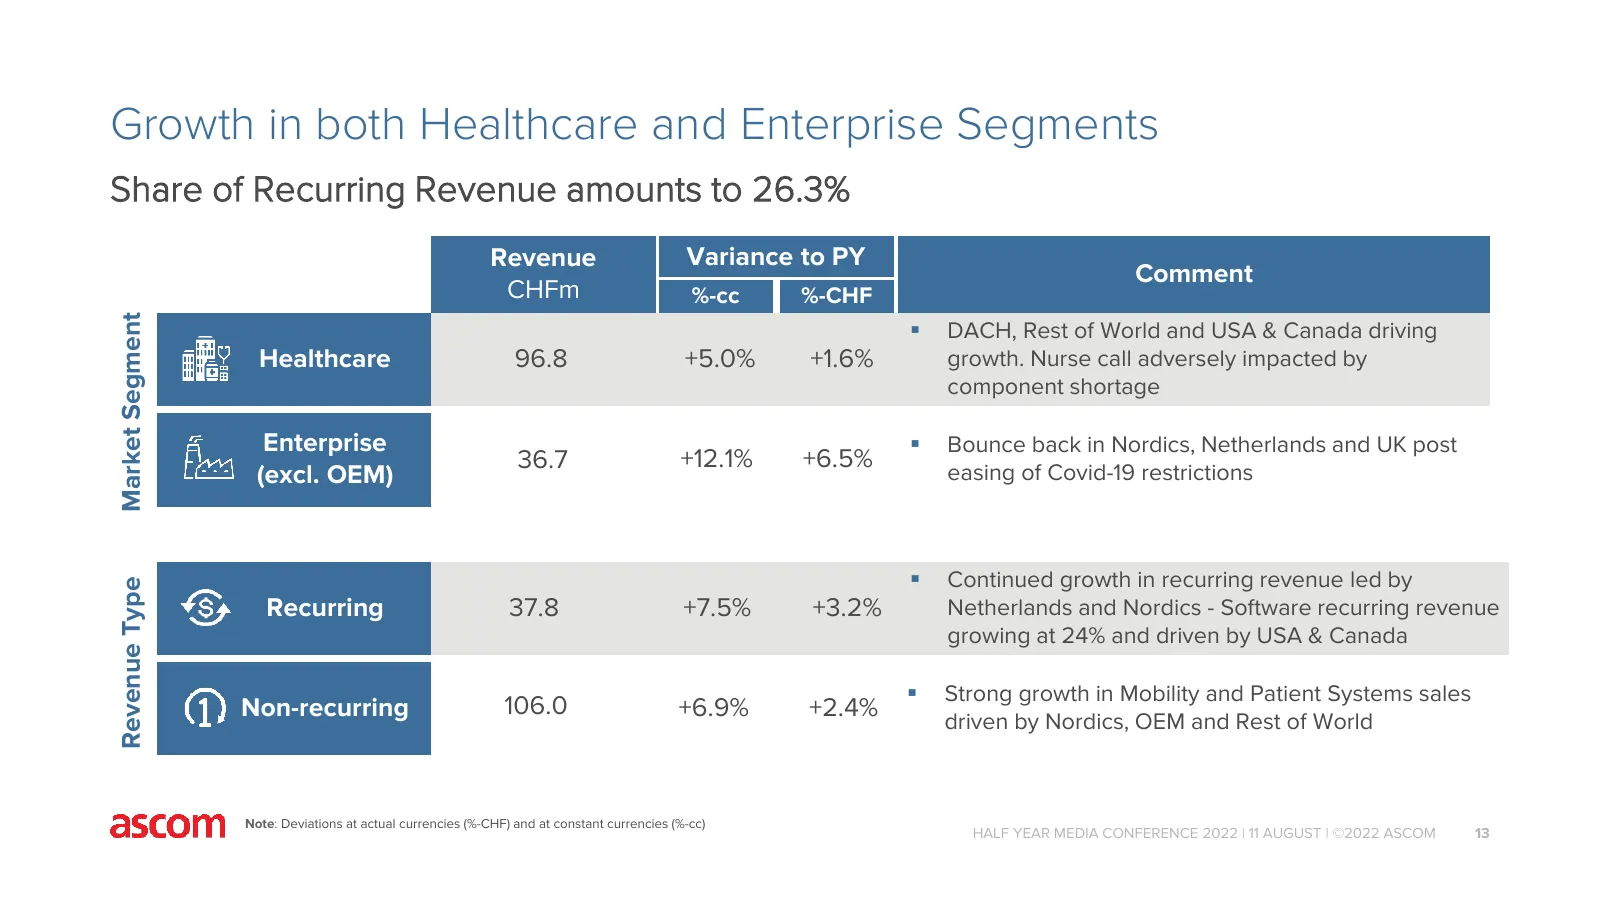
Growth in both Healthcare and Enterprise Segments Share of Recurring Revenue amounts to 26.3% Revenue Variance to PY Comment CHFm %-cc %-CHF Market Segment DACH, Rest of World and USA & Canada driving Healthcare 96.8 +5.0% +1.6% growth. Nurse call adversely impacted by component shortage Enterpris
Slide 14: EBITDA and Gross Profit Bridge
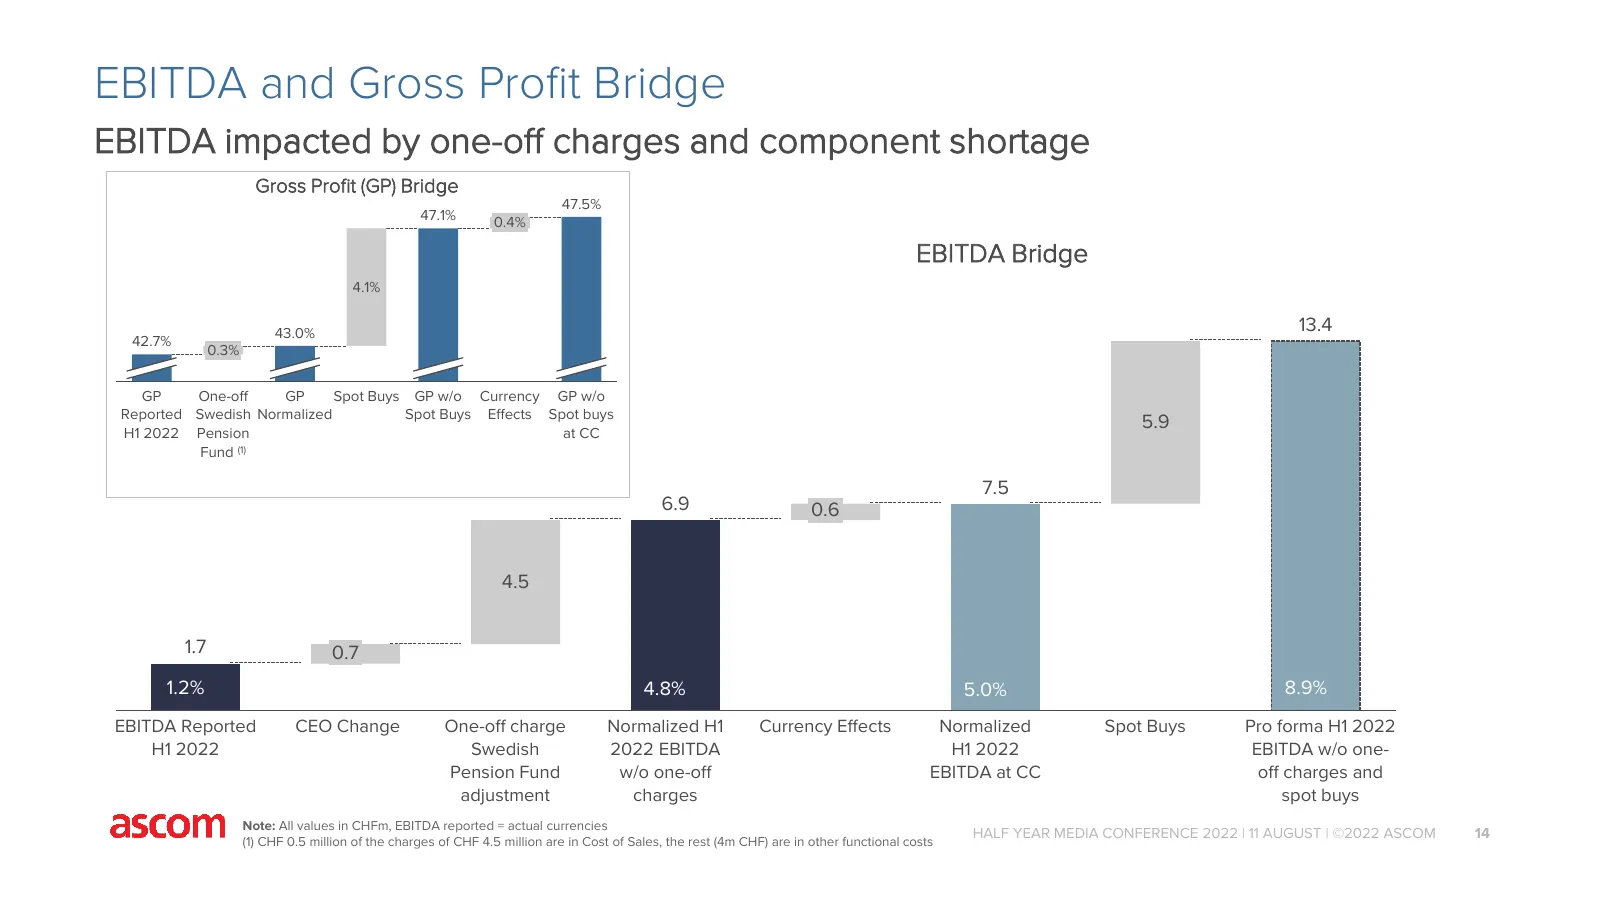
EBITDA and Gross Profit Bridge EBITDA impacted by one-off charges and component shortage Gross Profit (GP) Bridge 47.5% 47.1% 0.4% EBITDA Bridge 4.1% 43.0% 13.4 42.7% 0.3% GP One-off GP Spot Buys GP w/o Currency GP w/o Reported Swedish Normalized Spot Buys Effects Spot buys 5.9 H1 2022 Pension at CC
Slide 15: Swedish Pension Fund adjustment
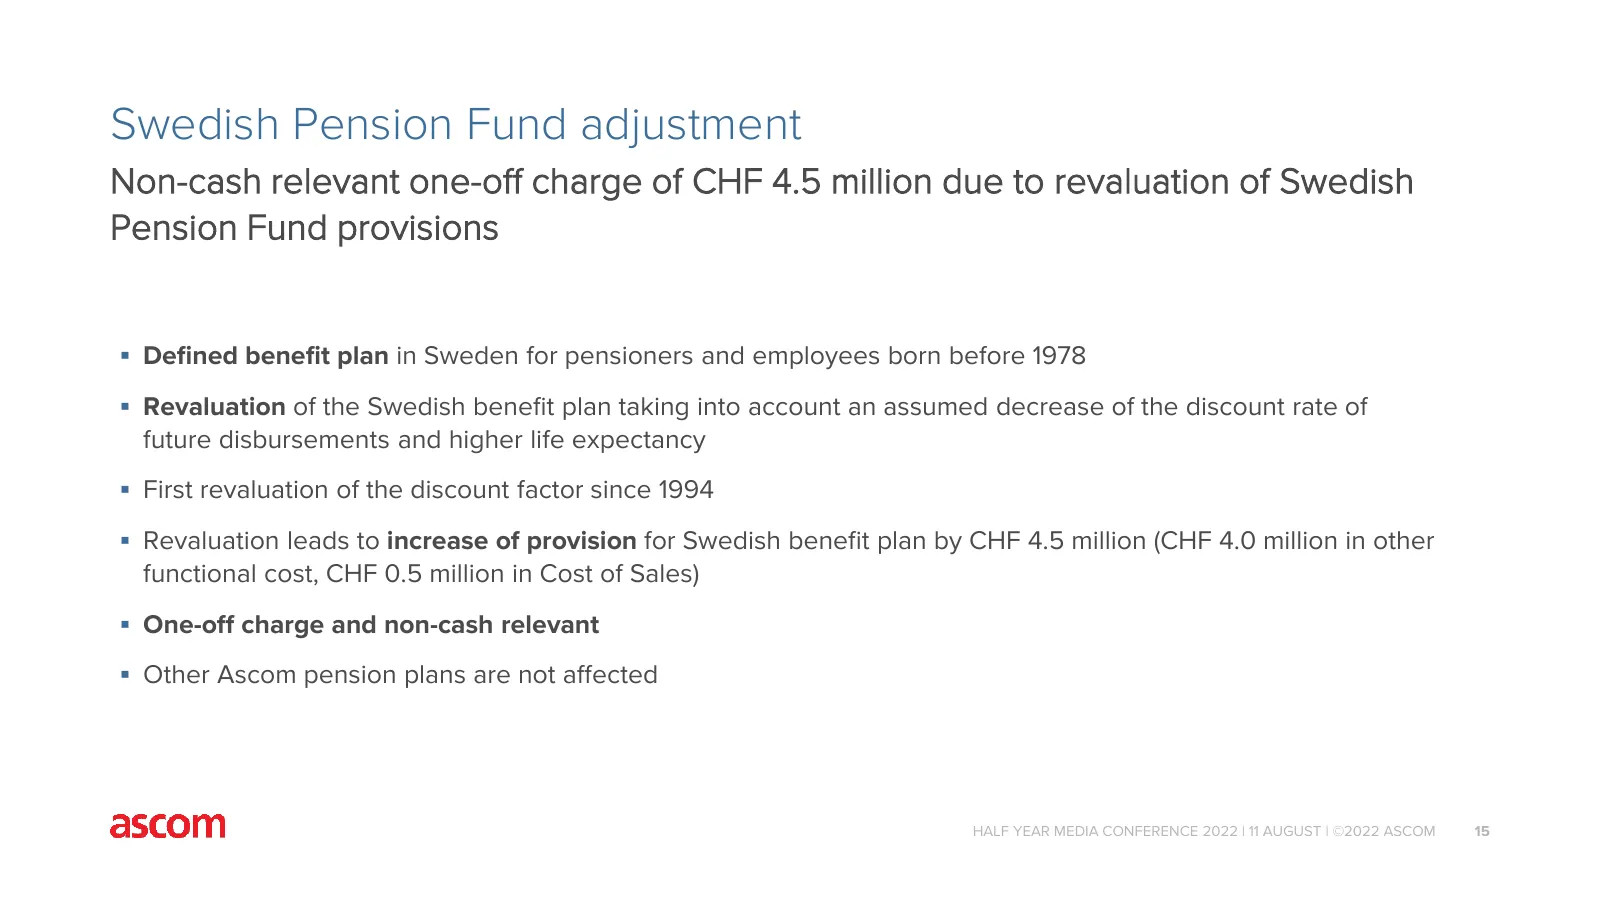
Swedish Pension Fund adjustment Non-cash relevant one-off charge of CHF 4.5 million due to revaluation of Swedish Pension Fund provisions Defined benefit plan in Sweden for pensioners and employees born before 1978 Revaluation of the Swedish benefit plan taking into account an assumed decrease o
Slide 16: H1 2022 P&L
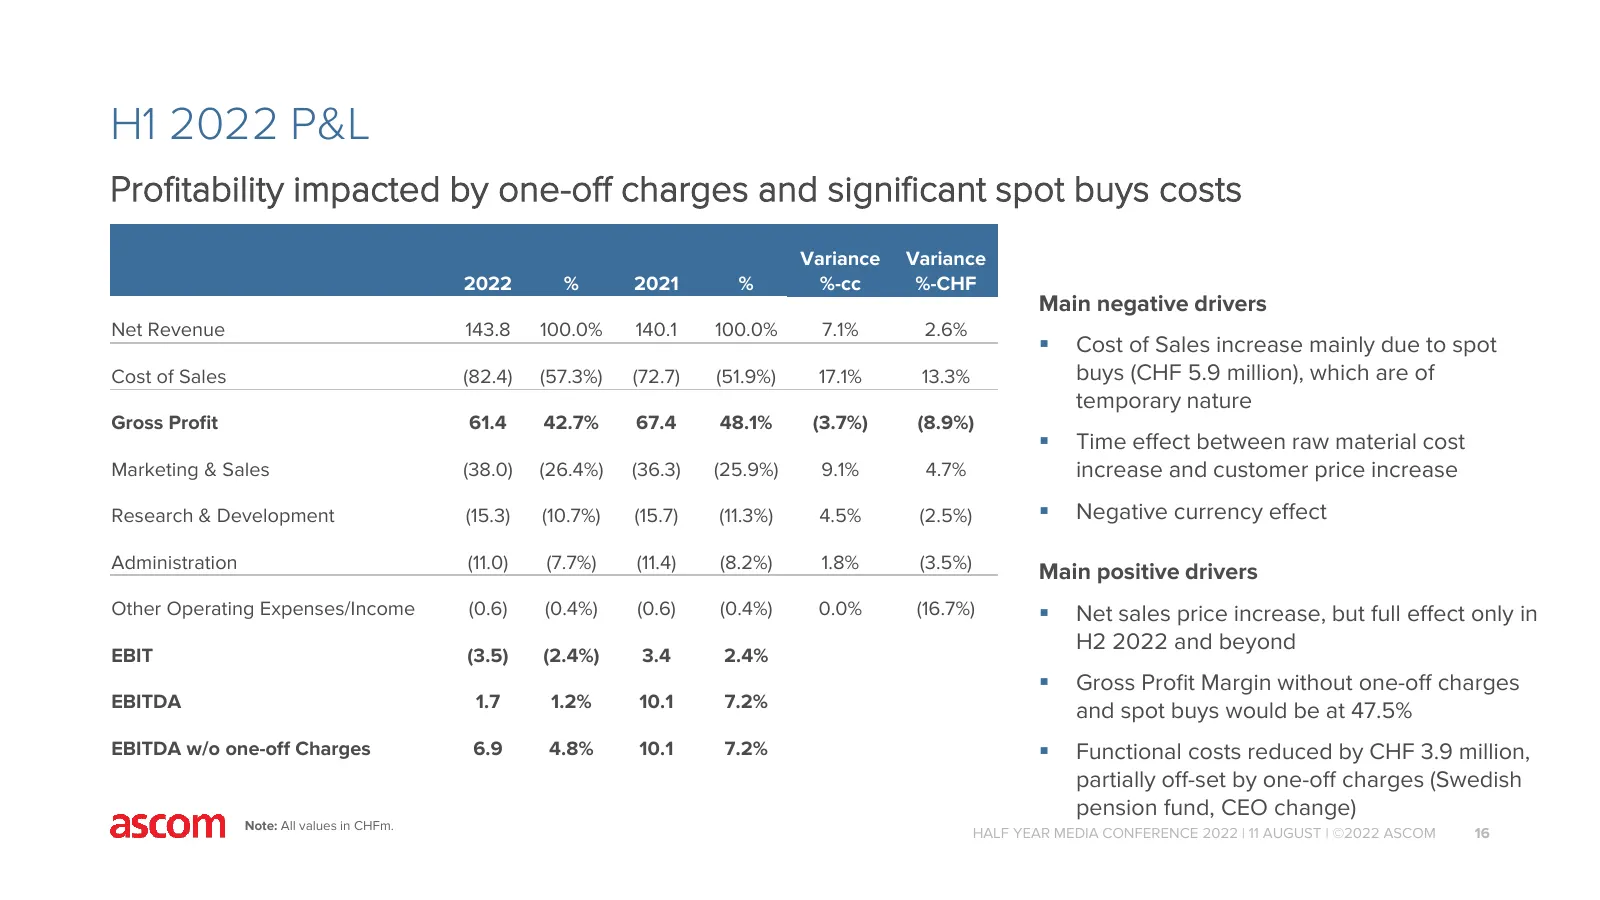
H1 2022 P&L Profitability impacted by one-off charges and significant spot buys costs Variance Variance 2022 % 2021 % %-cc %-CHF Main negative drivers Net Revenue 143.8 100.0% 140.1 100.0% 7.1% 2.6% Cost of Sales increase mainly due to spot Cost of Sales (82.4) (57.3%) (72.7) (51.9%) 17.1% 13.3% b
Slide 17: CAPEX
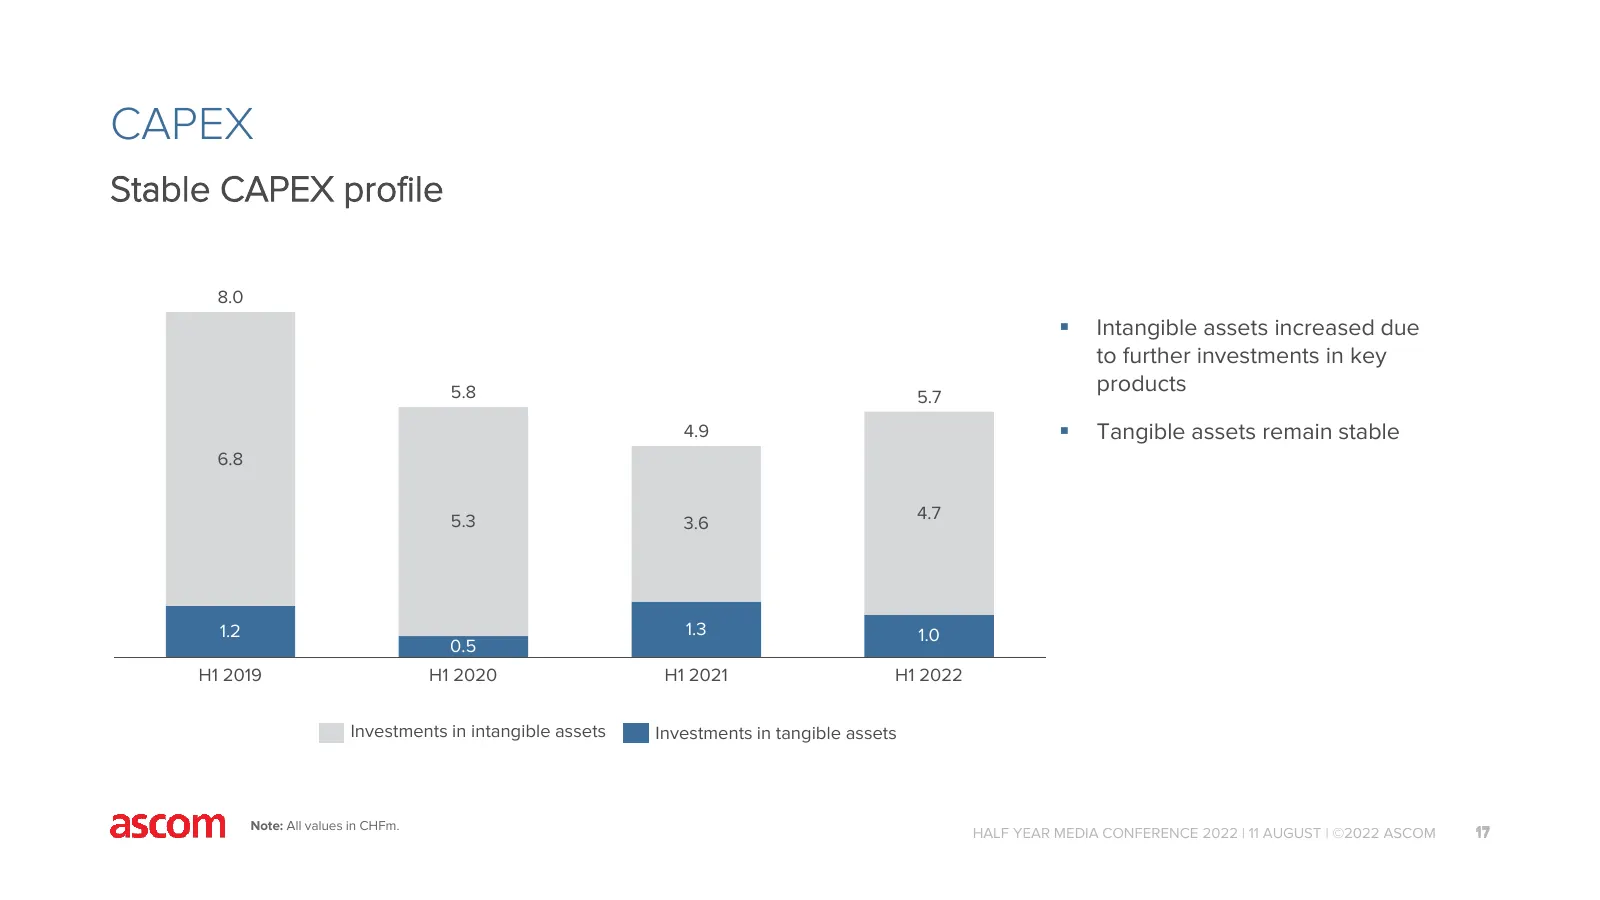
CAPEX Stable CAPEX profile 8.0 Intangible assets increased due to further investments in key 5.8 5.7 products 4.9 Tangible assets remain stable 6.8 5.3 4.7 3.6 1.2 1.3 1.0 0.5 H1 2019 H1 2020 H1 2021 H1 2022 Investments in intangible assets Investments in tangible assets Note: All values in CHFm
Slide 18: Cash Flow Development
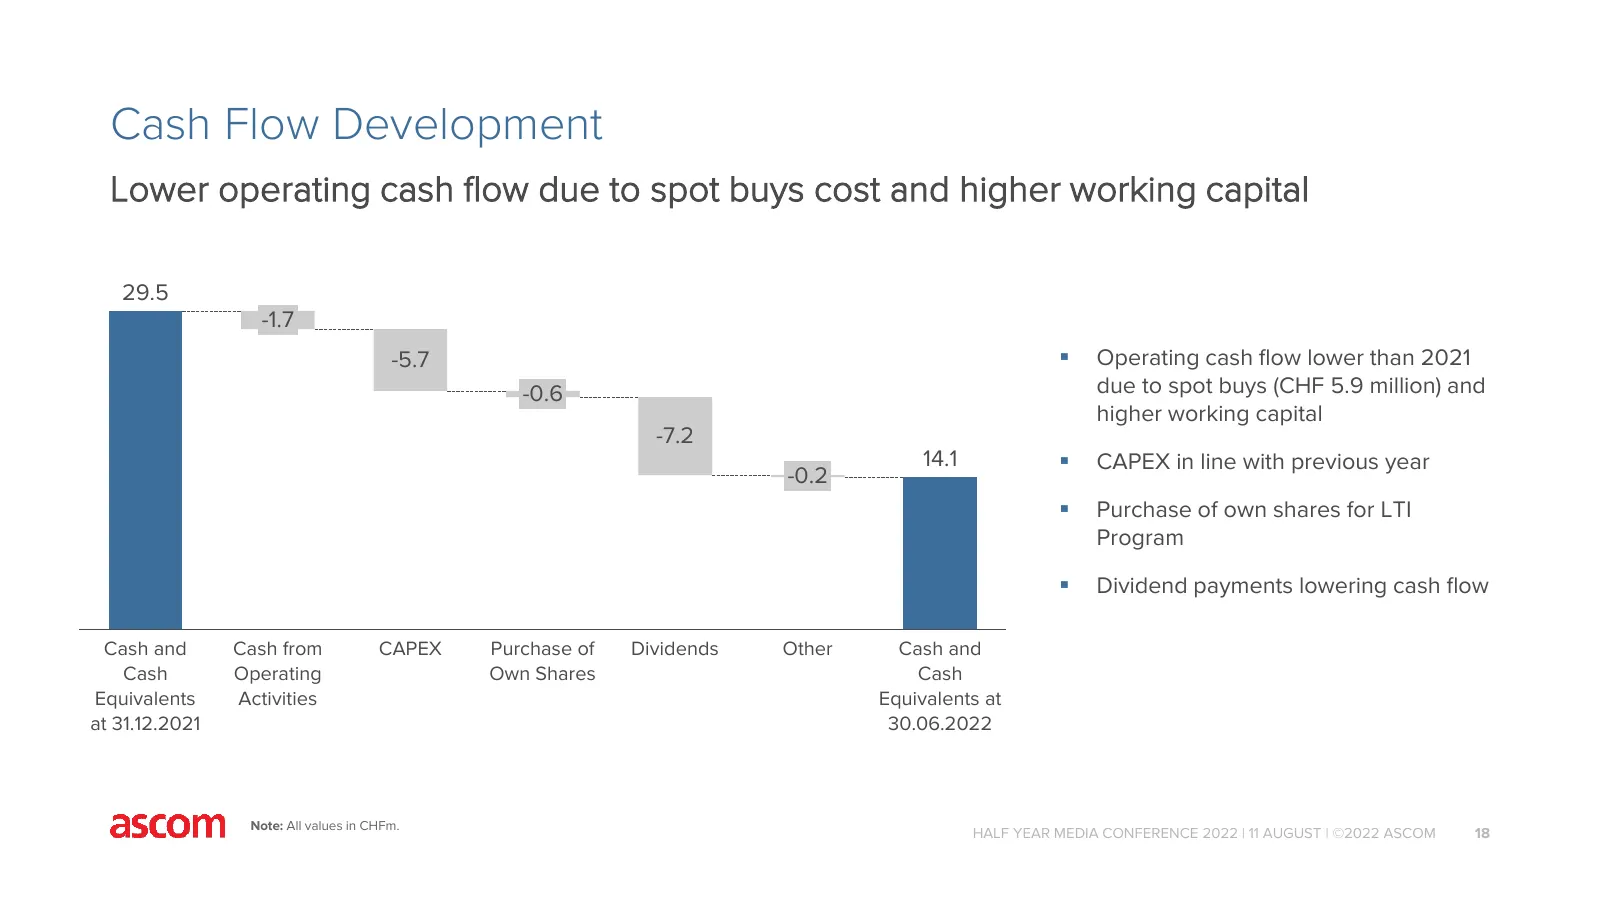
Cash Flow Development Lower operating cash flow due to spot buys cost and higher working capital 29.5 -1.7 -5.7 Operating cash flow lower than 2021 -0.6 due to spot buys (CHF 5.9 million) and higher working capital -7.2 14.1 CAPEX in line with previous year -0.2 Purchase of own shares for LTI
Slide 19: Balance Sheet Evolution
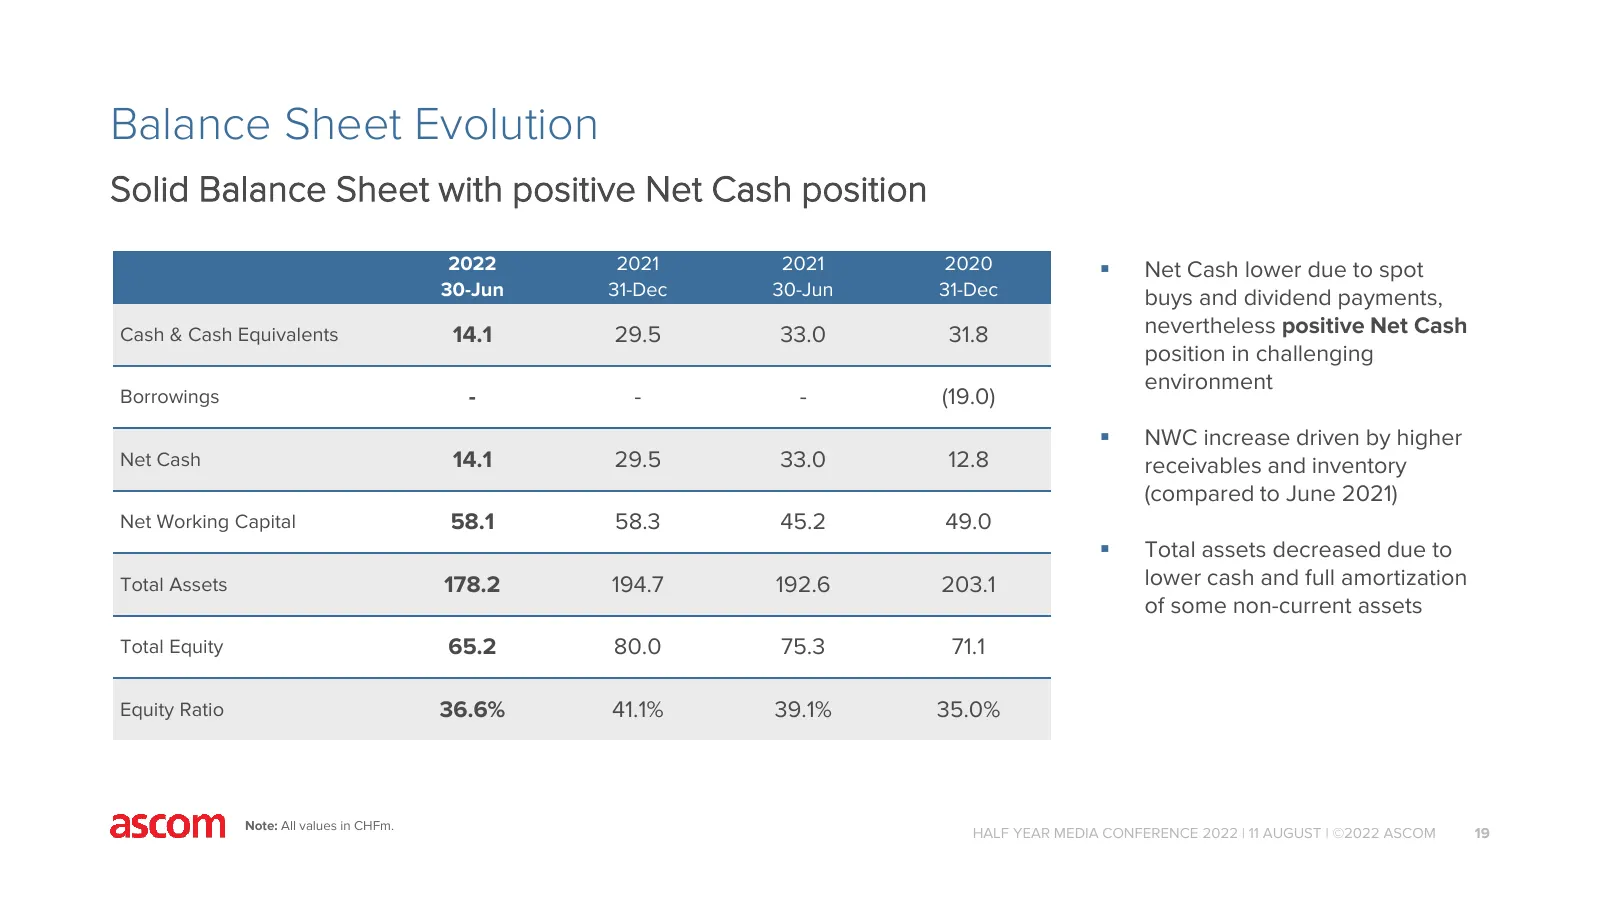
Balance Sheet Evolution Solid Balance Sheet with positive Net Cash position 2022 2021 2021 2020 Net Cash lower due to spot 30-Jun 31-Dec 30-Jun 31-Dec buys and dividend payments, Cash & Cash Equivalents 14.1 29.5 33.0 31.8 nevertheless positive Net Cash position in challenging environment Borrowin
Slide 20: Navigating in Challenging Macro Environment
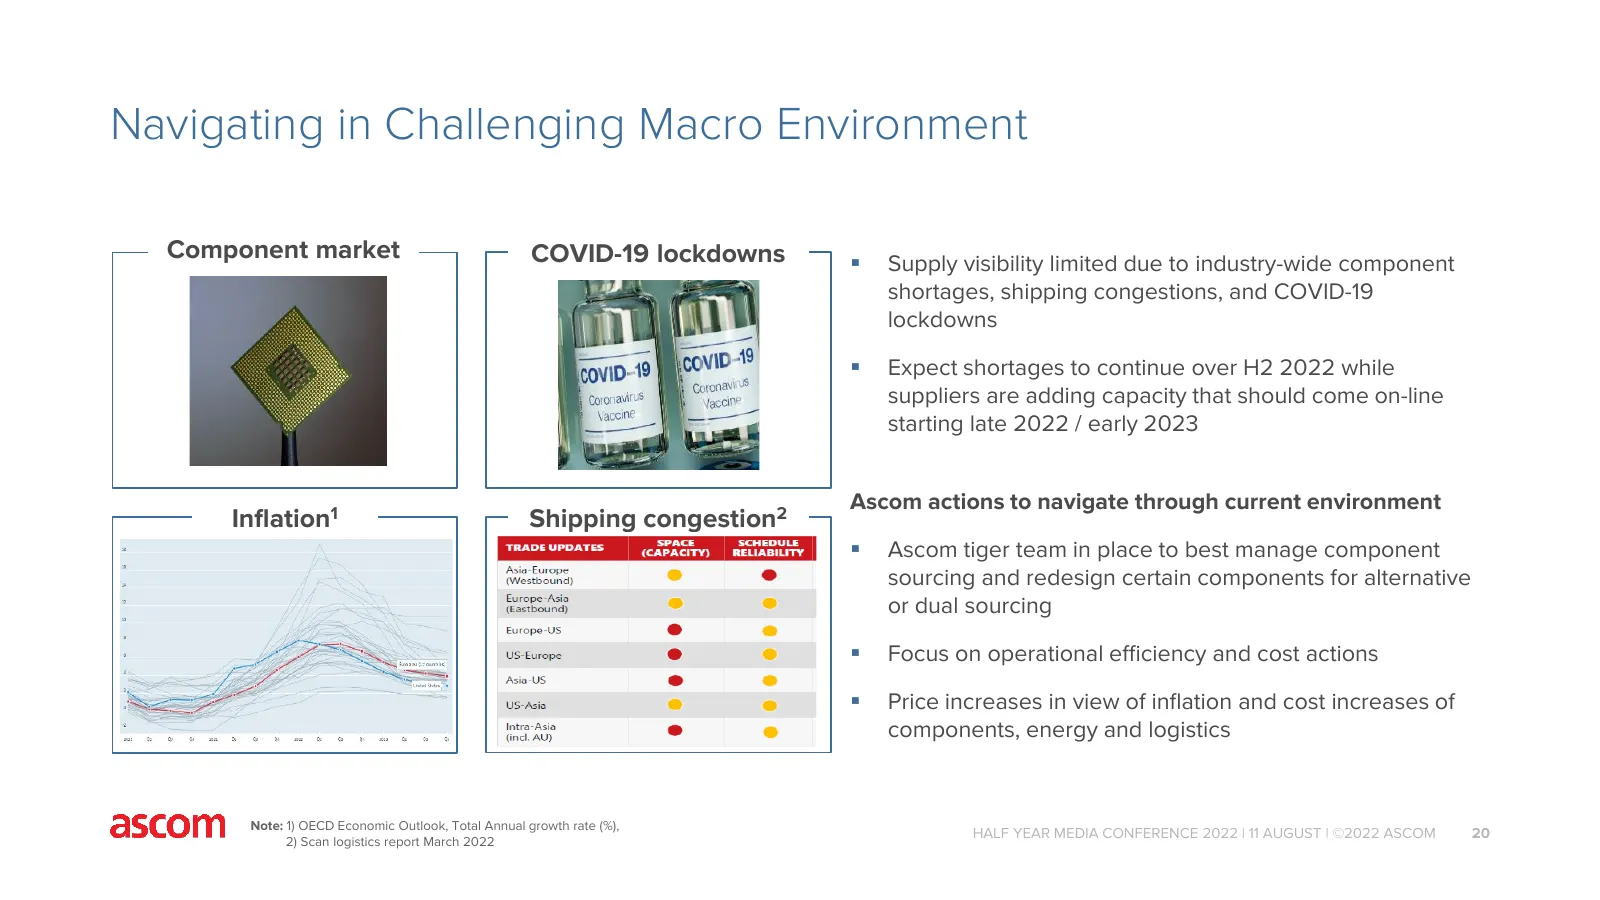
Navigating in Challenging Macro Environment Component market COVID-19 lockdowns Supply visibility limited due to industry-wide component shortages, shipping congestions, and COVID-19 lockdowns Expect shortages to continue over H2 2022 while suppliers are adding capacity that should come on-line

Slide 21: Update on Ascom Strategy
Update on Ascom Strategy Nicolas Vanden Abeele, CEO HALF YEAR MEDIA CONFERENCE 2022 | 11 AUGUST | ©2022 ASCOM 21
Slide 22: Accelerating Ascom's growth ambition
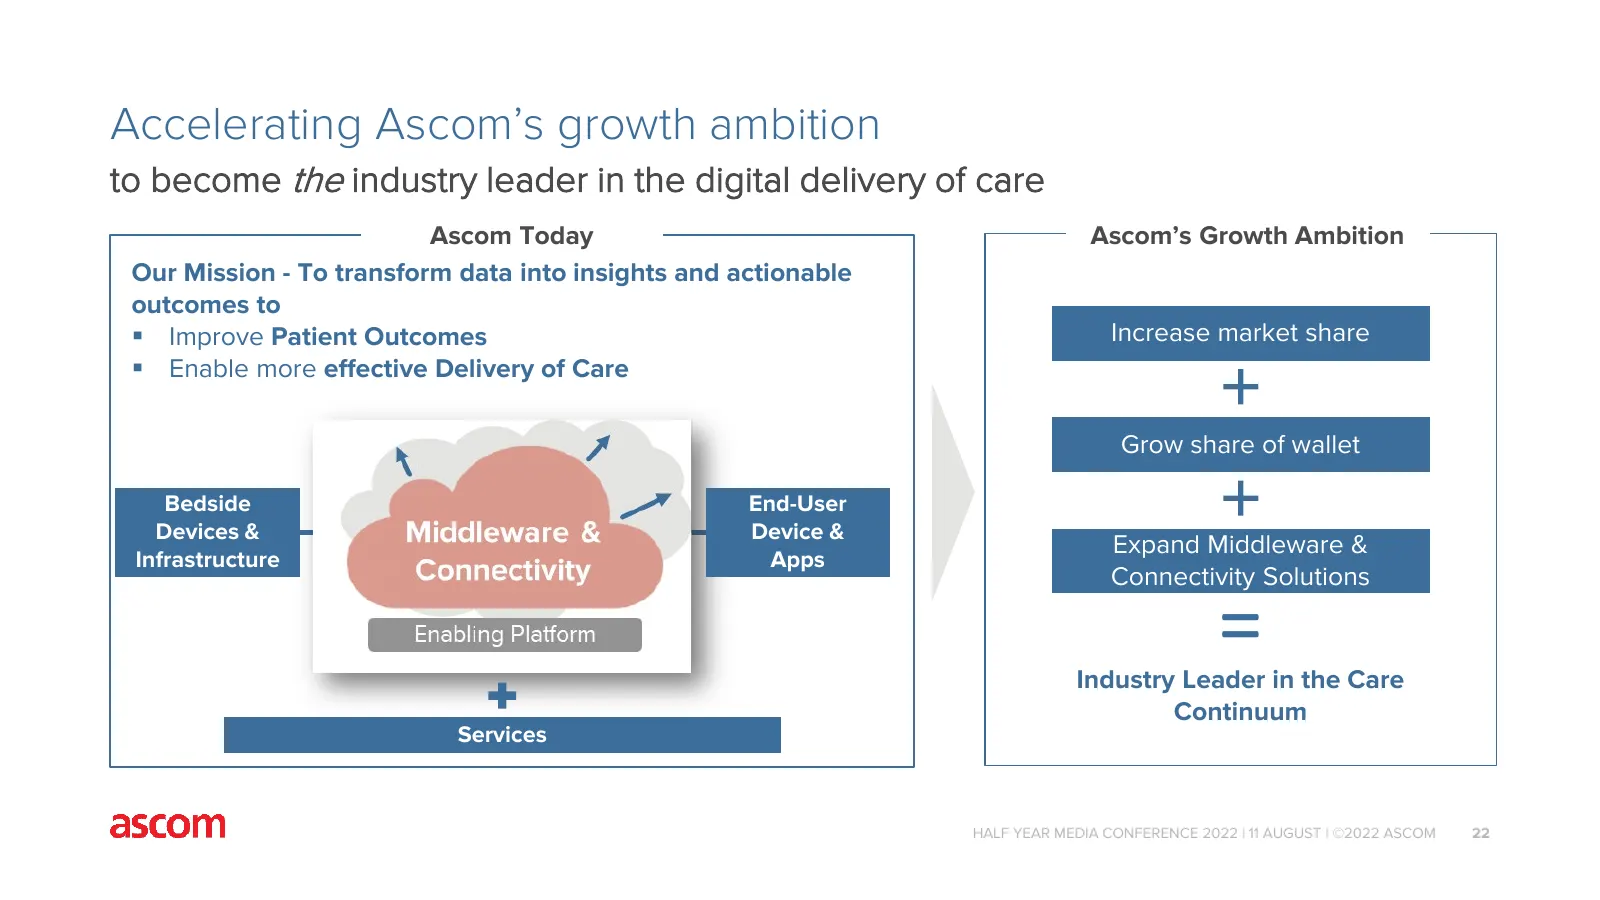
Accelerating Ascom’s growth ambition to become the industry leader in the digital delivery of care Ascom Today Ascom’s Growth Ambition Our Mission - To transform data into insights and actionable outcomes to Improve Patient Outcomes Increase market share Enable more effective Delivery of Care Gr
Slide 23: 3 Chapters of Ascom's Equity Story
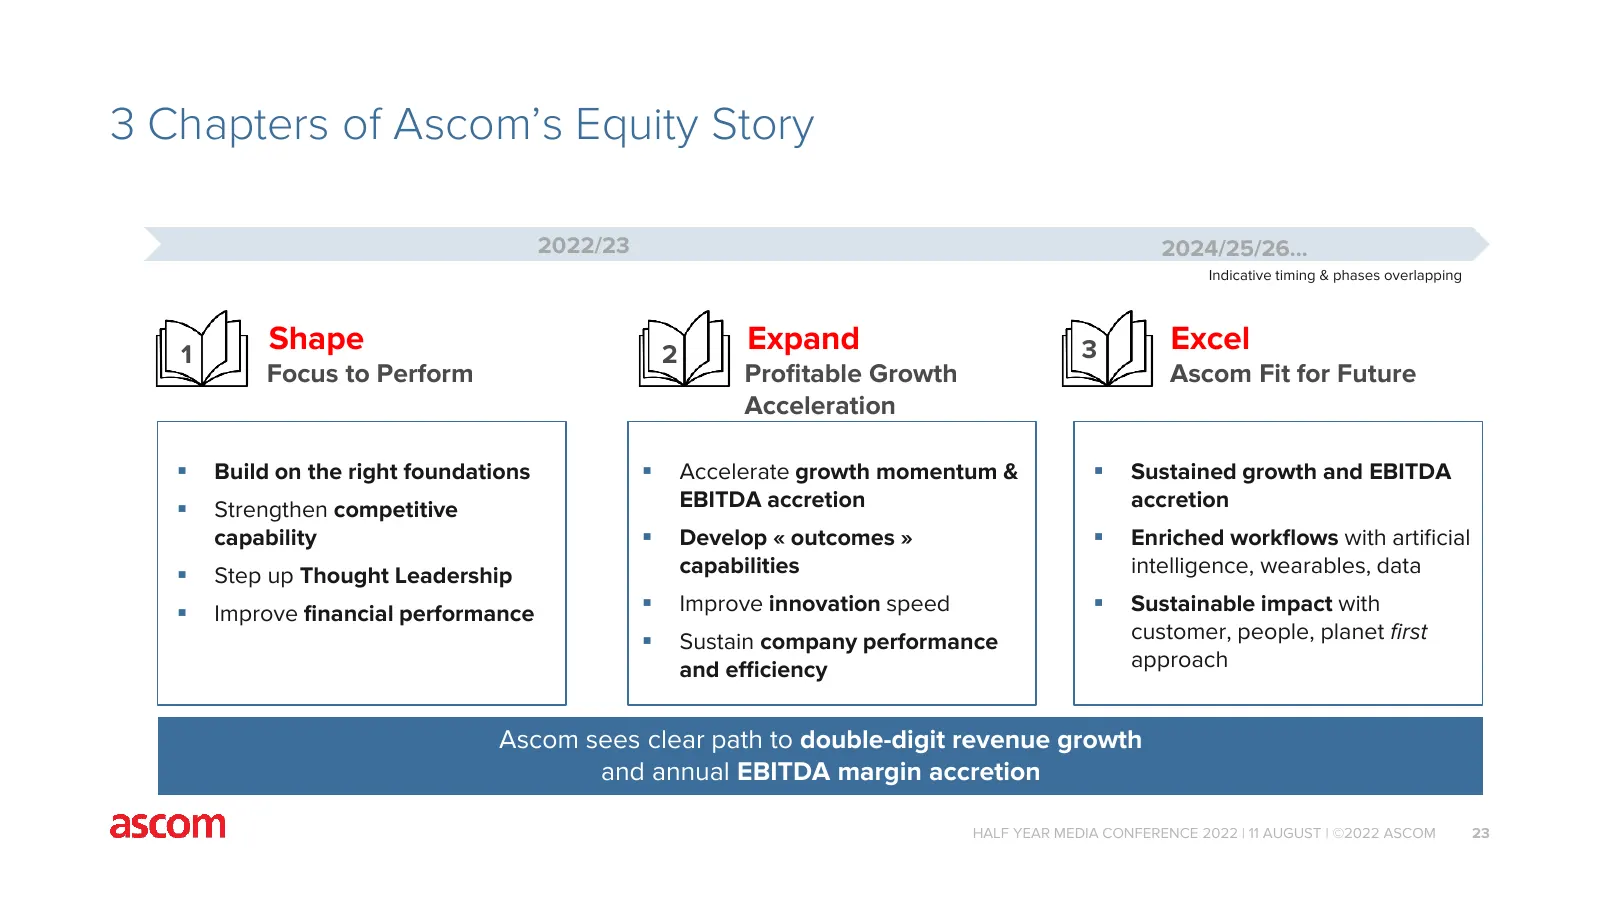
3 Chapters of Ascom’s Equity Story 2022/23 2024/25/26… Indicative timing & phases overlapping 1 Shape 2 Expand 3 Excel Focus to Perform Profitable Growth Ascom Fit for Future Acceleration Build on the right foundations Accelerate growth momentum & Sustained growth and EBITDA Strengthen compe
Slide 24: Ascom's Growth Model
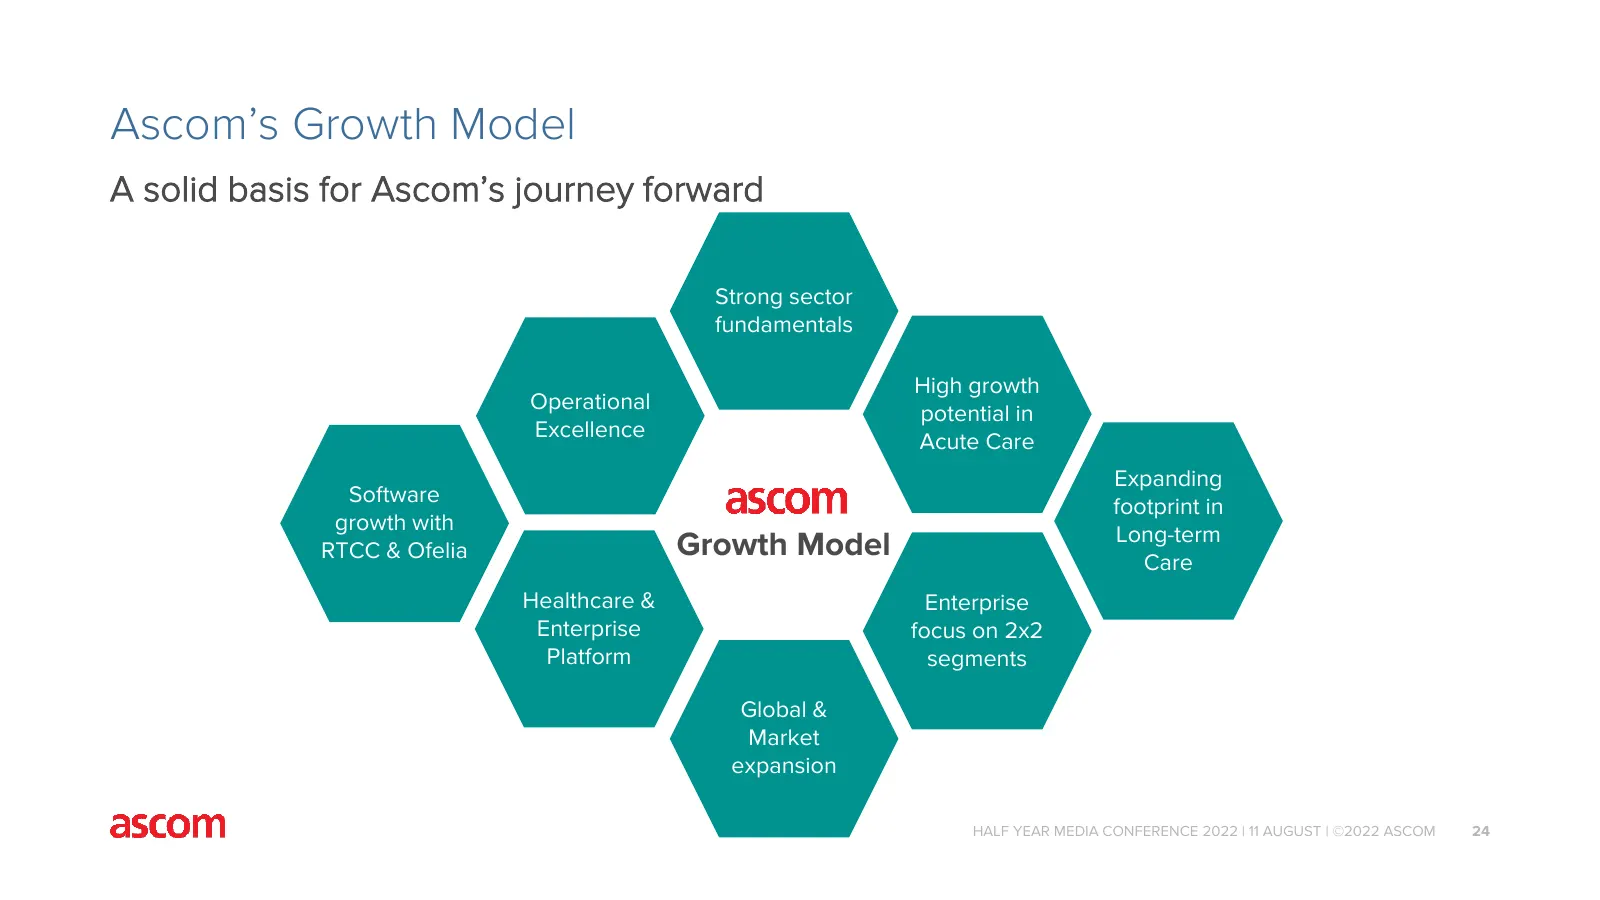
Ascom’s Growth Model A solid basis for Ascom’s journey forward Strong sector fundamentals High growth Operational potential in Excellence Acute Care Expanding Software footprint in growth with Long-term RTCC & Ofelia Growth Model Care Healthcare & Enterprise Enterprise focus on 2x2 Platform segments
Slide 25: Strong sector fundamentals
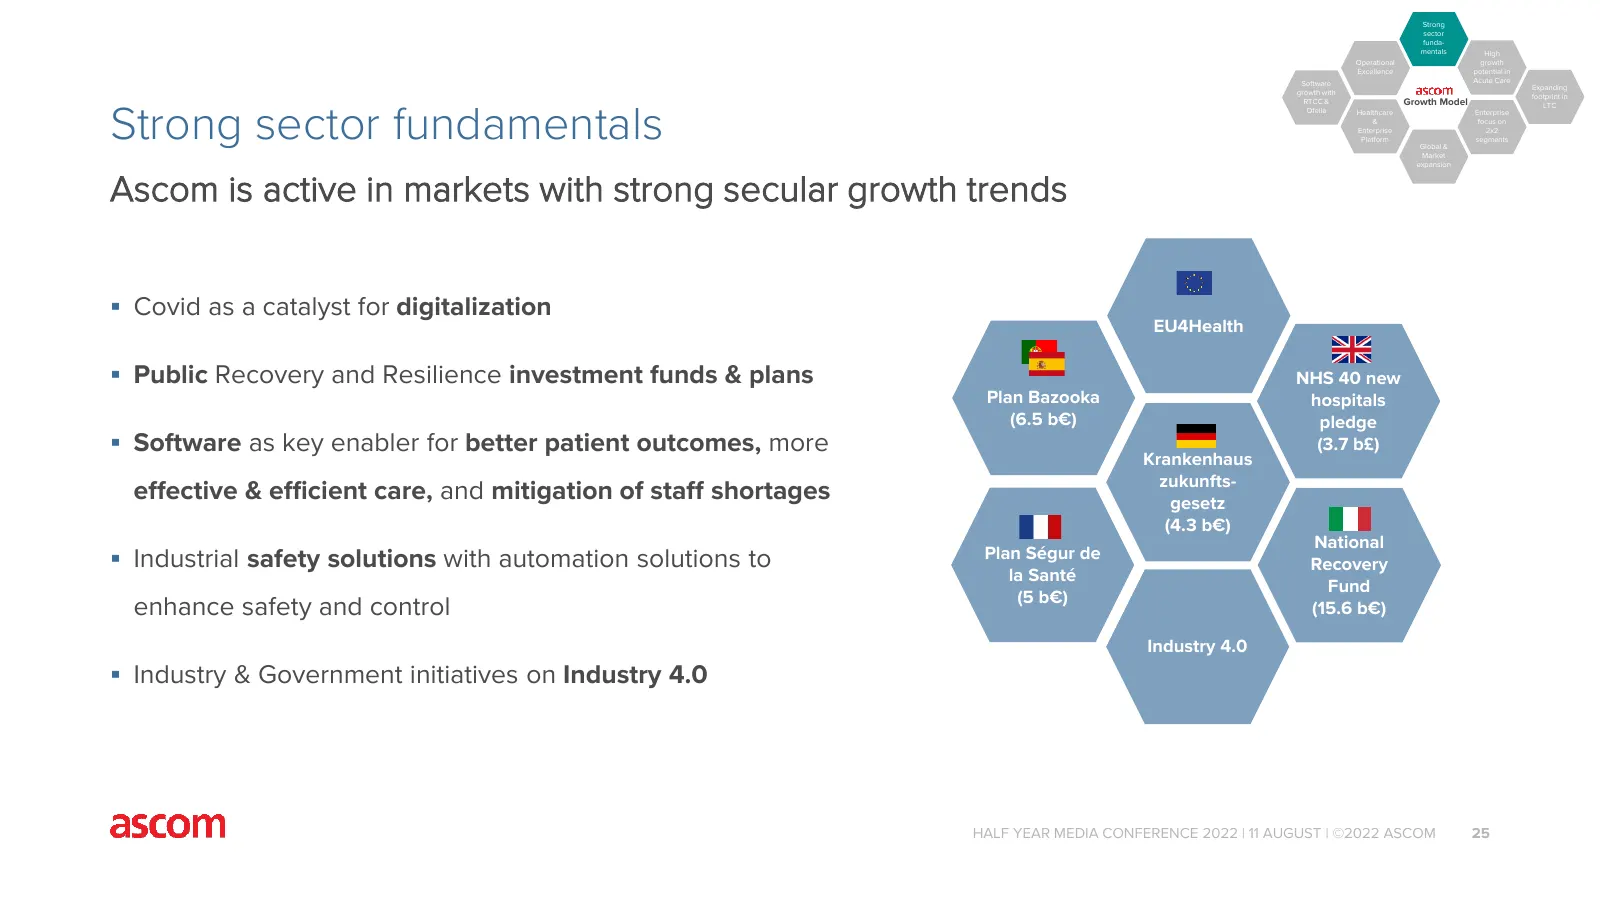
Strong sector funda- mentals High Operational growth Excellence potential in Software Acute Care Expanding growth with footprint in RTCC & Growth Model Strong sector fundamentals LTC Ofelia Healthcare Enterprise & focus on Enterprise 2x2 Platform segments Global & Market expansion Ascom is active in
Slide 26: High Growth Potential in Acute Care
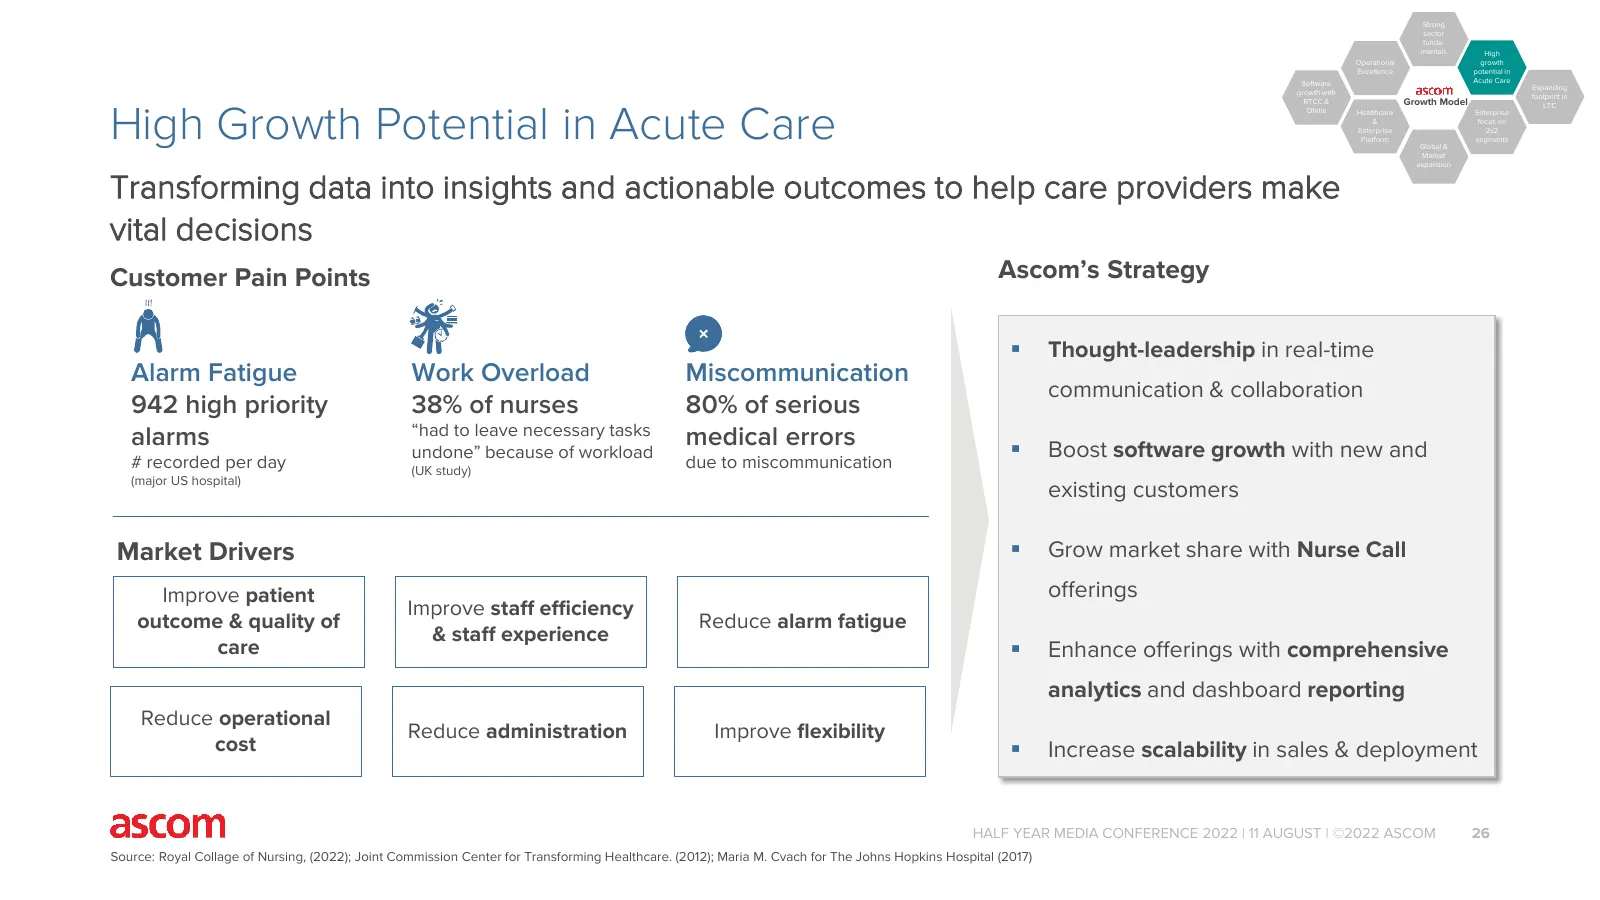
Strong sector funda- mentals High Operational growth Excellence potential in Software Acute Care Expanding growth with footprint in RTCC & Growth Model High Growth Potential in Acute Care LTC Ofelia Healthcare Enterprise & focus on Enterprise 2x2 Platform segments Global & Market expansion Transform
Slide 27: Expanding footprint in Long-term Care (LTC)
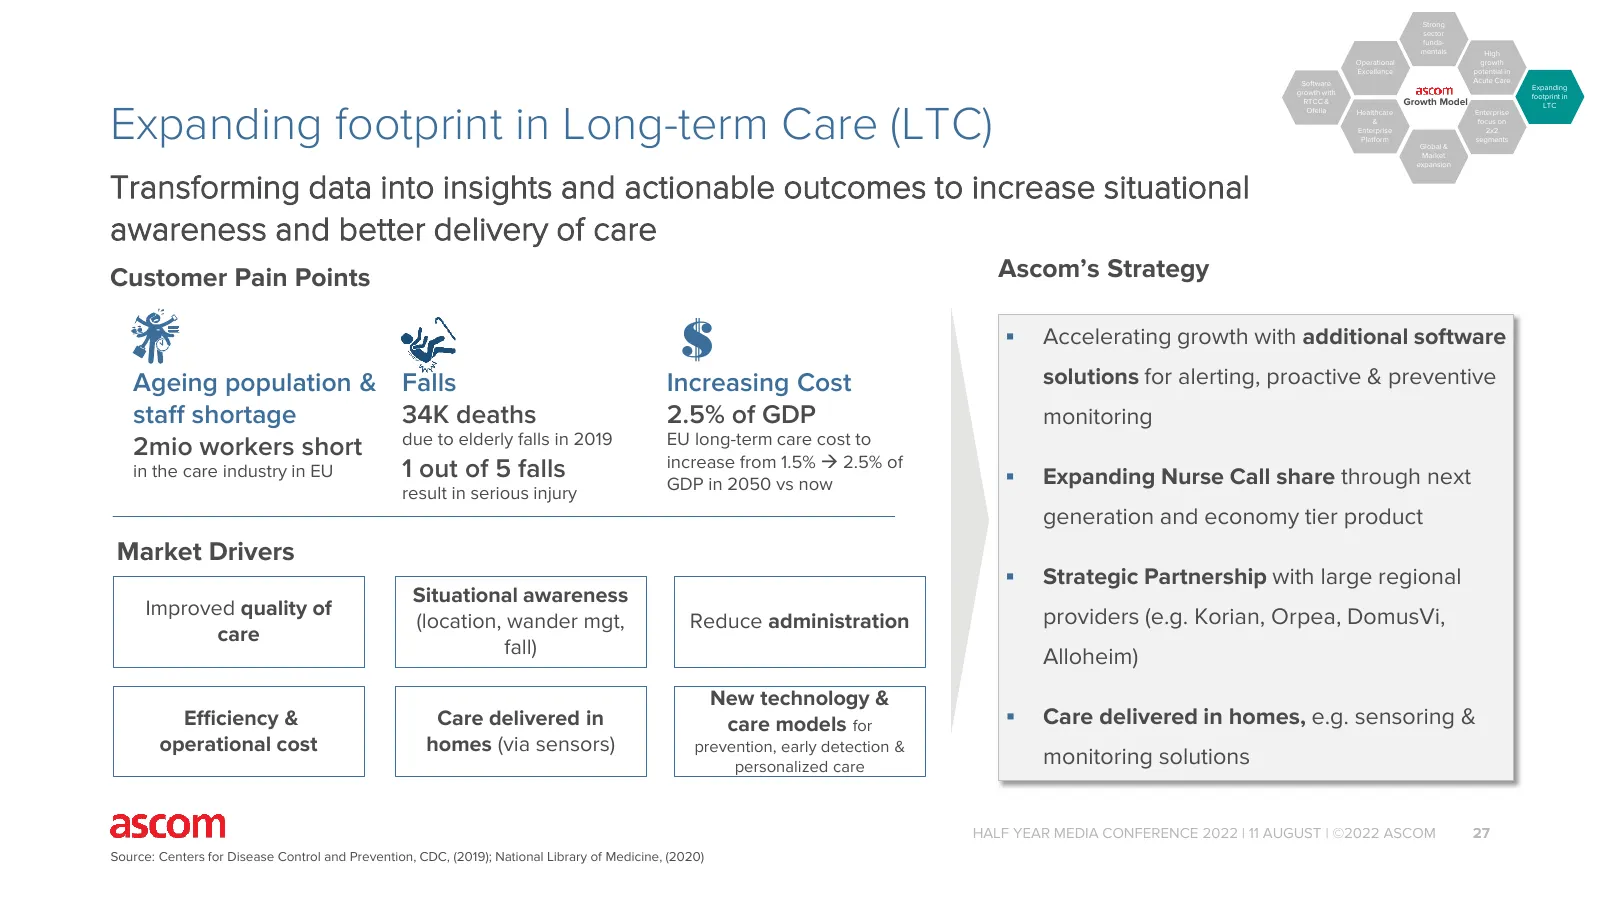
Strong sector funda- mentals High Operational growth Excellence potential in Software Acute Care Expanding growth with footprint in RTCC & Growth Model Expanding footprint in Long-term Care (LTC) LTC Ofelia Healthcare Enterprise & focus on Enterprise 2x2 Platform segments Global & Market expansion T
Slide 28: Enterprise focus on 2x2 Segments
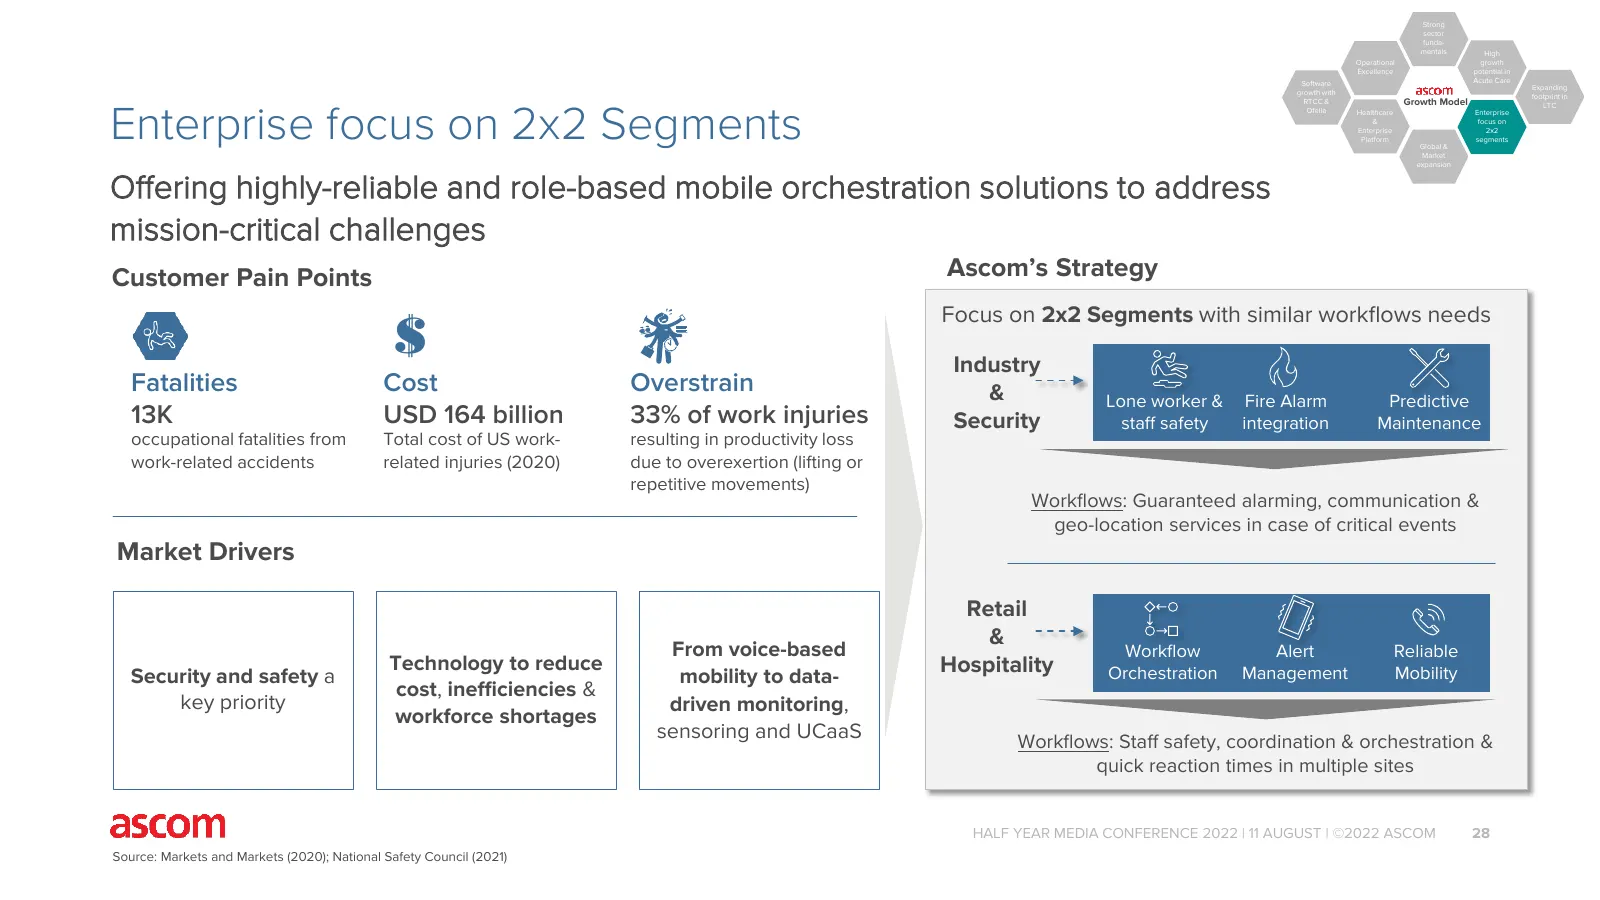
Strong sector funda- mentals High Operational growth Excellence potential in Software Acute Care Expanding growth with footprint in RTCC & Growth Model Enterprise focus on 2x2 Segments LTC Ofelia Healthcare Enterprise & focus on Enterprise 2x2 Platform segments Global & Market expansion Offering hig
Slide 29: Global & Market expansion
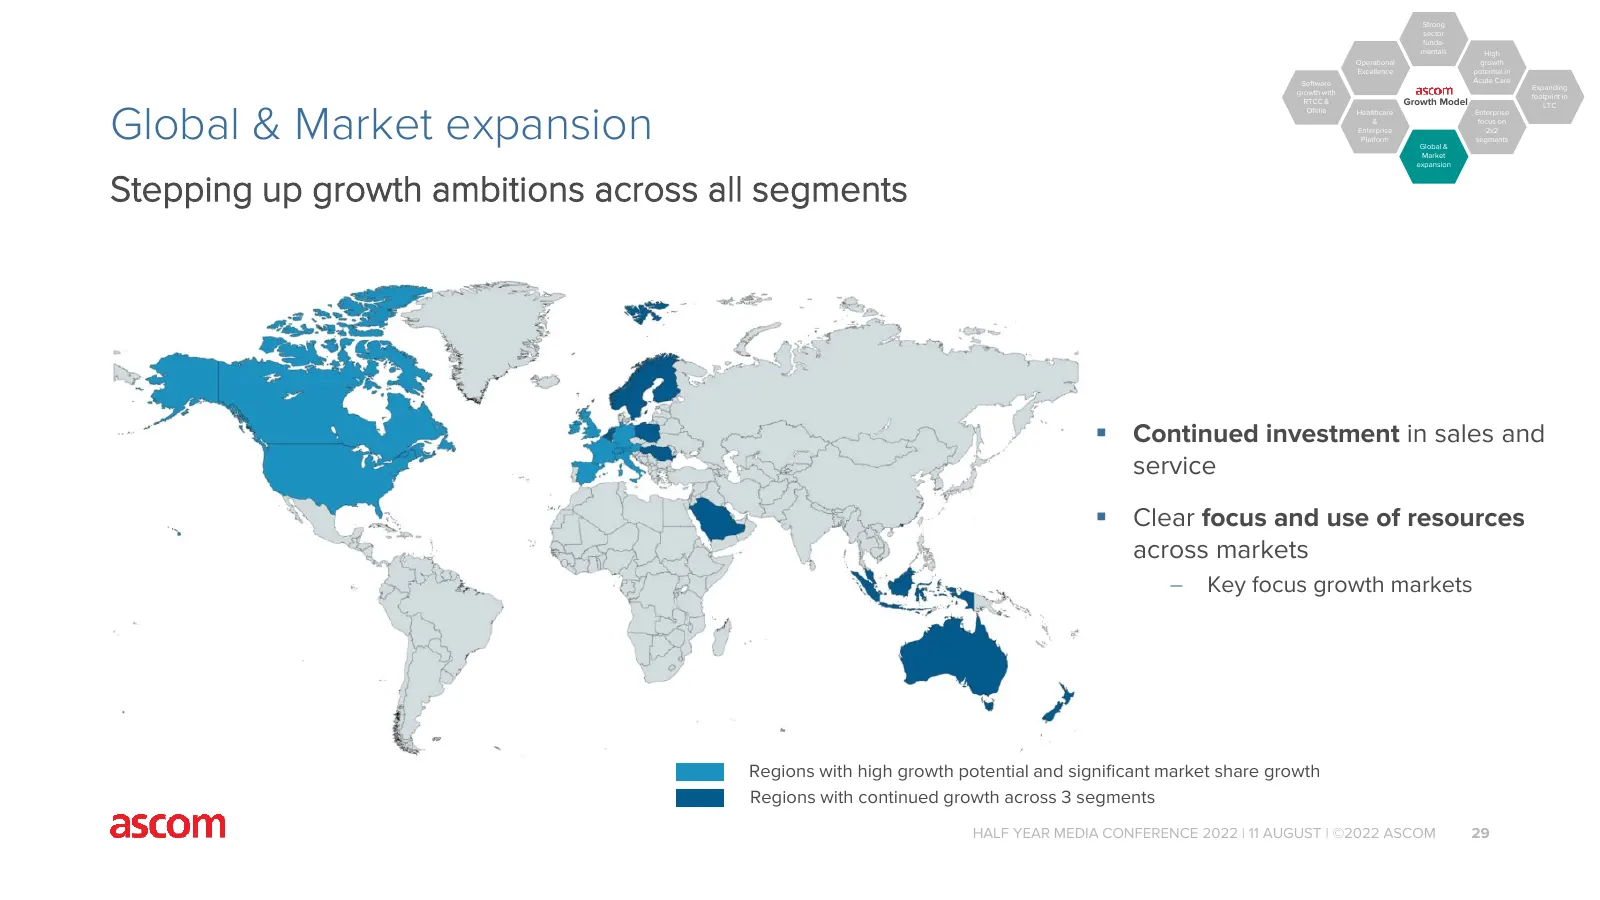
Strong sector funda- mentals High Operational growth Excellence potential in Software Acute Care Expanding growth with footprint in RTCC & Growth Model Global & Market expansion LTC Ofelia Healthcare Enterprise & focus on Enterprise 2x2 Platform segments Global & Market expansion Stepping up growth
Slide 30: Ascom Healthcare & Enterprise Platform
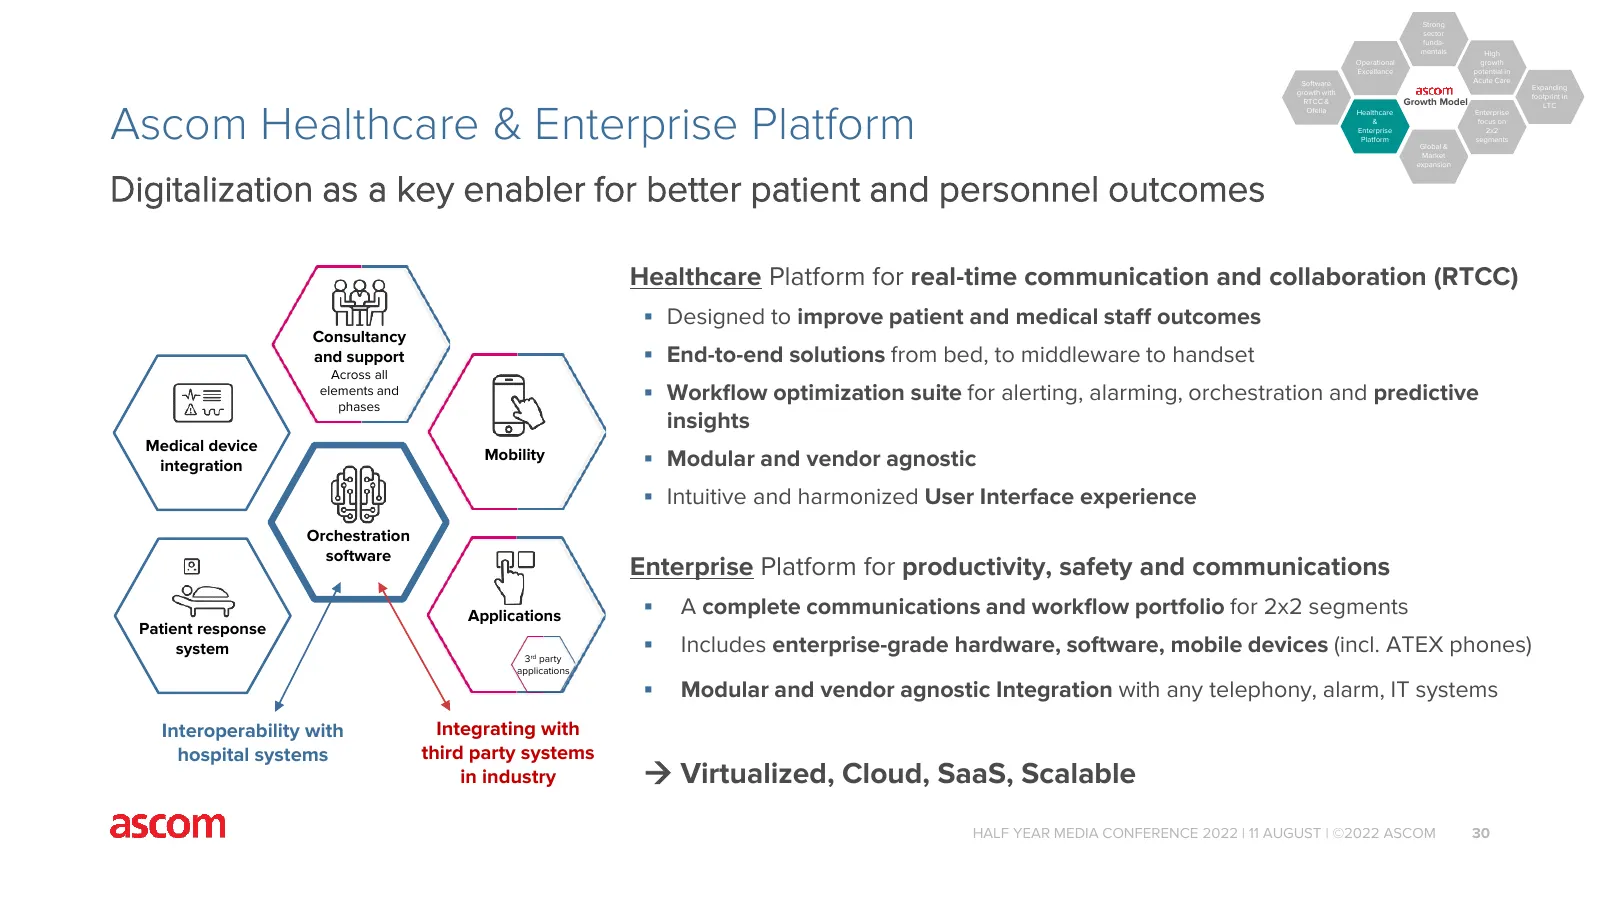
Strong sector funda- mentals High Operational growth Excellence potential in Software Acute Care Expanding growth with footprint in RTCC & Growth Model Ascom Healthcare & Enterprise Platform LTC Ofelia Healthcare Enterprise & focus on Enterprise 2x2 Platform segments Global & Market expansion Digita
Slide 31: Accelerating Software growth with RTCC and Ofelia (I)
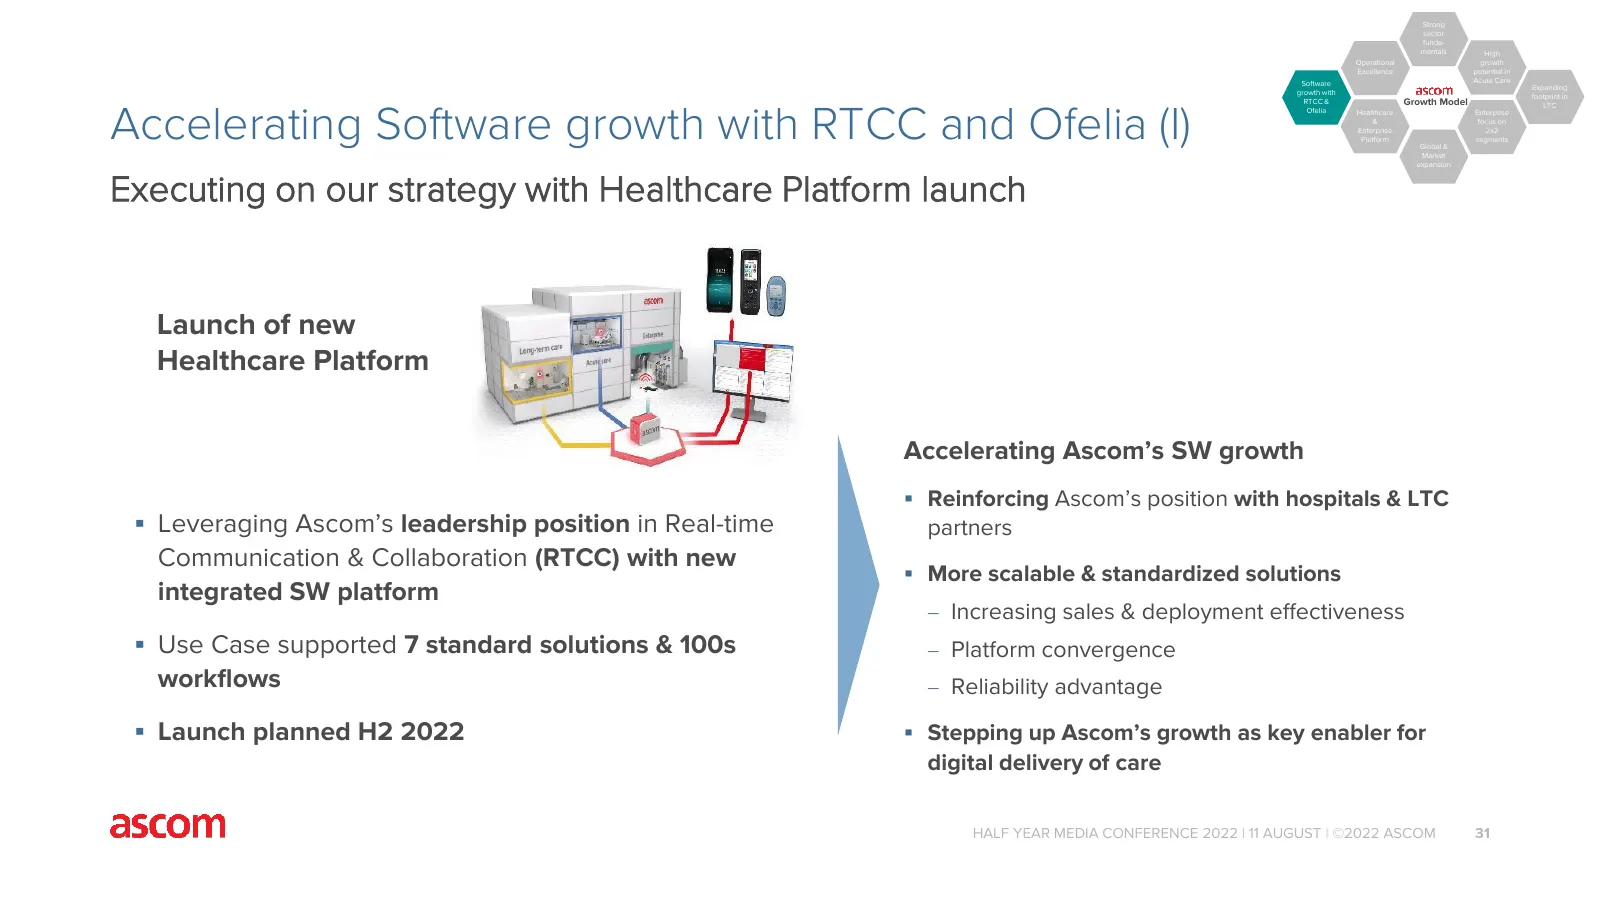
Strong sector funda- mentals High Operational growth Excellence potential in Software Acute Care Expanding growth with footprint in RTCC & Growth Model Accelerating Software growth with RTCC and Ofelia (I) LTC Ofelia Healthcare Enterprise & focus on Enterprise 2x2 Platform segments Global & Market e
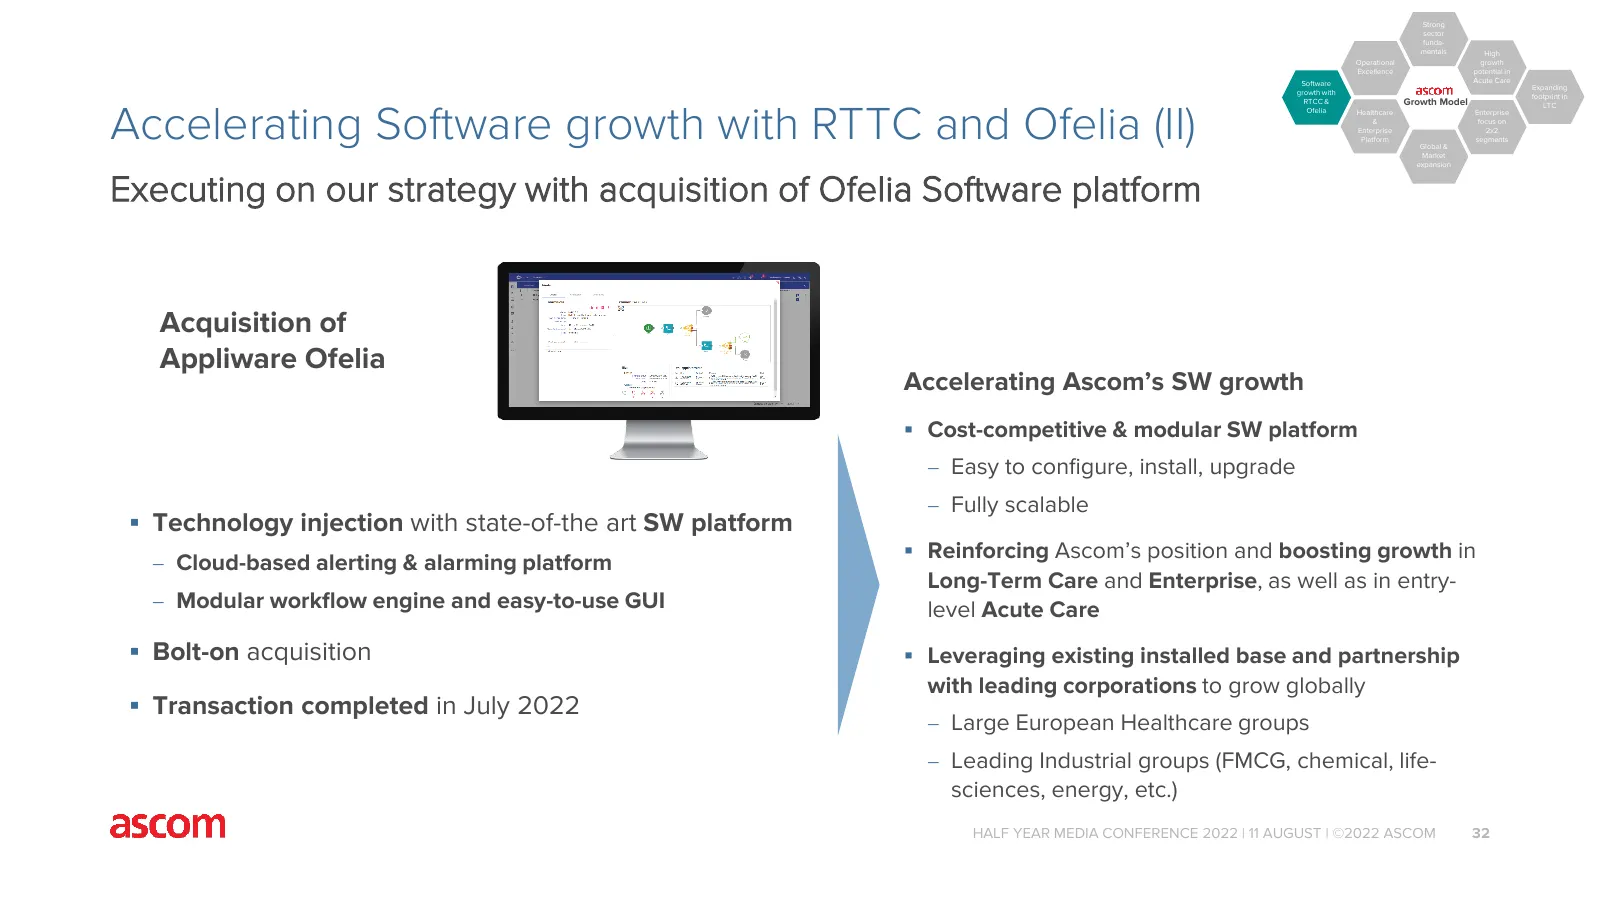
Slide 32: Accelerating Software growth with RTTC and Ofelia (II)
Strong sector funda- mentals High Operational growth Excellence potential in Software Acute Care Expanding growth with footprint in RTCC & Growth Model Accelerating Software growth with RTTC and Ofelia (II) LTC Ofelia Healthcare Enterprise & focus on Enterprise 2x2 Platform segments Global & Market
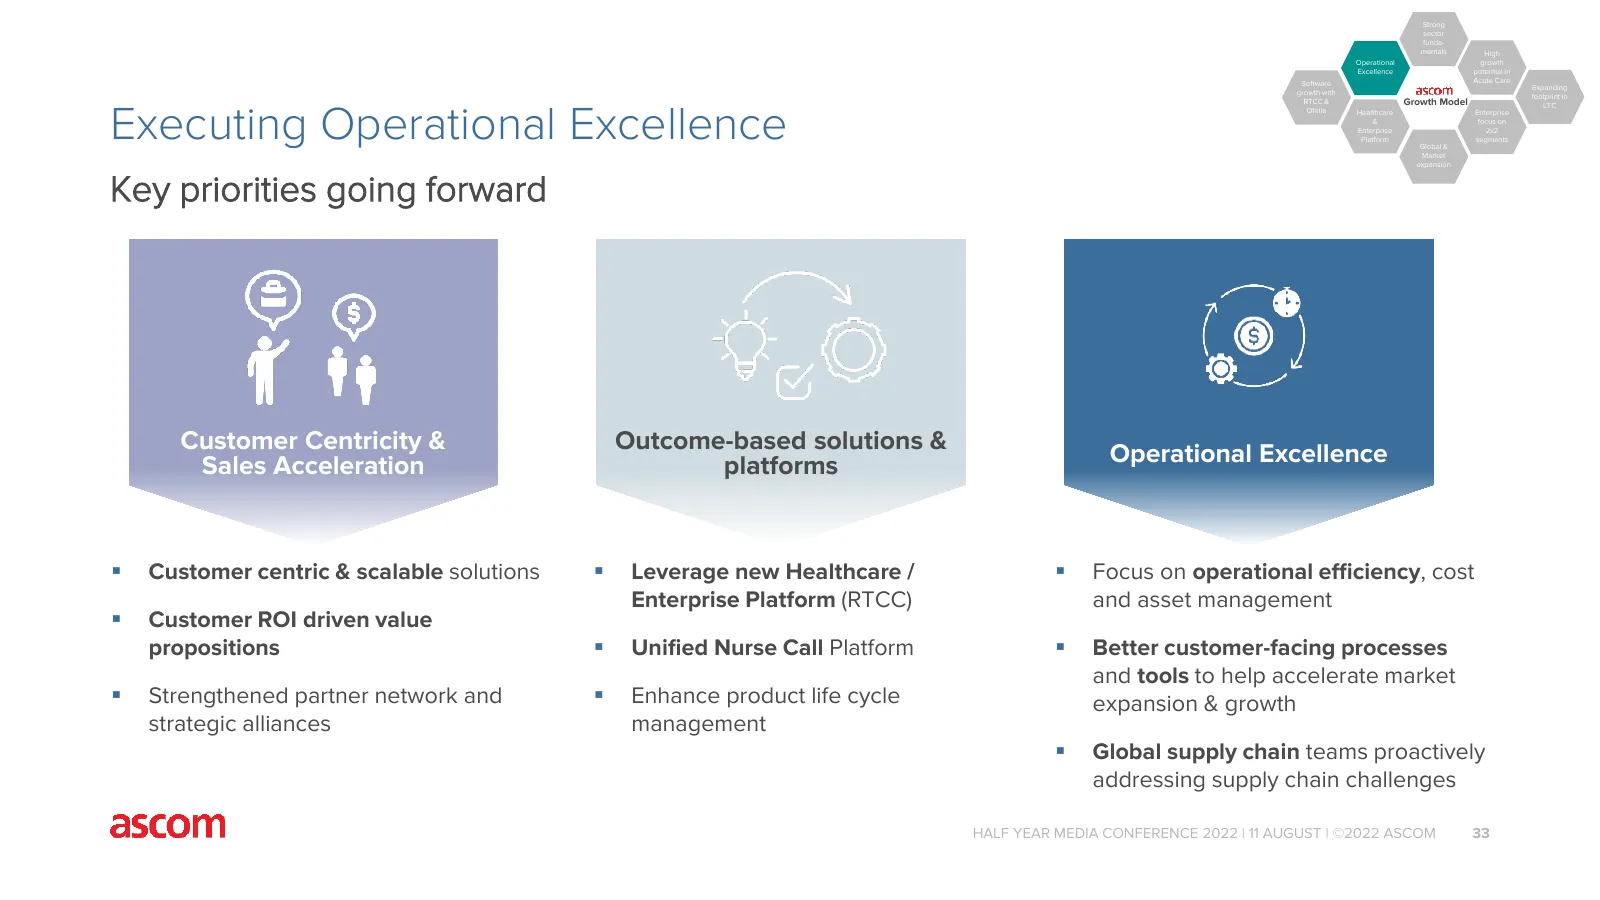
Slide 33: Executing Operational Excellence
Strong sector funda- mentals High Operational growth Excellence potential in Software Acute Care Expanding growth with footprint in RTCC & Growth Model Executing Operational Excellence LTC Ofelia Healthcare Enterprise & focus on Enterprise 2x2 Platform segments Global & Market expansion Key prioriti
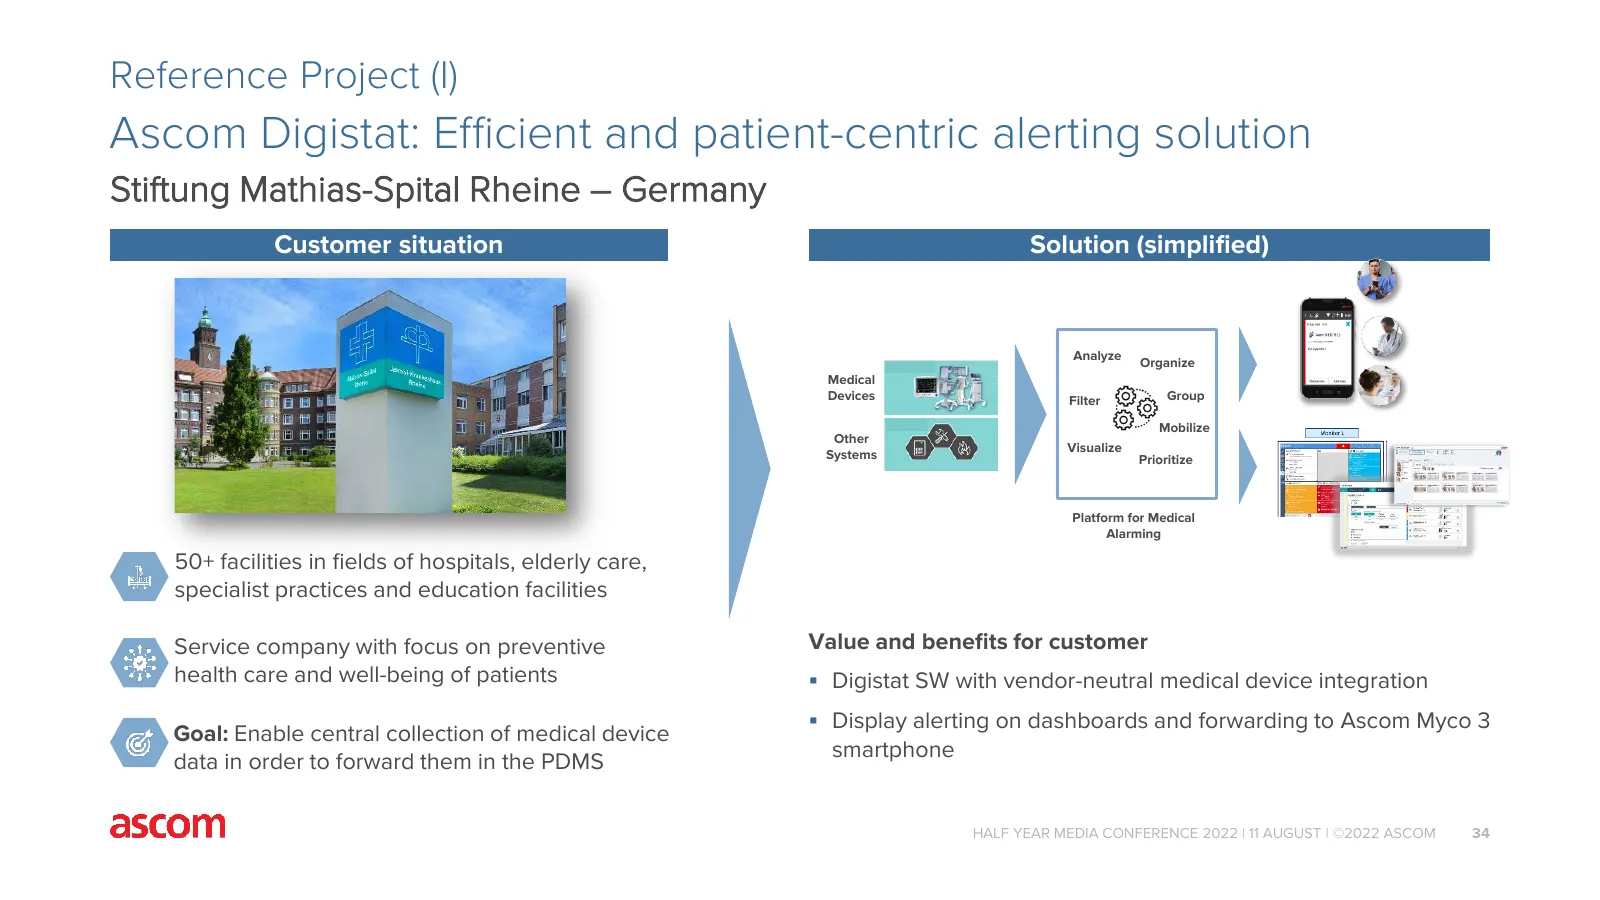
Slide 34: Ascom Digistat: Efficient and patient-centric alerting solution
Reference Project (I) Ascom Digistat: Efficient and patient-centric alerting solution Stiftung Mathias-Spital Rheine – Germany Customer situation Solution (simplified) Nurse Analyze Call Organize Medical Devices Filter Group Mobilize Other Visualize Systems Prioritize Platform for Medical Alarming 5
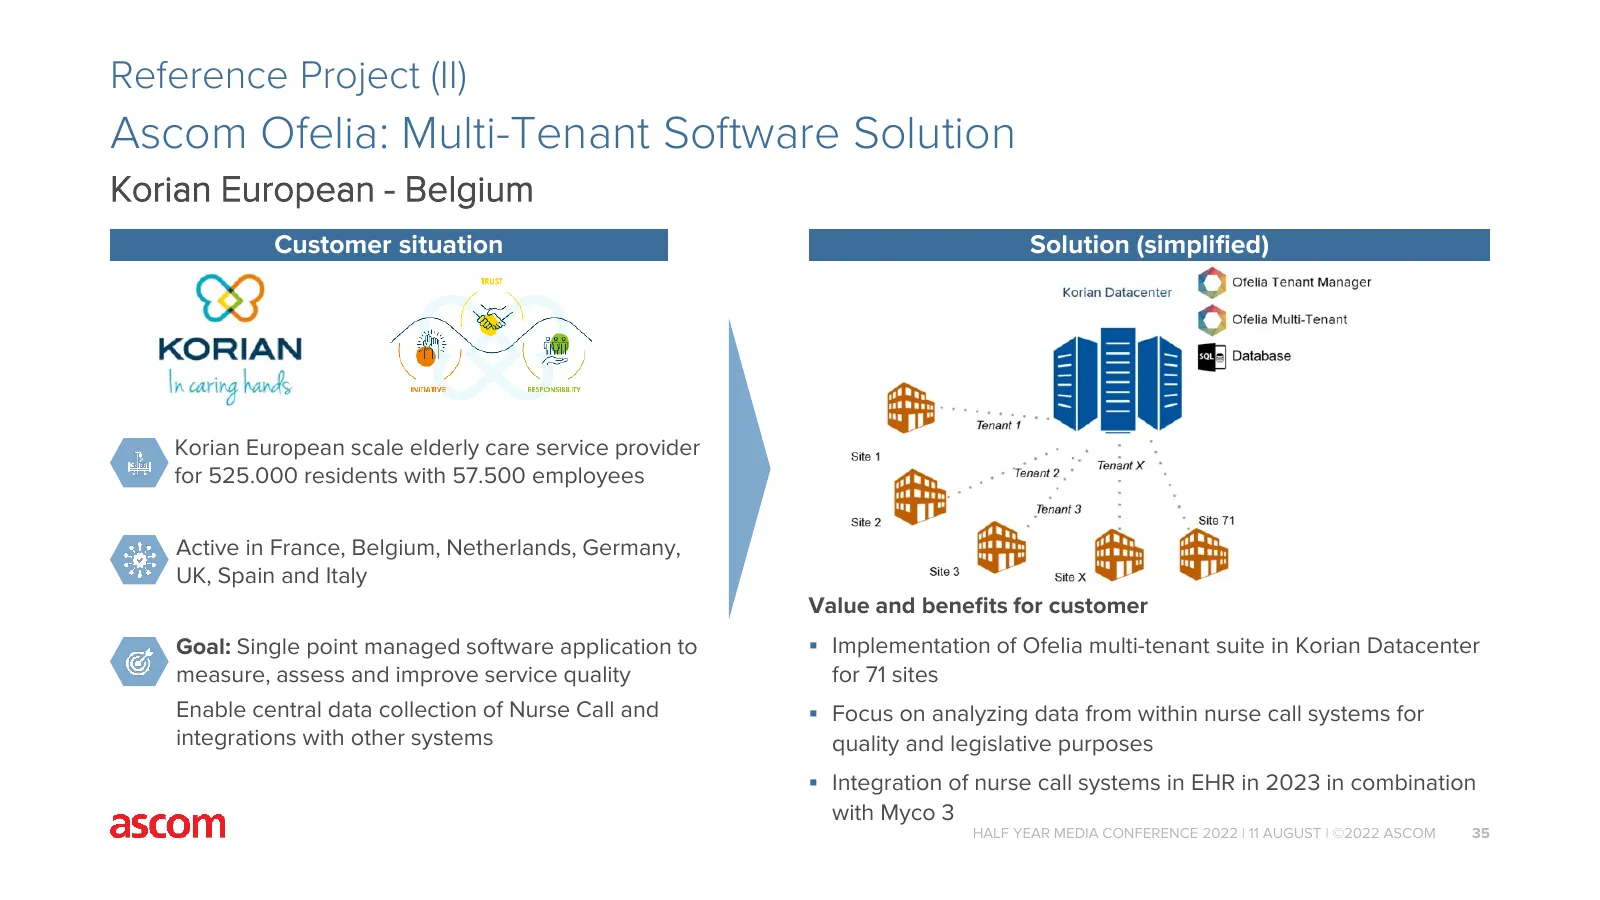
Slide 35: Ascom Ofelia: Multi-Tenant Software Solution
Reference Project (II) Ascom Ofelia: Multi-Tenant Software Solution Korian European - Belgium Customer situation Solution (simplified) Korian European scale elderly care service provider for 525.000 residents with 57.500 employees Active in France, Belgium, Netherlands, Germany, UK, Spain and Italy
Slide 36: Ascom Platform
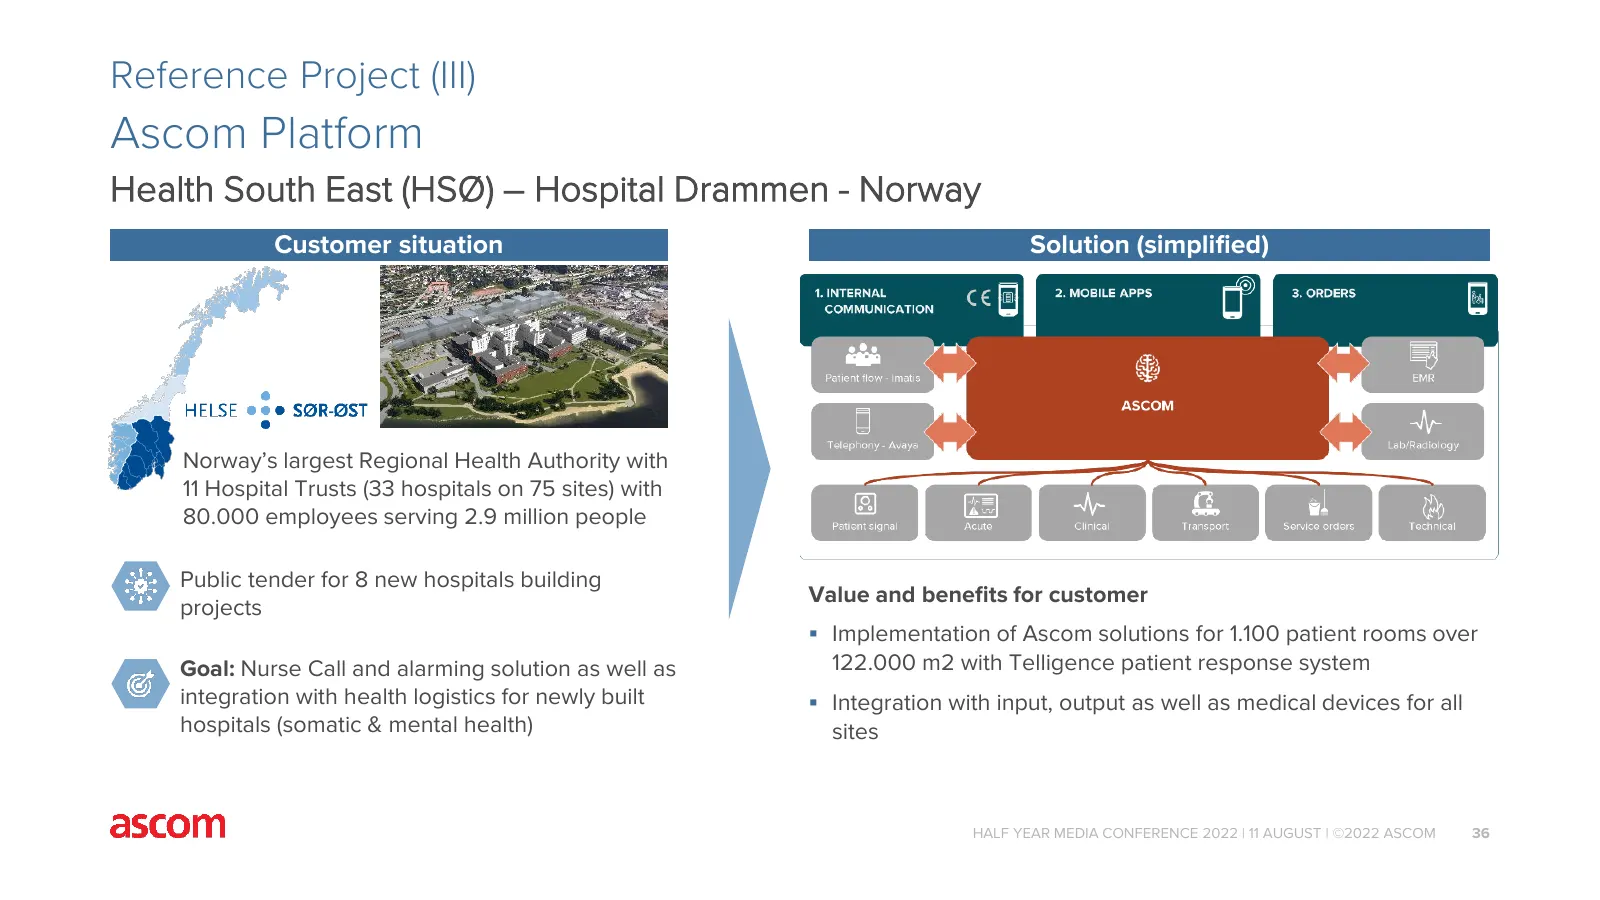
Reference Project (III) Ascom Platform Health South East (HSØ) – Hospital Drammen - Norway Customer situation Solution (simplified) Norway’s largest Regional Health Authority with 11 Hospital Trusts (33 hospitals on 75 sites) with 80.000 employees serving 2.9 million people Public tender for 8 new h

Slide 37: Outlook / Guidance
Outlook / Guidance Nicolas Vanden Abeele, CEO HALF YEAR MEDIA CONFERENCE 2022 | 11 AUGUST | ©2022 ASCOM 37

Slide 38: Guidance 2022
Guidance 2022 Ascom targets for 2022 mid- to high single digit revenue growth and EBITDA margin improvement of about 100bp (basis points)* compared to fiscal year 2021 * normalized (adjusted for one-off charges, i.e. Swedish pension fund and CEO change), at constant currencies, and based on the curr
Slide 39: Confirmation of Mid-term Guidance
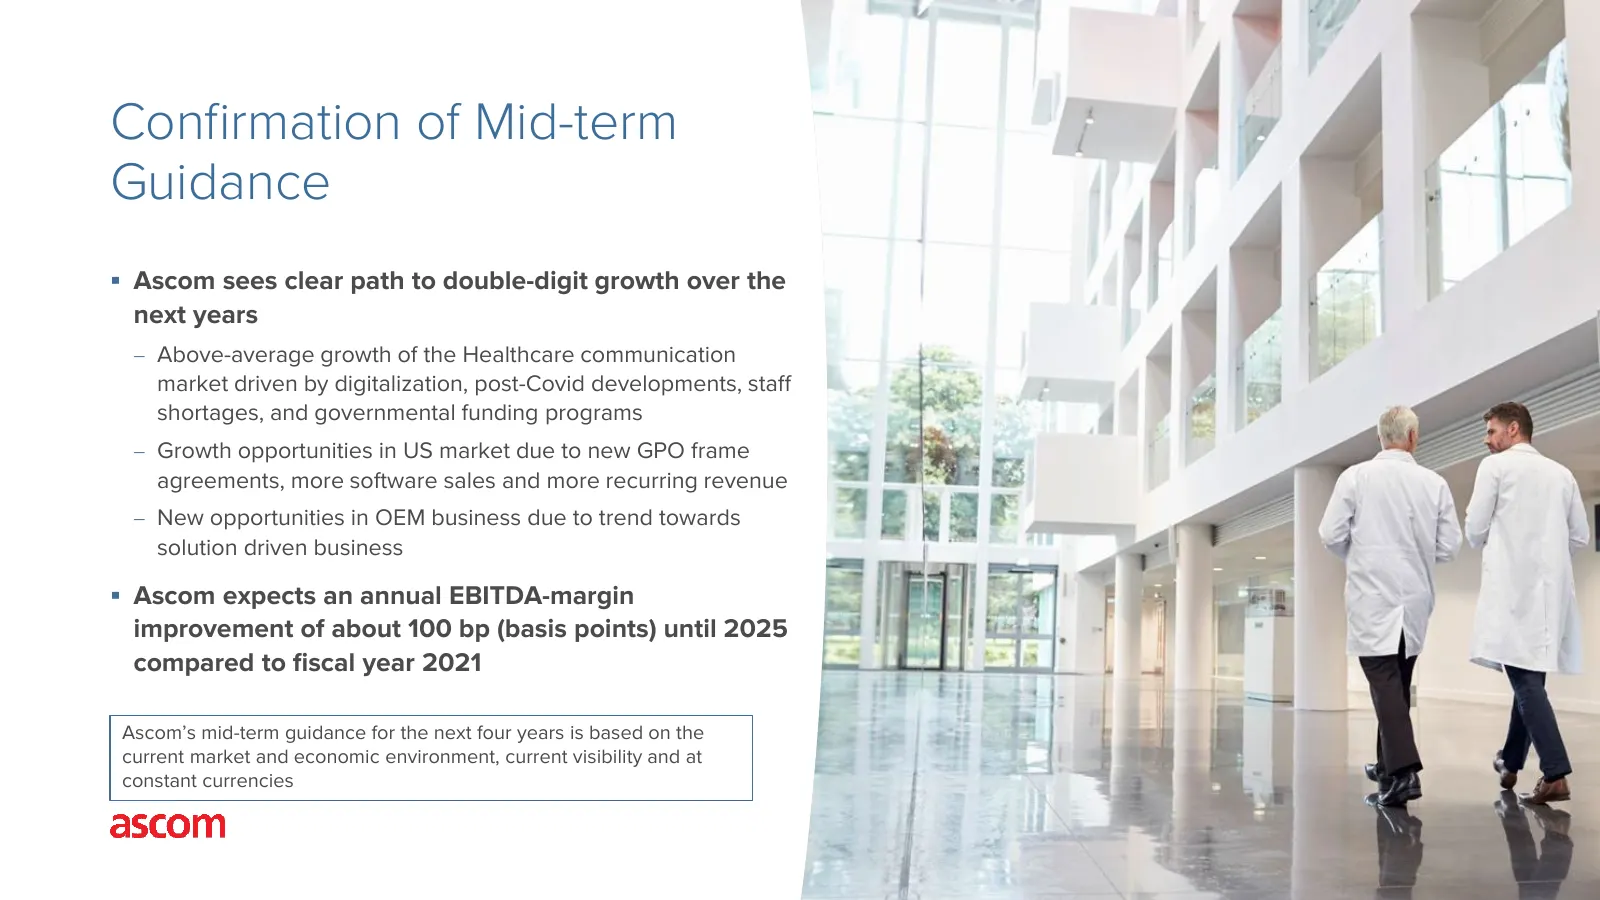
Confirmation of Mid-term Guidance Ascom sees clear path to double-digit growth over the next years − Above-average growth of the Healthcare communication market driven by digitalization, post-Covid developments, staff shortages, and governmental funding programs − Growth opportunities in US market
Slide 40: Ascom is well positioned for future growth
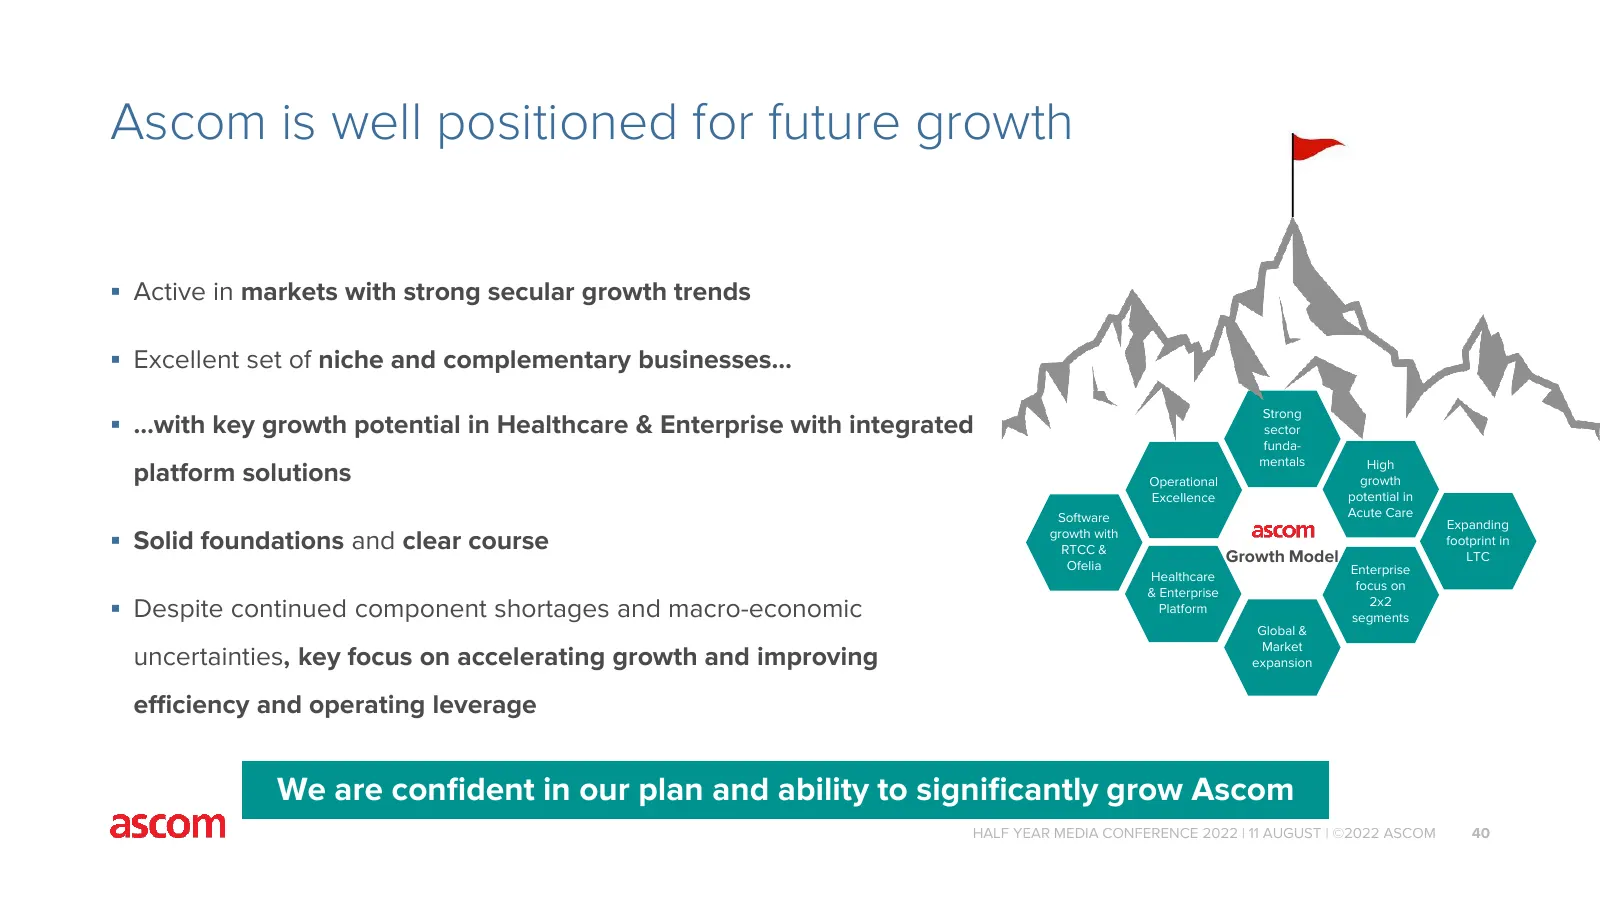
Ascom is well positioned for future growth Active in markets with strong secular growth trends Excellent set of niche and complementary businesses… Strong …with key growth potential in Healthcare & Enterprise with integrated sector funda- mentals platform solutions Operational High growth Exce

Slide 41: Q&A
Q&A HALF YEAR MEDIA CONFERENCE 2022 | 11 AUGUST | 41 ©2022 ASCOM
Slide 42: Legal Disclaimer
LEGAL DISCLAIMER This document contains specific forward-looking statements, e.g. statements including terms like “believe”, “expect” or similar expressions. Such forward-looking statements are subject to known and unknown risks, uncertainties and other factors which may result in a substantial dive
Source: Internet Archive copy of ascom.com