BMC Stock — Investor Presentation (November 2016)
35 slides from BMC Stock's investor presentation, Nov 8, 2016
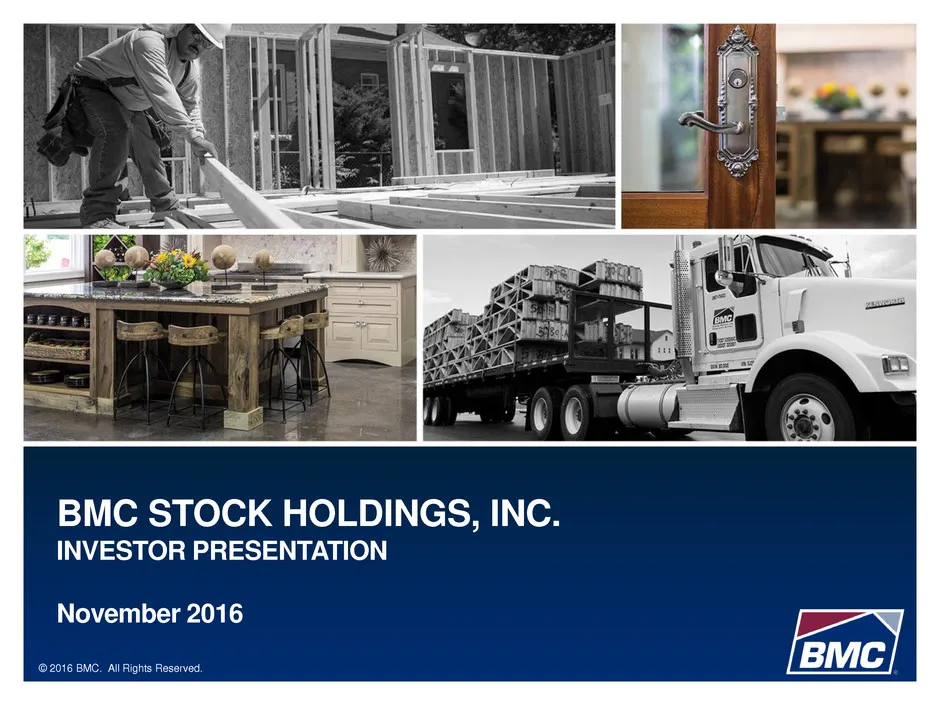
Slide 1: BMC Stock Holdings, Inc. Investor Presentation November 2016
© 2016 BMC. All Rights Reserved. BMC STOCK HOLDINGS, INC. INVESTOR PRESENTATION November 2016
Slide 2: Forward-Looking Statements
CLICK TO EDIT TITLEDISCLAIMER 2 Forward-Looking Statements This document contains "forward-looking statements" within the meaning of the Private Securities Litigation Reform Act of 1995. Forward-looking statements in this document may include, without limitation, statements regarding sales growth, p
Slide 3: Non-GAAP (Adjusted) Financial Measures
CLICK TO EDIT TITLENON-GAAP (ADJUSTED) FINANCIAL MEASURES 3 Adjusted net sales, Adjusted gross profit, Adjusted EBITDA and Adjusted net income are intended as supplemental measures of the Company’s performance that are not required by, or presented in accordance with, GAAP. The Company believes that
Slide 4: Company Overview
© 2016 BMC. All Rights Reserved. COMPANY OVERVIEW1
Slide 5: BMC Company Snapshot
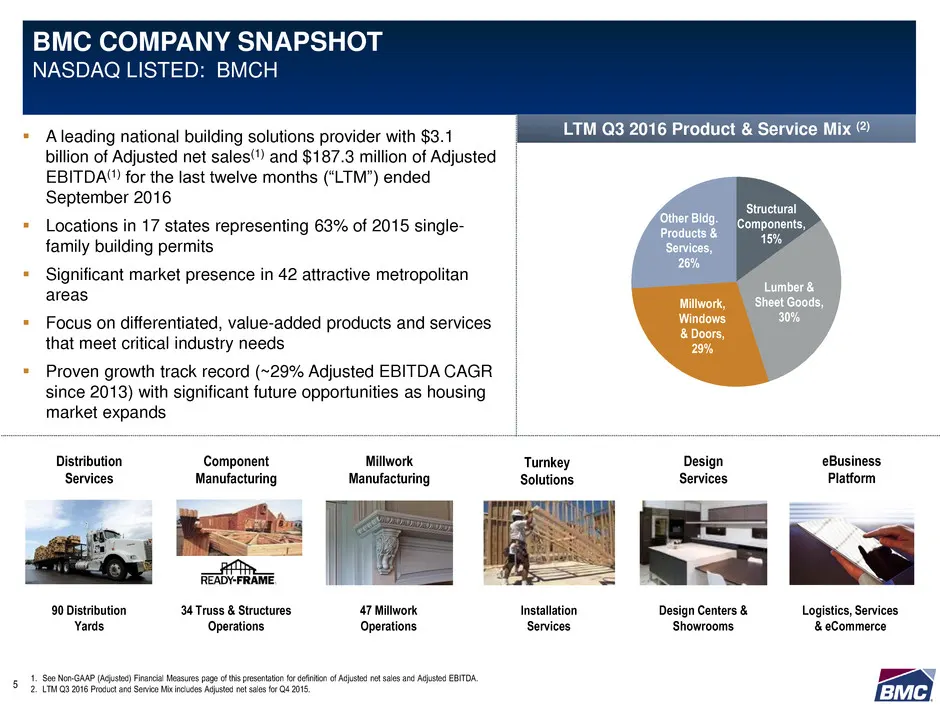
CLICK TO EDIT TITLEBMC COMPANY SNAPSHOT NASDAQ LISTED: BMCH 5 LTM Q3 2016 Product & Service Mix (2) A leading national building solutions provider with $3.1 billion of Adjusted net sales(1) and $187.3 million of Adjusted EBITDA(1) for the last twelve months (“LTM”) ended September 2016 Locations
Slide 6: A Market Leader with National Scale and Local Expertise in a Highly Fragmented Industry
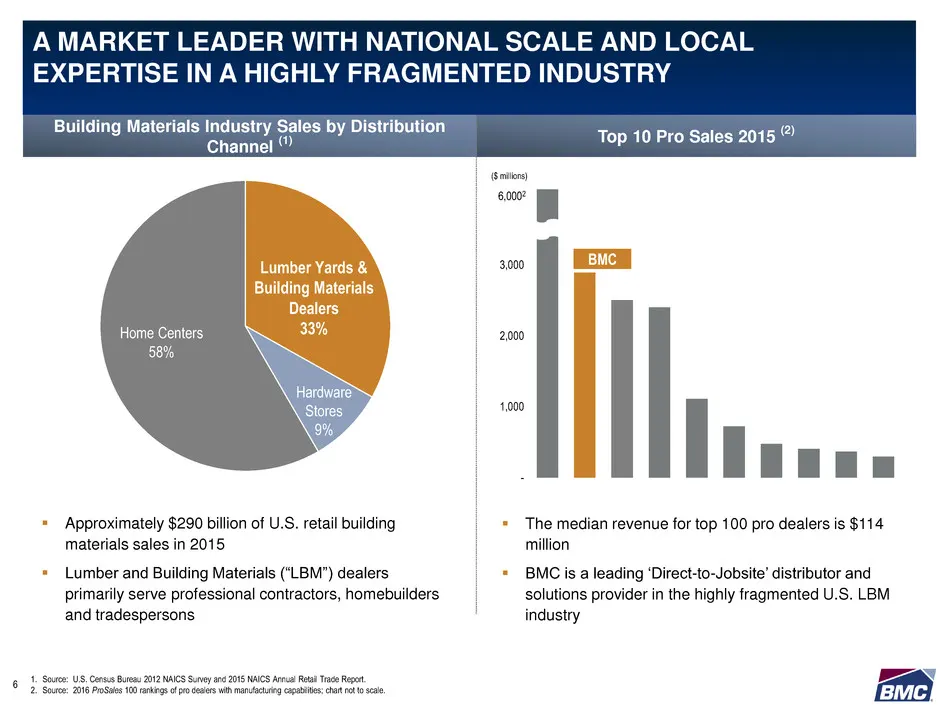
CLICK TO EDIT TITLE - 1,000 2,000 3,000 4,000 A MARKET LEADER WITH NATIONAL SCALE AND LOCAL EXPERTISE IN A HIGHLY FRAGMENTED INDUSTRY 6 Lumber Yards & Building Materials Dealers 33%Home Centers 58% Hardware Stores 9% ($ millions) BMC Top 10 Pro Sales 2015 (2)Building Materials Industry Sales by Dist
Slide 7: Strategic Footprint in Highly Attractive, Long-Term Growth Markets
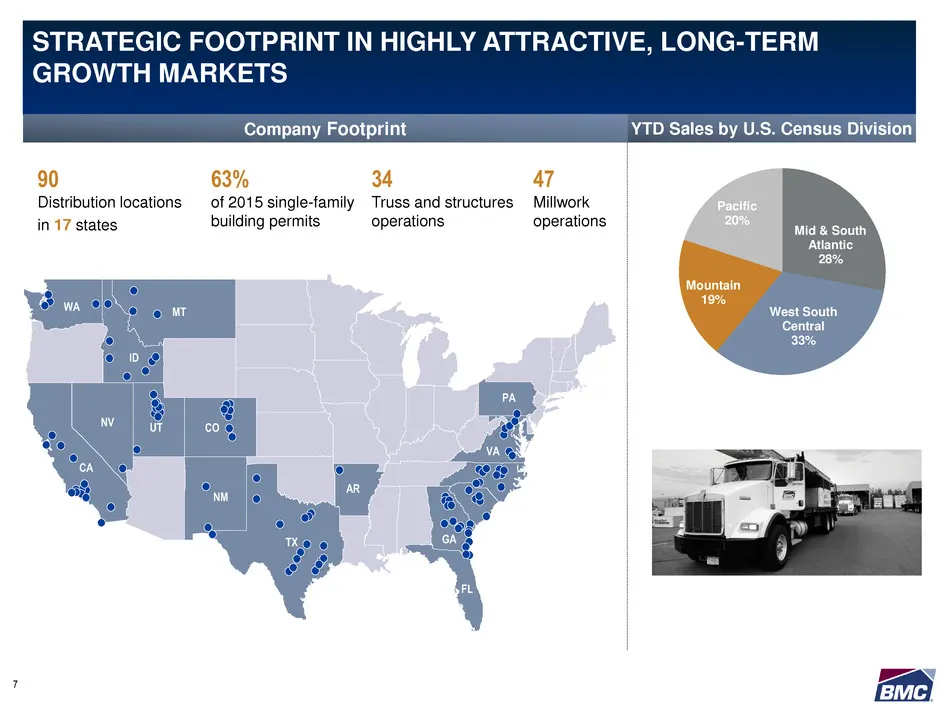
CLICK TO EDIT TITLESTRATEGIC FOOTPRINT IN HIGHLY ATTRACTIVE, LONG-TERM GROWTH MARKETS 7 Mid & South Atlantic 28% West South Central 33% Mountain 19% Pacific 20% YTD Sales by U.S. Census DivisionCompany Footprint FL NM TX MT COUT ID NV WA CA PA VA AR GA 90 Distribution locations in 17 states 34 Truss
Slide 8: Extensive Product and Service Offering
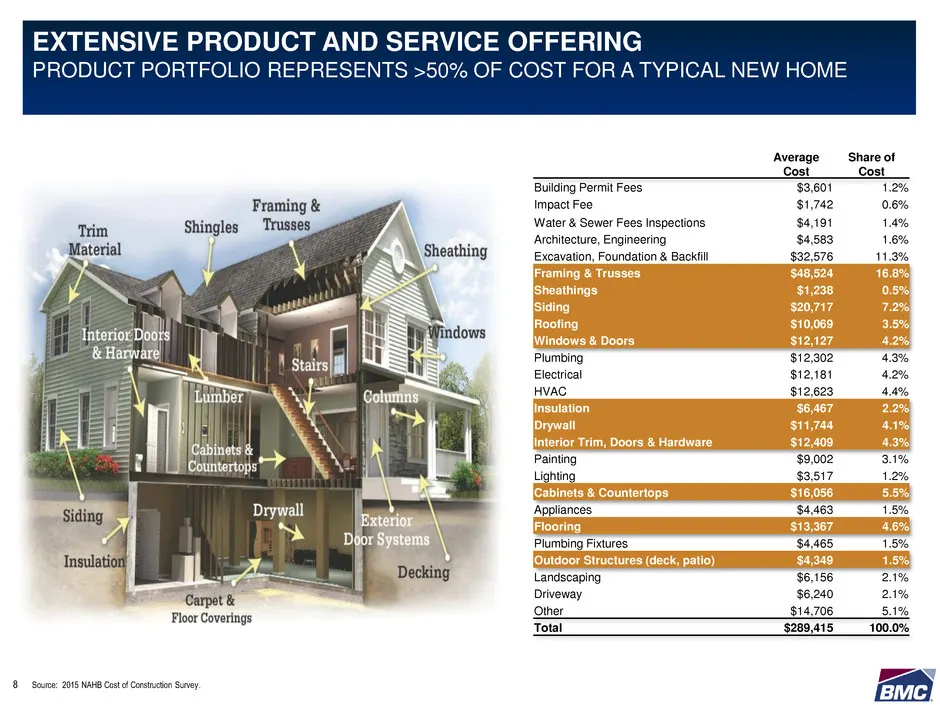
CLICK TO EDIT TITLE Average Cost Share of Cost Building Permit Fees $3,601 1.2% Impact Fee $1,742 0.6% Water & Sewer Fees Inspections $4,191 1.4% Architecture, Engineering $4,583 1.6% Excavation, Foundation & Backfill $32,576 11.3% Framing & Trusses $48,524 16.8% Sheathings $1,238 0.5% Siding $20,71
Slide 9: Value-Added Services Support Job Site Excellence
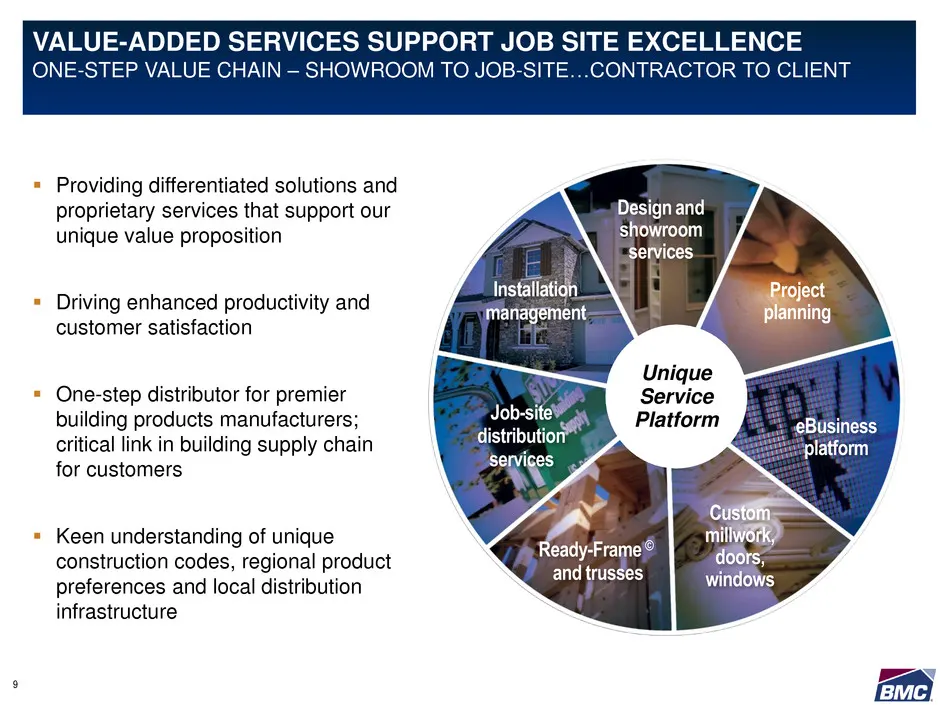
CLICK TO EDIT TITLEVALUE-ADDED SERVICES SUPPORT JOB SITE EXCELLENCE ONE-STEP VALUE CHAIN – SHOWROOM TO JOB-SITE…CONTRACTOR TO CLIENT 9 Providing differentiated solutions and proprietary services that support our unique value proposition Driving enhanced productivity and customer satisfaction O
Slide 10: Highly Diversified and Growing Customer Base
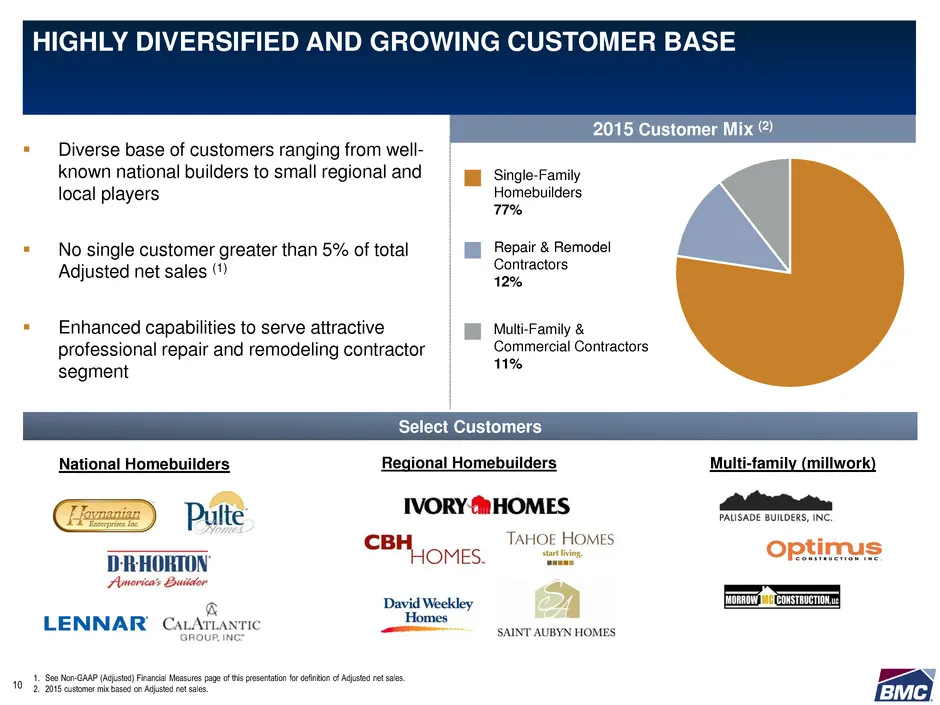
CLICK TO EDIT TITLE Diverse base of customers ranging from well- known national builders to small regional and local players No single customer greater than 5% of total Adjusted net sales (1) Enhanced capabilities to serve attractive professional repair and remodeling contractor segment Select
Slide 11: Strategic Go-to-Market Options for Suppliers
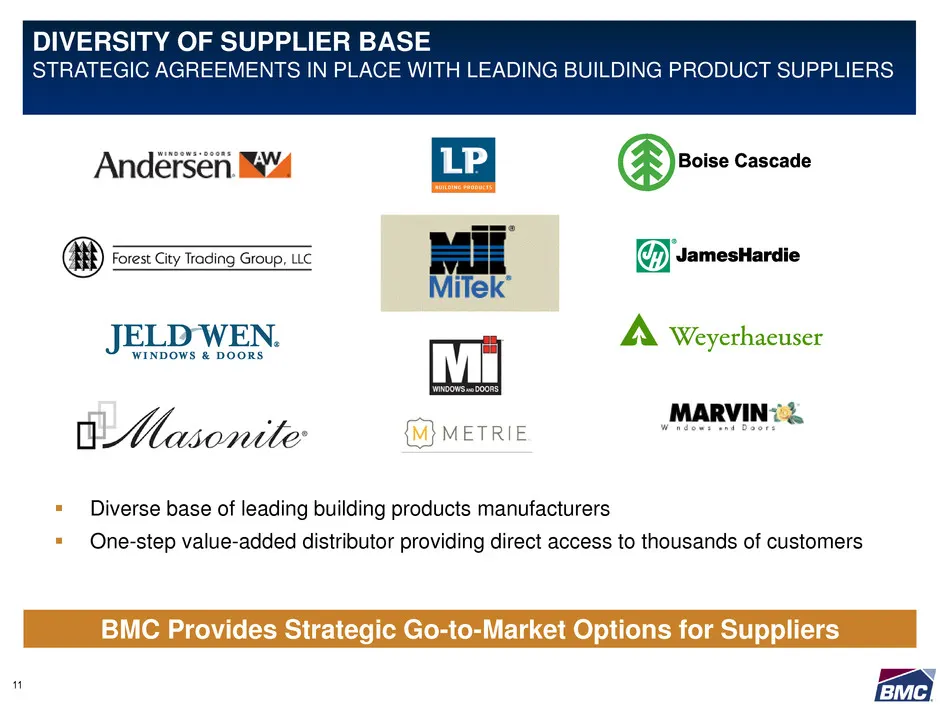
CLICK TO EDIT TITLE BMC Provides Strategic Go-to-Market Options for Suppliers Diverse base of leading building products manufacturers One-step value-added distributor providing direct access to thousands of customers DIVERSITY OF SUPPLIER BASE STRATEGIC AGREEMENTS IN PLACE WITH LEADING BUILDING
Slide 12: Merger Integration and Synergies
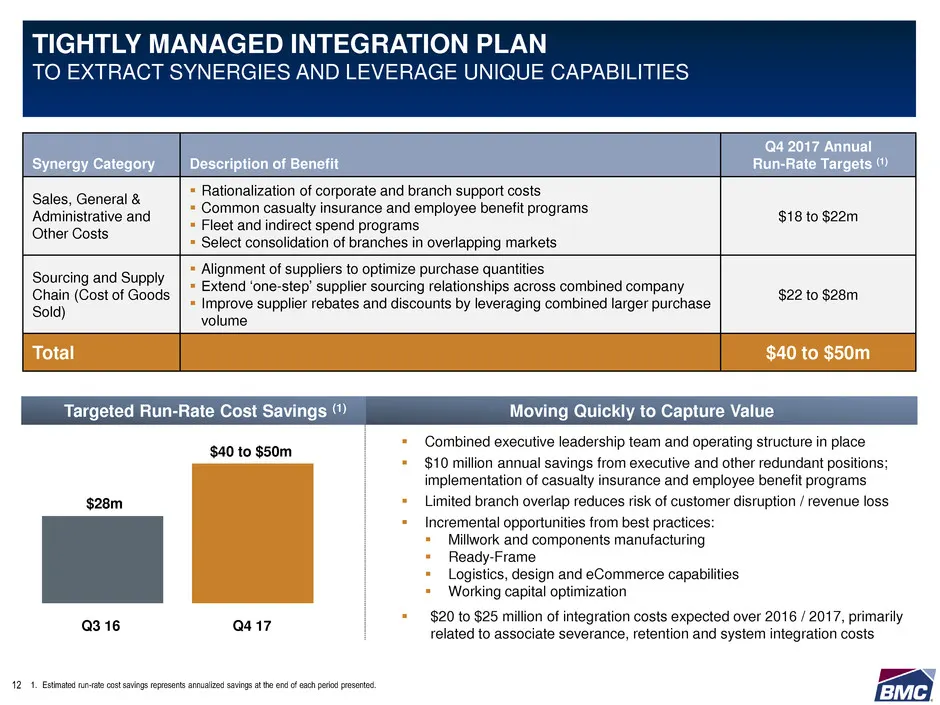
CLICK TO EDIT TITLE Combined executive leadership team and operating structure in place $10 million annual savings from executive and other redundant positions; implementation of casualty insurance and employee benefit programs Limited branch overlap reduces risk of customer disruption / reven
Slide 13: Focused Growth Strategy
© 2016 BMC. All Rights Reserved. FOCUSED GROWTH STRATEGY2
Slide 14: Leveraging Strong Foundation and Core Capabilities to Accelerate Profitable Growth
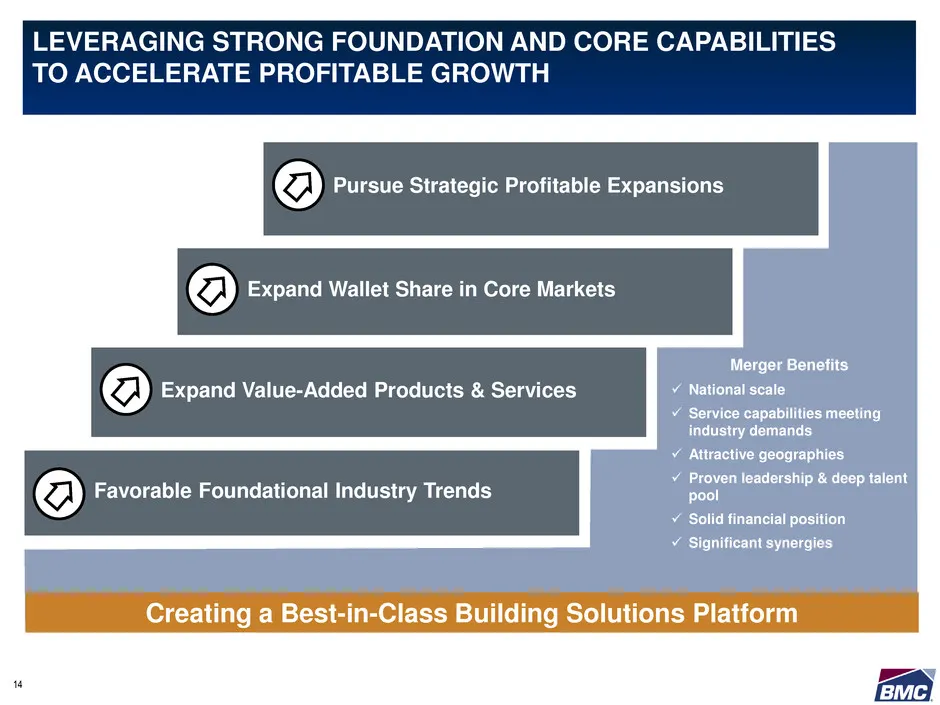
CLICK TO EDIT TITLE Favorable Foundational Industry Trends Expand Value-Added Products & Services Expand Wallet Share in Core Markets Pursue Strategic Profitable Expansions Merger Benefits National scale Service capabilities meeting industry demands Attractive geographies Proven leadership &
Slide 15: Benefitting from Favorable Industry Trends
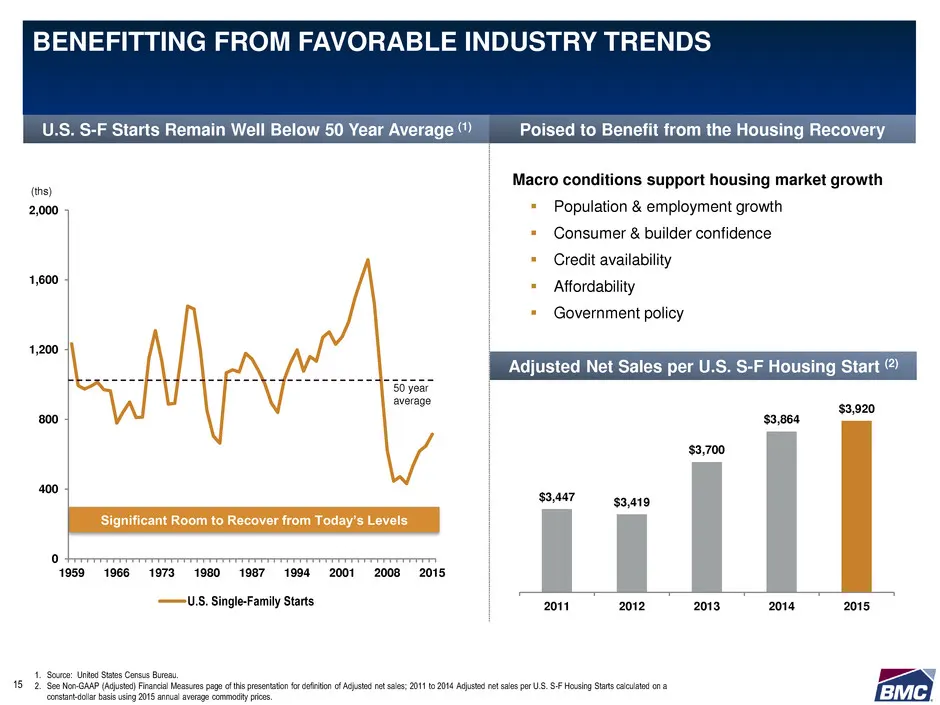
CLICK TO EDIT TITLE 0 400 800 1,200 1,600 2,000 1959 1966 1973 1980 1987 1994 2001 2008 2015 U.S. Single-Family Starts Significant Room to Recover from Today’s Levels (ths) U.S. S-F Starts Remain Well Below 50 Year Average (1) Poised to Benefit from the Housing Recovery Adjusted Net Sales per U.S. S
Slide 16: Product Categories: Structural Components, Lumber, Millwork
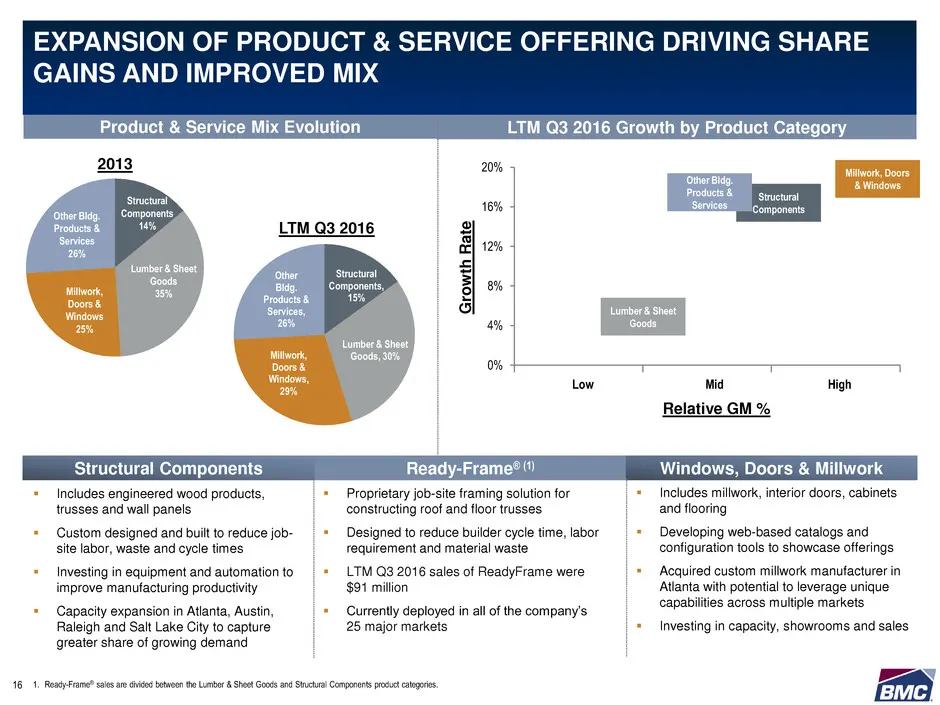
CLICK TO EDIT TITLE Other Bldg. Products & Services 26% Lumber & Sheet Goods 35%Millwork, Doors & Windows 25% Structural Components 14% Structural Components, 15% Lumber & Sheet Goods, 30%Millwork, Doors & Windows, 29% Other Bldg. Products & Services, 26% Includes engineered wood products, trusses
Slide 17: Ready-Frame Meeting Industry Needs
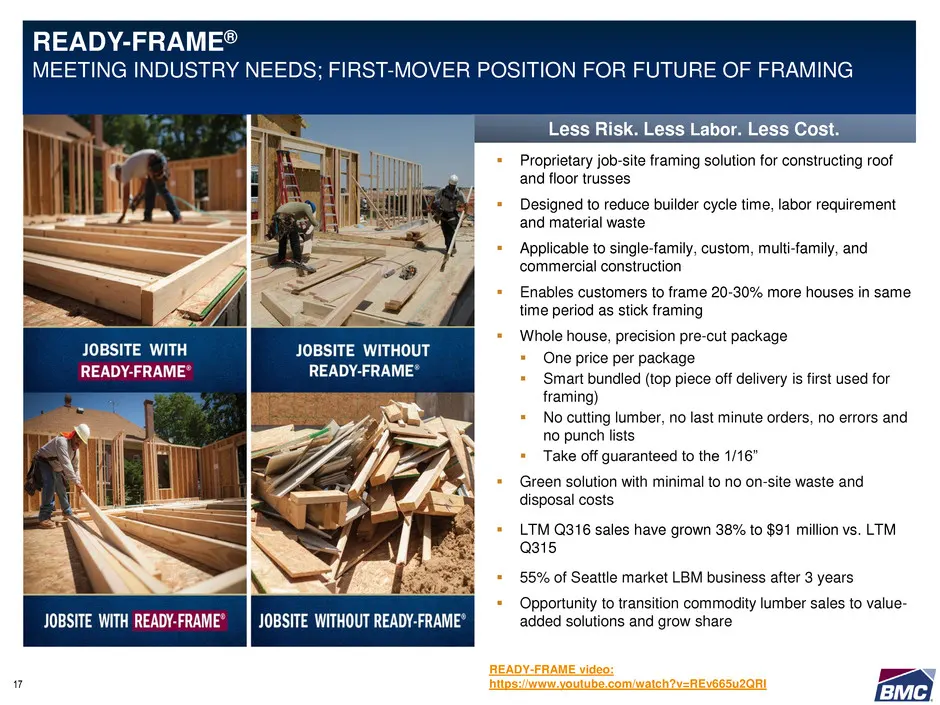
CLICK TO EDIT TITLEREADY-FRAME® MEETING INDUSTRY NEEDS; FIRST-MOVER POSITION FOR FUTURE OF FRAMING 17 Proprietary job-site framing solution for constructing roof and floor trusses Designed to reduce builder cycle time, labor requirement and material waste Applicable to single-family, custom, m
Slide 18: Ready-Frame Proven Track Record of Share Gains
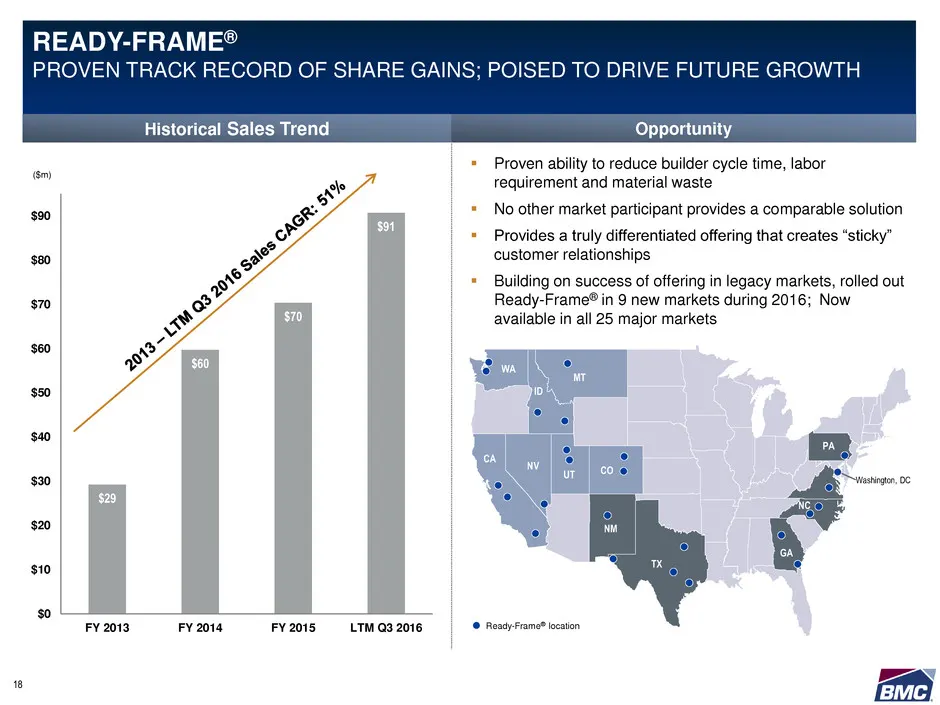
CLICK TO EDIT TITLEREADY-FRAME® PROVEN TRACK RECORD OF SHARE GAINS; POISED TO DRIVE FUTURE GROWTH 18 OpportunityHistorical Sales Trend Proven ability to reduce builder cycle time, labor requirement and material waste No other market participant provides a comparable solution Provides a truly d
Slide 19: BMC's LEAN eBusiness Evolution
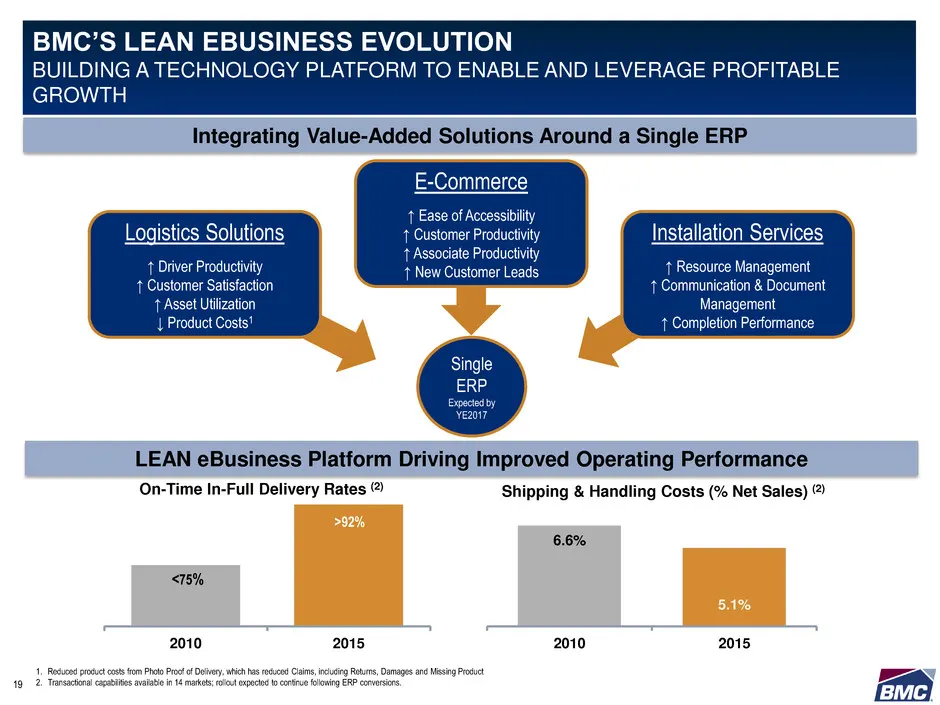
CLICK TO EDIT TITLEBMC’S LEAN EBUSINESS EVOLUTION BUILDING A TECHNOLOGY PLATFORM TO ENABLE AND LEVERAGE PROFITABLE GROWTH 19 LEAN eBusiness Platform Driving Improved Operating Performance 2010 2015 6.6% 5.1% 2010 2015 Shipping & Handling Costs (% Net Sales) (2)On-Time In-Full Delivery Rates (2) <75%
Slide 20: 24x7 Transactional Front-End to ERP
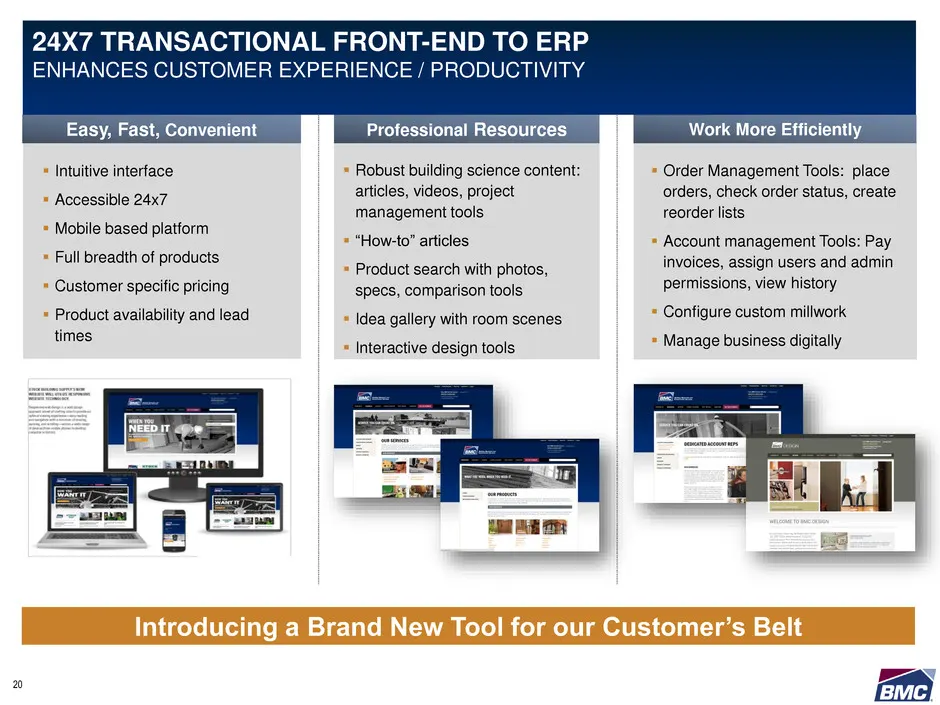
CLICK TO EDIT TITLE24X7 TRANSACTIONAL FRONT-END TO ERP ENHANCES CUSTOMER EXPERIENCE / PRODUCTIVITY 20 Easy, Fast, Convenient Intuitive interface Accessible 24x7 Mobile based platform Full breadth of products Customer specific pricing Product availability and lead times Professional Resou
Slide 21: Positioned to Utilize M&A to Drive Future Growth
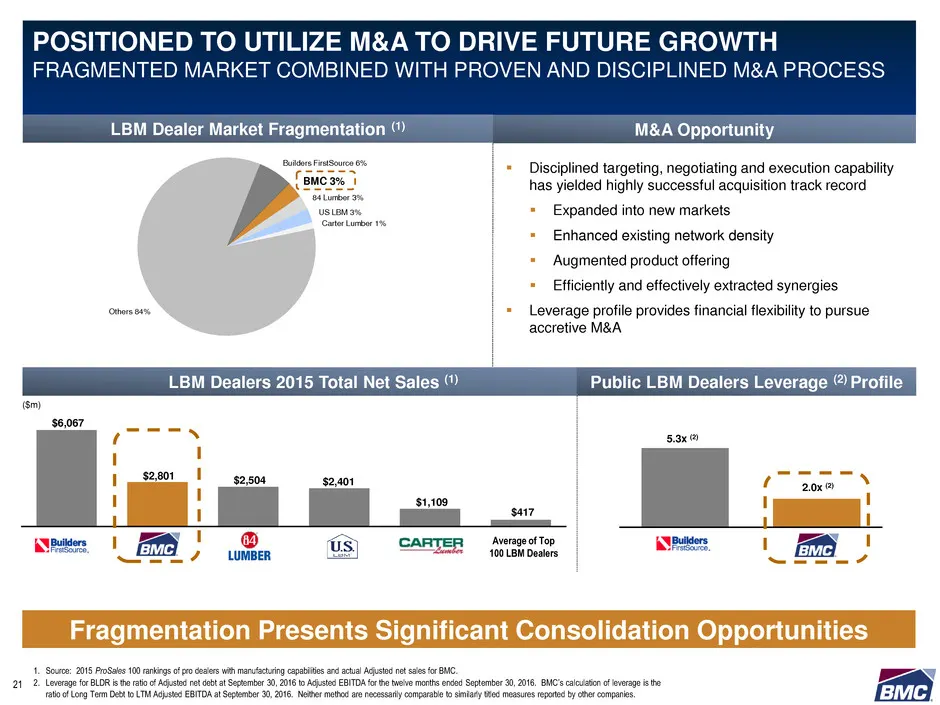
CLICK TO EDIT TITLEPOSITIONED TO UTILIZE M&A TO DRIVE FUTURE GROWTH FRAGMENTED MARKET COMBINED WITH PROVEN AND DISCIPLINED M&A PROCESS Fragmentation Presents Significant Consolidation Opportunities 5.3x (2) 2.0x (2) Disciplined targeting, negotiating and execution capability has yielded highly suc
Slide 22: Entering New Markets Efficiently: Proven Acquisition Capability
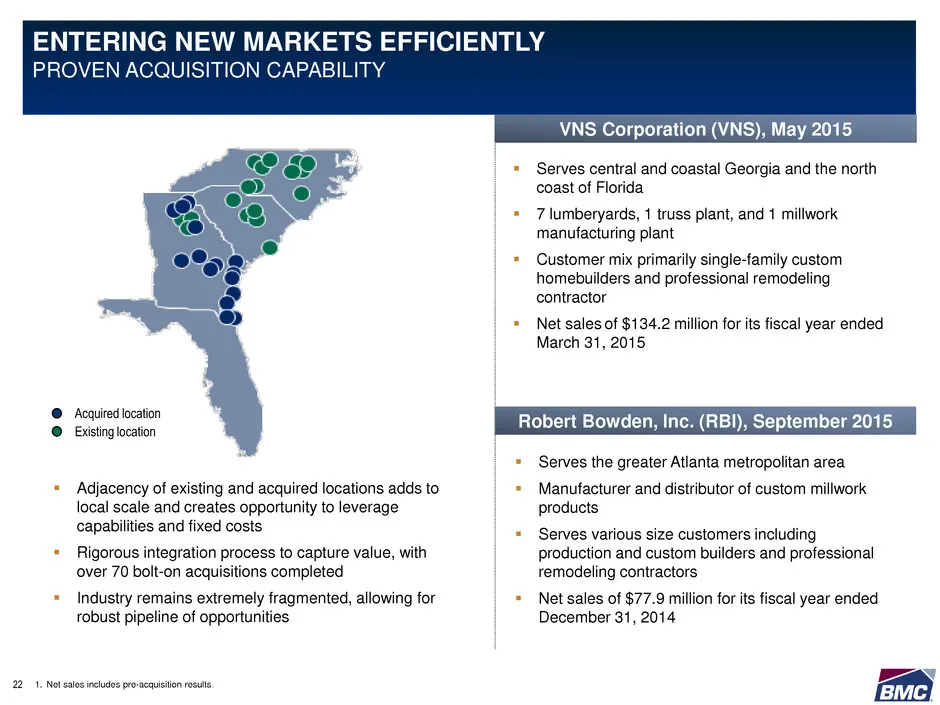
CLICK TO EDIT TITLEENTERING NEW MARKETS EFFICIENTLY PROVEN ACQUISITION CAPABILITY 22 Serves central and coastal Georgia and the north coast of Florida 7 lumberyards, 1 truss plant, and 1 millwork manufacturing plant Customer mix primarily single-family custom homebuilders and professional remo
Slide 23: Financial Overview
© 2016 BMC. All Rights Reserved. FINANCIAL OVERVIEW3
Slide 24: Proven Track Record of Growth
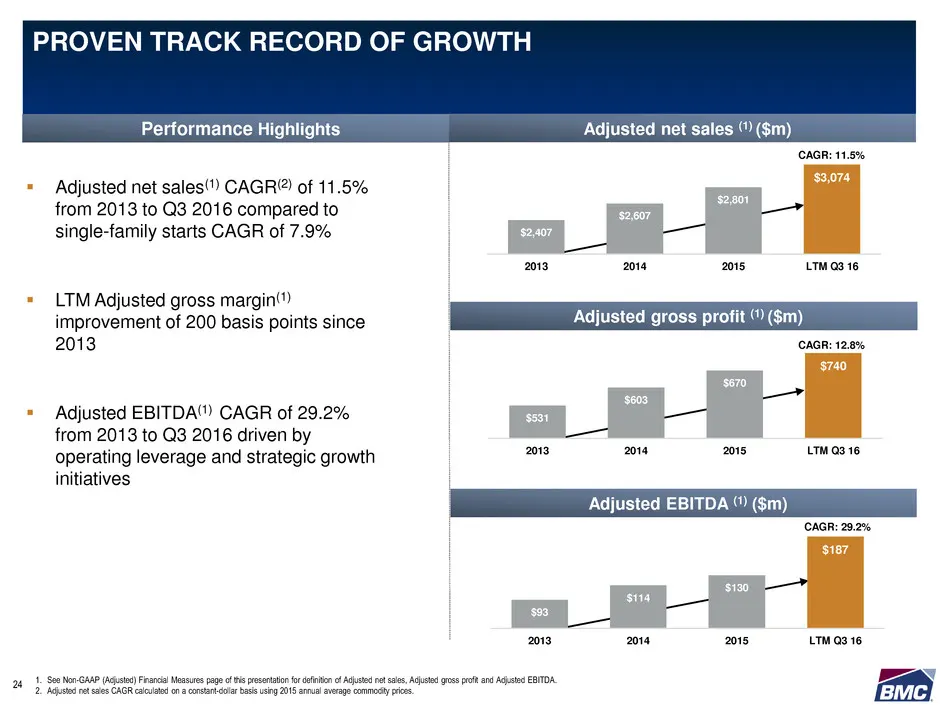
CLICK TO EDIT TITLE $93 $114 $130 $187 2013 2014 2015 LTM Q3 16 $2,407 $2,607 $2,801 $3,074 2013 2014 2015 LTM Q3 16 $531 $603 $670 $740 2013 2014 2015 LTM Q3 16 CAGR: 11.5% PROVEN TRACK RECORD OF GROWTH 24 Adjusted net sales(1) CAGR(2) of 11.5% from 2013 to Q3 2016 compared to single-family start
Slide 25: Q3 2016 / YTD Sep 30, 2016 Adjusted Net Sales Bridge
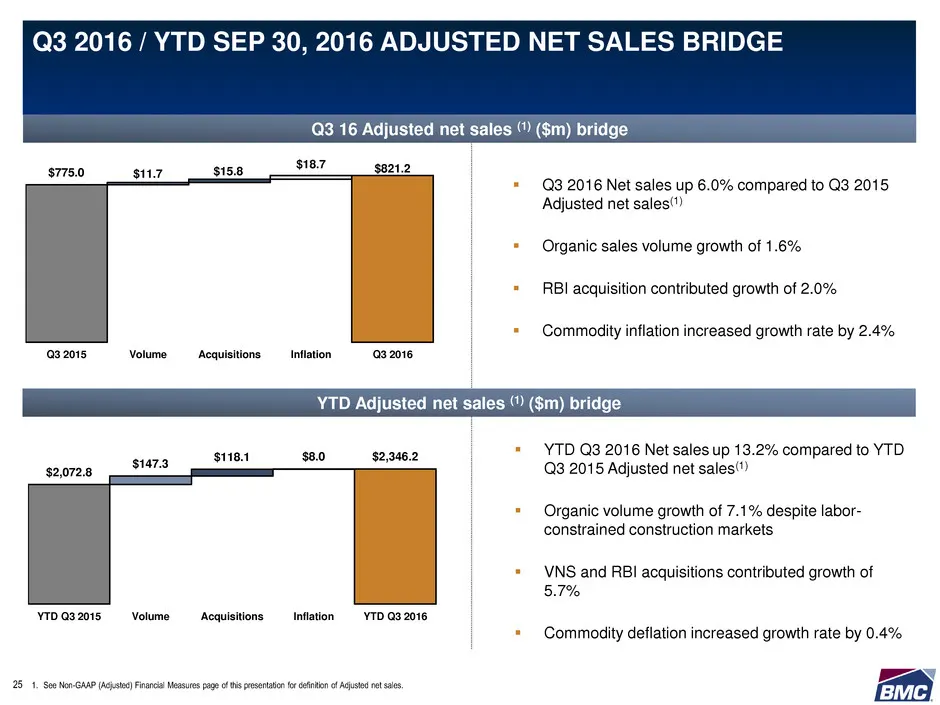
CLICK TO EDIT TITLEQ3 2016 / YTD SEP 30, 2016 ADJUSTED NET SALES BRIDGE 25 Q3 16 Adjusted net sales (1) ($m) bridge Q3 2016 Net sales up 6.0% compared to Q3 2015 Adjusted net sales(1) Organic sales volume growth of 1.6% RBI acquisition contributed growth of 2.0% Commodity inflation increased
Slide 26: Q3 2016 Financial Results
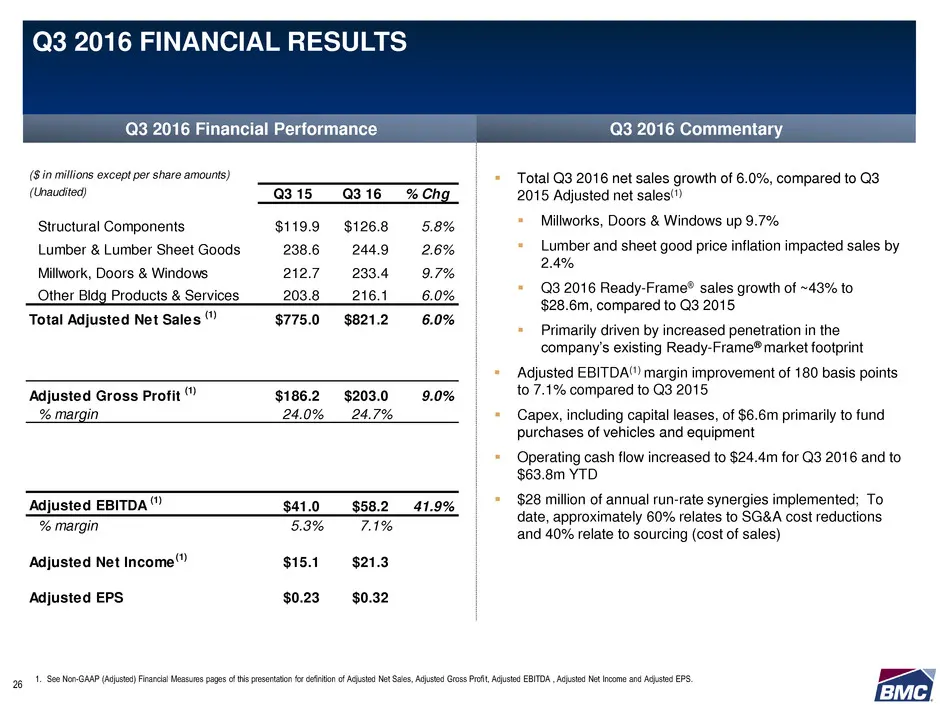
CLICK TO EDIT TITLEQ3 2016 FINANCIA RESULTS 26 Q3 2016 Financial Performance Q3 2016 Commentary Total Q3 2016 net sales growth of 6.0%, compared to Q3 2015 Adjusted net sales(1) Millworks, Doors & Windows up 9.7% Lumber and sheet good price inflation impacted sales by 2.4% Q3 2016 Ready-Fram
Slide 27: Strong Balance Sheet to Support Growth
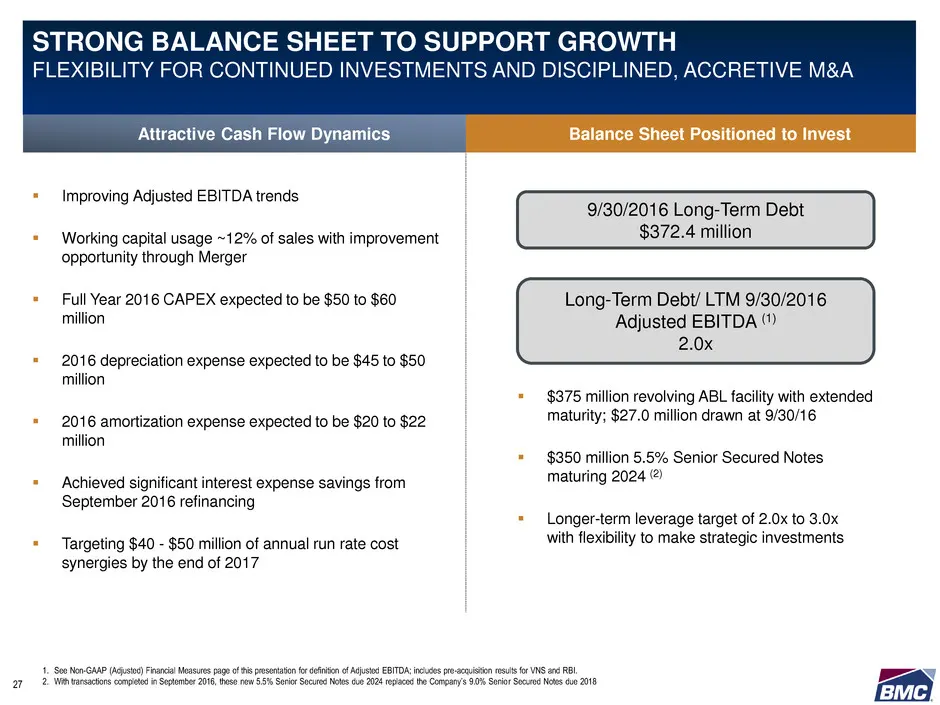
CLICK TO EDIT TITLESTRONG BALANCE SHEET TO SUPPORT GROWTH FLEXIBILITY FOR CONTINUED INVESTMENTS AND DISCIPLINED, ACCRETIVE M&A 27 1. See Non-GAAP (Adjusted) Financial Measures page of this presentation for definition of Adjusted EBITDA; includes pre-acquisition results for VNS and RBI. 2. With trans
Slide 28: Solid Balance Sheet and Ample Liquidity Support Business Strategy
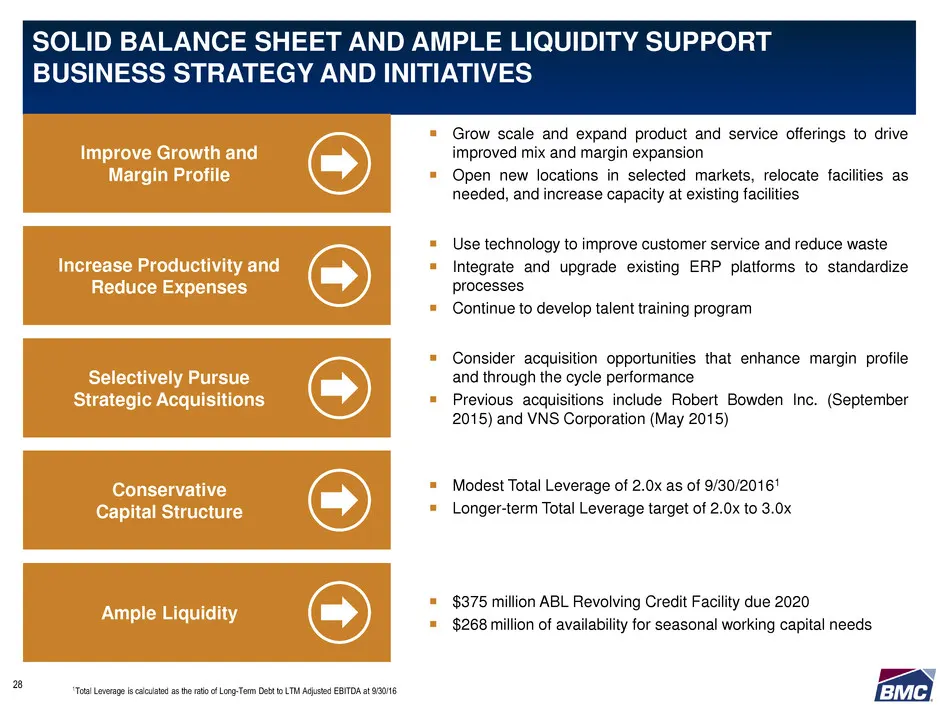
CLICK TO EDIT TITLESOLID BALANCE SHEET AND AMPLE LIQUIDITY SUPPORT BUSINESS STRATEGY AND INITIATIVES 28 Selectively Pursue Strategic Acquisitions Ample Liquidity Improve Growth and Margin Profile Increase Productivity and Reduce Expenses Conservative Capital Structure Grow scale and expand product
Slide 29: BMC Investment Highlights
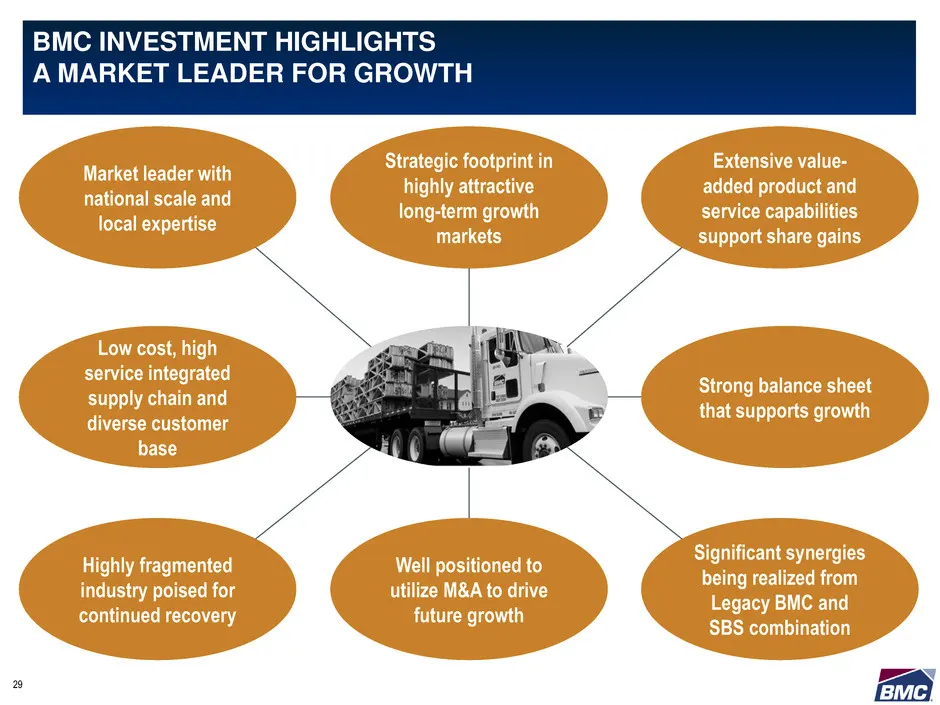
CLICK TO EDIT TITLEBMC INVESTMENT HIGHLIGHTS A MARKET LEADER FOR GROWTH 29 Market leader with national scale and local expertise Strategic footprint in highly attractive long-term growth markets Extensive value- added product and service capabilities support share gains Strong balance sheet that sup
Slide 30: Appendix
© 2016 BMC. All Rights Reserved. APPENDIX
Slide 31: Reported (GAAP) Income Statement
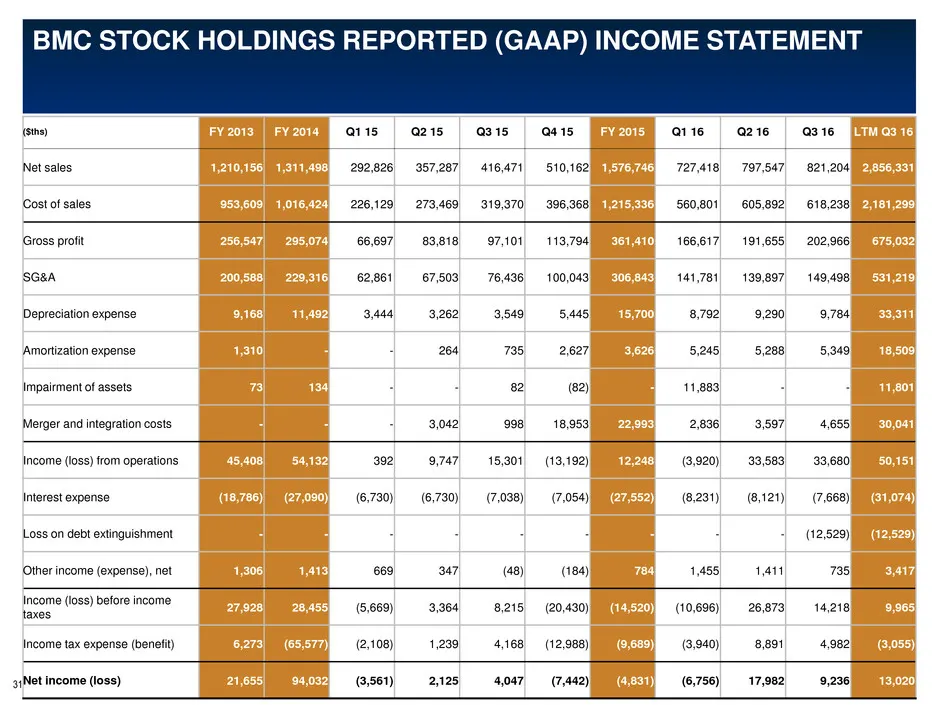
BMC STOCK HOLDINGS REPORTED (GAAP) INCOME STATEMENT ($ths) FY 2013 FY 2014 Q1 15 Q2 15 Q3 15 Q4 15 FY 2015 Q1 16 Q2 16 Q3 16 LTM Q3 16 Net sales 1,210,156 1,311,498 292,826 357,287 416,471 510,162 1,576,746 727,418 797,547 821,204 2,856,331 Cost of sales 953,609 1,016,424 226,129 273,469 319,370 396
Slide 32: Reconciliation: Adjusted Net Sales, Adjusted Gross Profit
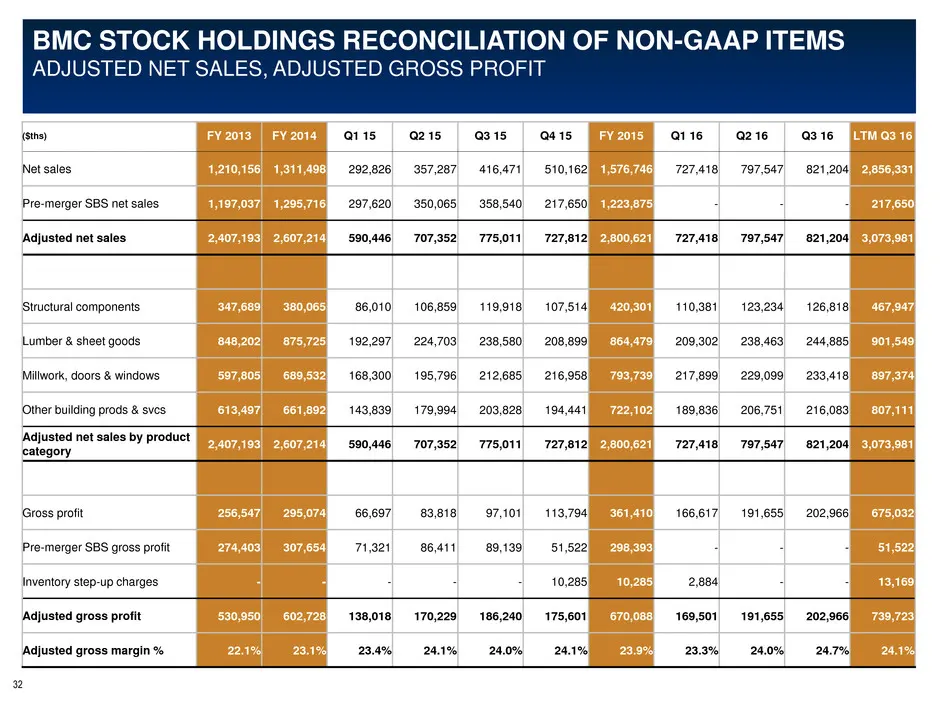
BMC STOCK HOLDINGS RECONCILIATION OF NON-GAAP ITEMS ADJUSTED NET SALES, ADJUSTED GROSS PROFIT ($ths) FY 2013 FY 2014 Q1 15 Q2 15 Q3 15 Q4 15 FY 2015 Q1 16 Q2 16 Q3 16 LTM Q3 16 Net sales 1,210,156 1,311,498 292,826 357,287 416,471 510,162 1,576,746 727,418 797,547 821,204 2,856,331 Pre-merger SBS ne
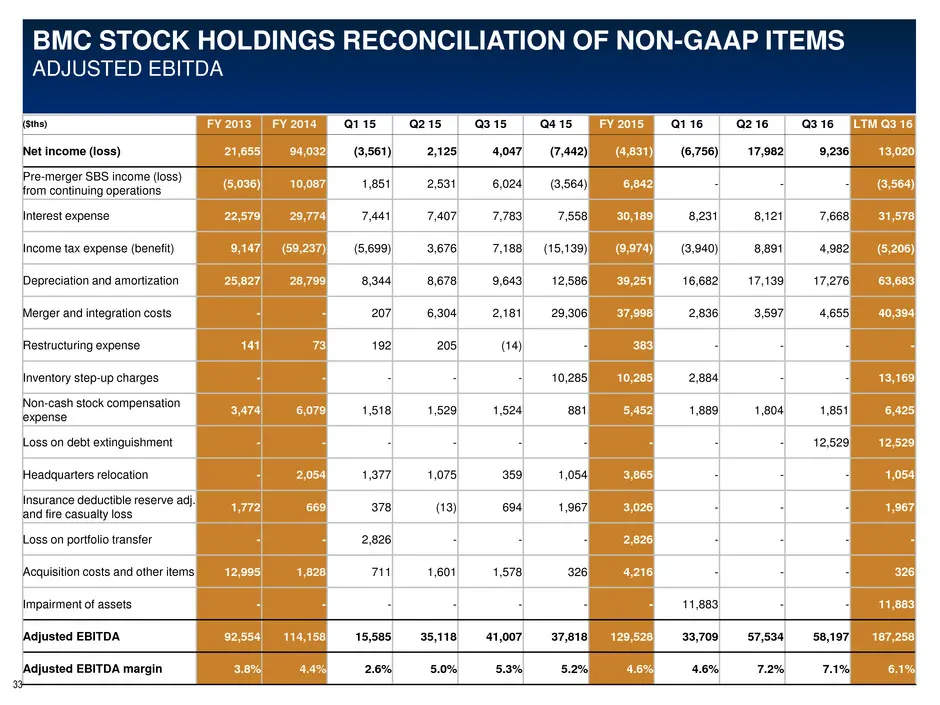
Slide 33: Reconciliation: Adjusted EBITDA
BMC STOCK HOLDINGS RECONCILIATION OF NON-GAAP ITEMS ADJUSTED EBITDA ($ths) FY 2013 FY 2014 Q1 15 Q2 15 Q3 15 Q4 15 FY 2015 Q1 16 Q2 16 Q3 16 LTM Q3 16 Net income (loss) 21,655 94,032 (3,561) 2,125 4,047 (7,442) (4,831) (6,756) 17,982 9,236 13,020 Pre-merger SBS income (loss) from continuing operatio
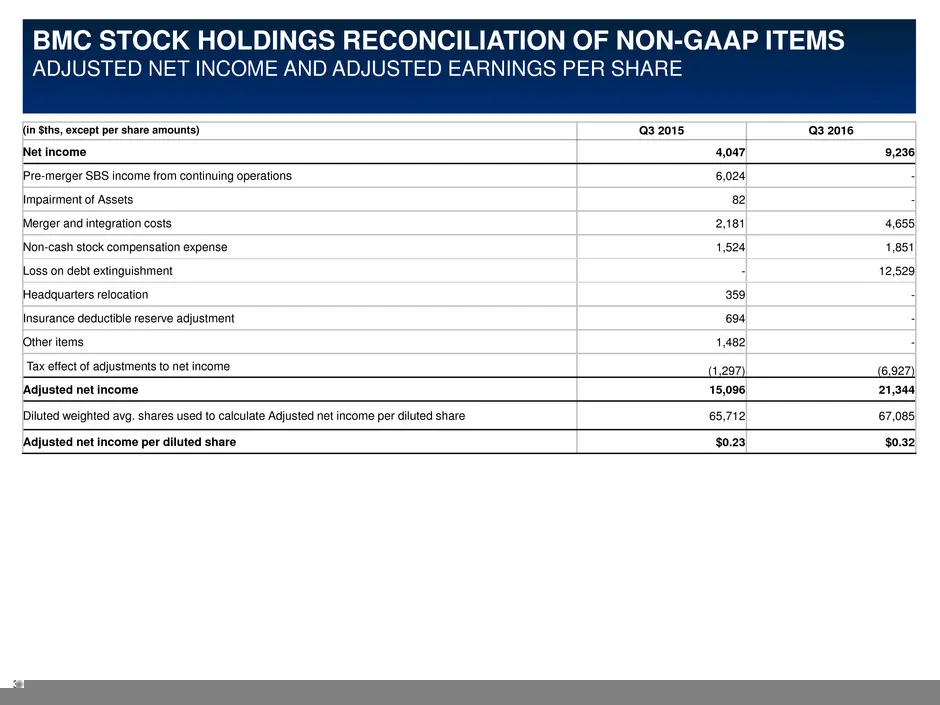
Slide 34: Reconciliation: Adjusted Net Income and Adjusted EPS
BMC STOCK HOLDINGS RECONCILIATION OF NON-GAAP ITEMS ADJUSTED NET INCOME AND ADJUSTED EARNINGS PER SHARE (in $ths, except per share amounts) Q3 2015 Q3 2016 Net income 4,047 9,236 Pre-merger SBS income from continuing operations 6,024 - Impairment of Assets 82 - Merger and integration costs 2,181 4,6
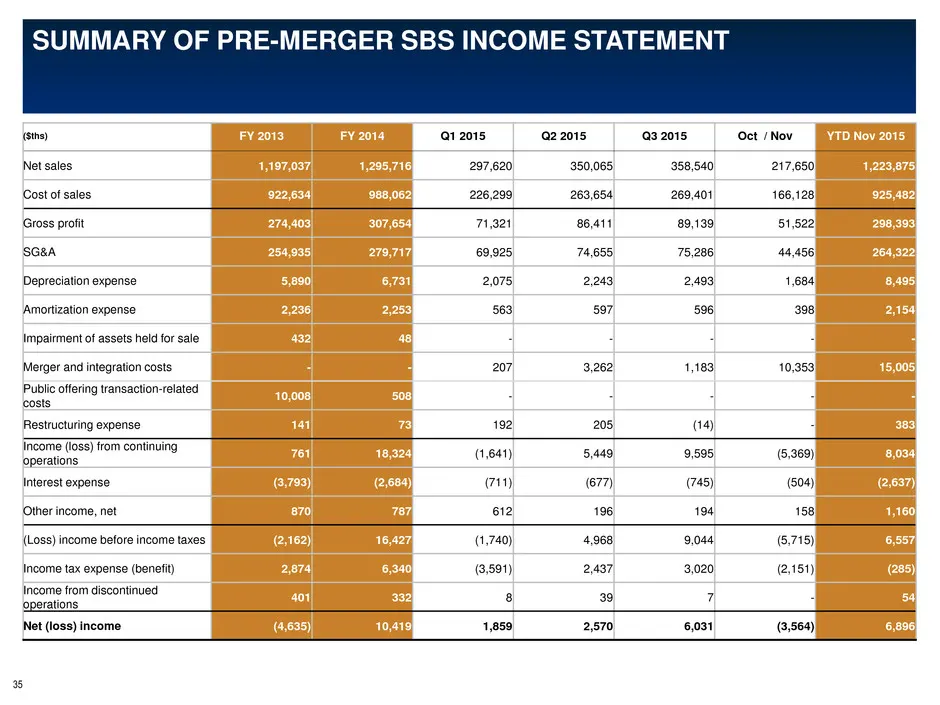
Slide 35: Summary of Pre-Merger SBS Income Statement
SUMMARY OF PRE-MERGER SBS INCOME STATEMENT ($ths) FY 2013 FY 2014 Q1 2015 Q2 2015 Q3 2015 Oct / Nov YTD Nov 2015 Net sales 1,197,037 1,295,716 297,620 350,065 358,540 217,650 1,223,875 Cost of sales 922,634 988,062 226,299 263,654 269,401 166,128 925,482 Gross profit 274,403 307,654 71,321 86,411 89
Source: SEC EDGAR · 8-K filed Nov 8, 2016
More decks from BMC Stock Holdings Inc
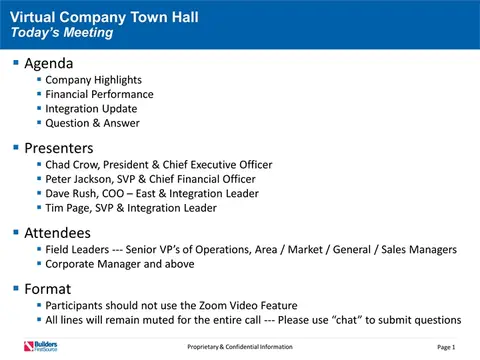 Merger or Acquisition (November 2020)7 slides · Nov 25, 2020
 Q3 2020 Earnings Presentation13 slides · Nov 3, 2020
 Merger or Acquisition (August 2020)21 slides · Aug 27, 2020
 Investor Presentation (August 2017)29 slides · Aug 4, 2017
 Investor Presentation (May 2017)29 slides · May 8, 2017
 Investor Presentation (March 2017)32 slides · Mar 1, 2017