Huttig Building Products — Investor Presentation (June 2017)
26 slides from Huttig Building Products's investor presentation, Jun 1, 2017
Slide 1: Huttig Building Products Investor Presentation Spring 2017
Huttig Building Products Nasdaq: HBP Investor Presentation Spring 2017 Exhibit 99.1
Slide 2: Safe Harbor / Forward Looking Statement
Huttig Building Products Spring 2017 Company Overview SAFE HARBOR / FORWARD LOOKING STATEMENT These presentation materials may contain forward-looking statements as defined by the U.S. Private Securities Litigation Reform Act of 1995 (“Reform Act”). Statements made in this presentation looking forwa
Slide 3: Huttig Building Products Company Overview
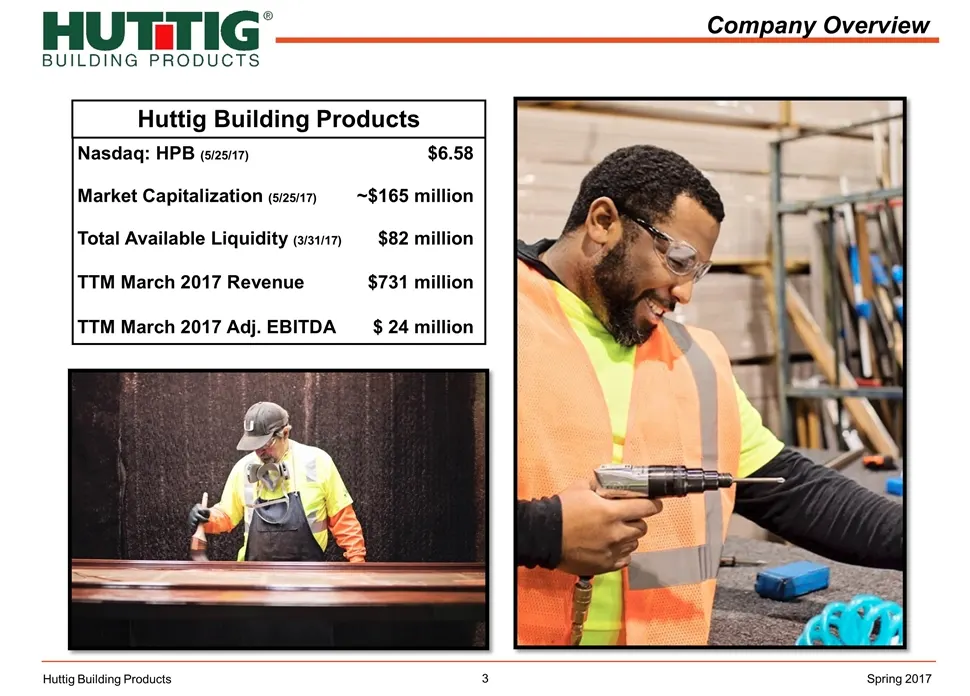
Huttig Building Products Spring 2017 Nasdaq: HPB (5/25/17) $6.58 Market Capitalization (5/25/17)~$165 million Total Available Liquidity (3/31/17) $82 million TTM March 2017 Revenue $731 million TTM March 2017 Adj. EBITDA$ 24 million Huttig Building Products Company Overview
Slide 4: Executive Overview: Investment Highlights
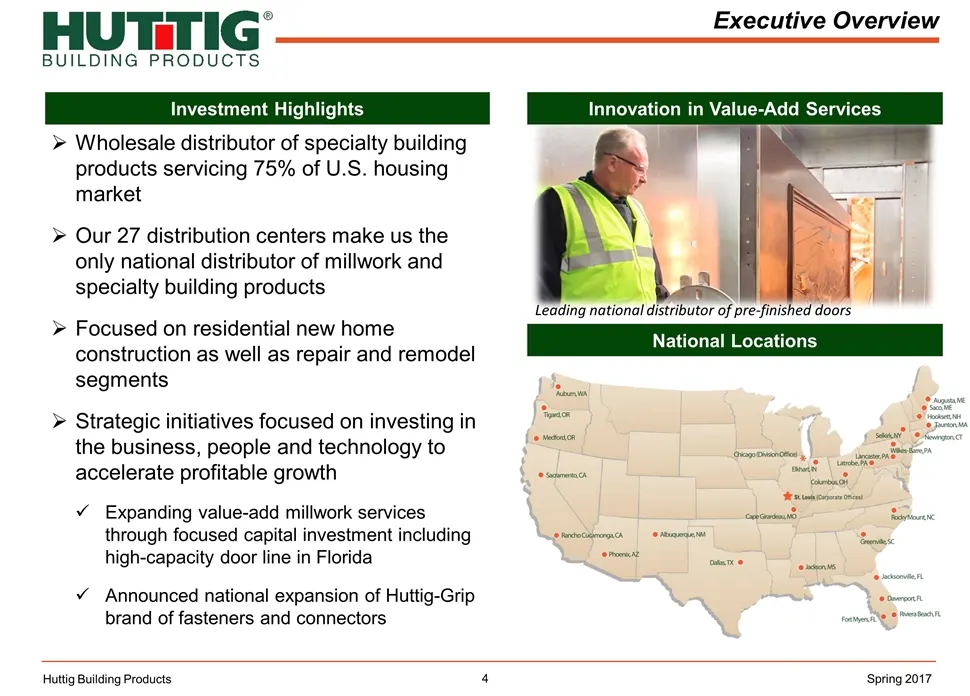
Executive Overview Huttig Building Products Investment Highlights Wholesale distributor of specialty building products servicing 75% of U.S. housing market Our 27 distribution centers make us the only national distributor of millwork and specialty building products Focused on residential new home co
Slide 5: Company / Industry Overview Value Proposition / Strategy Overview Financial Overview Summary / Q&A
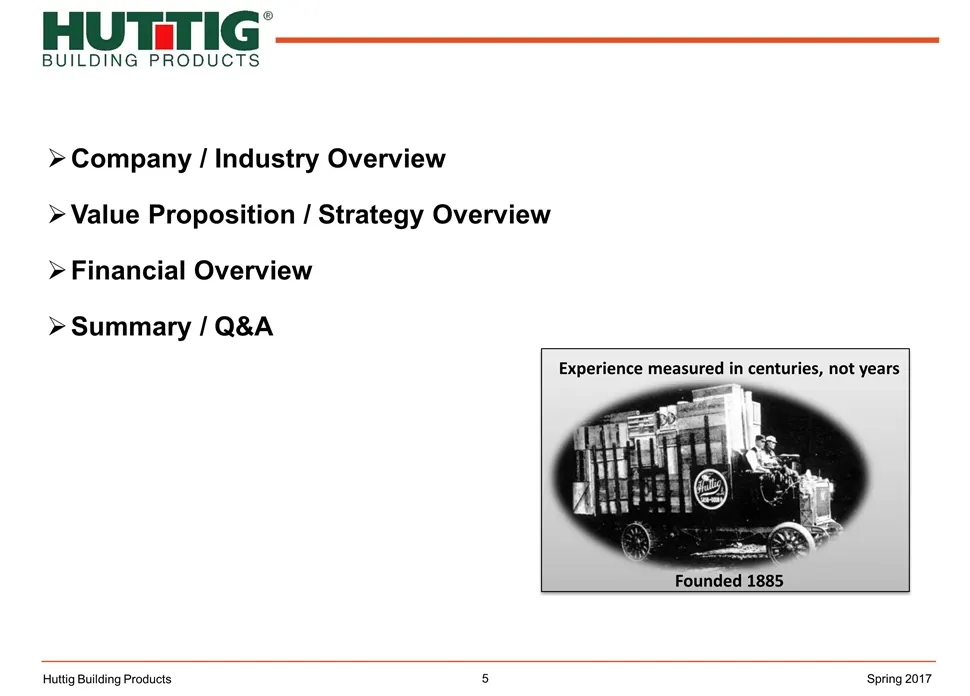
Company / Industry Overview Value Proposition / Strategy Overview Financial Overview Summary / Q&A Huttig Building Products Spring 2017 Experience measured in centuries, not years Founded 1885
Slide 6: Company / Industry Overview
Company / Industry Overview Huttig Building Products Spring 2017
Slide 7: Growth Concentrated in Strategic Products
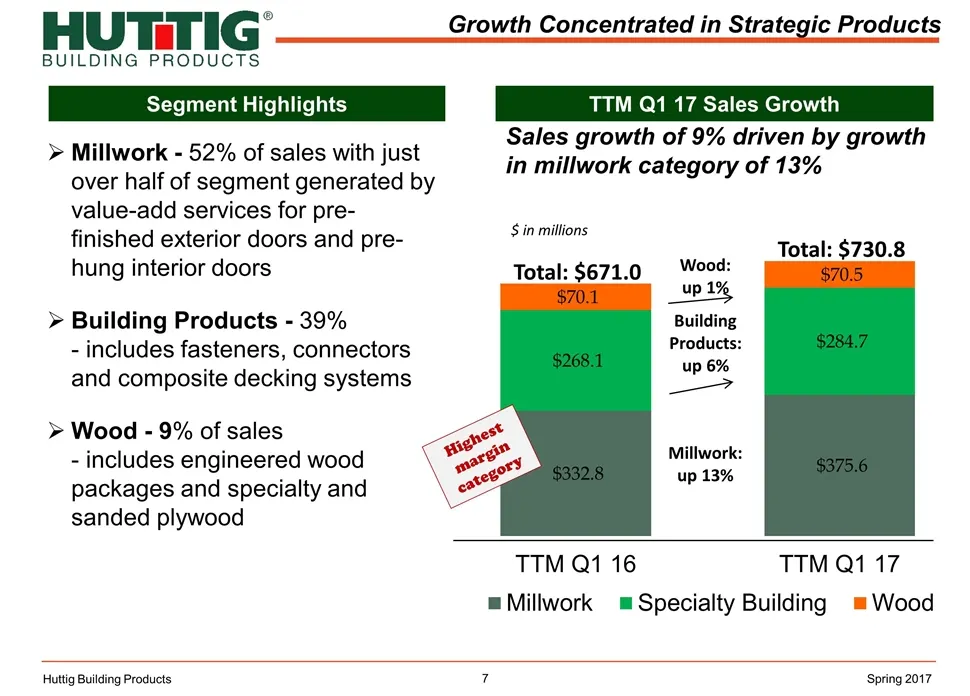
Growth Concentrated in Strategic Products Sales growth of 9% driven by growth in millwork category of 13% Millwork: up 13% Wood: up 1% Building Products: up 6% Segment Highlights TTM Q1 17 Sales Growth Millwork - 52% of sales with just over half of segment generated by value-add services for pre-fin
Slide 8: Service Proposition
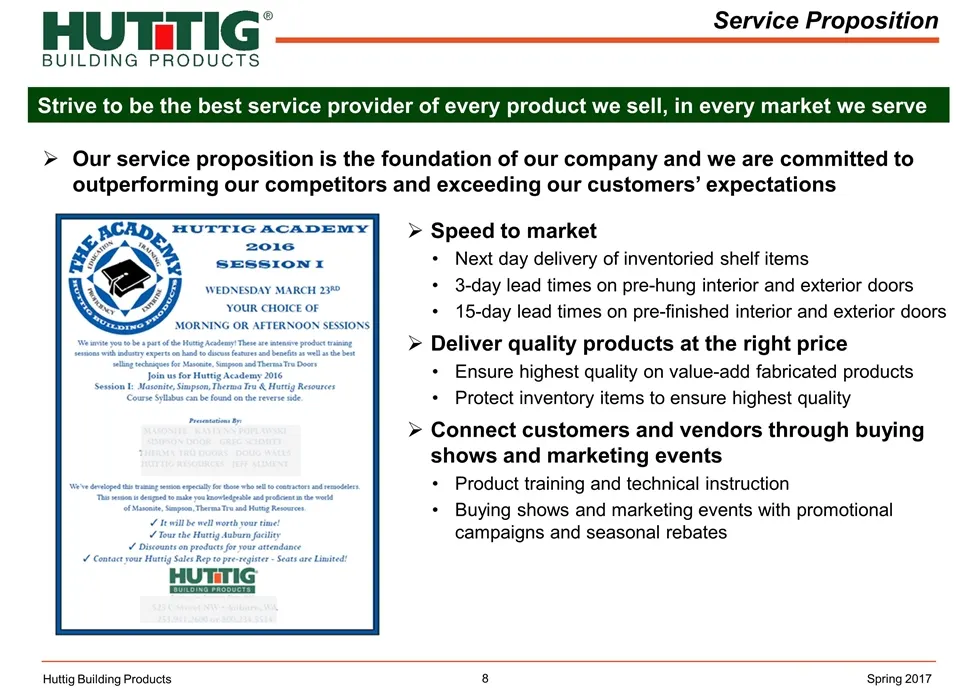
Service Proposition Huttig Building Products Speed to market Next day delivery of inventoried shelf items 3-day lead times on pre-hung interior and exterior doors 15-day lead times on pre-finished interior and exterior doors Deliver quality products at the right price Ensure highest quality on value
Slide 9: Market Leadership with National Scale
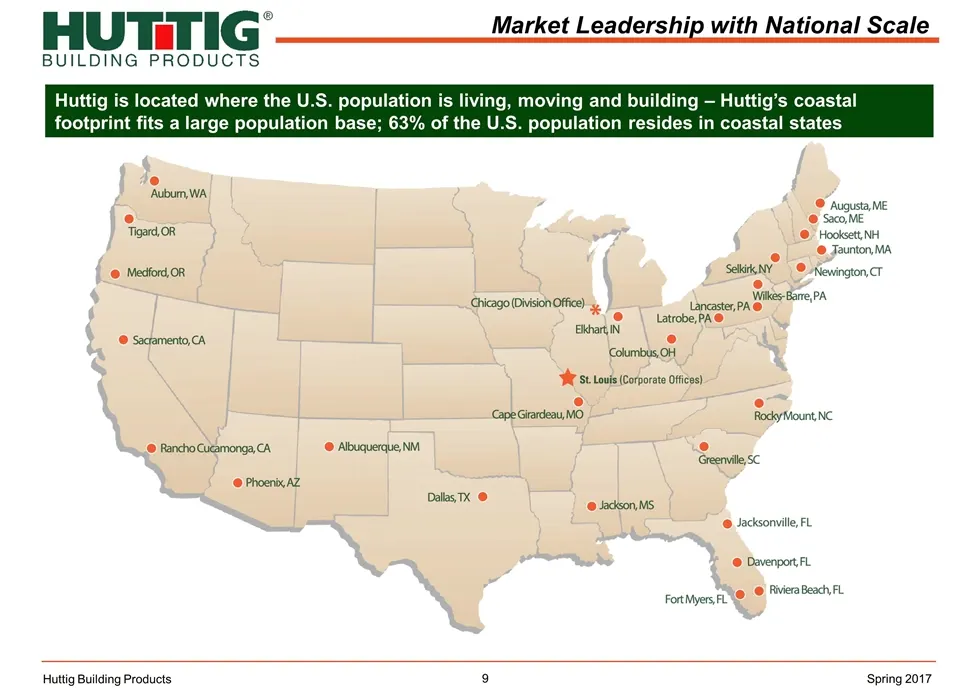
Huttig is located where the U.S. population is living, moving and building – Huttig’s coastal footprint fits a large population base; 63% of the U.S. population resides in coastal states Market Leadership with National Scale Huttig Building Products Spring 2017
Slide 10: Value of Wholesale in Housing Market
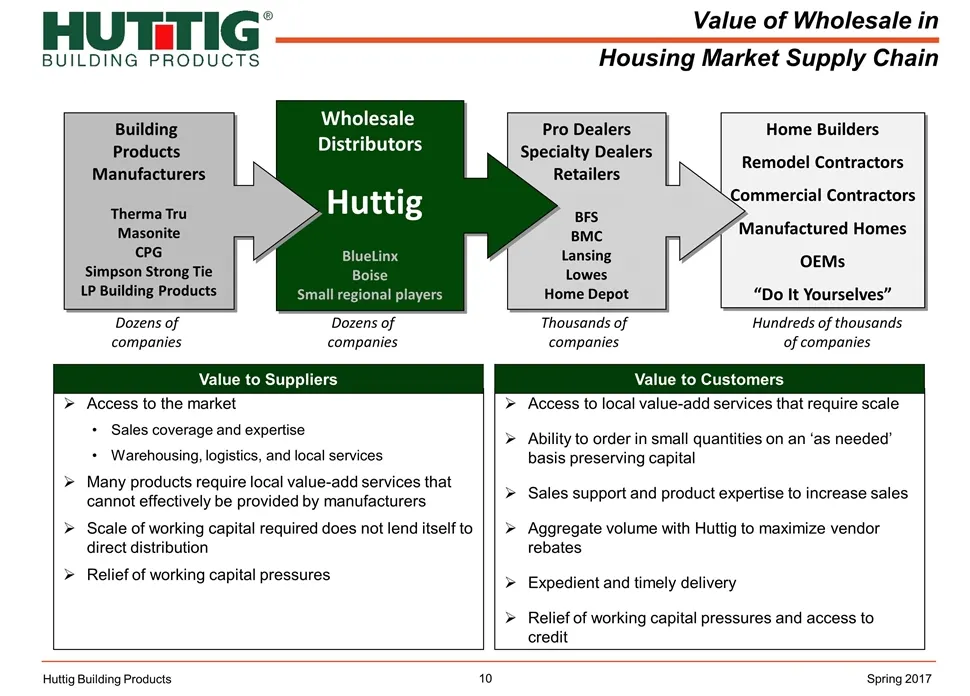
Home Builders Remodel Contractors Commercial Contractors Manufactured Homes OEMs “Do It Yourselves” Pro Dealers Specialty Dealers Retailers BFS BMC Lansing Lowes Home Depot Wholesale Distributors Huttig BlueLinx Boise Small regional players Building Products Manufacturers Therma Tru Masonite CPG Sim
Slide 11: Overview of U.S. Housing Market
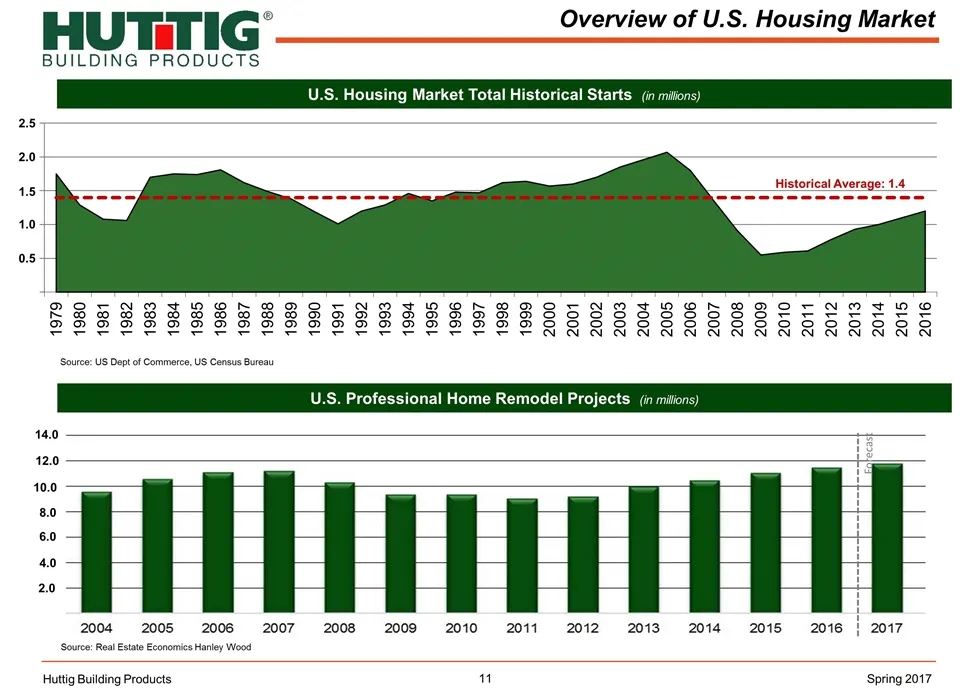
Overview of U.S. Housing Market Source: US Dept of Commerce, US Census Bureau U.S. Housing Market Total Historical Starts (in millions) Huttig Building Products U.S. Professional Home Remodel Projects (in millions) Source: Real Estate Economics Hanley Wood Forecast 14.0 12.0 10.0 8.0 4.0 6.0 2.0 Spr
Slide 12: Value Proposition / Strategy Overview
Value Proposition / Strategy Overview Huttig Building Products Spring 2017
Slide 13: Strategic Initiatives
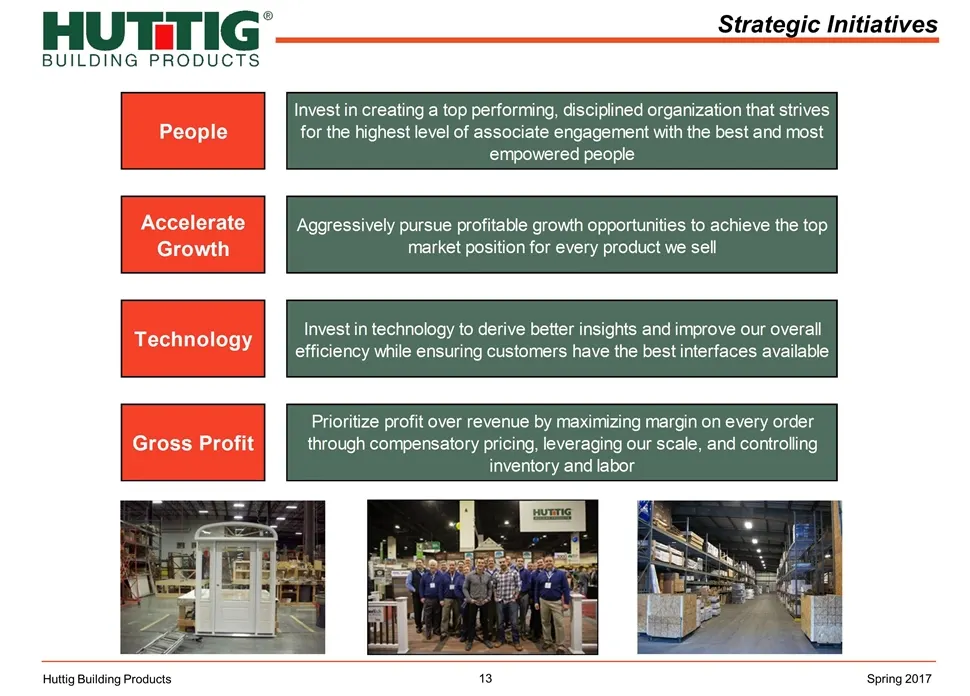
Strategic Initiatives Huttig Building Products Spring 2017 People Invest in creating a top performing, disciplined organization that strives for the highest level of associate engagement with the best and most empowered people Accelerate Growth Aggressively pursue profitable growth opportunities to
Slide 14: Strategic Priorities Grounded in History of Sustainable Results
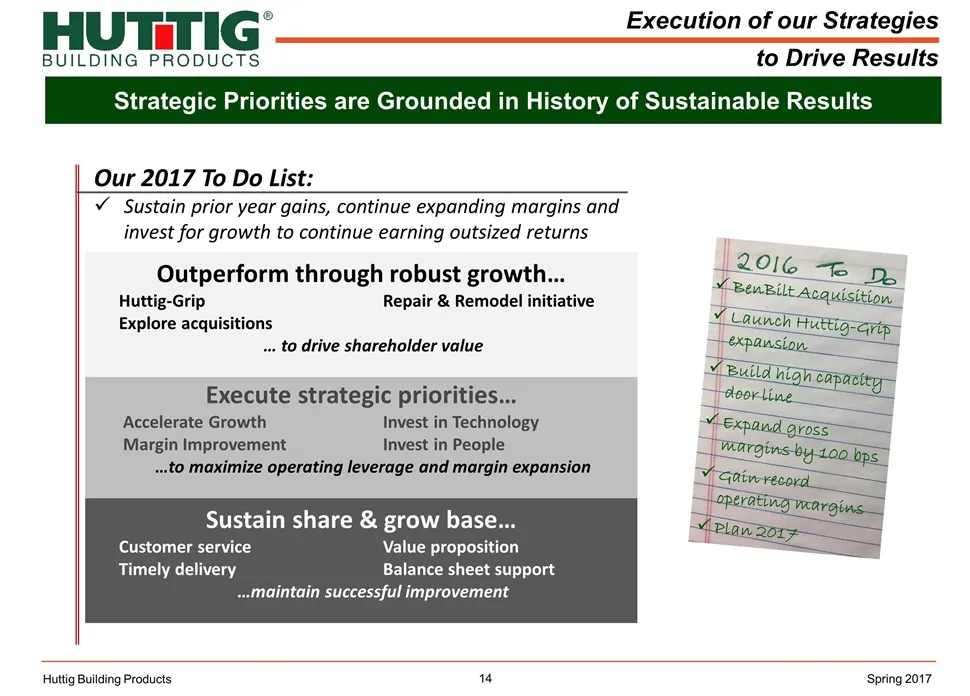
Strategic Priorities are Grounded in History of Sustainable Results Execution of our Strategies to Drive Results Huttig Building Products Sustain share & grow base… Customer serviceValue proposition Timely delivery Balance sheet support …maintain successful improvement Our 2017 To Do List: Sustain p
Slide 15: Our Value Proposition: Repair & Remodel
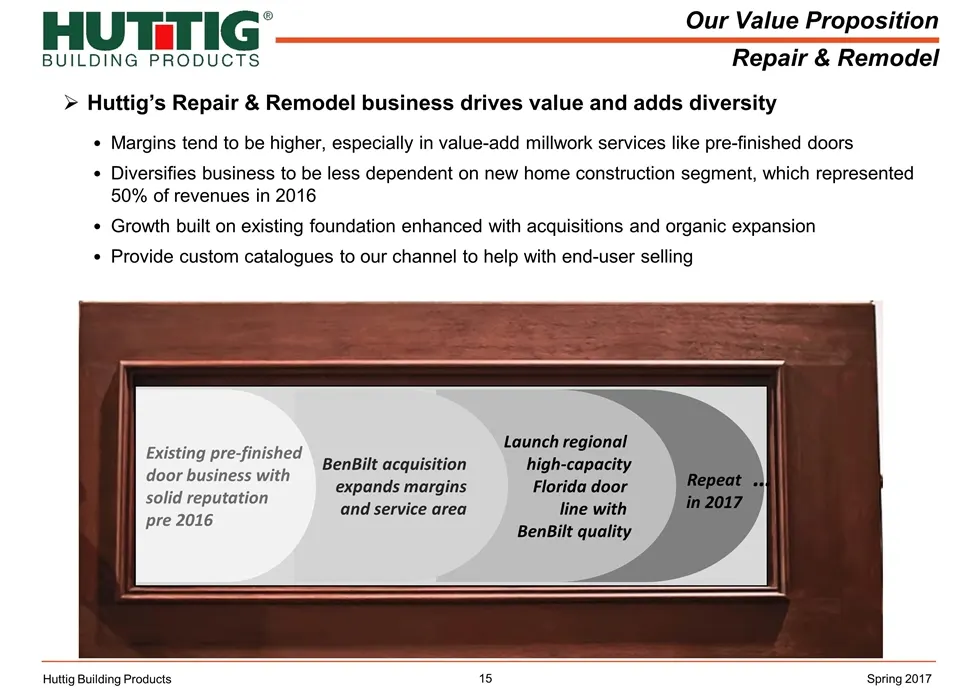
Our Value Proposition Repair & Remodel Huttig Building Products Spring 2017 Huttig’s Repair & Remodel business drives value and adds diversity Margins tend to be higher, especially in value-add millwork services like pre-finished doors Diversifies business to be less dependent on new home constructi
Slide 16: Huttig-Grip Growing Share in Fasteners & Connectors
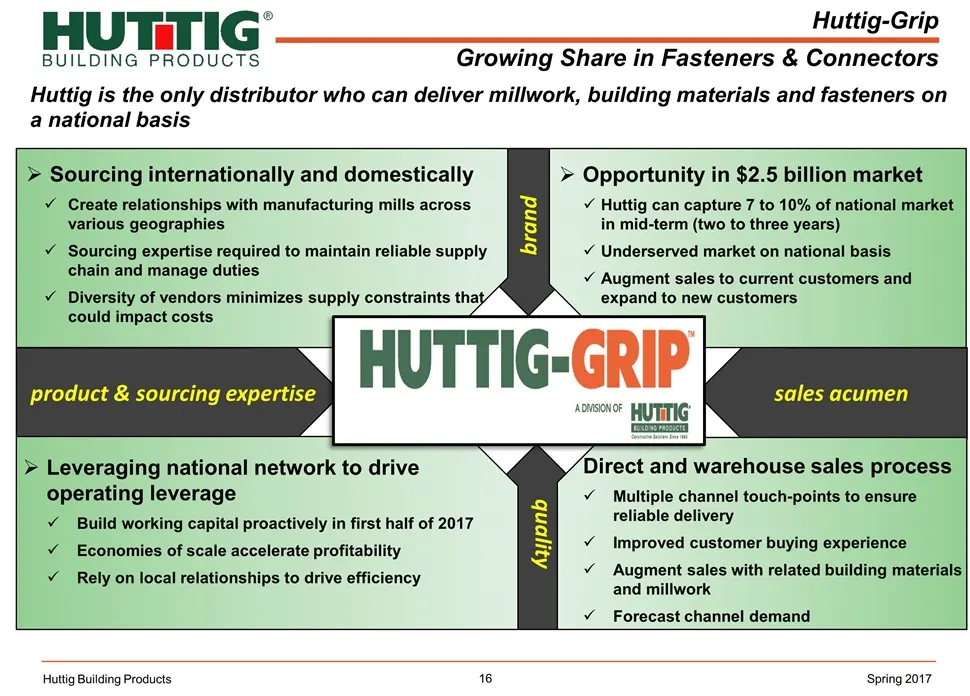
Sourcing internationally and domestically Create relationships with manufacturing mills across various geographies Sourcing expertise required to maintain reliable supply chain and manage duties Diversity of vendors minimizes supply constraints that could impact costs Huttig-Grip Growing Share in Fa
Slide 17: The Next Level of Investing: Leveraging Huttig-Grip Brand
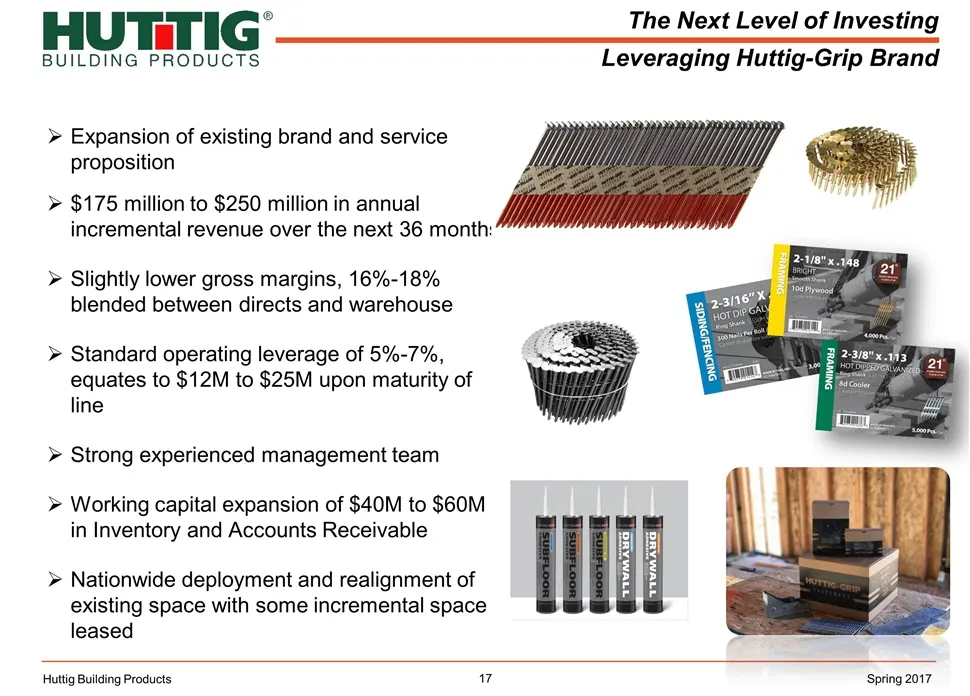
The Next Level of Investing Leveraging Huttig-Grip Brand Huttig Building Products Expansion of existing brand and service proposition $175 million to $250 million in annual incremental revenue over the next 36 months Slightly lower gross margins, 16%-18% blended between directs and warehouse Standar
Slide 18: Specialty Focused Brand Portfolio
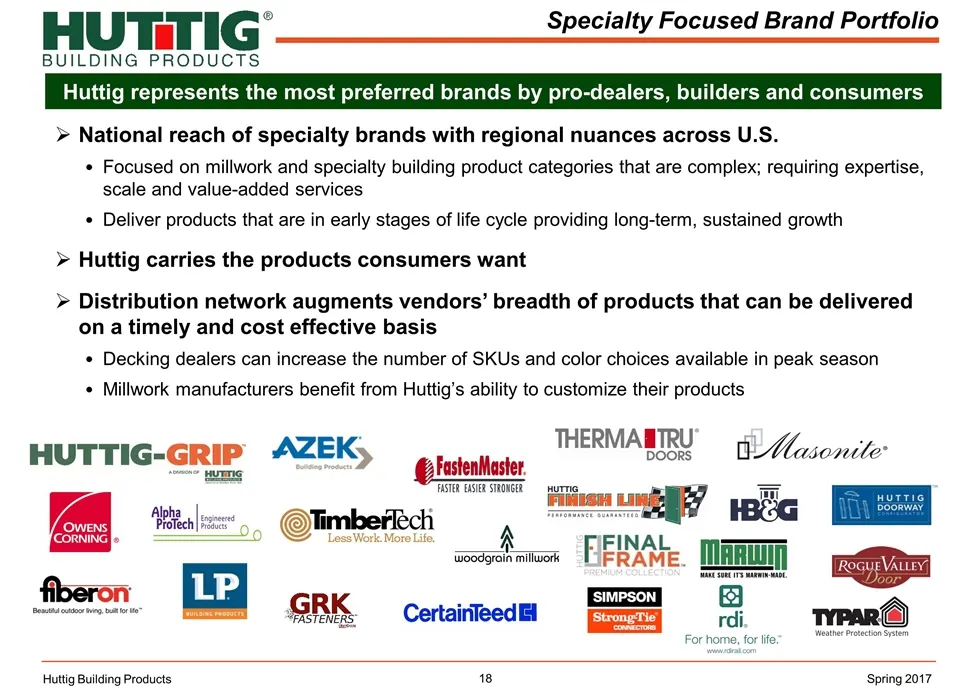
Specialty Focused Brand Portfolio Huttig represents the most preferred brands by pro-dealers, builders and consumers Huttig Building Products National reach of specialty brands with regional nuances across U.S. Focused on millwork and specialty building product categories that are complex; requiring
Slide 19: Unique Capabilities to Serve National Accounts
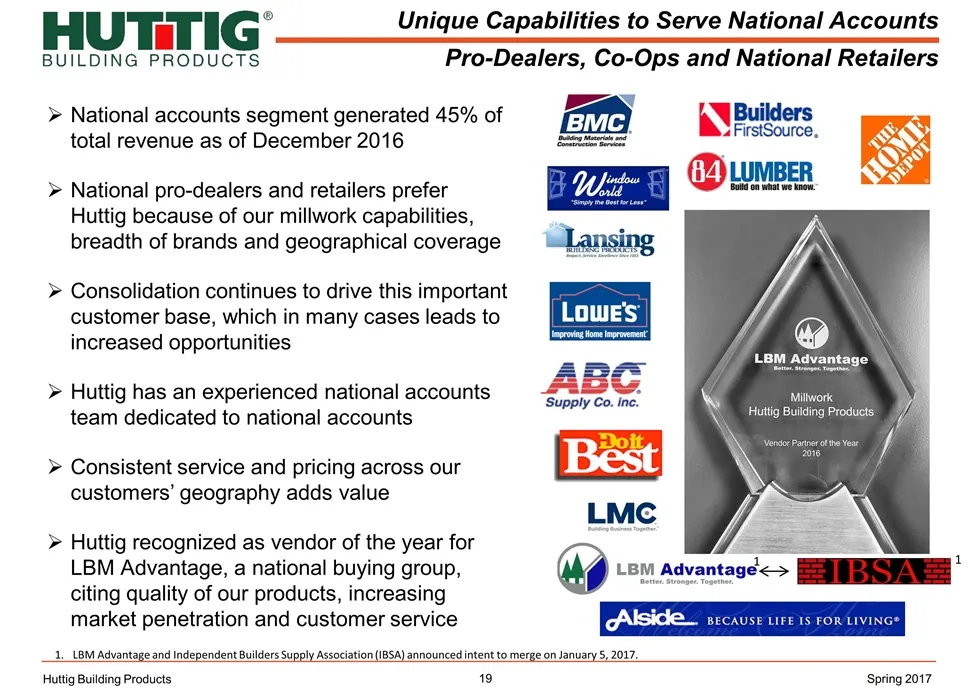
Unique Capabilities to Serve National Accounts Pro-Dealers, Co-Ops and National Retailers Huttig Building Products National accounts segment generated 45% of total revenue as of December 2016 National pro-dealers and retailers prefer Huttig because of our millwork capabilities, breadth of brands and
Slide 20: Our Path to Accelerate Growth and Performance
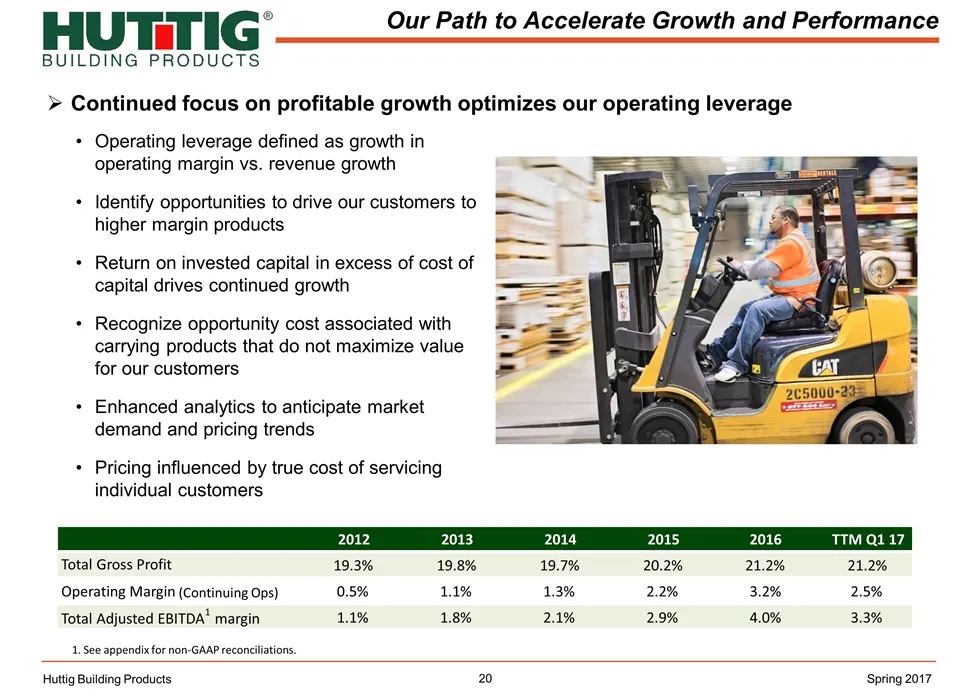
Continued focus on profitable growth optimizes our operating leverage Our Path to Accelerate Growth and Performance Huttig Building Products 1. See appendix for non-GAAP reconciliations. Operating leverage defined as growth in operating margin vs. revenue growth Identify opportunities to drive our c
Slide 21: Financial Overview
Financial Overview Huttig Building Products Spring 2017
Slide 22: Consolidated Financial Information
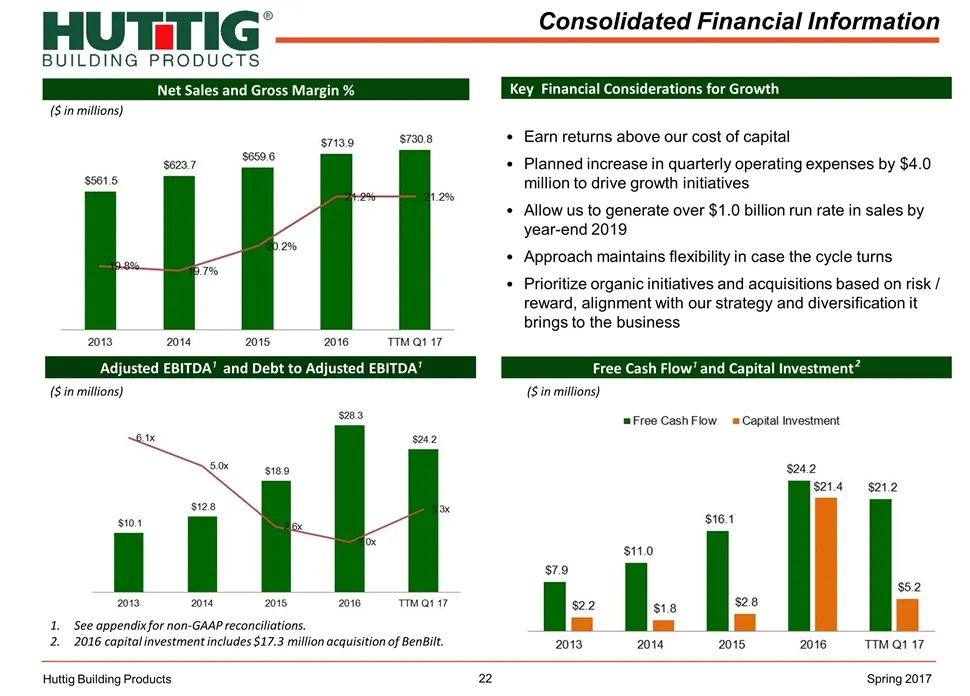
Consolidated Financial Information Huttig Building Products Net Sales and Gross Margin % Free Cash Flow¹ and Capital Investment 2 See appendix for non-GAAP reconciliations. 2016 capital investment includes $17.3 million acquisition of BenBilt. Adjusted EBITDA¹ and Debt to Adjusted EBITDA¹ Spring 201
Slide 23: 2017 Investment Outlook and Credit Facility
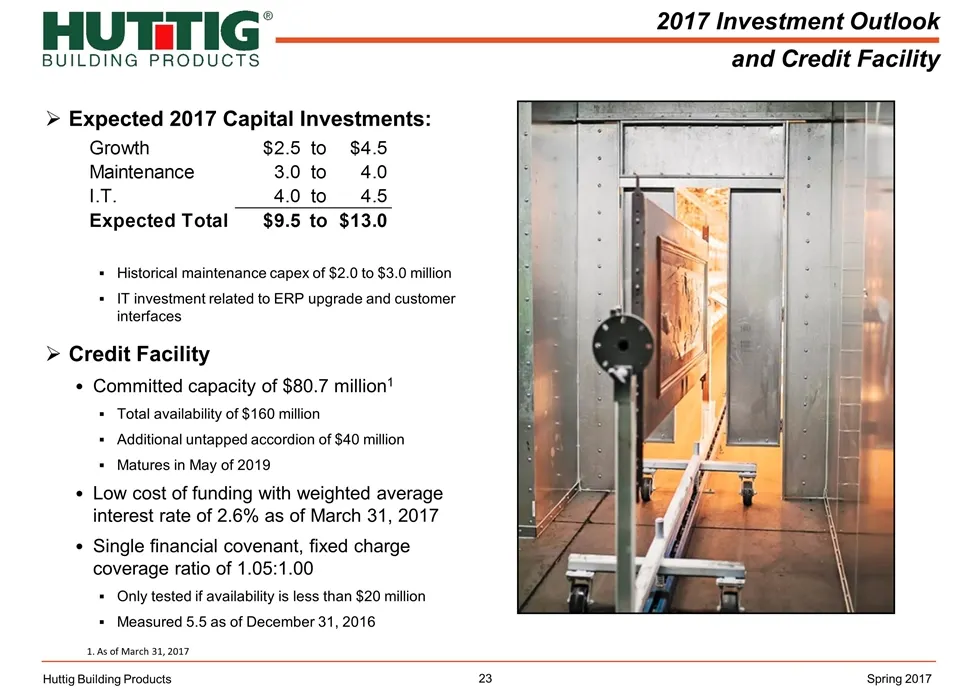
2017 Investment Outlook and Credit Facility Huttig Building Products Spring 2017 Expected 2017 Capital Investments: Historical maintenance capex of $2.0 to $3.0 million IT investment related to ERP upgrade and customer interfaces Credit Facility Committed capacity of $80.7 million1 Total availabilit
Slide 24: Summary
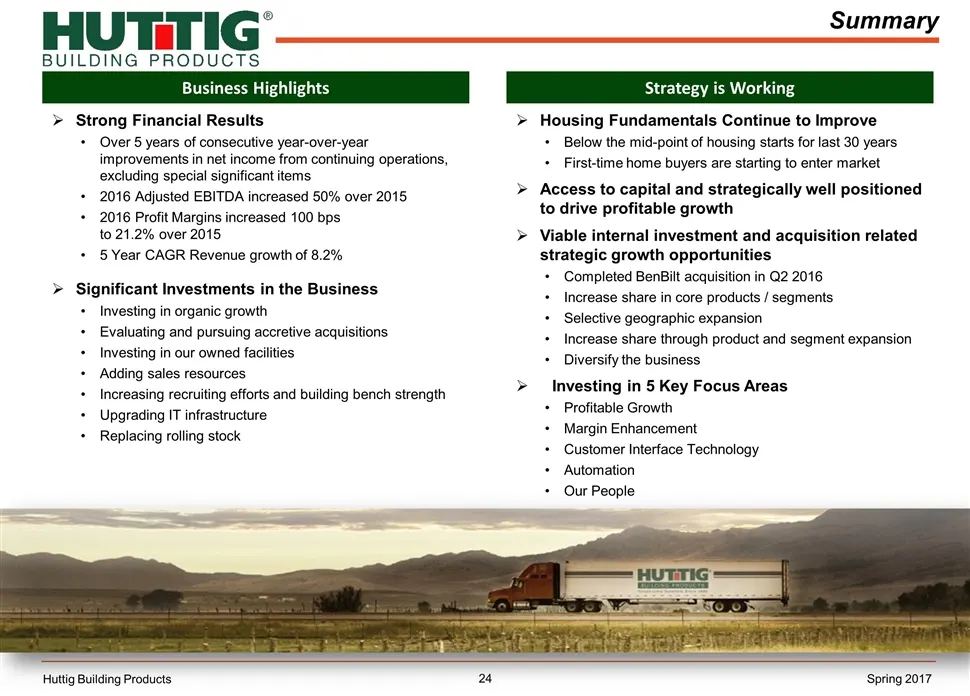
Summary Housing Fundamentals Continue to Improve Below the mid-point of housing starts for last 30 years First-time home buyers are starting to enter market Access to capital and strategically well positioned to drive profitable growth Viable internal investment and acquisition related strategic gro
Slide 25: Appendix
APPENDIX Huttig Building Products Spring 2017
Slide 26: Reconciliation of Adjusted EBITDA to Net Income
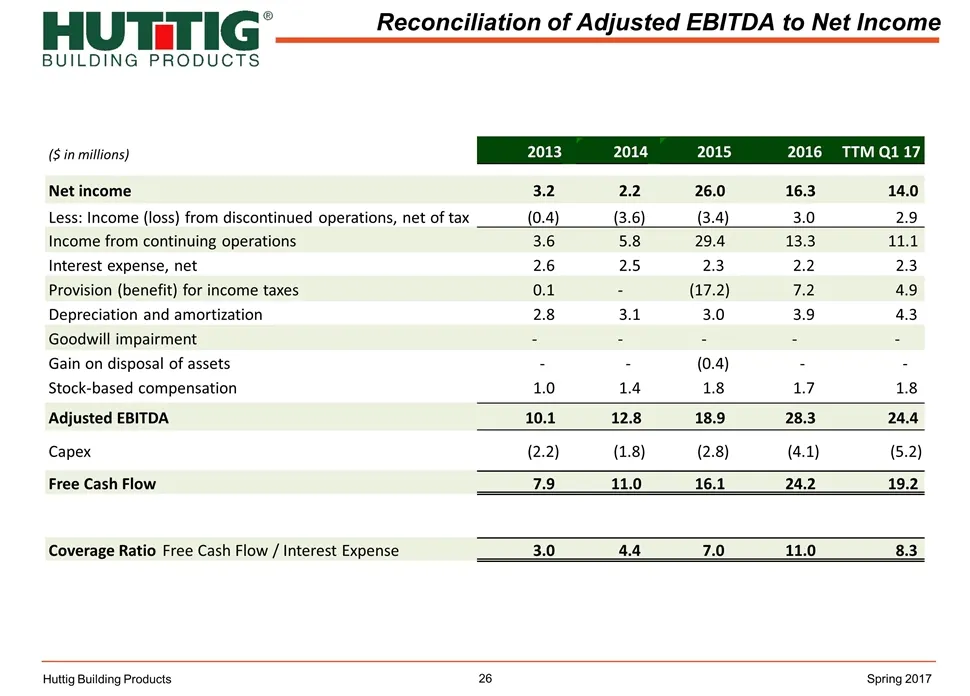
Reconciliation of Adjusted EBITDA to Net Income Huttig Building Products Spring 2017 ($ in millions) 2013 2014 2015 2016 TTM Q1 17 Net income 3.2 2.2 26.0 16.3 14.0 Less: Income (loss) from discontinued operations, net of tax (0.4) (3.6) (3.4) 3.0 2.9 Income from continuing operations 3.6 5.8 29.4 1
Source: SEC EDGAR · 8-K filed Jun 1, 2017
More decks from Huttig Building Products Inc
 Investor Presentation (November 2017)28 slides · Nov 14, 2017
 Investor Presentation (September 2017)25 slides · Sep 18, 2017
 Investor Presentation (March 2017)25 slides · Mar 31, 2017
 Investor Presentation (March 2017)24 slides · Mar 29, 2017
 Investor Presentation (September 2016)23 slides · Sep 13, 2016
 Investor Presentation (March 2016)27 slides · Mar 31, 2016