Uniphar PLC · EURONEXT:UPR
Uniphar — H1 2019 Earnings Presentation
29 slides from Uniphar's earnings presentation, Sep 17, 2019
Slide 1: H1 2019 Interim Results Presentation
H1 2019 Interim Results Presentation 17 September 2019 Connecting the Manufacturer to the Patient
Slide 2: Important Notice
Important Notice This presentation has been prepared solely in connection with the financial results of Uniphar plc (the "Company") for the period ended 30 June 2019 and should be read in conjunction with the announcement of the financial results of the Company for the period ended 30 June 2019, rel
Slide 3: Agenda and Presenters
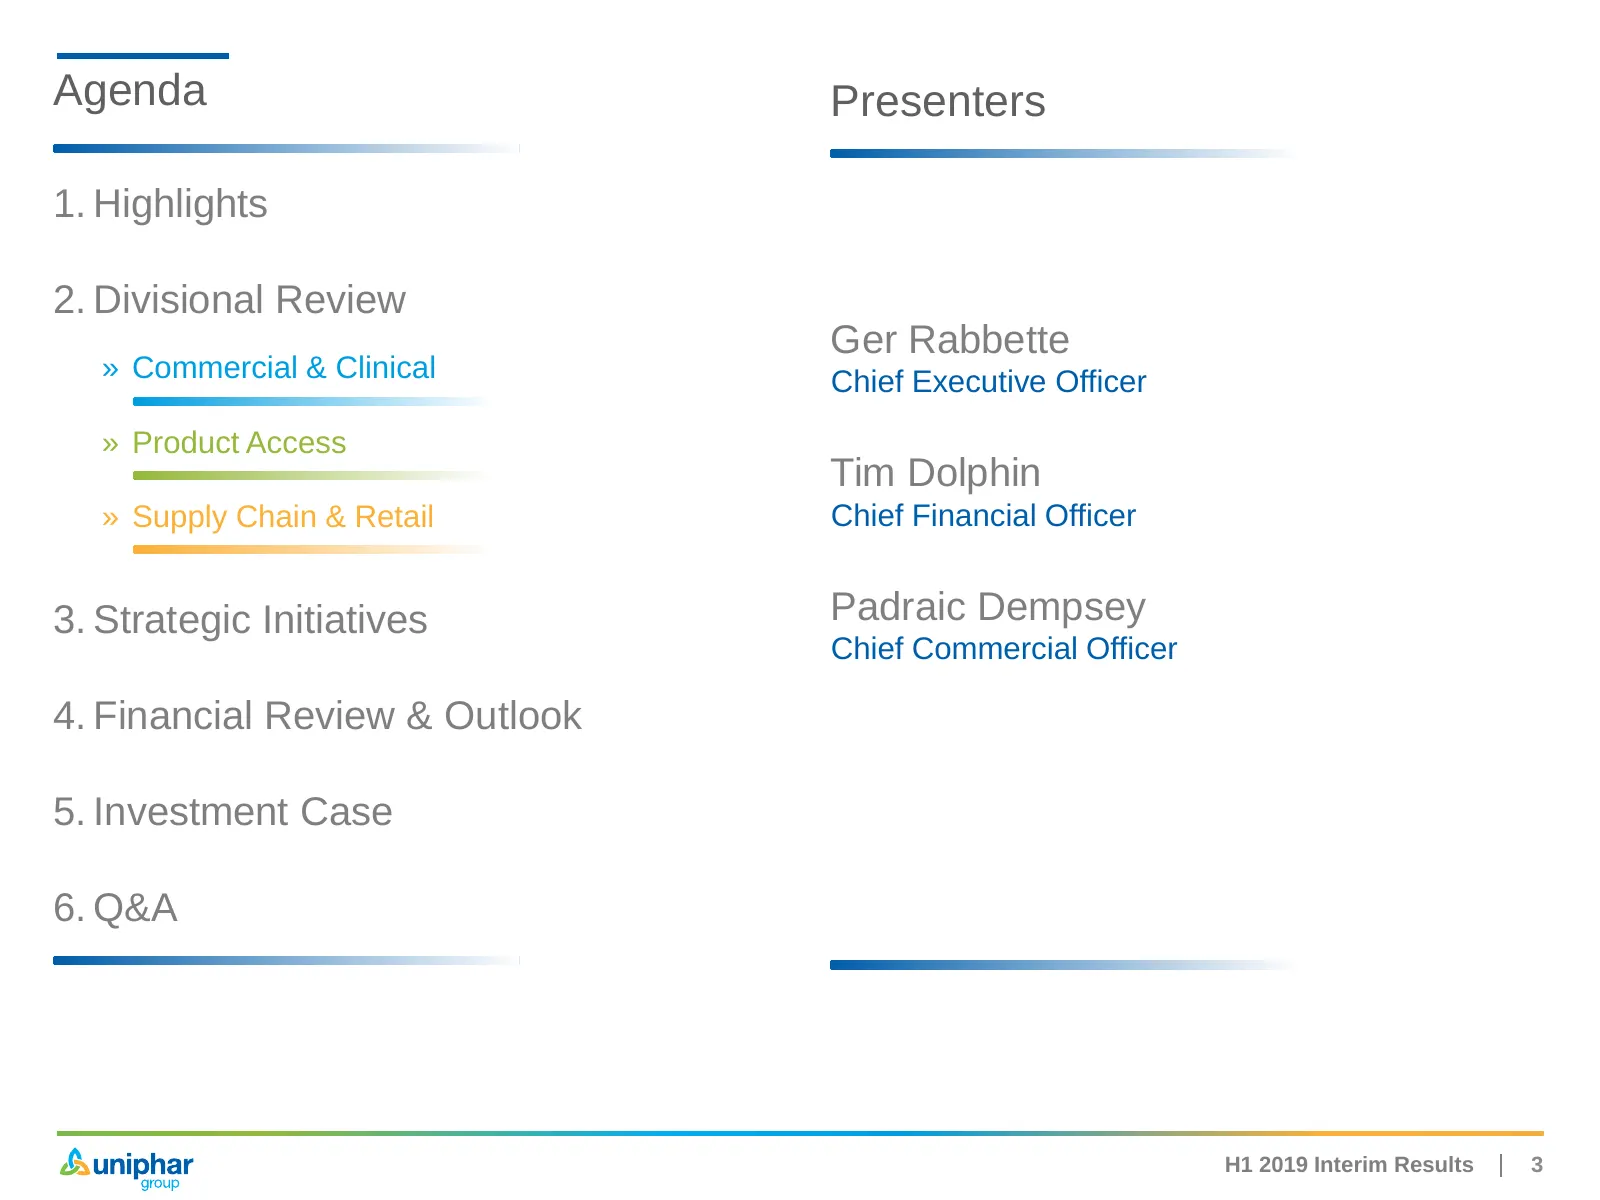
Agenda Presenters 1. Highlights 2. Divisional Review Ger Rabbette » Commercial & Clinical Chief Executive Officer » Product Access Tim Dolphin » Supply Chain & Retail Chief Financial Officer 3. Strategic Initiatives Padraic Dempsey Chief Commercial Officer 4. Financial Review & Outlook 5. Investment
Slide 4: Highlights
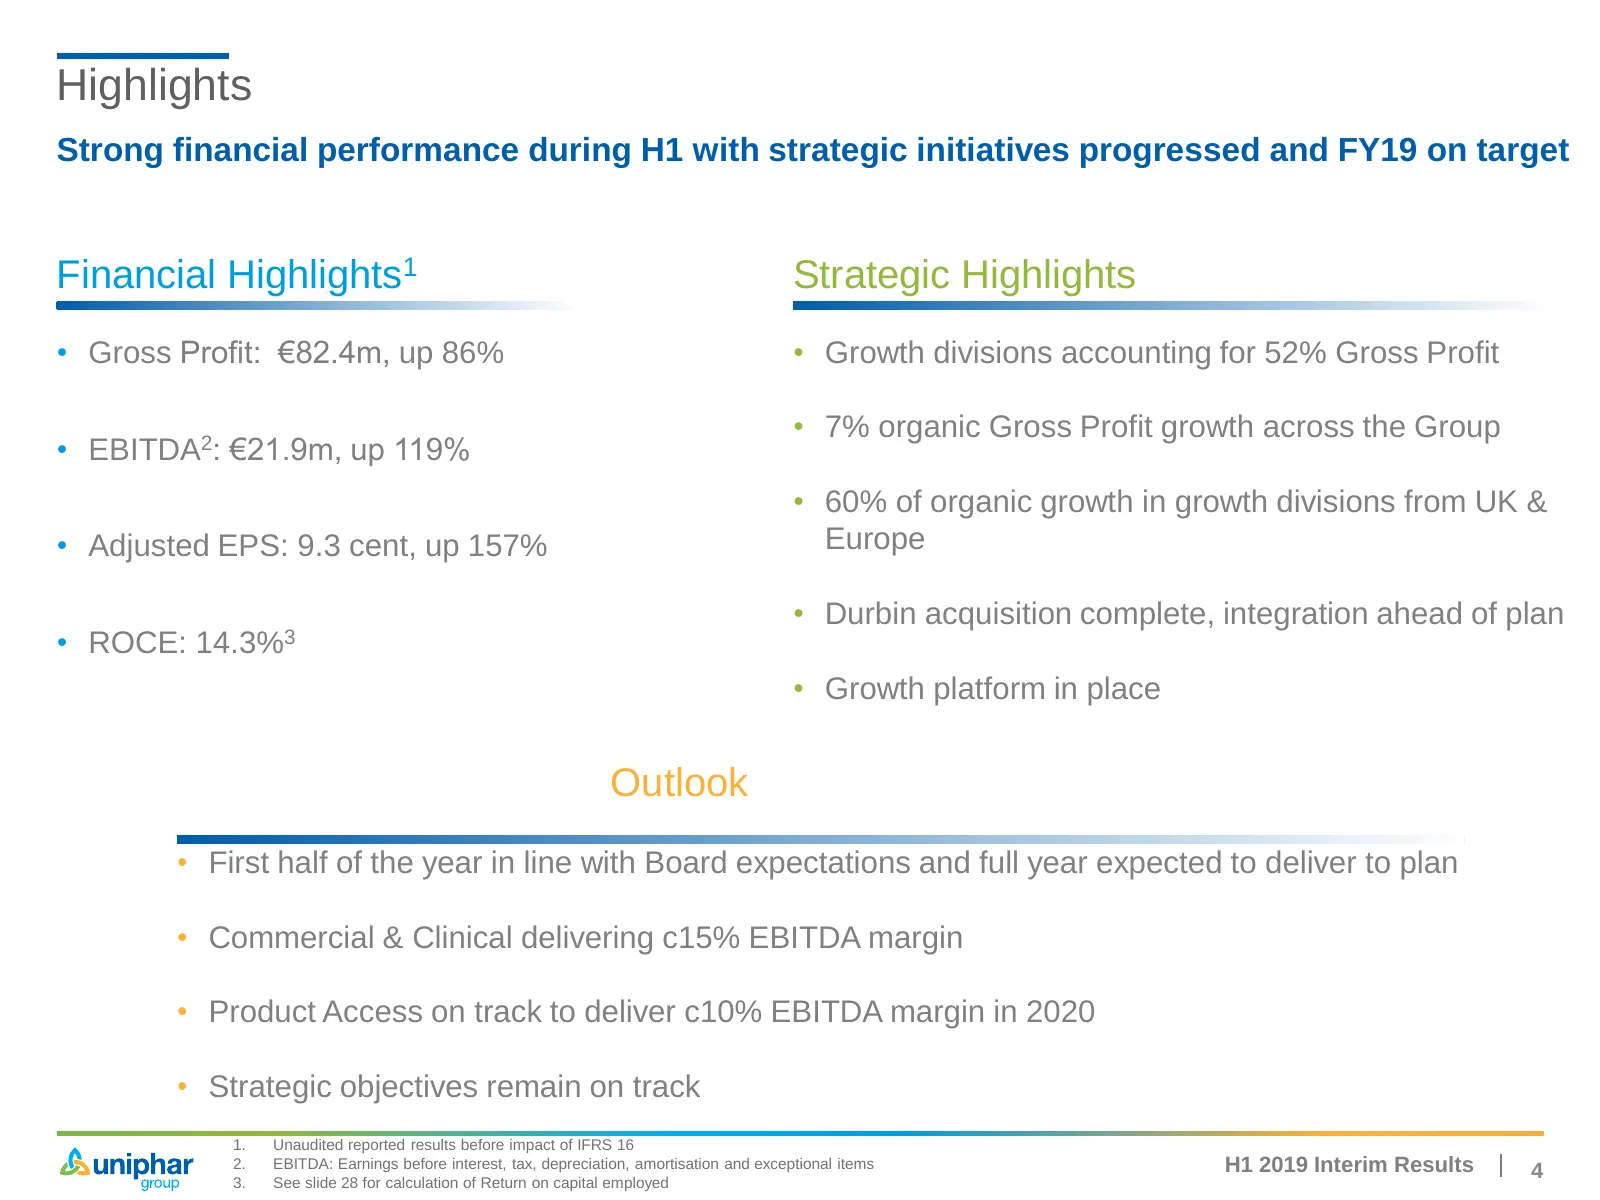
Highlights Strong financial performance during H1 with strategic initiatives progressed and FY19 on target Financial Highlights1 Strategic Highlights • Gross Profit: €82.4m, up 86% • Growth divisions accounting for 52% Gross Profit • 7% organic Gross Profit growth across the Group • EBITDA2: €21.9m,

Slide 5: Divisional Review
Divisional Review 5
Slide 6: Commercial & Clinical - H1 2019
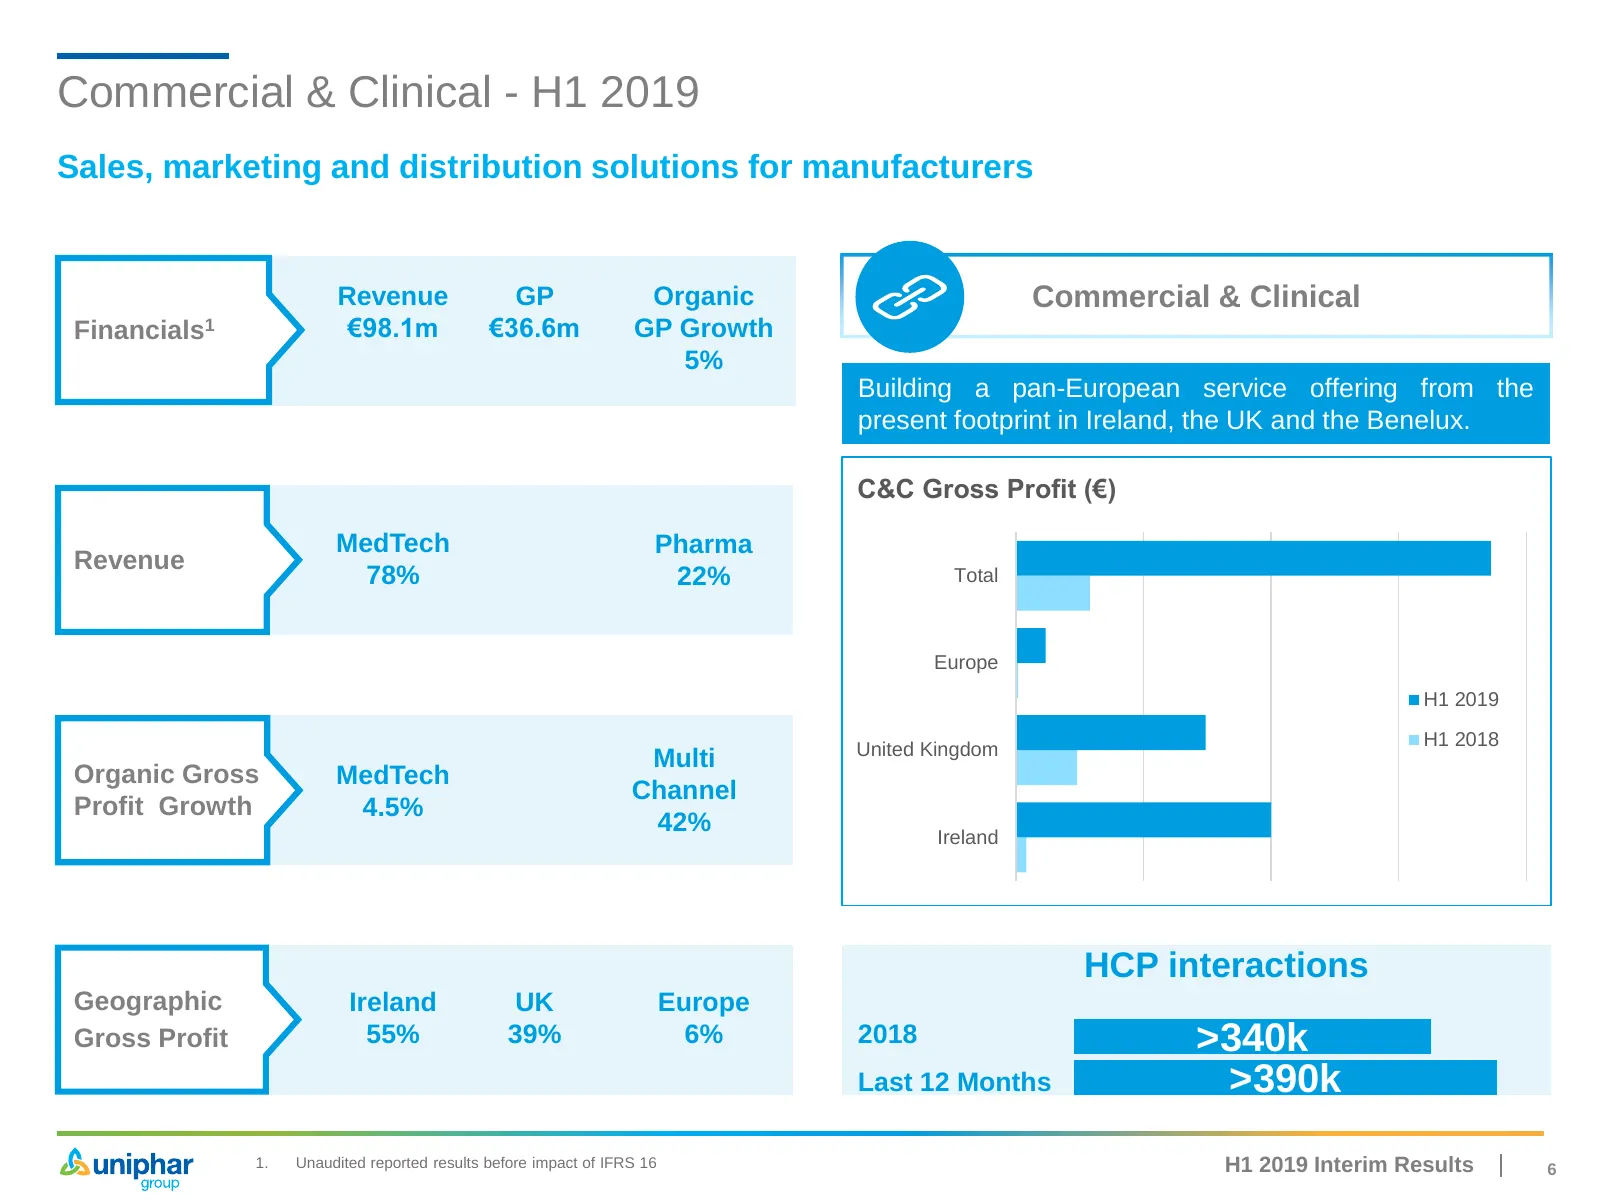
Commercial & Clinical - H1 2019 Sales, marketing and distribution solutions for manufacturers Revenue GP Organic Commercial & Clinical Financials1 €98.1m €36.6m GP Growth 5% Building a pan-European service offering from the present footprint in Ireland, the UK and the Benelux. C&C Gross Profit (€) M
Slide 7: Product Access - H1 2019
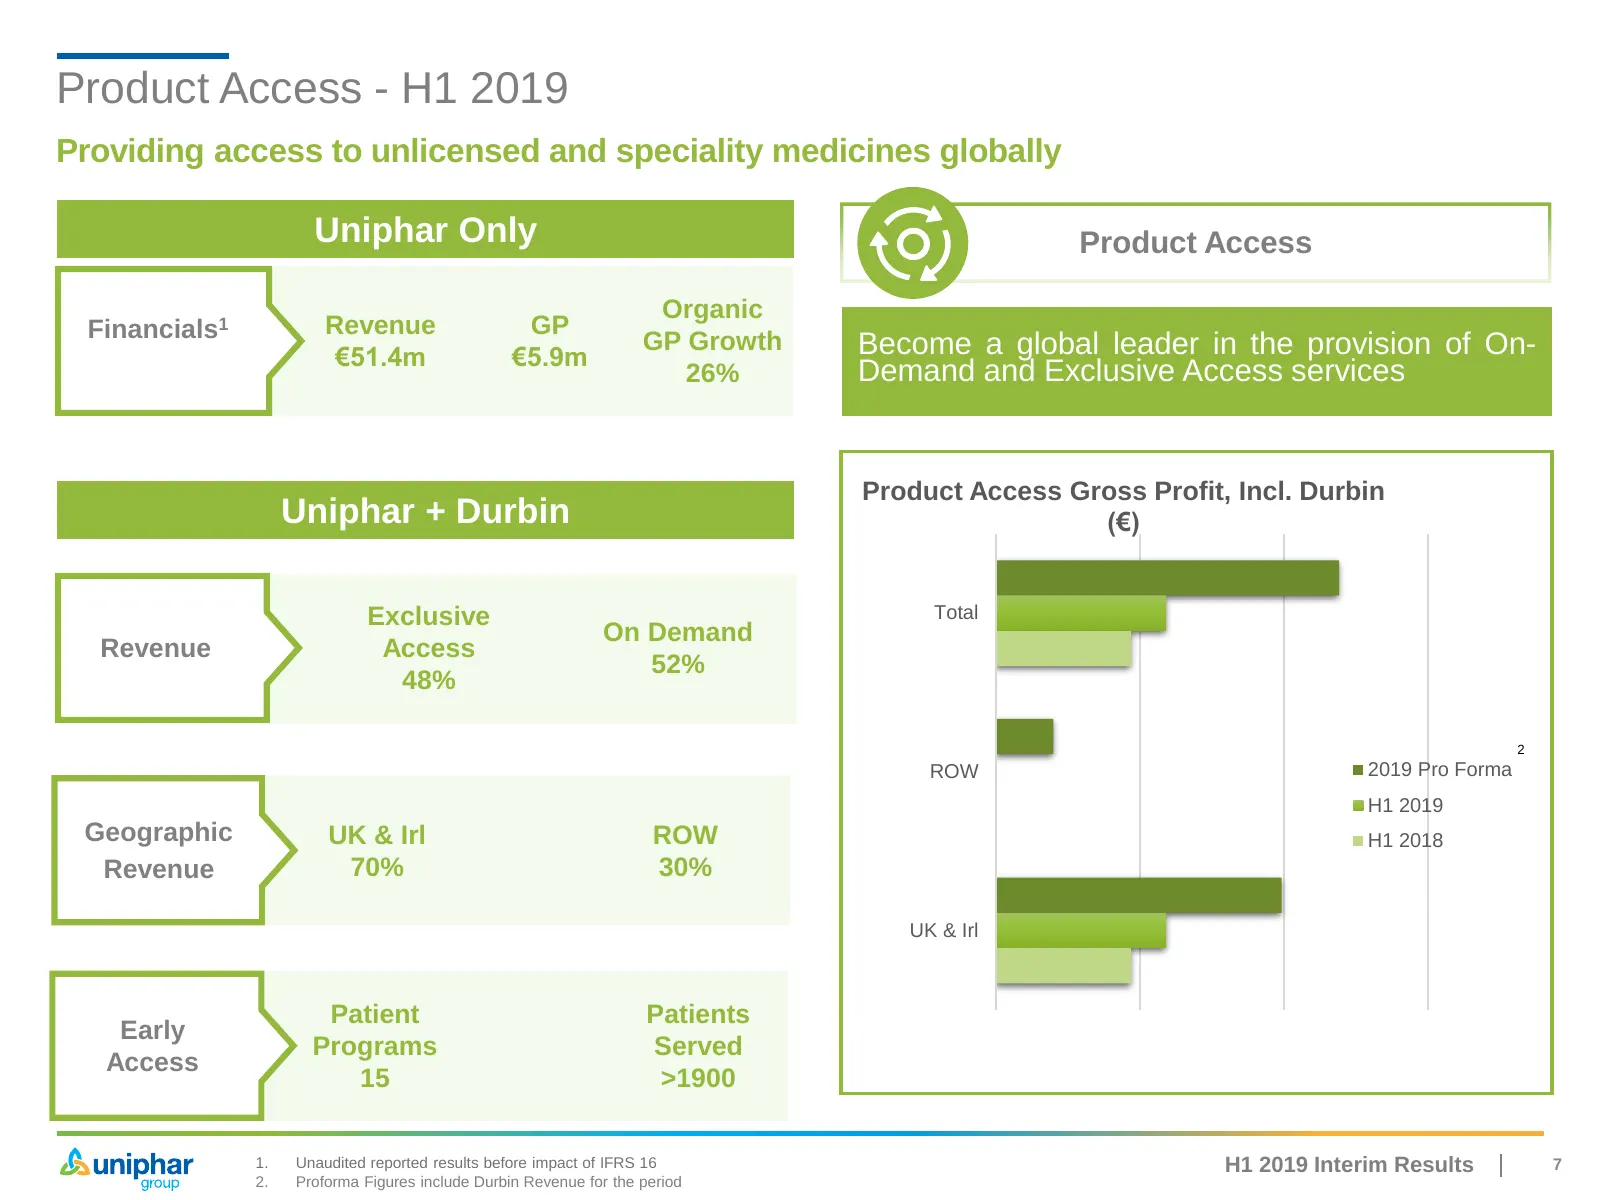
Product Access - H1 2019 Providing access to unlicensed and speciality medicines globally Uniphar Only Product Access Organic Financials1 Revenue GP GP Growth Become a global leader in the provision of On- €51.4m €5.9m 26% Demand and Exclusive Access services Product Access Gross Profit, Incl. Durbi
Slide 8: Supply Chain & Retail - H1 2019
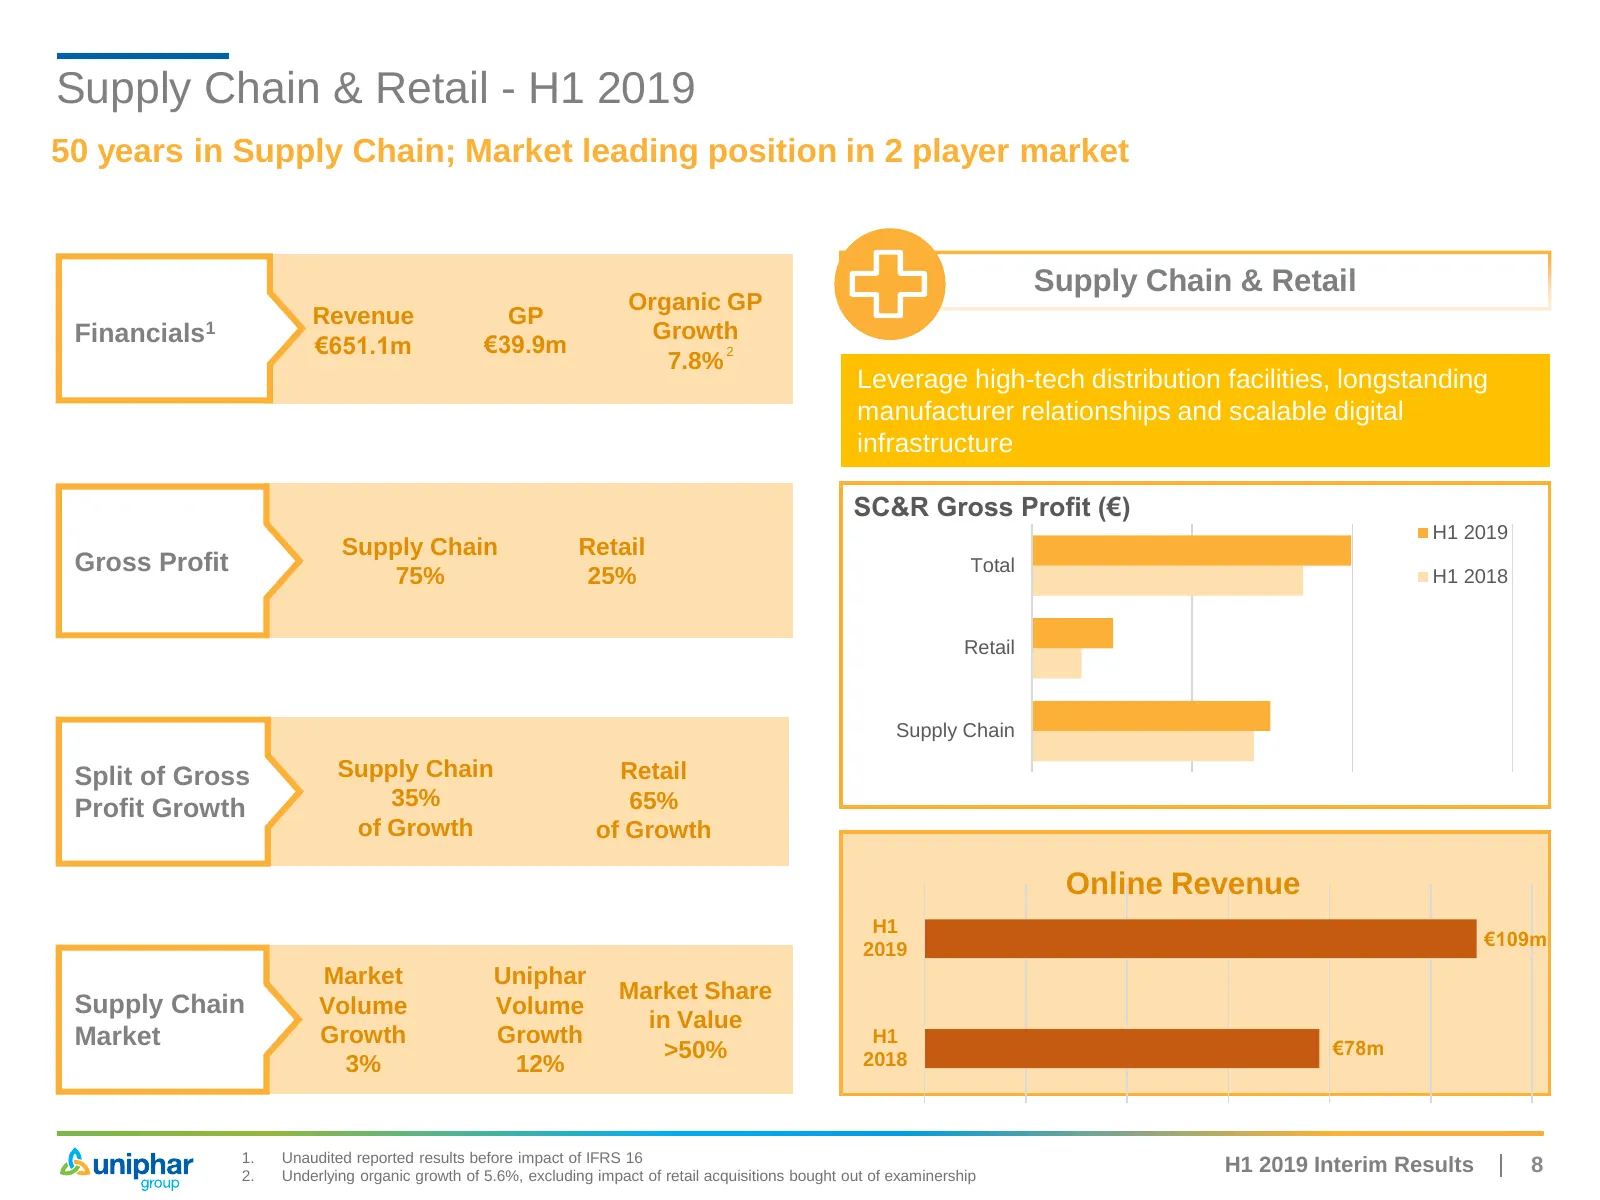
Supply Chain & Retail - H1 2019 50 years in Supply Chain; Market leading position in 2 player market Supply Chain & Retail Organic GP Revenue GP Financials1 €651.1m €39.9m Growth 2 7.8% Leverage high-tech distribution facilities, longstanding manufacturer relationships and scalable digital infrastru

Slide 9: Strategic Initiatives
Strategic Initiatives 9
Slide 10: Strategic Initiatives
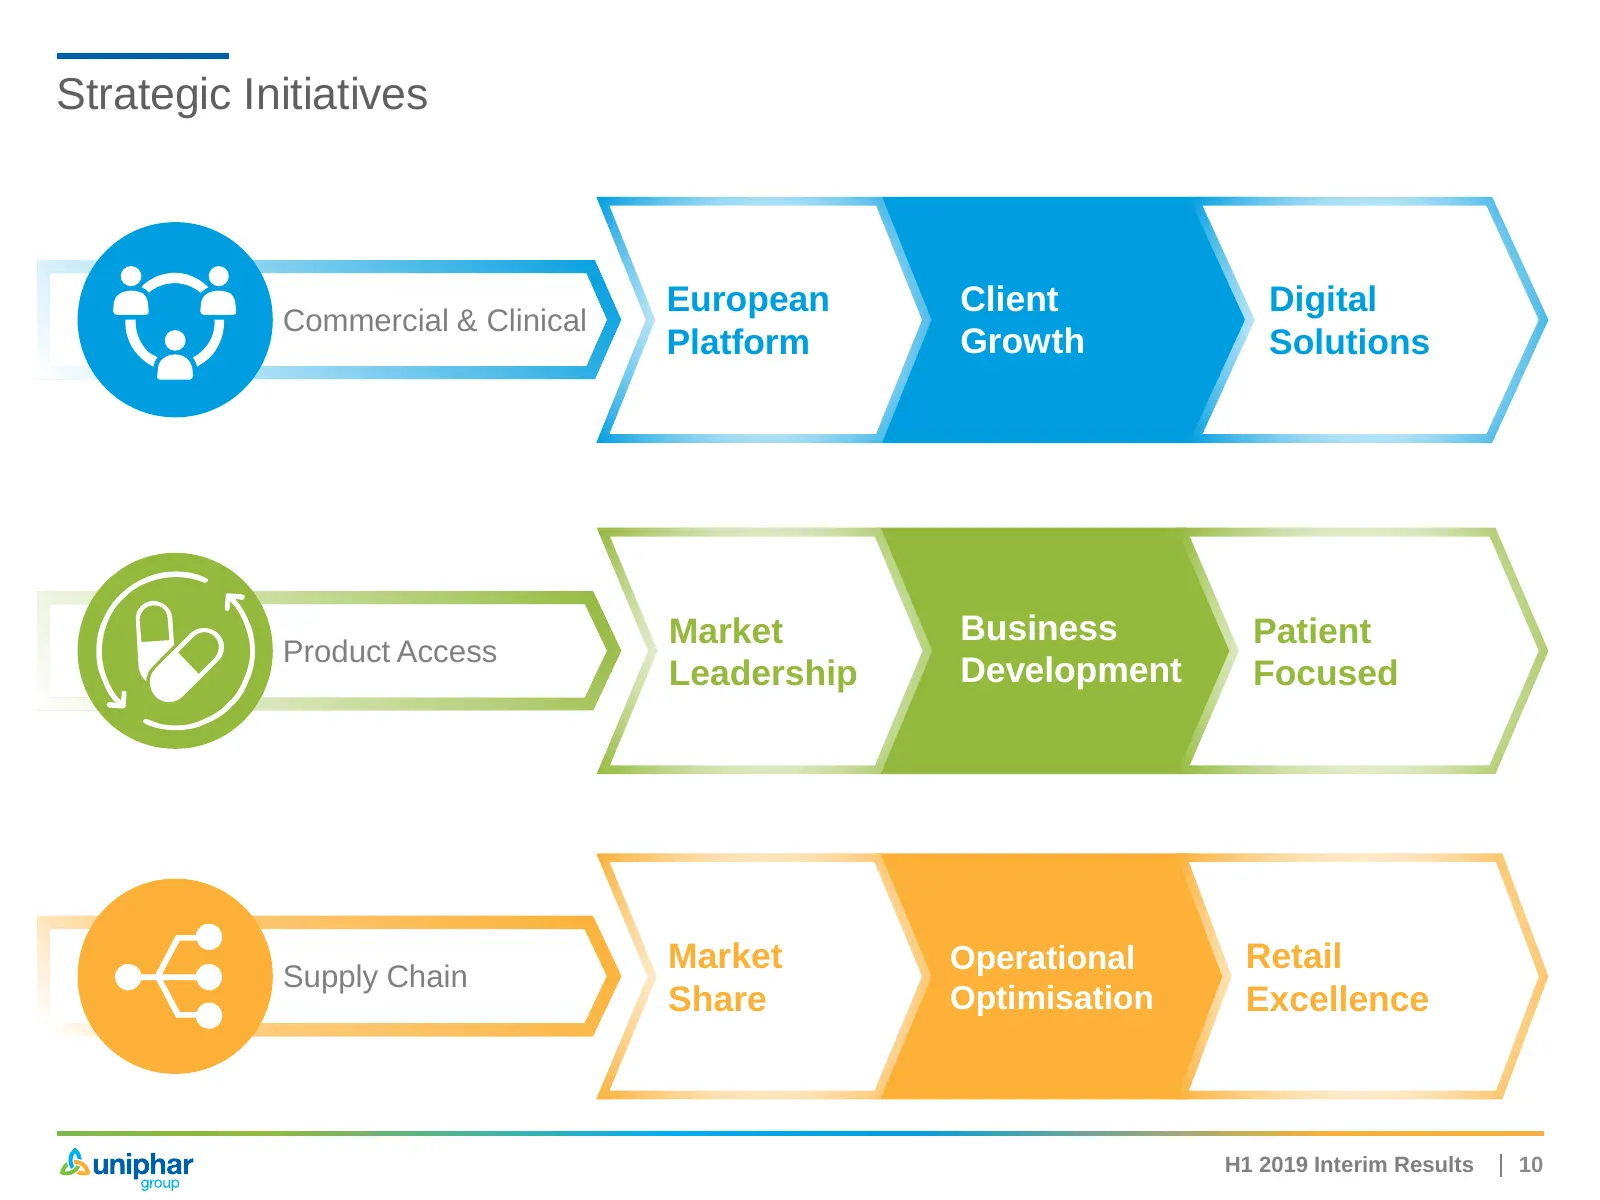
Strategic Initiatives European Client Digital Commercial & Clinical Platform Growth Solutions Market Business Patient Product Access Leadership Development Focused Market Operational Retail Supply Chain Share Optimisation Excellence H1 2019 Interim Results 10
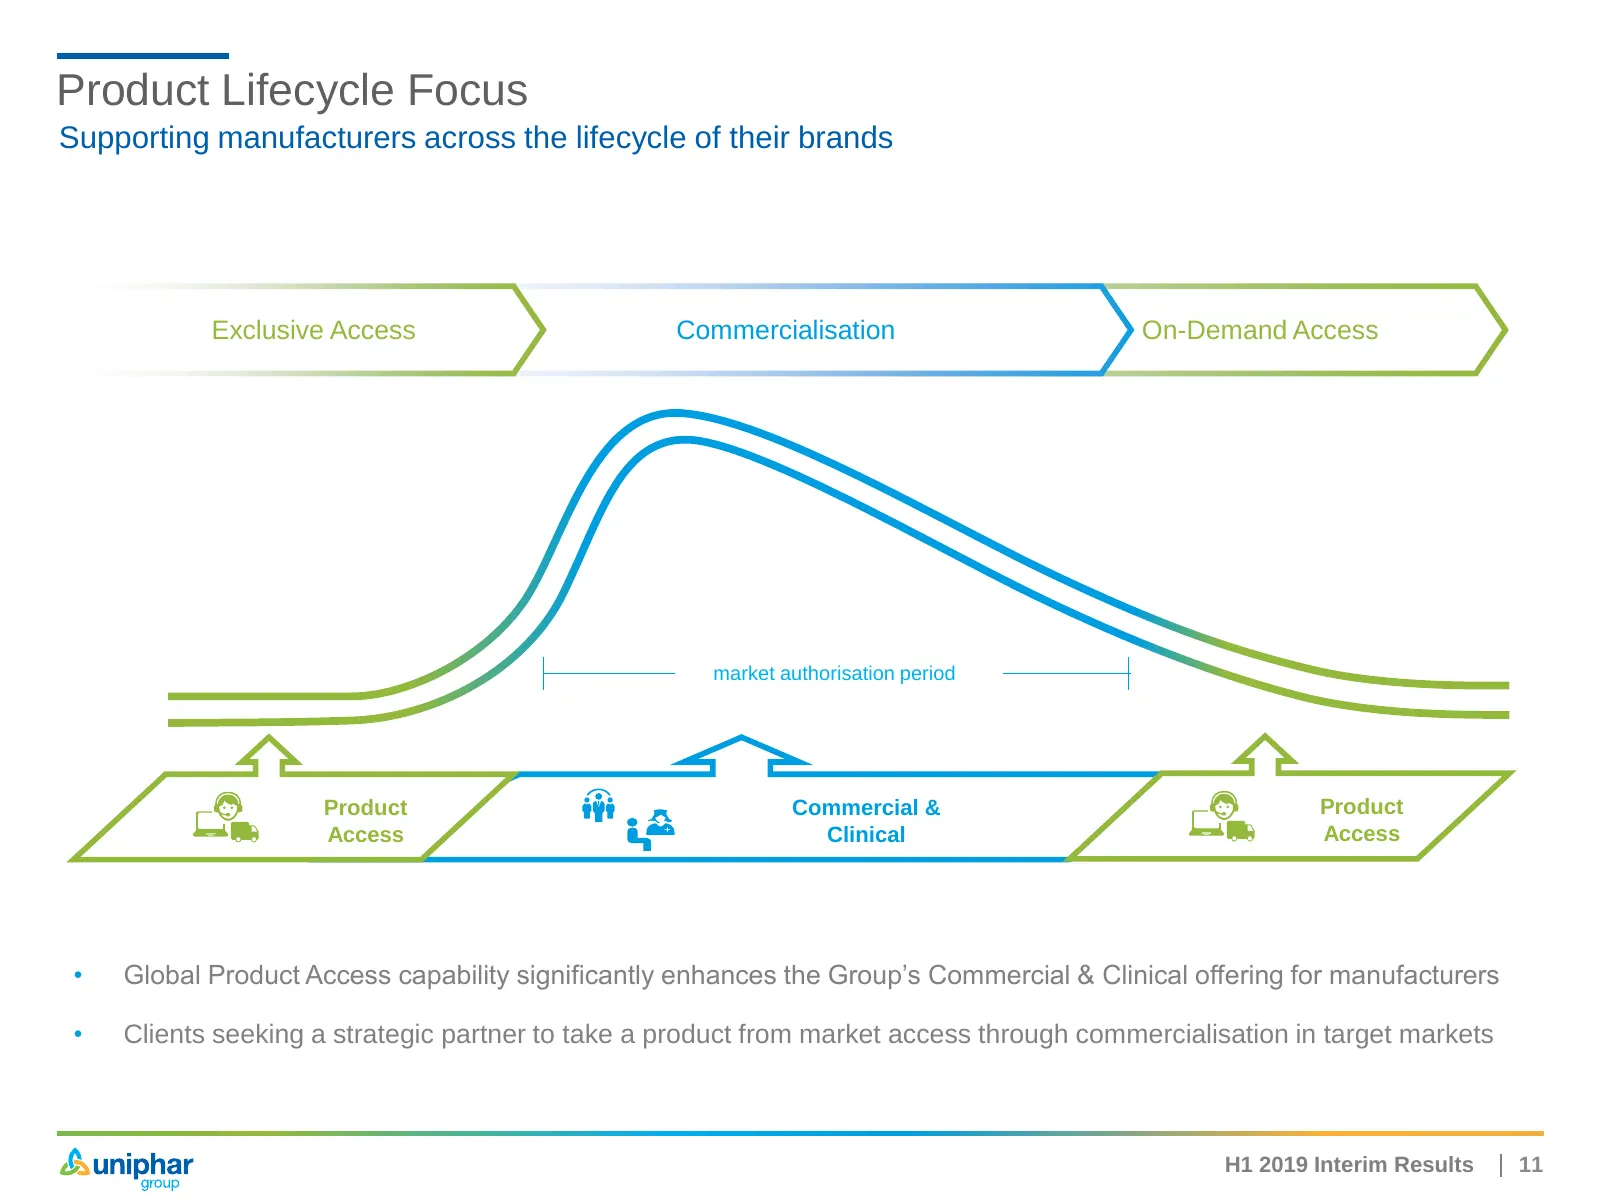
Slide 11: Product Lifecycle Focus
Product Lifecycle Focus Supporting manufacturers across the lifecycle of their brands Exclusive Access Commercialisation On-Demand Access market authorisation period Product Commercial & Product Access Clinical Access • Global Product Access capability significantly enhances the Group’s Commercial &
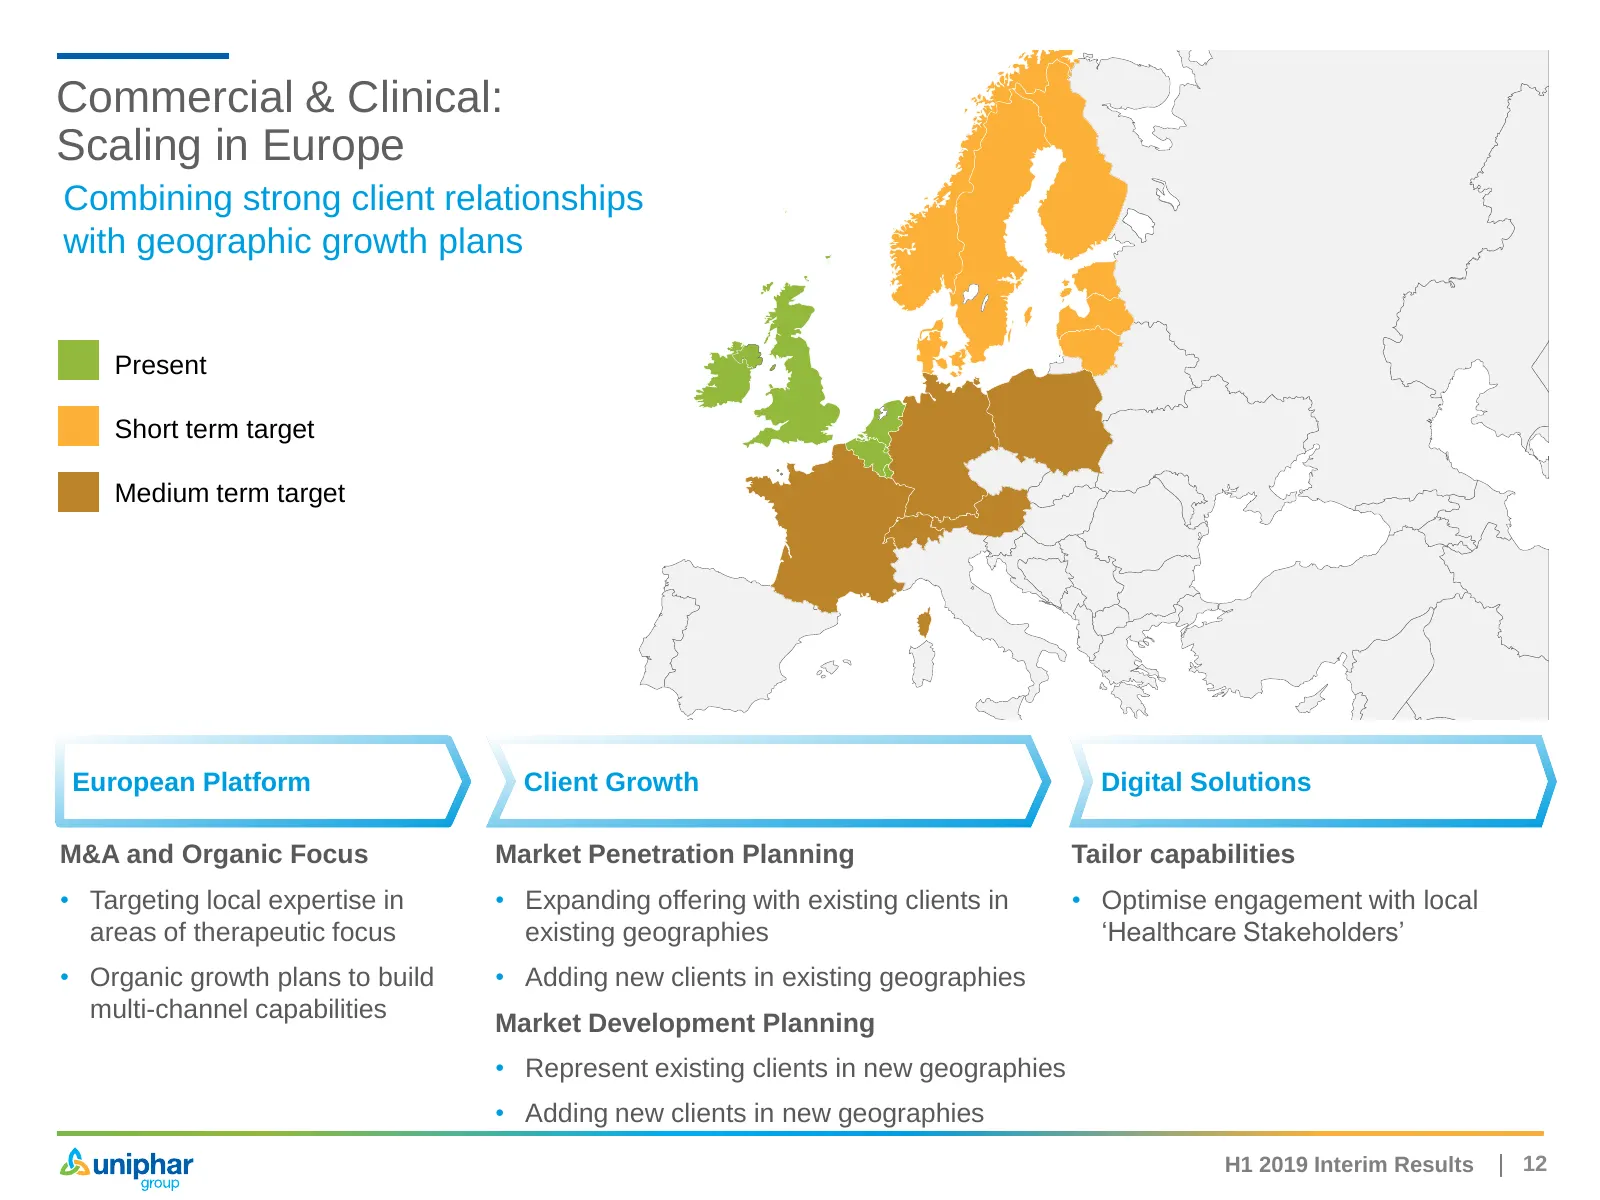
Slide 12: Commercial & Clinical: Scaling in Europe
Commercial & Clinical: Scaling in Europe Combining strong client relationships with geographic growth plans Present Short term target Medium term target European Platform Client Growth Digital Solutions M&A and Organic Focus Market Penetration Planning Tailor capabilities • Targeting local expertise
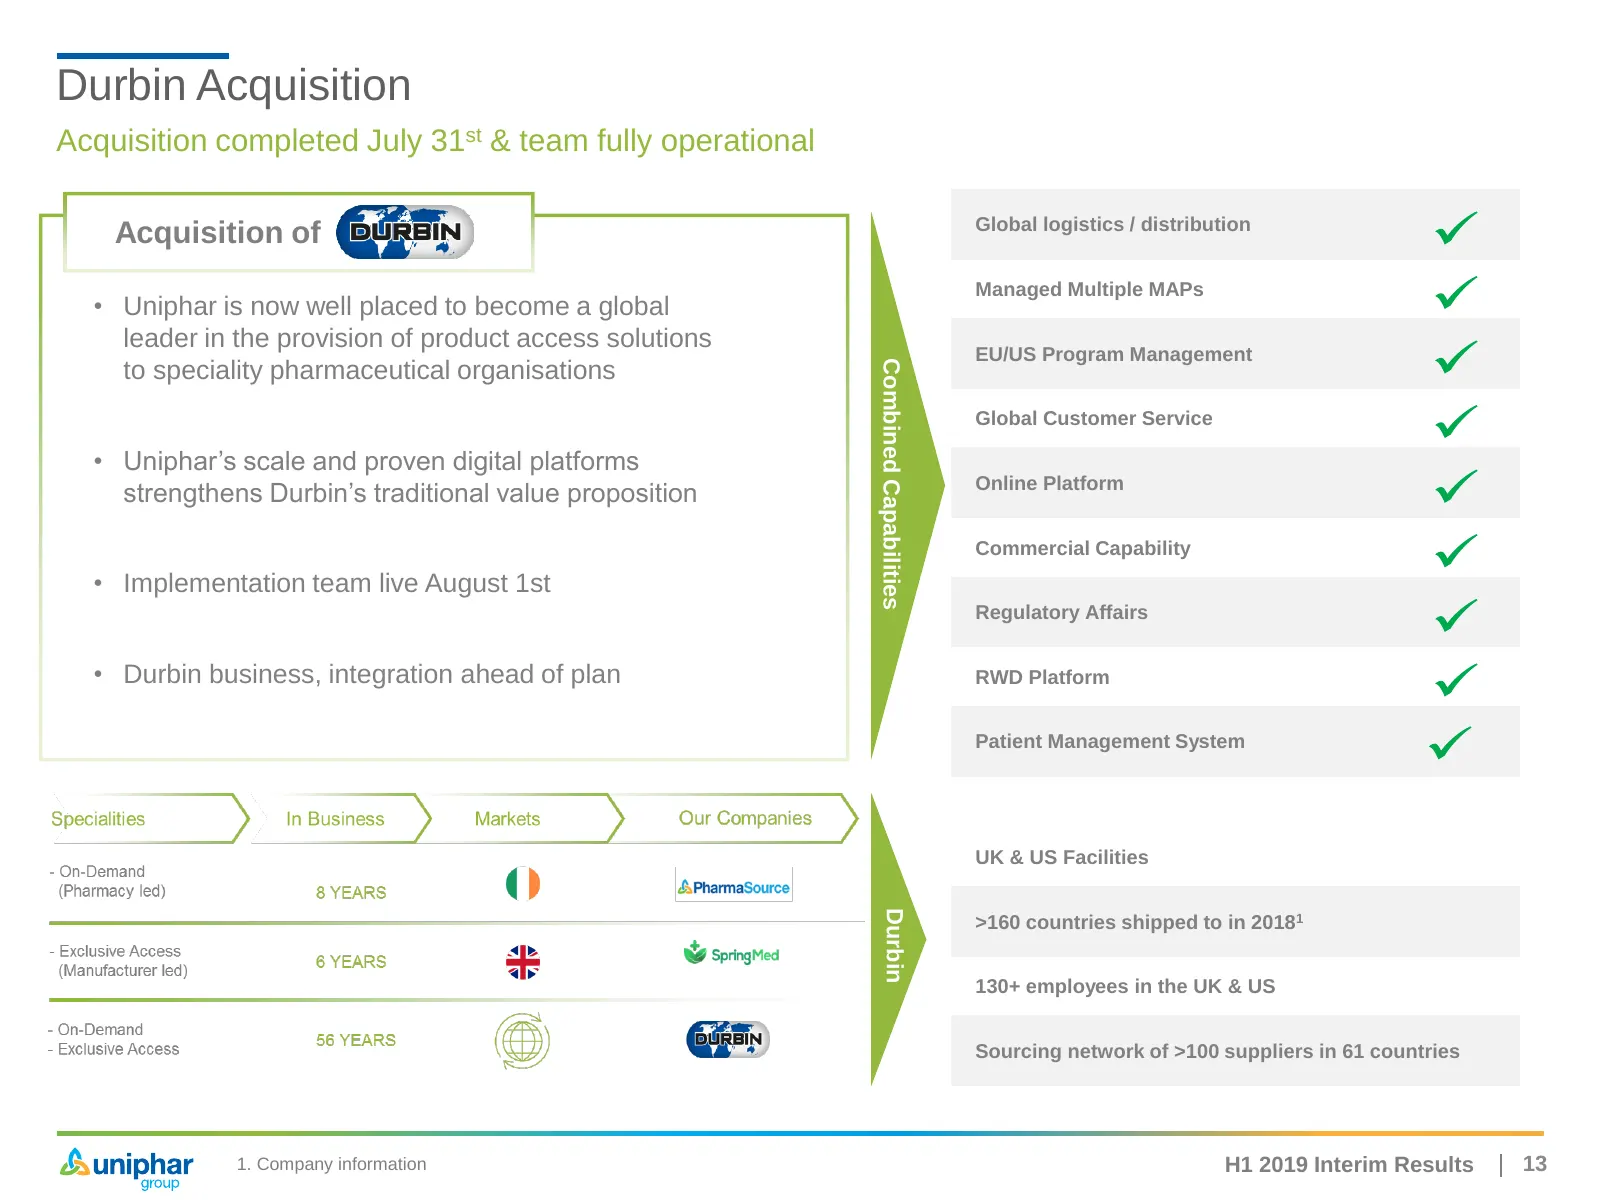
Slide 13: Durbin Acquisition: Combined Capabilities
Durbin Acquisition Acquisition completed July 31st & team fully operational Global logistics / distribution Acquisition of Managed Multiple MAPs • Uniphar is now well placed to become a global leader in the provision of product access solutions EU/US Program Management Combined Capabilities to speci
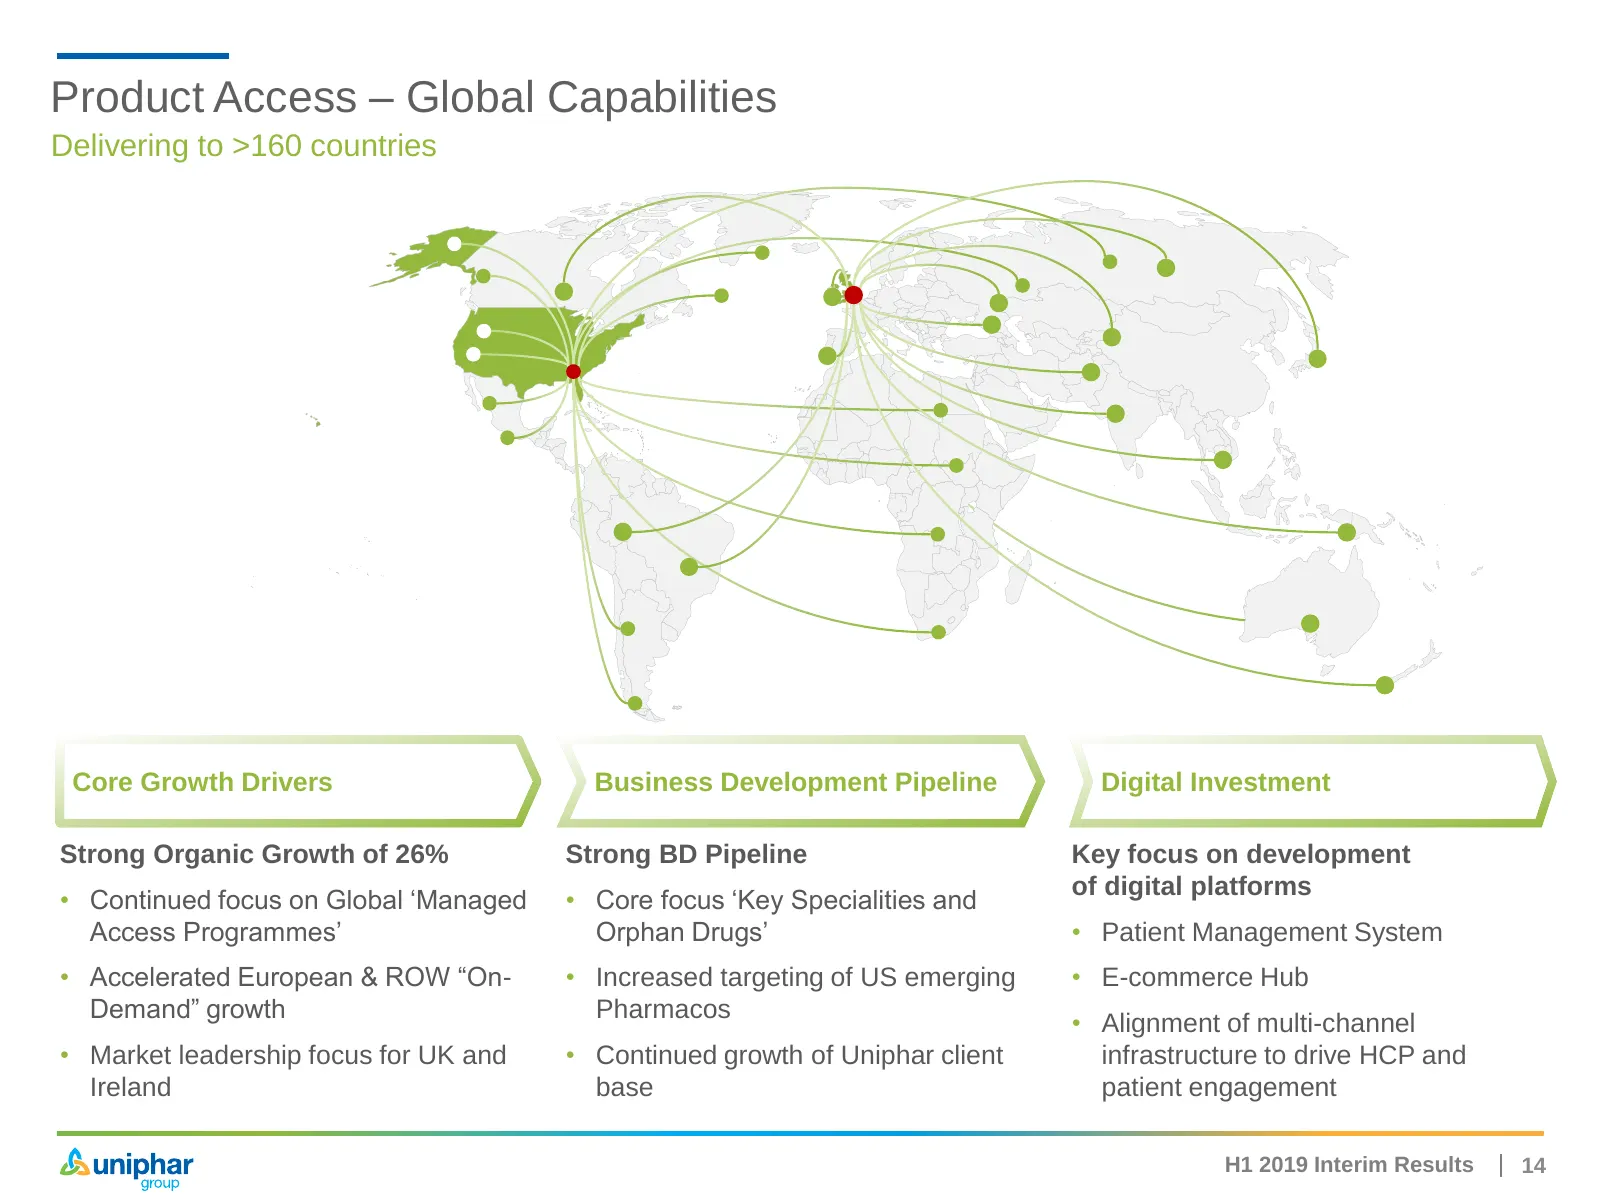
Slide 14: Product Access – Global Capabilities
Product Access – Global Capabilities Delivering to >160 countries Core Growth Drivers Business Development Pipeline Digital Investment Strong Organic Growth of 26% Strong BD Pipeline Key focus on development of digital platforms • Continued focus on Global ‘Managed • Core focus ‘Key Specialities and
Slide 15: Exclusive Access Focused on Speciality & Orphan Diseases
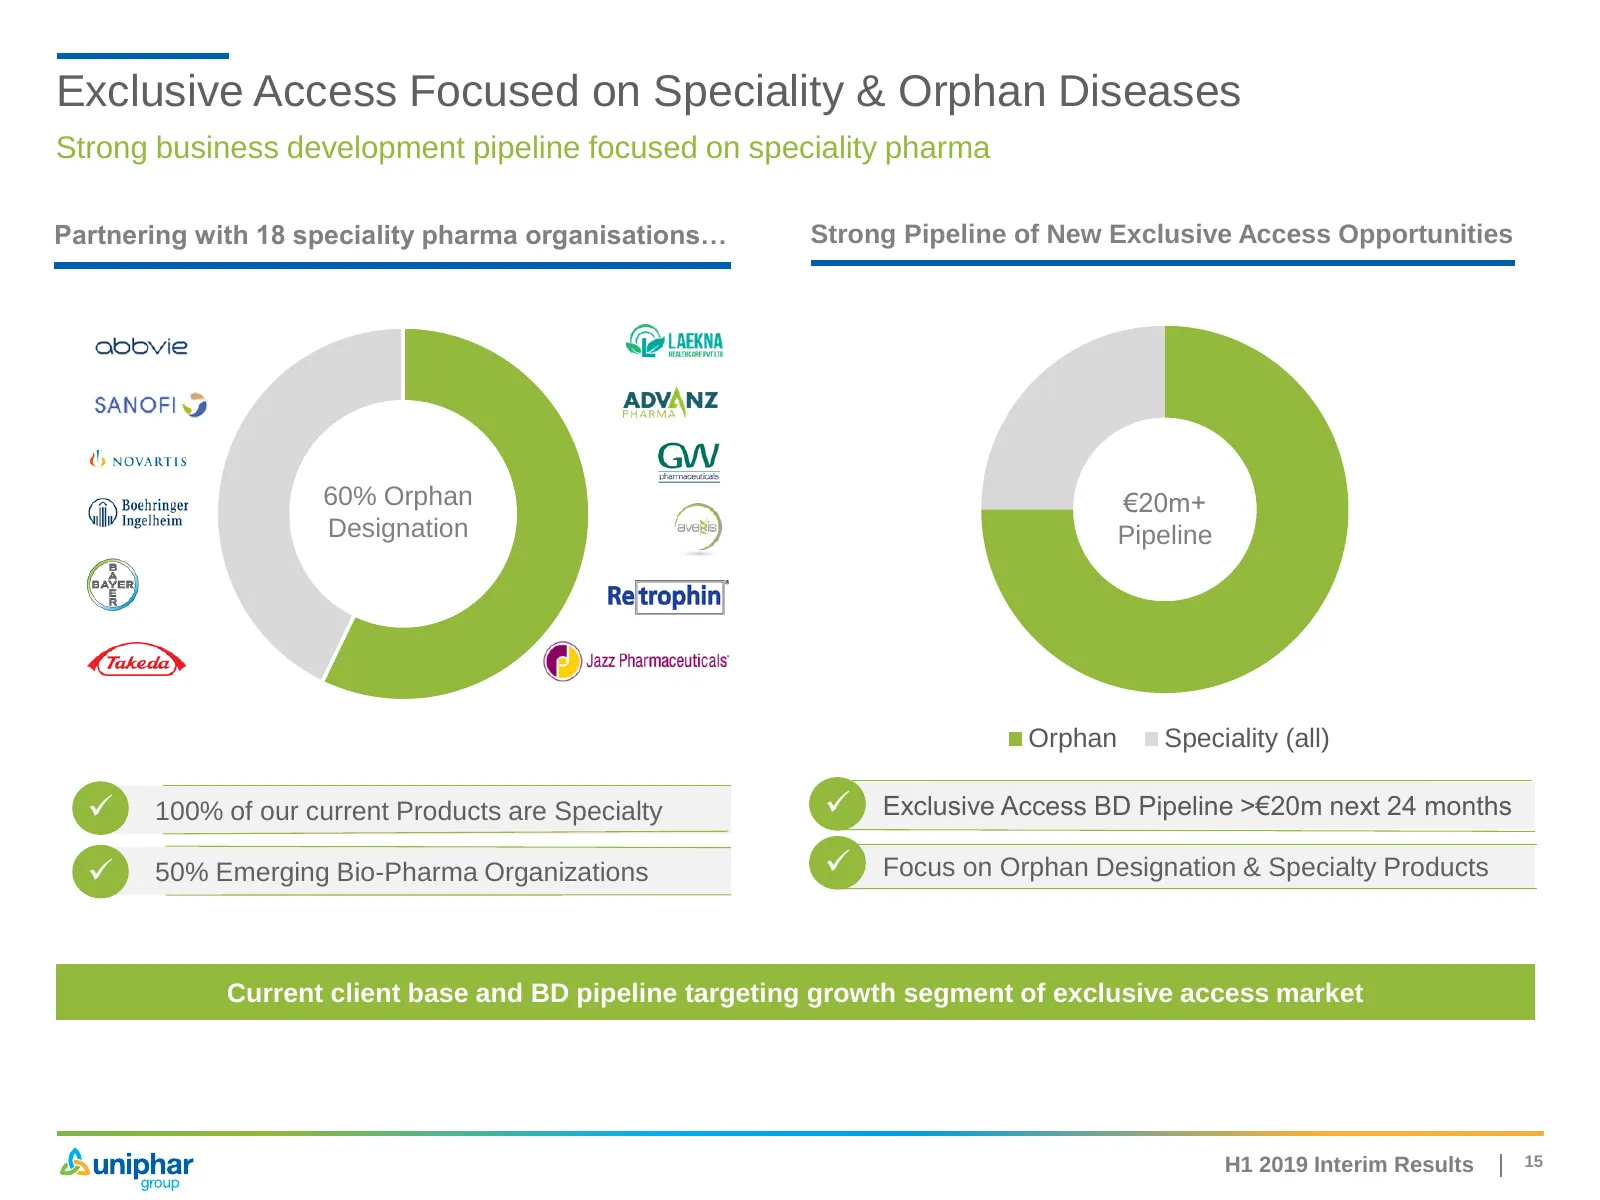
Exclusive Access Focused on Speciality & Orphan Diseases Strong business development pipeline focused on speciality pharma Partnering with 18 speciality pharma organisations… Strong Pipeline of New Exclusive Access Opportunities 60% Orphan €20m+ Designation Pipeline Orphan Speciality (all) ✓ 100% of
Slide 16: Financial Review & Outlook
Financial Review & Outlook 16
Slide 17: Financial Highlights
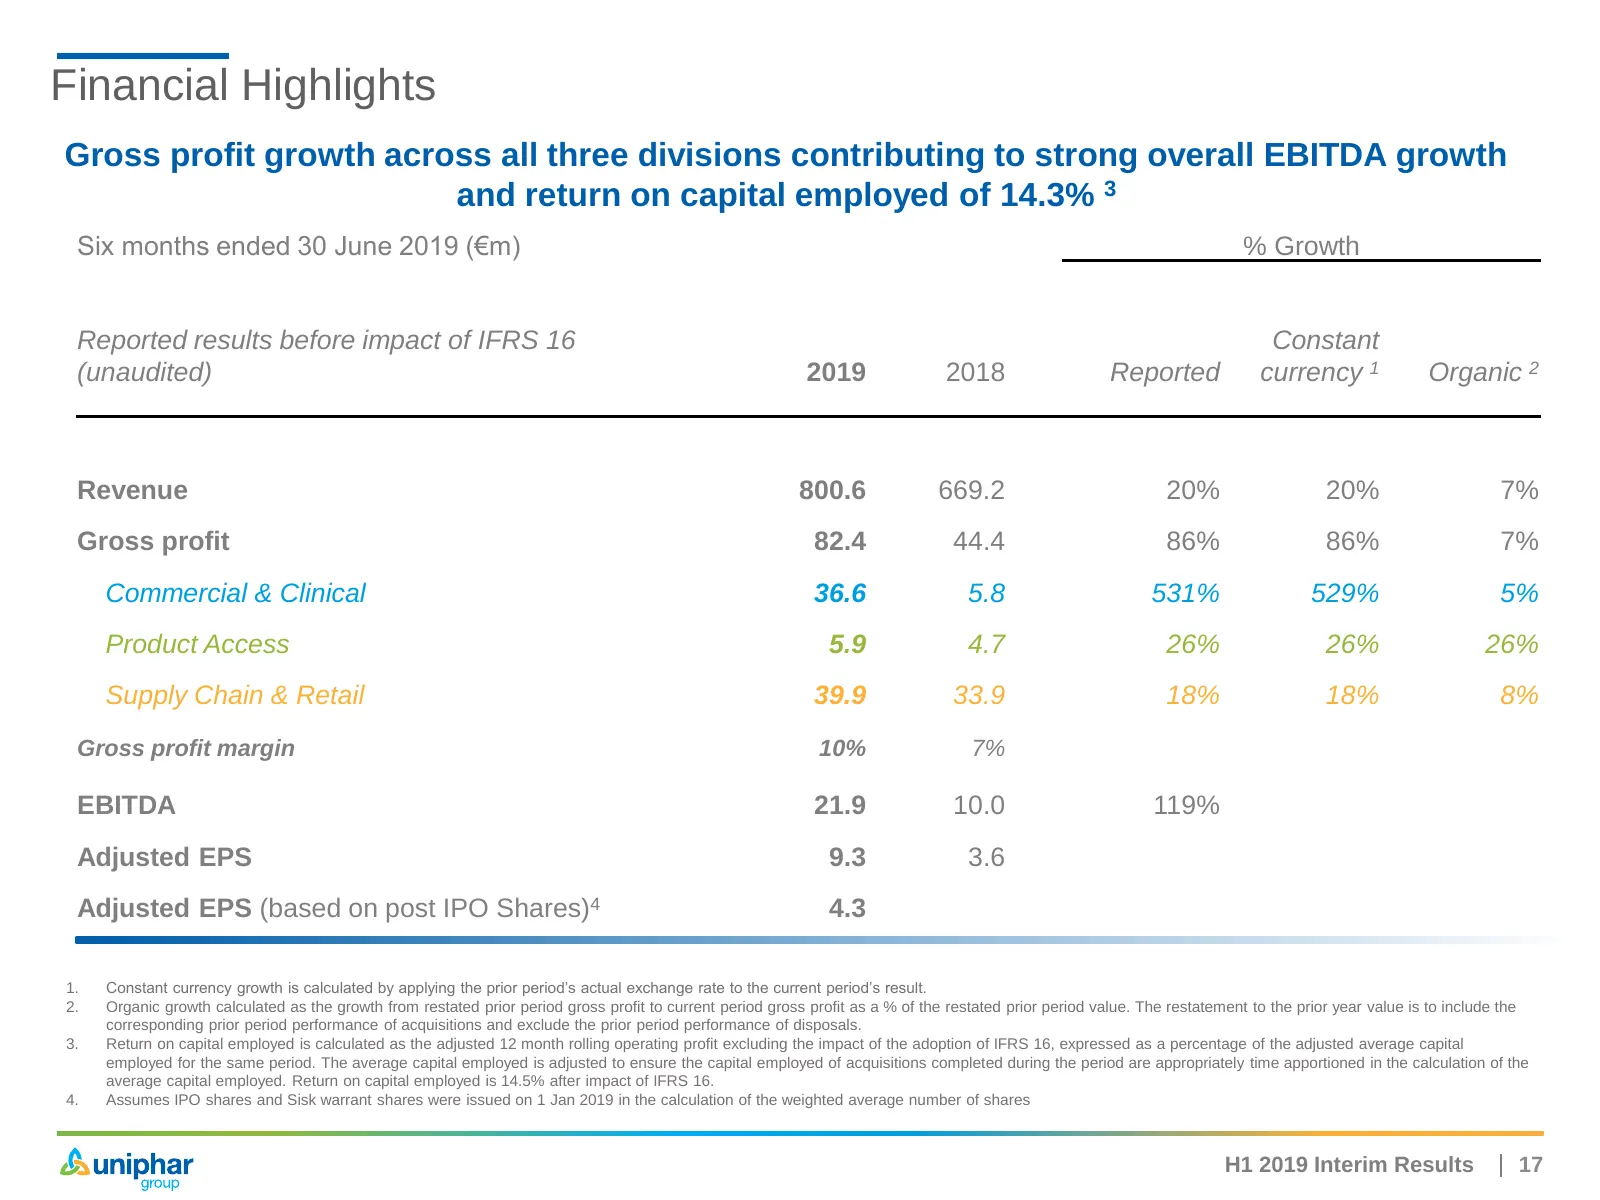
Financial Highlights Gross profit growth across all three divisions contributing to strong overall EBITDA growth and return on capital employed of 14.3% 3 Six months ended 30 June 2019 (€m) % Growth Reported results before impact of IFRS 16 Constant (unaudited) 2019 2018 Reported currency 1 Organic
Slide 18: Net Bank Debt Analysis
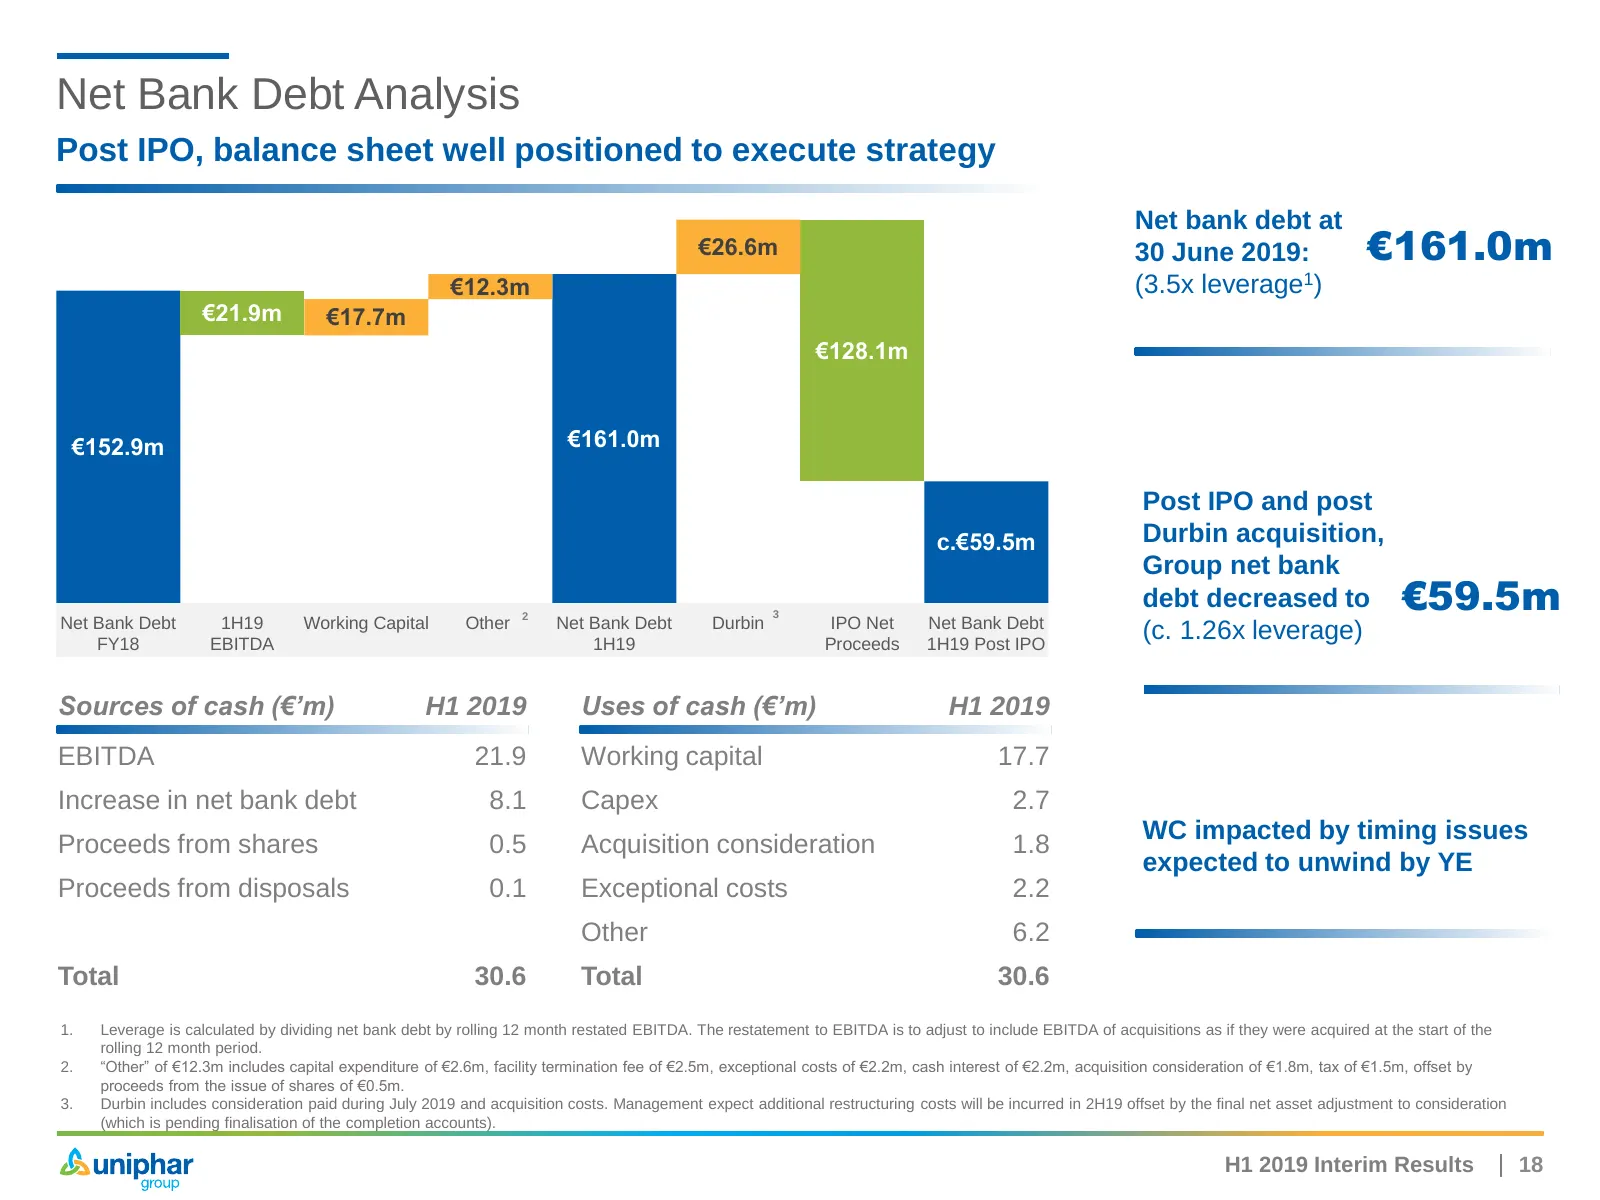
Net Bank Debt Analysis Post IPO, balance sheet well positioned to execute strategy Net bank debt at €26.6m 30 June 2019: €161.0m €12.3m (3.5x leverage1) €21.9m €17.7m €128.1m €152.9m €161.0m Post IPO and post c.€59.5m Durbin acquisition, Group net bank 2 3 debt decreased to €59.5m Net Bank Debt 1H19
Slide 19: Gross Profit
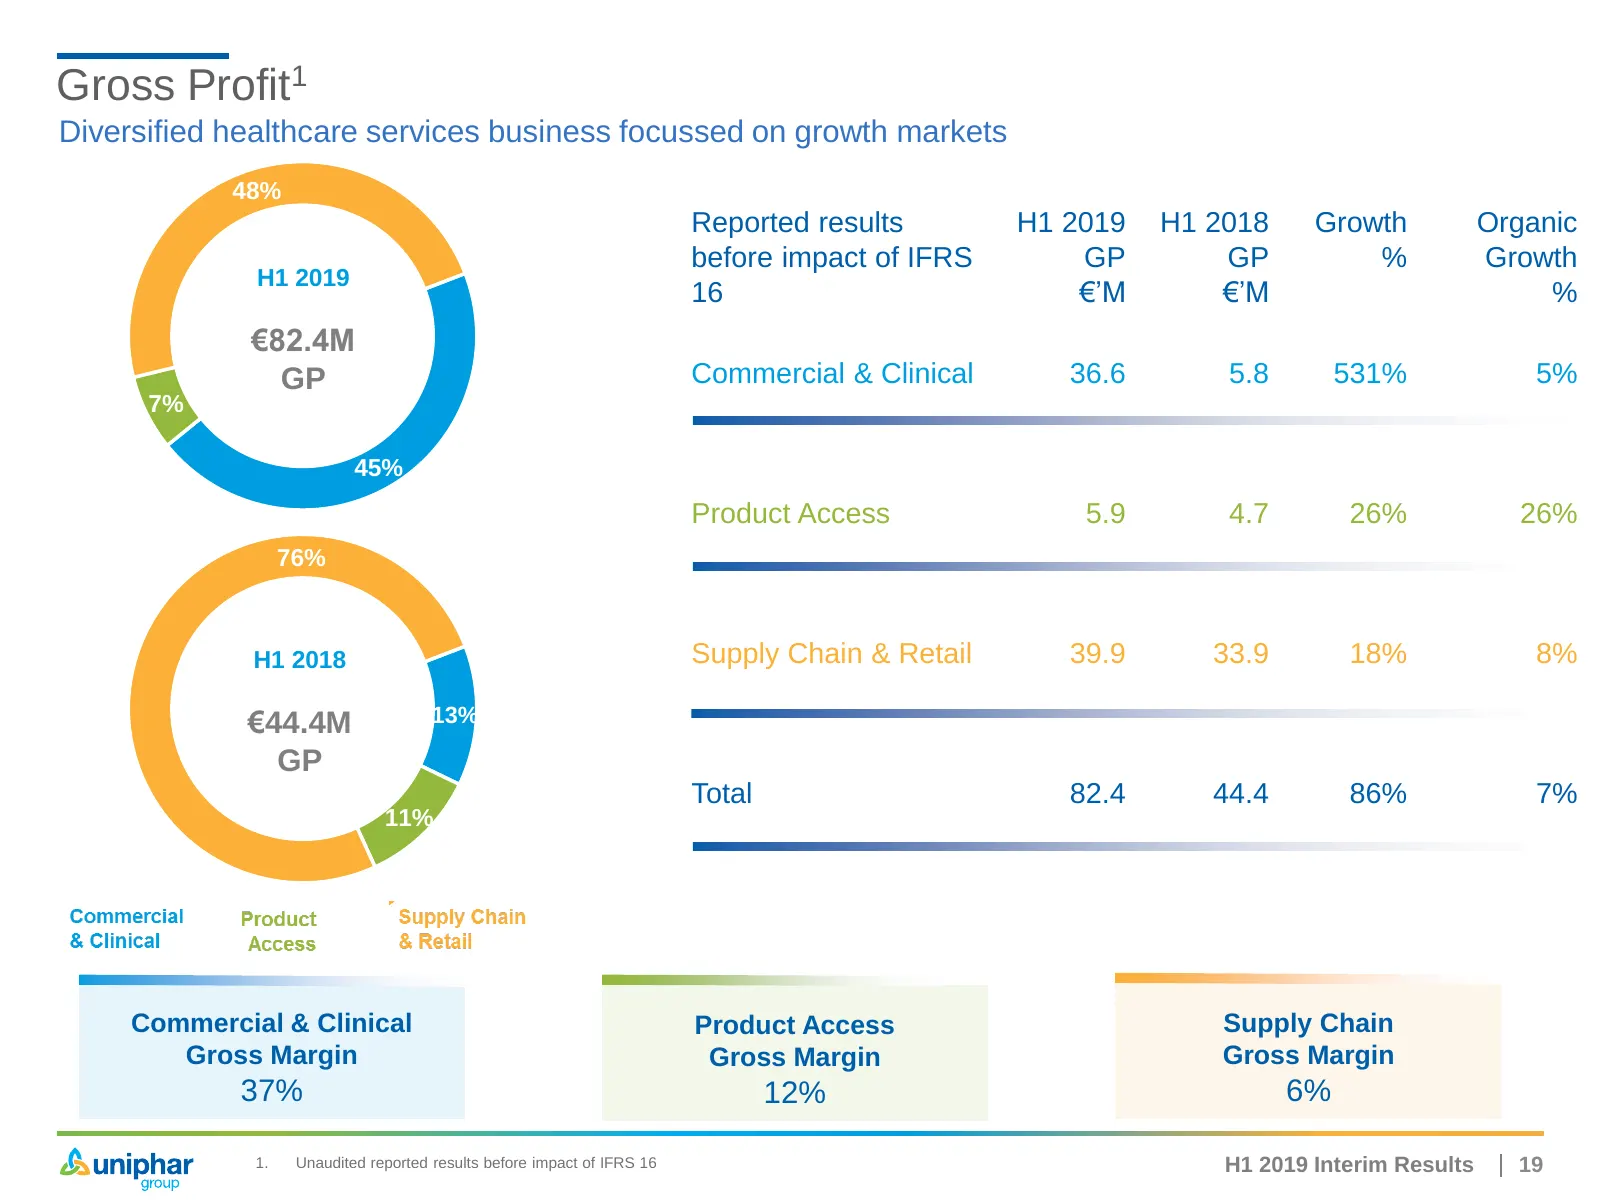
Gross Profit1 Diversified healthcare services business focussed on growth markets 48% Reported results H1 2019 H1 2018 Growth Organic before impact of IFRS GP GP % Growth H1 2019 16 €’M €’M % €82.4M GP Commercial & Clinical 36.6 5.8 531% 5% 7% 45% Product Access 5.9 4.7 26% 26% 76% H1 2018 Supply Ch
Slide 20: Outlook
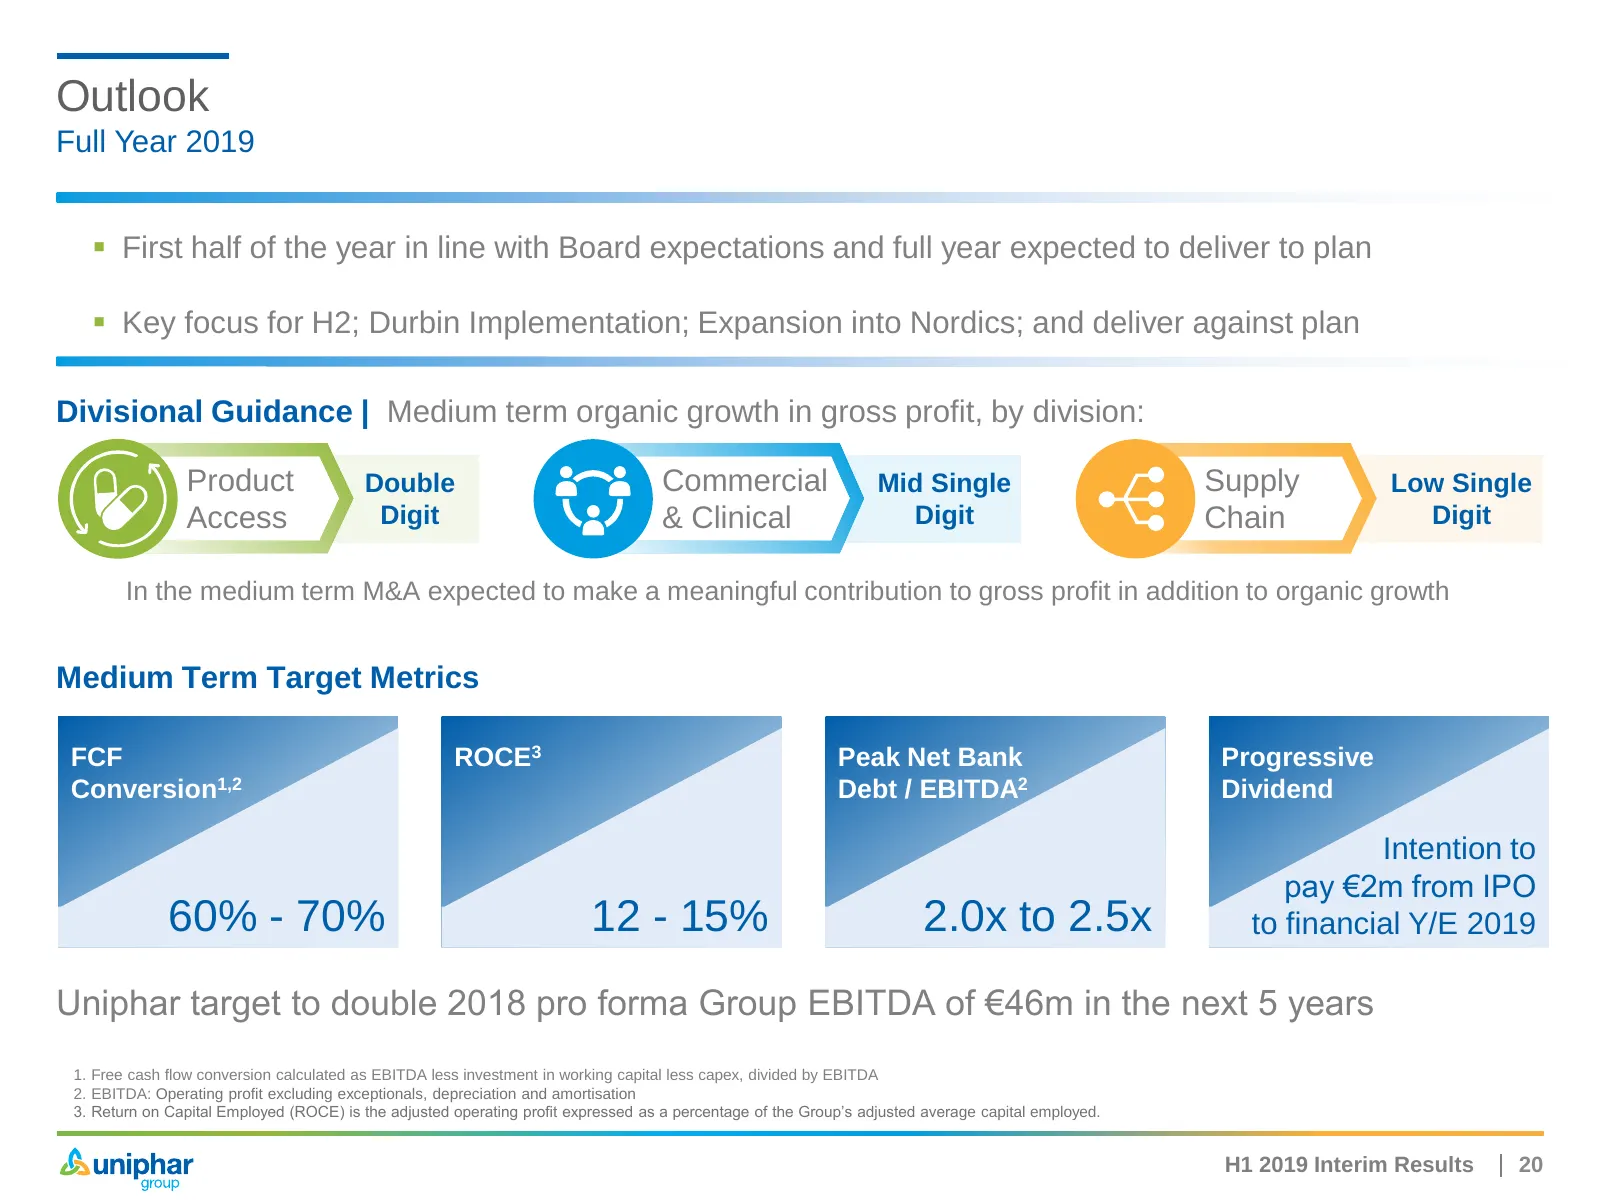
Outlook Full Year 2019 ▪ First half of the year in line with Board expectations and full year expected to deliver to plan ▪ Key focus for H2; Durbin Implementation; Expansion into Nordics; and deliver against plan Divisional Guidance | Medium term organic growth in gross profit, by division: Product
Slide 21: Investment Case
Investment Case 21
Slide 22: Investment Case
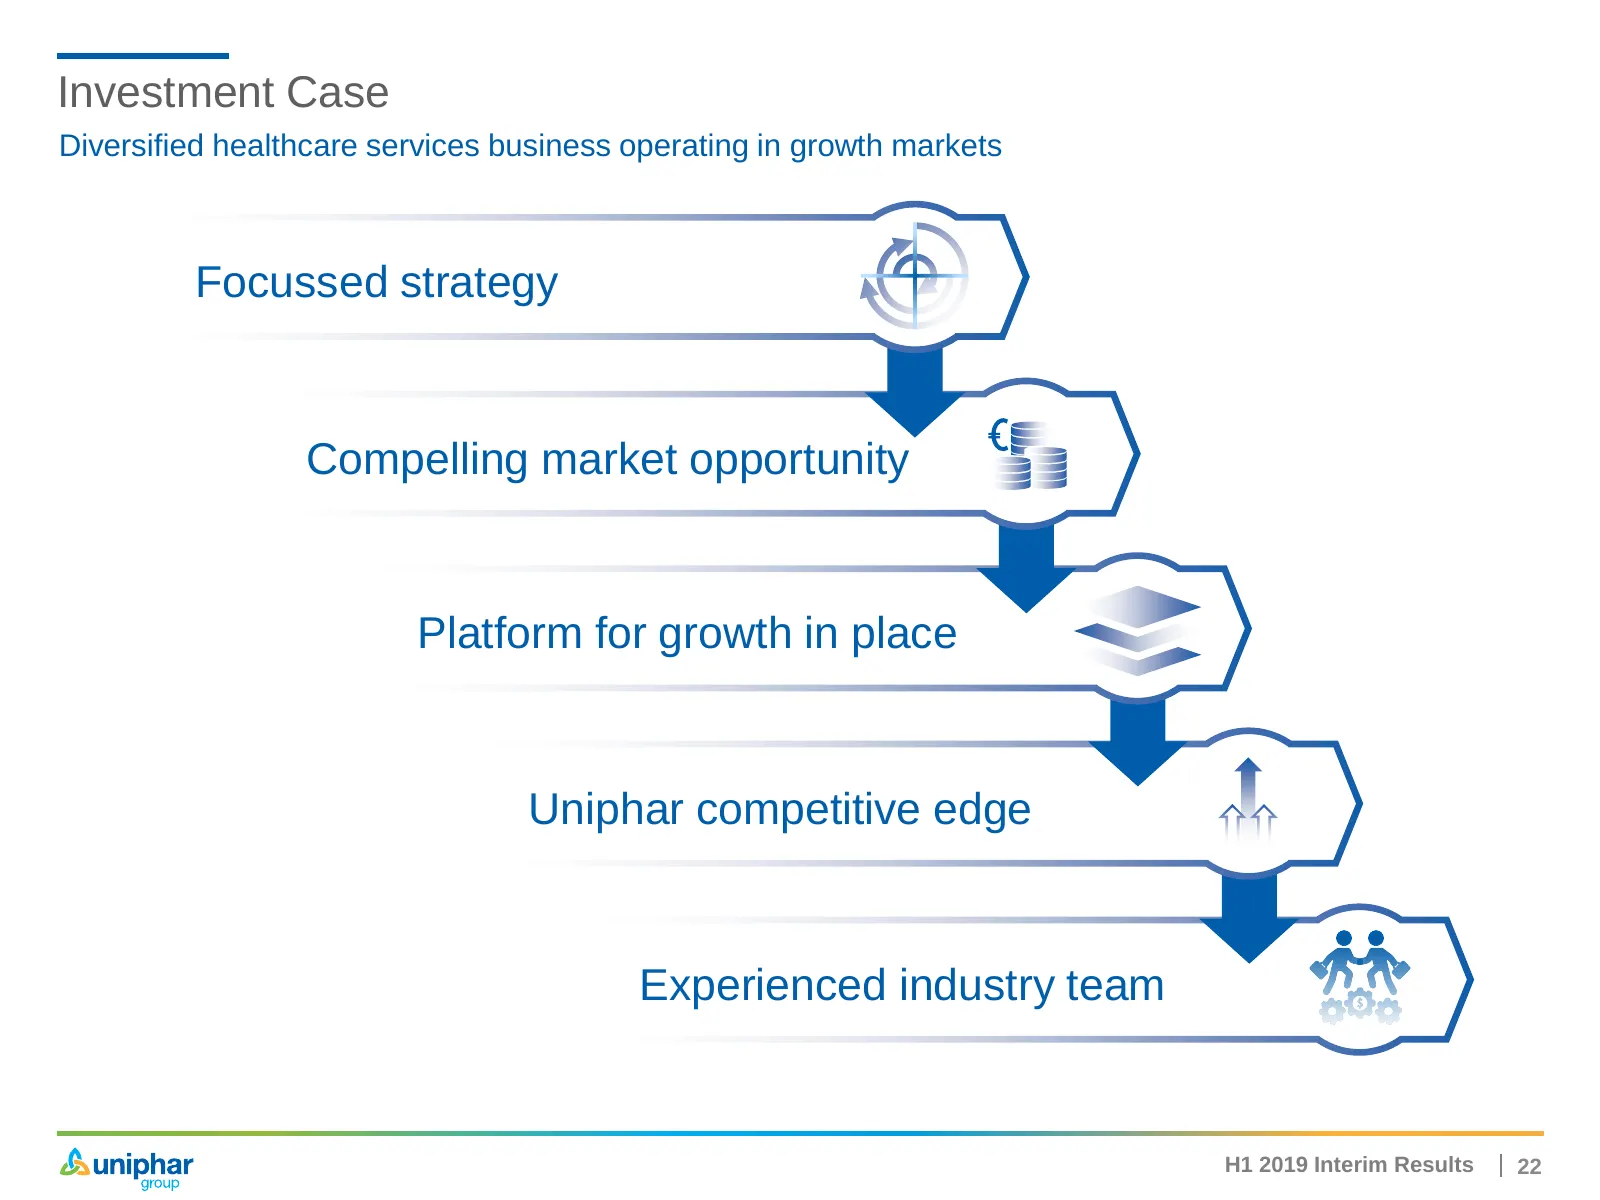
Investment Case Diversified healthcare services business operating in growth markets Focussed strategy Compelling market opportunity Platform for growth in place Uniphar competitive edge Experienced industry team H1 2019 Interim Results 22

Slide 23: Q&A
Q&A 23
Slide 24: Contact Details
Contact Details Brian O’Shaughnessy Director of Investor Relations and Corporate Development +353 (0)1 428 7777 investor.relations@Uniphar.ie Q4 PR Public Relations Adviser to Uniphar Iarla Mongey +353 (0)1 475 1444; or +353 (0)87 235 6461 H1 2019 Interim Results 24

Slide 25: Financial Appendices
Financial Appendices 25
Slide 26: Summary Group Financial Information
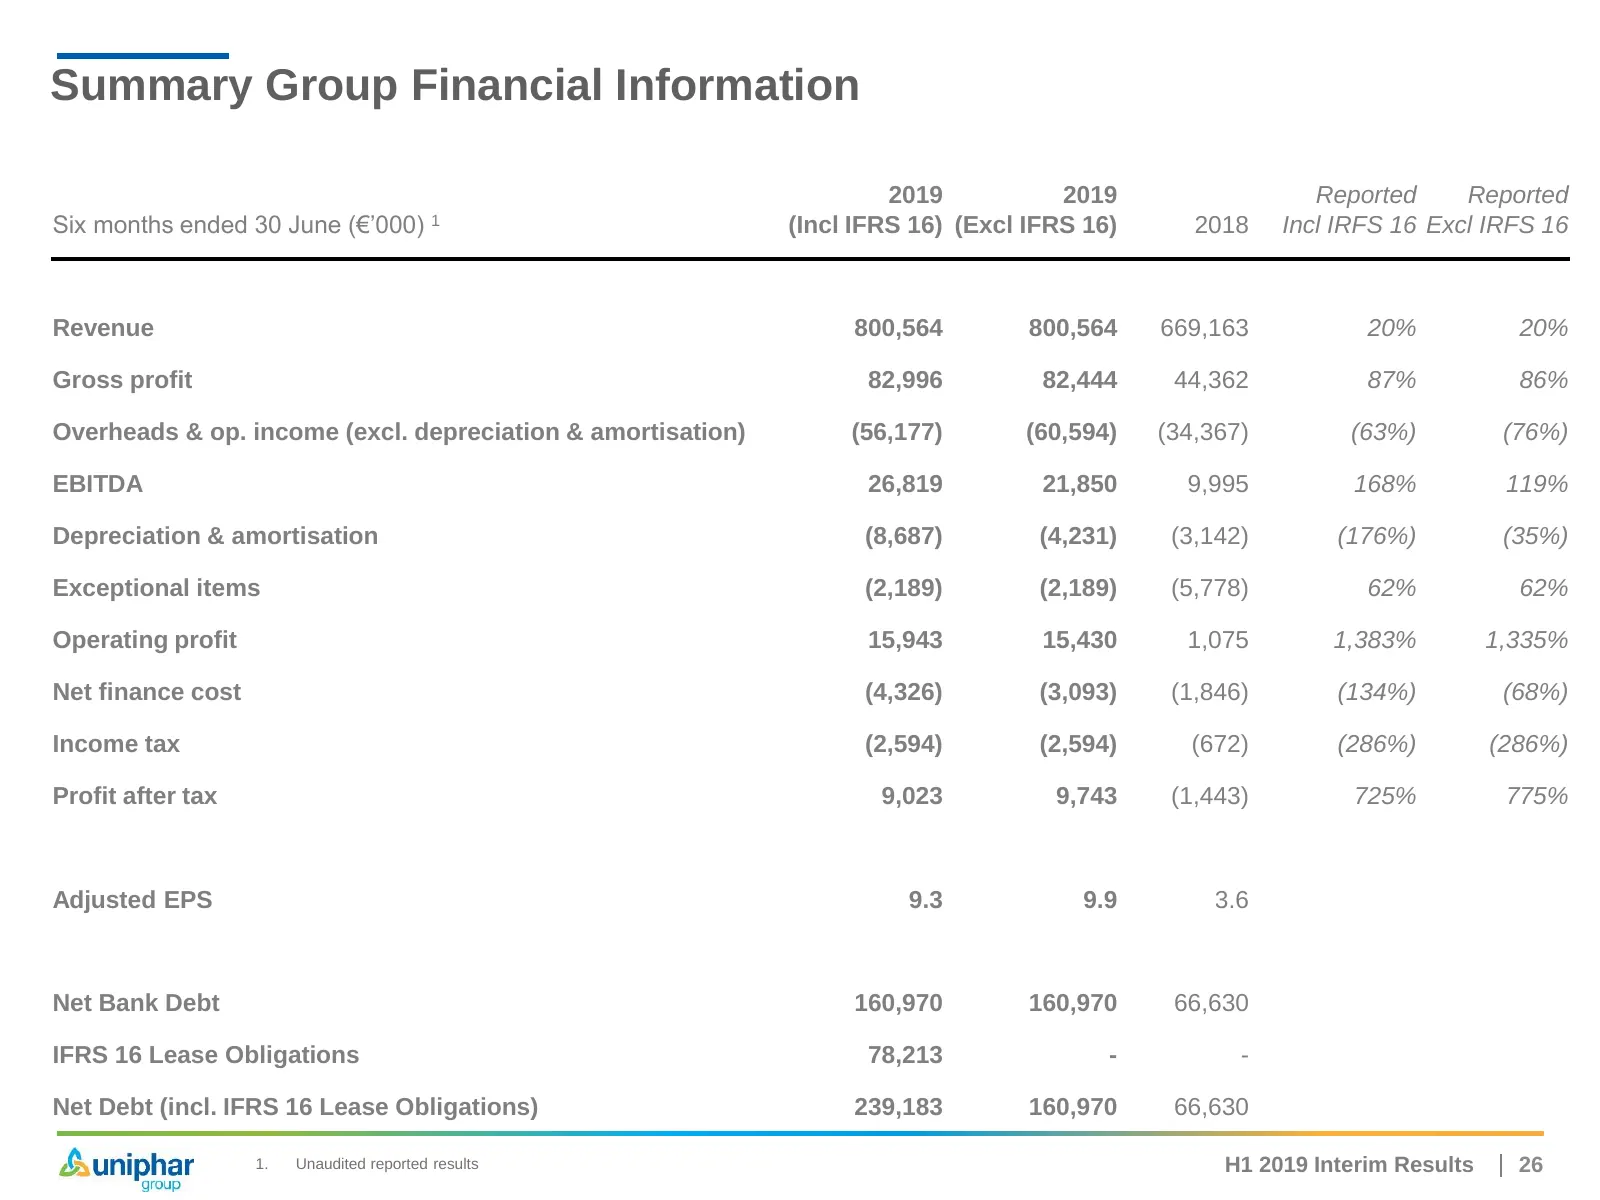
Summary Group Financial Information 2019 2019 Reported Reported Six months ended 30 June (€’000) 1 (Incl IFRS 16) (Excl IFRS 16) 2018 Incl IRFS 16 Excl IRFS 16 Revenue 800,564 800,564 669,163 20% 20% Gross profit 82,996 82,444 44,362 87% 86% Overheads & op. income (excl. depreciation & amortisation)
Slide 27: EBITDA Reconciliation
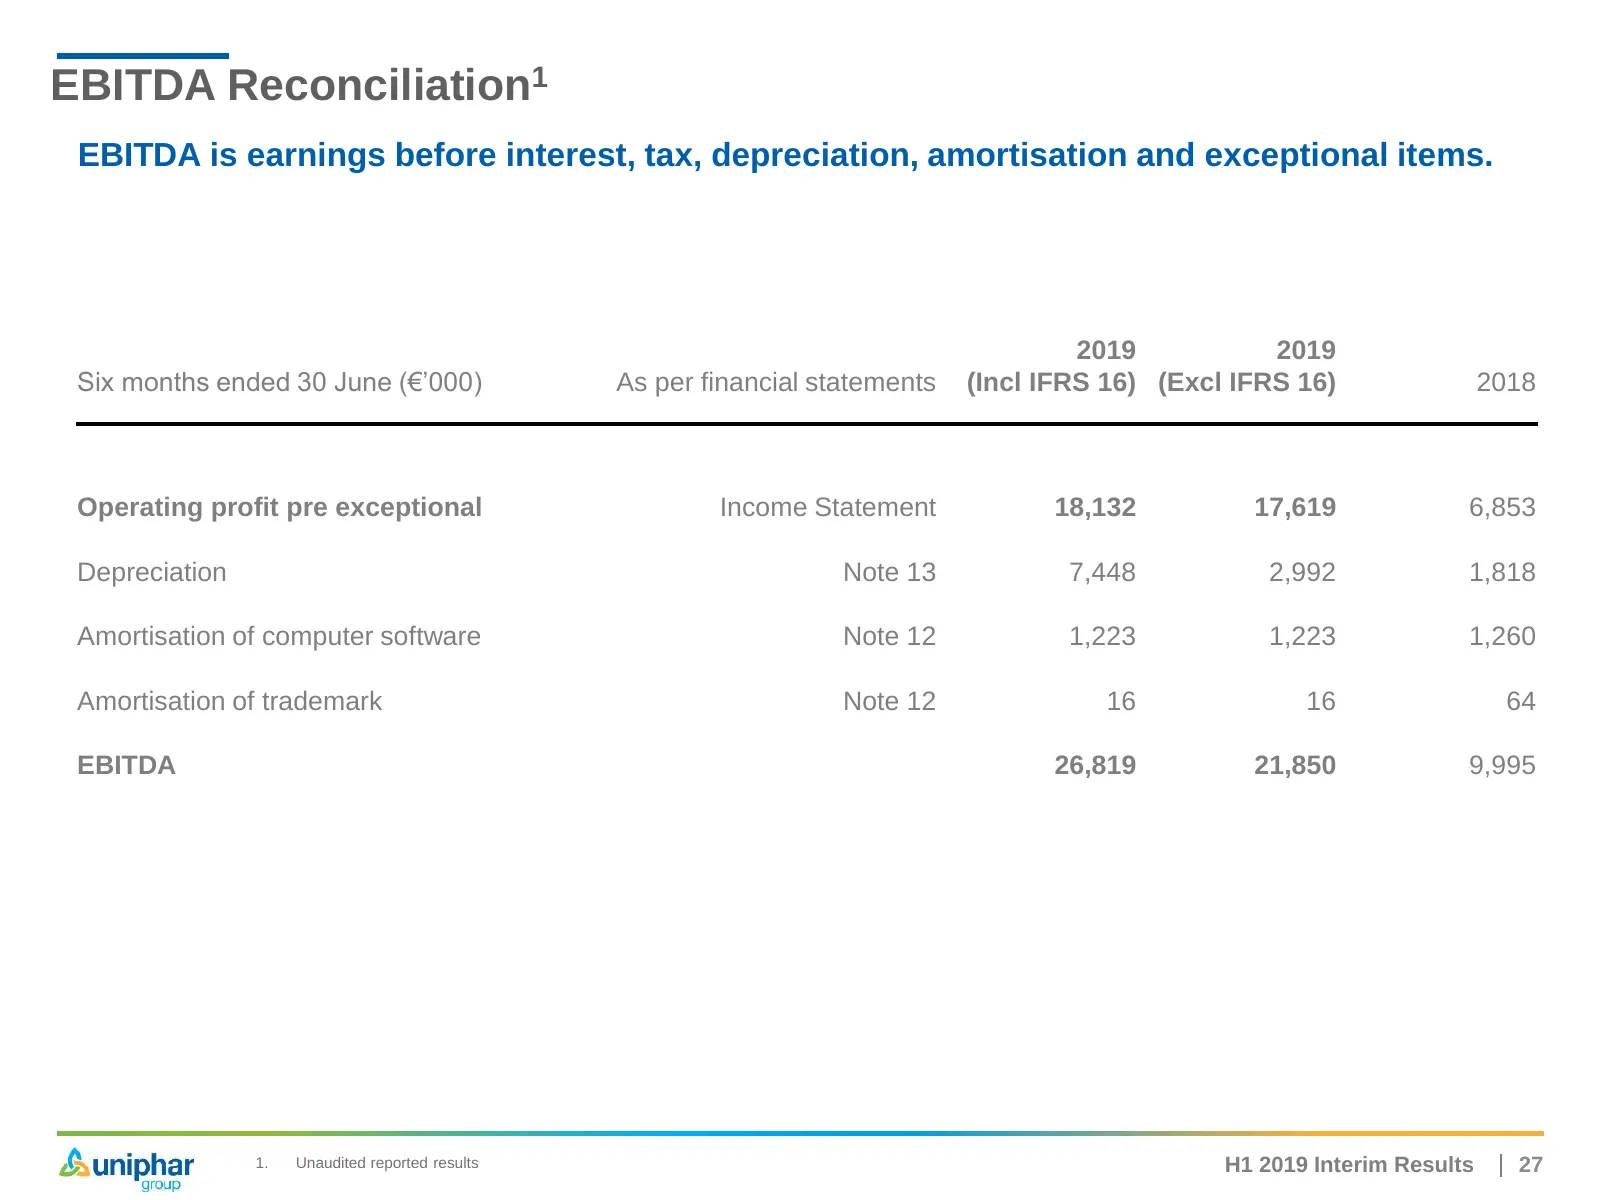
EBITDA Reconciliation1 EBITDA is earnings before interest, tax, depreciation, amortisation and exceptional items. 2019 2019 Six months ended 30 June (€’000) As per financial statements (Incl IFRS 16) (Excl IFRS 16) 2018 Operating profit pre exceptional Income Statement 18,132 17,619 6,853 Depreciati
Slide 28: Return on Capital Employed
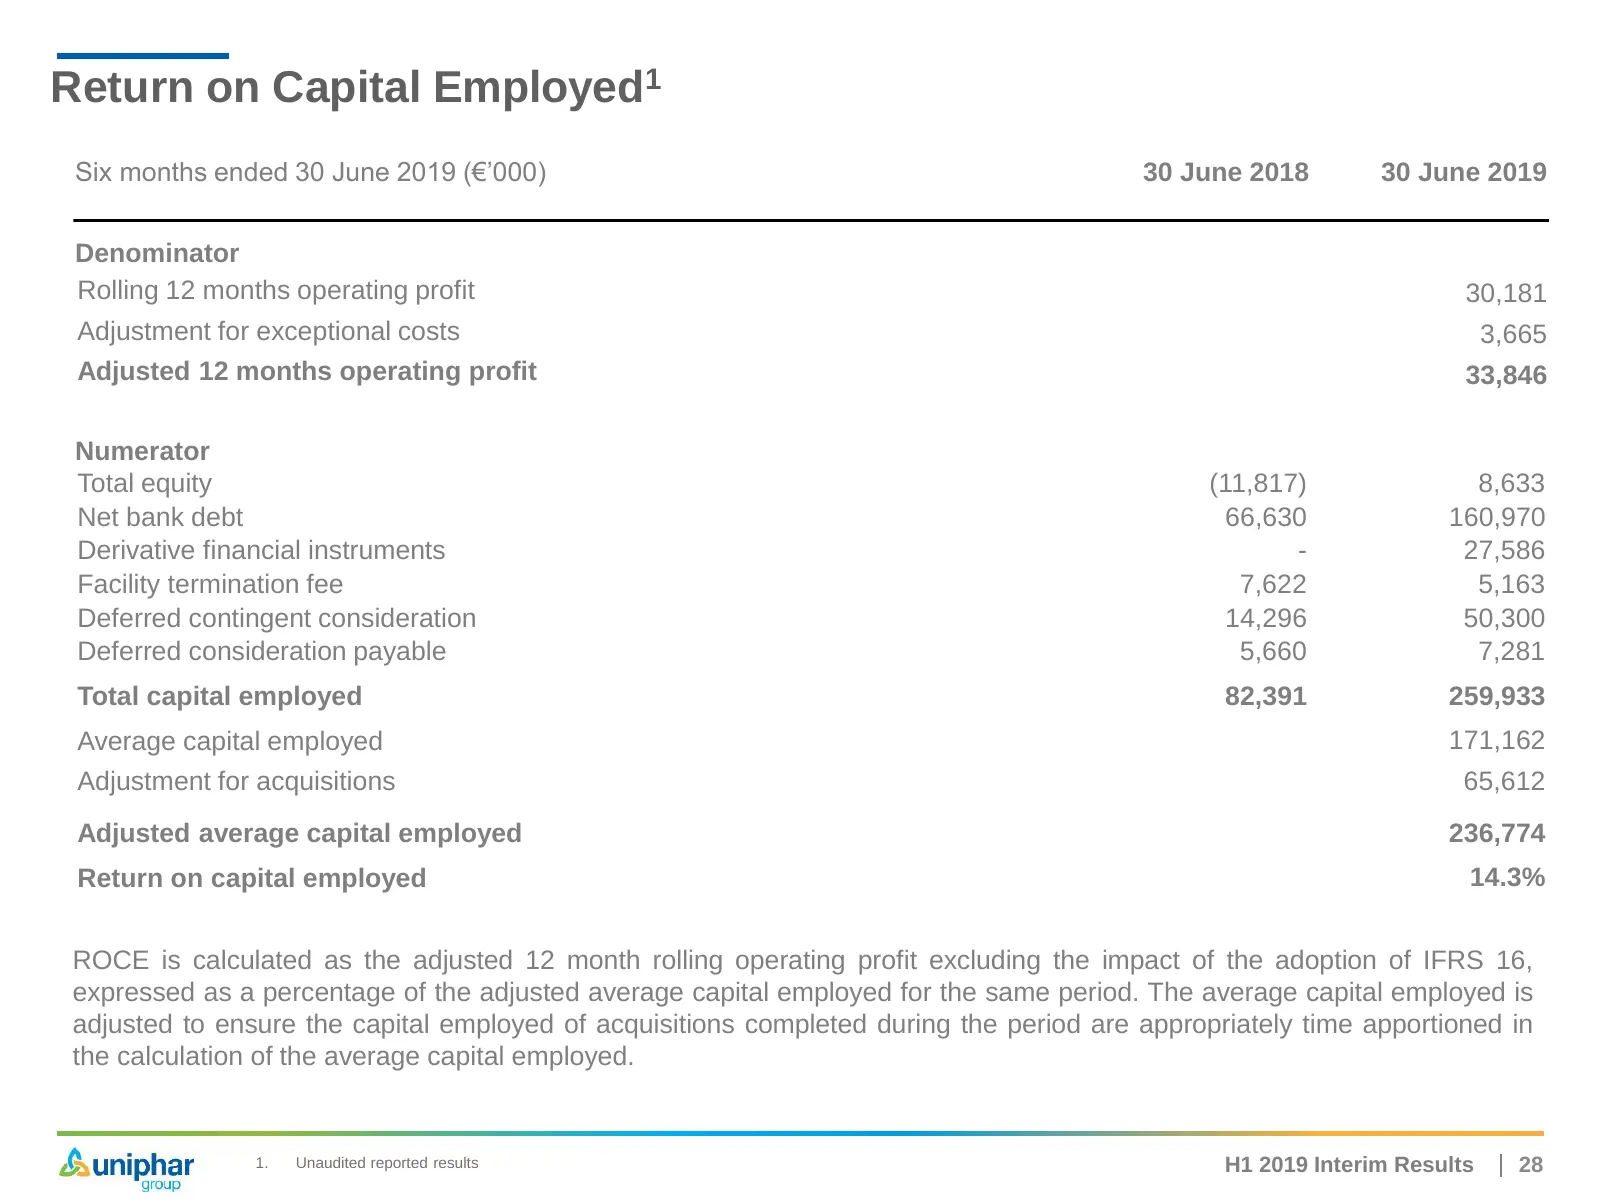
Return on Capital Employed1 Six months ended 30 June 2019 (€’000) 30 June 2018 30 June 2019 Denominator Rolling 12 months operating profit 30,181 Adjustment for exceptional costs 3,665 Adjusted 12 months operating profit 33,846 Numerator Total equity (11,817) 8,633 Net bank debt 66,630 160,970 Deriv
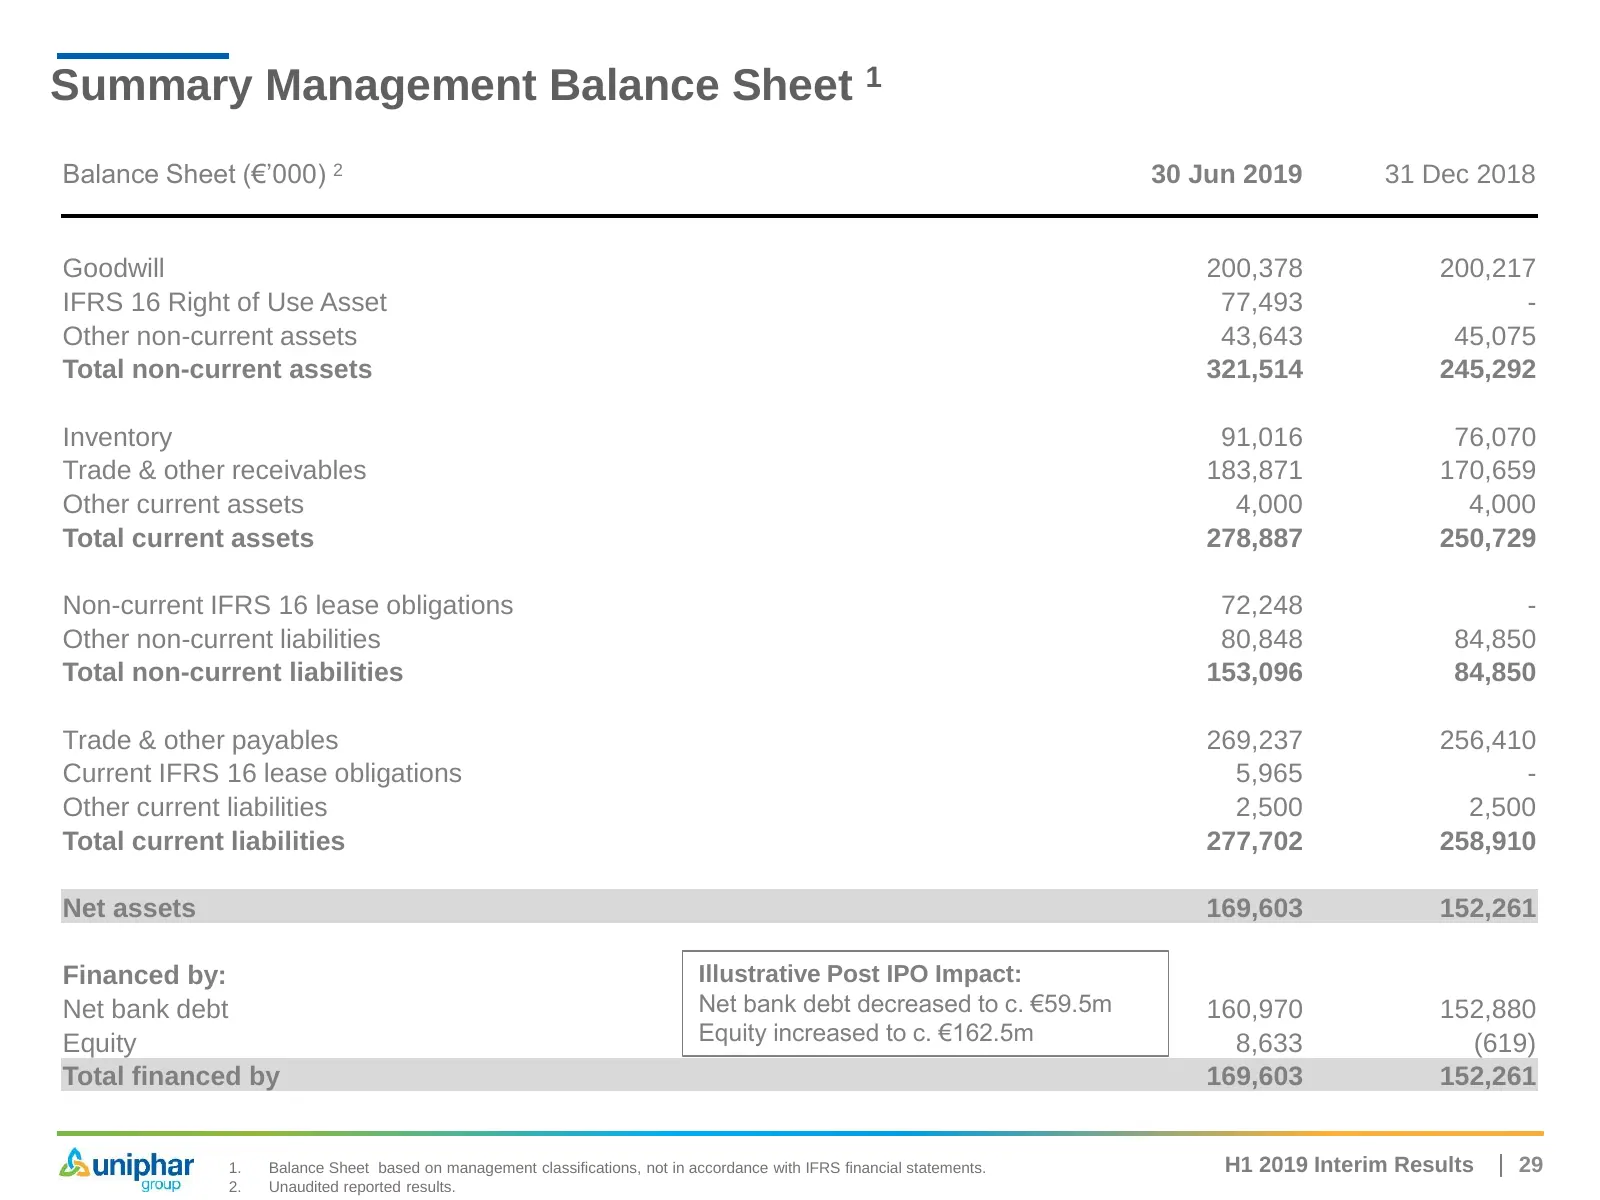
Slide 29: Summary Management Balance Sheet
Summary Management Balance Sheet 1 Balance Sheet (€’000) 2 30 Jun 2019 31 Dec 2018 Goodwill 200,378 200,217 IFRS 16 Right of Use Asset 77,493 - Other non-current assets 43,643 45,075 Total non-current assets 321,514 245,292 Inventory 91,016 76,070 Trade & other receivables 183,871 170,659 Other curr
Source: Internet Archive copy of uniphar.ie
More decks from Uniphar PLC
 H1 2026 Earnings Presentation39 slides · Sep 8, 2026
 FY2025 Earnings Presentation39 slides · Feb 24, 2026
 FY2024 Earnings Presentation38 slides · Feb 25, 2025
 H1 2024 Earnings Presentation37 slides · Sep 3, 2024
 FY2023 Earnings Presentation39 slides · Feb 27, 2024
 H1 2023 Earnings Presentation41 slides · Sep 14, 2023