BBX Capital Inc · OTC:BBXIA
BBX Capital — BankAtlantic Bancorp — Investor Presentation (October 2003)
57 slides from BBX Capital's investor presentation, Oct 24, 2003
Slide 1: BankAtlantic Bancorp
BANKATLANTIC BANCORP NYSE:BBX A diversified financial services holding company Banking Investment Banking and Retail Brokerage Real Estate Construction and Development
Slide 2: BankAtlantic Bancorp key figures
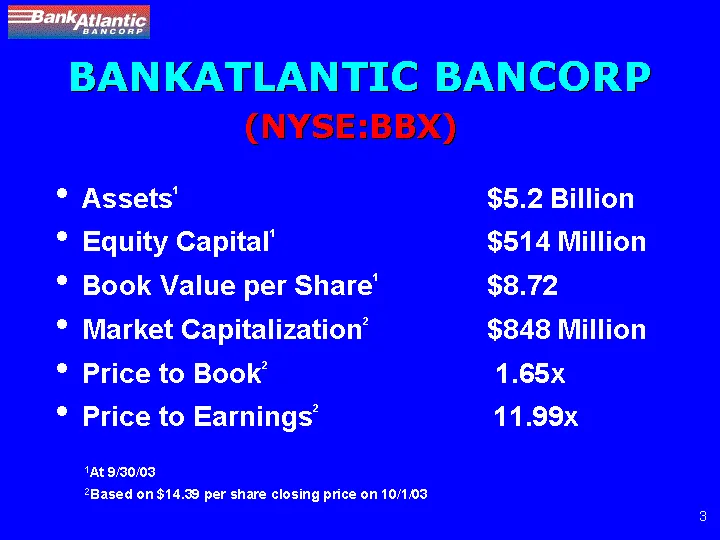
(NYSE:BBX) Assets1 $5.2 Billion Equity Capital1 $514 Million Book Value per Share1 $8.72 Market Capitalization2 $848 Million Price to Book2 1.65x Price to Earnings2 11.99x 1At 9/30/03 2Based on $14.39 per share closing price on 10/1/03 BANKATLANTIC BANCORP
Slide 3: Key Financial Highlights
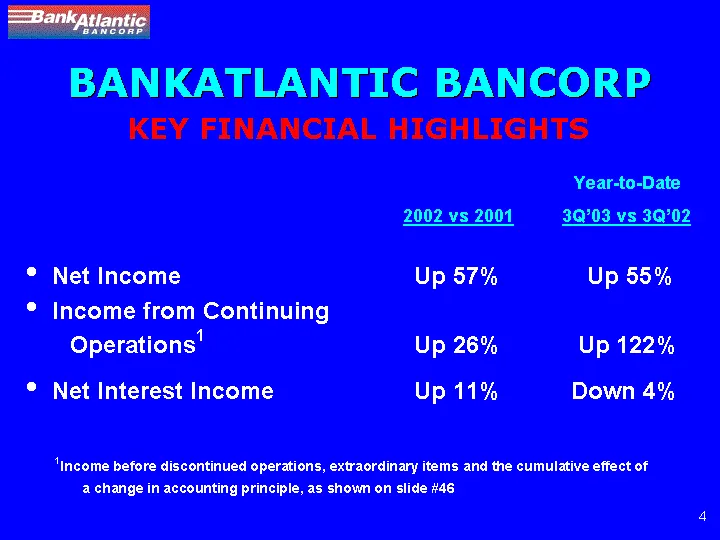
Net Income Up 57% Up 55% Income from Continuing Operations1 Up 26% Up 122% Net Interest Income Up 11% Down 4% 1Income before discontinued operations, extraordinary items and the cumulative effect of a change in accounting principle, as shown on slide #46 2002 vs 2001 Year-to-Date 3Q'03 vs 3Q'02 BANK
Slide 4: Key Financial Highlights: Returns on Assets and Equity
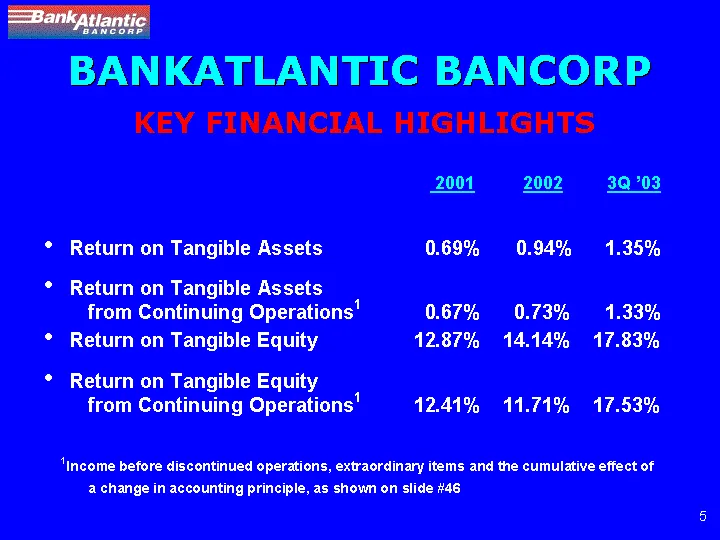
Return on Tangible Assets 0.69% 0.94% 1.35% Return on Tangible Assets from Continuing Operations1 0.67% 0.73% 1.33% Return on Tangible Equity 12.87% 14.14% 17.83% Return on Tangible Equity from Continuing Operations1 12.41% 11.71% 17.53% 1Income before discontinued operations, extraordinary items an
Slide 5: BankAtlantic Overview
BANKATLANTIC Founded in 1952 "Florida's Most Convenient Bank" 73 branches High visibility in South Florida Strong demographics OVERVIEW
Slide 6: BankAtlantic Branch Network
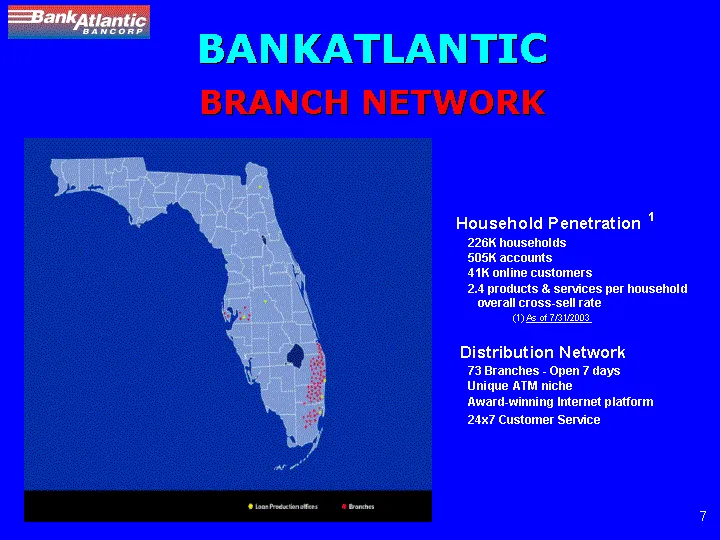
BANKATLANTIC BRANCH NETWORK Household Penetration 1 226K households 505K accounts 41K online customers 2.4 products & services per household overall cross-sell rate (1) As of 7/31/2003 Distribution Network 73 Branches - Open 7 days Unique ATM niche Award-winning Internet platform 24x7 Customer Servi
Slide 7: BankAtlantic Florida Deposit Ranking
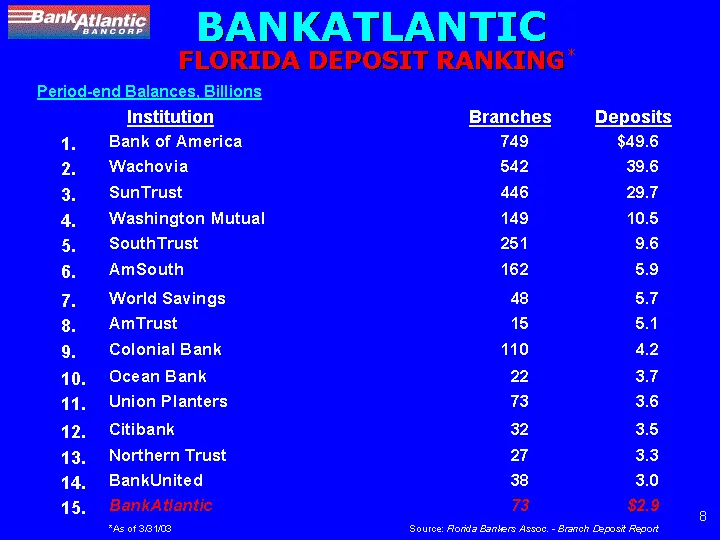
BANKATLANTIC FLORIDA DEPOSIT RANKING* Institution Branches Deposits *As of 3/31/03 Source: Florida Bankers Assoc. - Branch Deposit Report 1. Bank of America 749 $49.6 2. Wachovia 542 39.6 3. SunTrust 446 29.7 4. Washington Mutual 149 10.5 5. SouthTrust 251 9.6 6. AmSouth 162 5.9 7. World Savings 48
Slide 8: BankAtlantic Market Share
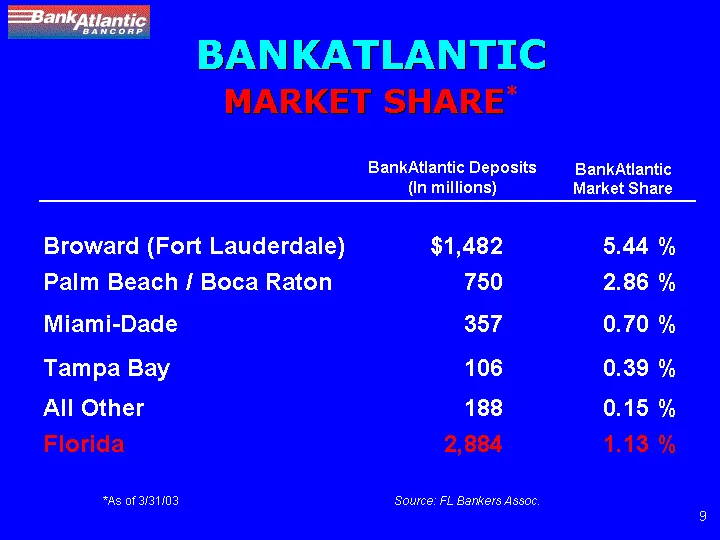
BankAtlantic Deposits (In millions) BankAtlantic Market Share *As of 3/31/03 Source: FL Bankers Assoc. MARKET SHARE* BANKATLANTIC Broward (Fort Lauderdale) $1,482 5.44 % Palm Beach / Boca Raton 750 2.86 % Miami-Dade 357 0.70 % Tampa Bay 106 0.39 % All Other 188 0.15 % Florida 2,884 1.13 %
Slide 9: BankAtlantic Strategy
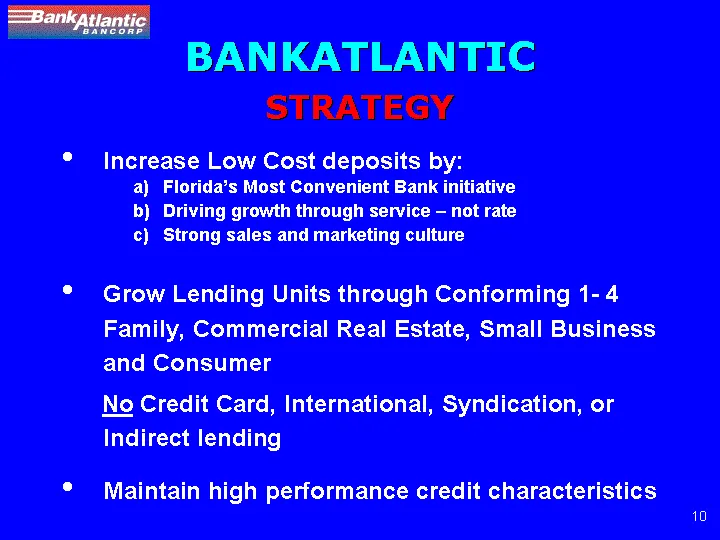
BANKATLANTIC STRATEGY Increase Low Cost deposits by: Florida's Most Convenient Bank initiative Driving growth through service - not rate Strong sales and marketing culture Grow Lending Units through Conforming 1- 4 Family, Commercial Real Estate, Small Business and Consumer No Credit Card, Internati
Slide 10: Florida's Most Convenient Bank
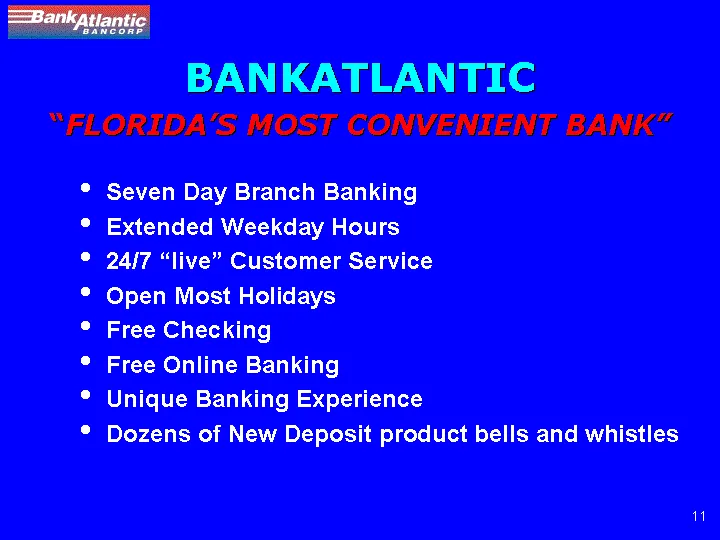
BANKATLANTIC "FLORIDA'S MOST CONVENIENT BANK" Seven Day Branch Banking Extended Weekday Hours 24/7 "live" Customer Service Open Most Holidays Free Checking Free Online Banking Unique Banking Experience Dozens of New Deposit product bells and whistles

Slide 11: Florida's Most Convenient Bank
FLORIDA'S MOST CONVENIENT BANK
Slide 12: New Low Cost Accounts
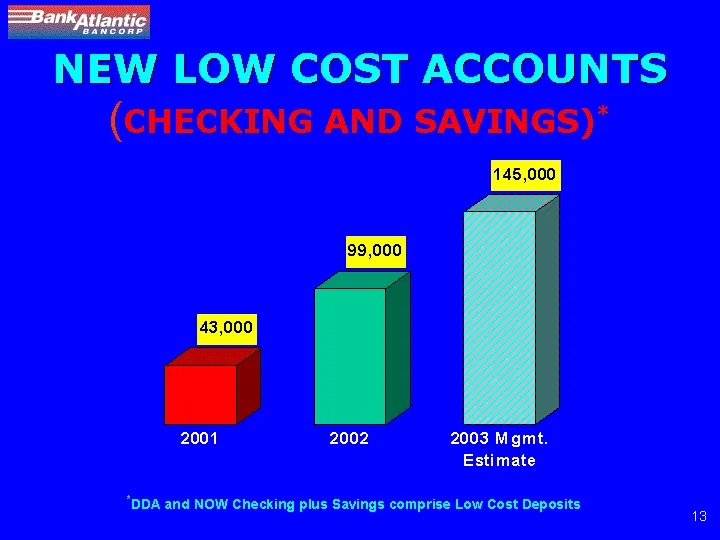
NEW LOW COST ACCOUNTS (CHECKING AND SAVINGS)* 2001 2002 2003 Mgmt. Estimate NEW ACCTS 43000 99000 155000 *DDA and NOW Checking plus Savings comprise Low Cost Deposits
Slide 13: Deposit Growth
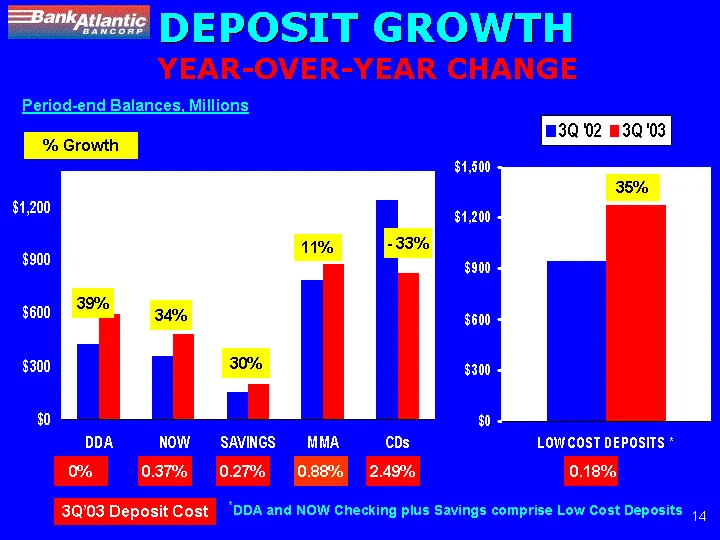
DEPOSIT GROWTH DDA NOW SAVINGS MMA CDs 3Q '02 428.812 359.386 155.328 791.211 1240.137 3Q '03 594.685 480.837 202.355 878.281 826.045 LOW COST DEPOSITS * 3Q '02 943.525 3Q '03 1277.877 Period-end Balances, Millions 39% 34% 30% - - 33% 0.18% 0% 0.37% 0.27% 2.49% 11% 0.88% 3Q'03 Deposit Cost % Growth
Slide 14: Low Cost Deposit Growth, Same Branch
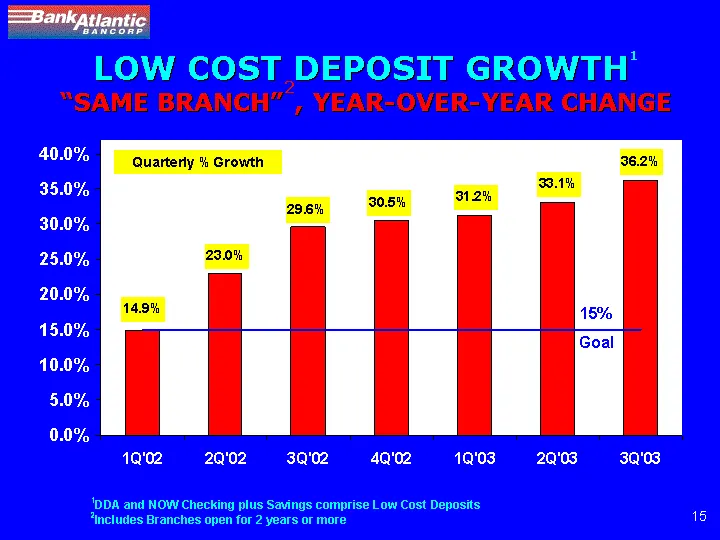
LOW COST DEPOSIT GROWTH1 "SAME BRANCH"2, YEAR-OVER-YEAR CHANGE 1Q'02 2Q'02 3Q'02 4Q'02 1Q'03 2Q'03 3Q'03 Linked Qtr Growth 0.149 0.23 0.296 0.305 0.312 0.3312 0.3618 Goal 0.15 0.15 0.15 0.15 0.15 0.15 0.15 Quarterly % Growth 1DDA and NOW Checking plus Savings comprise Low Cost Deposits 2Includes Bra
Slide 15: Low Cost Deposits % of Total Deposits
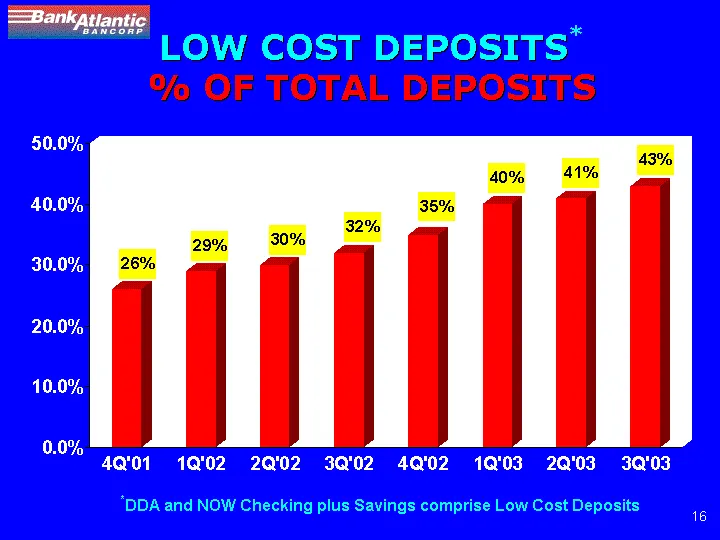
LOW COST DEPOSITS* % OF TOTAL DEPOSITS 4Q'01 1Q'02 2Q'02 3Q'02 4Q'02 1Q'03 2Q'03 3Q'03 Low Cost Deposit % 0.26 0.29 0.3 0.32 0.35 0.4 0.41 0.43 *DDA and NOW Checking plus Savings comprise Low Cost Deposits
Slide 16: Demand Deposits % of Total Deposits
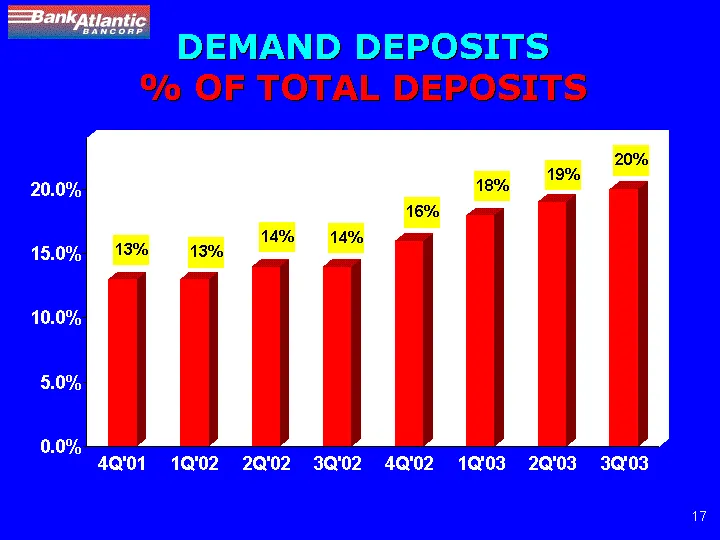
DEMAND DEPOSITS % OF TOTAL DEPOSITS 4Q'01 1Q'02 2Q'02 3Q'02 4Q'02 1Q'03 2Q'03 3Q'03 DDA % Tl. Deposits 0.13 0.13 0.14 0.14 0.16 0.18 0.19 0.2
Slide 17: Total Deposits
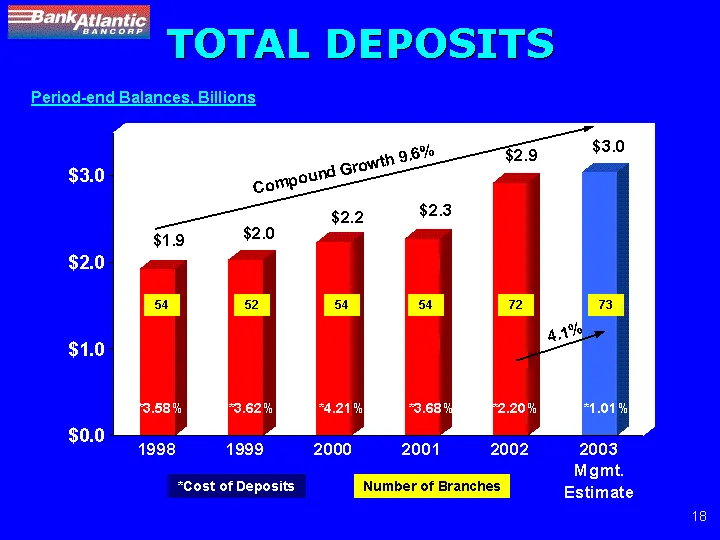
TOTAL DEPOSITS 1998 1999 2000 2001 2002 2003 Mgmt. Estimate Total Deposits 1.925772 2.027892 2.234485 2.276567 2.920555 3.041092 Compound Growth 9.6% *3.58% *Cost of Deposits *3.62% *4.21% *3.68% *2.20% *1.01% 54 52 54 54 72 73 Number of Branches 4.1% Period-end Balances, Billions
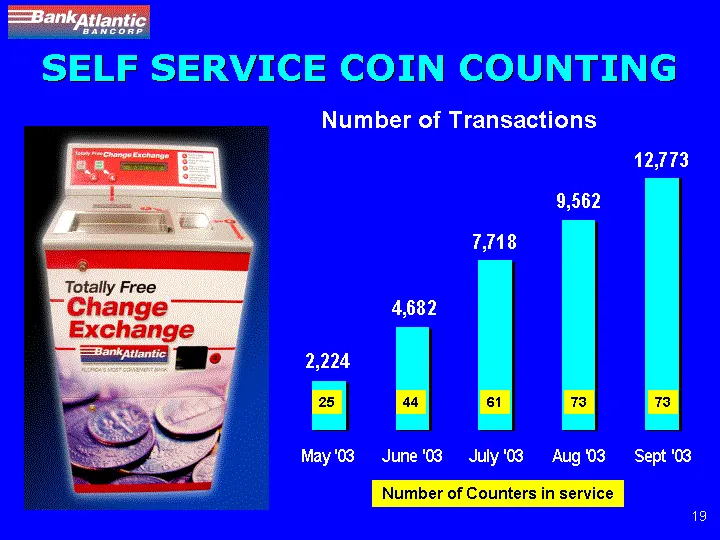
Slide 18: Self Service Coin Counting
SELF SERVICE COIN COUNTING May '03 June '03 July '03 Aug '03 Sept '03 East 2224 4682 7718 9562 12773 Number of Transactions 25 Number of Counters in service 61 73 73 44

Slide 19: BankAtlantic.com
BANKATLANTIC.COM 41,000 online customers Free Online Banking Electronic Bill Pay 24x7 Customer Service Winner 2002 Standard of Excellence Award
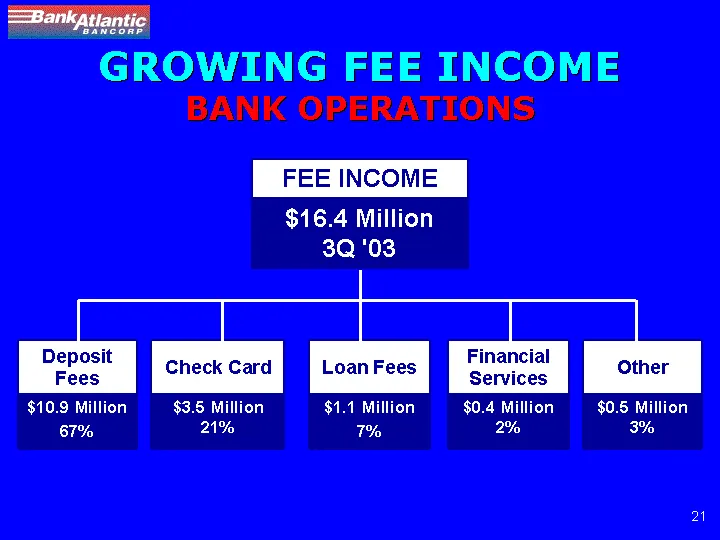
Slide 20: Growing Fee Income
GROWING FEE INCOME BANK OPERATIONS Deposit Fees Check Card Loan Fees Financial Services Other $10.9 Million 67% $3.5 Million 21% $1.1 Million 7% $0.4 Million 2% $0.5 Million 3% FEE INCOME $16.4 Million 3Q '03
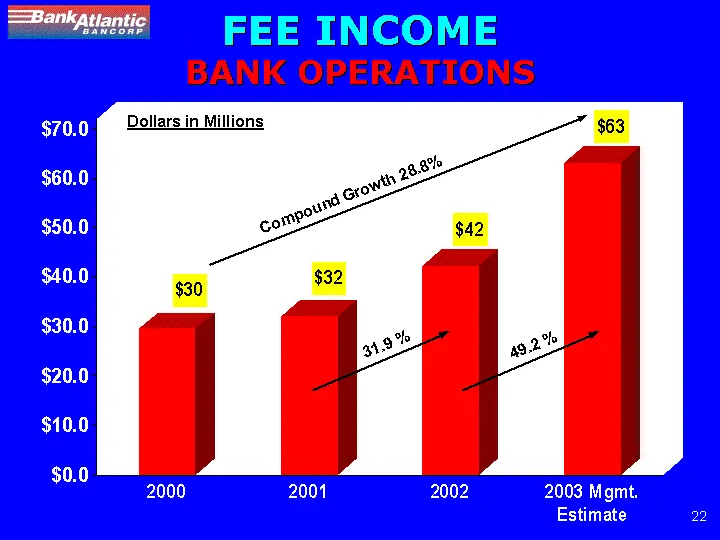
Slide 21: Fee Income
2000 2001 2002 2003 Mgmt. Estimate Fee Income 29.573322 32.077217 42.315973 63.14935 Compound Growth 28.8% 49.2 % 31.9 % Dollars in Millions FEE INCOME BANK OPERATIONS
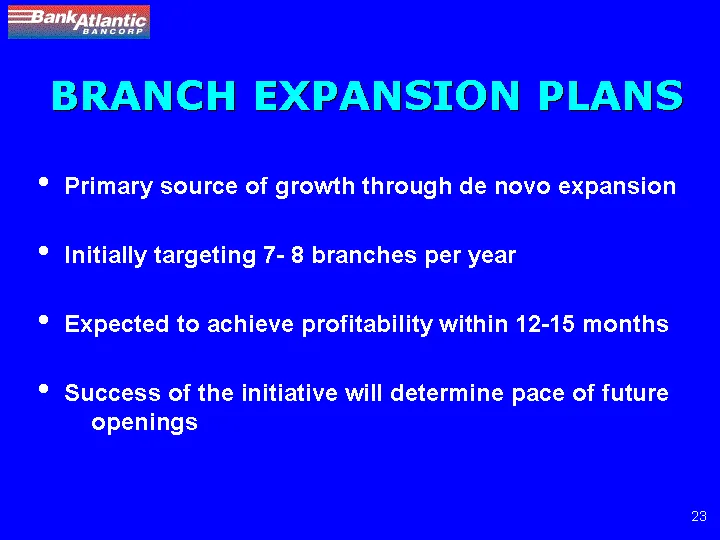
Slide 22: Branch Expansion Plans
Primary source of growth through de novo expansion Initially targeting 7- 8 branches per year Expected to achieve profitability within 12-15 months Success of the initiative will determine pace of future openings BRANCH EXPANSION PLANS
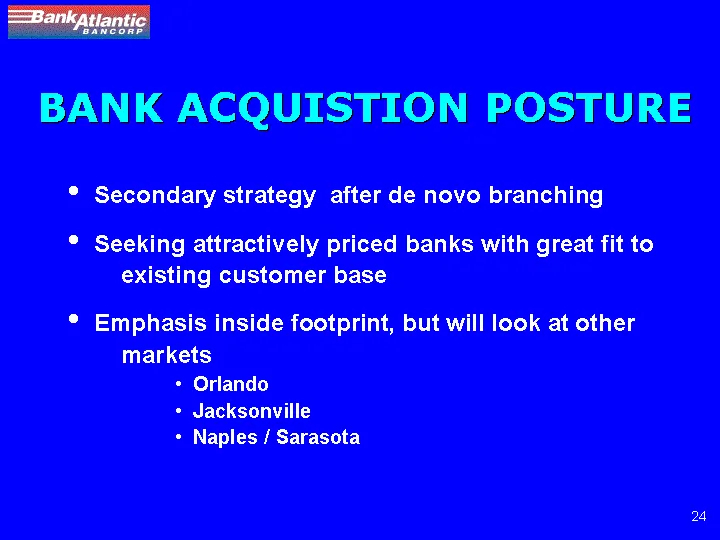
Slide 23: Bank Acquisition Posture
Secondary strategy after de novo branching Seeking attractively priced banks with great fit to existing customer base Emphasis inside footprint, but will look at other markets Orlando Jacksonville Naples / Sarasota BANK ACQUISTION POSTURE
Slide 24: Loan Growth
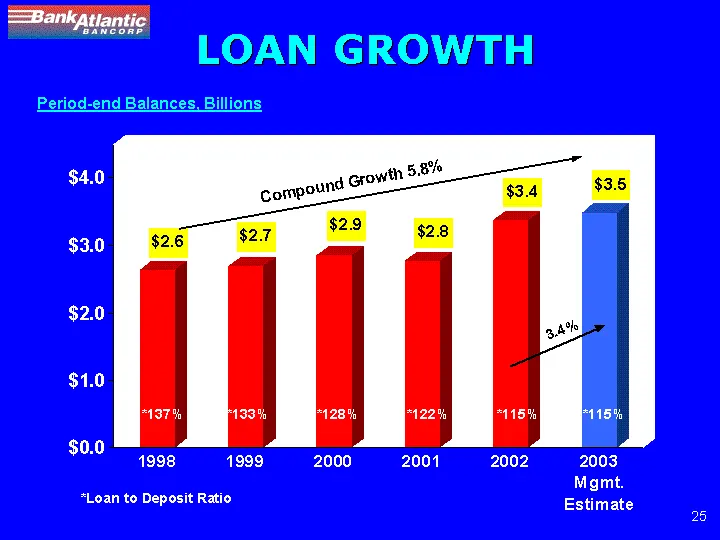
LOAN GROWTH 1998 1999 2000 2001 2002 2003 Mgmt. Estimate Total Loans 2.635 2.69 2.854 2.774 3.373 3.489 Compound Growth 5.8% *137% *Loan to Deposit Ratio *133% *128% *122% *115% *115% 3.4% Period-end Balances, Billions
Slide 25: Loan Composition
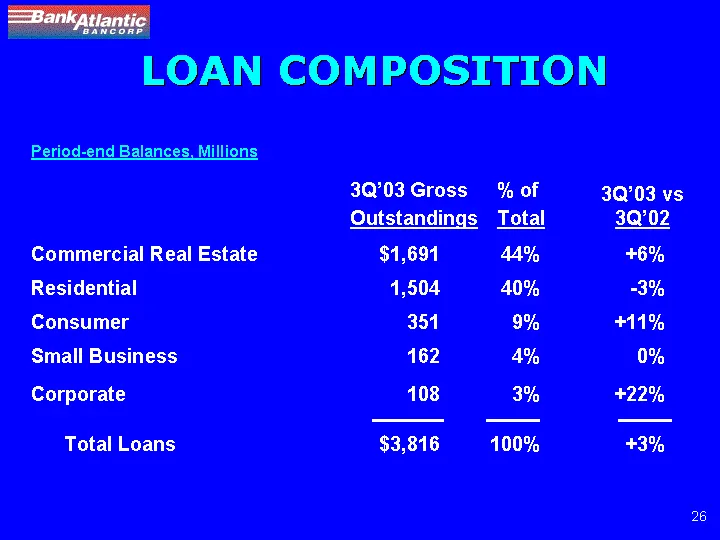
LOAN COMPOSITION Commercial Real Estate $1,691 44% +6% Residential 1,504 40% -3% Consumer 351 9% +11% Small Business 162 4% 0% Corporate 108 3% +22% Total Loans $3,816 100% +3% 3Q'03 Gross Outstandings % of Total 3Q'03 vs 3Q'02 Period-end Balances, Millions
Slide 26: Asset Quality
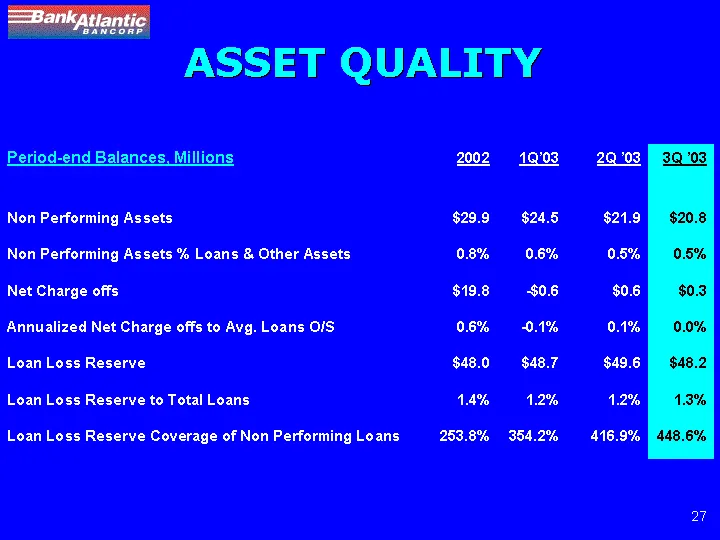
ASSET QUALITY 2002 1Q'03 2Q '03 3Q '03 Non Performing Assets $29.9 $24.5 $21.9 $20.8 Non Performing Assets % Loans & Other Assets 0.8% 0.6% 0.5% 0.5% Net Charge offs $19.8 -$0.6 $0.6 $0.3 Annualized Net Charge offs to Avg. Loans O/S 0.6% -0.1% 0.1% 0.0% Loan Loss Reserve $48.0 $48.7 $49.6 $48.2 Loan
Slide 27: Current Issues
CURRENT ISSUES Margin compression is affecting results Prepayment of mortgages, securities Flattening yield curve
Slide 28: Ryan Beck & Co. Overview
RYAN BECK & CO. Full-service investment banking and regional brokerage Founded in 1946 Nationally recognized leader in Financial Institutions investment banking OVERVIEW
Slide 29: Ryan Beck & Co.
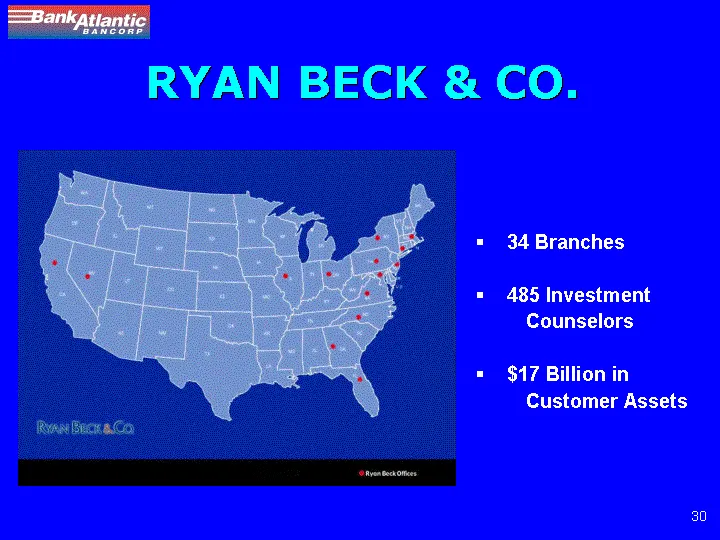
RYAN BECK & CO. 34 Branches 485 Investment Counselors $17 Billion in Customer Assets
Slide 30: Ryan Beck & Co. Revenue Distribution
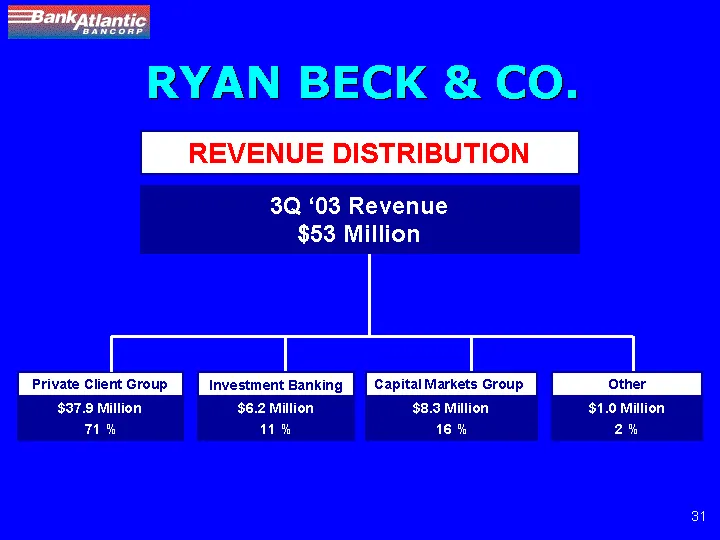
Private Client Group REVENUE DISTRIBUTION 3Q '03 Revenue $53 Million Capital Markets Group $6.2 Million 11 % Investment Banking RYAN BECK & CO.
Slide 31: Levitt Corporation
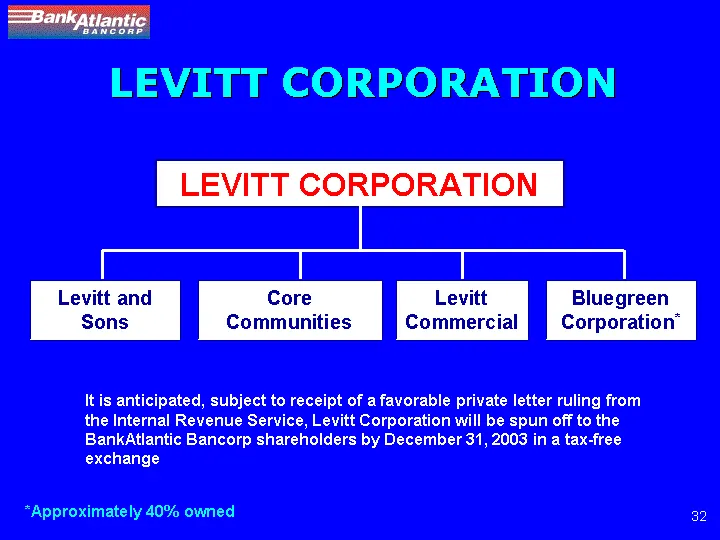
*Approximately 40% owned Levitt and Sons Core Communities Levitt Commercial Bluegreen Corporation* LEVITT CORPORATION It is anticipated, subject to receipt of a favorable private letter ruling from the Internal Revenue Service, Levitt Corporation will be spun off to the BankAtlantic Bancorp sharehol
Slide 32: Levitt and Sons
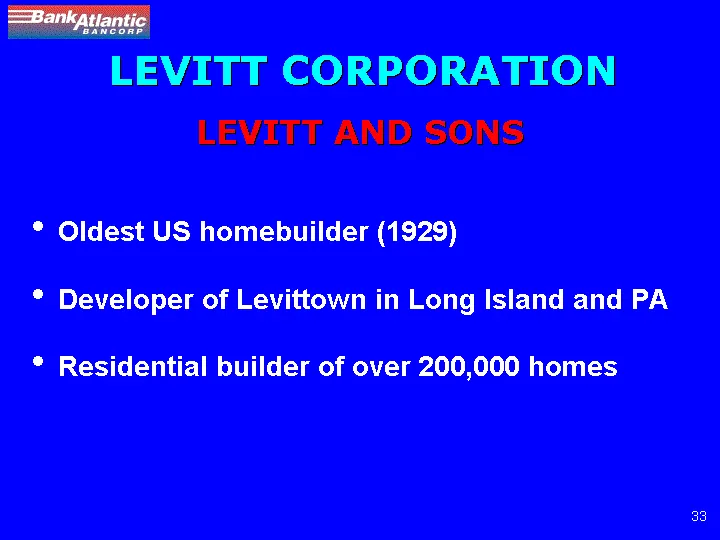
LEVITT AND SONS Oldest US homebuilder (1929) Developer of Levittown in Long Island and PA Residential builder of over 200,000 homes LEVITT CORPORATION
Slide 33: Levitt and Sons
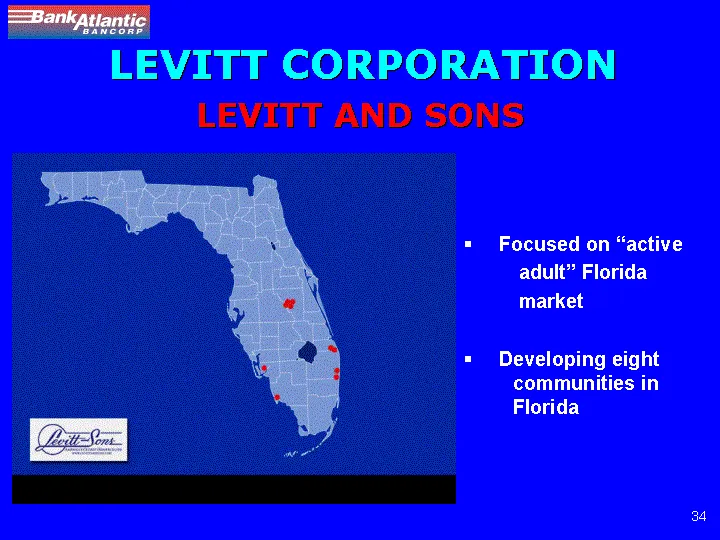
LEVITT AND SONS Focused on "active adult" Florida market Developing eight communities in Florida LEVITT CORPORATION
Slide 34: Levitt and Sons Backlog and Closings
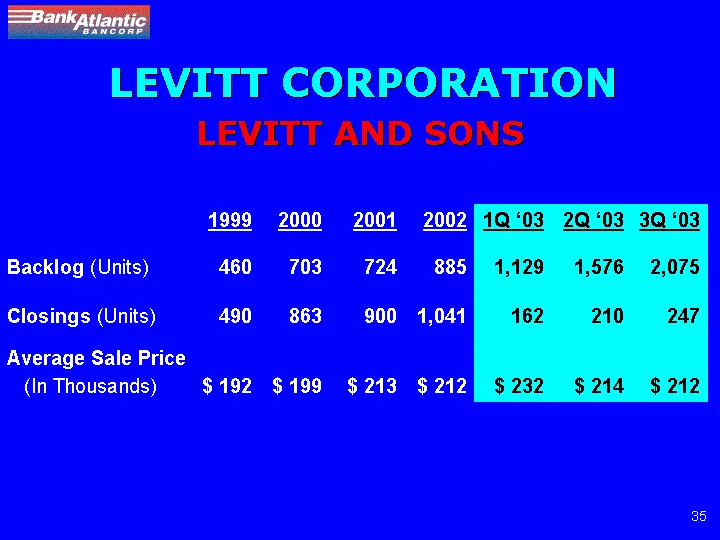
1999 2000 2001 2002 1Q '03 2Q '03 3Q '03 Backlog (Units) 460 703 724 885 1,129 1,576 2,075 Closings (Units) 490 863 900 1,041 162 210 247 Average Sale Price (In Thousands) $ 192 $ 199 $ 213 $ 212 $ 232 $ 214 $ 212 LEVITT AND SONS LEVITT CORPORATION
Slide 35: Core Communities
Developer of master-planned communities Product consists of: Residential tracts sold to builders Land for retail developers, schools and other community amenities CORE COMMUNITIES LEVITT CORPORATION
Slide 36: Core Communities
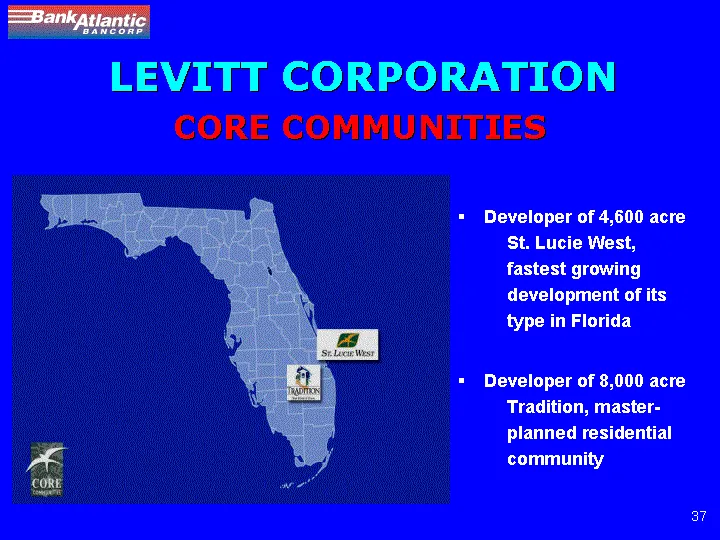
Developer of 4,600 acre St. Lucie West, fastest growing development of its type in Florida Developer of 8,000 acre Tradition, master- planned residential community CORE COMMUNITIES LEVITT CORPORATION
Slide 37: Bluegreen (40% Investment)
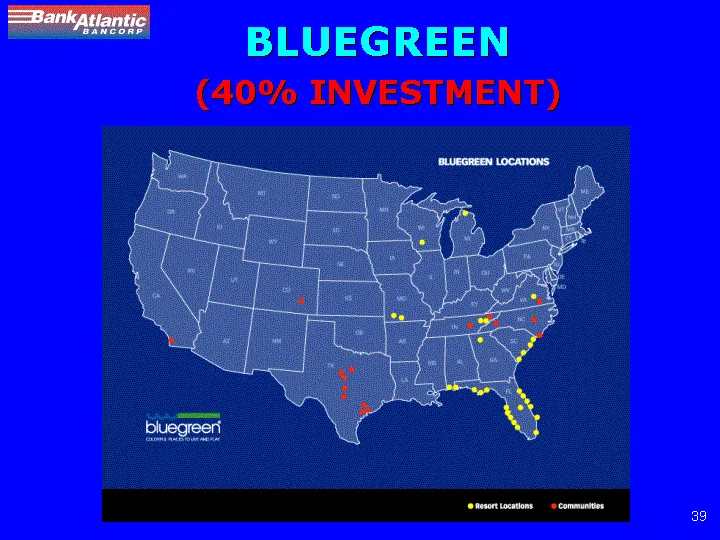
BLUEGREEN (40% INVESTMENT) Resort Developer Operator of Resort Properties under the timeshare model Operations throughout the US, primarily "drive-to" destinations Developer of Residential and Golf Communities
Slide 38: Bluegreen (40% Investment)
ie = BLUEGREEN (409o INVESTMENT)

Slide 39: Financial Results
FINANCIAL RESULTS
Slide 40: Income from Continuing Operations
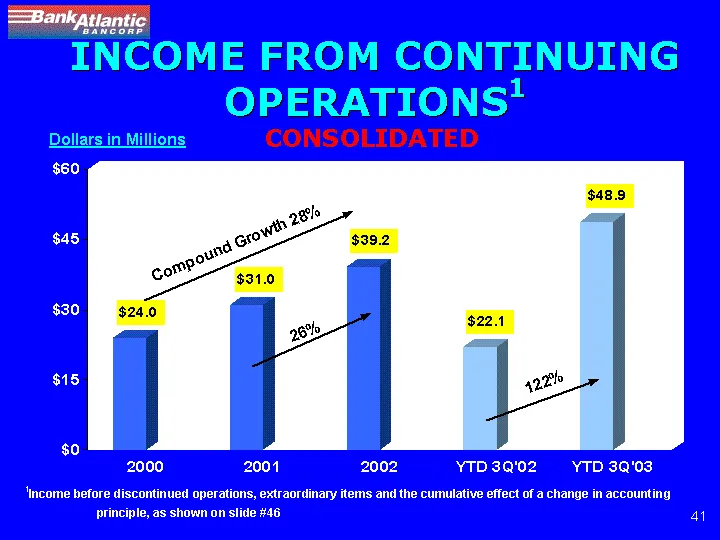
INCOME FROM CONTINUING OPERATIONS1 2000 2001 2002 YTD 3Q'02 YTD 3Q'03 Income from Continuing Ops 24 31 39.2 22.1 48.9 26% Compound Growth 28% CONSOLIDATED 122% Dollars in Millions 1Income before discontinued operations, extraordinary items and the cumulative effect of a change in accounting principl
Slide 41: EPS Trend from Continuing Operations
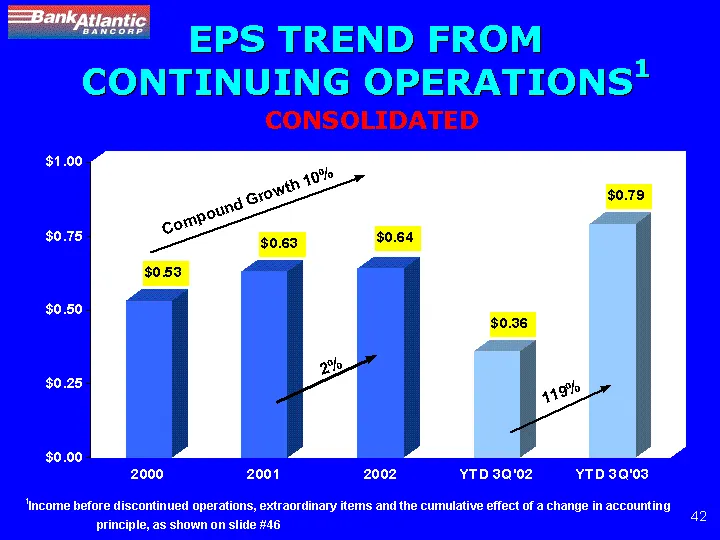
EPS TREND FROM CONTINUING OPERATIONS1 2000 2001 2002 YTD 3Q'02 YTD 3Q'03 EPS from Continuing Ops 0.53 0.63 0.64 0.36 0.79 Compound Growth 10% CONSOLIDATED 119% 1Income before discontinued operations, extraordinary items and the cumulative effect of a change in accounting principle, as shown on slide

Slide 42: Stockholder Value
STOCKHOLDER VALUE
Slide 43: Annual Return
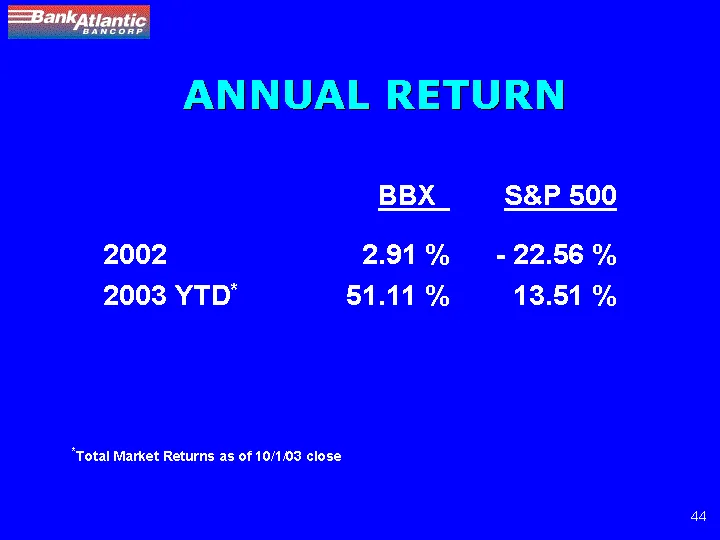
ANNUAL RETURN *Total Market Returns as of 10/1/03 close BBX S&P 500 2002 2.91 % - 22.56 % 2003 YTD* 51.11 % 13.51 %
Slide 44: Building Block Valuation
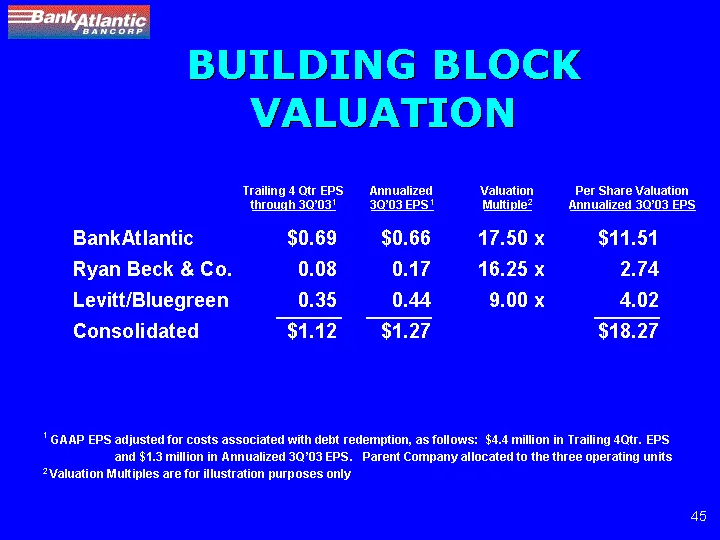
BUILDING BLOCK VALUATION BankAtlantic $0.69 $0.66 17.50 x $11.51 Ryan Beck & Co. 0.08 0.17 16.25 x 2.74 Levitt/Bluegreen 0.35 0.44 9.00 x 4.02 Consolidated $1.12 $1.27 $18.27 Valuation Multiple2 Trailing 4 Qtr EPS through 3Q'031 1 GAAP EPS adjusted for costs associated with debt redemption, as follo
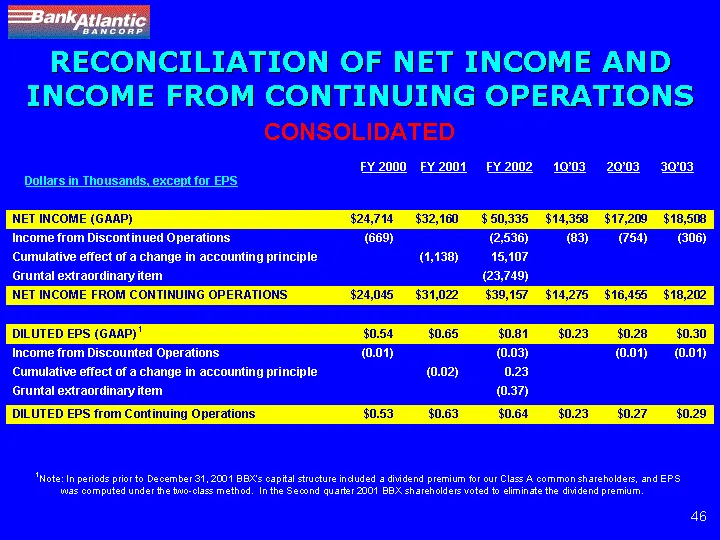
Slide 45: Consolidated Reconciliation of Net Income and Income from Continuing Operations
CONSOLIDATED RECONCILIATION OF NET INCOME AND INCOME FROM CONTINUING OPERATIONS Dollars in Thousands, except for EPS NET INCOME (GAAP) $24,714 $32,160 $ 50,335 $14,358 $17,209 $18,508 Income from Discontinued Operations (669) (2,536) (83) (754) (306) Cumulative effect of a change in accounting princ

Slide 46: Forward-Looking Information
FORWARD-LOOKING INFORMATION Except for historical information contained herein, the matters discussed in these slides contain forward-looking statements within the meaning of Section 27A of the Securities Act of 1933, as amended (the "Securities Act"), and Section 21E of the Securities Exchange Act

Slide 47

Slide 48: Supplemental Data
SUPPLEMENTAL DATA
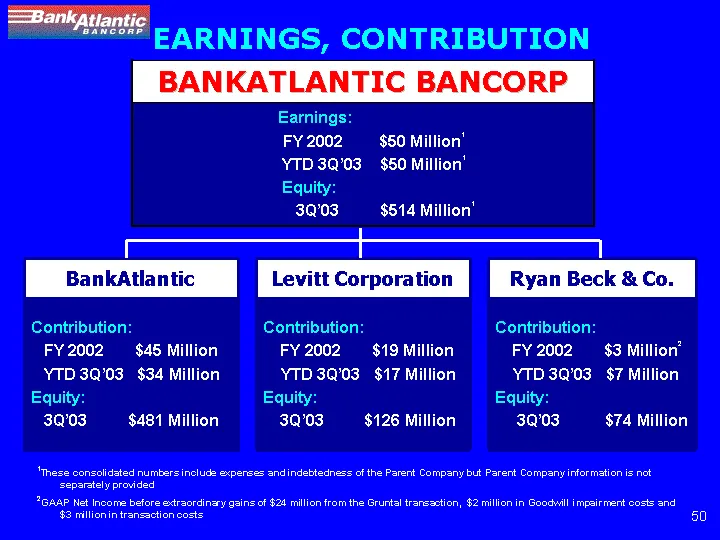
Slide 49: Earnings, Contribution
BankAtlantic Levitt Corporation Ryan Beck & Co. Contribution: FY 2002 $45 Million YTD 3Q'03 $34 Million Equity: 3Q'03 $481 Million Contribution: FY 2002 $19 Million YTD 3Q'03 $17 Million Equity: 3Q'03 $126 Million Contribution: FY 2002 $3 Million2 YTD 3Q'03 $7 Million Equity: 3Q'03 $74 Million BANKA
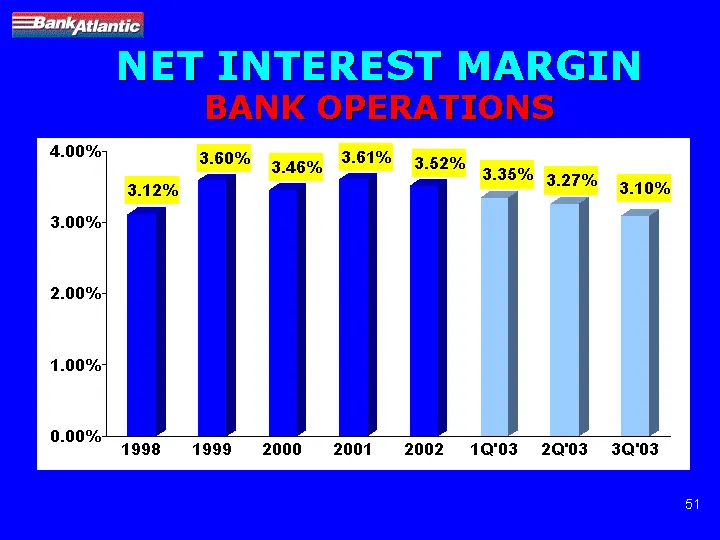
Slide 50: Net Interest Margin
1998 1999 2000 2001 2002 1Q'03 2Q'03 3Q'03 NIM 0.0312 0.036 0.0346 0.0361 0.0352 0.0335 0.0327 0.031 NET INTEREST MARGIN BANK OPERATIONS 101
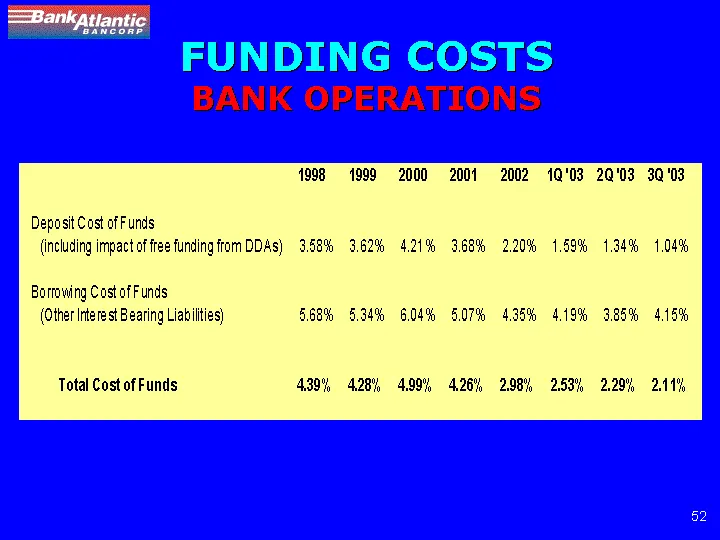
Slide 51: Funding Costs
FUNDING COSTS BANK OPERATIONS
Slide 52: Total Assets
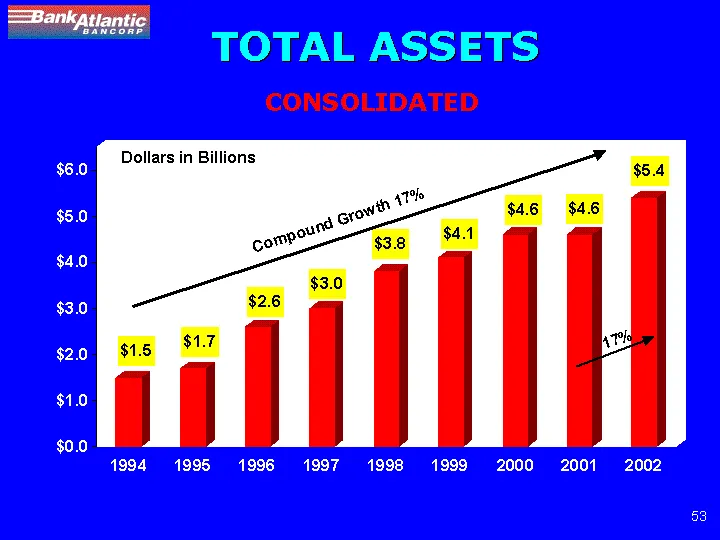
1994 1995 1996 1997 1998 1999 2000 2001 2002 TOTAL ASSETS 1.5 1.7 2.6 3 3.8 4.1 4.6 4.6 5.4 TOTAL ASSETS Compound Growth 17% 17% Dollars in Billions CONSOLIDATED
Slide 53: Financial Highlights, 3rd Quarter 2003 Consolidated
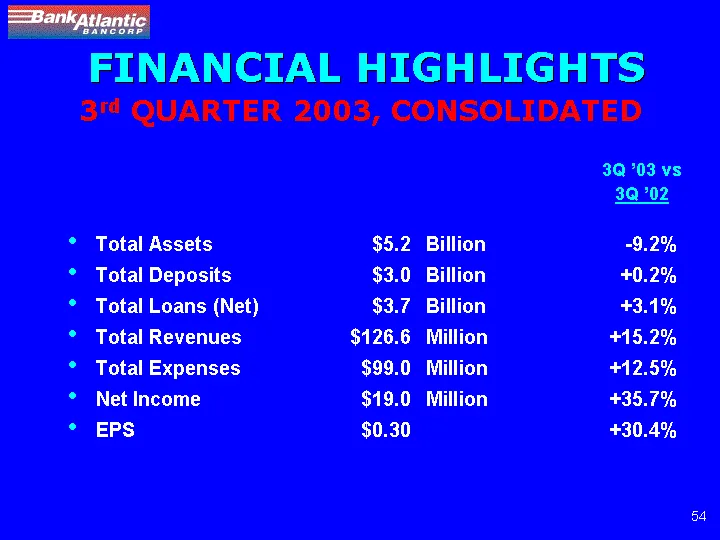
FINANCIAL HIGHLIGHTS Total Assets $5.2 Billion -9.2% Total Deposits $3.0 Billion +0.2% Total Loans (Net) $3.7 Billion +3.1% Total Revenues $126.6 Million +15.2% Total Expenses $99.0 Million +12.5% Net Income $19.0 Million +35.7% EPS $0.30 +30.4% 3Q '03 vs 3Q '02 3rd QUARTER 2003, CONSOLIDATED
Slide 54: Levitt Corporation Post Spin Pro Forma
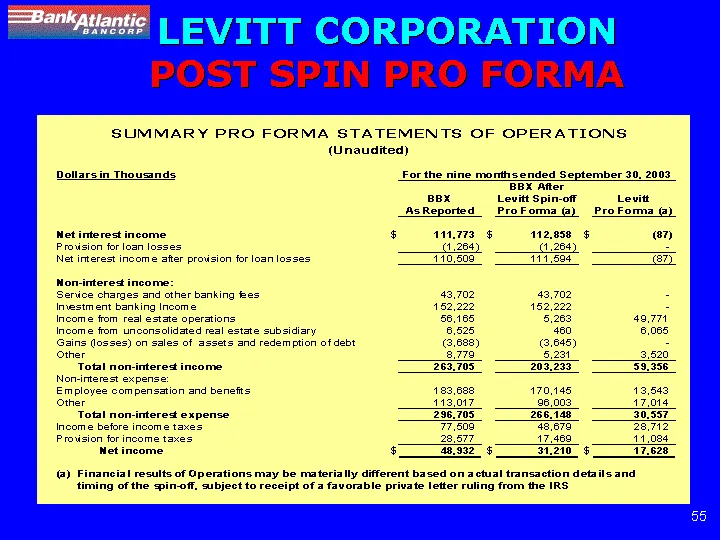
LEVITT CORPORATION POST SPIN PRO FORMA
Slide 55: Levitt Corporation Post Spin Pro Forma
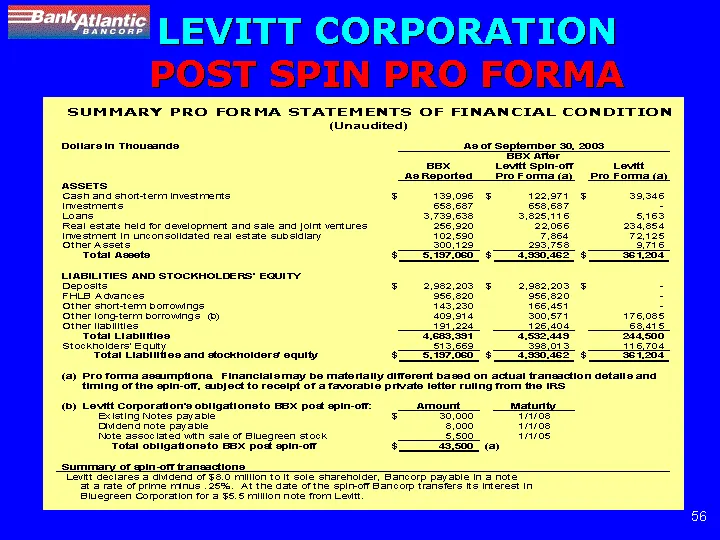
LEVITT CORPORATION POST SPIN PRO FORMA
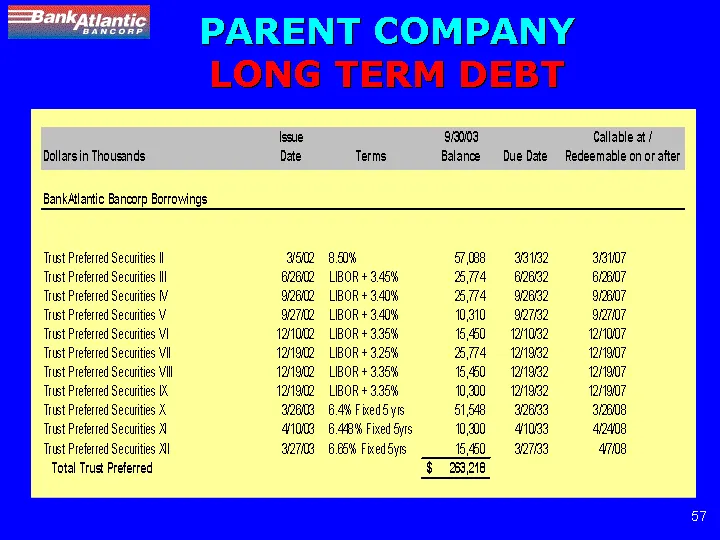
Slide 56: Parent Company Long Term Debt
PARENT COMPANY LONG TERM DEBT

Slide 57
Source: SEC EDGAR · 8-K filed Oct 24, 2003
More decks from BBX Capital Inc
 Merger or Acquisition (November 2016)60 slides · Nov 21, 2016
 Merger or Acquisition (October 2016)61 slides · Oct 11, 2016
 Merger or Acquisition (July 2016)11 slides · Jul 28, 2016
 Investor Presentation (November 2014)77 slides · Nov 26, 2014
 Merger or Acquisition (November 2014)77 slides · Nov 26, 2014
 Merger or Acquisition (September 2014)74 slides · Sep 19, 2014