Santander Holdings USA Inc · NYSE:SNUS/PH
Santander Holdings USA — Debt Investor Presentation (May 2022)
30 slides from Santander Holdings USA's debt investor presentation, May 9, 2022
Slide 1: First Quarter 2022 Fixed Income Investor Presentation
1 May 6, 2022 SANTANDER HOLDINGS USA, INC. First Quarter 2022 Fixed Income Investor Presentation
Slide 2: Important Information
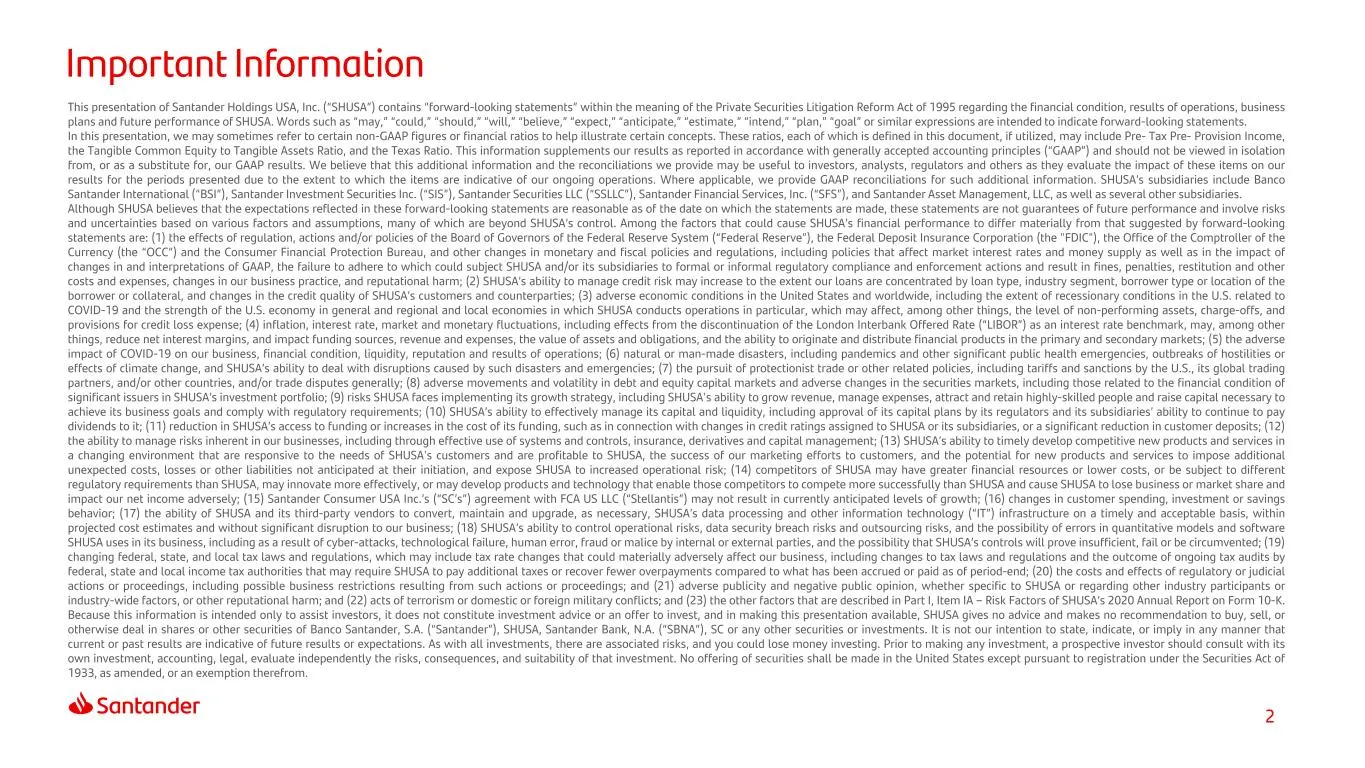
2 Important Information This presentation of Santander Holdings USA, Inc. (“SHUSA”) contains “forward-looking statements” within the meaning of the Private Securities Litigation Reform Act of 1995 regarding the financial condition, results of operations, business plans and future performance of SHUS
Slide 3: Index
3 1 At a Glance 2 Summary 3 Results 4 Appendix Index
Slide 4: Santander Group
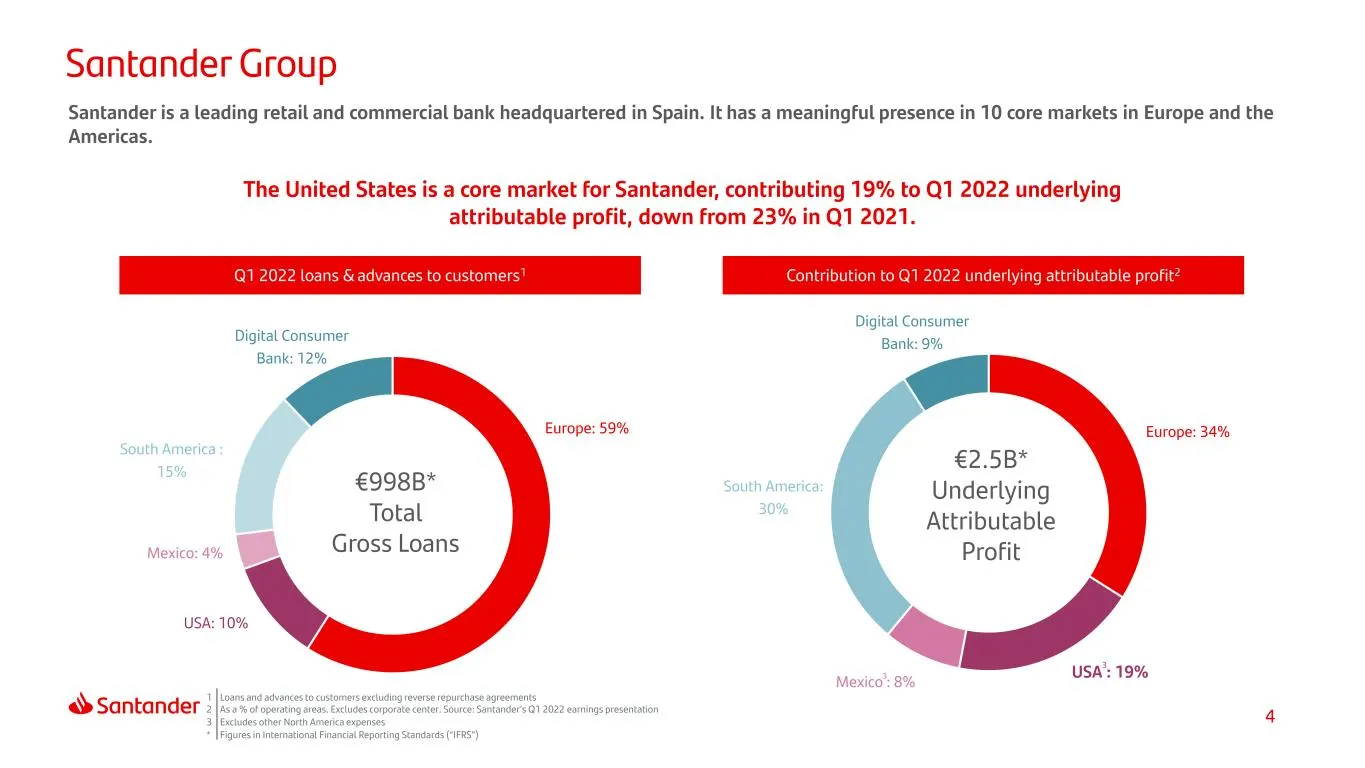
4 Europe: 59% USA: 10% Mexico: 4% South America : 15% Digital Consumer Bank: 12% Europe: 34% USA : 19% Mexico : 8% South America: 30% Digital Consumer Bank: 9% Santander Group The United States is a core market for Santander, contributing 19% to Q1 2022 underlying attributable profit, down from 23%
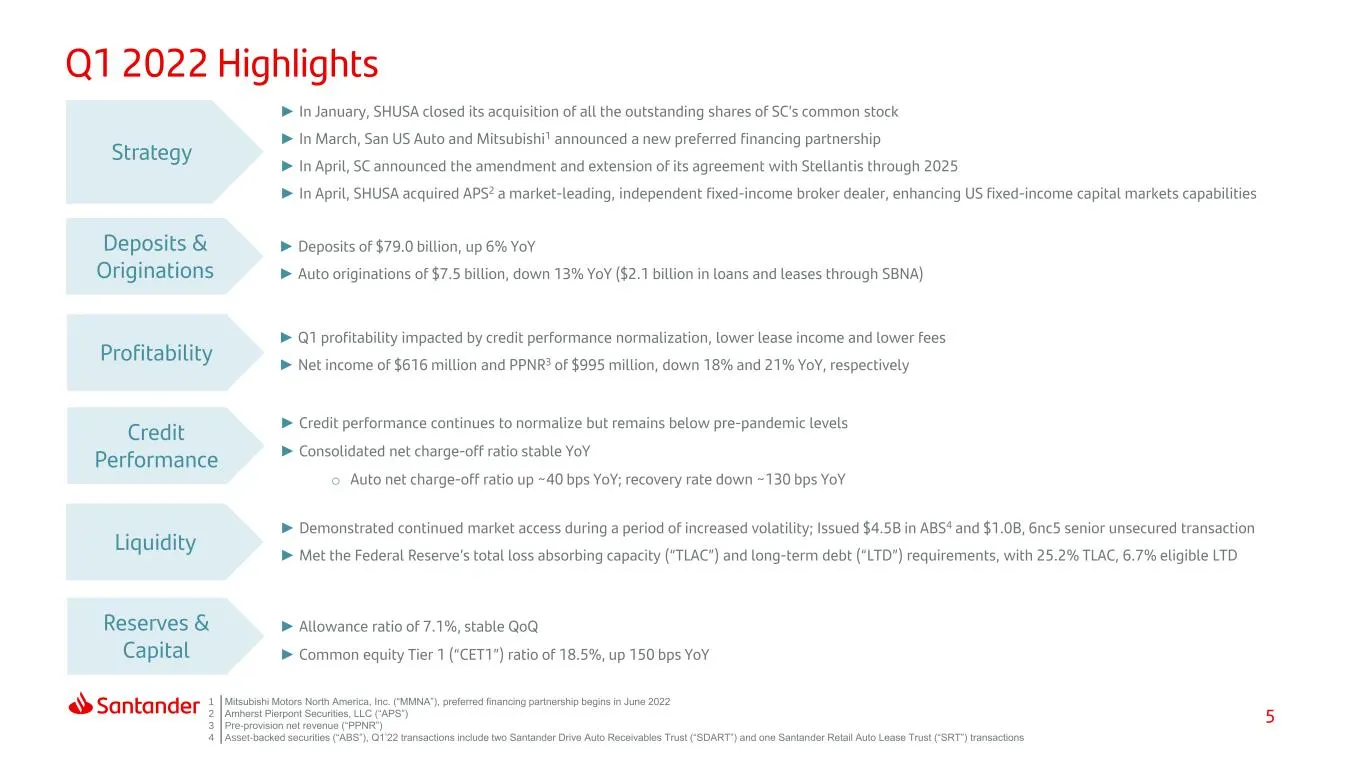
Slide 5: Q1 2022 Highlights
5 Q1 2022 Highlights Credit Performance Deposits & Originations Liquidity Reserves & Capital ► Deposits of $79.0 billion, up 6% YoY ► Auto originations of $7.5 billion, down 13% YoY ($2.1 billion in loans and leases through SBNA) ► Allowance ratio of 7.1%, stable QoQ ► Common equity Tier 1 (“CET1”)
Slide 6: At a Glance
6 1 At a Glance 2 Summary 3 Results 4 Appendix Index
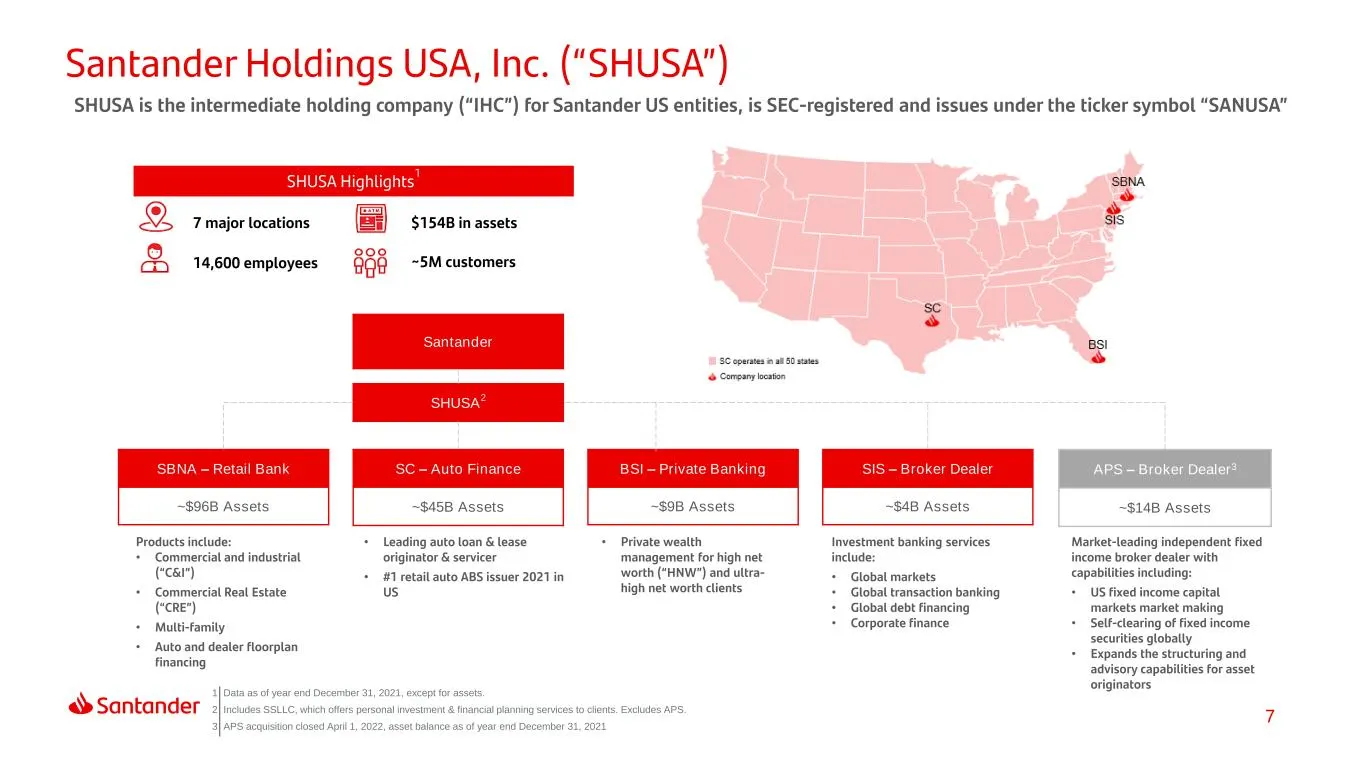
Slide 7: SHUSA Highlights
7 Santander Holdings USA, Inc. (“SHUSA”) SHUSA Highlights 1 14,600 employees ~5M customers $154B in assets7 major locations SHUSA is the intermediate holding company (“IHC”) for Santander US entities, is SEC-registered and issues under the ticker symbol “SANUSA” SHUSA 2 SBNA – Retail Bank ~$96B Asse
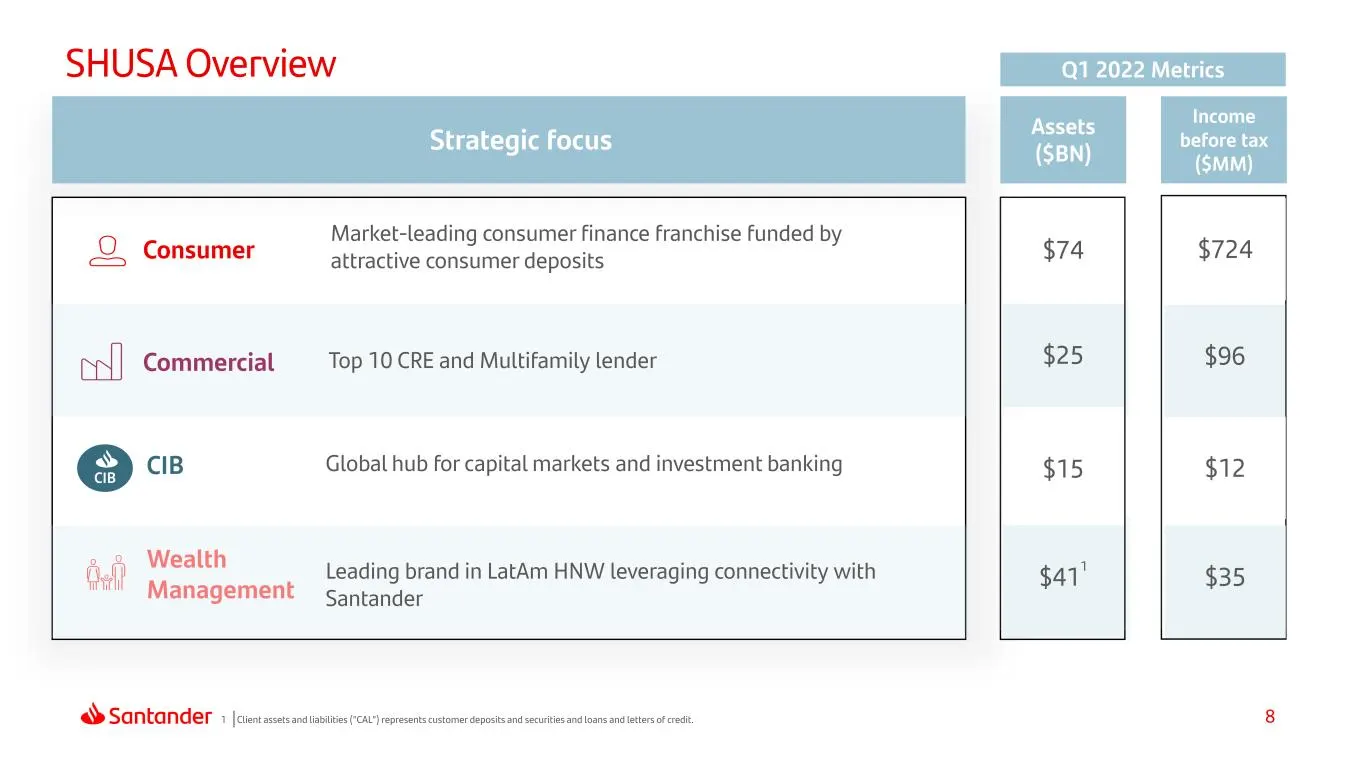
Slide 8: Strategic focus
8 Strategic focus Strategic focus CIB Consumer Commercial CIB Wealth Management Market-leading consumer finance franchise funded by attractive consumer deposits Top 10 CRE and Multifamily lender Global hub for capital markets and investment banking Leading brand in LatAm HNW leveraging connectivity
Slide 9: Balance Sheet Overview
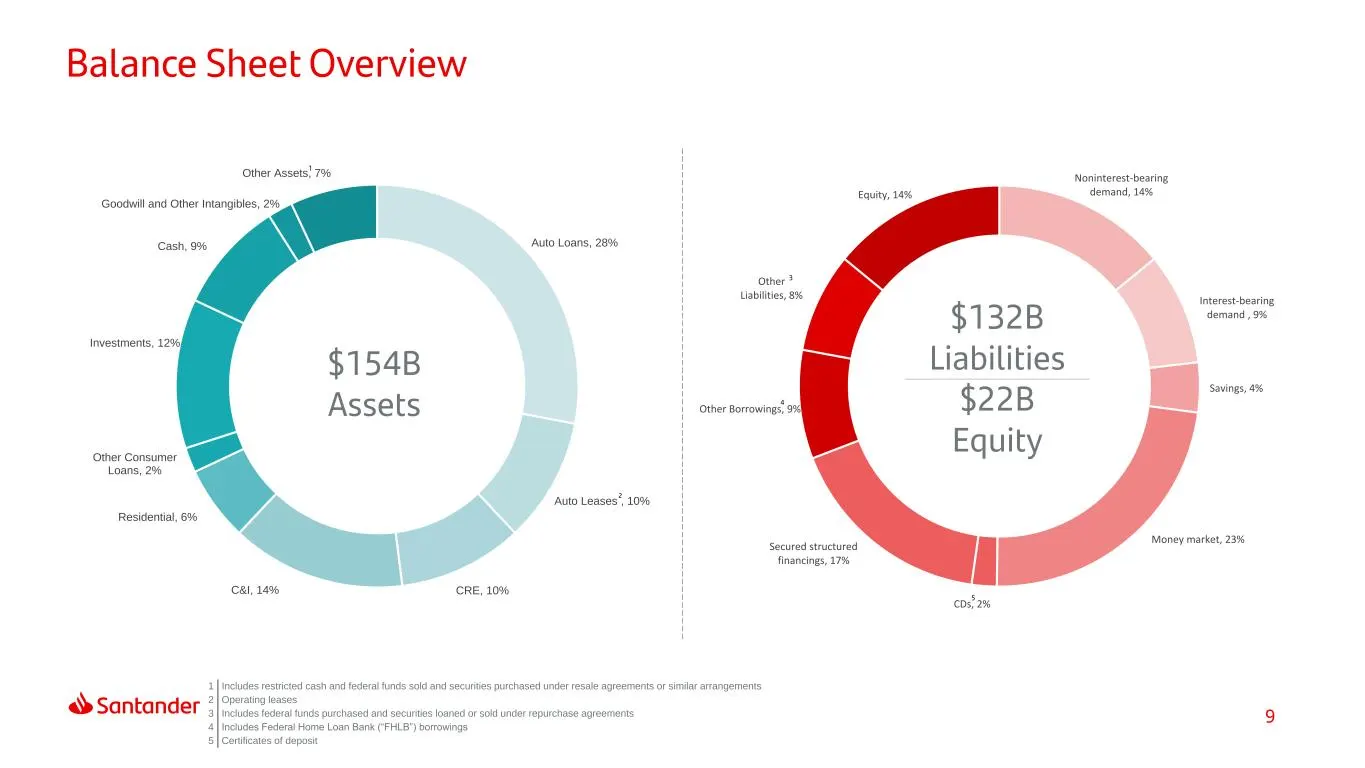
9 Auto Loans, 28% Auto Leases , 10% CRE, 10%C&I, 14% Residential, 6% Other Consumer Loans, 2% Investments, 12% Cash, 9% Goodwill and Other Intangibles, 2% Other Assets, 7% Noninterest-bearing demand, 14% Interest-bearing demand , 9% Savings, 4% Money market, 23% CDs, 2% Secured structured financings
Slide 10: Balance Sheet Trends
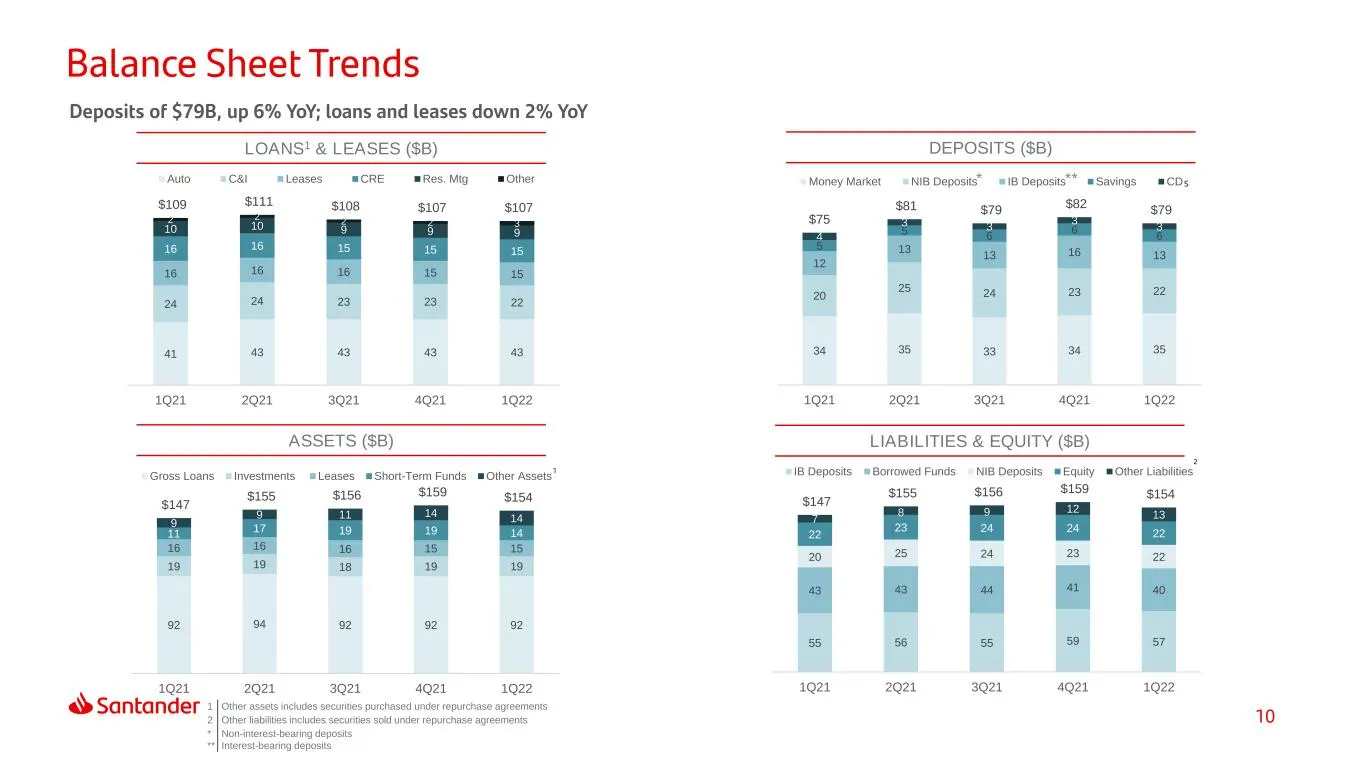
10 55 56 55 59 57 43 43 44 41 40 20 25 24 23 22 22 23 24 24 22 7 8 9 12 13 $147 $155 $156 $159 $154 1Q21 2Q21 3Q21 4Q21 1Q22 IB Deposits Borrowed Funds NIB Deposits Equity Other Liabilities 92 94 92 92 92 19 19 18 19 19 16 16 16 15 15 11 17 19 19 14 9 9 11 14 14 $147 $155 $156 $159 $154 1Q21 2Q21 3Q
Slide 11: Quarterly Profitability
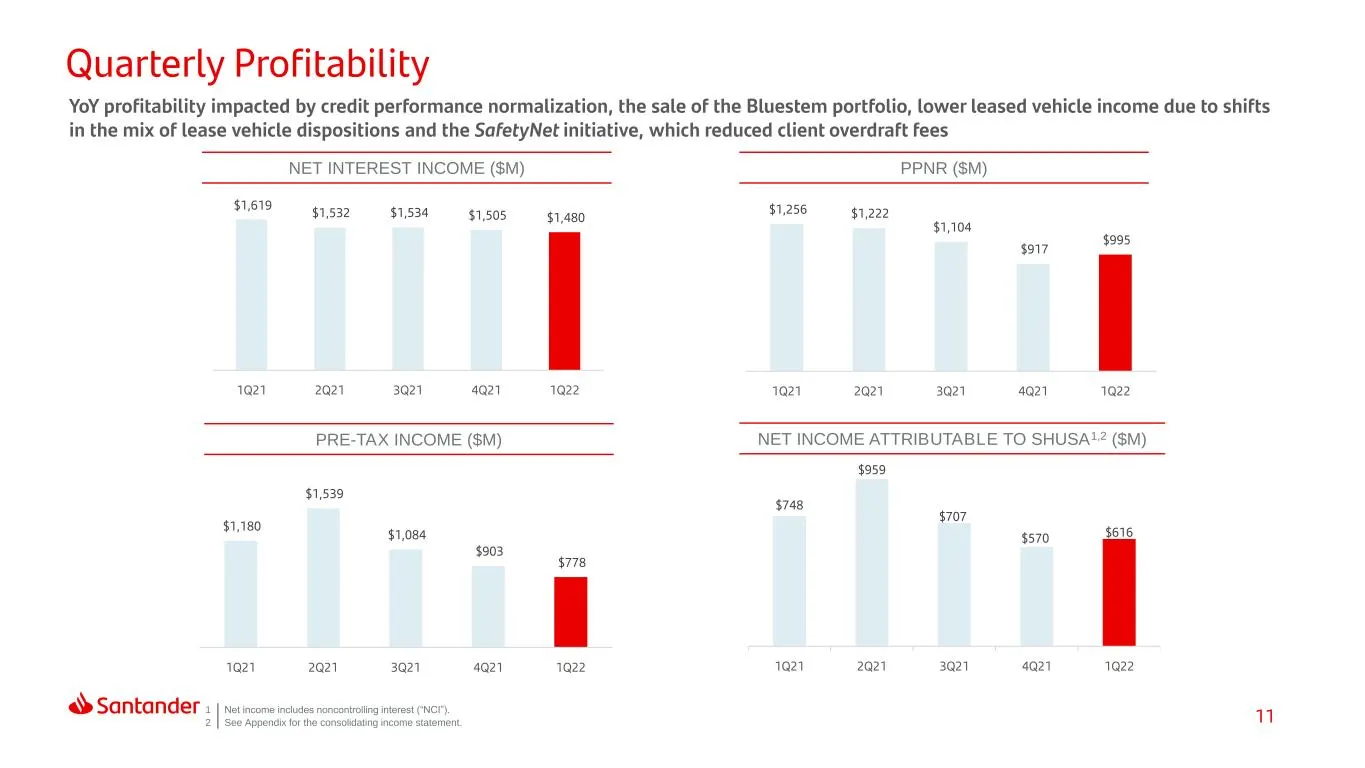
11 $1,619 $1,532 $1,534 $1,505 $1,480 1Q21 2Q21 3Q21 4Q21 1Q22 $1,180 $1,539 $1,084 $903 $778 1Q21 2Q21 3Q21 4Q21 1Q22 $1,256 $1,222 $1,104 $917 $995 1Q21 2Q21 3Q21 4Q21 1Q22 $748 $959 $707 $570 $616 1Q21 2Q21 3Q21 4Q21 1Q22 Quarterly Profitability NET INTEREST INCOME ($M) PRE-TAX INCOME ($M) NET IN
Slide 12: Net Interest Margin & Interest Rate Risk Sensitivity
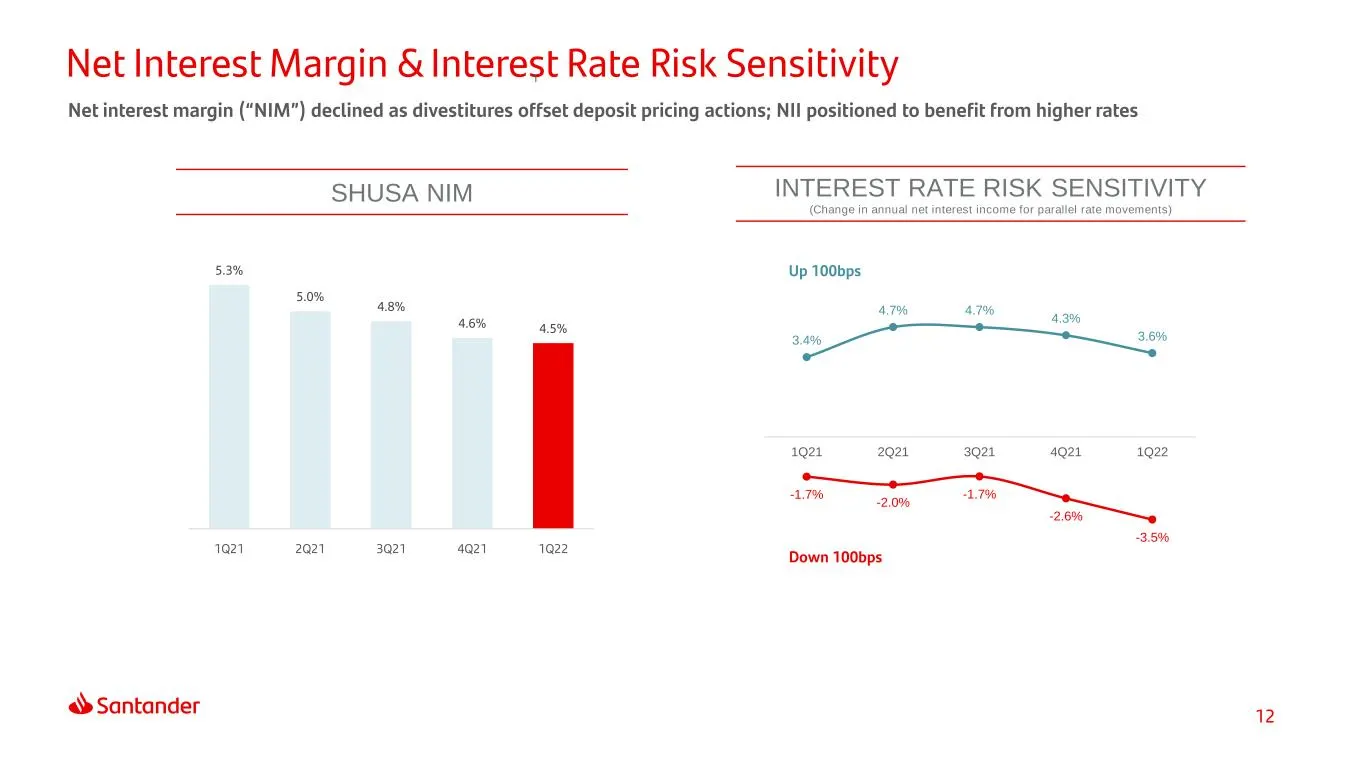
12 -1.7% -2.0% -1.7% -2.6% -3.5% 3.4% 4.7% 4.7% 4.3% 3.6% 1Q21 2Q21 3Q21 4Q21 1Q22 Net Interest Margin & Interest Rate Risk Sensitivity Net interest margin (“NIM”) declined as divestitures offset deposit pricing actions; NII positioned to benefit from higher rates SHUSA NIM Down 100bps Up 100bps INT
Slide 13: ESG Strategy Implementation
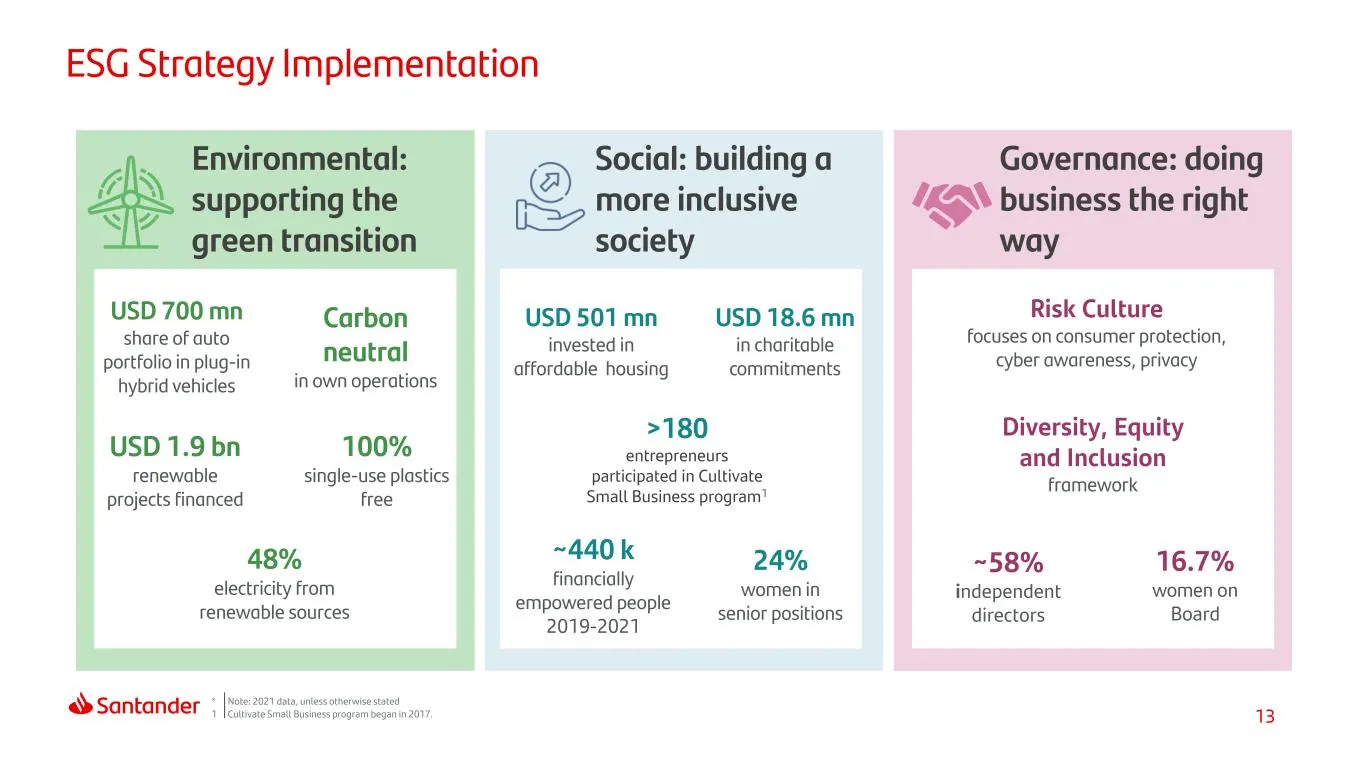
13 ESG Strategy Implementation Environmental: supporting the green transition Social: building a more inclusive society ~440 k financially empowered people 2019-2021 Governance: doing business the right way 24% women in senior positions 48% electricity from renewable sources ~58% independent directo
Slide 14: Results
14 1 At a Glance 2 Summary 3 Results 4 Appendix Index
Slide 15: Auto Originations
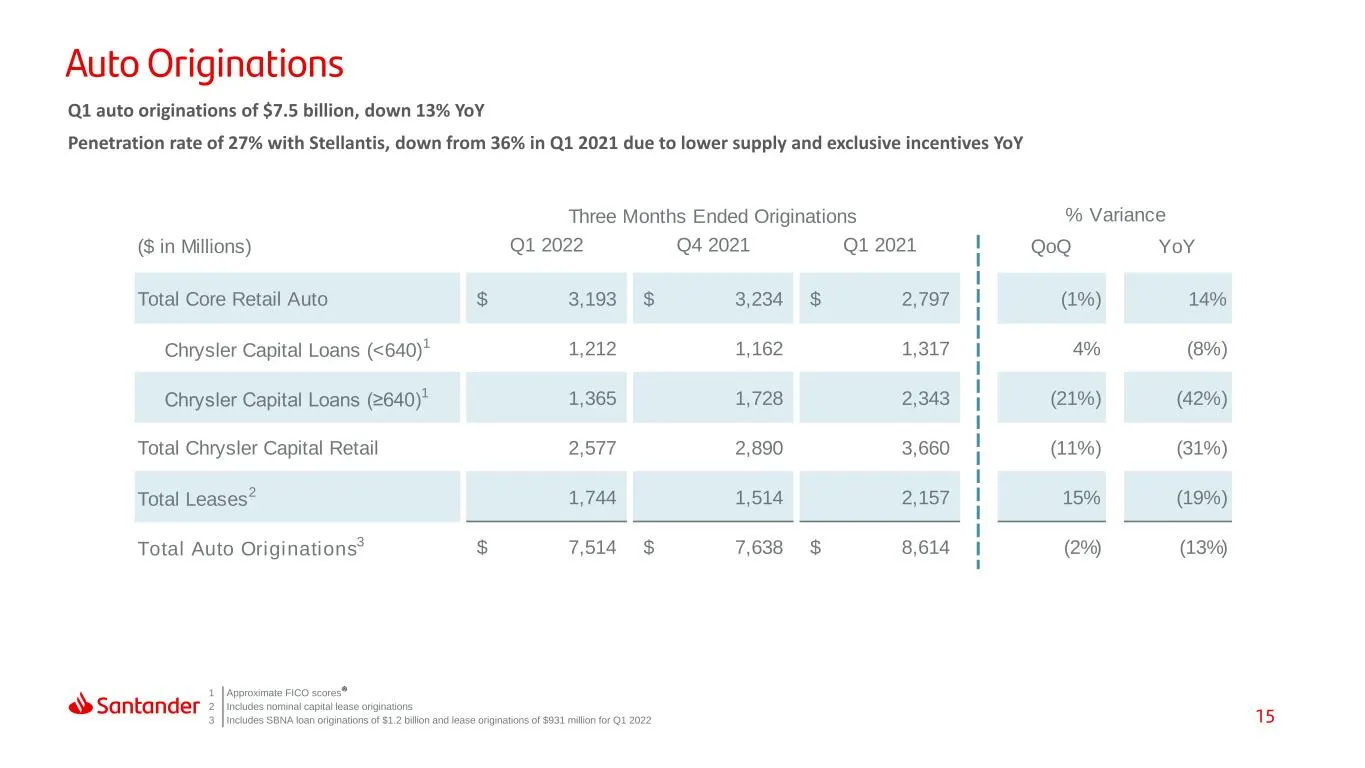
15 Auto Originations 1 Approximate FICO scores 2 Includes nominal capital lease originations 3 Includes SBNA loan originations of $1.2 billion and lease originations of $931 million for Q1 2022 Q1 auto originations of $7.5 billion, down 13% YoY Penetration rate of 27% with Stellantis, down from 36%
Slide 16: Asset Quality
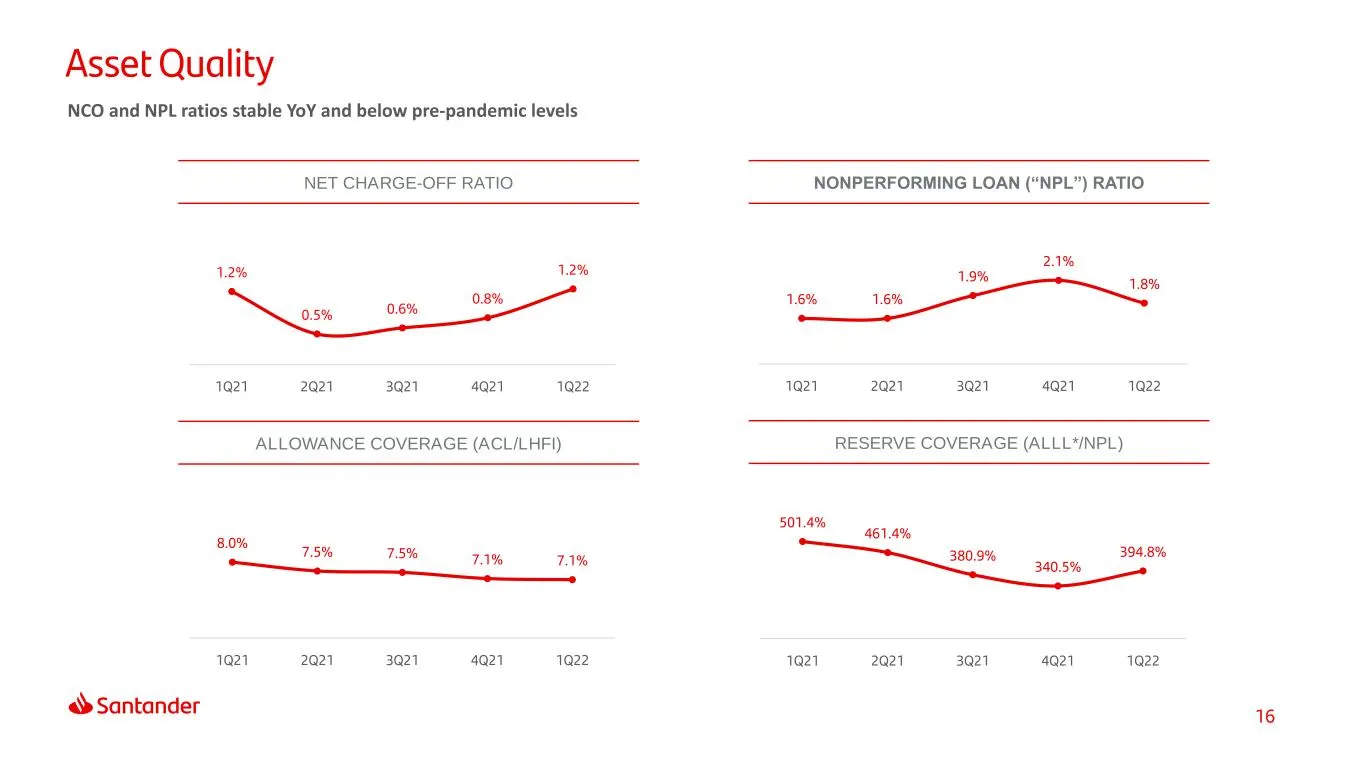
16 501.4% 461.4% 380.9% 340.5% 394.8% 1Q21 2Q21 3Q21 4Q21 1Q22 1.2% 0.5% 0.6% 0.8% 1.2% 1Q21 2Q21 3Q21 4Q21 1Q22 8.0% 7.5% 7.5% 7.1% 7.1% 1Q21 2Q21 3Q21 4Q21 1Q22 1.6% 1.6% 1.9% 2.1% 1.8% 1Q21 2Q21 3Q21 4Q21 1Q22 Asset Quality NCO and NPL ratios stable YoY and below pre-pandemic levels NET CHARGE-OF
Slide 17: Allowance For Credit Losses
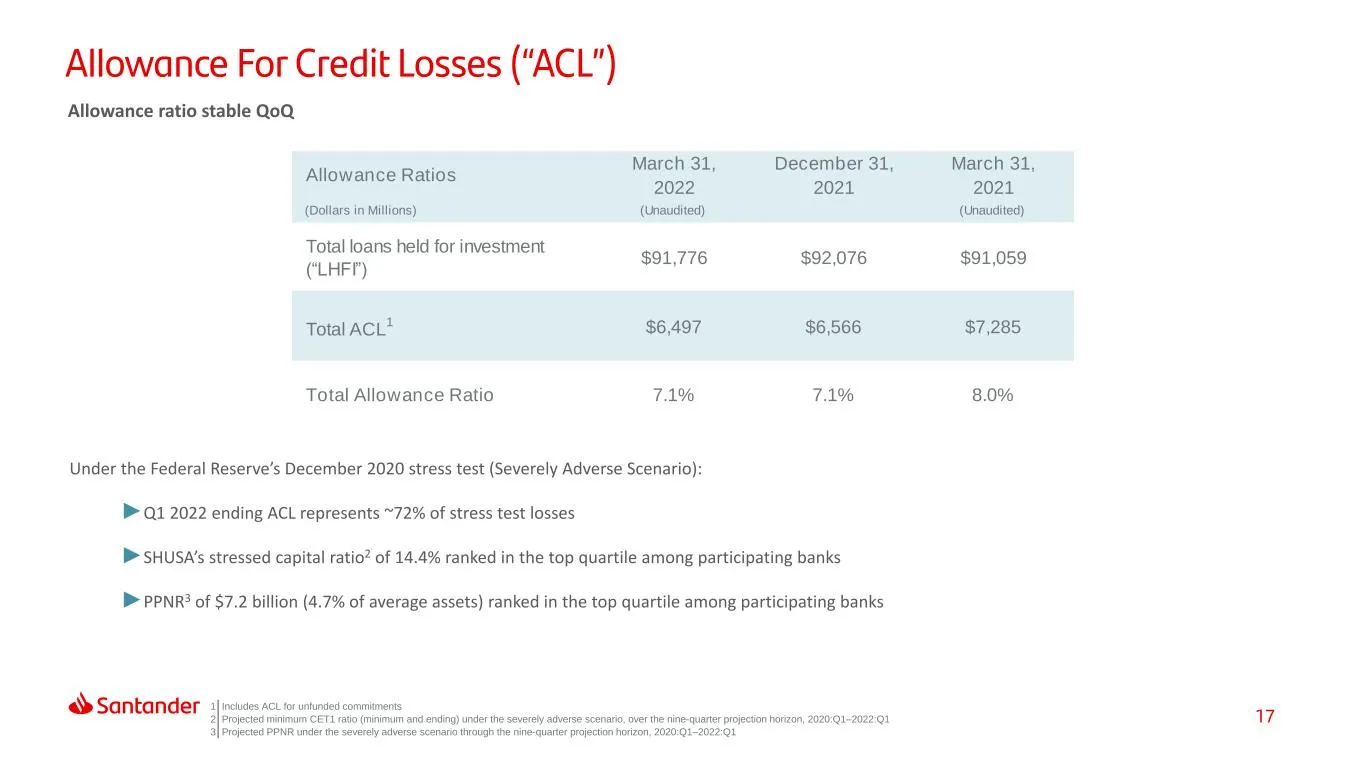
17 Allowance For Credit Losses (“ACL”) Under the Federal Reserve’s December 2020 stress test (Severely Adverse Scenario): ►Q1 2022 ending ACL represents ~72% of stress test losses ►SHUSA’s stressed capital ratio2 of 14.4% ranked in the top quartile among participating banks ►PPNR3 of $7.2 billion (4
Slide 18: Borrowed Funds Profile
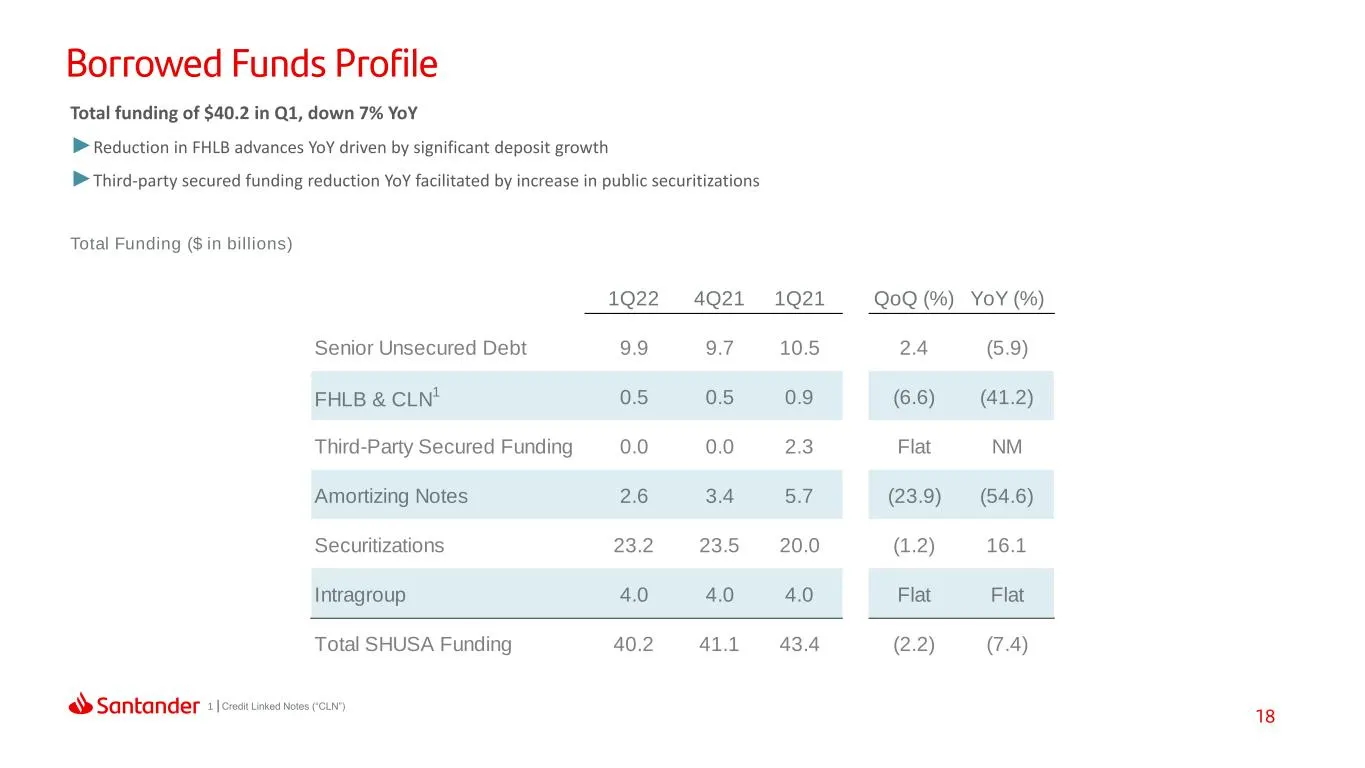
18 Borrowed Funds Profile Total Funding ($ in billions) Total funding of $40.2 in Q1, down 7% YoY ►Reduction in FHLB advances YoY driven by significant deposit growth ►Third-party secured funding reduction YoY facilitated by increase in public securitizations 1 Credit Linked Notes (“CLN”) 1Q22 4Q21
Slide 19: Debt & Total Loss-Absorbing Capacity
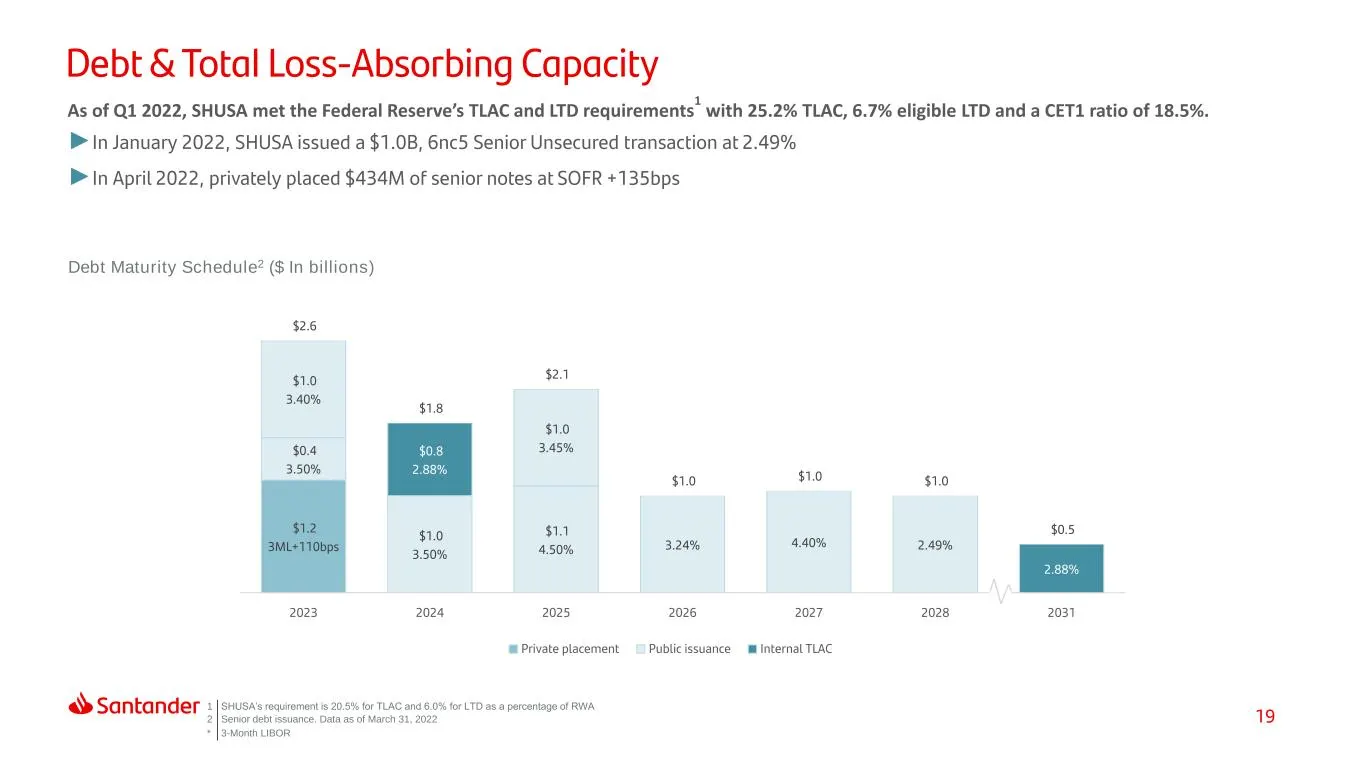
19 $1.2 3ML+110bps $0.4 3.50% $1.1 4.50% $1.0 3.40% $1.0 3.50% $1.0 3.45% 3.24% 4.40% 2.49% $0.8 2.88% 2.88% $2.6 $1.8 $2.1 $1.0 $1.0 $1.0 $0.5 2023 2024 2025 2026 2027 2028 2031 Private placement Public issuance Internal TLAC Debt & Total Loss-Absorbing Capacity 1 SHUSA’s requirement is 20.5% for T
Slide 20: Capital Ratios
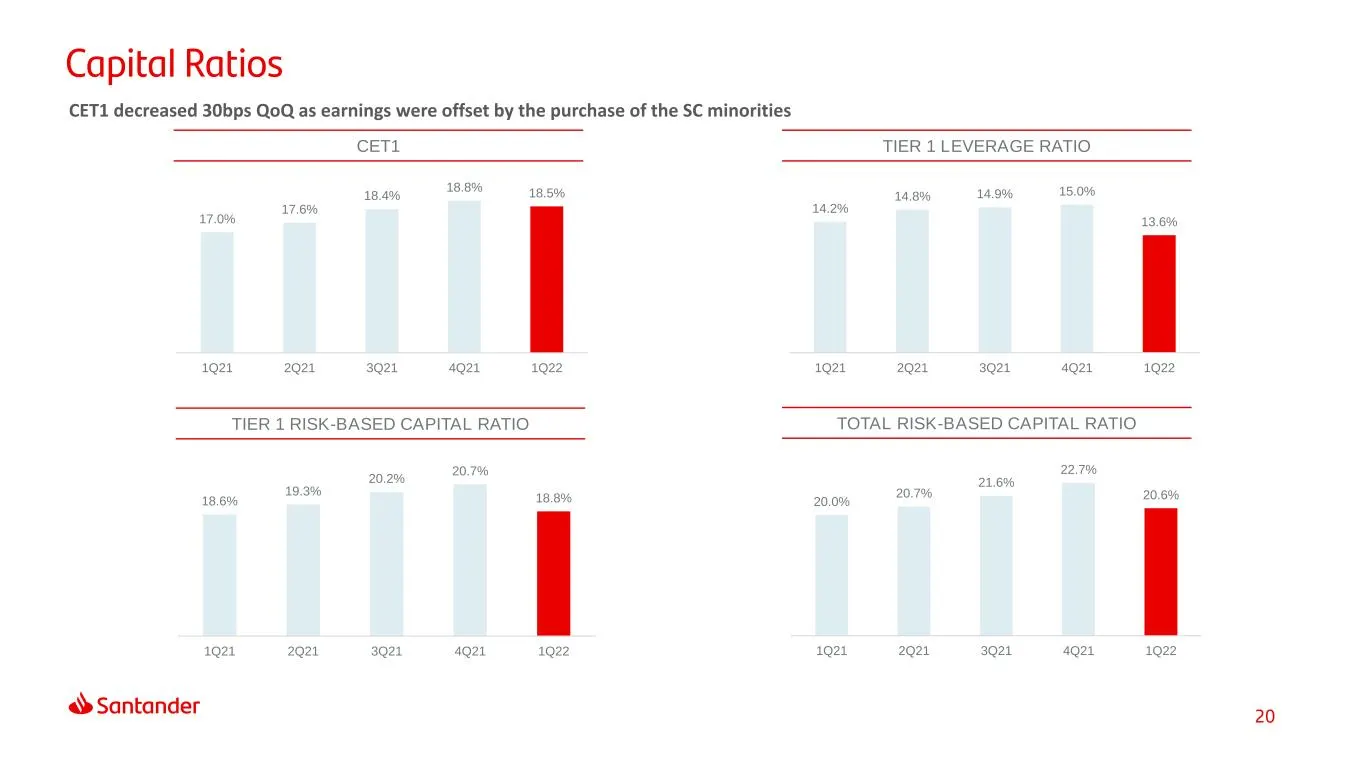
20 14.2% 14.8% 14.9% 15.0% 13.6% 1Q21 2Q21 3Q21 4Q21 1Q22 18.6% 19.3% 20.2% 20.7% 18.8% 1Q21 2Q21 3Q21 4Q21 1Q22 20.0% 20.7% 21.6% 22.7% 20.6% 1Q21 2Q21 3Q21 4Q21 1Q22 17.0% 17.6% 18.4% 18.8% 18.5% 1Q21 2Q21 3Q21 4Q21 1Q22 Capital Ratios CET1 TIER 1 RISK-BASED CAPITAL RATIO TOTAL RISK-BASED CAPITAL
Slide 21: Rating Agencies
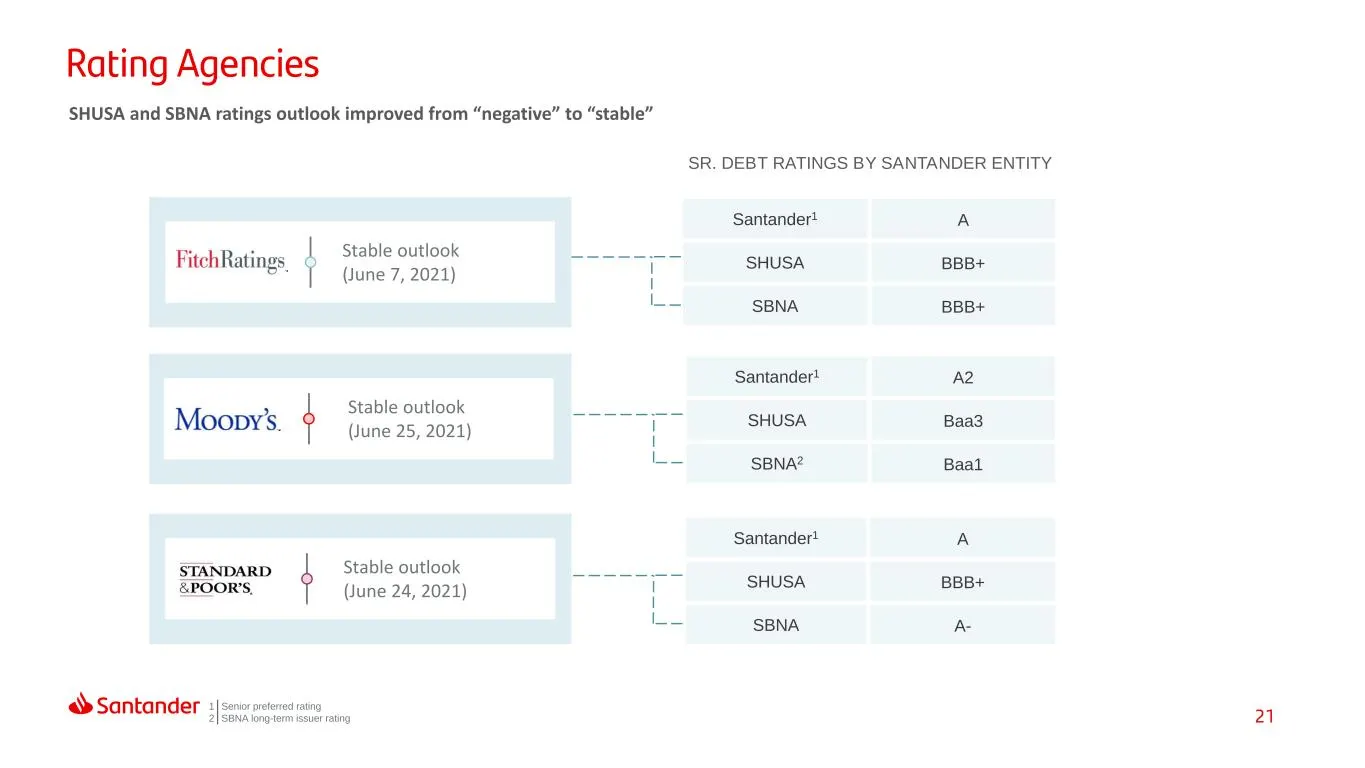
21 Rating Agencies Santander1 A2 SHUSA Baa3 SBNA2 Baa1 Santander1 A SHUSA BBB+ SBNA A- Stable outlook (June 7, 2021) SHUSA and SBNA ratings outlook improved from “negative” to “stable” SR. DEBT RATINGS BY SANTANDER ENTITY Santander1 A SHUSA BBB+ SBNA BBB+ Stable outlook (June 25, 2021) Stable outloo
Slide 22: Appendix
22 1 At a Glance 2 Summary 3 Results 4 Appendix Index
Slide 23: Consumer Activities
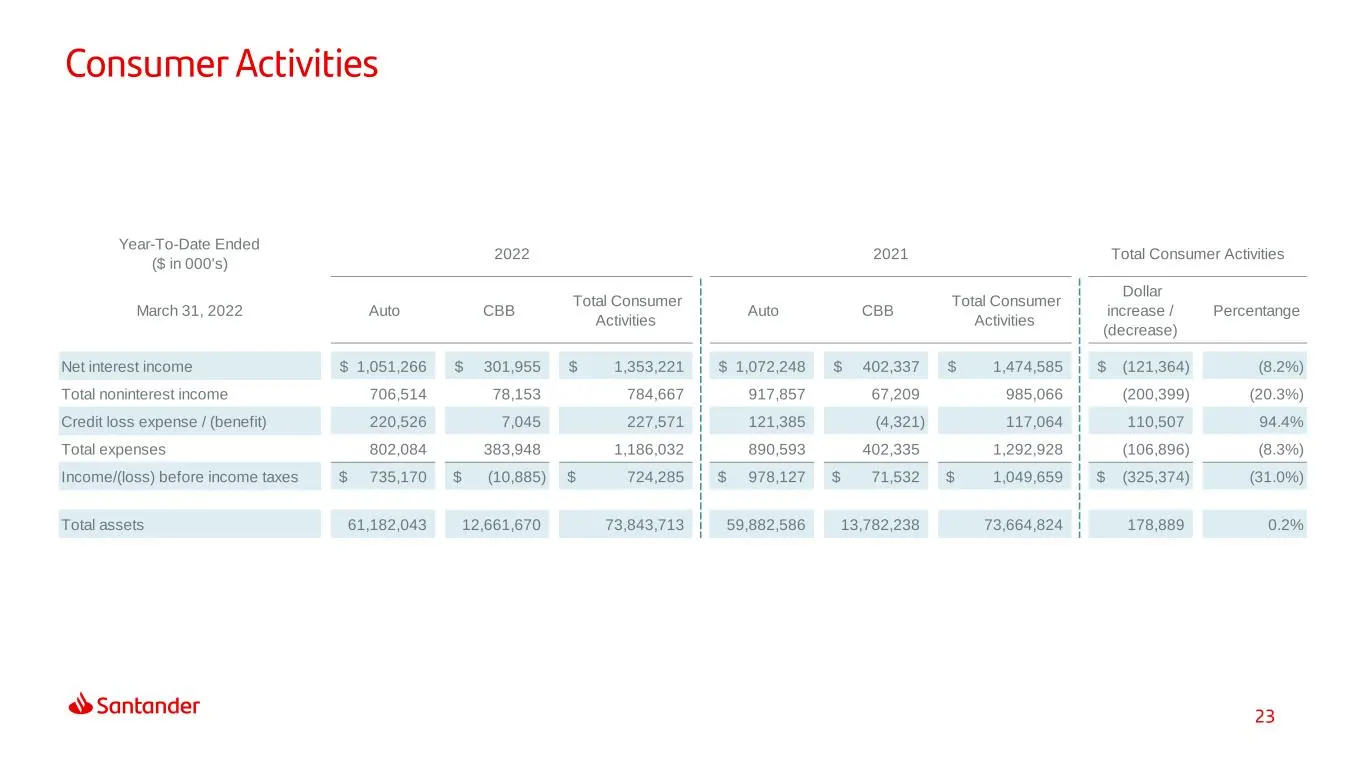
23 Consumer Activities Year-To-Date Ended ($ in 000's) March 31, 2022 Auto CBB Total Consumer Activities Auto CBB Total Consumer Activities Dollar increase / (decrease) Percentange Net interest income 1,051,266$ 301,955$ 1,353,221$ 1,072,248$ 402,337$ 1,474,585$ (121,364)$ (8.2%) Total noninterest i
Slide 24: Commercial Activities
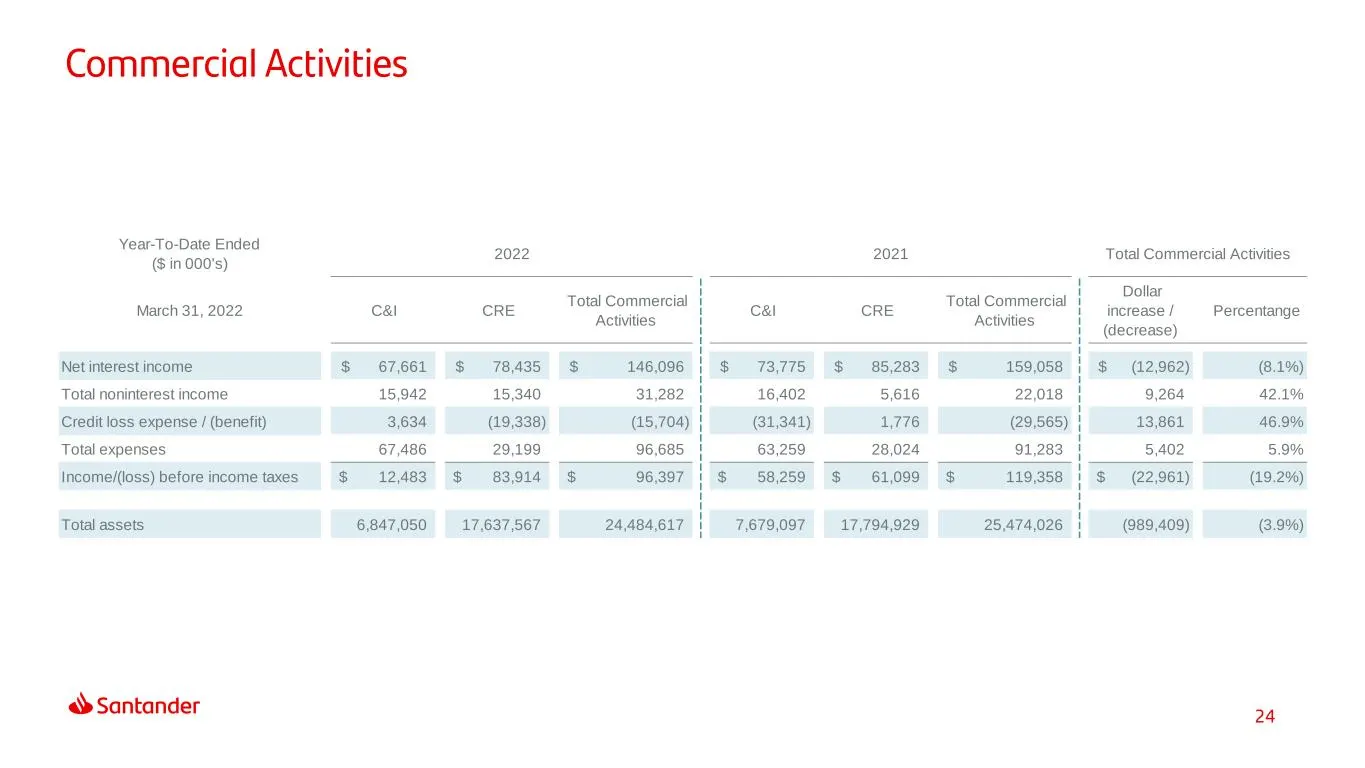
24 Commercial Activities Year-To-Date Ended ($ in 000's) March 31, 2022 C&I CRE Total Commercial Activities C&I CRE Total Commercial Activities Dollar increase / (decrease) Percentange Net interest income 67,661$ 78,435$ 146,096$ 73,775$ 85,283$ 159,058$ (12,962)$ (8.1%) Total noninterest income 15,
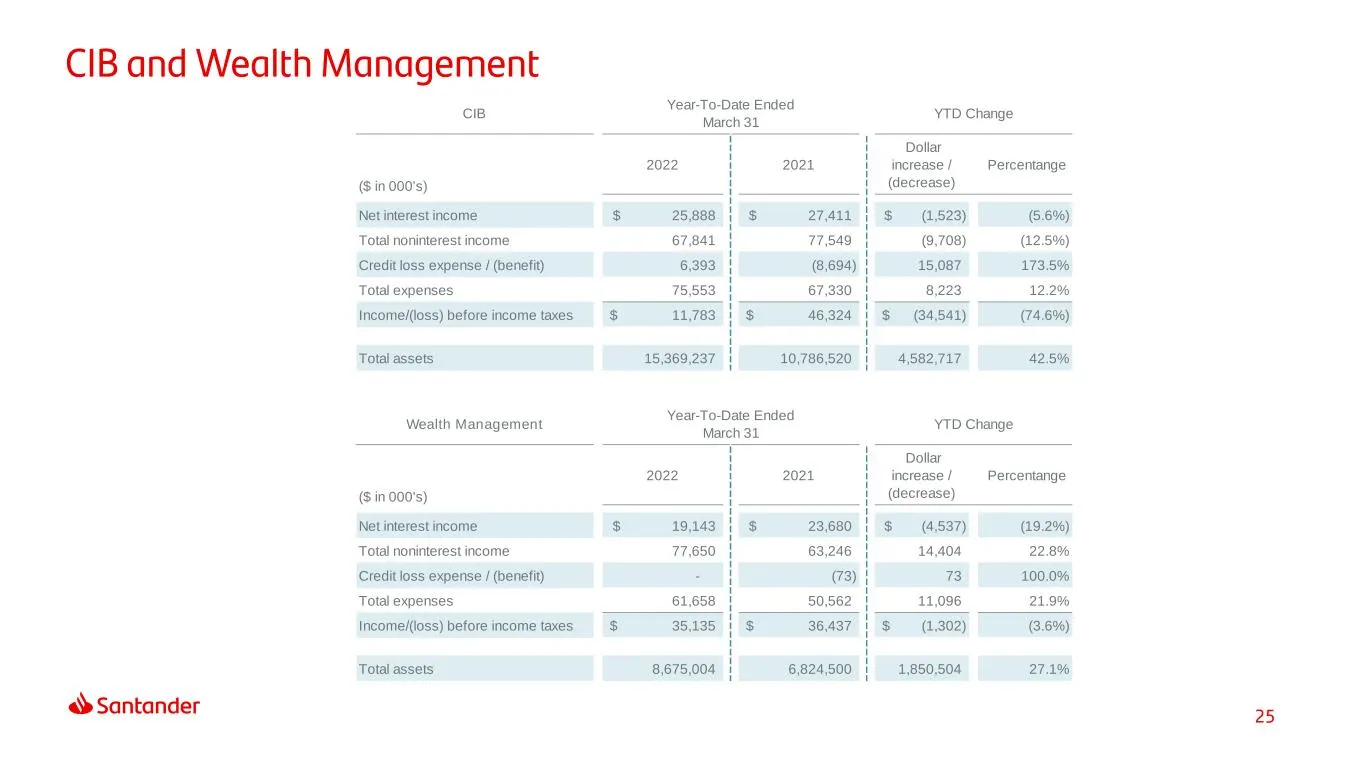
Slide 25: CIB and Wealth Management
25 CIB and Wealth Management CIB ($ in 000's) 2022 2021 Dollar increase / (decrease) Percentange Net interest income 25,888$ 27,411$ (1,523)$ (5.6%) Total noninterest income 67,841 77,549 (9,708) (12.5%) Credit loss expense / (benefit) 6,393 (8,694) 15,087 173.5% Total expenses 75,553 67,330 8,223 1
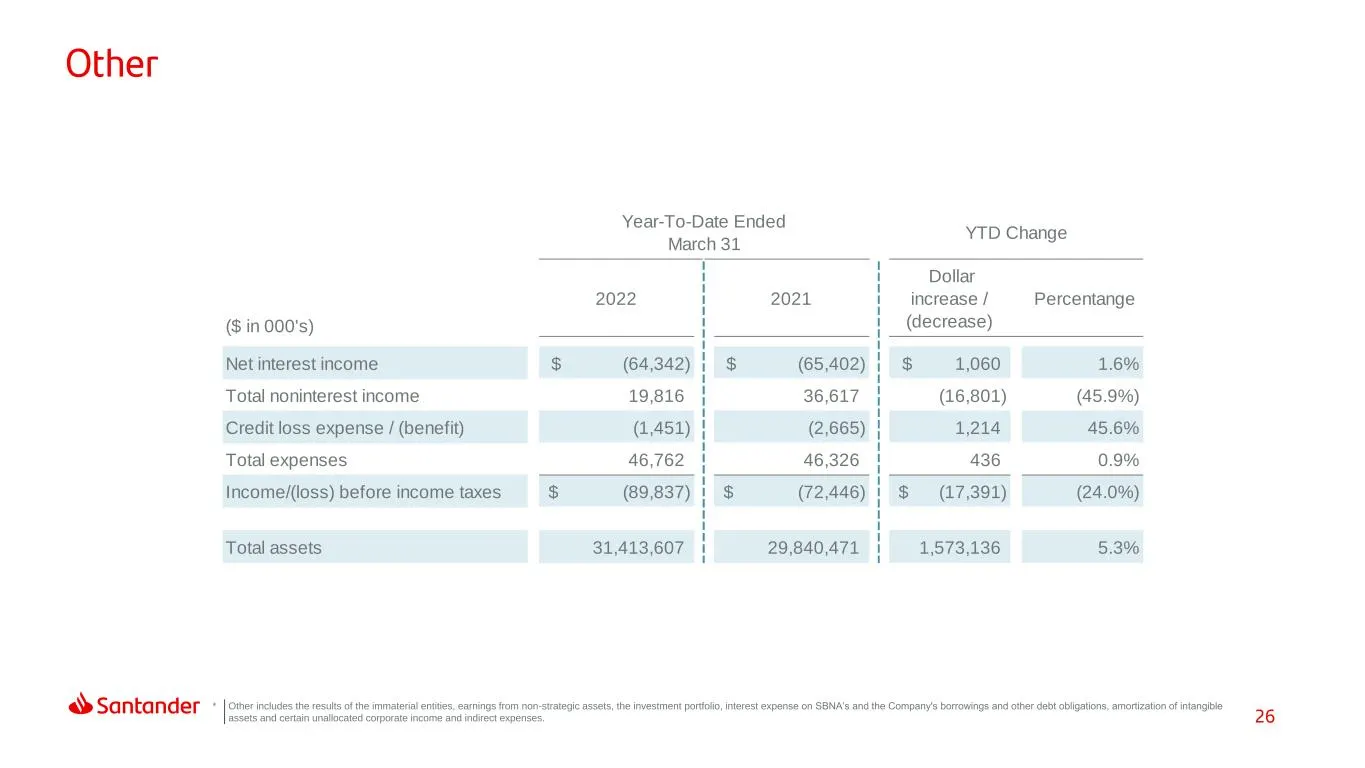
Slide 26: Other
26 Other * Other includes the results of the immaterial entities, earnings from non-strategic assets, the investment portfolio, interest expense on SBNA’s and the Company's borrowings and other debt obligations, amortization of intangible .assets and certain unallocated corporate income and indirect
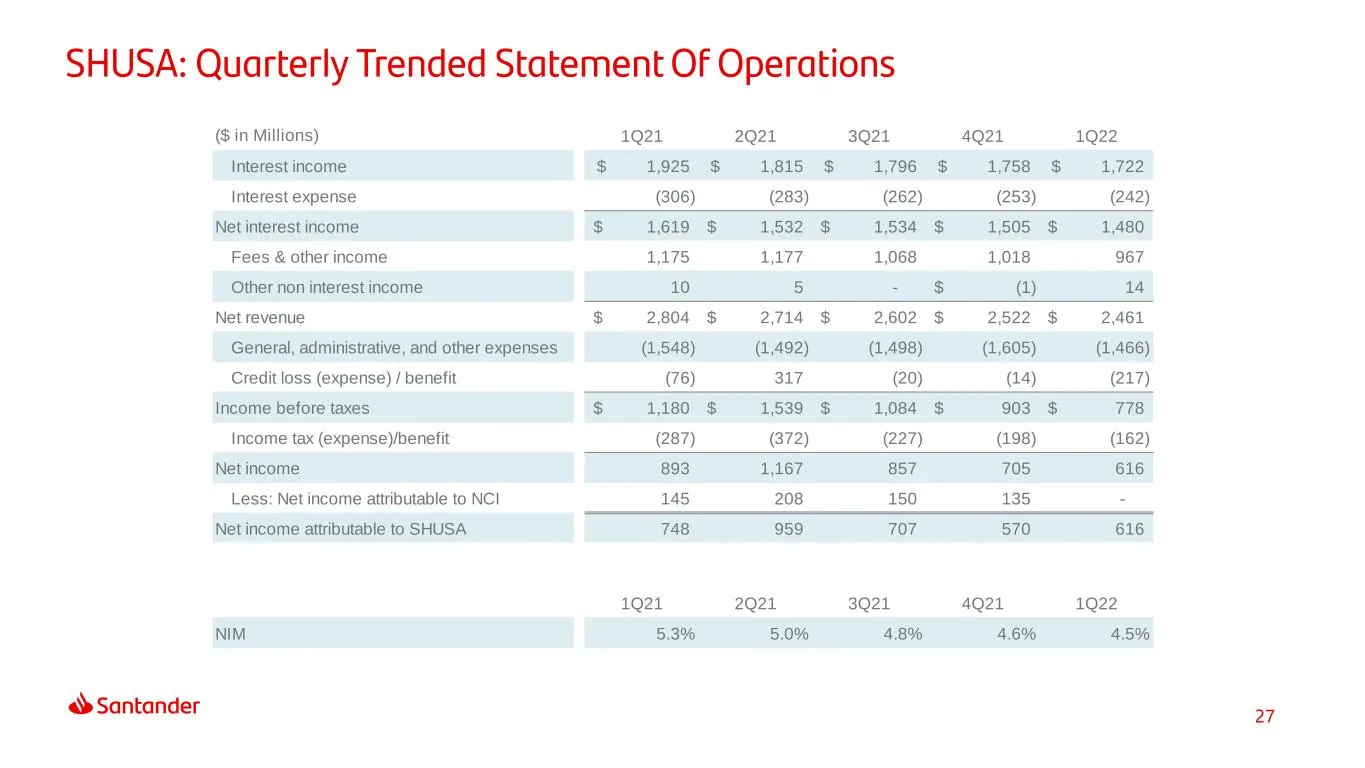
Slide 27: SHUSA: Quarterly Trended Statement Of Operations
27 SHUSA: Quarterly Trended Statement Of Operations ($ in Millions) 1Q21 2Q21 3Q21 4Q21 1Q22 Interest income 1,925$ 1,815$ 1,796$ 1,758$ 1,722$ Interest expense (306) (283) (262) (253) (242) Net interest income 1,619$ 1,532$ 1,534$ 1,505$ 1,480$ Fees & other income 1,175 1,177 1,068 1,018 967 Other
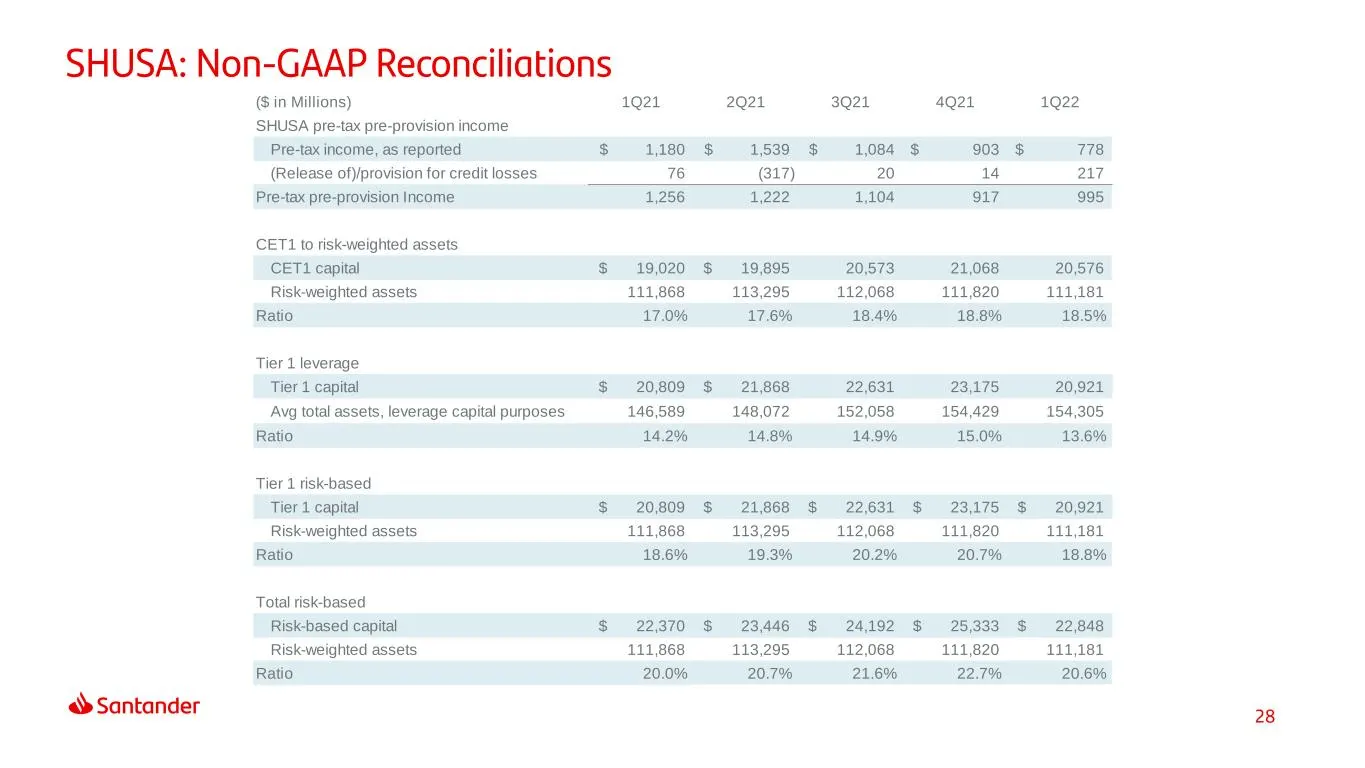
Slide 28: SHUSA: Non-GAAP Reconciliations
28 SHUSA: Non-GAAP Reconciliations ($ in Millions) 1Q21 2Q21 3Q21 4Q21 1Q22 SHUSA pre-tax pre-provision income Pre-tax income, as reported 1,180$ 1,539$ 1,084$ 903$ 778$ (Release of)/provision for credit losses 76 (317) 20 14 217 Pre-tax pre-provision Income 1,256 1,222 1,104 917 995 CET1 to risk-we
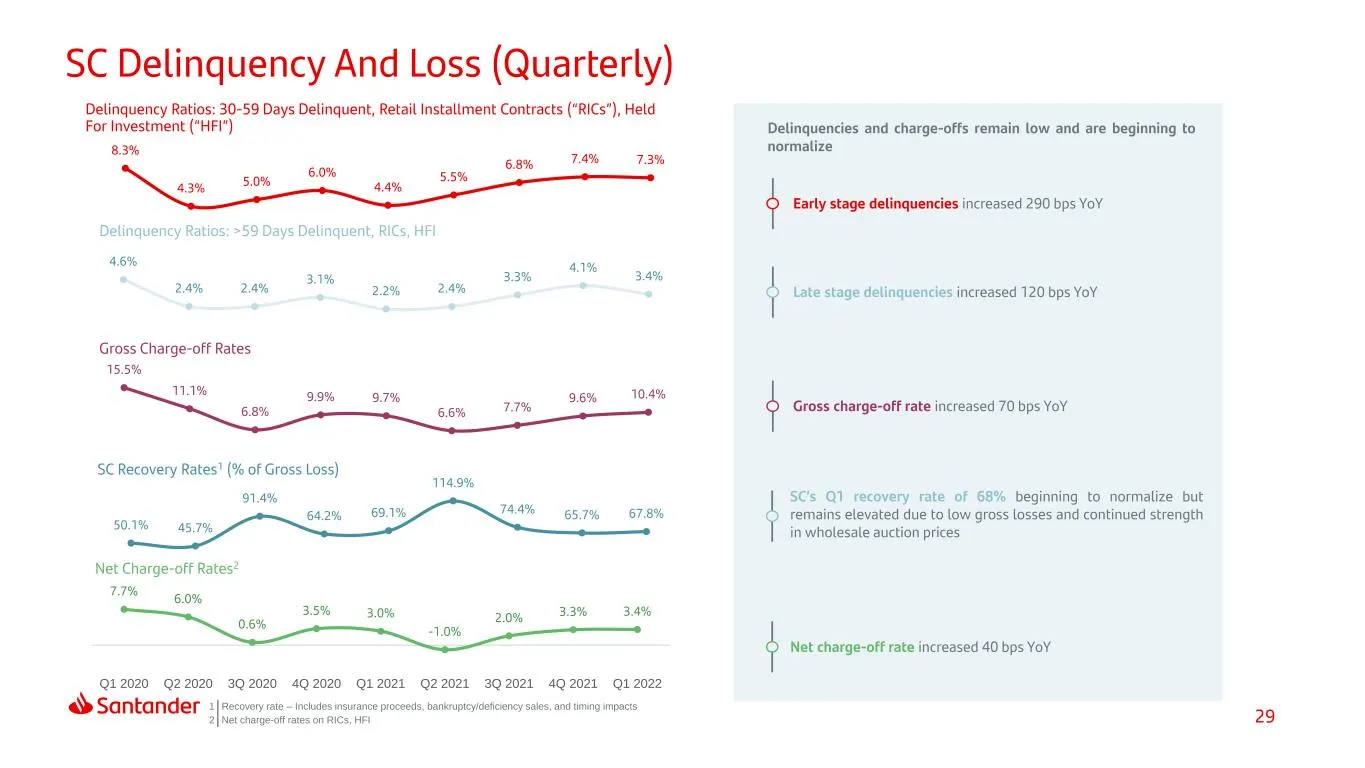
Slide 29: SC Delinquency And Loss (Quarterly)
29 50.1% 45.7% 91.4% 64.2% 69.1% 114.9% 74.4% 65.7% 67.8% 7.7% 6.0% 0.6% 3.5% 3.0% -1.0% 2.0% 3.3% 3.4% Q1 2020 Q2 2020 3Q 2020 4Q 2020 Q1 2021 Q2 2021 3Q 2021 4Q 2021 Q1 2022 15.5% 11.1% 6.8% 9.9% 9.7% 6.6% 7.7% 9.6% 10.4% 4.6% 2.4% 2.4% 3.1% 2.2% 2.4% 3.3% 4.1% 3.4% 8.3% 4.3% 5.0% 6.0% 4.4% 5.5% 6
Slide 30: Thank You
Thank You. Our purpose is to help people and businesses prosper. Our culture is based on believing that everything we do should be:
Source: SEC EDGAR · 8-K filed May 9, 2022
More decks from Santander Holdings USA Inc
 Debt Investor Presentation (August 2026)30 slides · Aug 12, 2026
 Debt Investor Presentation (August 2026)30 slides · Aug 12, 2026
 Debt Investor Presentation (June 2026)29 slides · Jun 12, 2026
 Debt Investor Presentation (June 2026)29 slides · Jun 12, 2026
 Debt Investor Presentation (March 2026)36 slides · Mar 6, 2026
 Debt Investor Presentation (March 2026)36 slides · Mar 6, 2026